Article

Consumers’ Perspectives on Government-Oriented Integrated Energy Services: A Case Study of Pilot Areas in China

by
Xiangyu Xu
,
Nazatul Syadia Zainordin
*,
Amir Hamzah Sharaai
and
Nik Nor Rahimah Nik Ab Rahim
Department of Environmental Management, Faculty of Forestry and Environment, Universiti Putra Malaysia, UPM Serdang, Selangor 43400, Malaysia
*
Author to whom correspondence should be addressed.
Sustainability 2025, 17(22), 10158; https://doi.org/10.3390/su172210158
Submission received: 5 October 2025 / Revised: 4 November 2025 / Accepted: 11 November 2025 / Published: 13 November 2025
(This article belongs to the Special Issue Advances in Sustainable Energy Systems)

Abstract

The transition toward sustainable energy systems remains challenging as conventional energy still dominates despite environmental and security concerns. Integrated Energy Services (IES) provide a promising mechanism by optimising energy planning, operation, and delivery through integrated solutions. While previous studies have emphasized technological or policy aspects of IES, little is known about how consumers’ cognition and perceptions shape their acceptance of IES. This study investigates how awareness of conventional energy drawbacks and recognition of IES advantages influence acceptance by surveying 450 households in Beijing, Tianjin, and Shanghai. Descriptive statistics, Spearman’s correlation, and mediation analysis were employed to identify key behavioral pathways. Results reveal that planning and design influence service performance through operation and maintenance, and service efficiency affects price acceptance through perceived service quality. City-level analysis shows that Beijing residents emphasize reliable planning and operations, Tianjin respondents focus on efficiency and responsiveness, while Shanghai consumers place the greatest importance on service quality and fairness. These findings provide new insights into the consumer-level mechanisms of IES acceptance and offer practical guidance for tailoring city-specific strategies to enhance IES implementation and support China’s low-carbon transition.

1. Introduction

The global energy system is rapidly transforming from conventional energy to cleaner and low-carbon alternatives [1]. The first major driver of this transformation is environmental pressure. The extensive use of coal, oil, and other conventional energy sources has resulted in severe air pollution and greenhouse gas emissions, further intensifying climate change [2]. In response, countries around the world have set emission-reduction targets and are promoting a transition toward greener and more sustainable energy structures [3]. A second driver is the growing concern for energy security. Conventional energy resources are finite and unevenly distributed, which exposes many countries to supply risks. In contrast, renewable resources such as wind and solar are abundant and widely available, making them more reliable for ensuring energy security [4,5]. The third driver relates to economic competitiveness. With technological advances and economies of scale, the cost of renewable energy generation has fallen significantly. In many regions, wind and solar power are now cheaper than conventional energy sources, making clean energy an increasingly attractive option [6].
Although the energy transition is progressing, data from 2020 to 2024 showed that conventional energy still dominates the global energy structure in terms of both total consumption and share [7]. According to reports by the International Energy Agency (IEA) and the Global Carbon Project, energy-related carbon dioxide emissions increased from 30.6 Gt in 2020 to 36.8 Gt in 2022, with further growth recorded in 2023 (37.4 Gt). The carbon dioxide emissions reach 37.8 Gt in 2024, setting a new historical record [8,9]. Conventional energy (such as coal, oil, and natural gas) made up about 81.5% of global energy consumption in 2023, and this share shows little sign of decline from 82% in 2022 [10]. In addition, global environmental degradation is increasingly driven by greenhouse gas emissions from industrial and transportation sectors, which together account for over two-thirds of total global emissions. Carbon-rich fuels, including petroleum, coal, and natural gas, respectively, supply approximately 36%, 27%, and 23.4% of the world’s total energy demand. Their combustion releases nearly 21.3 billion tons of carbon dioxide annually, making carbon dioxide the principal contributor to global warming [11,12]. According to Wiatros-Motyka (2023), conventional energy remains the primary source of energy for critical sectors such as electricity generation, industry, and transportation [13].
Conventional energy systems that rely heavily on fossil fuels face growing challenges due to environmental degradation, volatile supply chains, and escalating operational costs [14]. These systems are characterized by centralized generation, high transmission losses, and limited adaptability to fluctuating energy demand, resulting in low end-use efficiency and significant maintenance expenses associated with aging infrastructure [15]. In contrast, integrated energy services (IES) introduce a decentralized, service-oriented, and digitalized model that integrates multiple energy sources to achieve optimal efficiency and sustainability [16,17]. By coupling electricity, heat, cooling, and gas through digital control platforms, IES enhances operational coordination, reduces energy redundancy, and facilitates renewable energy integration [18]. IES also demonstrates a distinct cost structure: although it requires relatively high initial capital investment, it achieves substantial long-term savings through lower operation, maintenance, and transmission costs [19]. Empirical analyses further show that IES reduces carbon intensity while improving local air quality and system resilience [20]. IES represents a paradigm shift from resource consumption to value-added energy services, aligning with global trends toward carbon neutrality and sustainable urban development [21]. This transformation underscores the importance of consumers’ perception and acceptance of IES is crucial in achieving equitable and effective energy transitions. Therefore, a deeper understanding of how consumers perceive and respond to these evolving energy service models becomes essential for ensuring that the transition from conventional to integrated systems achieves both technical and social effectiveness.
Over the past decade, research on IES has evolved from technical system optimization toward broader market and behavioral perspectives. Early studies focused on multi-energy coupling and operational optimization to improve efficiency and reduce transmission losses [22,23,24,25]. Later work incorporated policy and institutional analysis, examining how government incentives and market reforms have guided IES implementation across different national contexts [26,27]. More recently, scholars have begun to emphasize consumer participation and social acceptance as key determinants of IES performance [28,29]. Despite these advances, empirical research on consumer perceptions and behavioral mechanisms across cities under unified policy frameworks remains limited, highlighting the need to understand IES as both a technological innovation and a social process shaped by user experience and interaction. The core concept of IES is to optimise the energy chain from production and transmission to storage and consumption by integrating multiple energy sources, renewable and non-renewable, with the support of intelligent control technologies [30,31]. Compared with conventional single-energy supply models, IES offers distinct advantages, including multi-energy coordination, demand-oriented response, and low-carbon orientation, which help improve energy efficiency and reduce carbon emissions [32]. IES has developed into diversified service models, including energy efficiency improvement services, integrated energy supply solutions, and intelligent energy management platforms [33]. Policy support, technological advancement, and market demand drive IES’ rapid growth [34]. In the European Union, smart energy communities integrate distributed renewable generation with district heating systems, achieving up to 25% efficiency improvement compared with conventional grids [35,36]. Japan and the United States have adopted technology-driven models emphasizing intelligent energy management for demand-response optimization [37,38]. In contrast, China’s IES development has been primarily government-oriented, focusing on large scale demonstration zones and integration of digital control with multi-energy supply to advance its dual carbon goals [39,40]. China’s 14th Five-Year Plan calls for constructing a modern energy system and identifies IES as a key pathway to achieving the country’s dual carbon goals [41]. In support of this agenda, China’s standard Guidelines for Evaluation of Contract Energy Management Services (GB/T 40010-2021) was introduced to regulate service evaluation frameworks [42]. Meanwhile, the China National Energy Administration launched the 100 smart energy demonstration projects initiative in 2021, focusing on pilot projects that showcase digital technologies, renewable integration, and smart energy management [43]. Against this policy backdrop, the government selected certain areas within cities as pilot areas for IES to explore replicable and scalable development models, unleashing the potential of IES in driving urban energy transition [44,45,46].
Current research on IES still has room for further development, particularly in understanding consumer behavioural mechanisms. Most existing studies focused on technological integration, service models, or macro-level policy design, while paying limited attention to how consumers’ awareness of the limitations of conventional energy sources translates into evaluation and acceptance of IES [47,48]. The lack of empirical evidence supporting this linkage hinders our comprehension of how policy intentions reach end consumers [49,50]. In addition, although IES pilot programmes have been implemented simultaneously in multiple cities, few studies have taken advantage of contexts where the pilots operate under a unified national policy and share broadly comparable population profiles. However, empirical evidence remains limited regarding how consumers perceive and accept IES within unified policy frameworks, and how such acceptance differs across cities. This study contributes to the literature by introducing a government-oriented IES framework by linking cognition, service capability, and satisfaction under China’s latest policies. As a result, the potential behavioural mechanisms behind consumers’ acceptance of IES under a unified policy framework remain underexplored. These gaps have limited our understanding of how IES policies function at the consumer level and hindered efforts to identify directions and actionable pathways for service improvement [51,52].
This study aims to explicate how consumers’ awareness of the disadvantages of conventional energy and recognition of the advantages of IES shape consumer acceptance under a unified national policy setting. By linking consumer cognition with service performance, this study bridges the gap between policy objectives and end-user experiences. Specifically, it seeks to clarify the behavioral mechanisms underlying consumer acceptance of IES within the context of pilot areas, thereby contributing to a deeper understanding of how policy intentions are transmitted to the consumer level and providing insights for improving service design and delivery. The findings are expected to inform the refinement of IES.

2. Materials and Methods

2.1. Study Area Description

This study focuses on three urban areas located in Beijing, Tianjin, and Shanghai, all of which have been designated as pilot areas for IES under national policy initiatives. As shown in Figure 1, these areas are geographically distributed across northern and eastern China, providing representative areas for IES analysis. The selection of these areas is grounded not only in their roles as government-designated pilots but also in their shared institutional and socio-economic features. At the policy level, all three municipalities operate under the overarching framework of China’s 14th Five-Year Plan, which serves as the highest-level guideline shaping local energy and urban development strategies. Similarly, the IES White Papers released by national authorities provide the design and implementation blueprint for local-level energy transition policies, ensuring that pilot programmes follow a consistent strategic orientation [27]. At the demographic level, Beijing, Tianjin, and Shanghai are all centrally administered municipalities, directly governed by the central government. This status grants them similar governance structures, urban administrative hierarchies, and a high degree of policy implementation capacity, leading to broadly comparable sociodemographic characteristics such as population size, urbanisation levels, and household structures [53,54,55]. At the economic level, all three municipalities are characterised by service-oriented economies, dense residential populations, and diversified urban industries, reflecting a shared pattern of urban consumption and energy demand [56,57]. Together, these commonalities establish a stable foundation for IES analysis, as differences observed across the three areas are less likely to arise from structural disparities in governance, demographics, or economic base, and more likely to reflect genuine variations in consumer perception and acceptance of IES [58].
Detailed attributes of the selected study areas are summarised in Table 1. These data show that the pilot districts (Low Carbon Park in Beijing, Jinzhong Street in Tianjin, and Zhangjiang Town in Shanghai) are medium-sized urban communities with populations between 70,000 and 110,000. These districts’ economies are dominated by service-related activities, and residential groups form the main population type. The survey was conducted in 2024, with a three-month collection period in study areas. Such demographic scale and economic structure are typical of Chinese urban communities, providing a concrete and representative context [59].

2.2. Survey Instrument

The design of this survey instrument was structured based on the China Statistical Yearbook (2024), supplemented by the China Energy Transformation White Papers (2024) and China’s standard GB/T 40010-2021 [27,41,55]. The questionnaire consisted of four sections, i.e., social demographics, awareness of energy conservation, perceptions of IES providers’ capabilities, and satisfaction level of IES. The socio-demographic section consists of gender, marital status, age group, educational level, occupation, and monthly income [60]. Beyond basic demographic attributes, the remaining 46 indicators were designed to capture how respondents perceive and evaluate different dimensions of IES provision. These indicators collectively reflect the technical, operational, and service quality of IES, providing a structured basis for linking consumer perceptions with overall acceptance. The selected indicators (gender, age, education level, occupation, marital status, and monthly income) were consistent with established academic practices and nationally recognised statistical classifications [27,61,62]. Based on the guidelines outlined in China Energy Transformation White Papers (2024), the second part of the questionnaire was designed to capture awareness of energy conservation [27]. This section was divided into two dimensions. Conventional Energy Disadvantages (CED) reflects consumers’ awareness of the drawbacks of conventional energy use, including environmental pollution, the limited and unsustainable nature of reserves, and the generation of greenhouse gas emissions leading to global warming. IES Advantages (IESA) captures consumers’ recognition of the benefits of IES. It reflects perceptions that IES integrates renewable energy, improves energy efficiency, and reduces dependence on conventional energy, thereby lowering greenhouse gas emissions and air pollution.
The design of the perception of IES providers’ capabilities and consumer satisfaction with IES is grounded in China’s standard GB/T 40010-2021. This standard specifies the key domains for assessing energy service performance, including consumer satisfaction, technical service provision, operational support, pricing, and communication mechanisms. Building on this guideline, the perception of IES providers’ capabilities was structured into three elements, i.e., planning and design (PAD), operation and maintenance (OAM), and Service Performance (SPE). PAD assesses the capacity of IES providers to design effective energy systems and reflects perceptions of technical competence, the inclusion of respondents’ input in project planning, and the ability to ensure both reliable and secure energy supply. OAM evaluates the transparency and reliability of IES operations, including the availability of pricing information, operational and maintenance guidelines, and conservation measures. SPE shows how IES providers deliver services, including billing transparency, service notifications, system updates, consultation, feedback channels, and environmentally friendly practices.
The consumer satisfaction with IES was also structured into three elements, i.e., service efficiency (SEF), service quality (SQU), and system and price (SAP). SEF assesses the responsiveness of IES providers and reflects perceptions of service ability to deliver timely feedback, maintain proactive and friendly communication, and ensure that energy problems are resolved attentively within a short period of time. SQU shows the overall quality of services and the perceptions of providers’ capacity to offer multi-channel feedback mechanisms, rely on well-trained staff, provide effective consulting services, and maintain a stable energy supply. SAP assesses the accessibility and fairness of the service system and reflects perceptions of its clear and consumer-friendly interface, ease of use, reasonable pricing, and the availability of service guidelines that are visually appealing and easy to understand. Each element reflects the corresponding dimensions of the national standard, ensuring that the items are consistent with authoritative evaluation frameworks.
In survey-based studies, determining an appropriate sample size is essential to ensure that the results are statistically reliable and representative of the target population [63,64]. The minimum required sample size was calculated using Cochran’s formula for sample size estimation:
    n 0 = Ζ 2 × ρ × 1 ρ e 2
where Ζ = 1.96 corresponds to a 95% confidence level, ρ = 0.5 is the estimated proportion of the population, and e = 0.05 is the margin of error. The sample size for this study was initially calculated as 384 using Cochran’s formula. To enhance statistical power and reduce potential bias, the final sample was expanded to 450 respondents [64,65]. A total of 450 valid responses were distributed across the three pilot cities in proportion to their population sizes (Beijing = 105, Tianjin = 162, Shanghai = 183). Prior to the formal survey, the questionnaire underwent validity checking and reliability testing to confirm that the items accurately captured the intended constructs and that responses were internally consistent and stable across measurements [66,67].

2.3. Data Collection

A stratified systematic sampling method was adopted to select respondents from households in Beijing, Tianjin, and Shanghai. Stratification ensured that different types of residential areas were represented, while systematic sampling provided consistent spacing for household selection and minimised the risk of sample clustering [68,69]. This approach was particularly suitable because households in the study areas are randomly distributed and clearly numbered, which allowed the construction of a structured and transparent sampling frame [70]. The simplicity and efficiency of systematic sampling also enabled large household populations to be covered with reduced operational complexity, as only a random starting point and fixed interval were required to determine the sample [71]. Since no obvious patterns exist in the distribution of dwellings across strata, systematic selection reduced the likelihood of concentration or bias, thereby enhancing representativeness and improving the generalisability of results [72]. In practice, the sampling interval within each stratum was determined by dividing the total number of households by the required sample size, and a random starting point was generated to initiate selection [73]. This ensured that all households had an equal probability of inclusion while maintaining efficiency in large residential areas [74]. By combining stratification with systematic selection, the method ensured balanced coverage of different urban settings while maintaining efficiency, ultimately increasing the accuracy and reliability of the study [75,76,77].

2.4. Data Analysis

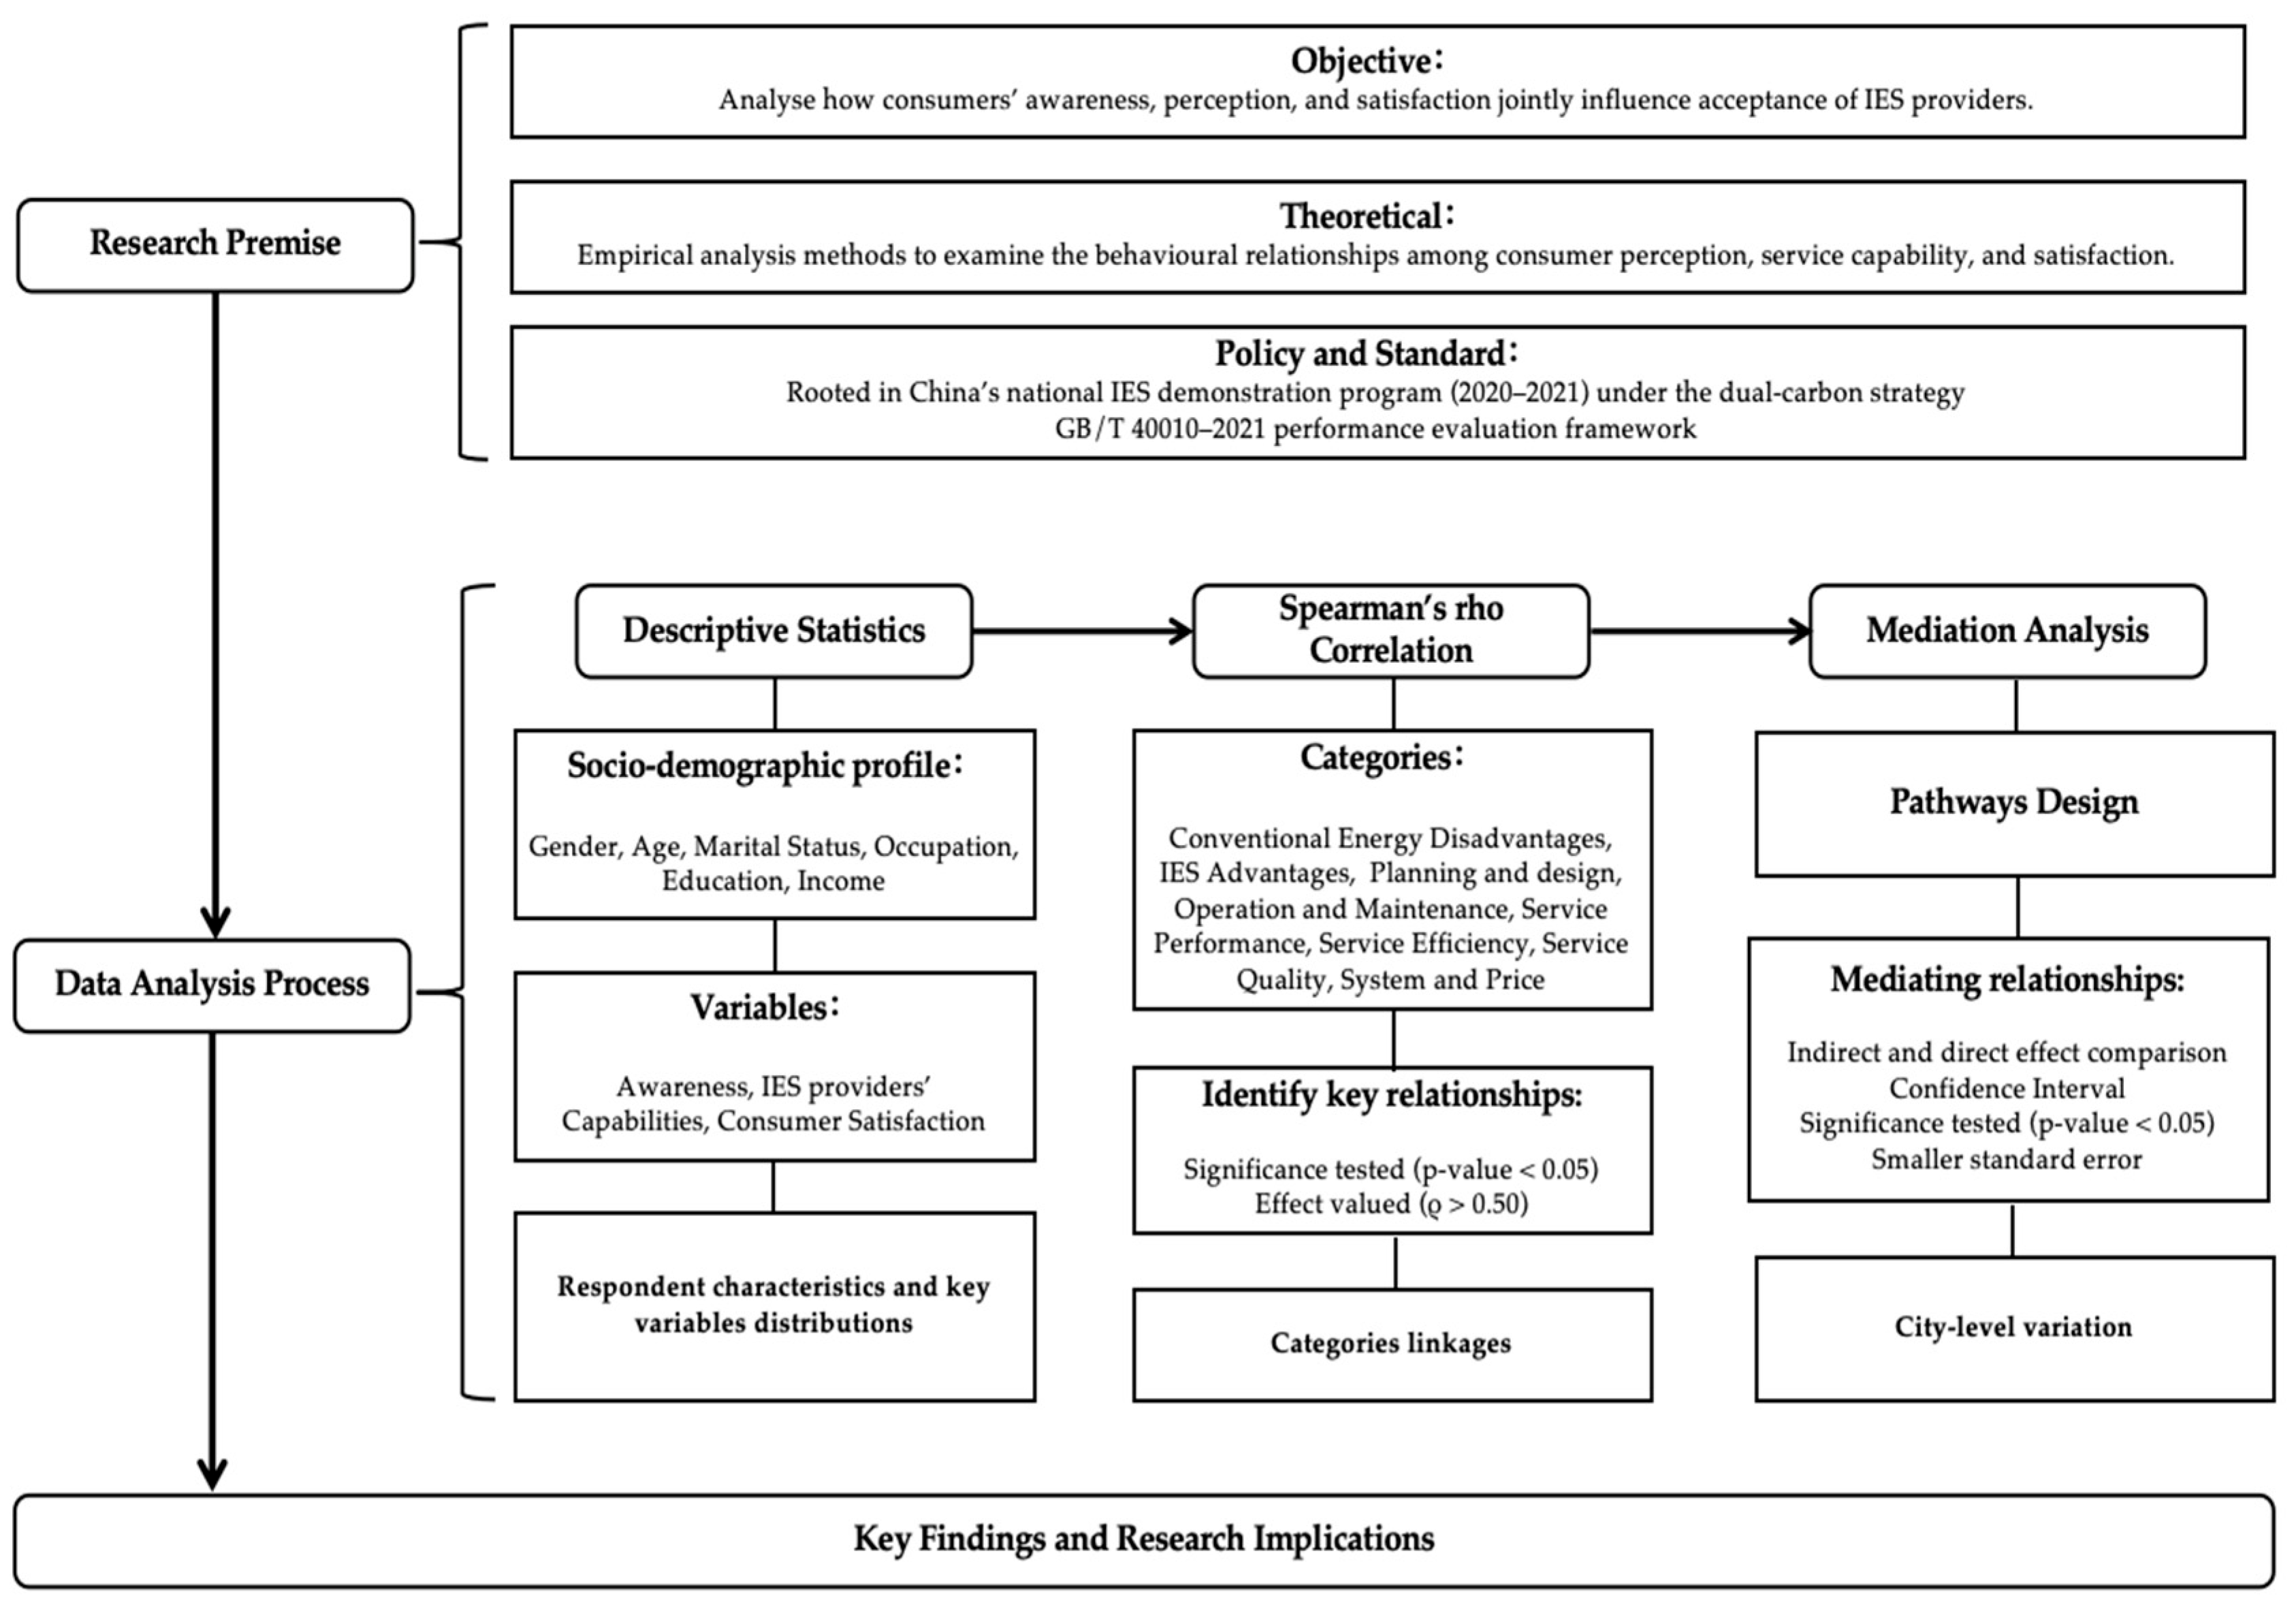
The data analysis framework outlined the overall analytical pathway adopted in this study, which connected descriptive statistics, correlation analysis, and mediation analysis to explain how consumer awareness and perceptions were transformed into acceptance of IES (see Figure 2). Descriptive statistics were first applied to summarise the characteristics of the survey data and provide an overview of the distribution patterns of key variables [78]. This included presenting the socio-demographic attributes of respondents (gender, marital status, age, occupation, education level, and monthly income) across the study areas. In addition, descriptive analysis was conducted for all measurement items of the questionnaire to report central tendency and dispersion. Specifically, the constructs of awareness, IES providers’ capabilities, and consumer satisfaction were summarised by showing the number of valid responses and missing values, as well as the minimum, maximum, and median scores for each indicator. These procedures established a comprehensive descriptive profile of the sample and the study variables, thereby serving as the foundation for subsequent analysis [79].
Given the ordinal nature of Likert-scale data, Spearman’s rank-order (rho) correlation was employed to examine the strength and direction of associations between variables [80]. This method is a non-parametric alternative to Pearson’s correlation, suitable for non-normally distributed data, and it captures monotonic relationships without assuming linearity [81]. Spearman’s rho correlation result (ρ) is computed according to the following formula:
  ρ = 1 6 i = 1 n d i 2 n n 2 1  
where di represents the rank differences for each pair of observations, and n is the number of paired ranks [82,83]. Based on Table 2, the interpretation of correlation coefficients followed established guidelines by Akoglu (2018), with values between 0.00 and 0.30 regarded as low, 0.30 and 0.50 as moderate, 0.50 and 0.70 as high, 0.70 and 0.90 as very high, and above 0.90 as near perfect [84]. These interpretation ranges provide a structured benchmark for evaluating the strength and significance of observed correlations.
Based on the high and very high strength of correlation identified through Spearman’s rank correlations, further analysis was conducted to examine the underlying mechanisms of these relationships. To further explore the mechanisms underlying the observed associations, a mediation analysis was conducted using the bootstrap method. This approach tested whether the independent variable influenced the dependent variable indirectly through one or more mediating factors [85]. To interpret the magnitude and significance of mediation effects, the study followed the guidelines proposed by Fritz and MacKinnon (2007) [86] and Preacher and Hayes (2008) [87]. As shown in Table 3, effect sizes below 0.05 are considered negligible, between 0.05 and 0.10 as small, 0.10 and 0.25 as moderate, 0.25 and 0.40 as large, and above 0.40 as very large [86,87]. The confidence intervals for the indirect effect are reported as lower-level confidence interval (LLCI) and upper-level confidence interval (ULCI), which in this study are based on 95% bootstrap resamples. An indirect effect was considered statistically significant if the confidence interval did not include zero, indicating that the mediating pathway contributed meaningfully to the relationship between the independent and dependent variables [88]. The standard error (SE) indicates the variability of the effect estimate across samples, with smaller SE values suggesting more precise estimates. Finally, the p-value reflects the level of statistical significance, with thresholds of p < 0.01 meaning significant influence [89].

3. Results and Discussion

3.1. Descriptive Analysis

A total of 450 valid responses were collected across all survey items, with no missing values. The social demographic composition of the three surveyed areas shows a high degree of similarity across key indicators, ensuring the comparability of the data (see Table 4). Responses were measured using a five-point Likert scale, which includes 1 (strongly disagree), 2 (disagree), 3 (neutral), 4 (agree), and 5 (strongly agree). Based on the results in Table 5. The gender distribution is nearly balanced, with females slightly outnumbering males in all three areas. Most respondents are married, accounting for over 79% in each city. The age structure is also comparable, with the largest group falling within the 35 to 54 age range, followed by respondents over 55 and those under 34. Most participants are employed in the private sector, while around 23% work in the public sector, and a small proportion are unemployed. Regarding education, most respondents hold a diploma or bachelor’s degree (59% to 67%), and only a small portion have attained postgraduate qualifications. Monthly income levels are similarly distributed, with most respondents earning under 5000 RMB, while a considerable share of respondents fall into the middle-income bracket (5001–15,000 RMB), and a small proportion earn above 15,000 RMB.
This demographic composition demonstrates that the three pilot communities share a broadly comparable population structure, which ensures the validity of cross-city comparisons in subsequent analyses. Since the study focuses on pilot urban areas rather than nationwide generalisation, the emphasis lies on internal comparability across Beijing, Tianjin, and Shanghai. The similarity in gender, marital status, age distribution, and income levels indicates that observed differences in awareness and satisfaction can be attributed more to attitudinal and contextual factors than to demographic discrepancies. This alignment strengthens the reliability of the pilot study design [90,91].
Respondents generally agreed with the disadvantages of CED, with all five items under this construct showing a median of 4. Similarly, awareness of the advantages of IESA also yielded a median of 4 for most items, except for the aspect concerning the ability of IES to reduce reliance on conventional energy, which had a median of 3. Perceptions toward IES providers’ capabilities in terms of PAD, OAM, and SPE were consistently scaled at a median of 4, suggesting general satisfaction with these functional dimensions. However, evaluations regarding SEF, SQU, and SAP were less positive, with all items in these domains reflecting a median of 3. Table 6 shows the results of descriptive analysis.
These findings indicate that respondents clearly recognise the environmental and sustainability drawbacks of conventional energy, while also acknowledging the advantages of IES. However, the neutral stance on whether IES can effectively reduce reliance on conventional energy reflects a degree of uncertainty toward the substitution potential of IES [92]. Furthermore, respondents expressed confidence in the technical and operational aspects of IES. Respondents were more cautious in evaluations of service efficiency, quality, and pricing. This suggests that future improvements in IES development should not only focus on technical performance but also place greater emphasis on enhancing services, including communication, responsiveness, and affordability [93,94].

3.2. Significant and Non-Significant Correlations Identified by Spearman Rho Analysis

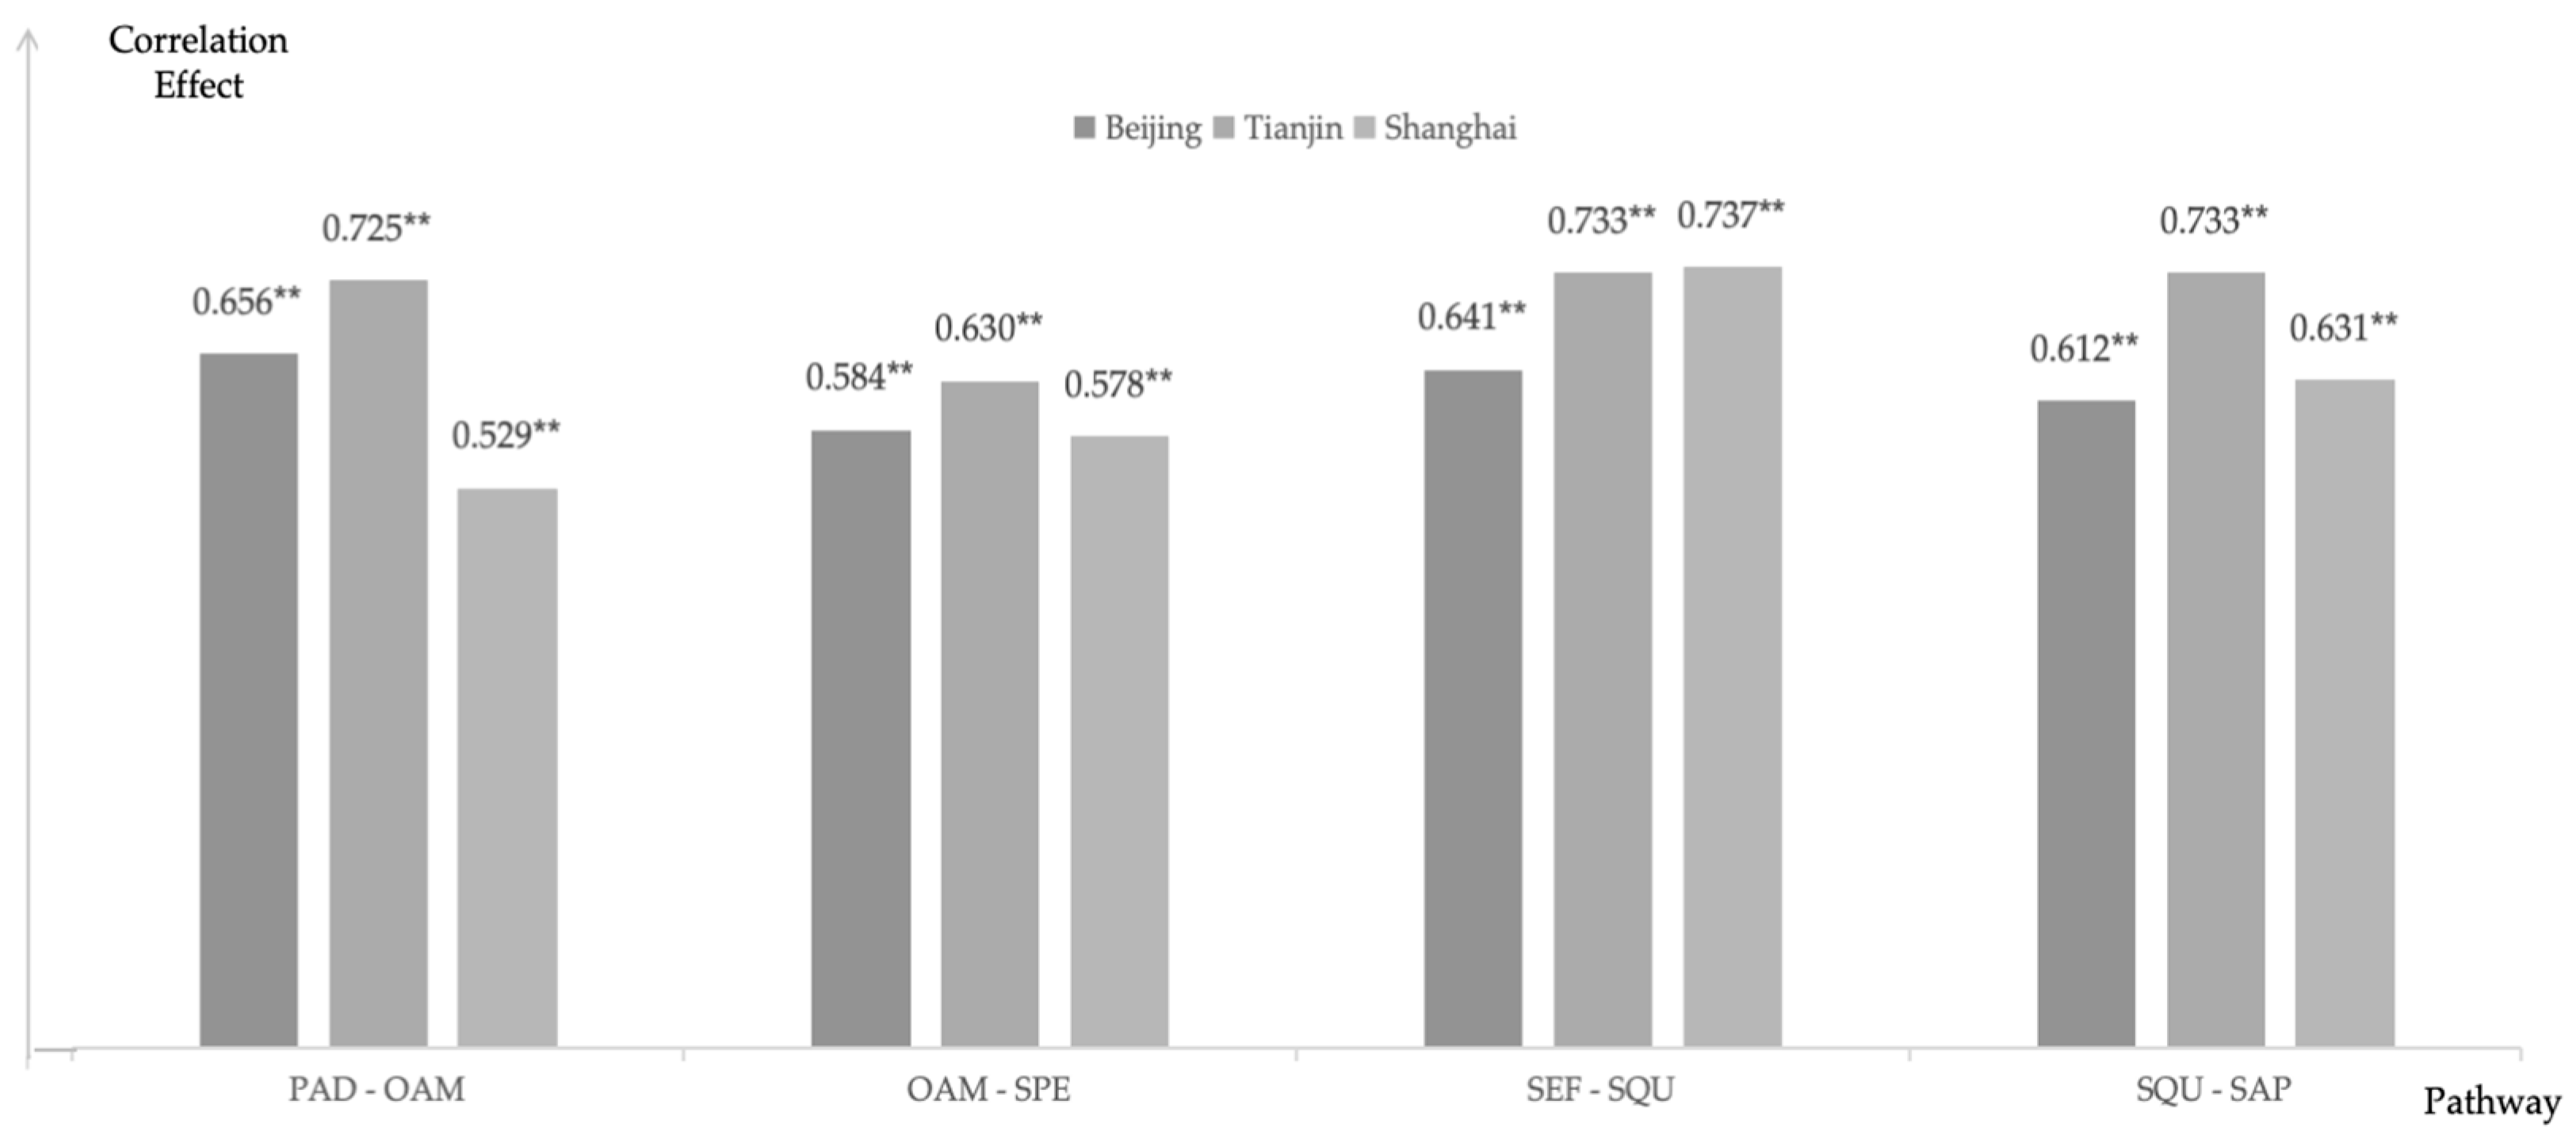
Spearman’s rank-order correlation tests were conducted separately for Beijing, Tianjin, and Shanghai to examine associations between respondents’ eight key constructs (CED, IESA, PAD, OAM, SPE, SEF, SQU, and SAP) [95]. The results are presented in Table 6. Across all three cities, CED and IESA were significantly and highly correlated (Beijing ρ = 0.649, Tianjin ρ = 0.571, Shanghai ρ = 0.601, all p < 0.01), indicating that respondents who recognised the drawbacks of conventional energy also tended to acknowledge the advantages of IES [96]. However, differences emerged when examining how this awareness translated into perceptions of provider capabilities. In Beijing, CED showed a high correlation with PAD (ρ = 0.531, p < 0.01), compared with low associations in Tianjin (ρ = 0.230, p < 0.01) and Shanghai (ρ = 0.244, p < 0.01). This suggests that in Beijing, recognition of conventional energy disadvantages was more directly linked with IES planning and design. PAD was further associated with operational and service-related constructs, with Beijing again showing stronger linkages. Specifically, PAD correlated highly with OAM (ρ = 0.656, p < 0.01) and had a very high correlation with SPE (ρ = 0.741, p < 0.01), while correlations were weaker but still significant in Tianjin (ρ = 0.637, p < 0.01) and Shanghai (ρ = 0.597, p < 0.01) [97]. In contrast, correlations between SEF, SQU, and SAP were consistently high across all three cities (Tianjin ρ = 0.850, Beijing ρ = 0.612, Shanghai ρ = 0.631, all p < 0.01), indicating a stable and robust relationship among these service constructs, namely service efficiency, service quality, and system and price [98].
These results provide several important insights. In all three cities, strong and significant correlations were observed between CED and IESA, confirming that respondents who perceive greater disadvantages of conventional energy recognise the benefits of IES [44]. This relationship forms the cognitive foundation of IES acceptance, where awareness of conventional energy limitations creates a basis for valuing integrated solutions. Although the pattern is consistent across Beijing, Tianjin, and Shanghai, the strength of the association was slightly higher in Beijing and Shanghai compared to Tianjin, which reflects differences in environmental awareness campaigns or the maturity of local policy implementation [99]. In Beijing, the connection between CED and PAD was notably stronger than in the other two cities. This suggests that Beijing respondents not only acknowledge the drawbacks of conventional energy but also translate this awareness into higher confidence in the planning and design of IES [100,101]. By contrast, the weaker CED with PAD associations in Tianjin and Shanghai implies that while respondents understand the energy challenges, this awareness does not necessarily extend into trust in IES design. This city-level variation highlights the importance of local context in shaping how awareness of energy disadvantages influences respondents’ evaluation of IES planning and design [102].
The strong correlations observed between PAD, OAM, and SPE highlight the role of effective PAD in shaping respondents’ perceptions of subsequent operational reliability and service performance. When respondents believe that an IES project is well-planned and inclusive of consumer demands, respondents are more likely to express confidence in its operation and service provision. This indicates the presence of a potential cognitive pathway in which PAD serves as an entry point that cascade into OAM and eventually into perceptions of SPE [103,104]. Third, the consistently high correlations among SEF, SQU, and SAP across all three cities suggest that respondents perceive these consumer-friendly services. In practical terms, this means that service efficiency, quality, and system pricing are not evaluated independently; rather, improvements or shortcomings in one aspect are likely to affect perceptions of the others. This stability across different urban contexts points to a second important pathway, where SEF influences perceptions of SQU, which in turn shape evaluations of SAP.

3.3. High-Correlation Pathways for Mediation Analysis

To identify the key pathways for further structural analysis, this study conducted Spearman Rho Correlation tests separately for each pilot city [105]. Although numerous correlations attained statistical significance, their strengths were not uniformly robust. To ensure that subsequent mediation analysis would be theoretically meaningful and statistically robust, only relationships with high correlation (ρ ≥ 0.50) and correlation significance at the 0.01 level were selected for further testing (see Figure 3). This threshold reflects common practices in social science research, where moderate to high correlations provide a sufficient basis for exploring mediating mechanisms, while weak correlations may not sustain meaningful causal inference [106,107].
Applying this criterion, two sets of pathways were identified. The first centres on PAD, which demonstrated strong correlations with both OAM and SPE. This pattern suggests a sequential process, where respondents’ trust in IES planning quality fosters confidence in operational reliability, which in turn supports perceptions of service performance. The second pathway involves SEF, which was strongly associated with SQU, and SQU in turn was highly correlated with SAP. This indicates that IES are closely interrelated and often evaluated as an integrated construct, where efficiency influences quality perceptions, which subsequently shape evaluations of pricing and accessibility. These findings justify the move from correlation analysis toward mediation testing, as these findings highlight specific mechanisms through which respondents’ perceptions may be transmitted across constructs [108,109].
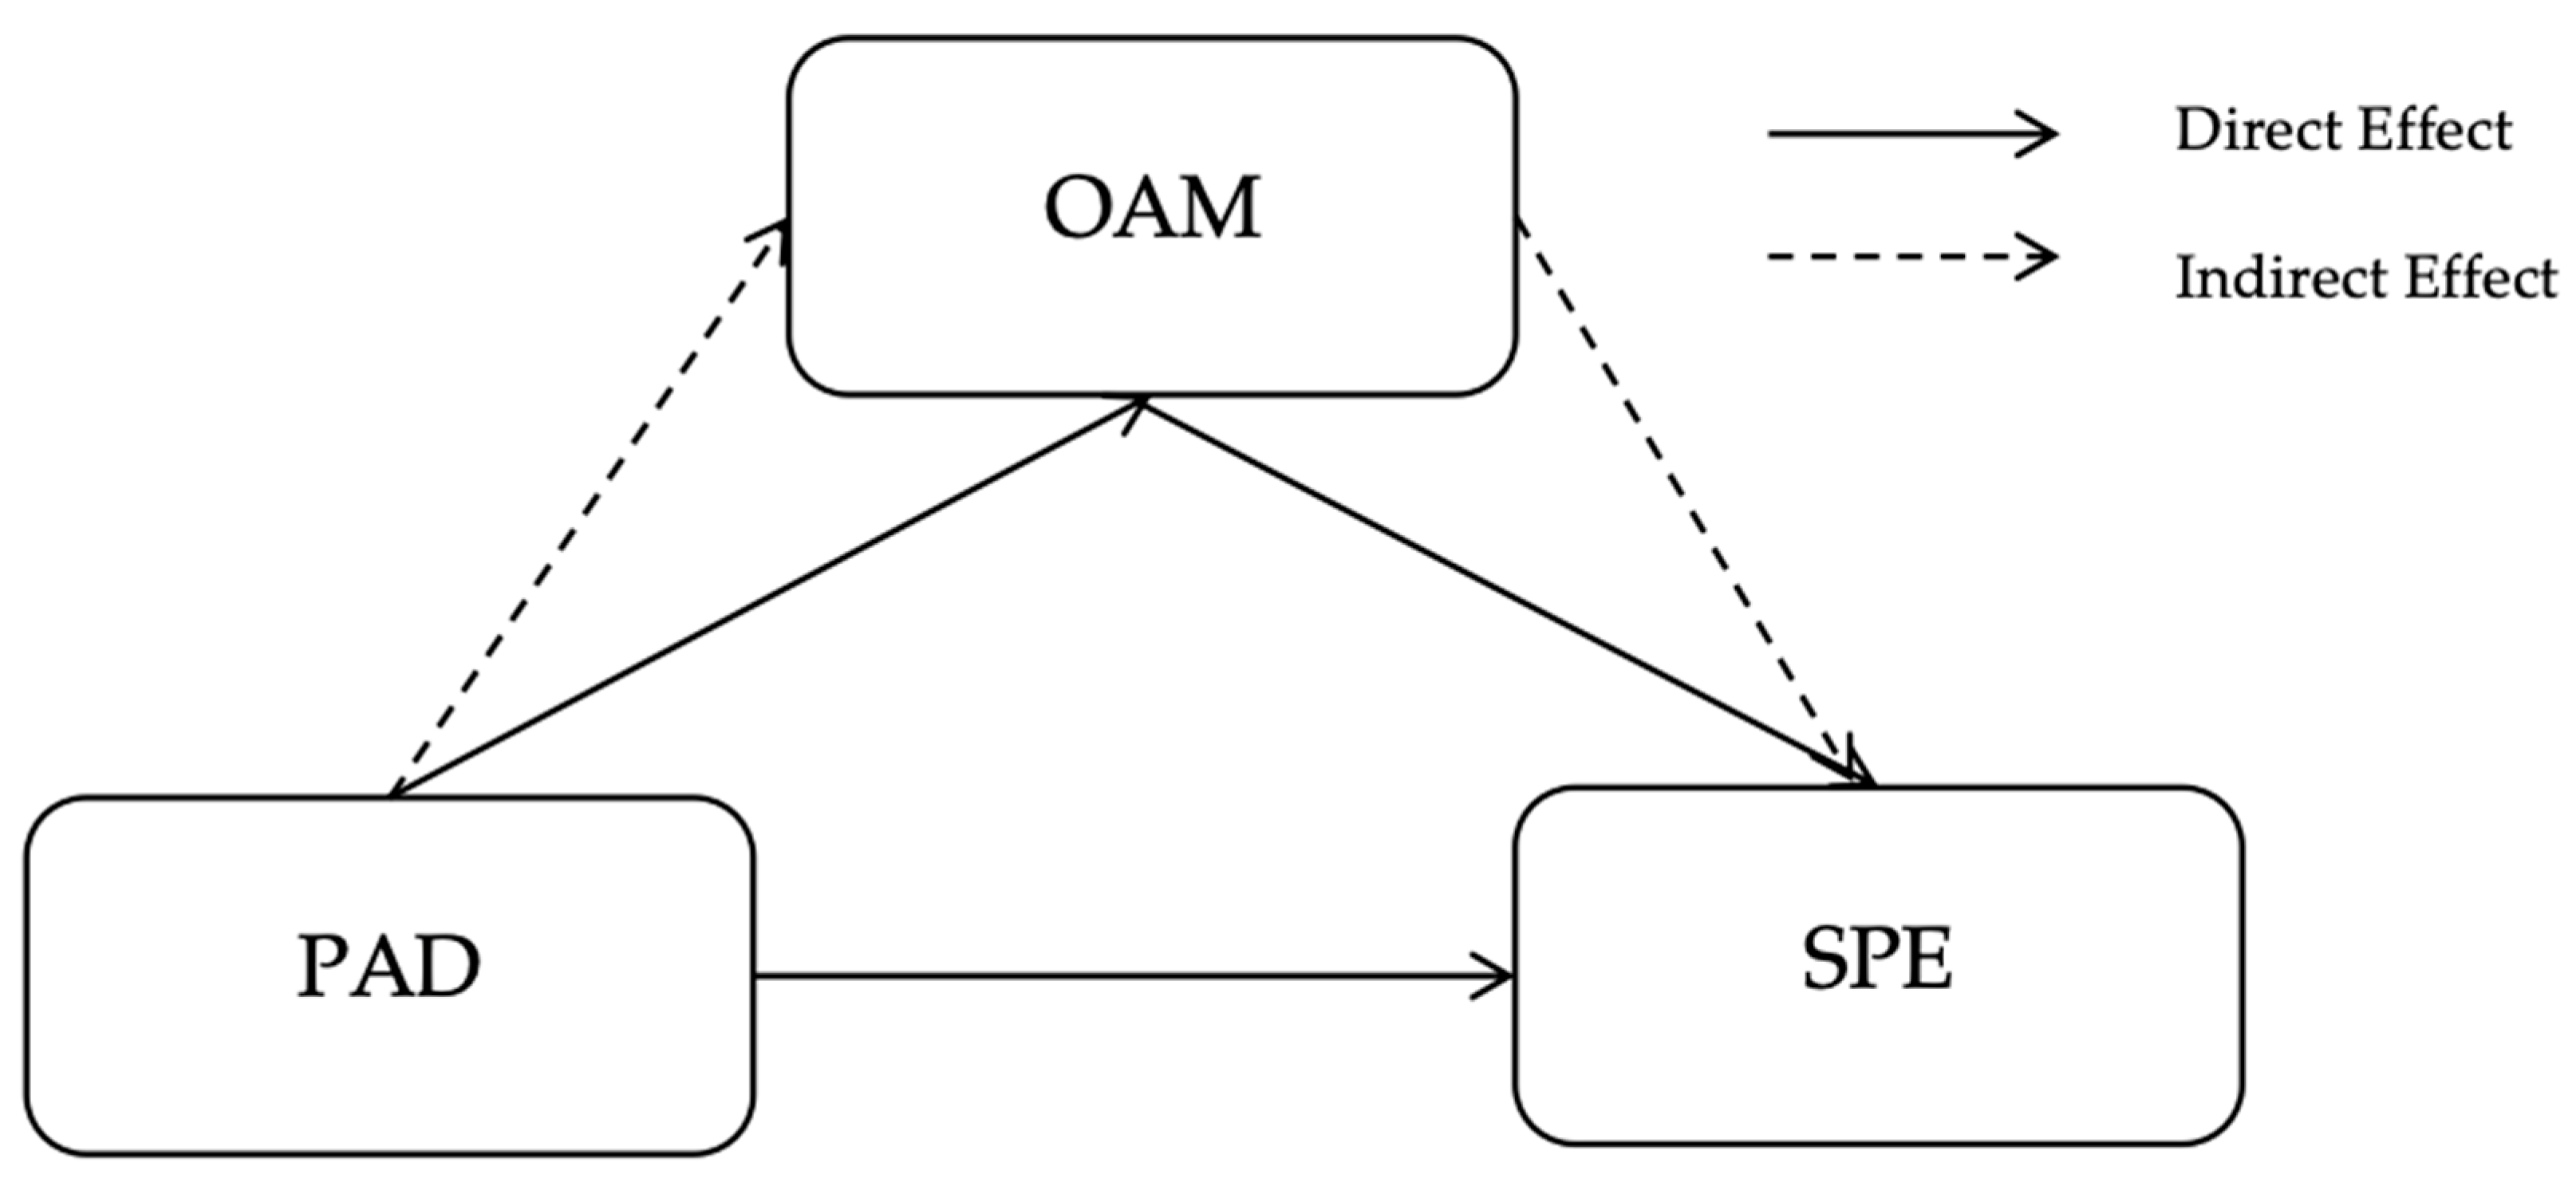
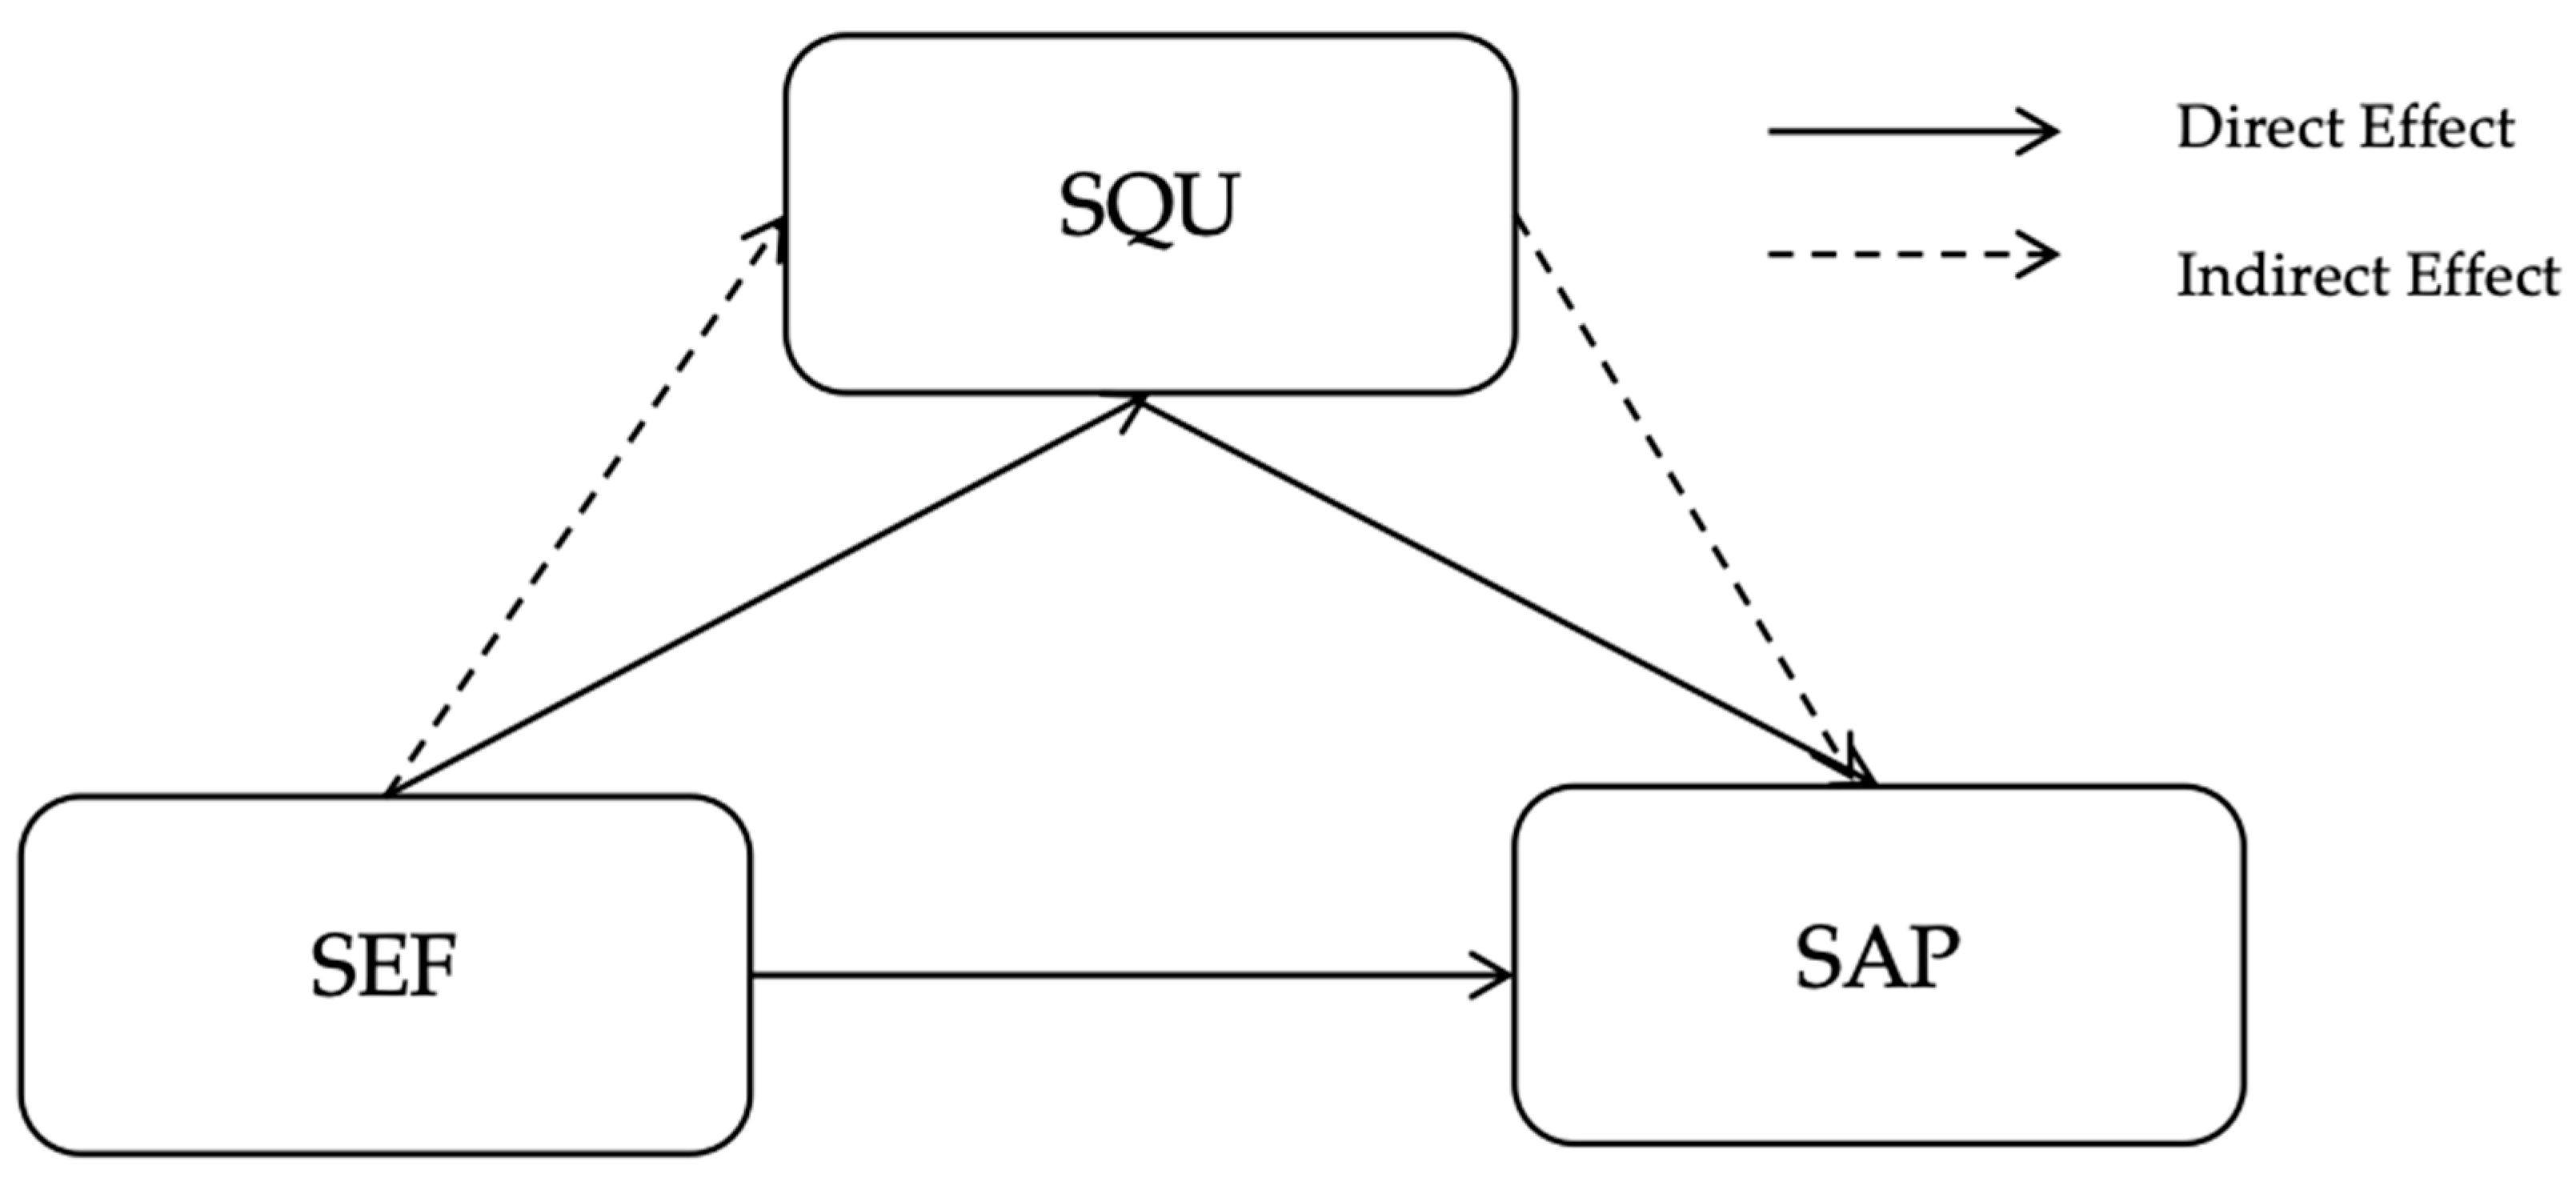
The analysis suggests that the impact of PAD on SPE operates partly through OAM (pathway 1). Planning quality is not only directly perceived by respondents but also indirectly shapes their evaluation of service through its influence on operational performance [94]. When respondents perceive that an IES project is well-planned and inclusive of consumer demands, consumers are more likely to believe that the system can be maintained effectively, thereby enhancing satisfaction with service delivery [110,111,112]. In addition, the relationship between SEF and SAP is mediated by SQU (pathway 2). Respondents do not judge affordability and pricing independently but rather through the lens of perceived service quality. In other words, efficient service enhances perceptions of quality, and once respondents are convinced of the quality, they are more likely to accept pricing structures as fair and reasonable.

3.3.1. The Impact of PAD on SPE Is Mediated by OAM

In the mediation analysis, the direct effect represents the influence of PAD on SPE without accounting for the mediator, whereas the indirect effect captures the portion of this relationship that is transmitted through operation and maintenance [113]. Figure 4 and Table 7 present the mediation results for pathway 1 across Beijing, Tianjin, and Shanghai. In all three cities, both the direct and indirect effects were significant, confirming that OAM mediates the relationship between PAD and SPE. For Beijing, the indirect effect of PAD on SPE via OAM was 0.292 (95% CI [0.171, 0.425]), while the direct effect remained significant at 0.530 (SE = 0.082, p < 0.001). This indicates a partial mediation, where PAD influences SPE both directly and indirectly through OAM. For Tianjin, the indirect effect was even stronger (0.406, 95% CI [0.289, 0.541]), and the direct effect remained significant at 0.389 (SE = 0.079, p < 0.001). This again demonstrates partial mediation, with OAM playing a particularly substantial role in transferring the effect of PAD to SPE. For Shanghai, the indirect effect was weaker but still significant (0.185, 95% CI [0.087, 0.299]), while the direct effect was 0.457 (SE = 0.071, p < 0.001). This suggests that in Shanghai, PAD affects SPE mainly through a direct channel, but OAM nonetheless provides a meaningful complementary pathway.
These findings underscore the importance of OAM as a mediating mechanism linking planning quality to service efficiency. Across all three pilot cities, respondents’ confidence in IES planning and design translated into higher assessments of service performance, both directly and indirectly through perceptions of operational performance. However, the strength of mediation varied across contexts. In Tianjin, the mediation effect was the strongest, suggesting that respondents place a particularly high value on effective operation and maintenance when assessing the efficiency of energy services. This reflects a local emphasis on operational performance and service continuity as key components of consumer confidence [114]. In Beijing, although the mediation effect was moderate, the direct effect remained relatively strong, indicating that respondents in the capital city place greater emphasis on planning credibility itself, independent of operational performance. This aligns with Beijing’s role as a policy demonstration zone, where strategic planning and design are more apparent for respondents’ perception in IES [102]. In Shanghai, the weaker mediation effect suggests that respondents rely more on direct perceptions of planning when forming judgements about service efficiency, with less emphasis on the intermediary role of OAM. This is due to the city’s higher baseline expectations for service quality, where planning is assumed to be directly linked to execution [112]. Overall, the effect of planning and design on service efficiency is partially mediated by operation and maintenance. The findings highlight the need for IES providers to not only demonstrate robust planning but also ensure reliable operational practices, particularly in contexts where respondents’ trust depends heavily on service continuity and operational performance.

3.3.2. The Impact of SEF on SAP Is Mediated by SQU

Figure 5 and Table 8 highlight the mediation results for pathway 2 across Beijing, Tianjin, and Shanghai. In all three cities, both the direct and indirect effects were significant, confirming that SQU mediates the relationship between SEF and SAP. For Beijing, the indirect effect was 0.231 (95% CI [0.057, 0.426]), and the direct effect remained significant at 0.531 (SE = 0.093, p < 0.001). This indicates a partial mediation, where SEF directly influences SAP while also exerting an additional indirect effect through SQU. For Tianjin, the indirect effect was 0.182 (95% CI [0.079, 0.300]), with a stronger direct effect of 0.695 (SE = 0.062, p < 0.001). This suggests that respondents in Tianjin rely more heavily on service efficiency itself when evaluating system and pricing, though perceptions of service quality still play a complementary mediating role. For Shanghai, the indirect effect was the strongest among the three areas (0.263, 95% CI [0.165, 0.383]), while the direct effect also remained significant at 0.604 (SE = 0.051, p < 0.001). These results indicate that in Shanghai, respondents’ evaluations on SAP are more substantially shaped by their perceptions of service quality, suggesting a stronger mediation mechanism compared to Beijing and Tianjin.
The findings provide strong support that the effect of service efficiency on system and price is consistently mediated by service quality across the three pilot areas. However, the degree of mediation varies by context. In Beijing, the evidence of partial mediation indicates that while service quality is relevant, respondents’ judgements of the IES system are still strongly influenced by direct perceptions of service efficiency. This reflects a relatively pragmatic orientation, where service efficiency is considered an independent marker of system and fair pricing [115]. In Tianjin, the stronger direct effect suggests that respondents prioritise service efficiency as the primary determinant of price acceptance, with service quality serving as a secondary channel. This pattern highlights the importance of operational responsiveness and efficiency improvements in strengthening local confidence in energy service [116]. By contrast, Shanghai demonstrates the strongest mediating role of service quality. Service efficiency influences system and price, mainly through its quality, implying that respondents do not separate service efficiency and quality but rather view them as interconnected criteria for evaluating system fairness and accessibility. This reflects higher expectations for integrated service experiences, where quality acts as the key bridge linking operational efficiency to consumer judgements of price and system value [117,118]. The results confirm that IES forms an interdependent construct. While service efficiency is a critical driver, its impact on pricing acceptance is often filtered through service quality, underscoring the need for IES providers to enhance not only technical efficiency but also perceived service quality to achieve broader acceptance.
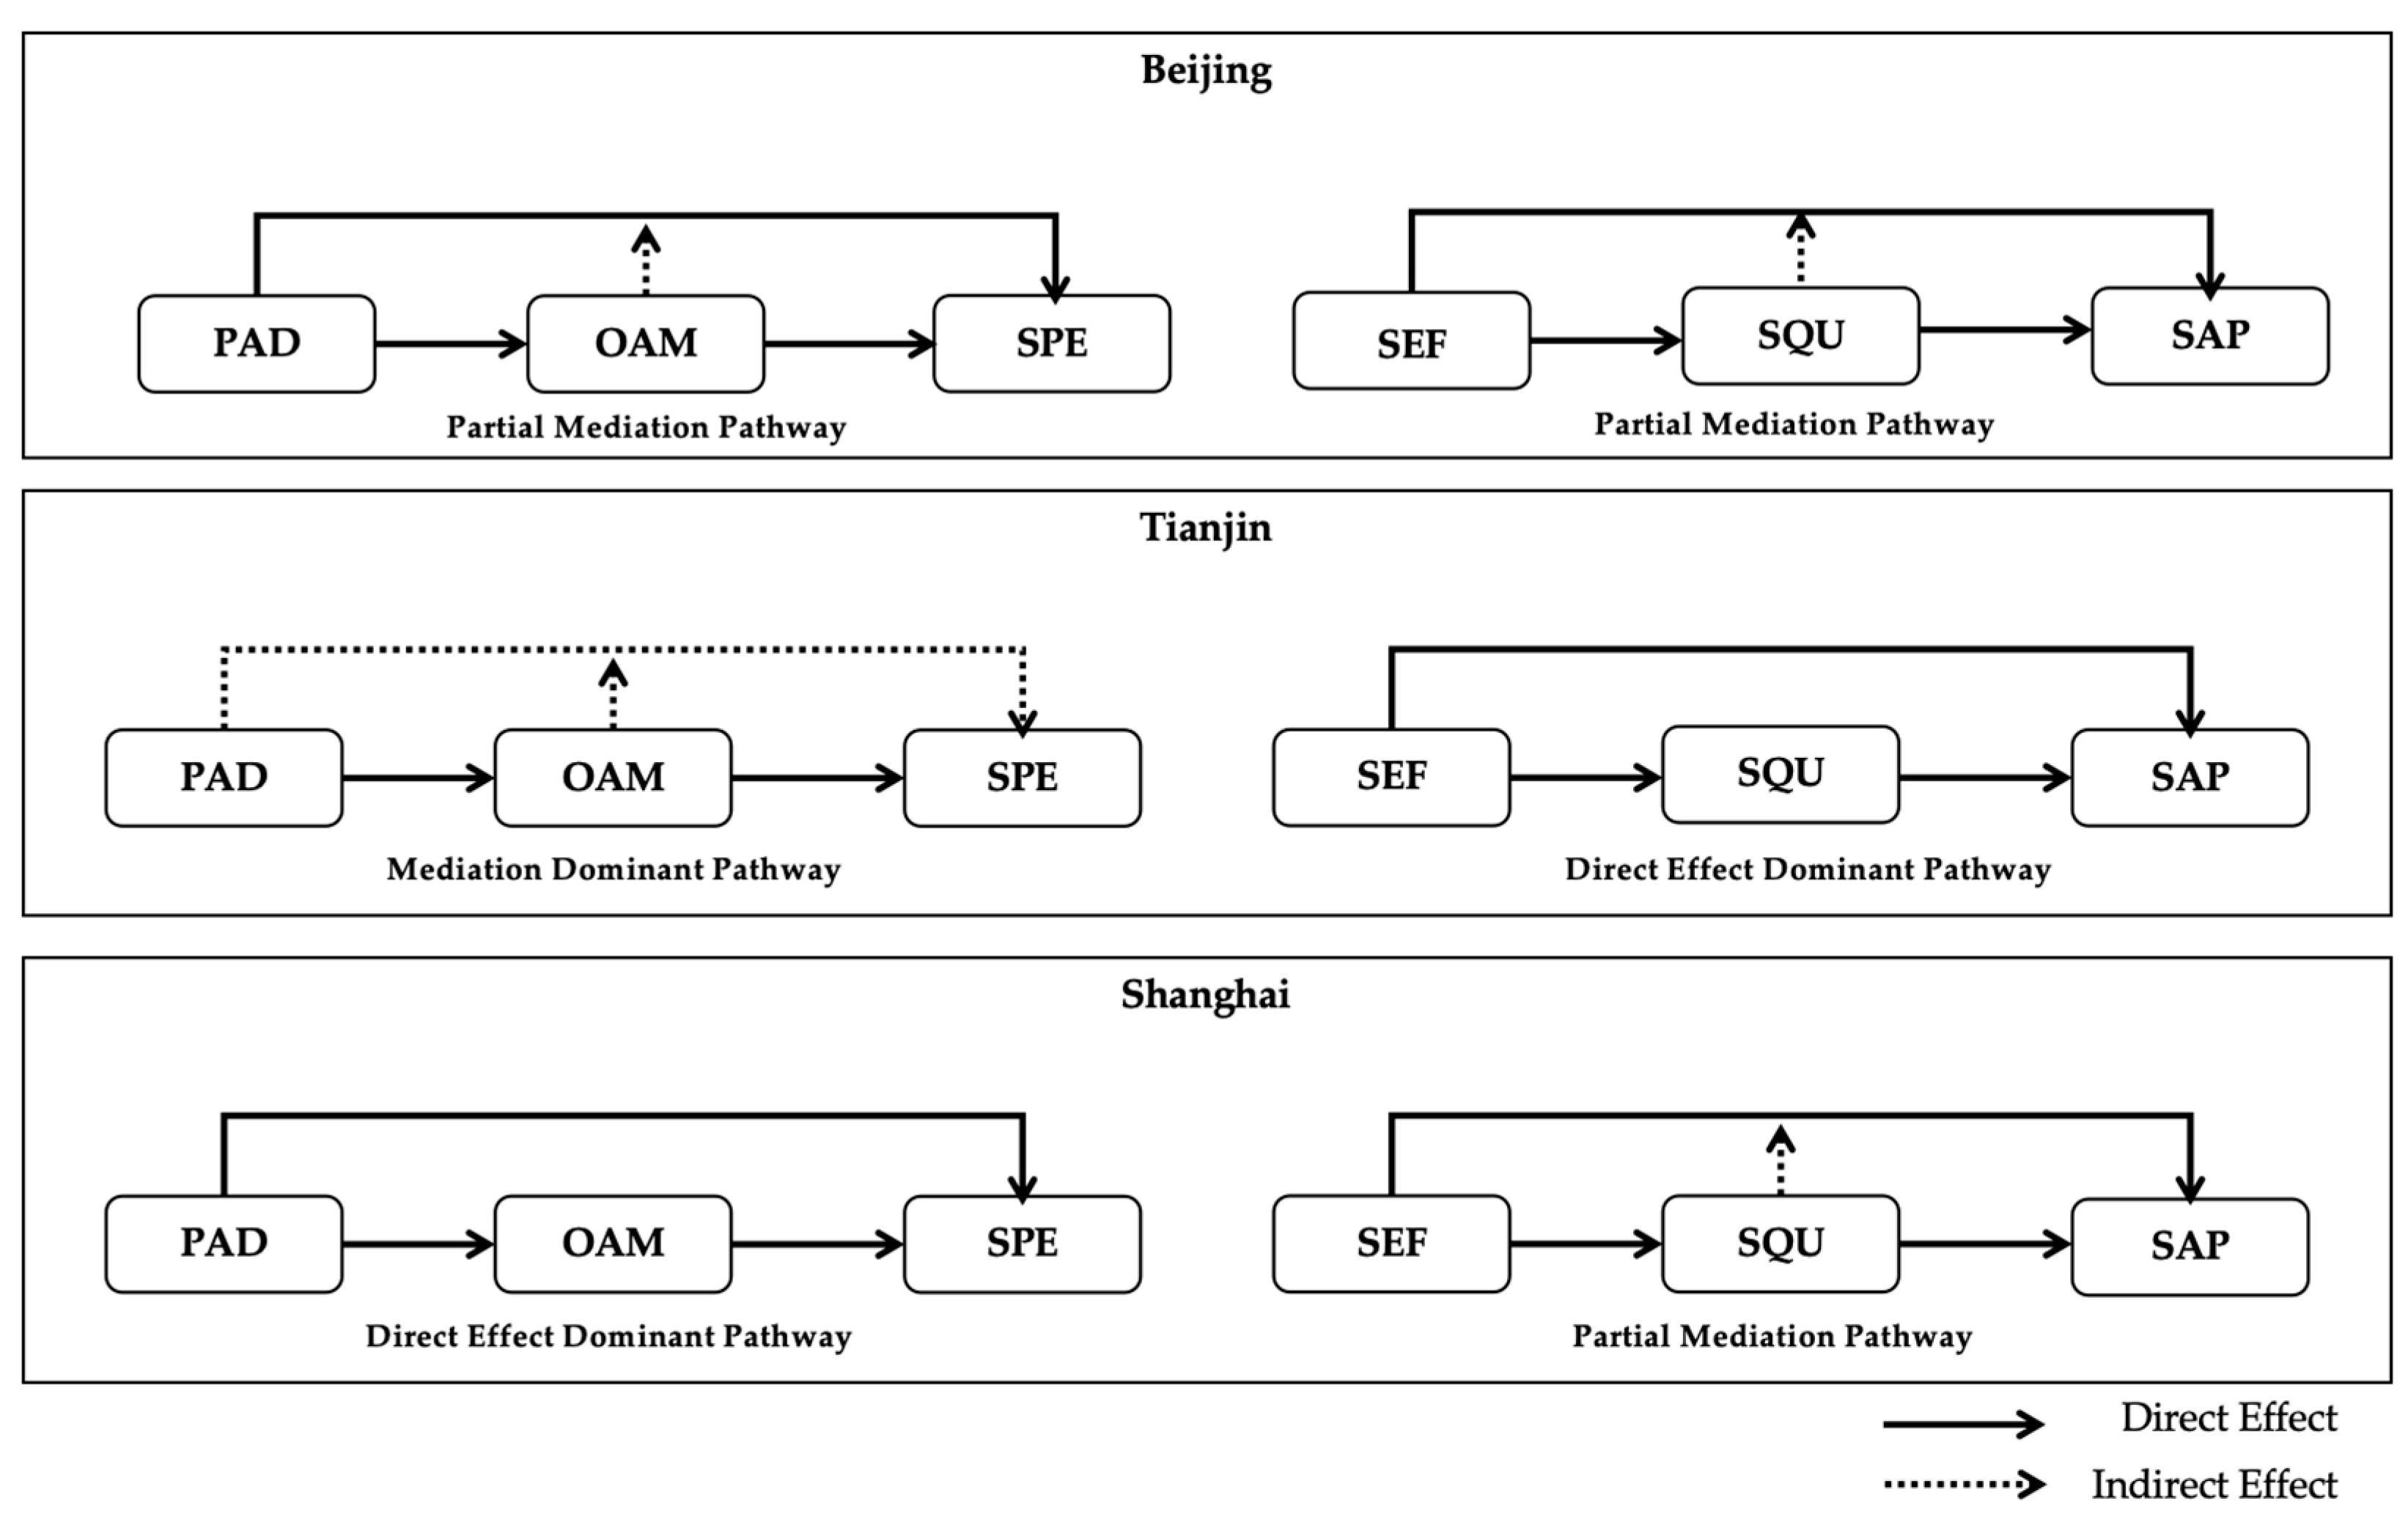
Unlike previous IES acceptance studies that examined isolated regions or lacked policy integration [119,120], this study provides a cross-city comparative insight under a unified policy framework, revealing distinct behavioral mechanisms in government-oriented IES pilot areas. These findings expand earlier conclusions that technical performance dominates satisfaction by demonstrating that service efficiency and quality mediate consumers’ price perception and acceptance [121]. The diagram (see Figure 6) illustrates the differentiated mediation mechanisms across the three pilot cities, showing how planning, operation, efficiency, and quality jointly shape consumer acceptance of IES. In Beijing, both mechanisms exhibit partial mediation effects. Planning and design influence service performance both directly and through operation and maintenance, while service efficiency affects price perception via service quality. This pattern reflects Beijing’s balanced emphasis on institutional planning and operational reliability, where coordinated policies and trust in system delivery strengthen consumer confidence. In Tianjin, the first mechanism is mediation-dominant, as operational efficiency forms the main channel linking planning efforts with perceived service outcomes. Conversely, the second mechanism is direct-effect dominant, suggesting that consumers prioritise visible efficiency gains that directly affect affordability rather than relying on service quality as an intermediary. In Shanghai, both mechanisms display mixed mediation and direct effects. Planning has a stronger direct impact due to mature governance and service management systems, while service quality still mediates consumers’ perception of value and pricing fairness. These findings indicate that although the structural logic of IES acceptance is consistent, the relative influence of planning, efficiency, and service quality varies across cities, reflecting differences in governance approach, service maturity, and consumer expectations. This evidence contributes new empirical validation of consumer-level mechanisms in IES evaluation, an area previously discussed largely from engineering or policy perspectives.

4. Conclusions

This study examined consumer awareness, perceptions, and satisfaction regarding IES across three government-designated pilot areas. The results show that respondents recognise the environmental drawbacks of conventional energy and acknowledge the environmental and technological advantages of IES, though uncertainty remains about its full substitutability for traditional sources. Two core mediation mechanisms explain how consumer cognition transforms into acceptance. The first mechanism shows that planning and design shape perceptions of service performance both directly and indirectly through operation and maintenance, emphasising the role of structured planning and reliable operations in fostering consumer trust. The second mechanism demonstrates that service efficiency affects perceptions of affordability through service quality, suggesting that fairness in pricing is closely linked to the perceived professionalism and responsiveness of service delivery. City-level analyses reveal distinctive variations in these pathways. In Beijing, both mechanisms exhibit partial mediation, where transparent planning and stable operations reinforce consumer confidence. In Tianjin, operational efficiency acts as a mediation-dominant driver, directly influencing satisfaction and price perception with less reliance on service quality. In Shanghai, partial mediation is again evident, as high service quality continues to mediate consumers’ perception of system value and pricing fairness. These differentiated mechanisms demonstrate that IES acceptance is a multidimensional process linking consumer cognition, provider capability, and service experience. Strengthening IES development requires an integrated approach that combines robust planning, operational efficiency, and high-quality service provision, while ensuring that national policy intentions align with localised consumer expectations. The methodological contribution lies in integrating descriptive, correlation, and mediation analyses to explain consumer behavior toward IES. This framework is also adaptable to other emerging energy markets, offering a basis for analyzing consumer responses under different policy and service settings. The results highlight that improving planning reliability and service quality can enhance public confidence in energy transitions, offering insights relevant for sustainable urban energy governance.
This study offers both theoretical and practical implications for advancing the understanding of government-oriented IES. The findings demonstrate that consumers’ awareness, perception, and satisfaction are not only shaped by service quality and efficiency but also vary significantly across cities under a unified policy framework. These insights contribute to refining existing behavioral models of energy acceptance and provide policy guidance for designing localized, government-oriented IES strategies. Despite its contributions, this study has several limitations. The survey data were collected from three pilot cities, which were all major metropolitan areas currently prioritized in China’s IES pilot program. As such, the findings may not fully capture conditions in smaller or less-developed regions. Moreover, the cross-sectional design limits the ability to capture temporal changes in consumer behavior or policy impacts. Future research could extend this work by incorporating additional regions and applying longitudinal or mixed method approaches to track evolving consumer perceptions. Comparative studies across different countries could also help in examining whether the findings from this study are consistent with the mechanisms identified here are consistent in diverse policy and cultural contexts. Further integration of economic and environmental performance indicators would enhance the robustness of the proposed social model and broaden its global applicability.

Author Contributions

Conceptualization, X.X. and N.S.Z.; methodology, X.X. and N.S.Z.; formal analysis, X.X.; investigation, X.X.; data curation, X.X. and N.S.Z.; writing—original draft preparation, X.X. and N.S.Z.; writing—review and editing, N.S.Z., A.H.S. and N.N.R.N.A.R.; supervision, N.S.Z., A.H.S. and N.N.R.N.A.R. All authors have read and agreed to the published version of the manuscript.

Funding

This research received no external funding.

Institutional Review Board Statement

The study was approved by the Ethics Committee of SHVTC (SHVTC-ETHICS-2025-001; date: 11 August 2025).

Informed Consent Statement

Informed consent was obtained from all subjects involved in the study.

Data Availability Statement

The original data supporting the conclusions of this article will be made available by the authors upon request.

Acknowledgments

This study is a part of the Faculty-Driven Research Program under the theme Environmental Advocacy, Policy, Governance, and City Planning Research Group of the Faculty of Forestry and Environment, Universiti Putra Malaysia. The authors gratefully acknowledge the support and guidance provided by the faculty and research administration.

Conflicts of Interest

The authors declare no conflicts of interest.

Abbreviations

The following abbreviations are used in this manuscript:
IESIntegrated Energy Services
IEAInternational Energy Agency
CEDConventional Energy Disadvantages
IESAIES Advantages
PADPlanning And Design
OAMOperation and Maintenance
SPEService Performance
SEFService Efficiency
CIConfidence Interval
LLCILower-level Confidence Interval
ULCIUpper-level Confidence Interval
SEStandard Error

References

  1. Durmus Senyapar, H.N.; Aksoz, A. Empowering sustainability: A consumer-centric analysis based on advanced electricity consumption predictions. Sustainability 2024, 16, 2958. [Google Scholar] [CrossRef]
  2. Certini, G.; Scalenghe, R. The crucial interactions between climate and soil. Sci. Total Environ. 2023, 856, 159169. [Google Scholar] [CrossRef] [PubMed]
  3. Wyrzykowska, B.; Czech, A.; Dąbrowska, A.; Rytko, A. Pro-ecological consumer behavior versus energy reduction and sustainable consumption: A case from Poland. Sustainability 2024, 16, 7556. [Google Scholar] [CrossRef]
  4. Mišík, M. The EU needs to improve its external energy security. Energy Policy 2022, 165, 112930. [Google Scholar] [CrossRef]
  5. Csutora, M.; Harangozo, G.; Szigeti, C. Factors behind the consumer acceptance of sustainable business models in pandemic times. Sustainability 2022, 14, 9450. [Google Scholar] [CrossRef]
  6. Bogdanov, D.; Ram, M.; Aghahosseini, A.; Gulagi, A.; Oyewo, A.S.; Child, M.; Breyer, C. Low-cost renewable electricity as the key driver of the global energy transition towards sustainability. Energy 2021, 227, 120467. [Google Scholar] [CrossRef]
  7. Yakymchuk, A.; Rataj, M.A. Economic analysis of fossil CO2 emissions: A European perspective on sustainable development. Energies 2025, 18, 2106. [Google Scholar] [CrossRef]
  8. International Energy Agency. CO2 Emissions in 2023: Analysis; IEA: Paris, France, 2024; Available online: https://www.iea.org/reports/co2-emissions-in-2023 (accessed on 19 September 2025).
  9. Financial Times. Clean Tech Investment Set to Hit $2 tn in 2024. Financial Times, 26 June 2024. Available online: https://www.ft.com/ (accessed on 19 September 2025).
  10. Statistical Review of World Energy. Global Energy Consumption Share: Conventional Energy 2023; Energy Institute: London, UK, 2024; Available online: https://www.energyinst.org/statistical-review (accessed on 19 September 2025).
  11. Wei, Y.; Xu, W.; Chen, Y.; Peng, Y.; Ke, H.; Zhan, L.; Lan, J.; Li, H.; Zhang, Y. Evaluation of greenhouse gas emission and reduction potential of high-food-waste-content municipal solid waste landfills: A case study of a landfill in the east of China. Waste Manag. 2024, 189, 290–299. [Google Scholar] [CrossRef]
  12. Daudu, C.D.; Adefemi, A.; Adekoya, O.O.; Okoli, C.E.; Ayorinde, O.B.; Daraojimba, A.I. LNG and climate change: Evaluating its carbon footprint in comparison to other fossil fuels. Eng. Sci. Technol. J. 2024, 5, 412–426. [Google Scholar] [CrossRef]
  13. Wiatros-Motyka, M. Global Electricity Review 2023; Ember: London, UK, 2023; Available online: https://ember-energy.org/ (accessed on 19 September 2025).
  14. Gandomi, S.; Barzegar, M.; Zolghadri, S.; Rahimpour, M.R. The future of fossil fuel supply and impacts on sustainability. Encycl. Renew. Energy Sustain. Environ. 2024, 121, 121–129. [Google Scholar]
  15. Stennikov, V.; Barakhtenko, E.; Mayorov, G.; Sokolov, D.; Zhou, B. Coordinated management of centralized and distributed generation in an integrated energy system using a multi-agent approach. Appl. Energy 2022, 309, 118487. [Google Scholar] [CrossRef]
  16. Haghgoo, M.; Dognini, A.; Storek, T.; Plamanescu, R.; Rahe, U.; Gheorghe, S.; Müller, D. A cloud-based service-oriented architecture to unlock smart energy services. Energy Inform. 2021, 4, 8. [Google Scholar] [CrossRef]
  17. Stermieri, L.; Kober, T.; McKenna, R.; Schmidt, T.J.; Panos, E. Impacts of digitalization and societal changes on energy transition: A novel socio-techno-economic energy system model. Energy Strategy Rev. 2023, 50, 101224. [Google Scholar] [CrossRef]
  18. Buffa, S.; Fouladfar, M.H.; Franchini, G.; Lozano Gabarre, I.; Andres Chicote, M. Advanced control and fault detection strategies for district heating and cooling systems—A review. Appl. Sci. 2021, 11, 455. [Google Scholar] [CrossRef]
  19. Zhou, H.; Xue, J.; Gao, H.; Ma, N. Hydrogen-fueled gas turbines in future energy systems. Int. J. Hydrogen Energy 2024, 64, 569–582. [Google Scholar] [CrossRef]
  20. Wang, M.; Yu, H.; Yang, Y.; Lin, X.; Guo, H.; Li, C.; Jing, R. Unlocking emerging impacts of carbon tax on integrated energy systems through supply and demand co-optimization. Appl. Energy 2021, 302, 117579. [Google Scholar] [CrossRef]
  21. Ben Jebli, M.; Chaouali, I. The influence of renewable energy integration and service value-added on carbon dioxide emissions in China. Environ. Prog. Sustain. Energy 2025, 44, e14630. [Google Scholar] [CrossRef]
  22. Li, L.; Lin, J.; Wu, N.; Xie, S.; Meng, C.; Zheng, Y.; Zhao, Y. Review and outlook on the international renewable energy development. Energy Built Environ. 2022, 3, 139–157. [Google Scholar] [CrossRef]
  23. Tu, T.T.; Anh, N.V.P.; Phuong, N.V.H. Low-carbon pathways for Ho Chi Minh City, Vietnam. IOP Conf. Ser. Earth Environ. Sci. 2025, 1540, 012009. [Google Scholar] [CrossRef]
  24. Zeng, S.; Su, B.; Zhang, M.; Gao, Y.; Liu, J.; Luo, S.; Tao, Q. Analysis and forecast of China’s energy consumption structure. Energy Policy 2021, 159, 112630. [Google Scholar] [CrossRef]
  25. Luo, G.; Liu, Y.; Zhang, L.; Xu, X.; Guo, Y. Do governmental subsidies improve the financial performance of China’s new energy power generation enterprises? Energy 2021, 227, 120432. [Google Scholar] [CrossRef]
  26. Kishore, T.S.; Kumar, P.U.; Ippili, V. Review of global sustainable solar energy policies: Significance and impact. Innovation and Green Development 2025, 4, e100224. [Google Scholar] [CrossRef]
  27. China State Council Information Office. China’s Energy Transition [White Paper]; National Energy Administration: Beijing, China, 2024. Available online: https://www.nea.gov.cn/2024-08/29/c_1310785406.htm (accessed on 19 September 2025).
  28. Shrestha, B.; Tiwari, S.R.; Bajracharya, S.B.; Keitsch, M.M.; Rijal, H.B. Review on the importance of gender perspective in household energy-saving behavior and energy transition for sustainability. Energies 2021, 14, 7571. [Google Scholar] [CrossRef]
  29. Sousa, J. A policy and evaluation framework for sustainable transitions—An energy policy approach. Adv. Environ. Eng. Res. 2024, 5, 003. [Google Scholar] [CrossRef]
  30. Zhao, Z.; Xu, J.; Lei, Y.; Liu, C.; Shi, X.; Lai, L.L. Robust dynamic dispatch strategy for multi-uncertainties integrated energy microgrids based on enhanced hierarchical model predictive control. Appl. Energy 2025, 381, 125141. [Google Scholar] [CrossRef]
  31. Song, D.; Meng, W.; Dong, M.; Yang, J.; Wang, J.; Chen, X.; Huang, L. A critical survey of integrated energy system: Summaries, methodologies, and analysis. Energy Convers. Manag. 2022, 266, 115863. [Google Scholar] [CrossRef]
  32. Luo, F.; Xu, J.; Zhang, T. Quantitative evaluation of power supply reliability improvement in distribution network by customer-side integrated energy system. Energy Rep. 2021, 7, 233–241. [Google Scholar] [CrossRef]
  33. Salisu, A.A.; Olaniran, A.O.; Vo, X.V. Geopolitical risk, climate risk, and financial innovation in the energy market. Energy 2025, 315, 134365. [Google Scholar] [CrossRef]
  34. Li, J.; Dong, K.; Dong, X. Green energy as a new determinant of green growth in China: The role of green technological innovation. Energy Econ. 2022, 114, 106260. [Google Scholar] [CrossRef]
  35. Ober, J.; Karwot, J. Pro-ecological behavior: Empirical analysis on the example of Polish consumers. Energies 2022, 15, 1690. [Google Scholar] [CrossRef]
  36. Prisecaru, P. The war in Ukraine and the overhaul of EU energy security. Glob. Econ. Obs. 2022, 10, 45–52. [Google Scholar]
  37. Huang, Z.; Gong, W.; Duan, J. TBDQN: A novel two-branch deep Q-network for crude oil and natural gas futures trading. Appl. Energy 2023, 347, 121321. [Google Scholar] [CrossRef]
  38. Kabeyi, M.J.B.; Olanrewaju, O.A. Sustainable energy transition for renewable and low-carbon grid electricity generation and supply. Front. Energy Res. 2022, 9, 743114. [Google Scholar] [CrossRef]
  39. Huang, S.; Zhang, C.; Li, W.; Liu, M. Industrial policies of integrated energy services in China: A perspective of qualitative analysis. Heliyon 2023, 9, e22360. [Google Scholar] [CrossRef] [PubMed]
  40. Bogdanov, D.; Oyewo, A.S.; Mensah, T.N.O.; Nishida, Y.; Saito, T.; Aikawa, T.; Breyer, C. Energy transition for Japan: Pathways towards a 100% renewable energy system in 2050. IET Renew. Power Gener. 2023, 17, 3298–3324. [Google Scholar] [CrossRef]
  41. State Council of the People’s Republic of China. The 14th Five-Year Plan for National Economic and Social Development and the Long-Range Objectives Through the Year 2035; The Central People’s Government of the PRC: Beijing, China, 2021.
  42. GB/T 40010-2021; Technical Guidelines for Evaluation of Energy Performance Contracting Service. Standardization Administration of China SAC: Beijing, China, 2021.
  43. National Energy Administration. Promotion of 100 Smart Energy Demonstration Projects; NEA: Beijing, China, 2021. [Google Scholar]
  44. Beijing Municipal People’s Government. The 14th Five-Year Plan for Beijing’s Energy Development; BMPG: Beijing, China, 2022.
  45. Shanghai Municipal People’s Government. The 14th Five-Year Plan for Shanghai’s Energy Development; SMPG: Shanghai, China, 2022.
  46. Tianjin Development and Reform Commission. The 14th Five-Year Plan for Tianjin’s Energy Development; TDRC: Tianjin, China, 2022.
  47. Yang, L.; Danwana, S.B.; Yassaanah, I.F.L. An empirical study of renewable energy technology acceptance in Ghana using an extended technology acceptance model. Sustainability 2021, 13, 10791. [Google Scholar] [CrossRef]
  48. Fett, D.; Dehler-Holland, J.; Schmutz, M. A survey on the user acceptance of PV battery storage systems. Sustain. Manag. Forum Nachhalt. 2021, 29, 161–171. [Google Scholar] [CrossRef]
  49. Zharova, A.; Lee, H.E. Understanding user perception and intention to use smart homes for energy efficiency: A survey. arXiv 2022, arXiv:2212.05019. [Google Scholar] [CrossRef]
  50. Zainal Ariffin, Z.; Isa, N.; Lokman, M.Q.; Ahmad Ludin, N.; Jusoh, S.; Ibrahim, M.A. Consumer acceptance of renewable energy in Peninsular Malaysia. Sustainability 2022, 14, 14627. [Google Scholar] [CrossRef]
  51. Tran, T.H.H.; Vu, T.D. Enhancing renewable energy product consumption of young customers through sustainable development goals knowledge: An application of the theory of planned behavior. Sustainability 2025, 17, 3784. [Google Scholar] [CrossRef]
  52. Berjawi, A.E.H.; Walker, S.L.; Patsios, C.; Hosseini, S.H.R. An evaluation framework for future integrated energy systems: A whole energy systems approach. Renew. Sustain. Energy Rev. 2021, 145, 111163. [Google Scholar] [CrossRef]
  53. National Bureau of Statistics of China. Homepage. Available online: http://www.stats.gov.cn/ (accessed on 15 June 2025).
  54. Ministry of Housing and Urban-Rural Development of the People’s Republic of China. Homepage. Available online: http://www.mohurd.gov.cn (accessed on 15 June 2025).
  55. National Bureau of Statistics of China. China Statistical Yearbook 2024; China Statistics Press: Beijing, China, 2024.
  56. Zhao, B.; Wang, K. The differences between county, county-level city and municipal district in the system of administrative divisions in China. J. Geogr. Res. Maǧallaẗ Al-Buḥūṯ Al-Ǧuġrāfiyyaẗ 2022, 5, 25–38. [Google Scholar] [CrossRef]
  57. Lu, W.W.; Tsai, K.S. Picking places and people: Centralizing provincial governance in China. China Q. 2021, 248, 957–986. [Google Scholar] [CrossRef]
  58. Fabbrizzi, S.; Papadopoulos, S.; Ntoutsi, E.; Kompatsiaris, I. A survey on bias in visual datasets. Comput. Vis. Image Underst. 2022, 223, 103552. [Google Scholar] [CrossRef]
  59. Liang, F.; Liu, J.; Liu, M.; Zeng, J.; Yang, L.; He, J. Scale-dependent impacts of urban morphology on commercial distribution: A case study of Xi’an, China. Land 2021, 10, 170. [Google Scholar] [CrossRef]
  60. Jamieson, S. Likert scales: How to (ab)use them? Med. Educ. 2004, 38, 1217–1218. [Google Scholar] [CrossRef]
  61. Sovacool, B.K.; Kester, J.; Noel, L.; de Rubens, G.Z. The demographics of decarbonizing transport: The influence of gender, education, occupation, age, and household size on electric mobility preferentableces in the Nordic region. Glob. Environ. Change 2018, 52, 86–100. [Google Scholar] [CrossRef]
  62. Sovacool, B.K.; Evensen, D.; Baum, C.M.; Fritz, L.; Low, S. Demographics shape public preferences for carbon dioxide removal and solar geoengineering interventions across 30 countries. Commun. Earth Environ. 2024, 5, 642. [Google Scholar] [CrossRef]
  63. Hasan, M.K.H.; Kumar, L.K. Determining adequate sample size for social survey research: Sample size for social survey research. J. Bangladesh Agric. Univ. 2024, 22, 146–157. [Google Scholar] [CrossRef]
  64. Watson, G.S. William Gemmell Cochran 1909–1980. Ann. Stat. 1982, 10, 1–10. [Google Scholar] [CrossRef]
  65. Connelly, L.M. Research Roundtable. Cronbach’s Alpha. Medsurg Nurs. 2011, 20, 45–47. [Google Scholar]
  66. Fitzner, K. Reliability and validity: A quick review. Diabetes Educ. 2007, 33, 775–780. [Google Scholar] [CrossRef] [PubMed]
  67. Yu, C.H. Reliability and validity. Educ. Assess. 2005, 10, 10–12. [Google Scholar]
  68. Clark, R.G.; Steel, D.G. Sampling within households in household surveys. J. R. Stat. Soc. A Stat. Soc. 2007, 170, 63–82. [Google Scholar] [CrossRef]
  69. Smyth, J.D.; Olson, K.; Stange, M. Within-household selection methods: A critical review and experimental examination. In Experimental Methods in Survey Research: Techniques that Combine Random Sampling with Random Assignment; Springer: Cham, Switzerland, 2019; pp. 23–45. [Google Scholar]
  70. Etikan, I.; Bala, K. Sampling and sampling methods. Biom. Biostat. Int. J. 2017, 5, 149. [Google Scholar] [CrossRef]
  71. Fourcade, Y.; Engler, J.O.; Rödder, D.; Secondi, J. Mapping species distributions with MAXENT using a geographically biased sample of presence data: A performance assessment of methods for correcting sampling bias. PLoS ONE 2014, 9, e97122. [Google Scholar] [CrossRef]
  72. Xu, Y.; Goodacre, R. On splitting training and validation set: A comparative study of cross-validation, bootstrap and systematic sampling for estimating the generalization performance of supervised learning. J. Anal. Test. 2018, 2, 249–262. [Google Scholar] [CrossRef]
  73. Singh, A.S.; Masuku, M.B. Sampling techniques and determination of sample size in applied statistics research: An overview. Int. J. Econ. Commer. Manag. 2014, 2, 1–22. [Google Scholar]
  74. Rashid, A.; Rasheed, R.; Amirah, N.A.; Yusof, Y.; Khan, S.; Agha, A.A. A quantitative perspective of systematic research: Easy and step-by-step initial guidelines. Turk. Online J. Qual. Inq. 2021, 12, 45–60. [Google Scholar]
  75. Alvi, M. A Manual for Selecting Sampling Techniques in Research (MPRA Paper 70218); University of Karachi: Karachi, Pakistan, 2016. [Google Scholar]
  76. Acharya, A.S.; Prakash, A.; Saxena, P.; Nigam, A. Sampling: Why and how of it. Indian J. Med. Spec. 2013, 4, 330–333. [Google Scholar] [CrossRef]
  77. Bhardwaj, P. Types of sampling in research. J. Pract. Cardiovasc. Sci. 2019, 5, 157–163. [Google Scholar] [CrossRef]
  78. Marshall, G.; Jonker, L. An introduction to descriptive statistics: A review and practical guide. Radiography 2010, 16, e1–e7. [Google Scholar] [CrossRef]
  79. Alabi, O.; Bukola, T. Introduction to descriptive statistics. In Recent Advances in Biostatistics; IntechOpen: London, UK, 2023; pp. 1–15. [Google Scholar]
  80. De Winter, J.C.; Gosling, S.D.; Potter, J. Comparing the Pearson and Spearman correlation coefficients across distributions and sample sizes: A tutorial using simulations and empirical data. Psychol. Methods 2016, 21, 273–290. [Google Scholar] [CrossRef]
  81. Schober, P.; Boer, C.; Schwarte, L.A. Correlation coefficients: Appropriate use and interpretation. Anesth. Analg. 2018, 126, 1763–1768. [Google Scholar] [CrossRef] [PubMed]
  82. Hotelling, H.; Pabst, M.R. Rank correlation and tests of significance involving no assumption of normality. Ann. Math. Stat. 1936, 7, 29–43. [Google Scholar] [CrossRef]
  83. Zimmerman, D.W.; Zumbo, B.D.; Williams, R.H. Bias in estimation and hypothesis testing of correlation. Psicológica 2003, 24, 17–41. [Google Scholar]
  84. Akoglu, H. User’s guide to correlation coefficients. Turk. J. Emerg. Med. 2018, 18, 91–93. [Google Scholar] [CrossRef]
  85. Steffener, J. Power of mediation effects using bootstrap resampling. arXiv 2021, arXiv:2106.02482. [Google Scholar] [CrossRef]
  86. Fritz, M.S.; MacKinnon, D.P. Required sample size to detect the mediated effect. Psychol. Sci. 2007, 18, 233–239. [Google Scholar] [CrossRef]
  87. Preacher, K.J.; Hayes, A.F. Asymptotic and resampling strategies for assessing and comparing indirect effects in multiple mediator models. Behav. Res. Methods 2008, 40, 879–891. [Google Scholar] [CrossRef]
  88. Götz, M.; O’Boyle, E.H.; Gonzalez-Mulé, E.; Banks, G.C.; Bollmann, S.S. The “Goldilocks Zone”: (Too) many confidence intervals in tests of mediation just exclude zero. Psychol. Bull. 2021, 147, 95–110. [Google Scholar] [CrossRef] [PubMed]
  89. Igartua, J.J.; Hayes, A.F. Mediation, moderation, and conditional process analysis: Concepts, computations, and some common confusions. Span. J. Psychol. 2021, 24, e49. [Google Scholar] [CrossRef] [PubMed]
  90. Yin, R.K. Case Study Research and Applications, 6th ed.; Sage: Thousand Oaks, CA, USA, 2018. [Google Scholar]
  91. Flyvbjerg, B. Five misunderstandings about case-study research. Qual. Inq. 2006, 12, 219–245. [Google Scholar] [CrossRef]
  92. Sovacool, B.K.; Griffiths, S. Culture and low-carbon energy transitions. Nat. Sustain. 2020, 3, 685–693. [Google Scholar] [CrossRef]
  93. Niesten, E.; Alkemade, F. How is value created and captured in smart grids? A review of the literature and an analysis of pilot projects. Renew. Sustain. Energy Rev. 2016, 53, 629–638. [Google Scholar] [CrossRef]
  94. Parasuraman, A.; Zeithaml, V.A.; Berry, L. SERVQUAL: A multiple-item scale for measuring consumer perceptions of service quality. J. Retail. 1988, 64, 12–40. [Google Scholar]
  95. Ali Abd Al-Hameed, K. Spearman’s correlation coefficient in statistical analysis. Int. J. Nonlinear Anal. Appl. 2022, 13, 3249–3255. [Google Scholar]
  96. Roscia, M.; Lazaroiu, G.C.; Dancu, V.S. The positive energy transition through consumer awareness. In Energy Transition Holistic Impact Challenge (ETHIC): A New Environmental and Climatic Era; Springer: Cham, Switzerland, 2024; pp. 441–456. [Google Scholar]
  97. Li, Y.; Chen, Z. Evaluation index system and evaluation method of China’s regional potential for electrical energy substitution. Math. Probl. Eng. 2018, 2018, 3834921. [Google Scholar] [CrossRef]
  98. Choi, J.W.; Sohn, C.S.; Lee, H.J. The impact of multi-dimensional trust for customer satisfaction. Manag. Sci. Financ. Eng. 2010, 16, 81–97. [Google Scholar]
  99. Kostka, G. Barriers to the implementation of environmental policies at the local level in China. World Bank Policy Res. Work. Pap. 2014, 7016, 29–32. [Google Scholar]
  100. Xiangyu, X.; Zainordin, N.S.; Sharaai, A.H.; Ab Rahim, N.N.R.N. Policy drivers of China’s integrated energy services: A current status review. Plan. Malays. 2024, 22, 45–60. [Google Scholar] [CrossRef]
  101. Hu, Y.; Zhang, S.; Pan, Q.; Nie, C.C. Development trends and solutions for comprehensive energy services in the context of green and low-carbon initiatives. Energy & Environment Management 2025, 1, 1–11. [Google Scholar] [CrossRef]
  102. Wang, Z. Study of psychological and behavioral factors influencing public acceptability of sustainable energy transition in China. In New Energy and Future Energy Systems; IOS Press: Amsterdam, The Netherlands, 2022; pp. 217–226. [Google Scholar]
  103. Hauke, J.; Kossowski, T. Comparison of values of Pearson’s and Spearman’s correlation coefficients on the same sets of data. Quaest. Geogr. 2011, 30, 87–93. [Google Scholar] [CrossRef]
  104. Stepanov, A. Comparison of correlation coefficients. Sankhya A 2025, 87, 191–218. [Google Scholar] [CrossRef]
  105. Spearman, C. The proof and measurement of association between two things. Am. J. Psychol. 1987, 100, 441–471. [Google Scholar] [CrossRef]
  106. Suen, C.; Ma, J.; Lin, X.; Thomas, R.J.; Westover, M.B.; Stone, K.; Zhang, C. Linking sleep microstructure, blood markers of inflammation and metabolism, and cognition: Mediation analysis in the osteoporotic fractures in men study. GeroScience 2025, 1–13. [Google Scholar] [CrossRef]
  107. Cohen, J. Statistical Power Analysis for the Behavioral Sciences, 2nd ed.; Routledge: New York, NY, USA, 2013. [Google Scholar]
  108. Baron, R.M.; Kenny, D.A. The moderator–mediator variable distinction in social psychological research: Conceptual, strategic, and statistical considerations. J. Pers. Soc. Psychol. 1986, 51, 1173–1182. [Google Scholar] [CrossRef]
  109. Pardo, A.; Román, M. Reflections on the Baron and Kenny model of statistical mediation. An. Psicol. 2013, 29, 614–623. [Google Scholar]
  110. Brady, M.K.; Cronin, J.J., Jr. Some new thoughts on conceptualizing perceived service quality: A hierarchical approach. J. Mark. 2001, 65, 34–49. [Google Scholar] [CrossRef]
  111. Verbich, D. Affordable and Fair? Analyzing Transit Fare Purchases, Service Quality, and Affordability and Their Implications for Social Equity. Master’s Thesis, Concordia University, Montreal, QC, Canada, 2016. [Google Scholar]
  112. Jain, T.K.; Jain, N. Service quality in the energy sector and its impact on sustainability. In Affordable and Clean Energy; Springer: Cham, Switzerland, 2020; pp. 1–9. [Google Scholar]
  113. Bolin, J.H. Introduction to Mediation, Moderation, and Conditional Process Analysis: A Regression-Based Approach; Guilford Press: New York, NY, USA, 2014. [Google Scholar]
  114. Parise, L. Service continuity in complex power systems: Safety, operation and maintenance. Energies 2014, 7, 1234–1248. [Google Scholar]
  115. Faria, N.; Mendes, L. Organizational image’s partial mediation role between quality and users’ satisfaction. Serv. Ind. J. 2013, 33, 1275–1293. [Google Scholar] [CrossRef]
  116. Lukic, R. The impact of energy efficiency on performance in service sector. Econ. Environ. Stud. 2016, 16, 169–190. [Google Scholar]
  117. Yao, J.; Xiao, E.; Jian, X.; Shu, L. Service quality and the share of renewable energy in electricity generation. Util. Policy 2021, 69, 101164. [Google Scholar] [CrossRef]
  118. Lukic, R. Energy efficiency and profitability in the service sector: A comparative study. J. Energy Environ. Policy Options 2021, 4, 8–14. [Google Scholar]
  119. Wu, N.; Zhang, F.; Wang, J.; Wang, X.; Wu, J.; Huang, J.; Zhao, Y. A review on modelling methods, tools, and services of integrated energy systems in China. Prog. Energy 2023, 5, 032003. [Google Scholar] [CrossRef]
  120. Liu, Y.; Chen, M.; Wang, P.; Wang, Y.; Li, F.; Hou, H. A review of carbon reduction pathways and policy–market mechanisms in integrated energy systems in China. Sustainability 2025, 17, 2802. [Google Scholar] [CrossRef]
  121. Shu, Y.; Dai, Y. The synergetic competition of cross-regional integrated energy systems with low-carbon technology heterogeneity under carbon emission trading mechanisms to achieve carbon reduction targets. Renew. Energy 2024, 236, 121394. [Google Scholar] [CrossRef]
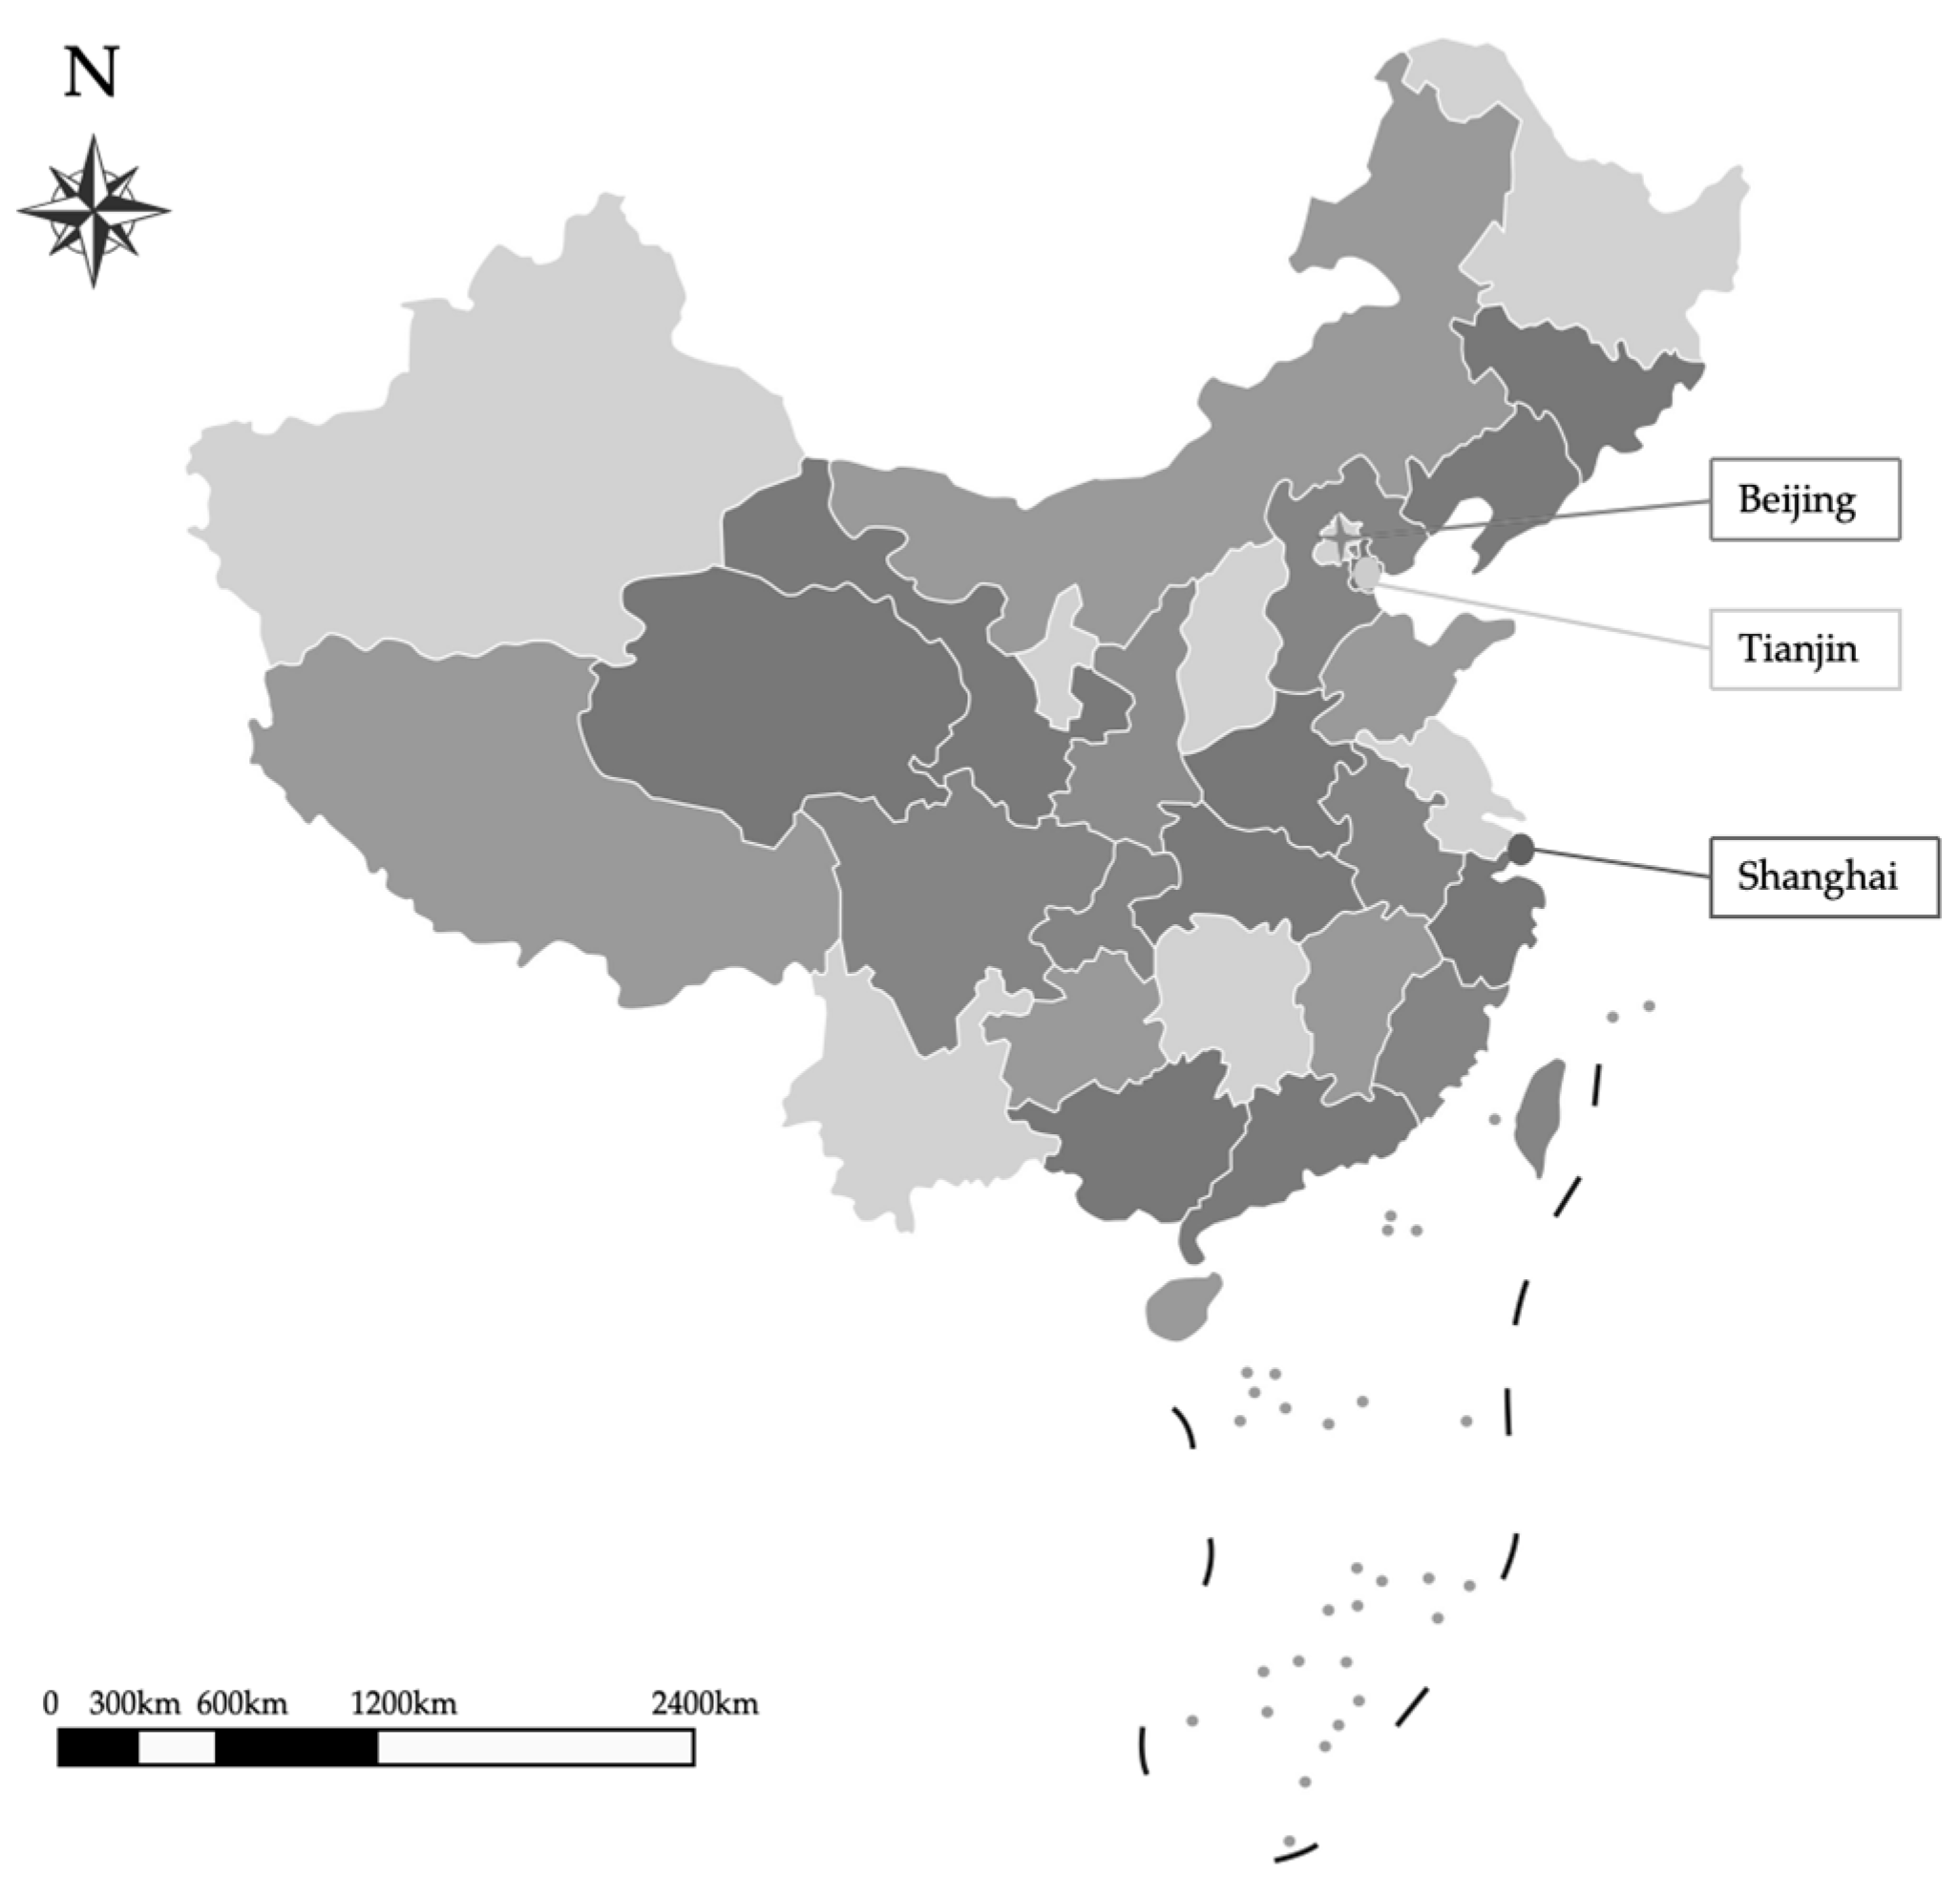
Figure 1. Location of the study areas.
Sustainability 17 10158 g001
Figure 2. Analytical framework of the study.
Sustainability 17 10158 g002
Figure 3. Inter-City Comparison of Spearman Correlation Coefficients. Indicator: PAD: Planning and Design; OAM: Operation and Maintenance; SPE: Service Performance; SEF: Service Efficiency; SQU: Service Quality; SAP: System and Price. **. Correlation is significant at the 0.01 level (2-tailed).
Sustainability 17 10158 g003
Figure 4. Mediation pathway design for PAD, OAM, and SPE. Indicator: PAD: Planning And Design; OAM: Operation and Maintenance; SPE: Service Performance.
Sustainability 17 10158 g004
Figure 5. Mediation pathway design for SEF, SQU, and SAP. Indicator: SEF: Service Efficiency; SQU: Service Quality; SAP: System and Price.
Sustainability 17 10158 g005
Figure 6. City-level pathways of IES acceptance. Indicator: PAD: Planning and design; OAM: Operation and Maintenance; SPE: Service Performance; SEF: Service Efficiency; SQU: Service Quality; SAP: System and Price.
Sustainability 17 10158 g006
Table 1. Study areas information.
BeijingTianjinShanghai
LocationLow Carbon ParkJinzhong StreetZhangjiang Town
Population70,582100,536108,597
Type of areaUrbanUrbanUrban
Type of populationResidentResidentResident
Economic activitiesRetail, Catering, Service industry, Real estate services
Source: National Bureau of Statistics of China; Ministry of Housing and Urban-Rural Development of the People’s Republic of China; Reprinted from ref. [53,54].
Table 2. Spearman Rho Correlation Interpretation Guidelines.
ρ (rho)Strength of CorrelationSignificance (p-Value)Academic Implication
0.00–0.30Low correlationIf p > 0.05 → nullCautiously interpretable
0.30–0.50Moderate correlationp < 0.05 requiredWorth further analysis
0.50–0.70High correlationp < 0.01 recommendedMeaningful
0.70–0.90Very high correlationp < 0.01Strong theoretical support
>0.90Near perfect correlationp < 0.01Typically, same construct
Source: Akoglu, H., 2018; Reprinted from ref. [84].
Table 3. Mediation Analysis Guidelines.
Effect Size (β)StrengthSignificance (CI/p-Value)Academic Implication
<0.05NegligibleCI includes 0/p > 0.05No evidence of mediation
0.05–0.10SmallCI excludes 0/p < 0.05Weak mediation
0.10–0.25ModerateCI excludes 0/p < 0.01Meaningful mediation
0.25–0.40LargeCI excludes 0/p < 0.01Strong mediation
>0.40Very largeCI excludes 0/p < 0.001Robust theoretical support
Source: Fritz & MacKinnon, 2007; Preacher & Hayes, 2008; Reprinted from ref. [86,87].
Table 4. Social Demographic Composition of the Study Area.
BeijingTianjinShanghai
Distribution of Respondents105156189
ItemsPercentage (%)
Gender:
Male48.0047.0048.00
Female52.0053.0052.00
Marital status:
Single21.0015.0020.00
Married79.0085.0080.00
Age:
Under 3429.0022.0023.00
35–5438.0045.0049.00
Over 5533.0033.0028.00
Occupation:
Public sector/Company23.0022.0022.00
Private Company/Individual66.0067.0063.00
Unemployed11.0011.0015.00
Highest educational level:
Under Secondary School29.0033.0031.00
Academy & Bachelor67.0059.0063.00
Master & Ph.D.5.008.006.00
Monthly Salary (RMB):
Under 500055.0068.0065.00
5001–15,00037.0028.0030.00
Over 15,0018.004.005.00
Table 5. Descriptive Statistics of Indicators for Consumer Awareness, IES Providers’ Capabilities, and Consumer Satisfaction.
SectionCategoryItems (I)N
Total
Missing
Value
MedianMinMax
Consumer
Awareness
CEDI1: Conventional energy pollutes environment4500415
I2: Conventional energy reserves are limited4500415
I3: Conventional energy is unsustainable4500415
I4: Conventional energy generates greenhouse gases4500415
I5: Conventional energy causes global warming4500415
IESAI1: IES include renewable energy4500415
I2: IES conserve energy4500415
I3: IES reduce reliance on conventional energy4500315
I4: IES reduce greenhouse gas emissions4500415
I5: IES reduce air pollution4500415
I6: IES include domestic energy supply4500415
I7: IES enhance environmental quality4500415
I8: IES drive growth in renewable energy4500415
I9: There are incentive policies for IES4500415
IES
Provider’s
capabilities
PADI1: Strong IES abilities4500415
I2: IES design includes consumers’ input4500415
I3: IES provide reliable energy supply4500415
I4: IES provide secure energy supply4500415
I5: IES provide variety of energy forms4500415
OAMI1: Price list for IES4500415
I2: IES operation guidelines4500415
I3: IES maintenance guidelines4500415
I4: IES energy-saving measures4500415
I5: IES 24-h energy operation4500415
I6: IES 24-h energy usage tracking4500415
SPEI1: IES energy usage billings4500415
I2: IES notification on service interruptions4500415
I3: IES system update4500415
I4: IES consultation on energy usage4500415
I5: IES consumer feedback channels4500415
I6: IES environmentally friendly practices4500415
Consumer
Satisfaction
SEFI1: Replying with feedback in timely manner4500315
I2: Communicating with consumers friendly4500315
I3: Communicating with consumers in advance4500315
I4: Solving all energy issues within a short time4500315
I5: Solving energy problems attentively4500315
SQUI1: Collect all consumers’ feedback in various ways4500315
I2: Staffs are well-trained in resolving issues4500315
I3: Effective consulting services4500315
I4: Stable energy supply4500315
SAPI1: Clear and attractive system client interface4500315
I2: Consumer service system is easy to use4500315
I3: The price list is reasonable4500315
I4: Service guidelines are easily found4500315
I5: Service guidelines are visually pleasing4500315
I6: Service guidelines are easy to understand4500315
Indicator: N: Number; CED: Conventional Energy Disadvantages; IESA: IES Advantages; PAD: Planning and design; OAM: Operation and Maintenance; SPE: Service Performance; SEF: Service Efficiency; SQU: Service Quality; SAP: System and Price.
Table 6. Spearman’s Rank-Order Correlation Among Key Indicators Across Study Areas.
Beijing
CEDIESAPADOAMSPESEFSQUSAP
CED10.649 **0.531 **0.399 **0.396 **0.226 *0.324 **0.159
IESA 10.423 *0.233 *0.338 **0.1580.196 *0.138
PAD 10.656 **0.741 **0.0840.251 *0.045
OAM 10.584 **0.1200.237 *0.069
SPE 10.1830.306 *0.123
SEF 10.641 **0.706 **
SQU 10.612 **
SAP 1
Tianjin
CEDIESAPADOAMSPESEFSQUSAP
CED10.571 **0.230 **0.1240.192 *0.240 **0.178 *0.185 *
IESA 10.268 **0.1520.242 **0.240 **0.248 **0.269 **
PAD 10.725 **0.637 **0.1300.1510.077
OAM 10.630 **0.0840.1530.029
SPE 10.0690.1210.127
SEF 10.733 **0.850 **
SQU 10.733 **
SAP 1
Shanghai
CEDIESAPADOAMSPESEFSQUSAP
CED10.601 **0.244 **0.349 **0.362 **0.291 **0.229 **0.296 **
IESA 10.143 *0.226 **0.237 **0.287 **0.310 **0.289 **
PAD 10.529 **0.597 **0.1090.0830.176 *
OAM 10.578 **0.0560.0710.070
SPE 10.0880.0840.112
SEF 10.737 **0.811 **
SQU 10.631 **
SAP 1
Indicator: CED: Conventional Energy Disadvantages; IESA: IES Advantages; PAD: Planning and design; OAM: Operation and Maintenance; SPE: Service Performance; SEF: Service Efficiency; SQU: Service Quality; SAP: System and Price; **. Correlation is significant at the 0.01 level (2-tailed); *. Correlation is significant at the 0.05 level (2-tailed).
Table 7. Mediation analysis results for pathway 1 across three cities.
CitiesIndirect EffectDirect Effect
EffectLLCIULCIEffectSEp
Beijing0.29180.17090.42530.52980.08200.0000
Tianjin0.40590.28900.54080.38940.07880.0000
Shanghai0.18510.08660.29850.45690.07120.0000
Table 8. Mediation analysis results for pathway 2 across three cities.
CitiesIndirect EffectDirect Effect
EffectLLCIULCIEffectSEp
Beijing0.23130.05660.42580.53140.09280.0000
Tianjin0.18190.07870.29950.69540.06190.0000
Shanghai0.26300.16450.38300.60400.05110.0000
Disclaimer/Publisher’s Note: The statements, opinions and data contained in all publications are solely those of the individual author(s) and contributor(s) and not of MDPI and/or the editor(s). MDPI and/or the editor(s) disclaim responsibility for any injury to people or property resulting from any ideas, methods, instructions or products referred to in the content.