1. Introduction
Urban vibrancy is one of the key concepts of the functioning and quality of life in cities. It refers to the intensity of social, economic, and cultural life in urban space, as well as to the ways in which this space is used by residents and city users at different times of the day and week. The concept originates from classical urban studies, particularly the observations of Jacobs [
1], who emphasized that a “vibrant” city is one characterized by a diversity of functions, users, and activities that together create a safe, attractive, and interactive street environment.
Nowadays, urban vibrancy is analyzed in a multidimensional framework, most often encompassing four main aspects: social, economic, cultural, and environmental [
2,
3]. All of these dimensions collectively contribute to the overall vitality and attractiveness of urban environments, shaping how cities function, evolve, and are perceived by their inhabitants. Understanding these dimensions allows researchers and planners to assess the liveliness of a city within its relevant social, economic, cultural, and environmental contexts and to identify areas where interventions can enhance urban quality of life. In this sense, urban vibrancy serves not only as an analytical framework but also as a guiding concept for creating more inclusive, resilient, and sustainable cities.
The economic dimension is associated with commercial and service activity, as well as local entrepreneurship, which form the basis of urban dynamics. It encompasses the density and diversity of firms and services; the presence of vibrant retail, hospitality and professional–service sectors; and the capacity of local entrepreneurship ecosystems to generate jobs, innovation and economic resilience. Urban areas that support a broad mix of commercial uses and foster business start-ups tend to exhibit greater economic vibrancy, as these activities stimulate foot-traffic, increase street-level engagement and attract further investment [
4].
The social dimension refers to the intensity of interpersonal interactions and the level of social integration and trust. It reflects the extent to which urban spaces foster encounters between diverse groups of people, support community cohesion, and encourage a sense of belonging and safety. Recent studies emphasize that social vibrancy depends not only on population density, but also on the diversity and quality of social mixing occurring in public spaces, which shapes everyday experiences and perceptions of inclusivity within the city [
5]. Vibrant social environments are therefore characterized by active street life, inclusive public spaces, and opportunities for spontaneous interaction among residents and visitors. Together, these elements contribute to the perception of liveliness and social well-being within urban areas.
The cultural dimension includes the diversity and accessibility of events, institutions and cultural venues that enrich urban life. It encompasses not just the presence of museums, theatres, festivals and galleries, but also the ease with which different social groups can participate in cultural practices, the integration of cultural infrastructure into everyday urban fabric, and the capacity of these cultural assets to foster a shared sense of identity, creativity and innovation. Research shows that cultural vibrancy and cultural dynamics in urban planning are increasingly acknowledged as key components of city vitality, influencing social engagement, public space use and long-term urban development trajectories [
6]. In cities where cultural infrastructure is both physically accessible and socially inclusive, public spaces become hubs of interaction, creative expression and continuity—thereby amplifying the perceived liveliness and attractiveness of the urban environment.
The environmental dimension concerns the quality and accessibility of public spaces and urban greenery, as well as conditions conducive to walking and recreation. It emphasizes the importance of designing urban environments that promote physical activity, mental well-being, and ecological sustainability. Well-connected green networks, pedestrian-friendly streets, and environmentally conscious planning practices contribute to enhancing both the livability and resilience of cities. Recent studies have shown that access to green and open spaces positively influences social interaction, health outcomes, and residents’ attachment to place [
7]. From the perspective of urban policy and spatial planning, the environmental dimension therefore represents a key component in building sustainable and resilient urban fabric that supports residents’ well-being and fosters the creation of attractive, healthy, and inclusive living environments.
In the context of infrastructure investments, the analysis of urban vibrancy serves as an important tool for assessing the impact of new developments on the functioning of urban spaces. It helps to determine the extent to which the development of transport, public spaces, or residential areas contributes to the social and economic activation of the city. Transport infrastructure, and in particular subway networks, plays a pivotal role in shaping this vibrancy. In European capitals, where historical urban fabrics coexist with rapid socio-economic transformation, new metro lines function not only as mobility instruments but also as catalysts of spatial and social change.
Empirical evidence from other contexts demonstrates that proximity to metro infrastructure can reshape property markets and local economies, although the direction and magnitude of such effects vary considerably. Metro stations, through their architecture, integration with surrounding spaces, and role as intermodal hubs, can act as anchors of vibrancy, fostering encounters, commerce, and symbolic identity. They not only facilitate mobility but also create new nodes of interaction and adaptation, where urban communities renegotiate their relationship with space and change. This approach should be associated with the Transit-Oriented Development strategy (TOD). Drawing inspiration from classic urban planning concepts such as the Garden City and the Linear City, the TOD idea promotes shaping the urban structure around transport hubs that serve as focal points of social and spatial activity, restoring public transit to a central role in the organization of the city [
8]. According to the principles of the TOD concept, well-designed transport hubs not only enhance mobility but also generate intense urban activity and support the development of sustainable, vibrant neighborhoods [
9,
10,
11]. Empirical studies indicate that areas surrounding metro stations with high-quality public spaces and diverse functions are characterized by higher numbers of users, greater economic activity, and stronger social ties [
12]. These findings highlight the crucial role of metro station areas as catalysts for sustainable urban vitality and community cohesion in contemporary cities.
The development of analytical tools and spatial data (including mobile phone data, geolocation information, and social media platforms) has enabled the quantitative measurement of urban vibrancy in real time [
13,
14]. This allows researchers to examine the relationships between urban infrastructure and actual patterns of city use. For instance, authors of the reference article [
15] apply a random forest classification model to survey data collected in Chengdu, China, to estimate the probability that passengers select a given metro station based on the characteristics of its surrounding built environment. Their analysis provides a robust framework for modelling passengers’ destination preferences in relation to station-area attributes. In a related study [
16], the authors investigate how built environment features influence urban vibrancy around metro stations in Wuhan, with particular emphasis on their nonlinear and synergistic interactions with public transport accessibility. Employing Gradient Boosting Decision Trees (GBDT) and SHAP (Shapley Additive Explanations), the authors integrate multiple data sources—including metro ridership, smartphone-based location records, and social media check-ins—covering 210 station catchment areas and various times of day. Their findings indicate that vibrancy is most strongly associated with leisure amenities, floor area ratio, commercial intensity, and enterprise density, while the influence of public transport accessibility depends on its interplay with these factors. For instance, multimodal accessibility amplifies vibrancy, particularly in leisure-oriented contexts, whereas high-density development exerts a stronger effect in commercial zones. While authors of the first example article [
15] primarily focus on passengers’ destination preferences, Peng et al. [
16] extend this perspective by revealing the spatiotemporal dynamics of population activity around metro stations using real-time smartphone data. Complementing these approaches, Wei Tu et al. [
17] examine how metro-induced vibrancy is conditioned by the built environment in Shenzhen, Singapore, and London, employing spatial statistical methods to identify the most influential determinants. Further expanding the analytical scope, Liu et al. [
18] explore how the vitality of urban form—expressed through pedestrian activity—is related to the economic vitality of small commercial sectors, particularly catering and leisure businesses. The authors find that mixed-use commercial environments with diverse business types (life, finance, leisure, and services) generate stronger and more continuous pedestrian flows, indicating greater urban vitality and supporting the economic performance of small enterprises. Using multisource big data, including POIs (points of interest) and travel heat maps, their study combines kernel density analysis, multiple linear regression, and multinomial logistic regression to identify commercial centers, model pedestrian movement, and assess how the diversity of business types (measured via the Hill numbers diversity index) affects vitality. The methodology links the spatial distribution of commercial forms with real-time pedestrian flow patterns, showing that diversity and integration of small-scale businesses—such as cafés, restaurants, and leisure venues—significantly enhance daytime and all-day urban liveliness. These findings highlight the synergy between the pedestrian usability of urban spaces and the economic activity of small catering enterprises.
Nevertheless, the above contributions predominantly focus on existing urban systems and often lack a clearly defined causal relationship between observed factors and outcomes. The present study aims to address this gap by applying a quasi-experimental causal inference framework to better establish the direction and magnitude of causal links between the built environment, transportation systems, and urban vibrancy. By linking spatial transformation with infrastructural policy, it contributes to ongoing debates on how transport systems shape and reflect the vitality of European metropolitan regions.
Research hypothesis: The development of the metro system influences urban vibrancy, generating both short-term disruptions and long-term transformations in neighborhood dynamics. Specifically, the study examines the economic and social aspects of urban vibrancy, measured through the intensity of local service activity (the number of Small Catering Businesses—SCB) and its temporal variation in relation to infrastructural factors such as building density, the proportion of parking areas, and the presence of small-scale urban elements (benches, playgrounds). Such an operationalization of urban vibrancy enables the quantitative assessment of local economic and social activity changes in response to infrastructural intervention, thus allowing for the analysis of both short-term adaptive effects and long-term spatial and social transformation trends in the vicinity of new metro stations.
2. Context of M2 Warsaw Underground Line Development
Warsaw provides a particularly compelling case. Since the systemic transformation of the 1990s, the city has experienced rapid metropolization characterized by uneven development, planning challenges, and delays in infrastructure delivery [
19,
20]. While globalization and foreign investment have strengthened Warsaw’s regional position, the metro remains one of the few integrative projects with a long-term influence on the city’s spatial and functional structure. Yet, as Wesołowska [
21] observes, large-scale infrastructural interventions often provoke local resistance, revealing persistent tensions between metropolitan benefits and neighborhood concerns. The second metro line (M2) in Warsaw is among the most consequential urban transport investments in post-socialist Central Europe. The first line (M1), opened in 1995, established a north–south spine for rapid transit. As the capital’s economy expanded in the 2000s, suburbanization and rising car ownership exposed the limits of a single-line network and placed growing pressure on the transport system.
The corridor of Warsaw Metro Line M2 traverses areas of considerable historical, social, and spatial diversity, linking the densely built-up central districts with residential and post-industrial zones on both sides of the Vistula River. In the western section, the line serves territories with a well-established urban structure and high population density, whereas the eastern extension crosses areas undergoing dynamic transformation and revitalization. Along the M2 route, a clear functional diversity can be observed—from office and service centers in the city core to residential, educational, and recreational areas in the peripheral districts. The potential for spatial and social “catalysis” of the M2 line thus derives from its passage through zones that differ in development intensity, renewal capacity, and degree of integration within the broader urban fabric.
The 7 km central segment with seven stations opened in March 2015, followed by staged extensions to the east and west financed largely through European Union Cohesion Policy funds. These phases strengthened M2’s role in rebalancing development across the river. Beyond performance in moving people, city leaders used the project to signal Warsaw’s ambition to align with other European capitals that pursue integrated, high-capacity transit systems.
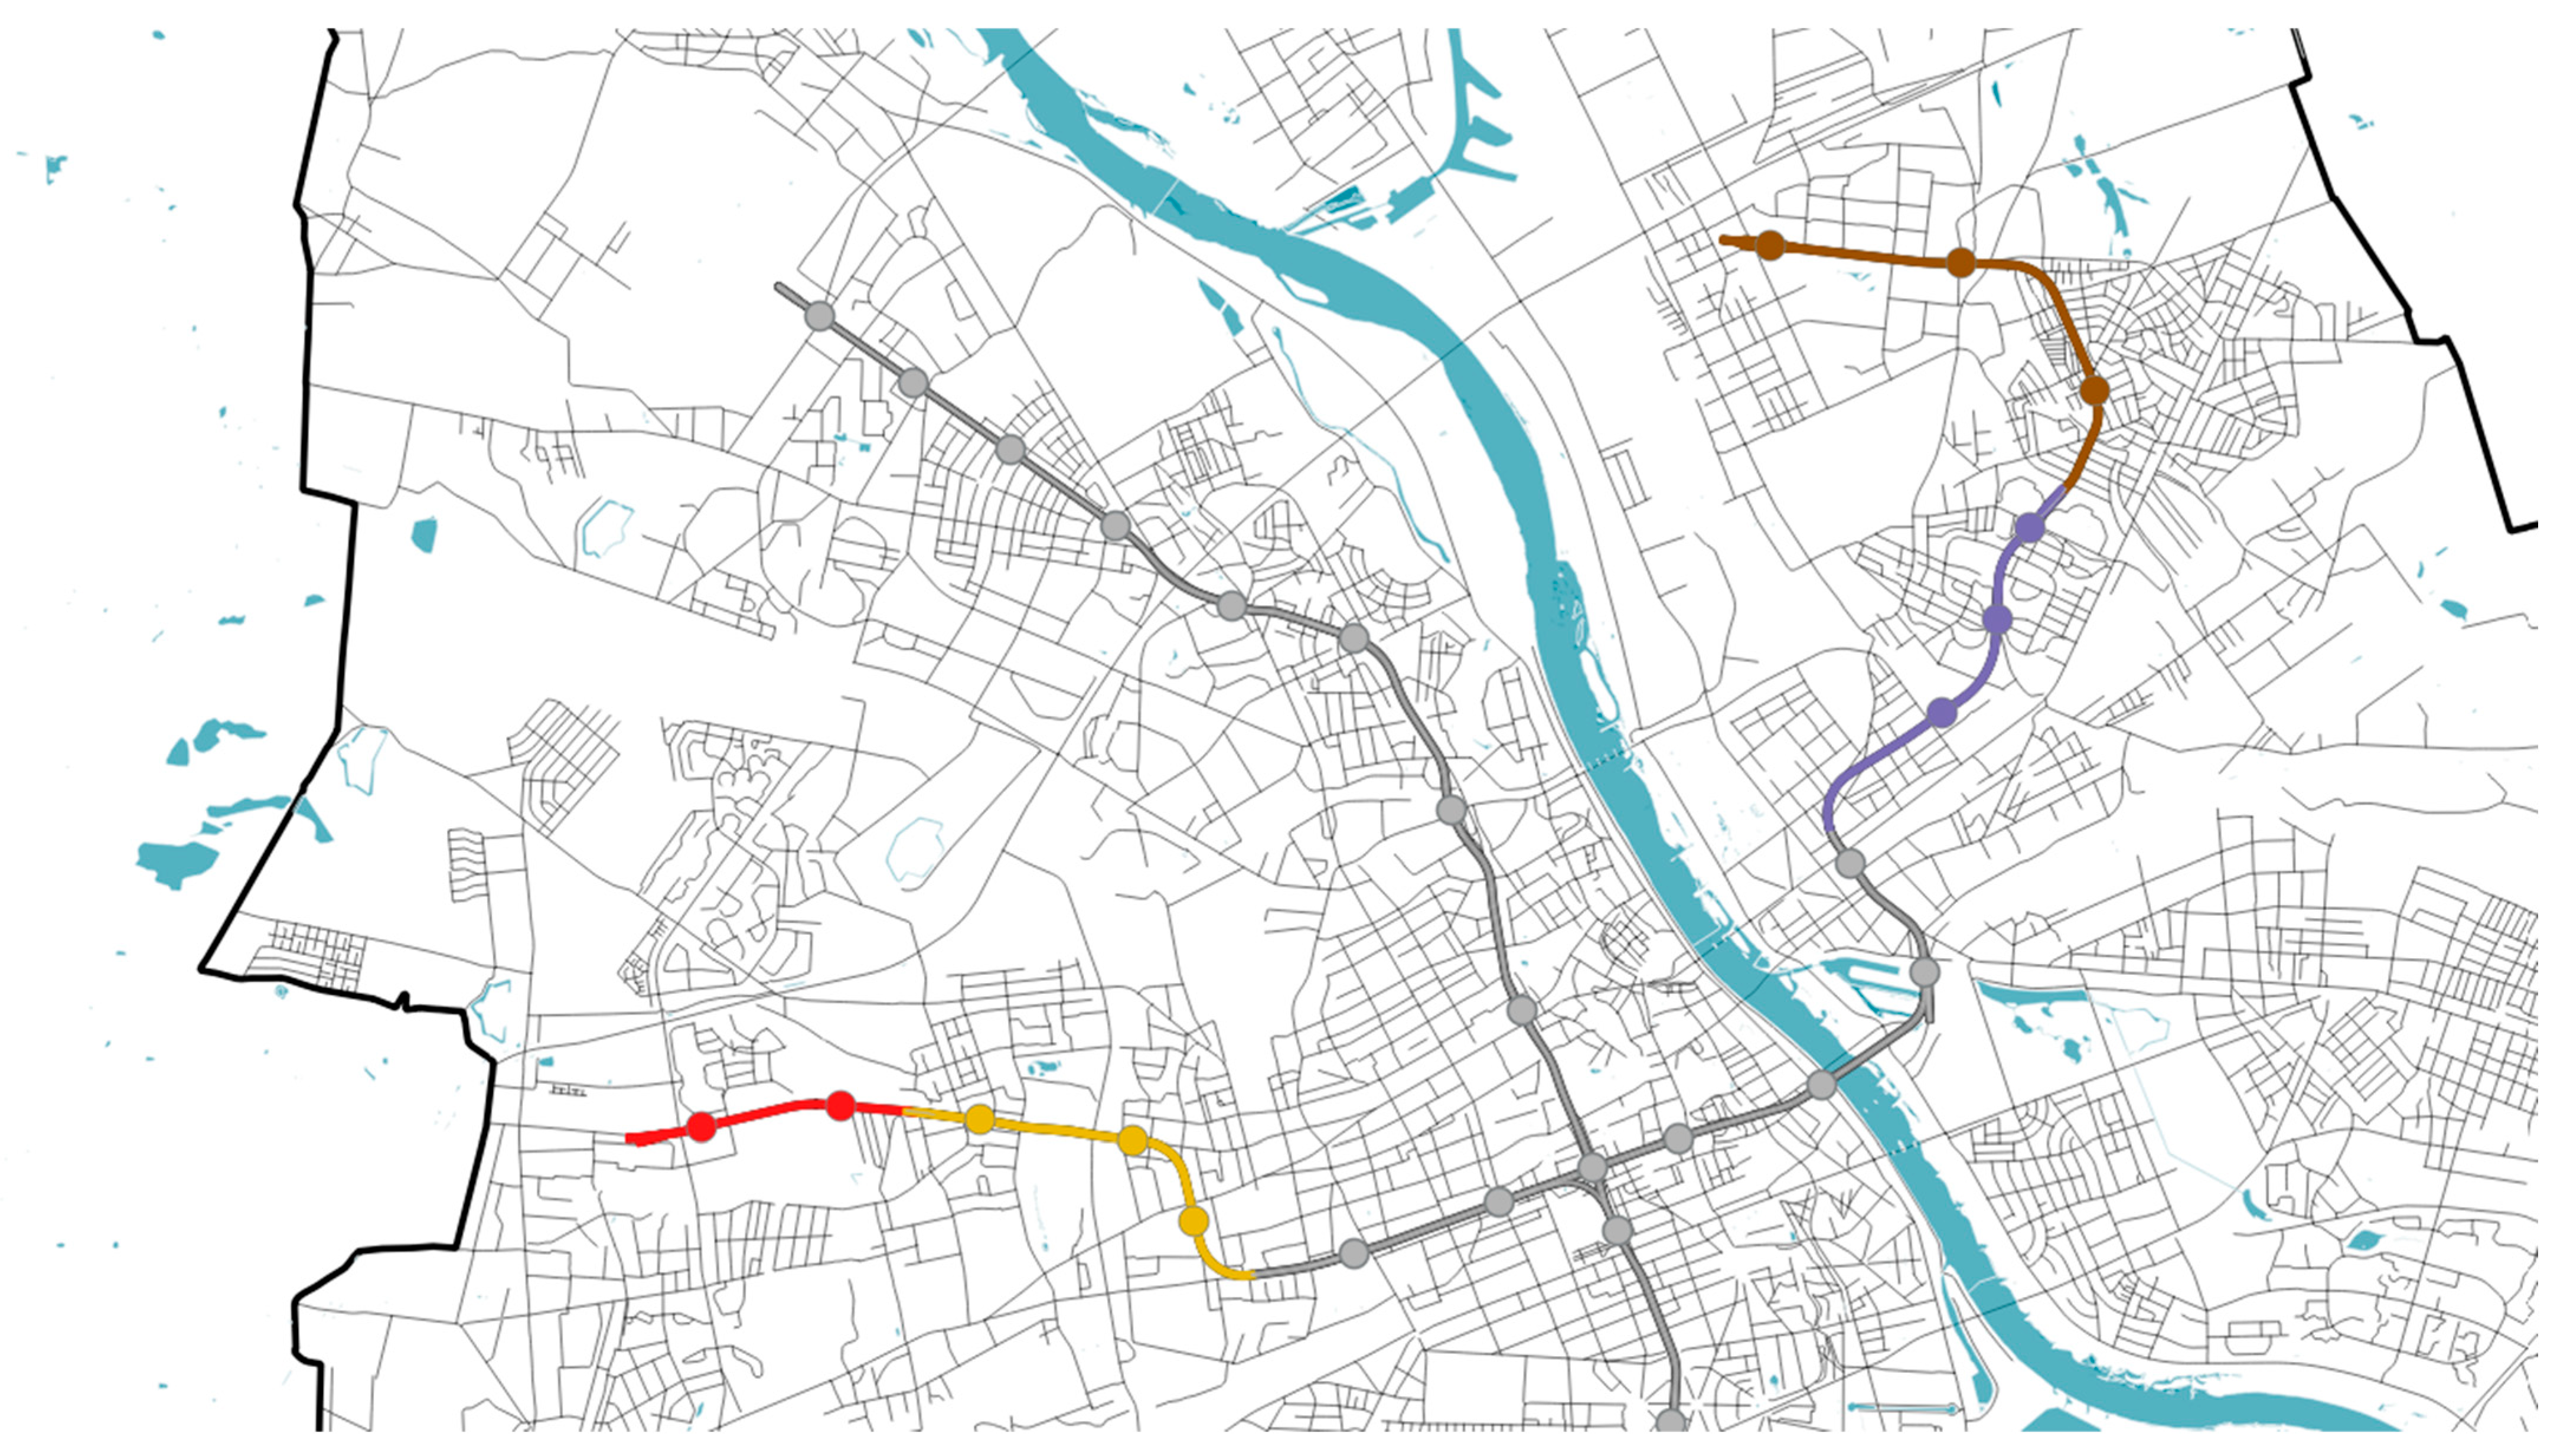
Table 1 presents the chronology of the openings of the second metro line stations. Planning for M2 was embedded in long-term mobility and spatial strategies. The line was intended to curb congestion and emissions by shifting trips from private cars to public transport, while supporting urban regeneration and social integration—particularly in the Praga districts, where new accessibility was expected to raise investment attractiveness, stimulate real-estate development, and bolster cultural and social activity. The metro stations of Line 2 have also become cultural landmarks for Warsaw residents and visitors alike. A notable example is the Kondratowicza station, which houses “Metroteka”–a public library in the Targówek district. Moreover, various art installations and temporary exhibitions are regularly held at other M2 stations, further enhancing their role as spaces of public engagement and creativity. M2 is therefore both infrastructure and urban policy. Its rollout offers a clear test case for examining how new metro stations redistribute urban activity and “vibrancy” in a European capital still navigating post-socialist restructuring, rapid globalization, and persistent socio-spatial disparities.
Table 1.
The chronology of the opening of the underground stations.
Table 1.
The chronology of the opening of the underground stations.
| No | Station | Opening Date | Metro Line Section | Colour on Figure 1 |
|---|
| 1 | Szwedzka | 15 September 2019 | Eastern 1 | Purple |
| 2 | Targówek Mieszkaniowy | 15 September 2019 |
| 3 | Trocka | 15 September 2019 |
| 4 | Zacisze | 28 September 2022 | Eastern 2 | Brown |
| 5 | Kondratowicza | 28 September 2022 |
| 6 | Bródno | 28 September 2022 |
| 7 | Księcia Janusza | 4 April 2020 | Western 1 | Yellow |
| 8 | Płocka | 4 April 2020 |
| 9 | Młynów | 4 April 2020 |
| 10 | Ułrychów | 30 July 2022 | Western 2 | Red |
| 11 | Bemowo | 30 July 2022 |
Figure 1.
The scope of the research, in the context of the Warsaw underground. The bold grey lines indicate the first metro line and the initial section of the second metro line. The purple bold line represents the first eastern extension section, the brown bold line represents the second eastern extension section, the yellow bold line represents the first western extension section, and the red bold line represents the second western extension section.
3. Methodology
The literature on statistical inference identifies a special class of models dedicated to policy evaluation, situated within the field of microeconometrics. These are commonly referred to as causal inference models and include methods such as Regression Discontinuity Design (RDD) [
22], Matching [
23], and Difference-in-Differences (DiD) [
24,
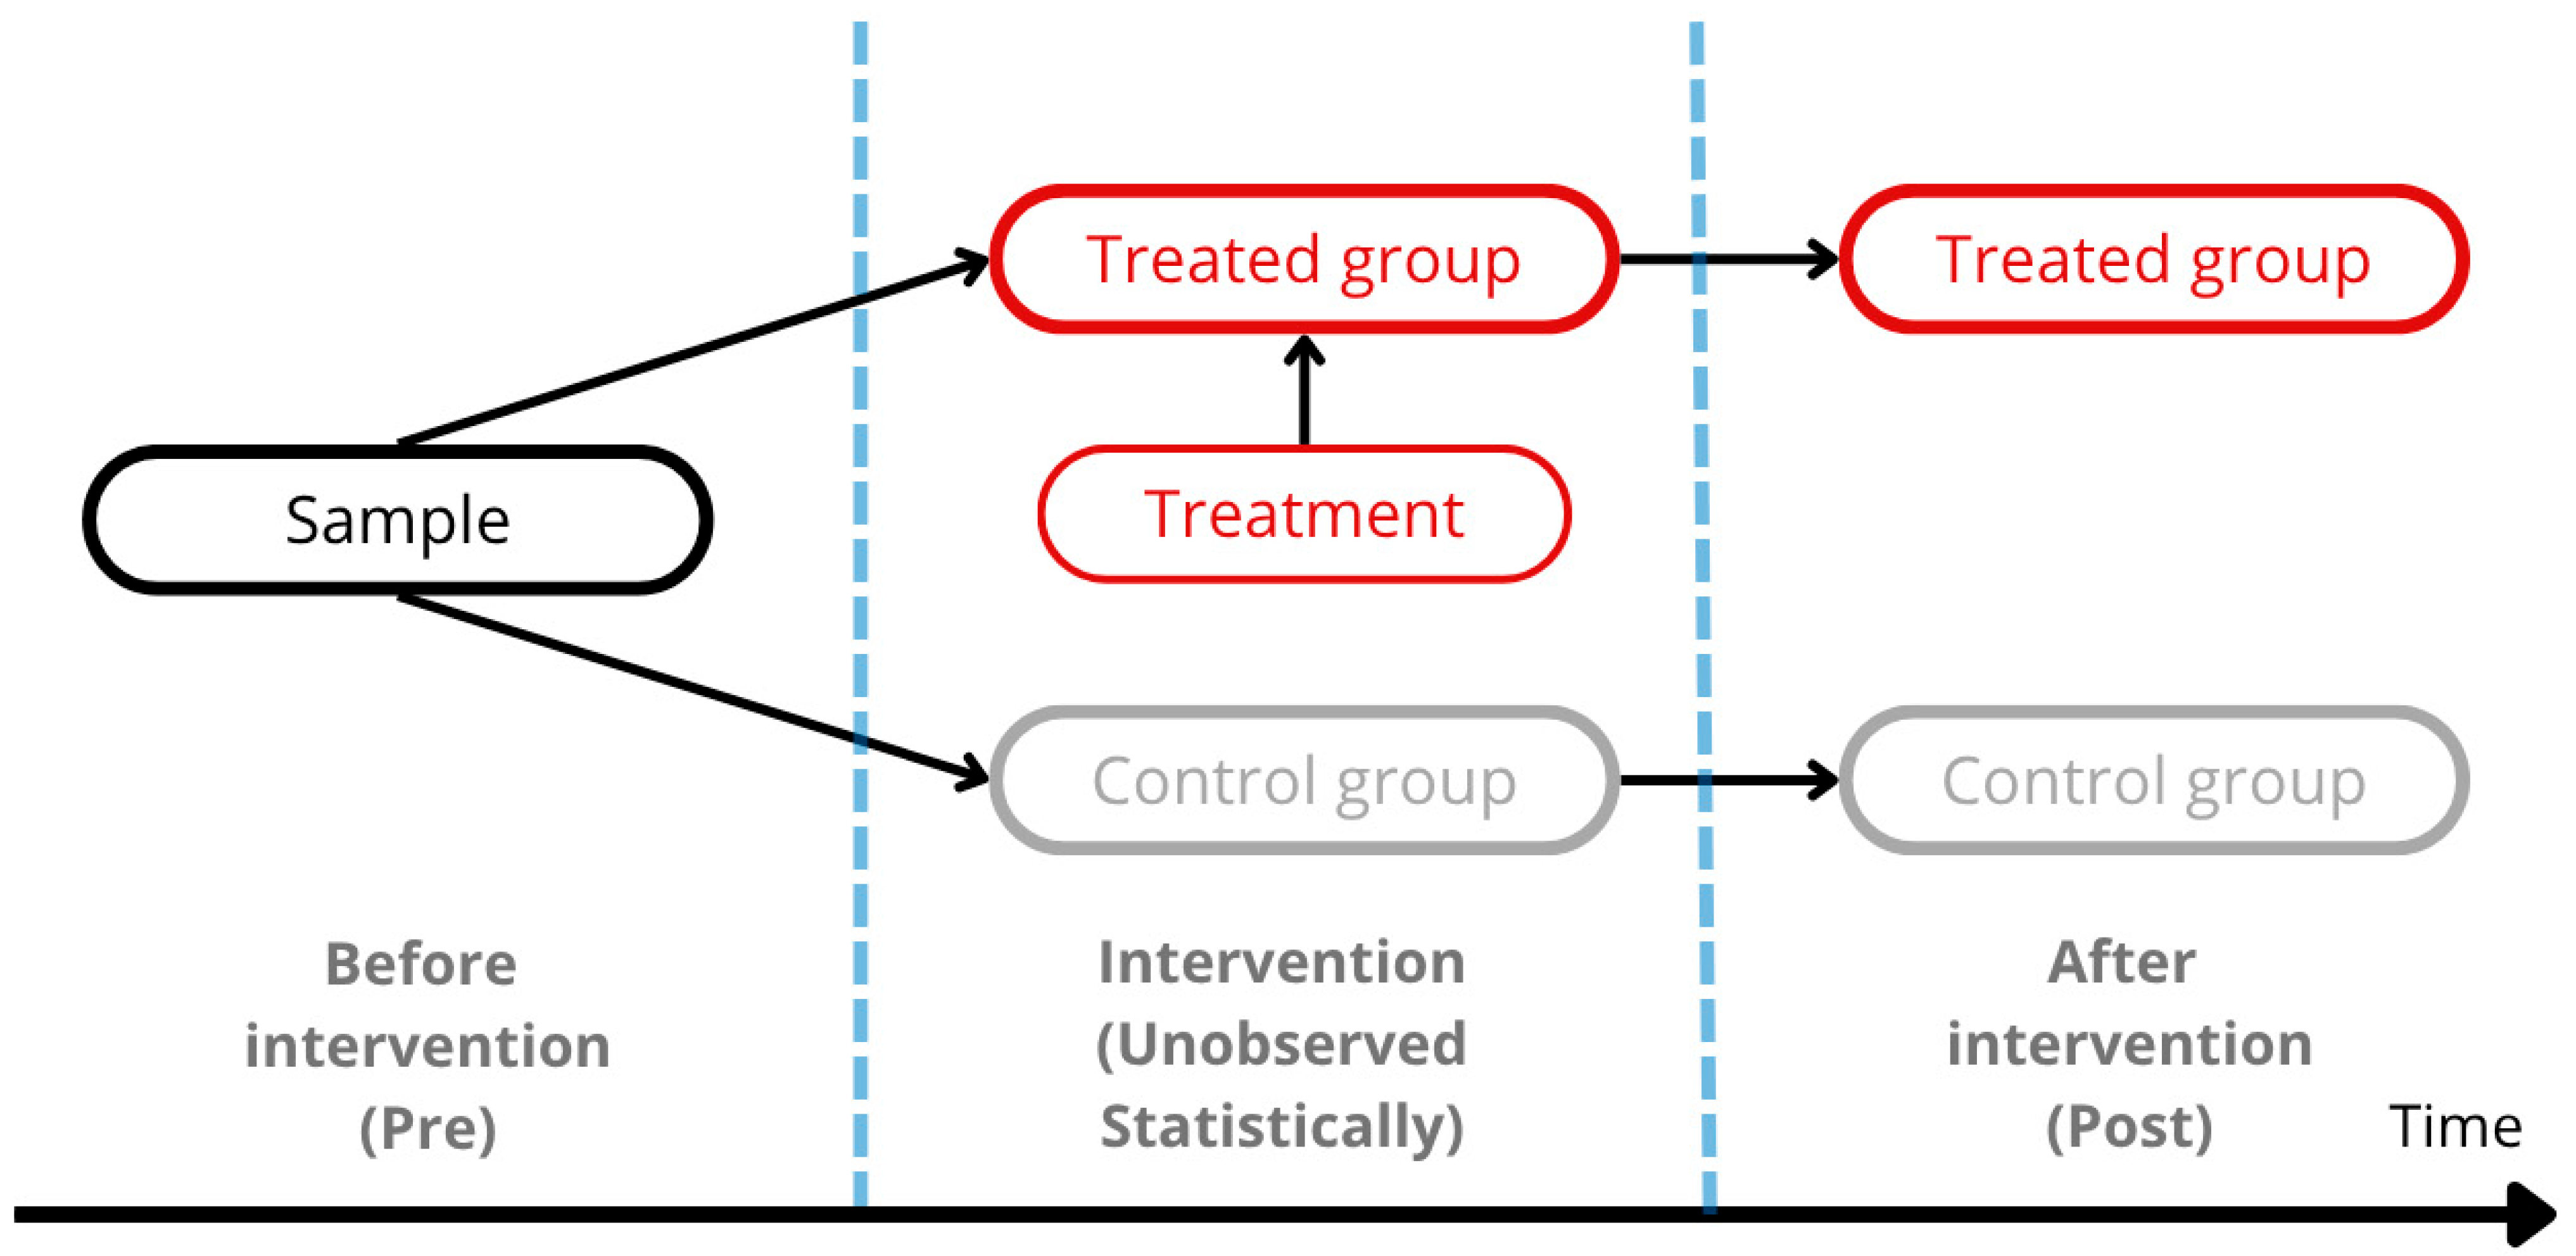
25]. The central principle underlying these models is the division of the sample into treated units (those exposed to an intervention) and control units (
Figure 2). These models typically operate on panel data with at least two time periods—pre- and post-intervention. This structure is necessary, as the treatment is assumed to occur in an unobserved period between these two.
The division into treatment and control groups is designed to address the issue of endogenous heterogeneity, which arises as a result of the intervention itself.
The goal of policy evaluation using statistical inference is to estimate the Average Treatment Effect on the Treated (ATT), and, where relevant heterogeneity is observed, the Conditional Average Treatment Effect on the Treated (CATT). ATT reflects the average effect of an intervention on the treated units, whereas CATT estimates this effect for a specific homogeneous subgroup.
All causal inference models must satisfy the Stable Unit Treatment Value Assumption (SUTVA), which includes two key conditions: (1) no interference between units, and (2) no hidden variations in treatment. The first condition implies that the treatment effect on one observation should not influence outcomes for other units. The second ensures that all relevant forms of the treatment are accounted for. Violation of the first leads to biased and inefficient estimates, while violation of the second precludes identification of the treatment effect due to uncontrolled treatment heterogeneity.
To satisfy SUTVA, the study must be well-designed, accounting for possible interactions between units (e.g., spatial spillovers) and all relevant forms of treatment.
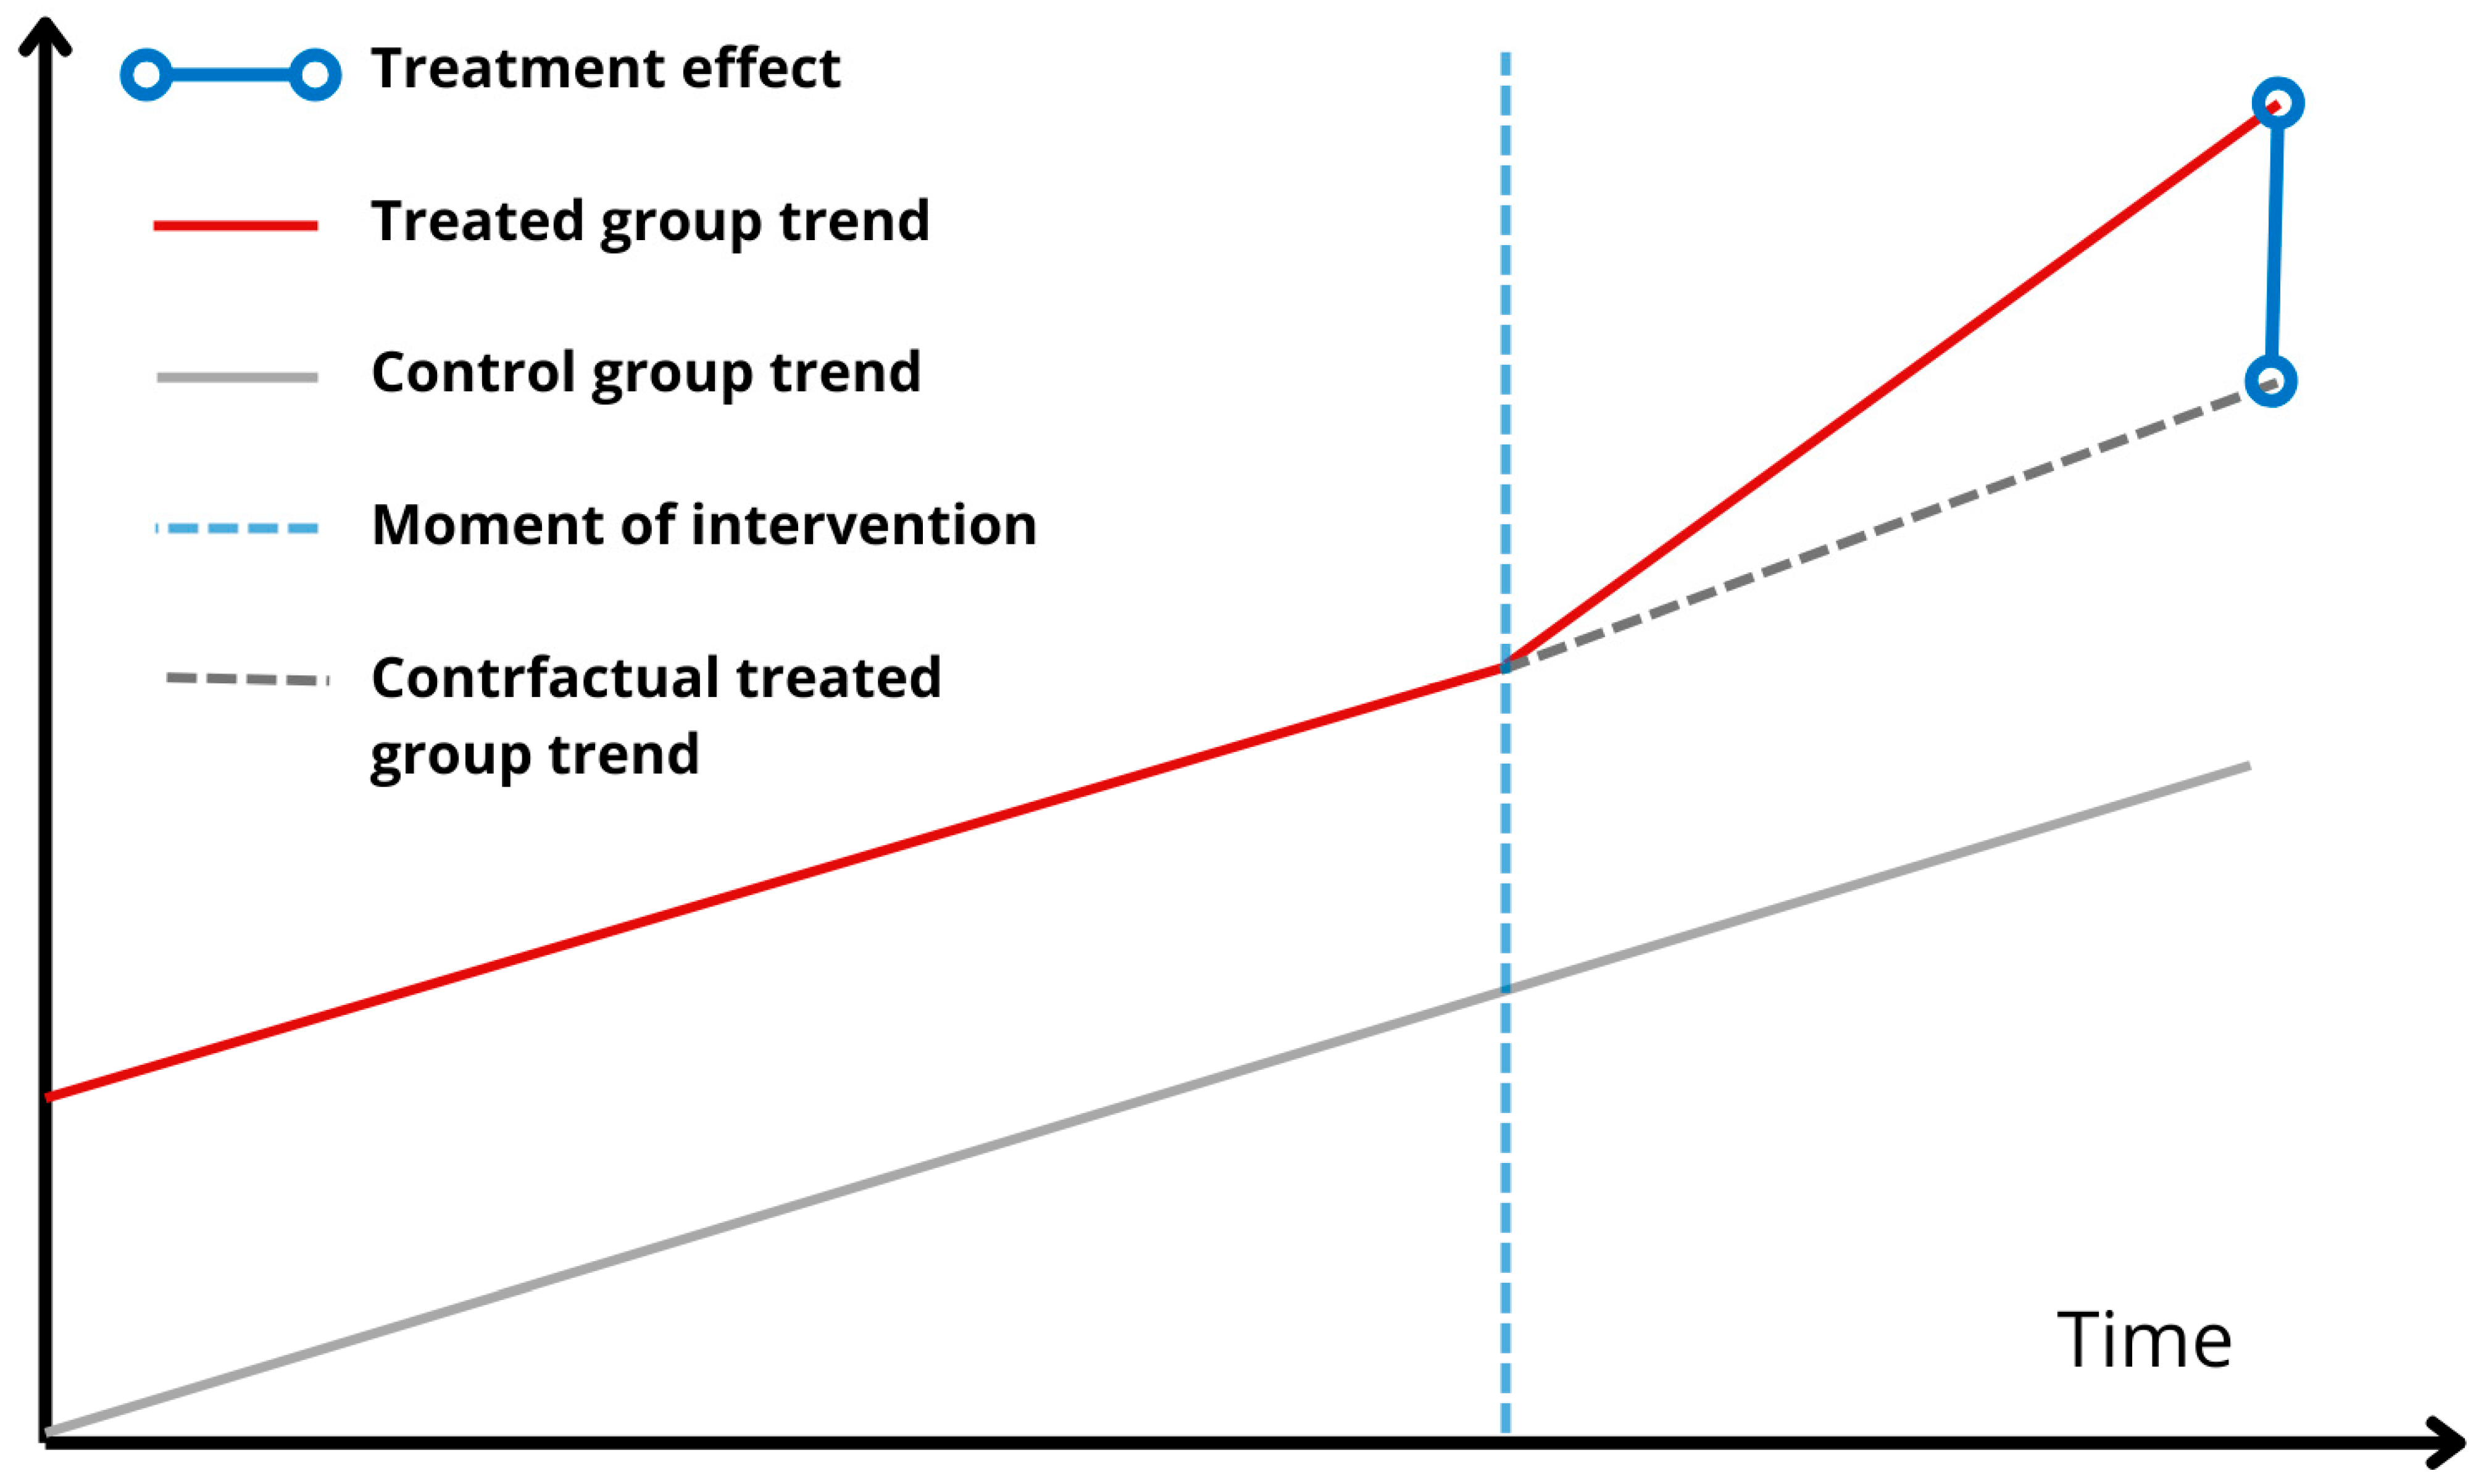
Among causal inference methods, the DiD approach is the most developed with respect to fulfilling SUTVA, as it incorporates aspects of both RDD and matching. DiD leverages control variables (as in matching) to account for observed heterogeneity and relies on the parallel trends assumption (similar to RDD), which strengthens the comparability between treatment and control groups and allows the ATT to be interpreted as the difference in trends (
Figure 3). Furthermore, unlike RDD and matching, which may require panel data but operate on single differences, DiD is a true panel method. This enables it to account for time and cross-sectional unobserved heterogeneity, making it the preferred choice in this study.
To address unobserved time and cross-sectional heterogeneity in panel DiD models, the two-way fixed effects (TWFE) model is commonly used [
26,
27]. TWFE models can be estimated either directly or via a two-stage approach [
28,
29]. However, the first component of SUTVA imposes additional restrictions in spatial policy evaluation due to spatial treatment spillovers. This has become a frontier area in econometric research [
30,
31,
32,
33,
34].
In this study, we simplify spatial treatment mapping by assuming a 15 min proximity threshold [
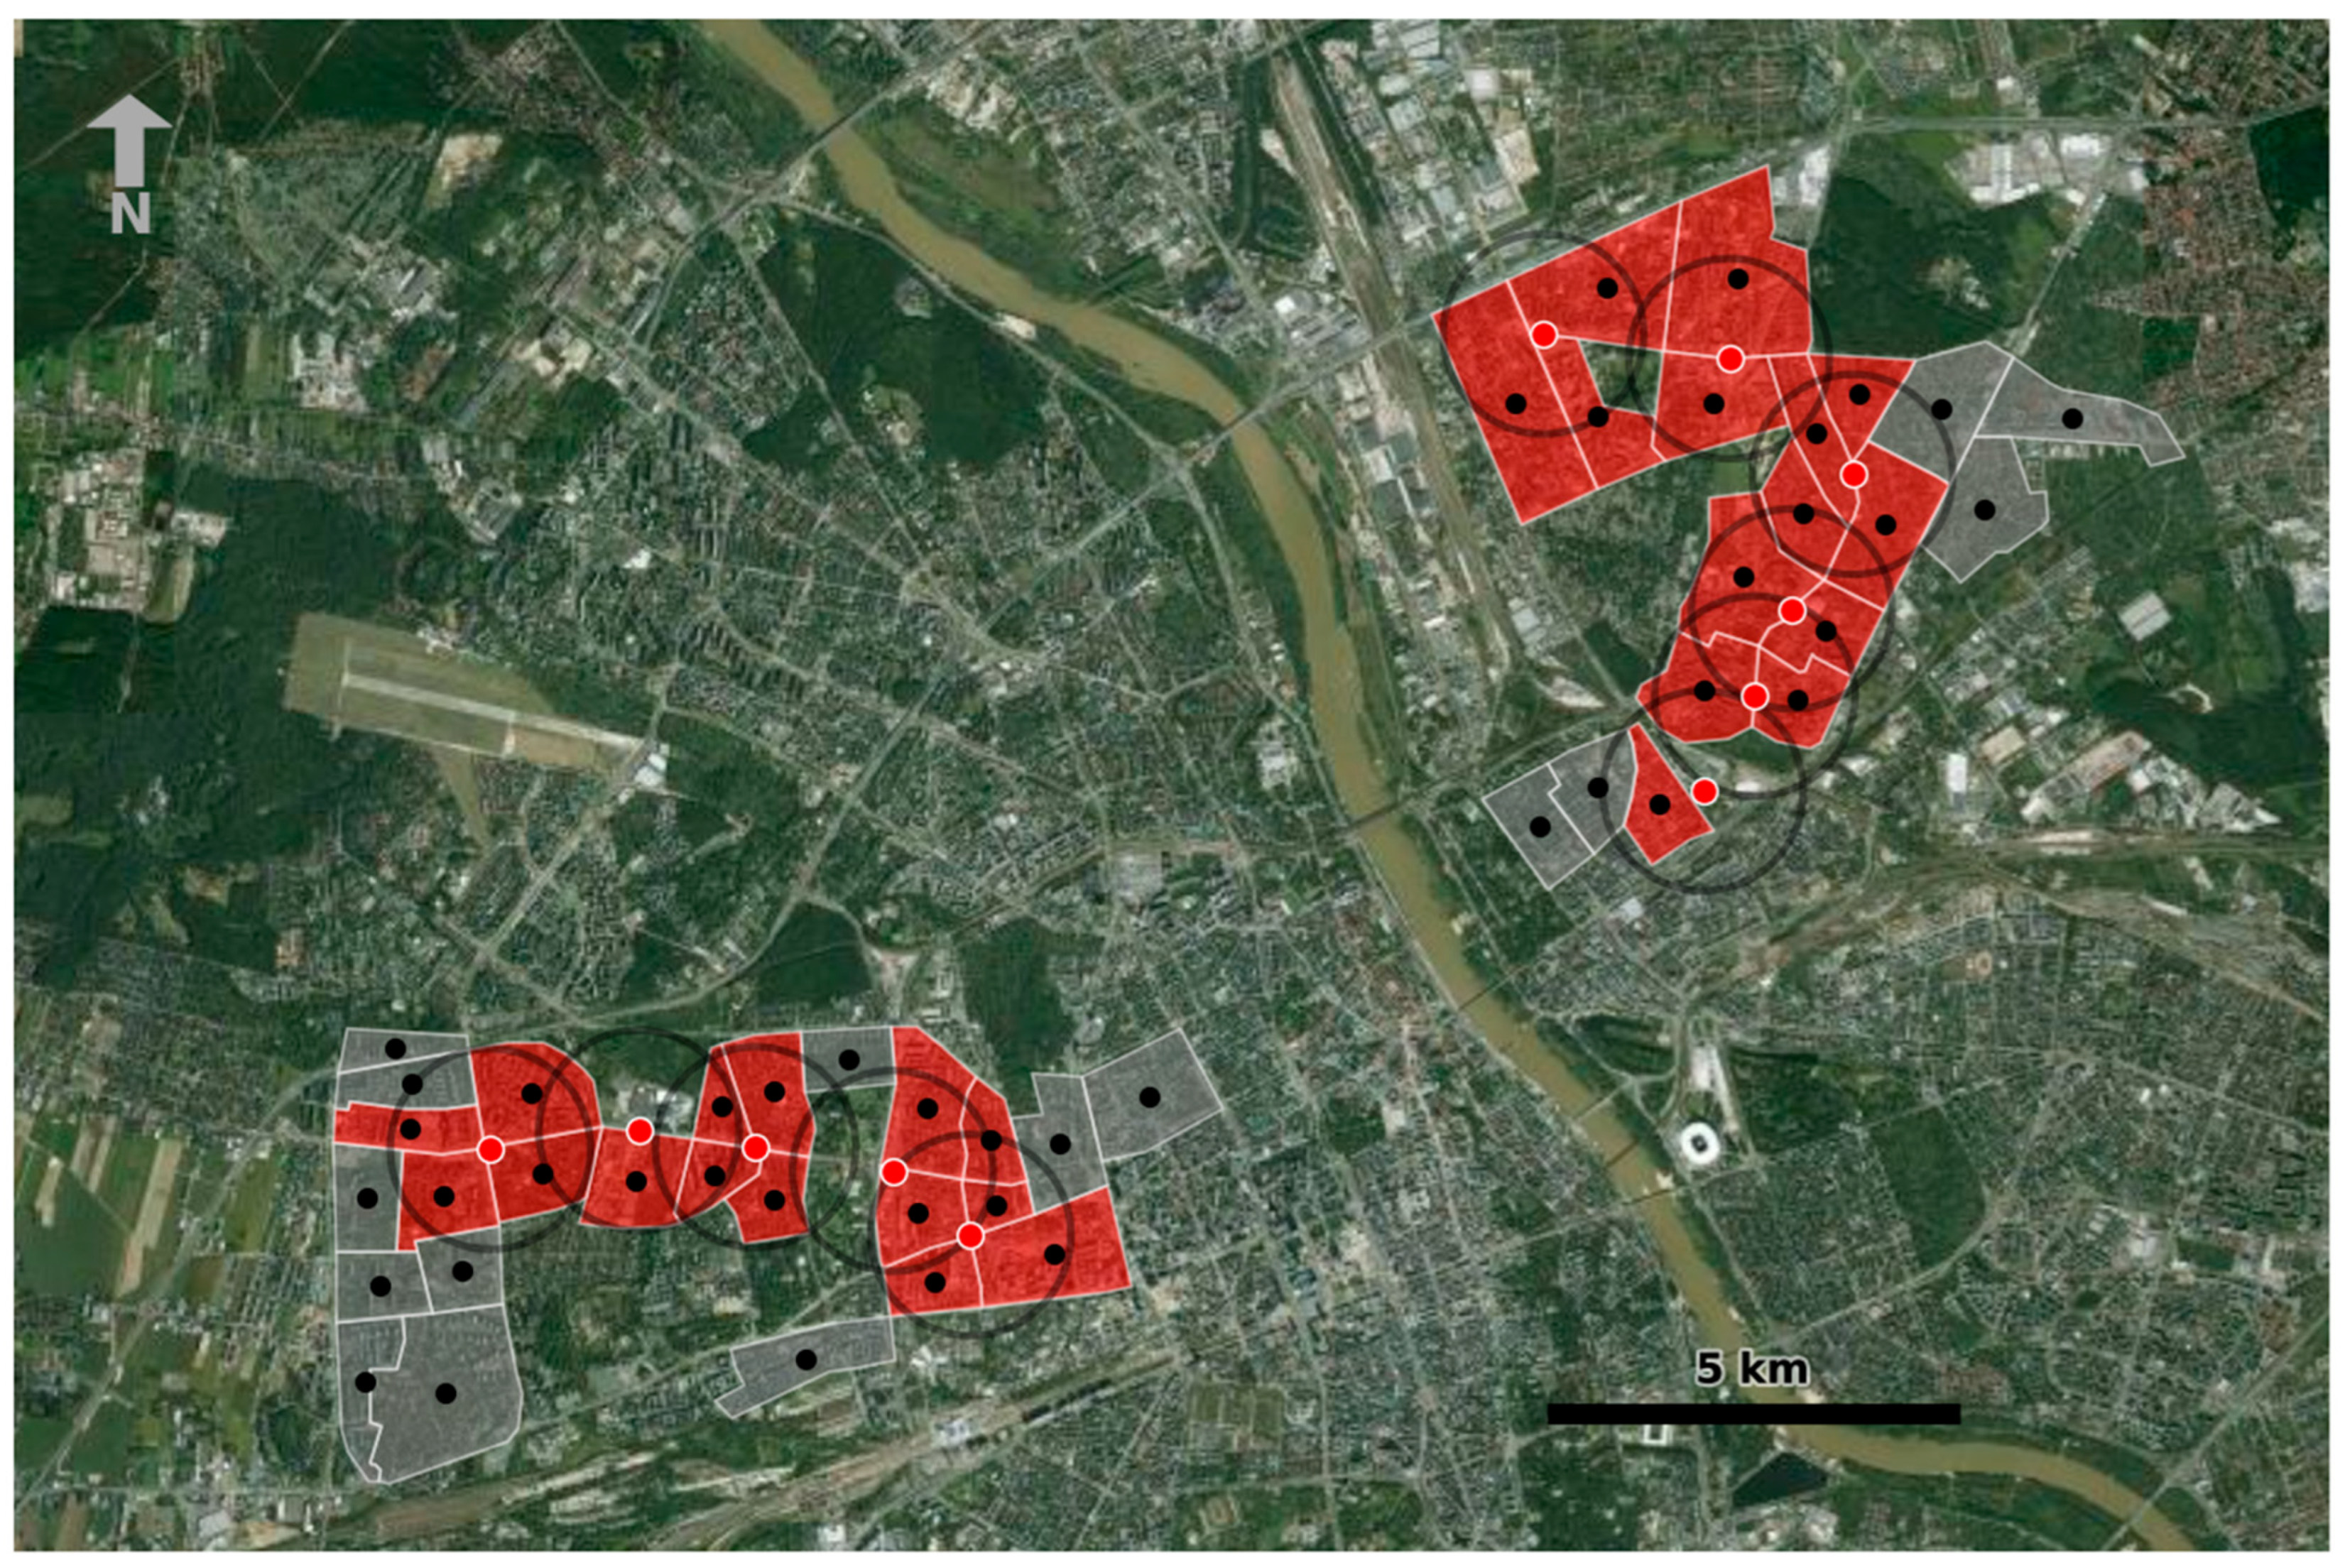
35]. Our hypothesis is that metro-related urban vibrancy effects occur only within neighbourhoods located within a 15 min walking distance. Therefore, a neighbourhood is considered treated if its centroid falls within 700 m (Euclidean) or 1000 m (Manhattan) of a new metro station. We further assume that the number of metro stations within this area does not influence treatment intensity—individuals simply choose the nearest one—thus eliminating hidden treatment variation.
The final sample includes treated units (centroids within distance rings) and control units (located near treated areas but outside the defined distance). The spatial distribution is shown in
Figure 4.
To improve model clarity, we apply a two-stage DiD framework. In the first stage, urban vibrancy is regressed on control variables (e.g., building footprint, parking area) using a two-way fixed effects model. The residuals—net of control effects—are then regressed on the binary treatment indicator. The final layout of the model is presented below:
where:
—dependent variable,
—the adjusted outcome from the first stage DiD,
β—the estimates for the control variables,
—control variables,
δ—the treatment effect,
—the treatment interaction term,
—time fixed effects,
—cross-sectional fixed effects,
—time fixed effects estimated from the first stage,
—cross-sectional fixed effects estimated from the first stage,
—error term in the first stage,
—error term in the second stage
We rely on the historical OpenStreetMap data on Points of Interest, which allow us to map both the economic and cultural dimensions of urban vibrancy. To this end, it is important to note that the Difference-in-Differences model employed in this study rests not only on the Stable Unit Treatment Value Assumption (SUTVA) but also requires the fulfillment of the parallel trends assumption. A critical implication of the latter is the requirement that no unobserved confounders simultaneously influence both treatment assignment and the outcome trajectory. Accordingly, although cultural vibrancy—defined as the density of cultural entities—could potentially serve as a proxy for the vitality of urban form, its use as a dependent variable might violate the parallel trends assumption. This is because both the decision to open new metro stations and the establishment of new cultural entities (e.g., monuments, fountains) are typically outcomes of urban development and planning policies implemented by local authorities. In such cases, the local policy framework constitutes a systematic confounder, undermining the identification of causal effects. For this reason, our analysis focuses on economic vibrancy, which primarily emerges from market-driven processes and is only indirectly constrained by local regulations—specifically, by spatial guidelines defining the areas where Small Commercial Businesses (SCBs) may operate.
4. Data
Our dataset is structured into three categories: (1) the outcome variable, (2) the treatment variable, and (3) control variables. Each required a distinct collection method and descriptive analysis. The panel covers four years: 2019, 2021, 2022, and 2023.
In this study, we operationalize the definition of urban vibrancy proposed by Fu et al. [
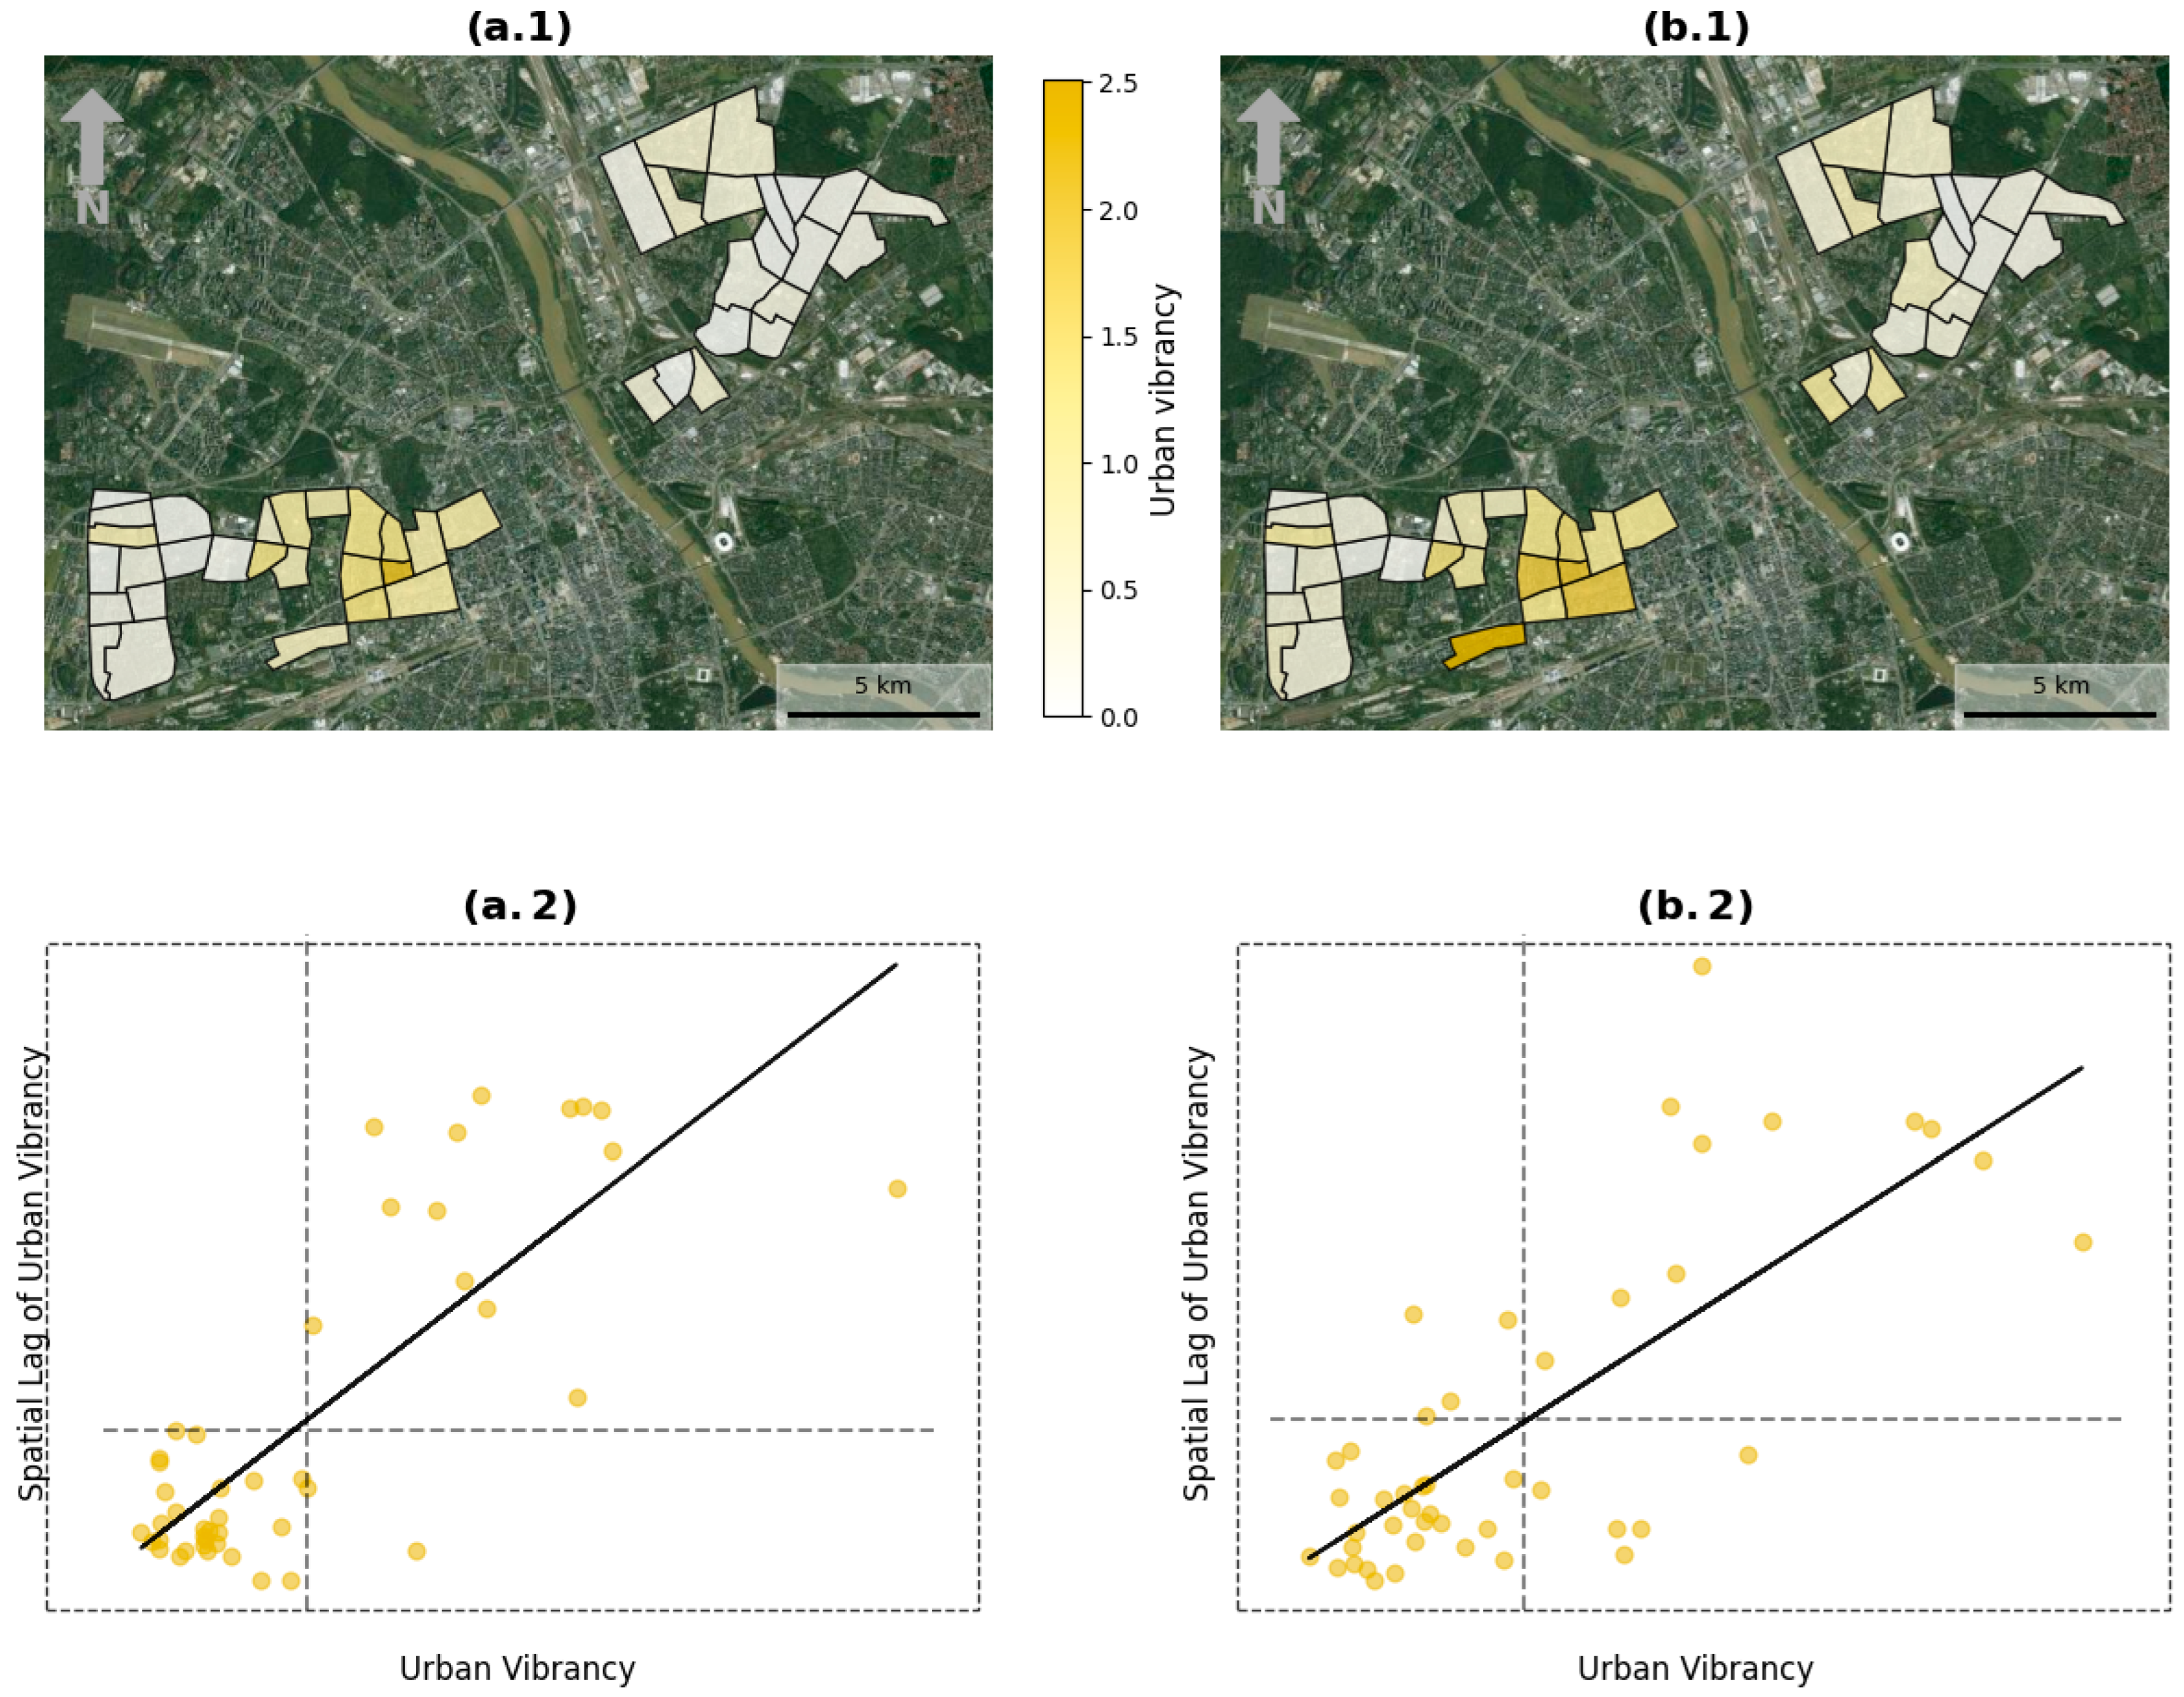
36] through the presence of Small Catering Businesses (SCBs). Urban vibrancy is measured as the number of SCB Points of Interest (PoIs) derived from historical OpenStreetMap data, aggregated by neighbourhood and year, and normalized per hectare (SCBs per 10,000 m
2). This variable exhibits strong spatial autocorrelation (Moran’s I = 0.77 in 2019 and 0.63 in 2023;
p < 0.0001, based on first-order queen contiguity). The spatial distribution of this variable, along with the corresponding Moran scatterplots, is presented in
Figure 5.
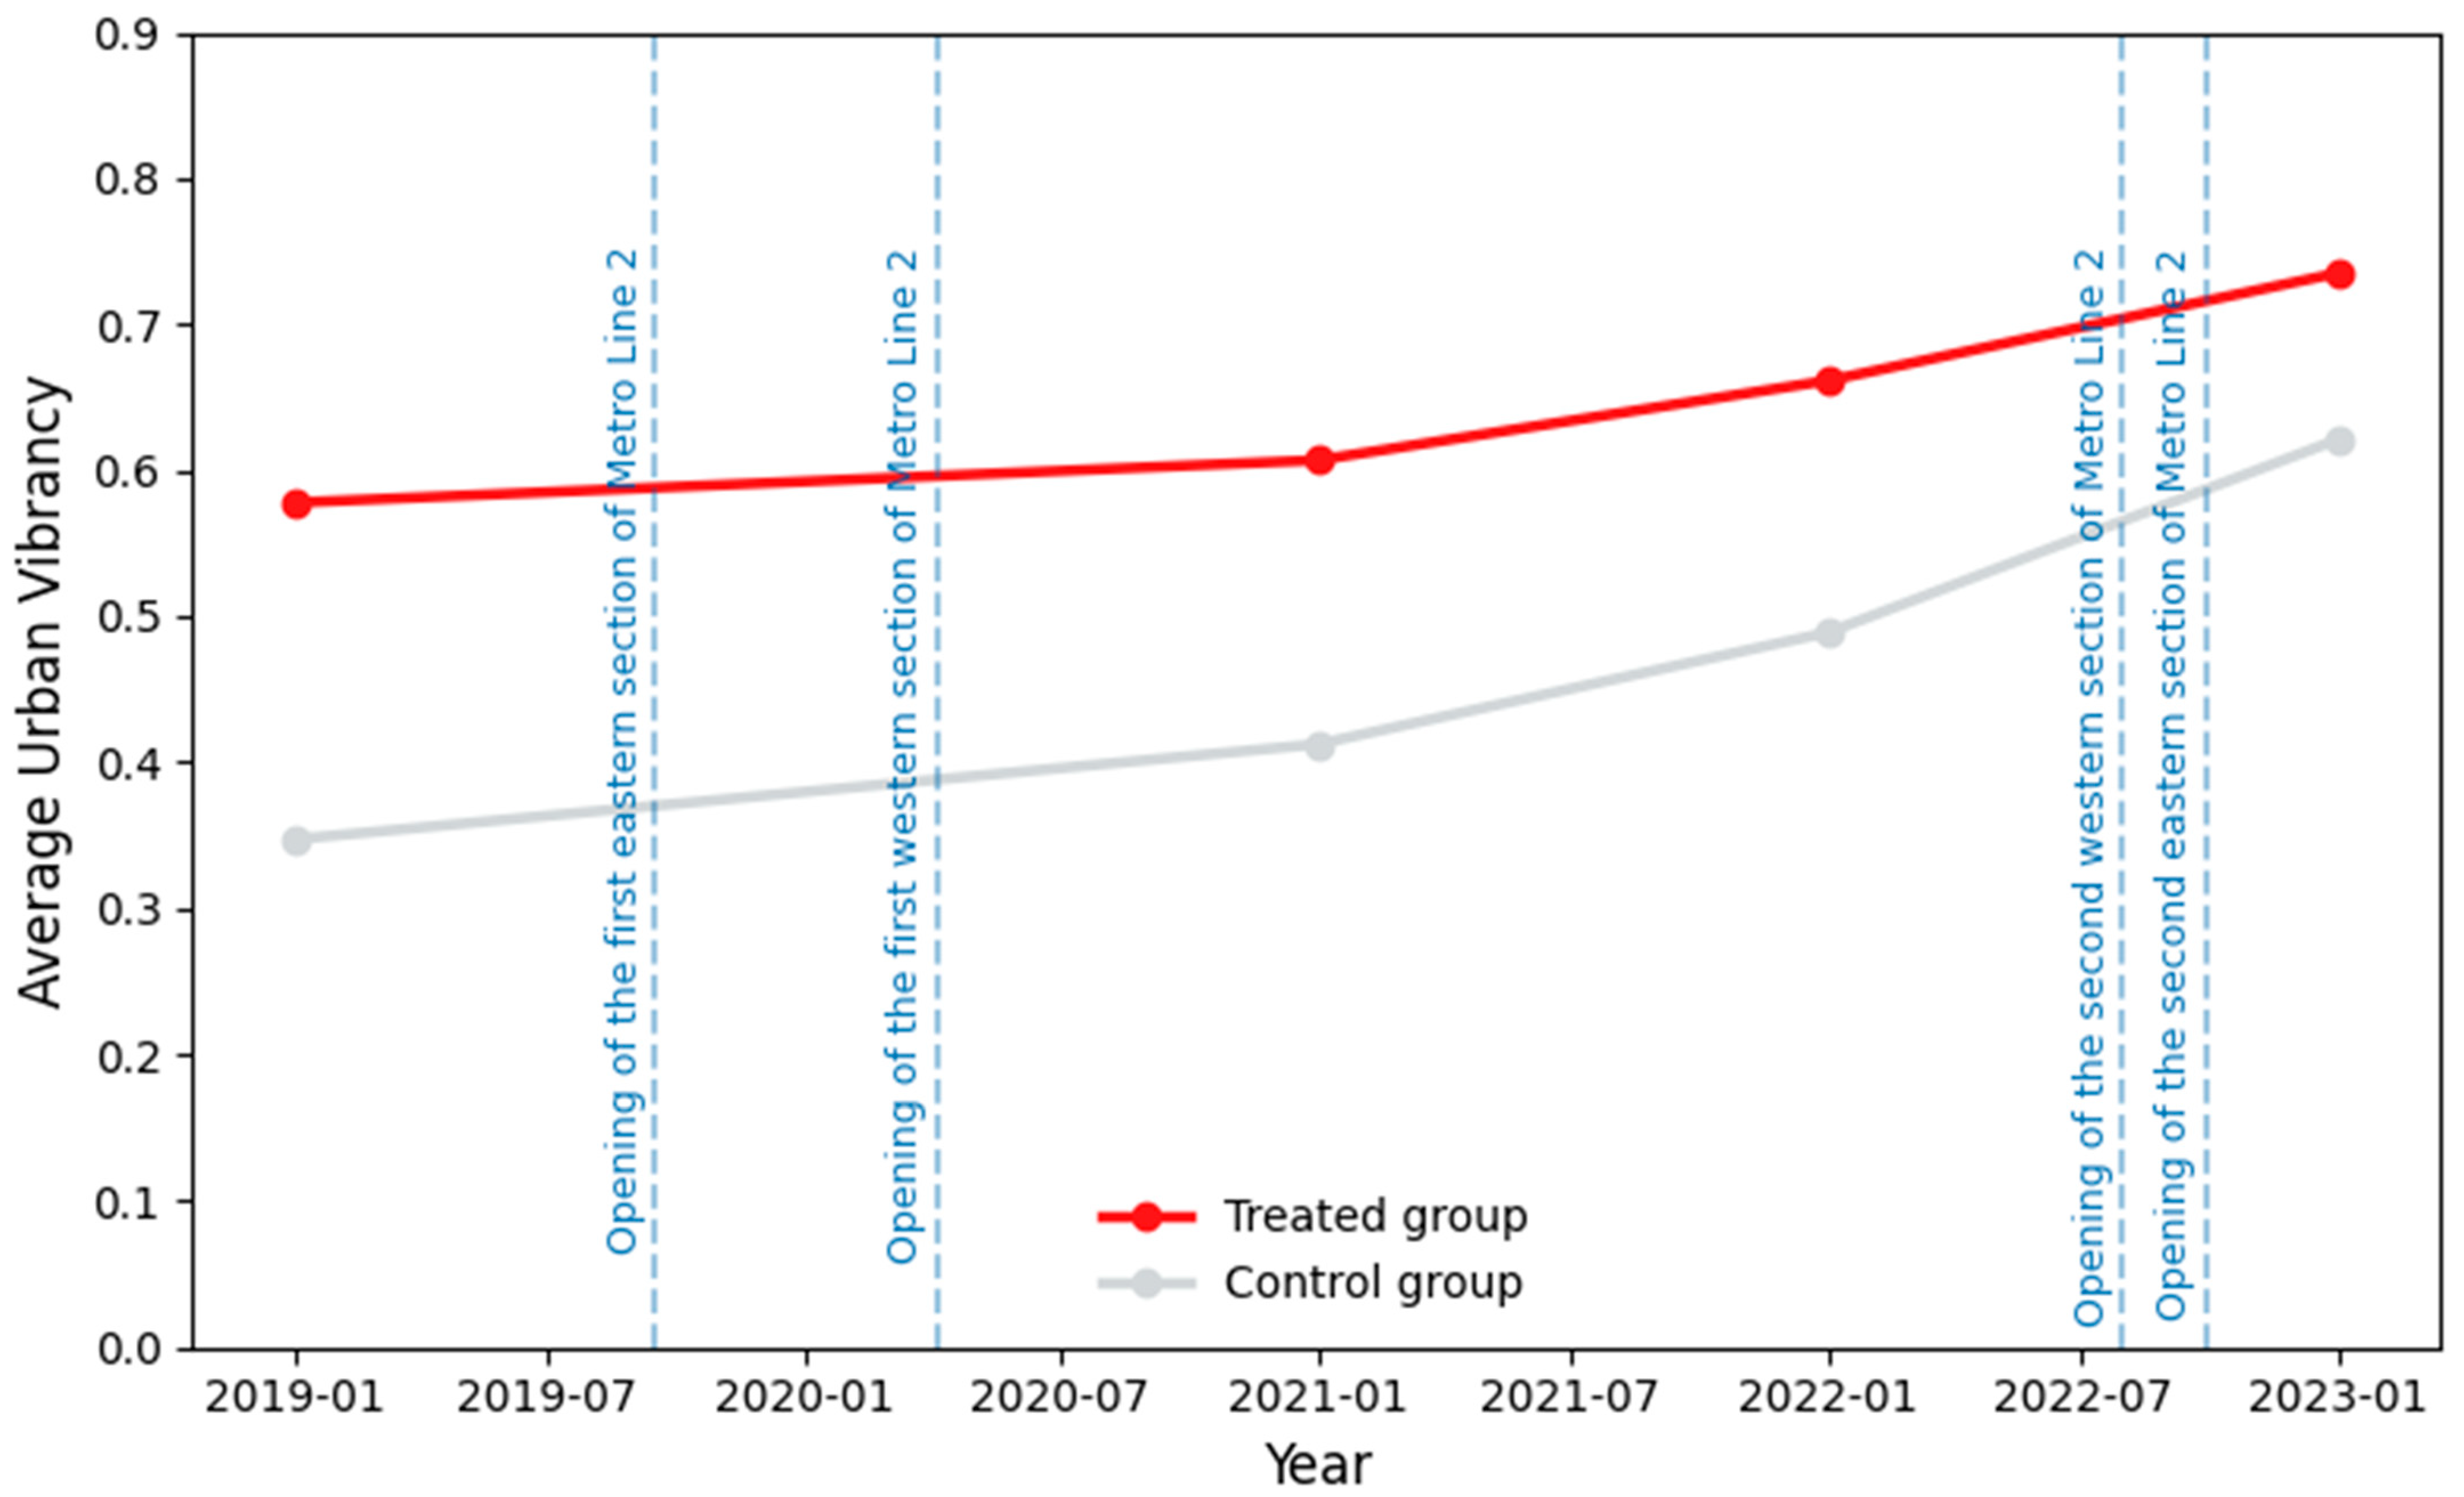
The treatment dummy combines two components: “ever treated” and “post-treatment”. A unit is “ever treated” if its centroid ever falls within the treatment buffer, regardless of time. The “post” dummy equals 1 only after the metro station is operational. Their interaction forms the treatment indicator. The trends of vibrancy in treated vs. control groups are shown in
Figure 6, revealing that vibrancy in control areas has been growing faster since 2020—the year new metro stations were introduced.
Control variables include: building footprint, parking surface area ratio, number of benches, and playgrounds—sourced from OpenStreetMap and aggregated by neighbourhood.
Table 2 summarizes the variables used in the analysis and their computational definitions. The variables EqBench and EqPlgrnd represent the number of benches and playgrounds located within each urban block. VibSCB captures the level of urban vibrancy, operationalized as the density of small catering businesses per 10,000 m2 of block area. CarPark and BldFtprnt denote the ratios of car park footprints and building footprints to the total block area, respectively. Finally, Post is a binary indicator variable distinguishing observations in the post-treatment period (1 = treated, 0 = non-treated).
On the other hand,
Figure 7 presents pairwise Pearson correlation coefficients among the main study variables. Urban vibrancy (VibSCB) is positively and significantly correlated with the ratio of building footprints (BldFtprnt,
r = 0.57,
p < 0.001) and with the availability of benches (EqBench,
r = 0.32,
p < 0.001) and car parks (CarPark,
r = 0.32,
p < 0.001), while its relationship with playgrounds (EqPlgrnd) is weakly negative (
r = –0.15,
p < 0.01). The control variables themselves exhibit only weak and mostly insignificant correlations (|
r| < 0.15), indicating the absence of multicollinearity among them. This suggests that the explanatory variables capture distinct spatial aspects of the urban environment while remaining individually relevant to the level of urban vibrancy.
5. Quantitative Modeling and Results
In the first stage, the two-way fixed effects DiD model was refined using best subset selection based on the statistical significance of control covariates. The resulting model is:
where:
—SCB-derived vibrancy (panel dimension),
—time fixed effects,
—cross-sectional fixed effects,
—the estimates for the control variables,
,
,
—the control variables (acc. to
Table 2),
—error term in the first stage
Residual analysis showed no spatial autocorrelation (Moran’s I = −0.06,
p = 0.84), and the residuals were normally distributed, supporting the OLS approach. The adjusted outcome was regressed on the treatment indicator in the second stage:
where:
—SCB-derived vibrancy (panel dimension),
—the adjusted outcome from the first stage DiD,
δ—the treatment effect,
—the treatment interaction term,
—time fixed effects estimated from the first stage,
—cross-sectional fixed effects estimated from the first stage,
—error term in the second stage
First-stage results (
Table 3) show that vibrancy is positively associated with building footprint, car parks, and benches. Specifically, a 10% increase in building footprint raises vibrancy by 0.59 SCB per hectare; a 10% increase in car park share corresponds to a 0.48 increase; and 1000 additional benches add 3.7 SCB per neighbourhood.
The second-stage analysis is divided into two parts: (1) the assessment of the time-invariant Average Treatment Effect on the Treated (ATT), and (2) the staggered ATT.
Table 4 reports the results of the time-invariant ATT estimation. As shown, the overall treatment effect is negative, indicating an average decrease of 0.33 points in urban vibrancy in the treated group compared to the control group. This finding aligns with the general trends observed for the treated and control groups (see
Figure 6), where the growth in vibrancy is slower for treated units than for control units.
One possible explanation is that residents living within 15 min’ walking distance from the newly opened metro stations may increasingly rely on the metro to access goods and services in the city centre, where vibrancy is already high. As a result, local vibrancy near the stations grows more slowly than in areas located further away.
This interpretation is further supported by the marginal significance of the first-year coefficient (p < 0.1), which suggests a lag in the adjustment process. That is, both residents and small local businesses may require time to adapt their habits and business models to the new mobility conditions.
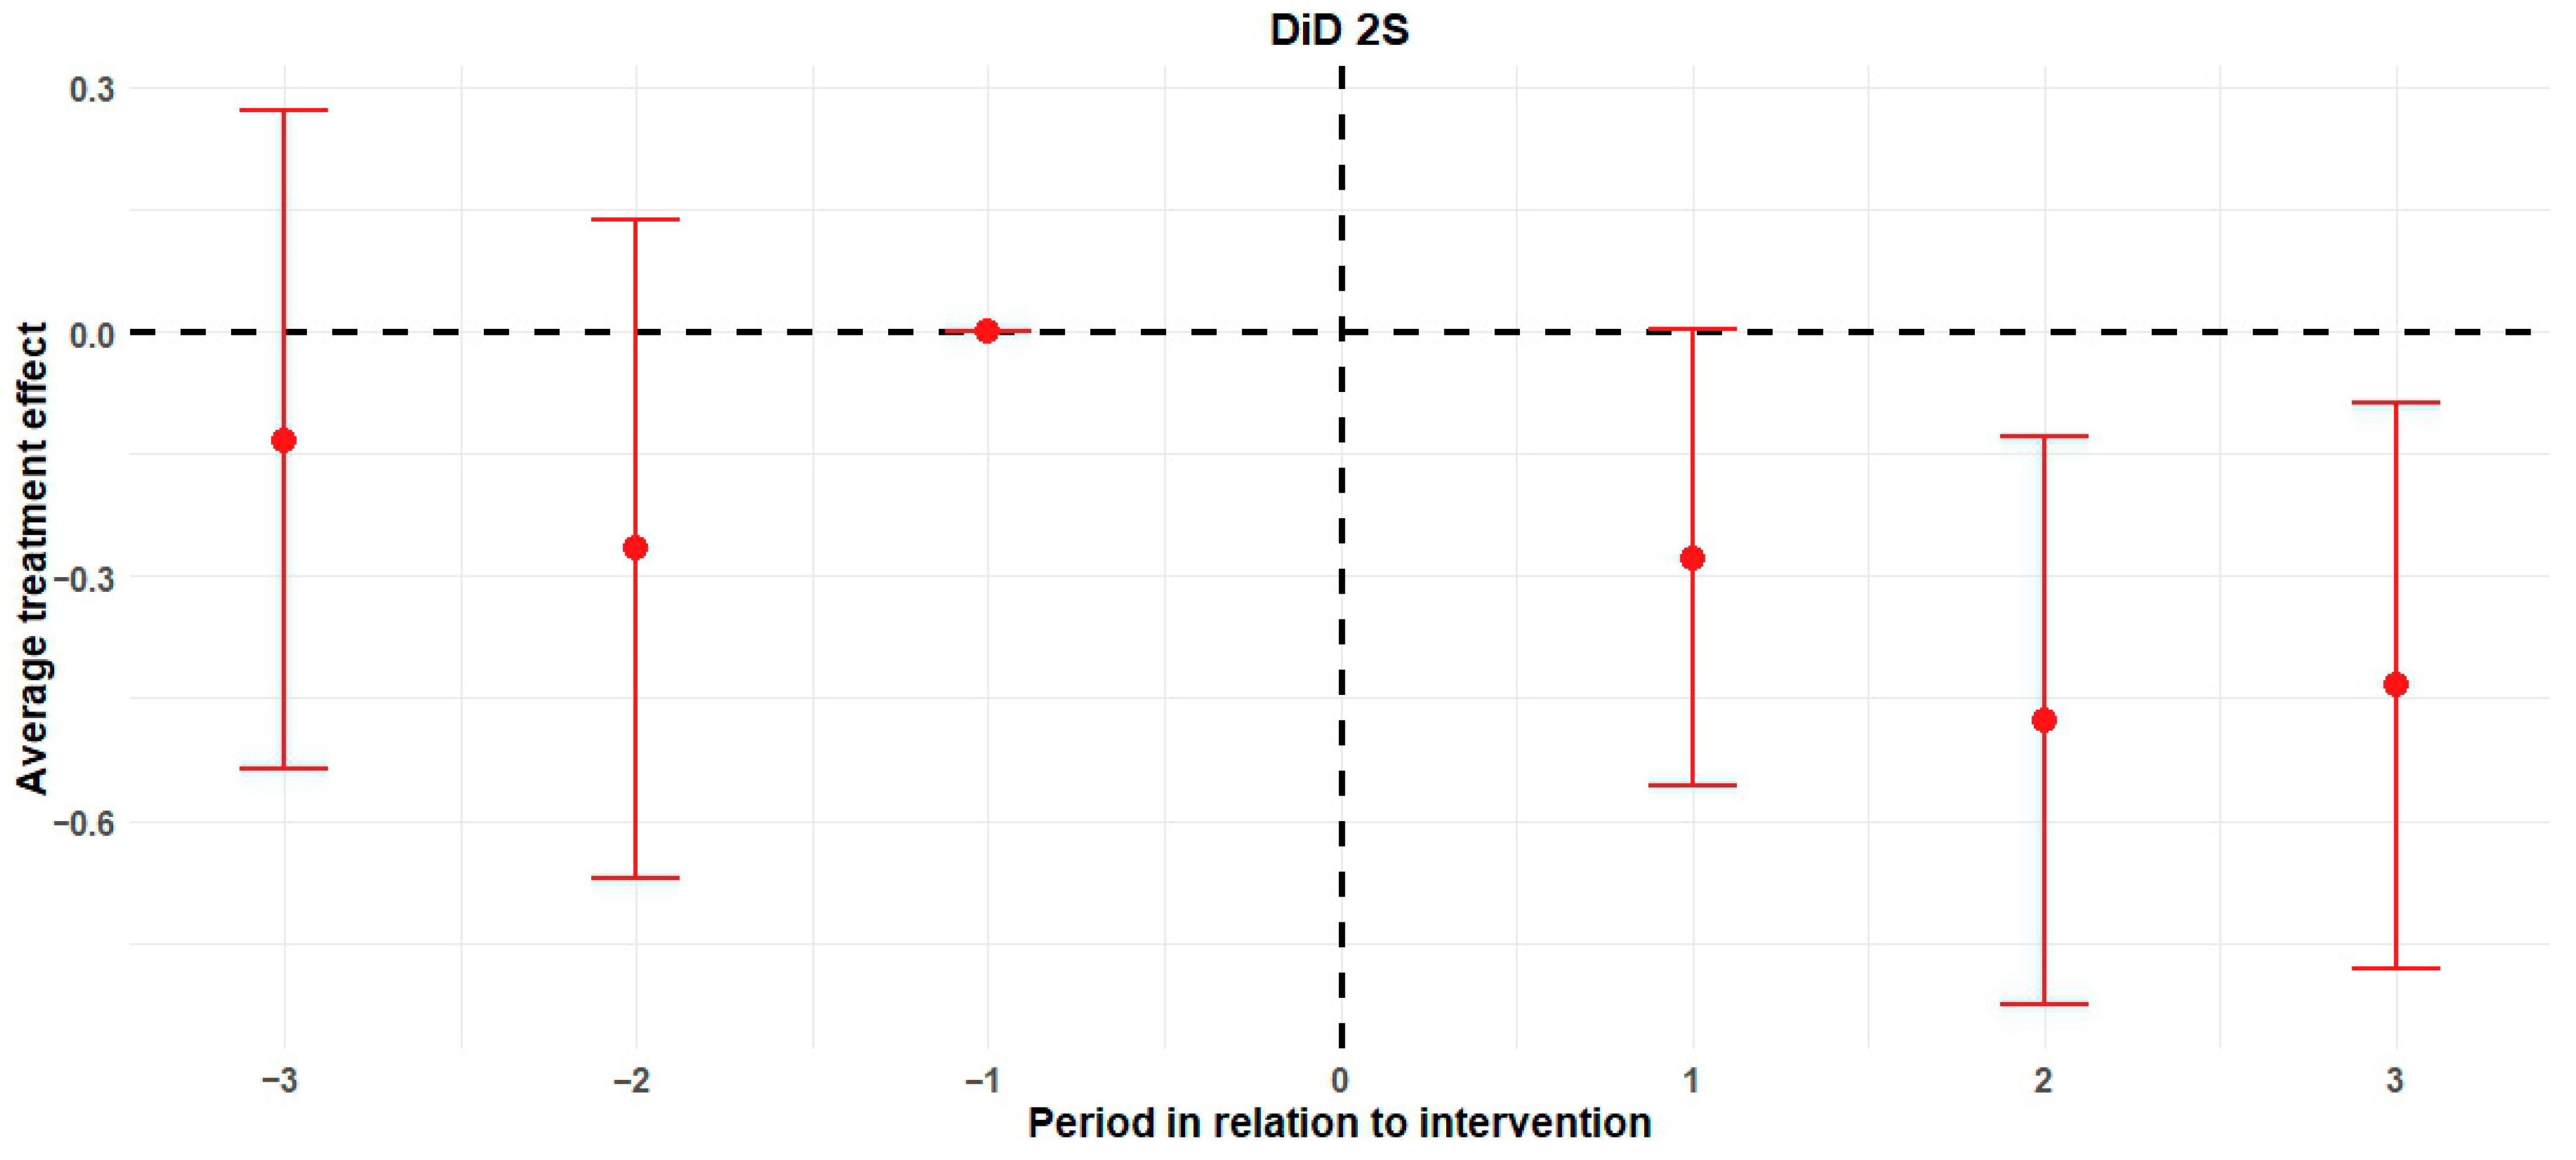
To estimate the staggered Average Treatment Effect on the Treated (ATT), we decomposed the treatment effect by year using dummy variables for each post-treatment period. The estimated staggered ATTs are negative and statistically significant across all three post-treatment years: Year 1: ATT = −0.28, p < 0.1 (1), Year 2: ATT = −0.48, p < 0.01 (2), Year 3: ATT = −0.43, p < 0.05 (3). Importantly, the pre-treatment effects are not statistically significant, which supports the parallel trends assumption.
Figure 8 visualizes the staggered ATT estimates with 95% confidence intervals. According to this figure, the treatment effect intensifies from the first to the second year and slightly diminishes in the third year. This dynamic suggests a potential return to equilibrium in the longer term, as residents and businesses adapt their behavior to the new transportation infrastructure and the rate of vibrancy growth between treated and control groups converges.
6. Discussion
Investments in public transport can generate short-term side effects for local neighborhoods, even when their primary objective is to enhance accessibility and mobility. From an urban policy perspective, the planning of new metro stations should therefore also consider measures to support local services and socio-economic activity during the adjustment period, for example, through incentives for small businesses or improvements to public spaces near the new stations.
These findings are related to previous research. For instance, Gao et al. [
37] suggest that transport infrastructure can stimulate local economic activity; however, their analysis primarily focuses on long-term macroeconomic effects, whereas our study shows that the short-term impact may even be negative. Similarly, Fu et al. [
36] found that transport accessibility increases the utilization of local service points, yet their study did not account for the dynamic adaptation of residents and businesses, which is critical in our context. In this way, our results complement the existing literature, highlighting the importance of distinguishing between short- and long-term effects and accounting for the adaptive responses of local communities.
It should be acknowledged that the study has certain limitations. Primarily, using a fixed distance to define the “treated” area may not fully reflect residents’ actual travel behavior, as they may prefer different routes or use other modes of transport. Moreover, the analysis relies on the number of SCB points as a proxy for urban vibrancy, which may not fully capture all dimensions of socio-economic activity, such as cultural events or social interactions.
Future research should incorporate more diverse measures of urban vibrancy, including pedestrian mobility, bicycle traffic intensity, quality of public spaces, and indicators of social cohesion. Additionally, it would be valuable to explore the interaction between different types of transport infrastructure, such as metro systems in combination with bus rapid transit or bicycle networks, and their differential impacts on various groups of residents.
Finally, it is evident that transport infrastructure projects produce complex spatial and temporal effects. Although initial impacts may be negative in the immediate vicinity of new stations, the adaptation of residents and local businesses, along with existing infrastructural resources, plays a crucial role in shaping long-term urban vibrancy. These findings underscore the importance of adopting a holistic and dynamic perspective when evaluating the urban impacts of transport interventions, considering both physical infrastructure and socio-economic responses.
7. Conclusions
First of all, analysis confirmed that urban vibrancy is positively influenced by local infrastructure and amenities. Specifically, larger building footprints, greater car park areas, and more benches were all associated with higher vibrancy, indicating that pre-existing physical features play an important role in shaping neighborhood activity levels. These findings provide important context for interpreting further subsequent treatment effects.
Further analysis indicates that the initial impact of opening new metro stations on urban vibrancy in the surrounding neighborhoods was negative, reflected in a slower growth of local activity compared to control areas. This pattern may be explained by residents increasingly using the metro to access more developed areas of the city center rather than engaging with nearby local businesses and services. These findings suggest that the immediate effects of the intervention are not necessarily beneficial for the areas closest to the new infrastructure and that local units require time to adjust to altered mobility conditions.
The analysis further revealed that the effect evolved over time: the largest decline in urban vibrancy occurred in the second year after station openings, followed by a slight recovery in the third year. The absence of statistically significant differences prior to the intervention supports the parallel trends assumption, reinforcing that the observed changes can be interpreted as a direct effect of the new metro stations.
The observed temporal variation implies that the influence of transport infrastructure is largely transient. As residents and local businesses gradually adapt their routines and strategies, local vibrancy can recover, eventually approaching a more balanced growth trajectory. Accordingly, the initial decline in activity near the stations should be understood as a transitional phase rather than a permanent shift in urban dynamics.
Overall, the study demonstrates that public transport investments may temporarily slow the development of local services in the immediate vicinity of new stations, but over several years, adaptation by residents and businesses tends to reduce disparities in urban vibrancy between treated and untreated areas. These results underscore the importance of considering the dynamic social and economic responses when evaluating the urban impacts of transport projects.
