
Street Trees’ Obstruction of Retail Signage and Retail Rent: An Exploratory Scene Parsing Street View Analysis of Seoul’s Commercial Districts


Abstract
1. Introduction
2. Data and Methods
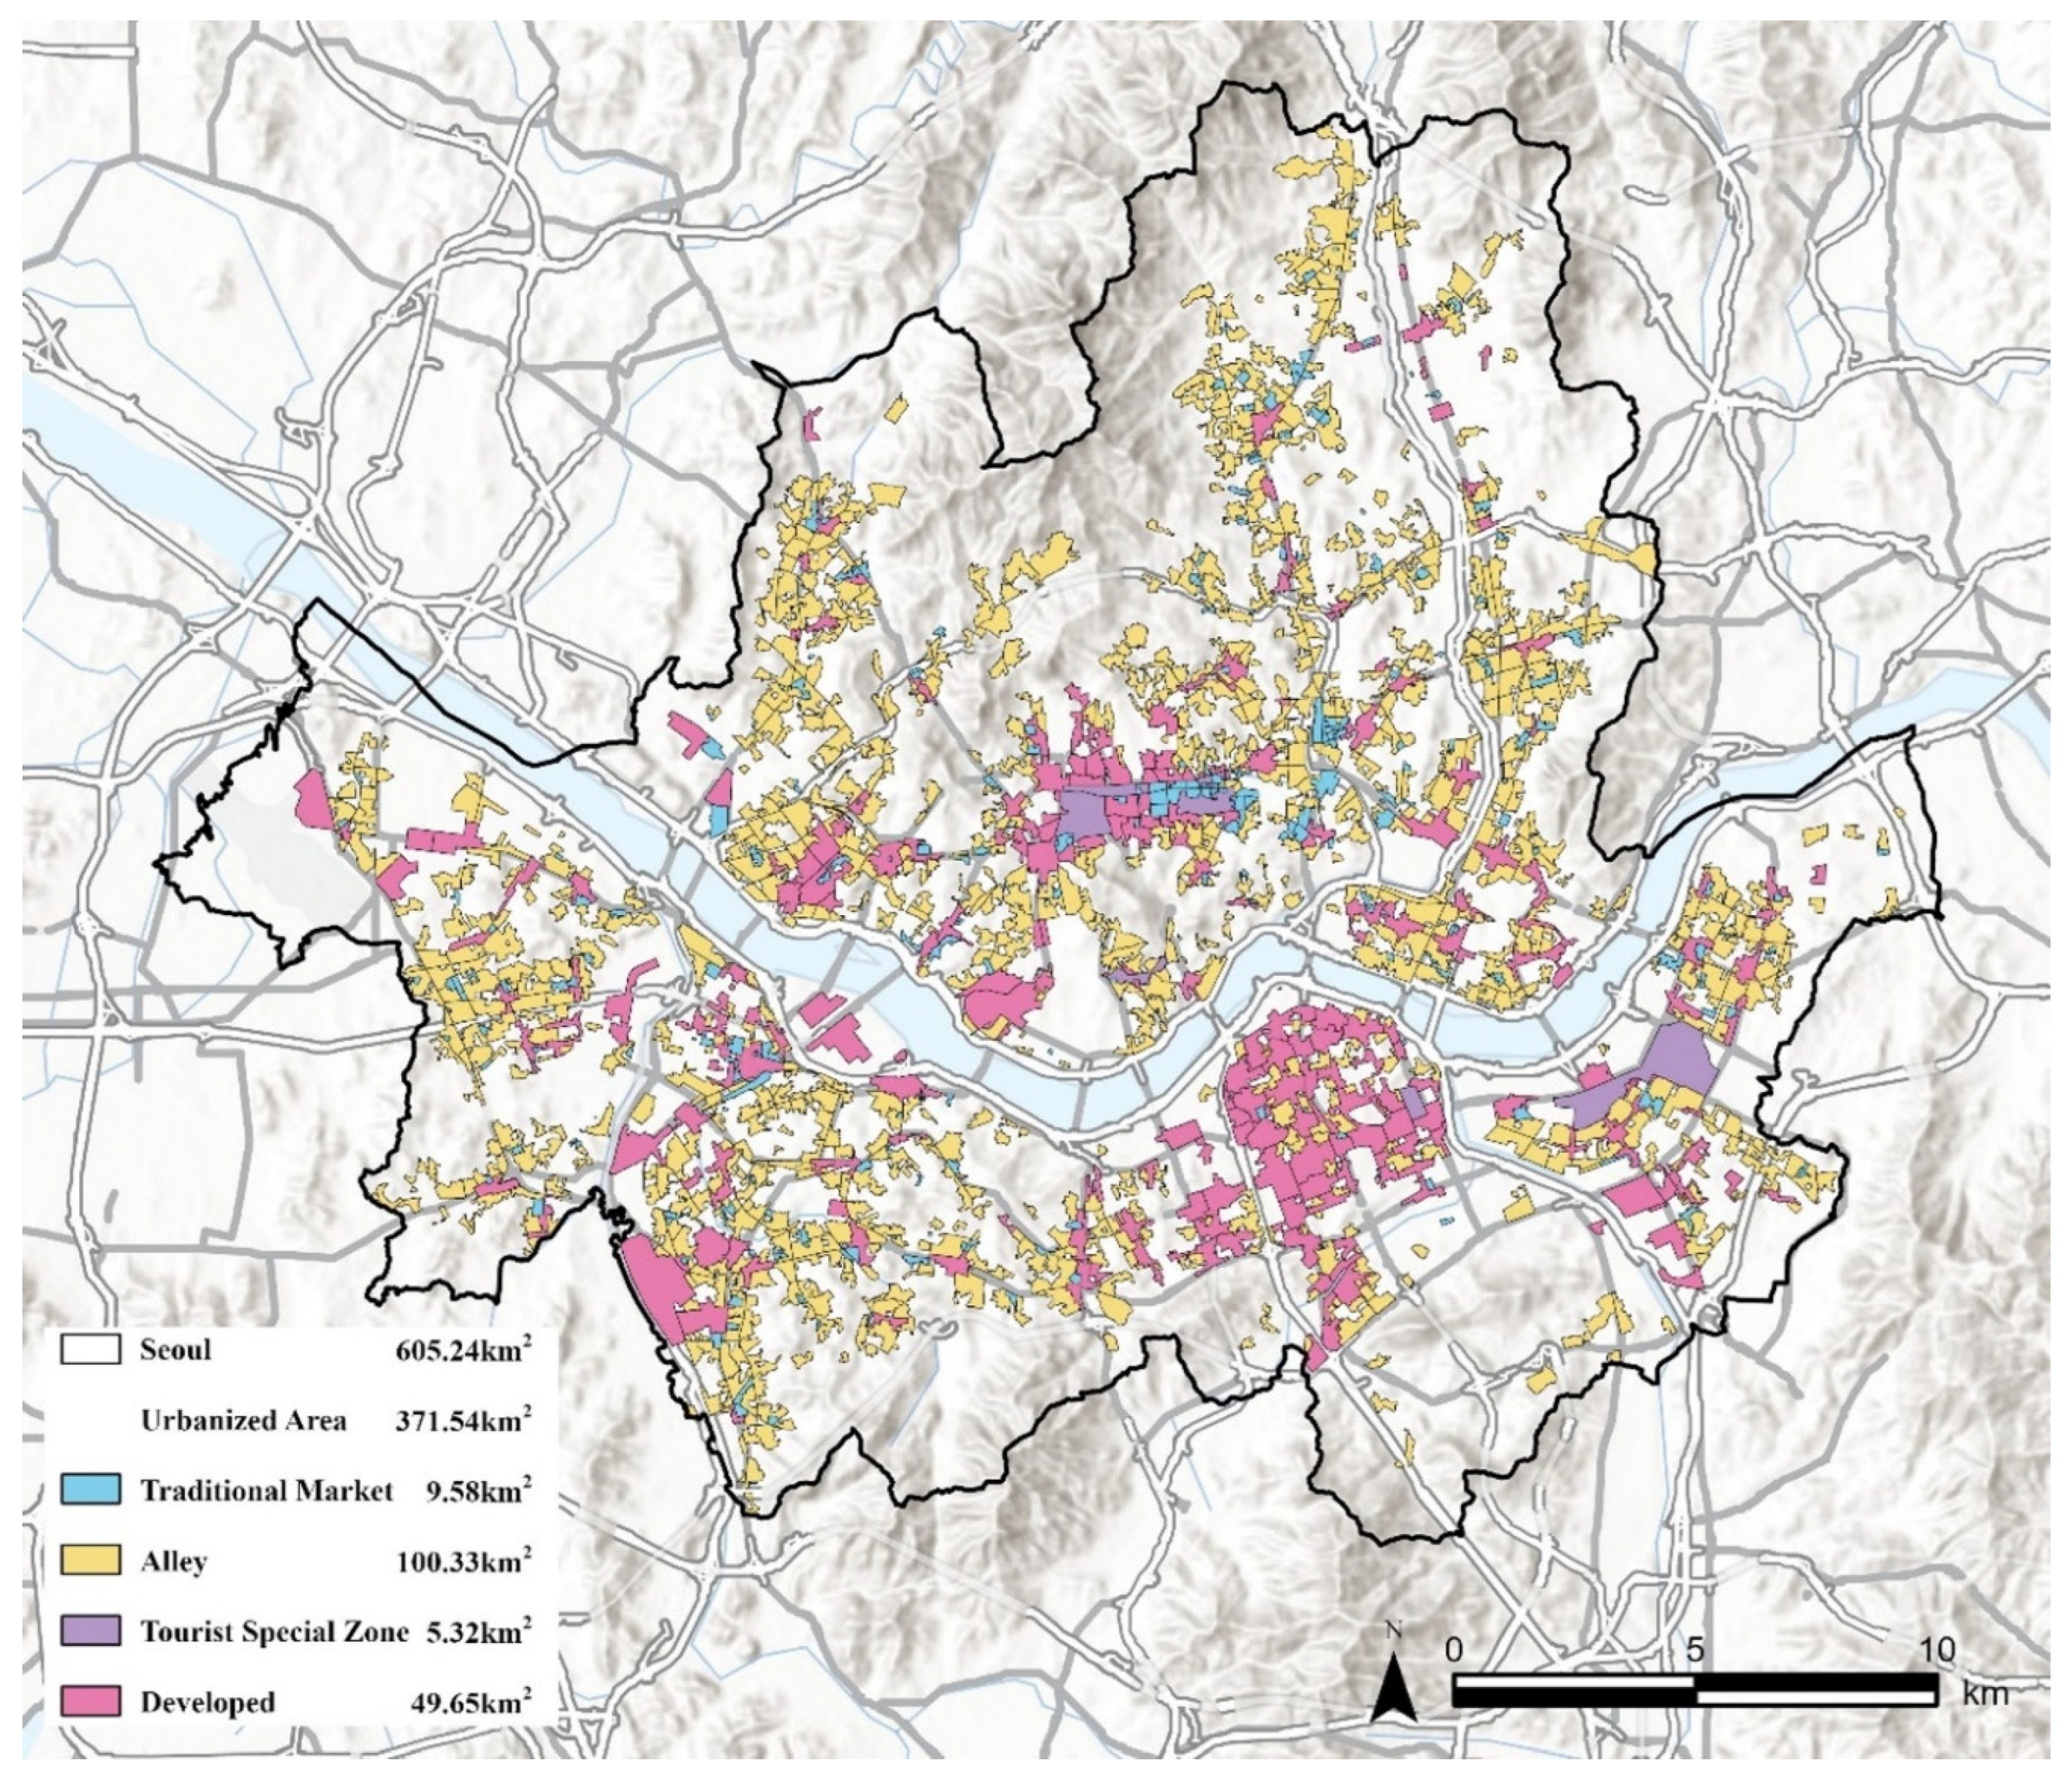
2.1. Study Area
2.2. Data
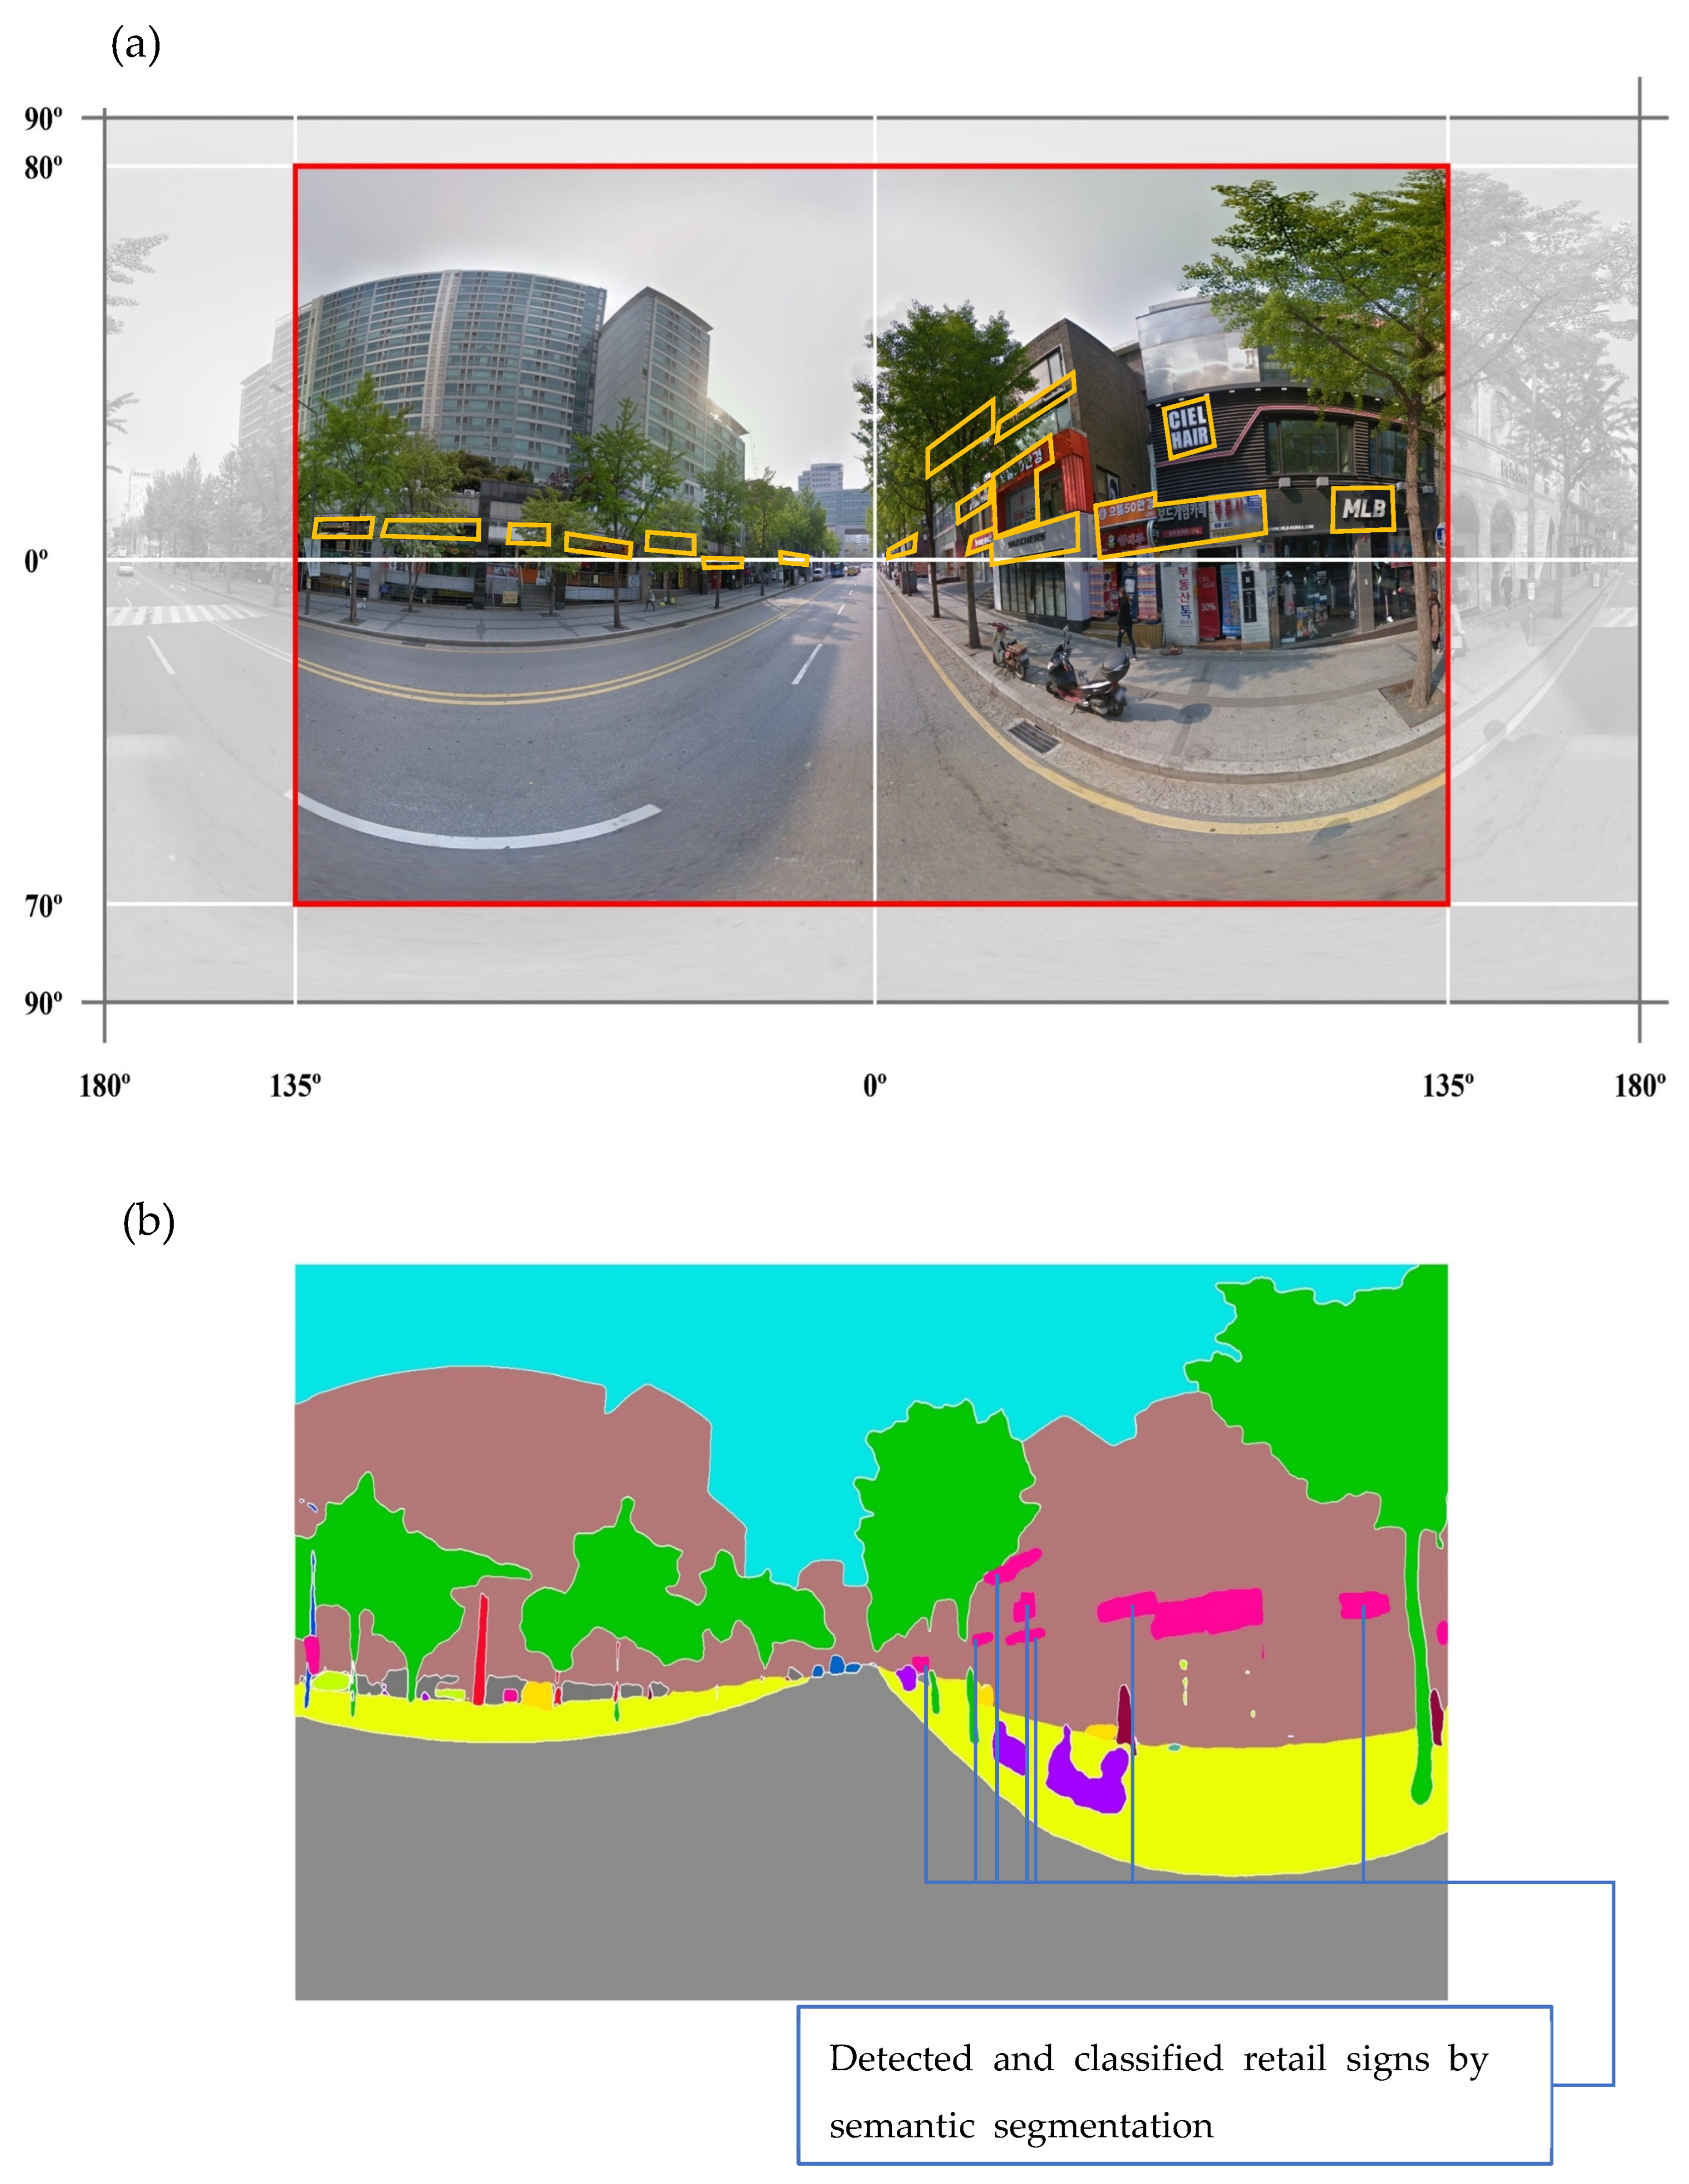
2.3. Method—Street View Analysis
2.4. Method—Analytical Method to Investigate Monthly Rent
3. Results
4. Discussion
4.1. Economic Factors and Monthly Rent
4.2. A Tension in Sustainability
4.3. Making Sense of Enclosure
4.4. Limitations and Future Directions
5. Conclusions
Author Contributions
Funding
Institutional Review Board Statement
Informed Consent Statement
Data Availability Statement
Acknowledgments
Conflicts of Interest
References
- Daniels, P.; El Baghdadi, O.; Desha, C.; Matthews, T. Evaluating net community benefits of integrating nature within cities. Sustain. Earth 2020, 3, 12. [Google Scholar] [CrossRef]
- Grey, T.; Xidous, D.; O’Neill, D.; Collier, M. Growing Older Urbanism: Exploring the nexus between ageing, the built environment, and urban ecosystems. Urban Transform. 2023, 5, 8. [Google Scholar] [CrossRef]
- Joye, Y.; Willems, K.; Brengman, M.; Wolf, K. The effects of urban retail greenery on consumer experience: Reviewing the evidence from a restorative perspective. Urban For. Urban Green. 2010, 9, 57–64. [Google Scholar] [CrossRef]
- Joye, Y. Architectural lessons from environmental psychology: The case of biophilic architecture. Rev. Gen. Psychol. 2007, 11, 305–328. [Google Scholar] [CrossRef]
- Kellert, S.R.; Heerwagen, J.; Mador, M. Biophilic Design: The Theory, Science and Practice of Bringing Buildings to Life; John Wiley & Sons: Hoboken, NJ, USA, 2011. [Google Scholar]
- Turley, L.W.; Milliman, R.E. Atmospheric effects on shopping behavior: A review of the experimental evidence. J. Bus. Res. 2000, 49, 193–211. [Google Scholar] [CrossRef]
- Maxwell, S.; Kover, A. Negative affect: The dark side of retailing. J. Bus. Res. 2003, 56, 553–559. [Google Scholar] [CrossRef]
- Luczaj, K. Evolutionary Aesthetics and Print Advertising: Empirical Evidence from Poland. SAGE Open 2015, 5, 2158244015592165. [Google Scholar] [CrossRef]
- Wolf, K.L. Nature in the retail environment: Comparing consumer and business response to urban forest conditions. Landsc. J. 2004, 23, 40–51. [Google Scholar] [CrossRef]
- Wolf, K.L. Trees in the small city retail business district: Comparing resident and visitor perceptions. J. For. 2005, 103, 390–395. [Google Scholar] [CrossRef]
- Wolf, K.L. Assessing public response to freeway roadsides: Urban forestry and context-sensitive solutions. Transp. Res. Rec. 2006, 1984, 102–111. [Google Scholar] [CrossRef]
- Wolf, K.L. Community context and strip mall retail: Public response to the roadside landscape. Transp. Res. Rec. 2008, 2060, 95–103. [Google Scholar] [CrossRef]
- Nasar, J.L. The effect of sign complexity and coherence on the perceived quality of retail scenes. J. Am. Plan. Assoc. 1987, 53, 499–509. [Google Scholar] [CrossRef]
- Campbell, S.D. The planner’s triangle revisited: Sustainability and the evolution of a planning ideal that can’t stand still. J. Am. Plan. Assoc. 2016, 82, 388–397. [Google Scholar] [CrossRef]
- Donovan, G.H.; Butry, D.T. The effect of urban trees on the rental price of single-family homes in Portland, Oregon. Urban For. Urban Green. 2011, 10, 163–168. [Google Scholar] [CrossRef]
- Sander, H.A.; Zhao, C. Urban green and blue: Who values what and where? Land Use Policy 2015, 42, 194–209. [Google Scholar] [CrossRef]
- Lin, J.; Huang, B.; Wang, Q.; Chen, M.; Lee, H.F.; Kwan, M.P. Impacts of street tree abundance, greenery, structure and management on residential house prices in New York City. Urban For. Urban Green. 2024, 94, 128288. [Google Scholar] [CrossRef]
- Jang, D.C.; Kim, B.; Kim, S.H. The effect of green building certification on potential tenants’ willingness to rent space in a building. J. Clean. Prod. 2018, 194, 645–655. [Google Scholar] [CrossRef]
- Kang, Y.; Zhang, F.; Gao, S.; Lin, H.; Liu, Y. A review of urban physical environment sensing using street view imagery in public health studies. Ann. GIS 2020, 26, 261–275. [Google Scholar] [CrossRef]
- Biljecki, F.; Ito, K. Street view imagery in urban analytics and GIS: A review. Landsc. Urban Plan. 2021, 215, 104217. [Google Scholar] [CrossRef]
- Yue, H.; Liu, L.; Xiao, L. Investigating the effect of people on the street and streetscape physical environment on the location choice of street theft crime offenders using street view images and a discrete spatial choice model. Appl. Geogr. 2023, 157, 103025. [Google Scholar] [CrossRef]
- OECD. Self-Employment Rate. Available online: https://www.oecd.org/en/data/indicators/self-employment-rate.html (accessed on 28 October 2022).
- Park, H.-S. Self-Employed in Seoul: Characteristics and Policy Support Direction. 2011. Available online: https://www.si.re.kr/node/42560 (accessed on 28 October 2024).
- Lee, J.Y. A Study on the Effect of Internal and External Factors of Self-Employed Business in Seoul on the Default of Credit Guarantee: Focused on the Start-Up Guarantee of the Seoul Credit Guarantee Foundation. Master’s Thesis, Yonsei University, Seoul, Republic of Korea, 2021. [Google Scholar]
- Lee, S.; Ishiro, T. Regional economic analysis of major areas in South Korea: Using 2005–2010–2015 multi-regional input–output tables. J. Econ. Struct. 2023, 12, 12. [Google Scholar] [CrossRef]
- Seoul City Commercial District Analysis Service (SCCDA). Available online: https://golmok.seoul.go.kr/introduce.do (accessed on 30 October 2024).
- Fondeville, N.; Ozdemir, E.; Lelkes, O.; Ward, T.; Zolyomi, E. Recent changes in self-employment and entrepreneurship across the EU. Res. Note 2015, 6, 2015. [Google Scholar]
- Chung, S.; Kim, E.K.; Kim, W.-Y. Does increase in self-employment affect economic growth and unemployment rate? J. Ind. Econ. Bus. 2020, 33, 1937–1959. [Google Scholar] [CrossRef]
- Lee, J.; Han, J.; Kim, J.; Oh, Y.; Kim, M.; Bae, J. Study on self-employment and policy suggestions. KDI Res. Monogr. 2020, 6. [Google Scholar] [CrossRef]
- Yun, S. A study on the effect of local commercial characteristic information on closure rate of small business. J. Corp. Innov. 2019, 42, 21–39. [Google Scholar] [CrossRef]
- Williams, C.C. Rethinking the role of the retail sector in economic development. Serv. Ind. J. 1997, 17, 205–220. [Google Scholar] [CrossRef]
- Smart City Korea. Seoul City, Reorganization of Commercial District Analysis Service, More Convenient Big Data-Based Commercial District Information at a Glance. Ministry of Land, Infrastructure and Transport. 25 April 2022. Available online: https://smartcity.go.kr/en/%EC%A0%95%EC%B1%85/%EB%B3%B4%EB%8F%84%EC%9E%90%EB%A3%8C/?_sf_s=%EC%84%9C%EC%9A%B8%EC%8B%9C%20%EC%83%81%EA%B6%8C%EB%B6%84%EC%84%9D (accessed on 28 October 2024).
- Distribution Industry Development Act. Chapter 1, Articles 1–5. 2020. Available online: https://www.law.go.kr/LSW/eng/engLsSc.do?menuId=2§ion=lawNm&query=%EC%9C%A0%ED%86%B5%EC%82%B0%EC%97%85%EB%B0%9C%EC%A0%84%EB%B2%95&x=50&y=36#liBgcolor0 (accessed on 30 October 2024).
- Lee, M.H.; Hong, S.; Shin, D.B. A study on application of spatial weighted regression for analyzing the influential factors of sales in sub-region commercial area of Seoul: Focusing on geo-spatial big data utilization. Geogr. J. Korea 2019, 53, 21–224. [Google Scholar]
- Woo, J.G. Analysis on the Influence of Changes in the Composition of Commercial District in Itaewon: Focusing on the Relationship Between Floating Population and Sale. Master’s Thesis, Seoul National University, Seoul, Republic of Korea, 2021. Available online: https://dcollection.snu.ac.kr/handle/10371/000000165474 (accessed on 20 May 2025).
- Cao, Y.; Lee, S. Analysis of urban vitality and its determinant factors using POI big data in Seoul, Korea. J. Korea Plan. Assoc. 2021, 56, 87–102. [Google Scholar] [CrossRef]
- Gehl, J. Cities for People; Island Press: Washington, DC, USA, 2013. [Google Scholar]
- Yin, L.; Wang, Z. Measuring visual enclosure for street walkability: Using machine learning algorithms and Google Street View imagery. Appl. Geogr. 2016, 76, 147–153. [Google Scholar] [CrossRef]
- Knapp, A. An introduction to clinical perimetry. Arch. Ophthalmol. 1938, 20, 1116–1117. [Google Scholar] [CrossRef]
- Kim, S.; Woo, A. Streetscape and business survival: Examining the impact of walkable environments on the survival of restaurant businesses in commercial areas based on street view images. J. Transp. Geogr. 2022, 105, 103480. [Google Scholar] [CrossRef]
- Wang, C.; Endo, T.; Hirofuchi, T.; Ikegami, T. Pyramid Swin Transformer for multi-task: Expanding to more computer vision tasks. In Proceedings of the International Conference on Advanced Concepts for Intelligent Vision Systems, Cham, Switzerland, 21–23 August 2023; Springer Nature: Cham, Switzerland, 2023; pp. 53–65. [Google Scholar]
- Liu, Z.; Lin, Y.; Cao, Y.; Hu, H.; Wei, Y.; Zhang, Z.; Lin, S.; Guo, B. Swin transformer: Hierarchical vision transformer using shifted windows. In Proceedings of the IEEE/CVF International Conference on Computer Vision, Montreal, QC, Canada, 10–17 October 2021; pp. 10012–10022. [Google Scholar]
- Jain, J.; Li, J.; Chiu, M.T.; Hassani, A.; Orlov, N.; Shi, H. Oneformer: One transformer to rule universal image segmentation. In Proceedings of the IEEE/CVF Conference on Computer Vision and Pattern Recognition, Vancouver, BC, Canada, 19–24 June 2023; pp. 2989–2998. [Google Scholar]
- Park, J. The Effect of Street Environments on Commercial Sales in Seoul: Using Street Big Data and Deep Learning Technologies. Master’s Thesis, Hanyang University, Seoul, Republic of Korea, 2023. Available online: http://www.dcollection.net/handler/hanyang/200000651849 (accessed on 25 November 2024).
- Spreiregen, P.D. Urban Design: The Architecture of Towns and Cities; McGraw-Hill: New York, NY, USA, 1965; p. 45. [Google Scholar]
- Kim, J.; Kim, S. Finding the optimal D/H ratio for an enclosed urban square: Testing an urban design principle using immersive virtual reality simulation techniques. Int. J. Environ. Res. Public Health 2019, 16, 865. [Google Scholar] [CrossRef]
- Kim, J.-Y. Myeong-Dong Is No Longer Seoul’s Priciest District for Store Rent. Korea JoongAng Daily. 8 March 2024. Available online: https://koreajoongangdaily.joins.com/news/2024-03-08/business/economy/Myeongdong-is-no-longer-Seouls-priciest-district-for-store-rent/1997702 (accessed on 25 November 2024).
- Choi, J.-Y. A Study on the Appropriate Rent and Asset Value of Franchise Lease Small Commercial Real Estate. Master’s Thesis, Dong-Eui University, Busan, Republic of Korea, 2021. [Google Scholar]
- Montella, A.; Chiaradonna, S.; De Sanctis Mihiel, A.C.; Lovegrove, G.; Nunziante, P.; Rella Riccardi, M. Sustainable complete streets design criteria and case study in Naples, Italy. Sustainability 2022, 14, 13142. [Google Scholar] [CrossRef]
- City of Los Angeles. Complete Streets Design Guide. Available online: https://planning.lacity.gov/odocument/c9596f05-0f3a-4ada-93aa-e70bbde68b0b/Complete_Street_Design_Guide.pdf (accessed on 26 November 2024).
- Ewing, R.; Handy, S. Measuring the unmeasurable: Urban design qualities related to walkability. J. Urban Des. 2009, 14, 65–84. [Google Scholar] [CrossRef]


| Variable | Description | Source |
|---|---|---|
| Predicted Variable | The average monthly rent in a developed commercial district per square meter | Korea Credit Guarantee Fund https://www.kodit.co.kr/koditEng/main.do (accessed on 30 October 2024). |
| Rent | ||
| Predictor Variable—Economic factors | Seoul City Commercial District Analysis Service https://golmok.seoul.go.kr/main.do (accessed on 30 October 2024) | |
| The number of retail shops | The total number of retail shops in a developed commercial district | |
| The annual rate of new retail shop openings | The proportion of newly opened retail shops to the total number of retail shops | |
| Revenue | The total amount of income generated by a business | |
| Income | The maximum income of residents in a developed commercial district | |
| Foot traffic | The number of pedestrians passing through a developed commercial district | |
| Working population | The total population that works in a developed commercial district | |
| Survival rate | The proportion of retail shops that remain operational for 5 years compared to the total number of retail shops | |
| POI | The number of points of interest (POI) in a developed commercial district | National Geographic Information Institute https://map.ngii.go.kr/mi/oprGuide/portalIntro.do (accessed on 30 October 2024) |
| GRDP per capita | Gross Regional Domestic Product (GRDP) per capita within the municipal boundaries of the commercial district | Statistics Korea https://kostat.go.kr/anse/ (accessed on 30 October 2024) |
| Predictor Variable—Built Environment factors | Google Street View images analyzed using semantic segmentation | |
| Street Tree View | The proportion of segmented objects categorized into the following categories: street trees, sidewalks, signs, sky, roads, and buildings. | |
| Sidewalk | ||
| Sign | ||
| Sky | ||
| Road | ||
| Structure | ||
| Predictor | The Average Monthly Rent of a Developed Commercial District | |||
|---|---|---|---|---|
| Full Model Results | Reduced Model Results | |||
| Coefficients | p-Value | Coefficients | p-Value | |
| Intercept | 307,500 | 0.000 *** | 315,300 | 0.000 *** |
| shop_cnt_y | 16 | 0.000 *** | 13.98 | 0.000 *** |
| shop_open_y | 7063 | 0.065 . | 6469 | 0.064 . |
| revenue | 0.00003266 | 0.491 | ||
| income_max | −0.001229 | 0.746 | ||
| poi | −89 | 0.282 | ||
| pop_travel | −0.01673 | 0.281 | ||
| pop_work | 1.685 | 0.796 | ||
| surv_rate5 | −147 | 0.600 | ||
| grdp_cap | 148 | 0.000 *** | 154 | 0.000 *** |
| Street Tree View | −3463 | 0.029 * | −3390 | 0.028 * |
| sidewalk | 1227 | 0.621 | ||
| sky | −3869 | 0.003 ** | −3981 | 0.001 ** |
| road | −1726 | 0.158 | −1939 | 0.050 . |
| structure | −1581 | 0.160 | −2067 | 0.045 * |
| Sample | 246 | |||
| F-statistic | 10.61 | 20.99 | ||
| Multiple R squared | 0.3945 | 0.3847 | ||
| Adjusted R squared | 0.3573 | 0.3664 | ||
| Predictor | The Average Monthly Rent of the Whole Commercial Districts in Seoul | |||
|---|---|---|---|---|
| Full Model Results | Reduced Model Results | |||
| Coefficients | p-Value | Coefficients | p-Value | |
| Intercept | 123,326 | 0.001 *** | 142,317 | 0.000 *** |
| shop_cnt_y | 23 | 0.000 *** | 23 | 0.000 *** |
| shop_open_y | 1456 | 0.002 ** | 1460 | 0.001 *** |
| revenue | 0.0000231 | 0.006 ** | 0.0000216 | 0.010 ** |
| income_max | 4930 | 0.044 * | 4966 | 0.039 * |
| poi | −44 | 0.701 | −51 | 0.653 |
| pop_travel | −0.00109 | 0.877 | ||
| pop_work | −4.057529 | 0.502 | ||
| surv_rate5 | −12 | 0.912 | ||
| grdp_cap | 207 | 0.000 *** | 208 | 0.000 *** |
| Street Tree View | 492 | 0.186 | 0.028 * | |
| sidewalk | 728 | 0.652 | ||
| sky | −1753 | 0.009 ** | −2261 | 0.000 *** |
| road | −1140 | 0.001 *** | −1168 | 0.030 * |
| structure | −1246 | 0.160 | −1461 | 0.000 *** |
| Sample | 1082 | |||
| F-statistic | 28.92 | 44.82 | ||
| Multiple R squared | 0.2751 | 0.2734 | ||
| Adjusted R squared | 0.2656 | 0.2673 | ||
Disclaimer/Publisher’s Note: The statements, opinions and data contained in all publications are solely those of the individual author(s) and contributor(s) and not of MDPI and/or the editor(s). MDPI and/or the editor(s) disclaim responsibility for any injury to people or property resulting from any ideas, methods, instructions or products referred to in the content. |
© 2025 by the authors. Licensee MDPI, Basel, Switzerland. This article is an open access article distributed under the terms and conditions of the Creative Commons Attribution (CC BY) license (https://creativecommons.org/licenses/by/4.0/).
Share and Cite
Park, M.; Wang, J.; Yim, B.; Park, D.; Lee, J. Street Trees’ Obstruction of Retail Signage and Retail Rent: An Exploratory Scene Parsing Street View Analysis of Seoul’s Commercial Districts. Sustainability 2025, 17, 6934. https://doi.org/10.3390/su17156934
Park M, Wang J, Yim B, Park D, Lee J. Street Trees’ Obstruction of Retail Signage and Retail Rent: An Exploratory Scene Parsing Street View Analysis of Seoul’s Commercial Districts. Sustainability. 2025; 17(15):6934. https://doi.org/10.3390/su17156934
Chicago/Turabian StylePark, Minkyu, Junyoung Wang, Beomgu Yim, Doyoung Park, and Jaekyung Lee. 2025. "Street Trees’ Obstruction of Retail Signage and Retail Rent: An Exploratory Scene Parsing Street View Analysis of Seoul’s Commercial Districts" Sustainability 17, no. 15: 6934. https://doi.org/10.3390/su17156934
APA StylePark, M., Wang, J., Yim, B., Park, D., & Lee, J. (2025). Street Trees’ Obstruction of Retail Signage and Retail Rent: An Exploratory Scene Parsing Street View Analysis of Seoul’s Commercial Districts. Sustainability, 17(15), 6934. https://doi.org/10.3390/su17156934