Article

Analysis of Spatial Changes in Urban Areas Due to Revitalization Investments Based on China and Poland

1
Department of Geoinformation and Spatial Management, Faculty of Environmental and Mechanical Engineering, Poznan University of Life Sciences, Piatkowska 94, 60-649 Poznan, Poland
2
Department of Landscape Architecture, Faculty of Agriculture, Horticulture and Biotechnology, Poznan University of Life Sciences, Dabrowskiego 159, 60-594 Poznan, Poland
*
Author to whom correspondence should be addressed.
Sustainability 2025, 17(22), 10126; https://doi.org/10.3390/su172210126
Submission received: 17 September 2025 / Revised: 8 November 2025 / Accepted: 10 November 2025 / Published: 12 November 2025
(This article belongs to the Section Sustainability in Geographic Science)

Abstract

In order to address the social, economic, and environmental challenges arising from urban development, some urban revitalization plans have been proposed. With the implementation of these plans, the spatial pattern of the region has also undergone corresponding changes. Some of the revitalization projects have driven economic growth while accompanied by ecological degradation, while others have achieved coordinated development and protection. This study selected eight urban revitalization cases, based on remote sensing (RS) and geographic information system (GIS), and used the Random Forest (RF) machine learning method to dynamically monitor the spatial changes in the region before and after revitalization through Land Use and Land Cover (LULC) analysis. The research results show that among the eight cases, only the revitalization cases located in Beijing and Swarzędz reflected an increase in water and vegetation areas, while the built-up area decreased. The other six cases located in Nanjing, Kraków, Wągrowiec, Swarzędz, Parczew, and Mosina all reflect the result of built-up areas encroaching water and vegetation areas.

1. Introduction

With the rapid advancement of society and the acceleration of urbanization, many cities face spatial degradation and socioeconomic issues. Urban revitalization has emerged as a proactive intervention strategy to reverse urban degradation and enhance vitality and competitiveness [1]. Globally, its policy paradigms have shifted significantly, moving from post-war large-scale reconstruction through phases of historic preservation, entrepreneurial flagship projects, and finally towards contemporary goals of inclusivity, climate resilience, and community-led governance [2]. It is within this latest paradigm that our comparative study of Polish and Chinese cases is situated.
As rapid urbanization leads to land resource scarcity and fragmentation through large-scale appropriation of natural ecological spaces into hardened urban surfaces undermines critical ecosystem services, including rainwater infiltration, carbon sequestration, climate regulation, biodiversity, and so on [3,4]. This decline in service functions further exacerbates environmental issues such as urban waterlogging, the heat island effect, water pollution, soil degradation, biodiversity loss, and so on [3,4,5,6,7]. To tackle these challenges, urban revitalization entails concentrated alterations in LULC within urban areas and their surrounding regions.
Previous research has demonstrated the value of LULC analysis in urban revitalization, with its core strength lying in quantifying the spatiotemporal dynamics of surface morphology, thereby providing decision-making support for urban expansion, environmental management, and sustainable planning [8]. For instance, the Nanjing Sponge City project effectively assessed ecological renovation outcomes through LULC change monitoring, highlighting its practical potential [9]. However, practical application still faces challenges: existing studies rely on medium- and low-resolution remote sensing data, focus on macro-level national or regional analyses, and lack systematic cross-national comparisons at a fine-grained scale specifically targeting the urban revitalization process [10].
To address this research gap, this study selected eight representative cases for cross-national comparative analysis, including six cases from Poland (three from urban municipalities, Poznań, Wągrowiec, and Kraków; three from urban–rural municipalities, Parczew, Swarzędz, and Mosina) significantly influenced by EU cohesion policies and post-socialist transition contexts, and two cases from China (two from cities: Beijing and Nanjing) driven by rapid urbanization and ecological civilization initiatives [11,12]. By employing PlanetScope imagery and the RF algorithm, this research aims to precisely quantify LULC changes in these areas, seeking to reveal the spatial effects of different governance models and provide valuable empirical references for advancing sustainable urban development globally.
During revitalization, the transformation of reducing hardened urban surfaces (built-up areas) to expand natural ecological spaces (vegetation and water areas) will restore the local microclimate and improve the ecosystem’s ability to regulate the environment. On the contrary, an improper adjustment of LULC changes can disrupt the urban ecological balance, giving rise to a series of environmental issues [13]. Typical evidence includes increased vulnerability to urban waterlogging, as seen in extreme rainfall events. For example, Beijing experienced catastrophic rainfall in 2012 with a maximum hourly rainfall of 460 mm [14]. Poznań and Swarzędz were struck by severe rainfall after daily precipitation of 79.4 mm and 136.9 mm in 2021. This caused large-scale urban waterlogging, resulting in substantial property damage [15]. Therefore, understanding the changes in LULC through research like this study is useful for formulating more sustainable urban revitalization strategies to mitigate the negative impacts on the climate and environment.
Based on the background of spatial changes driven by urban revitalization, the following sections will focus on the transformations of LULC among eight cases in LULC, supported by RS and GIS technologies.

2. Materials and Methods

2.1. Study Area

Urban revitalization has become a critical policy tool for addressing issues of inner-city decline and degradation of city centers, industrial transformation, and sustainable development; for example, Bordeaux, South Wales, Chongqing, and so on [16,17,18]. Under the latest paradigm, the research object of this study involves urban revitalization in Poland, which is mainly based on the Act of 9 October 2015 on revitalization [19]. Meanwhile, China lacks an equivalent legal framework similar to Poland’s Revitalization Act. However, related policies such as urban renewal, old town regeneration, and rural revitalization share conceptual and practical similarities with Poland’s revitalization paradigm.
Considering these extreme weather-affected regions, sample diversity, and information accessibility, the representative eight cases that have previously experienced extreme weather events, have clear urban revitalization investments, and where revitalization documents and satellite data covering the entire revitalization process were selected. According to the eight cases, the study designated eight sub-areas from two cities in China (two from cities: Beijing and Nanjing) and six municipalities in Poland (three from urban municipalities, Poznań, Wągrowiec, and Kraków; three from urban–rural municipalities, Parczew, Swarzędz, and Mosina). To comprehensively understand the policies proposed to tackle challenges and characterize the socioeconomic profiles of the studied areas, key indicators including number of inhabitants, area, population density, type of municipality and city, yearly budget expenditure in USD, and registered unemployment rate are systematically summarized in Table A1.

2.2. Data Sources

When analyzing urban transformation driven by urban revitalization, the integrated application of RS and GIS enables humans to utilize satellite platforms located above the Earth’s surface. This approach allows for the simultaneous acquisition of large-scale geospatial observation data and ensures continuous monitoring over time [20]. Such capabilities provide highly accessible data sources for planning studies on urban revitalization and renewal measures, offering a scientific foundation for refined and sustainable urban development.
The analysis of spatial changes before and after urban revitalization based on the LULC time series has become a core methodology in contemporary urban planning research. LULC modeling, recognized as the best tool to comprehend and unravel the dynamics of future urban expansion [21], has undergone a series of developments. With technological advancements and the revolution in artificial intelligence (AI) algorithms, LULC classification has transitioned from manual to numerical and digital [22]. The selection of a classification algorithm must align with the specific objectives and constraints of the research. The study aims to enable comparisons of LULC transformations across eight cases. While the field of LULC classification is increasingly influenced by sophisticated deep learning models, their requirement for vast training data presents a challenge for multi-case studies with limited sample sizes. Furthermore, ensuring methodological consistency and result interpretability across all cases is paramount. RF, a proven machine learning algorithm, is particularly suited to this study. Previous research demonstrates its effectiveness in urban land classification, noting its resilience to overfitting and its ability to handle complex spectral signatures with high accuracy [23,24,25]. Consequently, RF is selected for this study to generate a consistent and reliable benchmark for cases comparison, prioritizing analytical robustness and comparative clarity [22].
Additionally, freely accessible satellite data from Landsat and Sentinel, known for their broad coverage and long temporal records, have supported numerous large-scale analyses. However, their spatial resolution limitations (mainly 10–30 m) pose significant challenges in identifying small-scale features [26]. In recent years, emerging satellite platforms like PlanetScope, SkySat, SPOT, QuickBird, and so on have provided higher spatial resolutions (sub-meter to a few meters), greatly enhancing precision in small-scale analyses [27].
In order to ensure the data consistency and provide high-spatial-resolution satellite imagery to minimize unavoidable errors, PlanetScope data were collected from the Planet website (https://www.planet.com/ accessed on 20 January 2025) as the source. Urban revitalization is a dynamic and long-term process. To enable cross-case comparison, the before baseline for each case was defined using the latest available satellite imagery prior to the start of its revitalization project. The study establishes a unified evaluation benchmark: the LULC analysis for all cases is based on data up to December 2024. For completed cases, this cutoff captures their final outcomes. For cases still ongoing, it records the phased results in the whole revitalization process. This approach ensures a fair and consistent way to measure what urban revitalization and policies have achieved so far.
When choosing satellite images for the exact acquisition time of start and end dates, the following points are noted. As vegetation features significantly influence classification because they tend to be more abundant in summer and autumn, the differences between vegetation and other land cover types become more pronounced during the two seasons, facilitating better differentiation. Cloud also severely affects the classification. Therefore, to enhance analytical accuracy and reliability, the thesis tended to choose cloud-free or low-cloud imagery from summer and autumn for data analysis. It is specifically noted that some of the selected cases are still undergoing revitalization. In such cases, the after-revitalization date is chosen as the latest available date that meets the above requirements as of now.
Additionally, the World Imagery Wayback (https://livingatlas.arcgis.com/wayback/ accessed on 20 January 2025) dates used as historical imagery for verifying the accuracy of the LULC classification maps have been chosen to be as close as possible to the PlanetScope imagery date. While some minor changes may still exist, the overall differences are minimal. Table 1 shows the final acquisition date results.

2.3. Research Methodology

The PlanetScope data products used in this study are provided in ready-to-use format, having been pre-processed to the Level 3B surface reflectance standard, which includes geometric, radiometric, and atmospheric corrections. Cloud-free images were specifically selected for analysis. Four bands—red, green, blue, and near-infrared, corresponding to band 1, band 2, band 3, and band 4—offer 3 m spatial resolution data, providing a unique data source well-suited for characterizing heterogeneous urban spaces. These properties make the data particularly valuable for detailed urban spatial analysis at fine spatial and temporal scales [27]. Subsequently, supervised land cover classification was performed in ArcGIS Pro (version 3.1.7). All images were georeferenced using the WGS 1984 geographic coordinate system.
As we know, the Random Forest method is a combination of tree predictors such that each tree depends on the values of a random vector sampled independently and with the same distribution for all trees in the forest [28]. Its advantages include effectively handling high-dimensional data, reducing overfitting, and demonstrating robust performance against noisy data. Due to its high accuracy and stability, the RF has increasingly become one of the most applied machine learning algorithms in classification studies like LULC changes [29].
The LULC classification was performed using the Image Classification Wizard tool within the ArcGIS Pro platform, employing the Random Forest algorithm. Since the study areas are within urban boundaries, the land cover types are relatively simple. For convenience, only three LULC classification categories were defined: water, vegetation, and built-up areas. Classification system of LULC refers to Table 2. True color and false color imagery were used to highlight specific land cover features when choosing training fields for training samples in classification. Additionally, the recognition of training fields was based on the authors’ experience. The model was trained with the following parameter configuration: the number of trees was set to 50 to balance model performance and computational cost; the maximum depth of each tree was limited to 30 to prevent overfitting; and the maximum number of samples per class was set to 1000 to ensure balanced learning.
Accuracy assessment serves to check the quality of classification maps [29]. Using a stratified random sampling method, over 90 validation points were collected for the error matrix of each classification map. These validation points were cross-verified with high-resolution historical imagery from the website World Imagery Wayback to assess the reliability of LULC maps. Through computing the confusion matrix, the overall accuracy and Kappa coefficient were derived as shown in Table 3. An overall accuracy exceeding 0.85 is considered acceptable. The kappa coefficient typically falls within the range of 0.61–0.80 for moderate agreement and above 0.81 for substantial to almost perfect agreement [30]. For robust and credible classification, achieving both high overall accuracy and a kappa coefficient of at least 0.61 is recommended. All of the results (kappa coefficient and overall accuracy) fell within the acceptable ranges, demonstrating the reliability of the LULC analysis. The detailed LULC maps and transformations can be found in the Results Section. The flowchart of the entire data analysis process is shown in Figure 1.

3. Results

3.1. China

3.1.1. Beijing

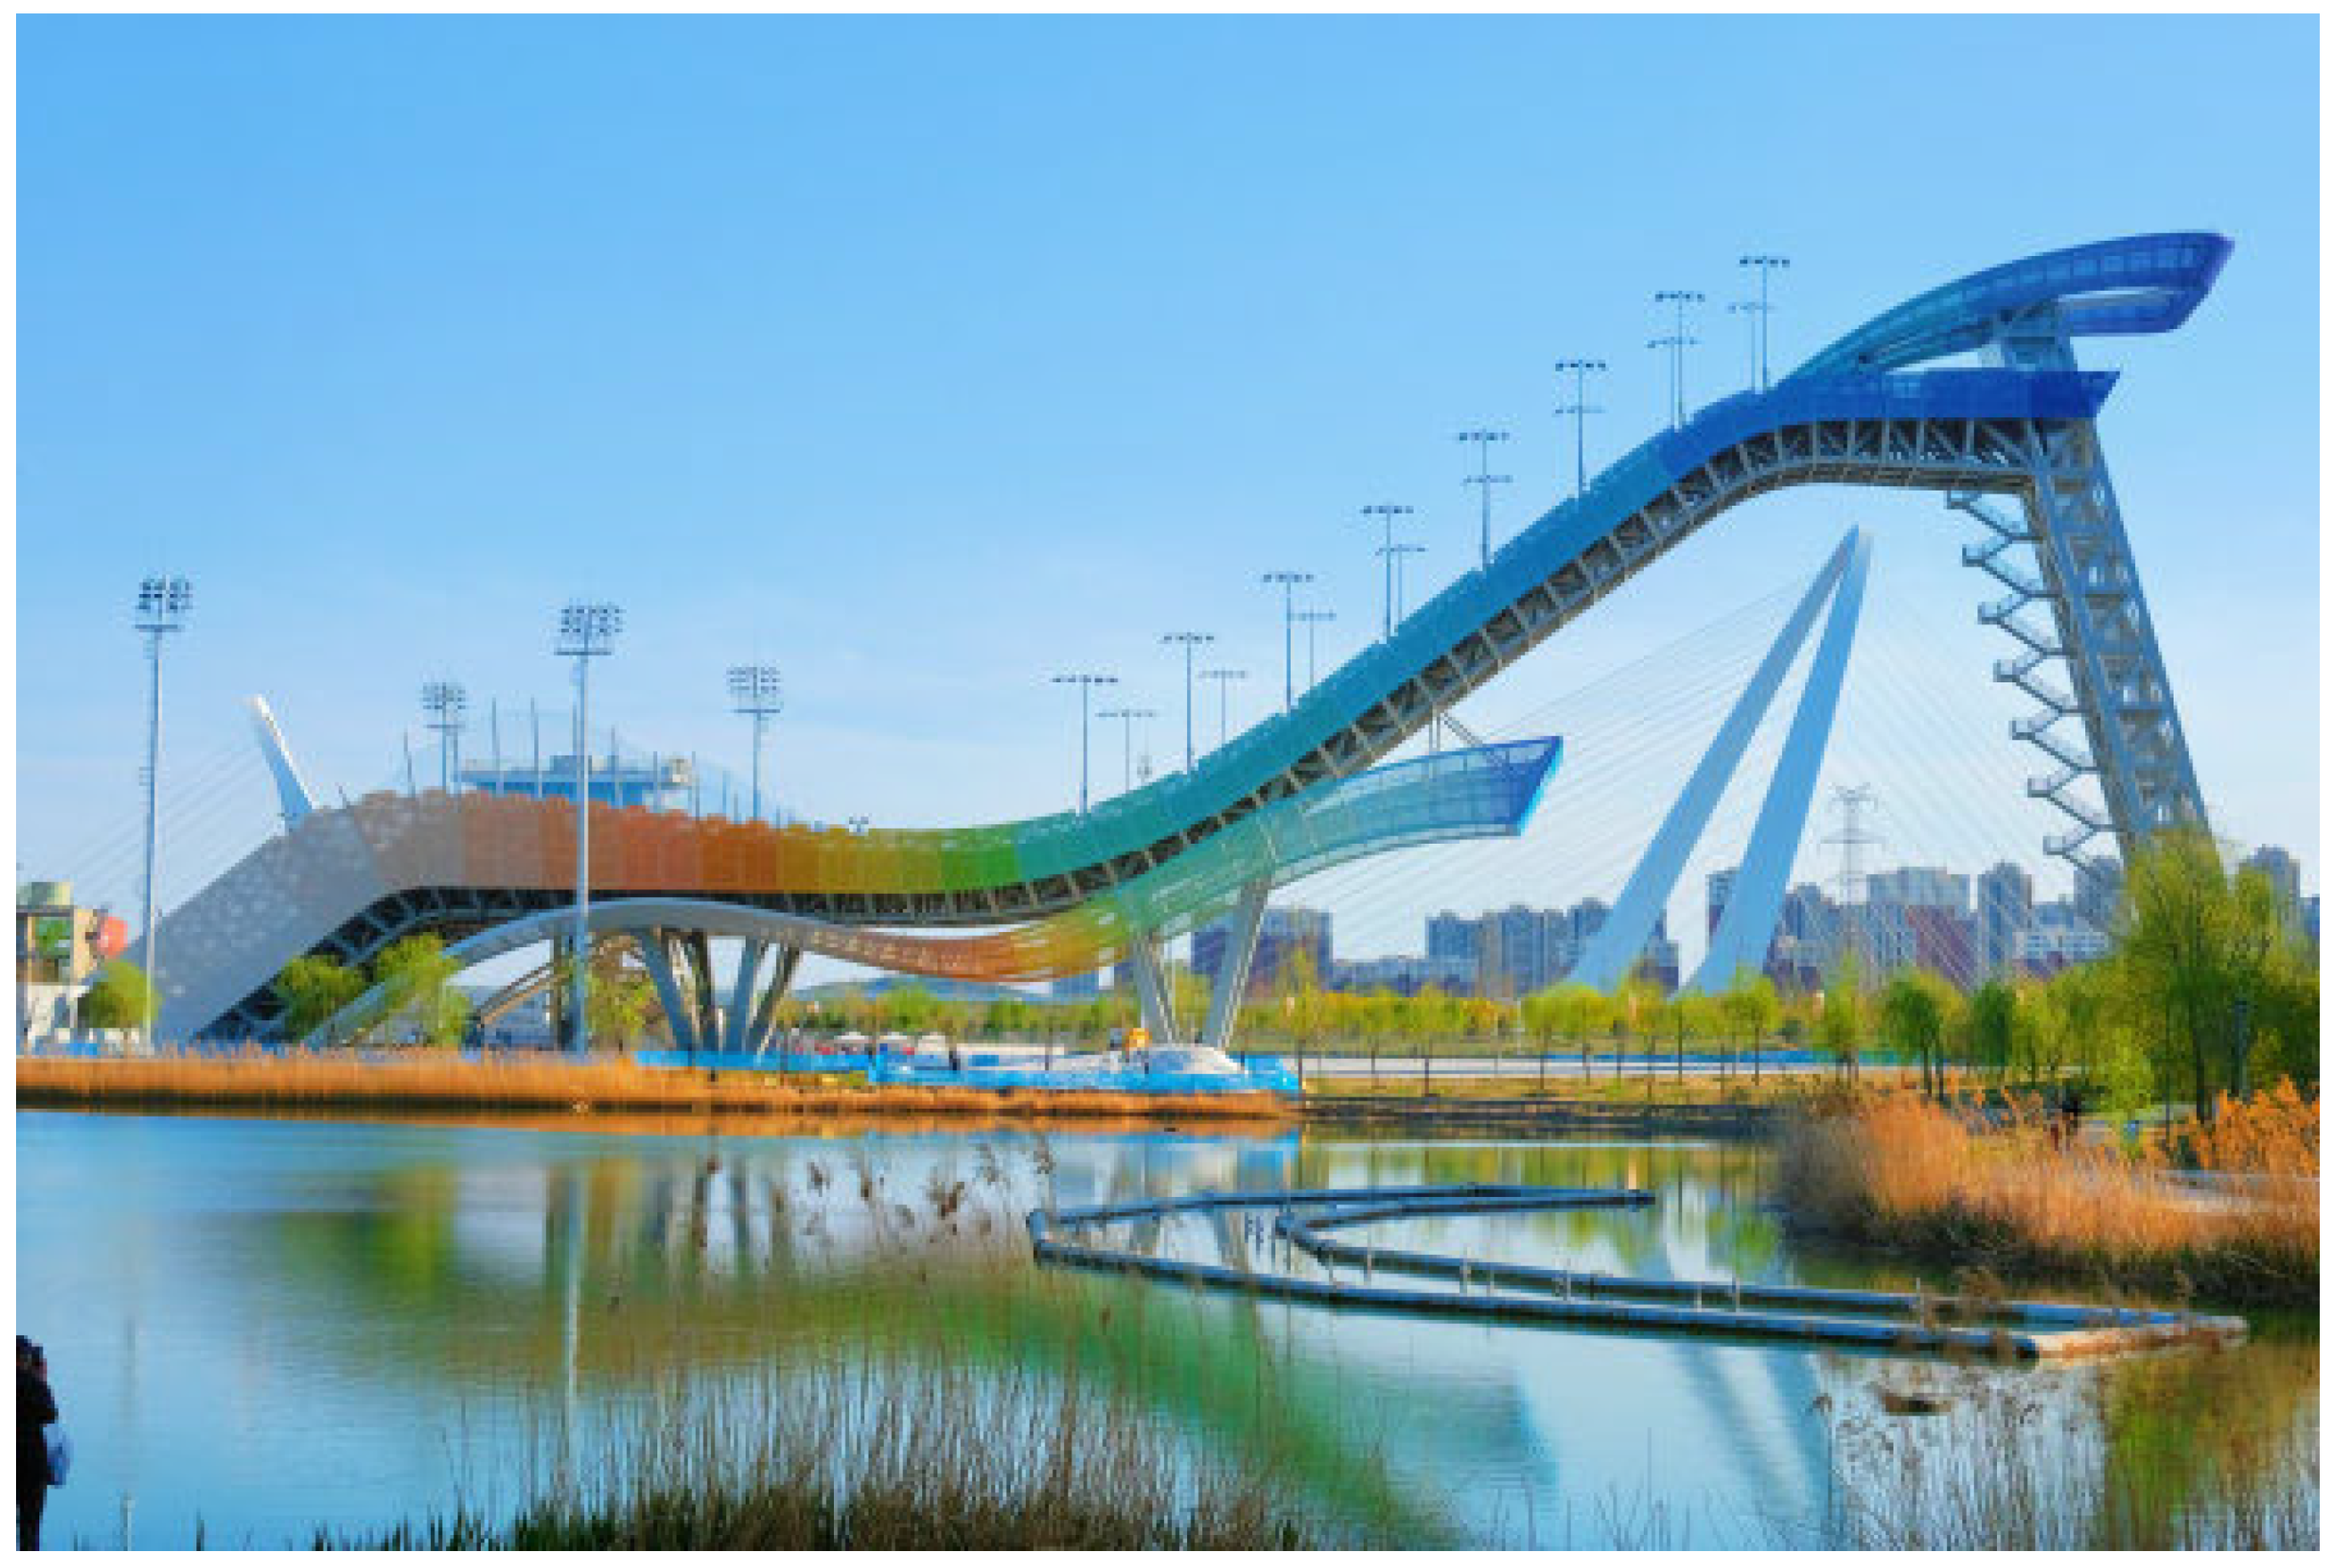
The Shougang Park, an 8.63 km2 area in the western and southern parts of Beijing, is a century-old industrial site formerly operated by Shougang Group (Figure 2). Relocated prior to the 2008 Summer Olympics for environmental reasons, its industrial structures were preserved. The park’s renewal began when Beijing won the bid for the 2022 Winter Olympics, designating it as a competition venue (Figure A3).
This transformation was formalized in 2017 by the Framework Agreement on Preparing for the 2022 Winter Olympics and Establishing a National Sports Industry Demonstration Zone, committing to a green transition aimed at developing a National Sports Industry Demonstration Zone and a post-industrial cultural hub [31].
To quantify this transformation, 4 August 2017 (before revitalization) and 10 August 2022 (after revitalization) were selected to analyze the transformation in Figure 2.

3.1.2. Nanjing

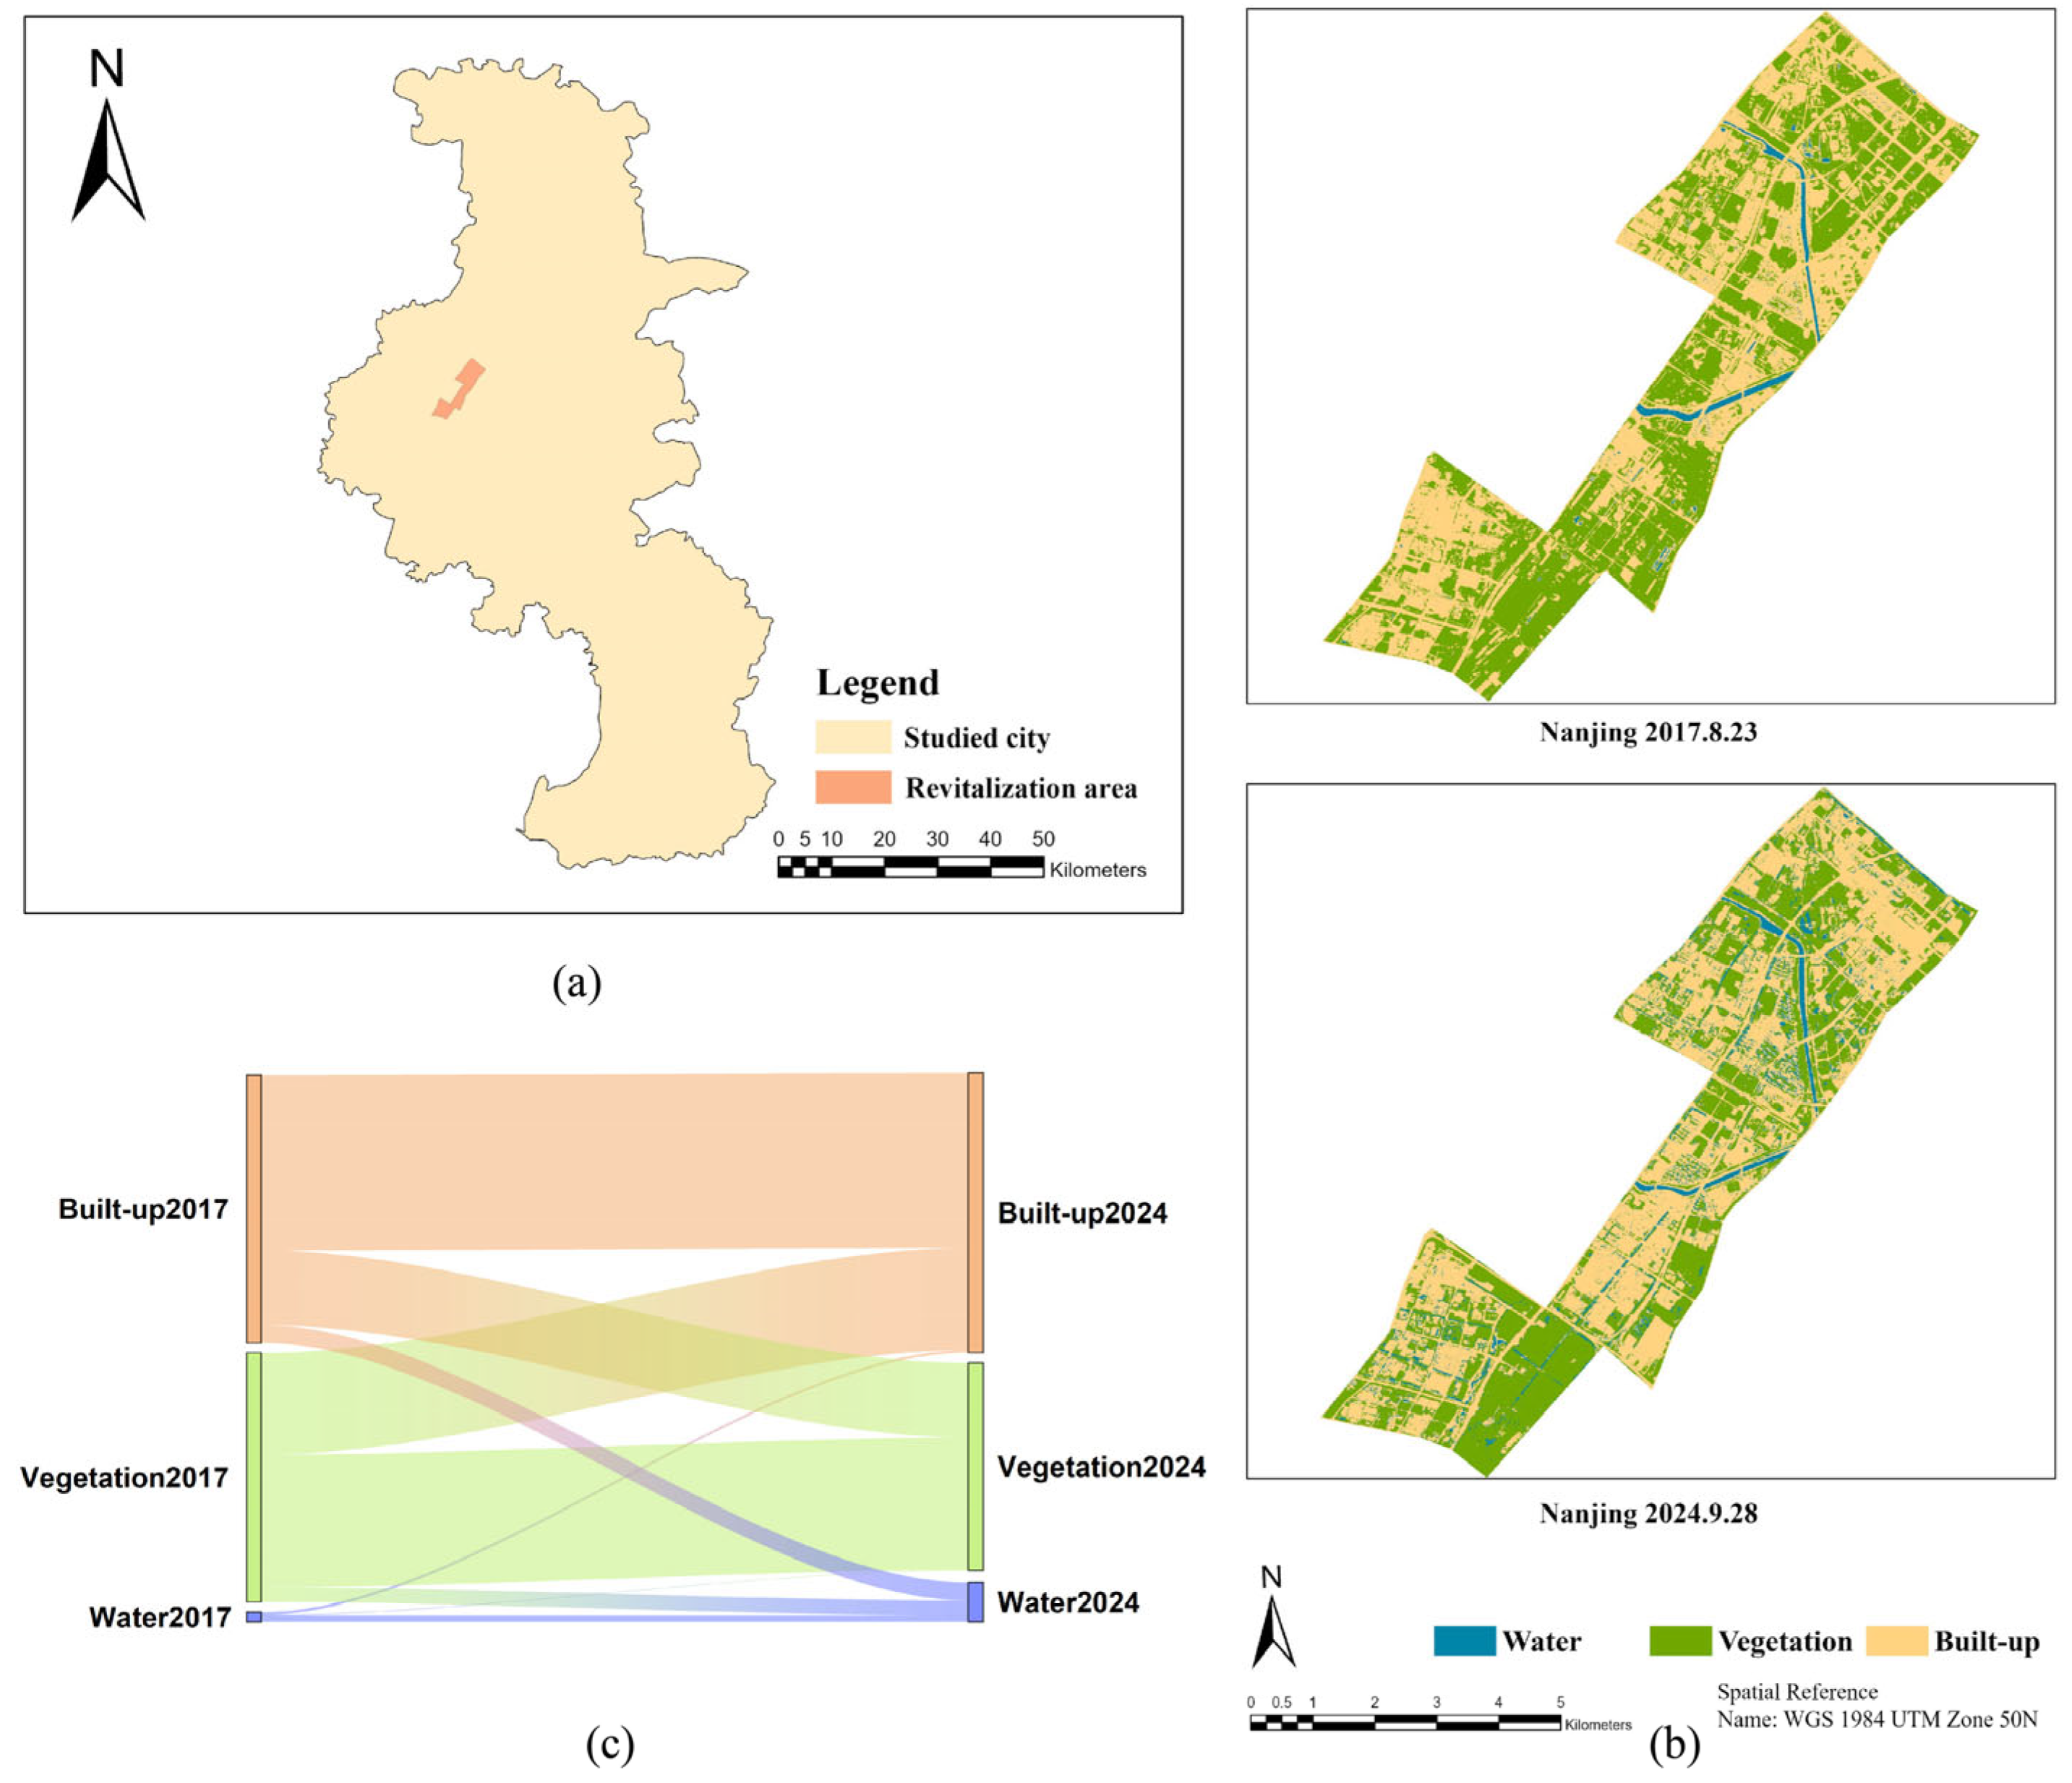
The 33.2 km2 Core Area of Nanjing Jiangbei New Area (Figure 3) serves as the functional and development center of the national-level new zone. Its evolution can be traced through key policy milestones: initially approved as a 16.1 km2 national-level new area by the State Council in 2015, it was expanded to 33.2 km2 in 2017. The Master Plan for the Core Area of Nanjing Jiangbei New Area and Surrounding Areas [32] further positioned it as an engine for cross-river integration, emphasizing coordinated economic, functional, and ecological development. This study examines the expanded Core Area using PlanetScope imagery from 14 September 2017 and 2 October 2024 to analyze spatial transformation under the revitalization, with results shown in Figure 3.

3.2. Poland

To promote urban development, Poland introduced the Revitalization Act on 9 October 2015, which defines revitalization as “the process of bringing degraded areas out of a state of crisis, carried out comprehensively, through integrated activities for the benefit of the local community, space and economy, territorially concentrated, carried out by revitalization stakeholders based on a revitalization program” [19]. The Act also outlines the legal framework for urban revitalization in Poland, defining its procedures, objectives, stakeholders, and responsibilities of local governments. It emphasizes the integration of social, economic, and spatial development, with a focus on public participation [33]. Over the following years, it underwent several amendments to adapt to socioeconomic changes and housing development needs.

3.2.1. Poznań

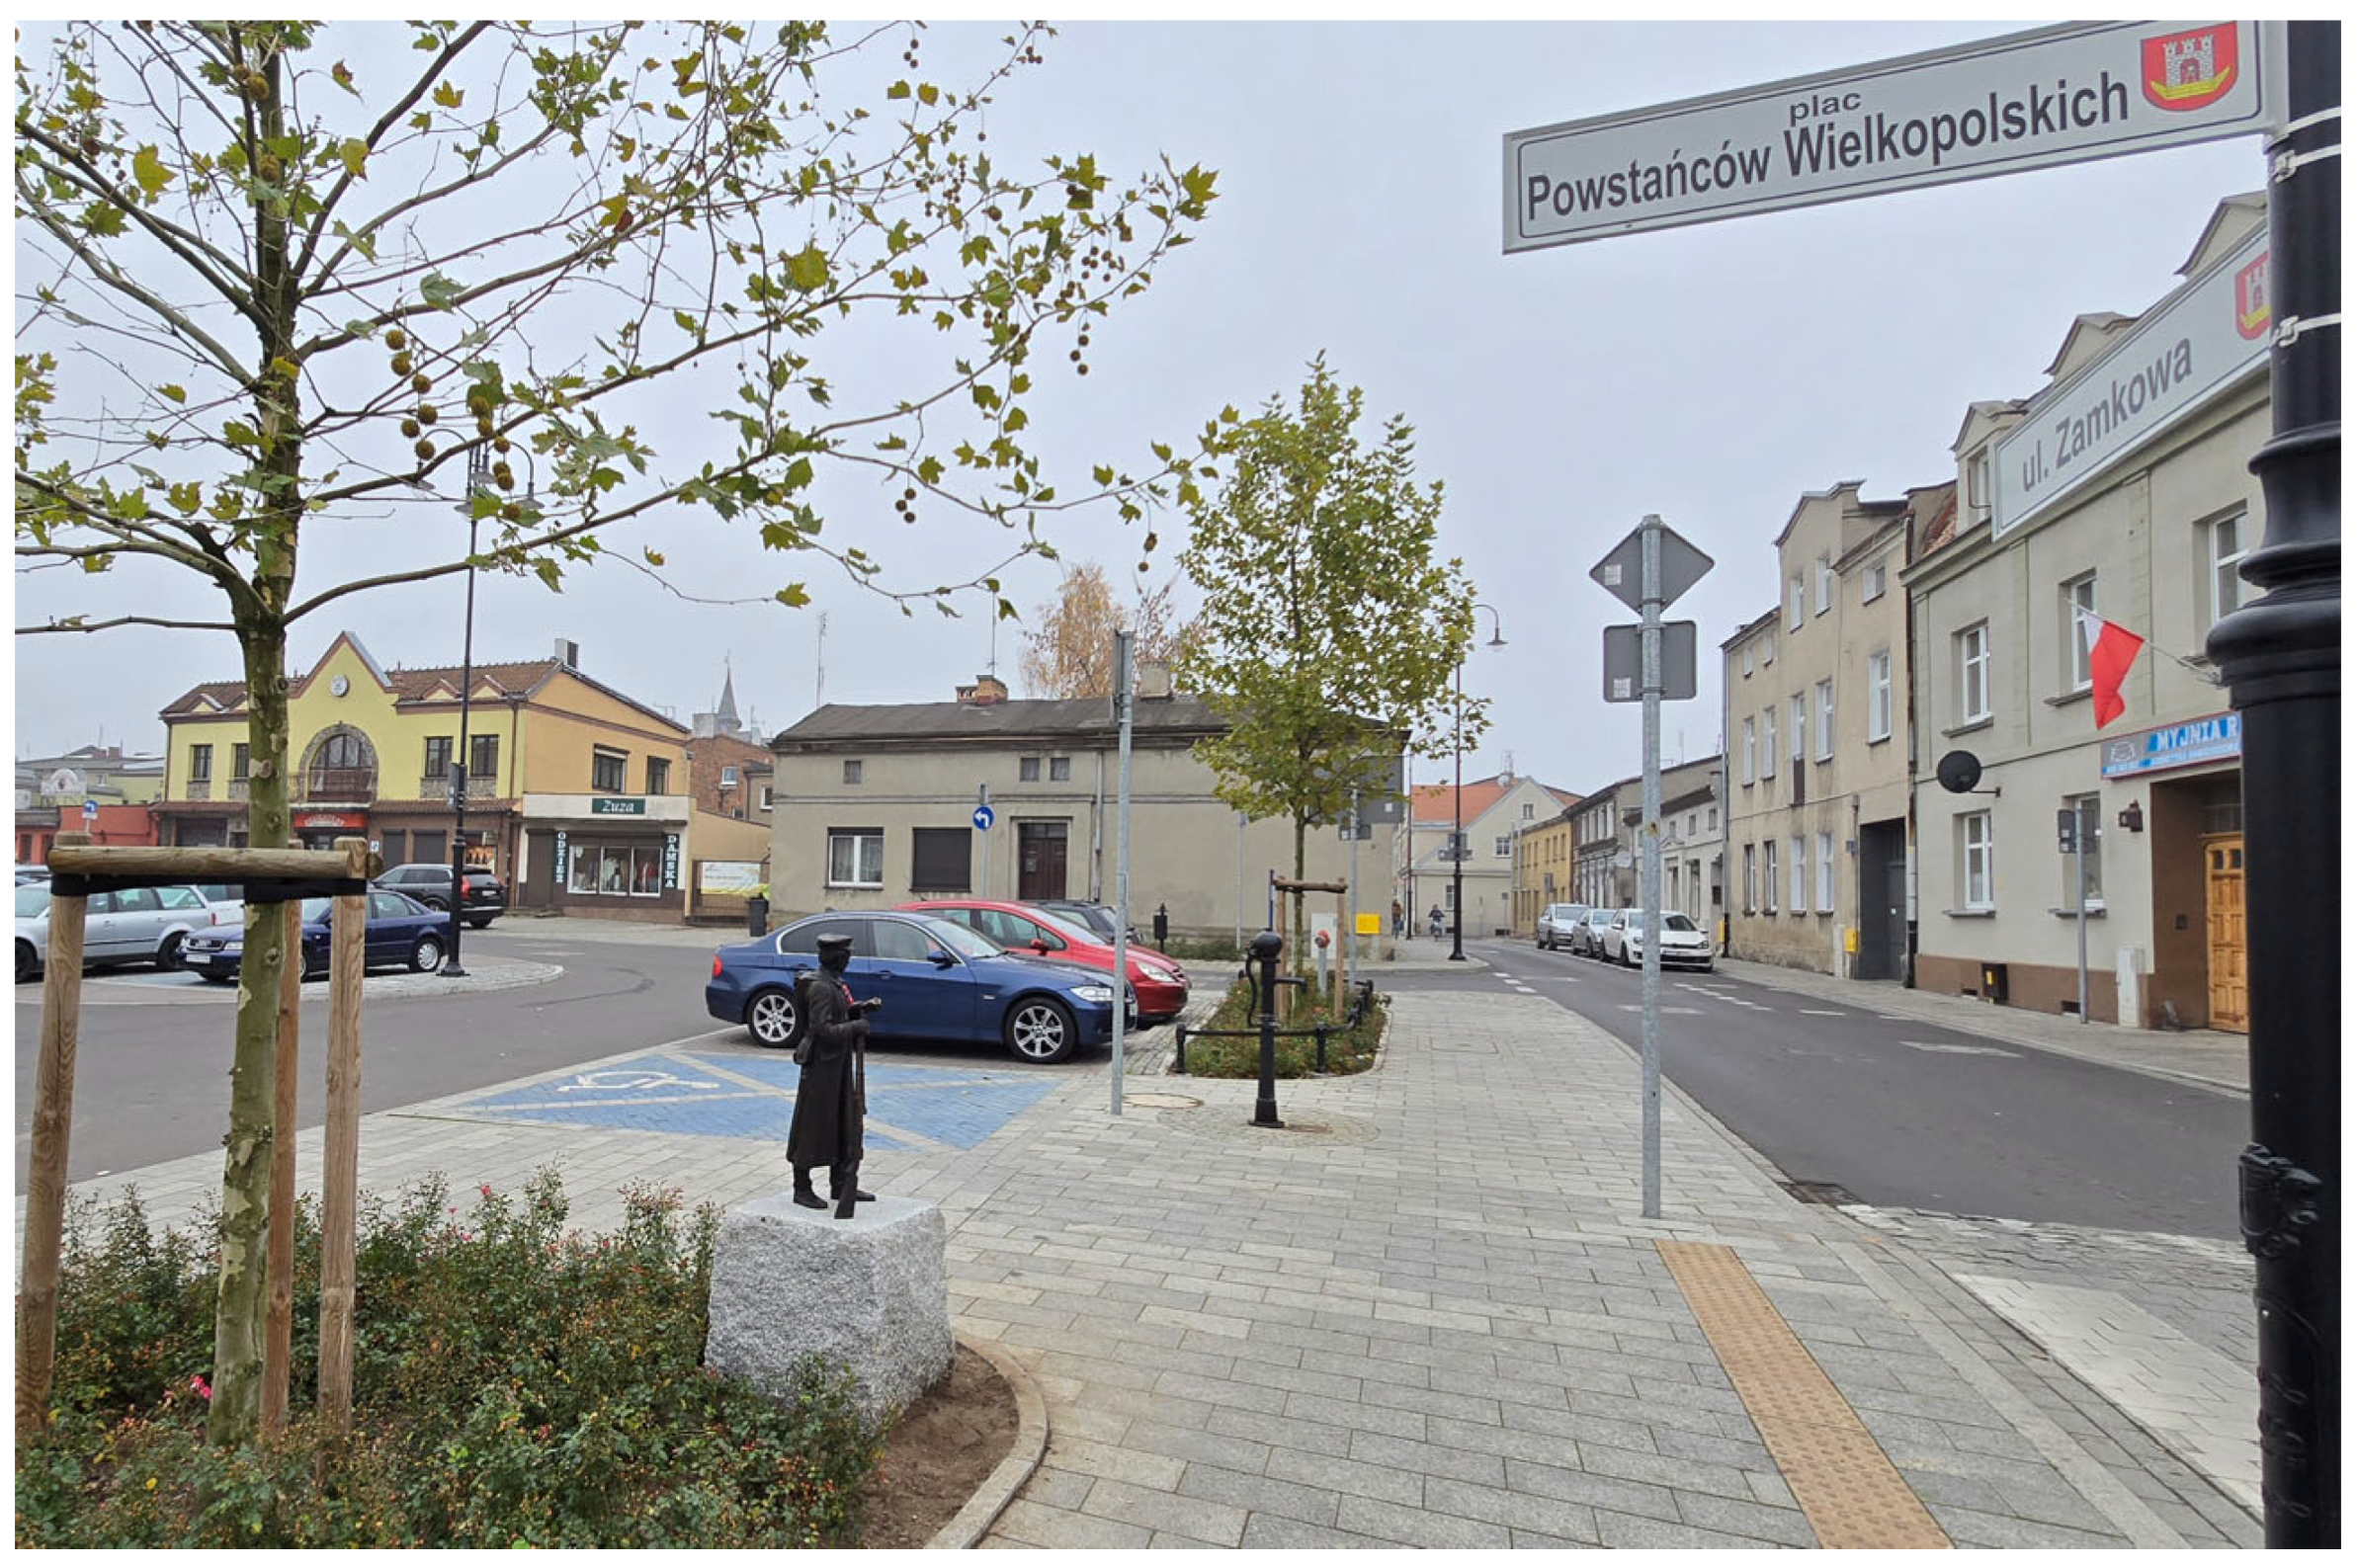
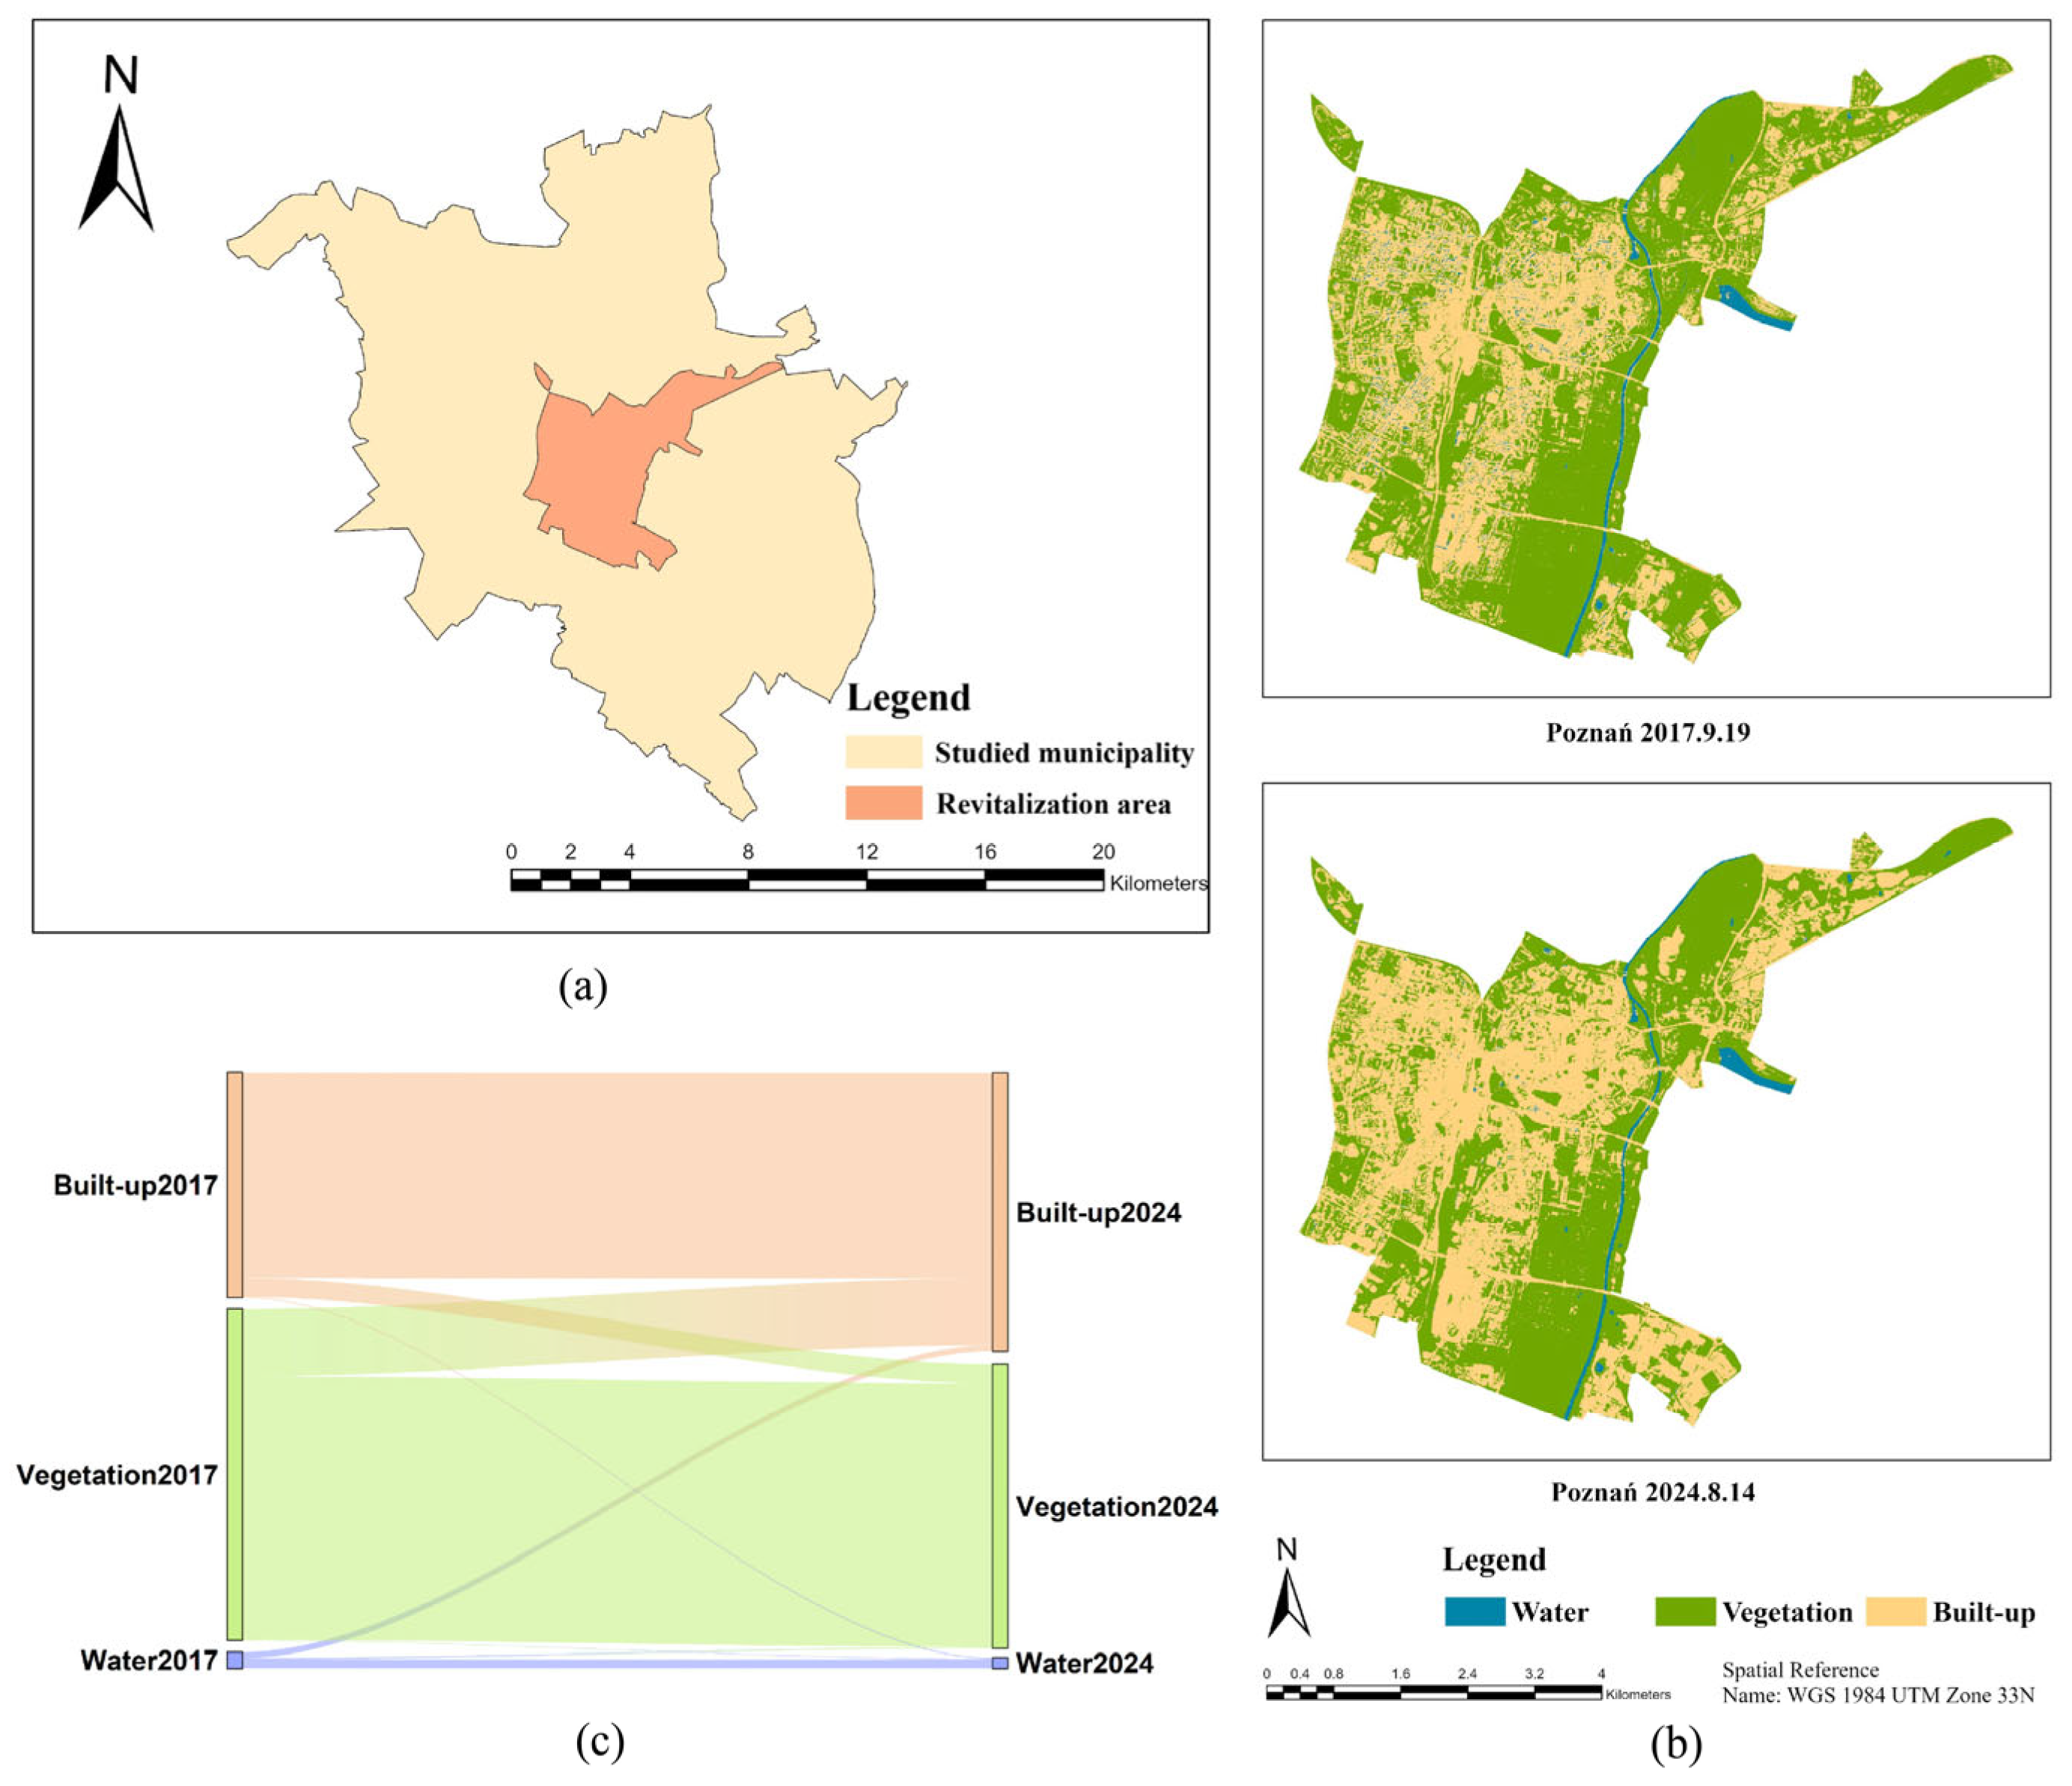
Located in western Poland (Figure 4), Poznań is a historic municipality with over eight centuries of cultural heritage. Under “The Municipal Revitalization Program for the Municipality of Poznań”, the program has identified a 24.62 km2 area in its central districts, including the old town with 114,514 residents [34].
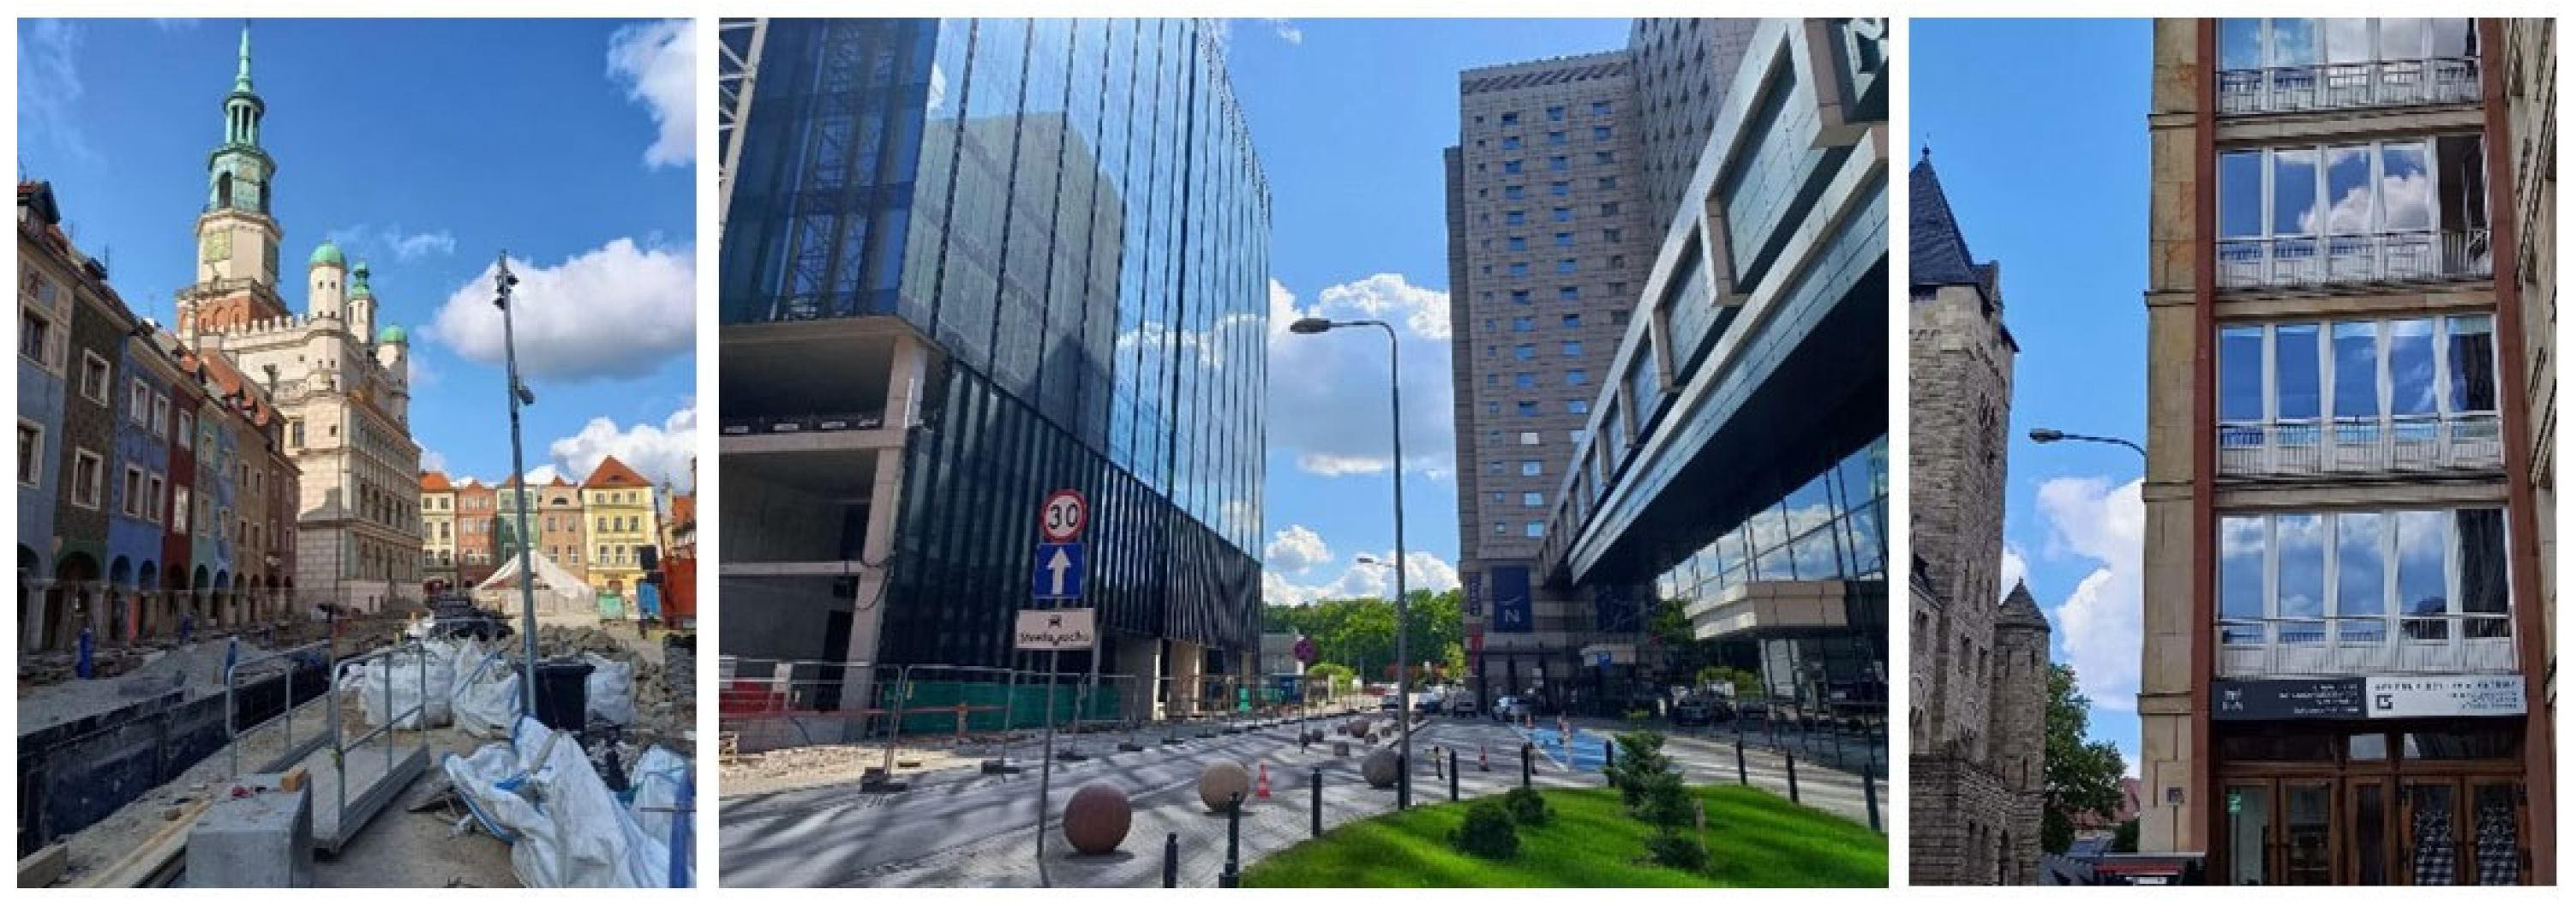
The program implemented a multi-phase revitalization strategy spanning short-term (2018–2020), medium-term (2021–2025), and long-term (2026–2030) initiatives. Key objectives emphasize the creation of safe public spaces, enhanced living conditions, improved housing stock, economic and cultural activation, heritage preservation, community engagement, and sustainable transportation systems (Figure A4).
As the program remains ongoing, this study utilizes satellite imagery from 19 September 2017 and 14 August 2024 (phased results). The LULC maps before and after revitalization are shown in Figure 4.

3.2.2. Kraków

Kraków, situated in southern Poland (Figure 5) as the nation’s second-largest municipality and historical–cultural hub, is implementing an urban revitalization program to establish itself as a sustainable European metropolis with high living standards and a modern economy driven by scientific and cultural potential. Approved through Resolution No. CXXI/1906/14 by the Municipality Council on 5 November 2014, and updated by a Council decision on 11 January 2017, this revitalization plan spans from 2017 to 2023 [35].
The revitalization area comprises three distinct sectors: “Stare Miasto-Kazimierz” and “Stare Podgórze-Zabłocie” in the central–western districts, and “Stara Nowa Huta” in the eastern sector. Figure 5 shows the LULC results before and after revitalization in the western and eastern parts of the Kraków revitalization area.

3.2.3. Wągrowiec

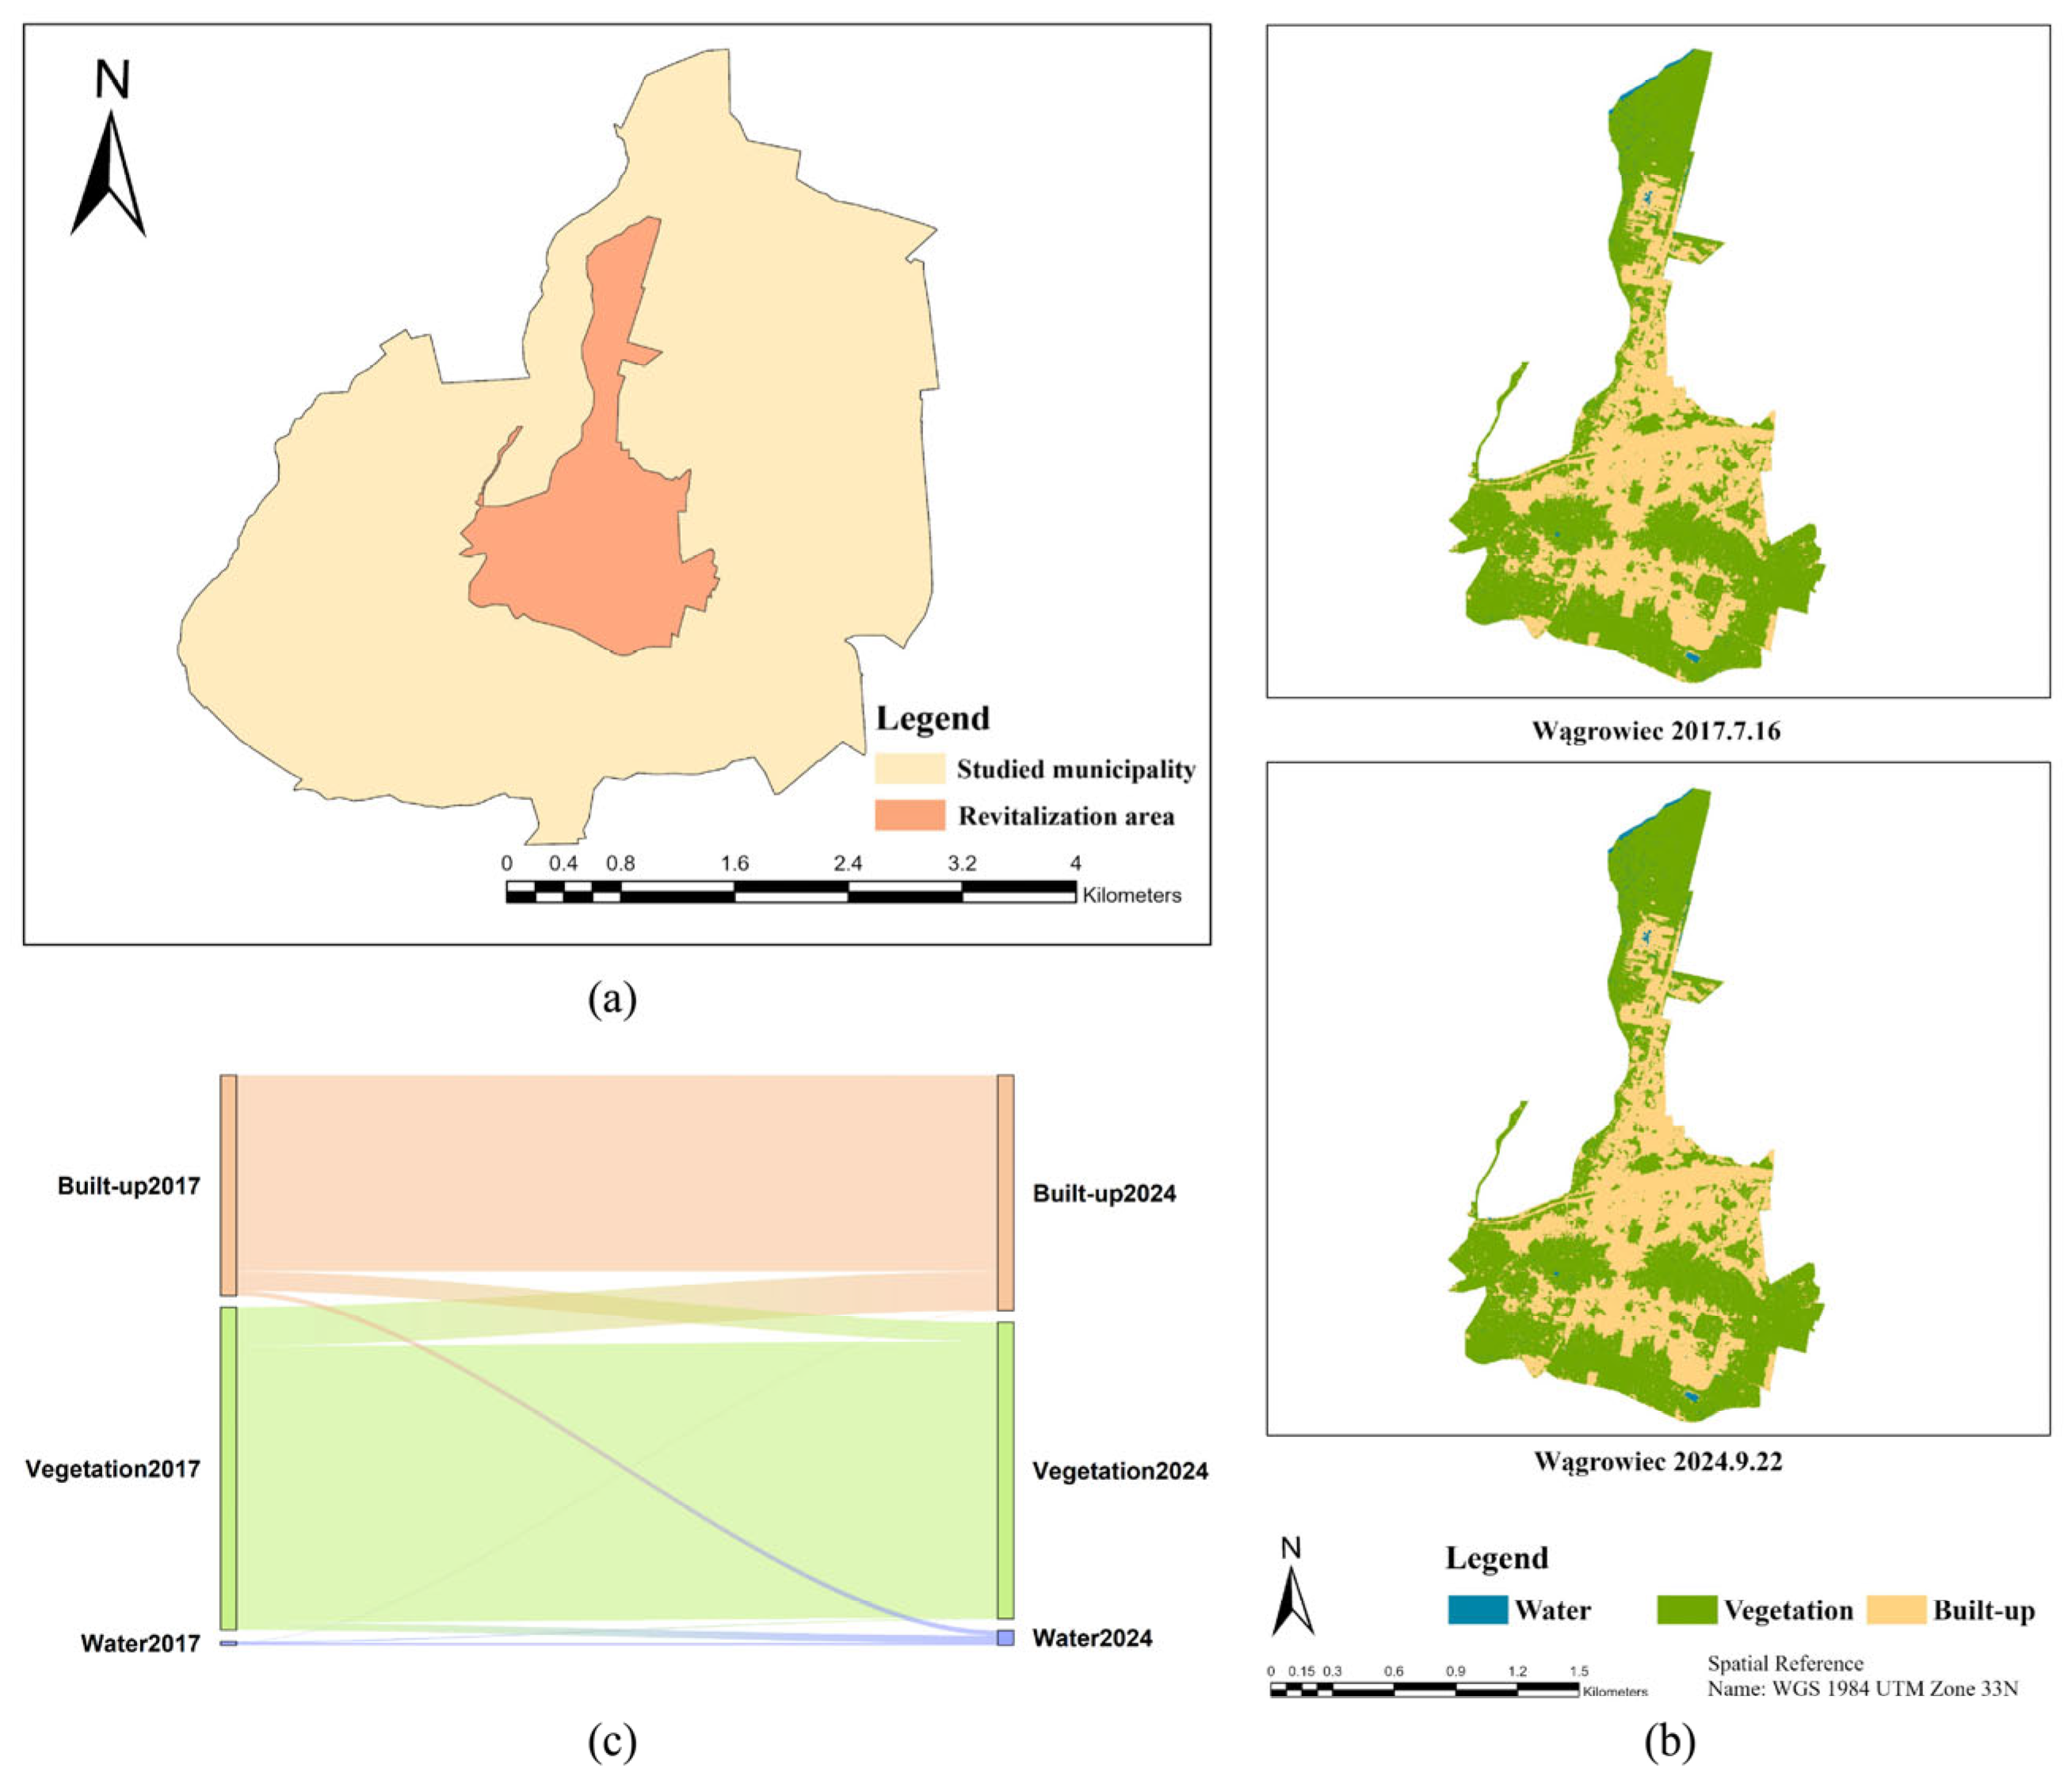
Based on the Local Revitalization Program of the Municipality of Wągrowiec for the years 2017–2025 [36], a revitalization area was designated encompassing the units of Starówka Północ, Starówka Południe and Kościuszki, covering 2.221 km2 with 4481 residents (Figure 6). This area faces challenges—including high unemployment, insufficient educational resources, outdated infrastructure, and poor environmental quality—which exceed the municipal averages.
The main objectives of the revitalization plan include implementing measures such as expanding educational facilities and cultural activity centers, supporting entrepreneurship, attracting investments, developing tourism, protecting the natural environment, creating green and open public spaces, improving public transportation, and so on. The aim is to transform the revitalization area into a modernized, vibrant hub of the town.
Therefore, the data from 16 July 2017 and 22 September 2024 were chosen to observe the interim changes brought by the revitalization (Figure 6).

3.2.4. Swarzędz

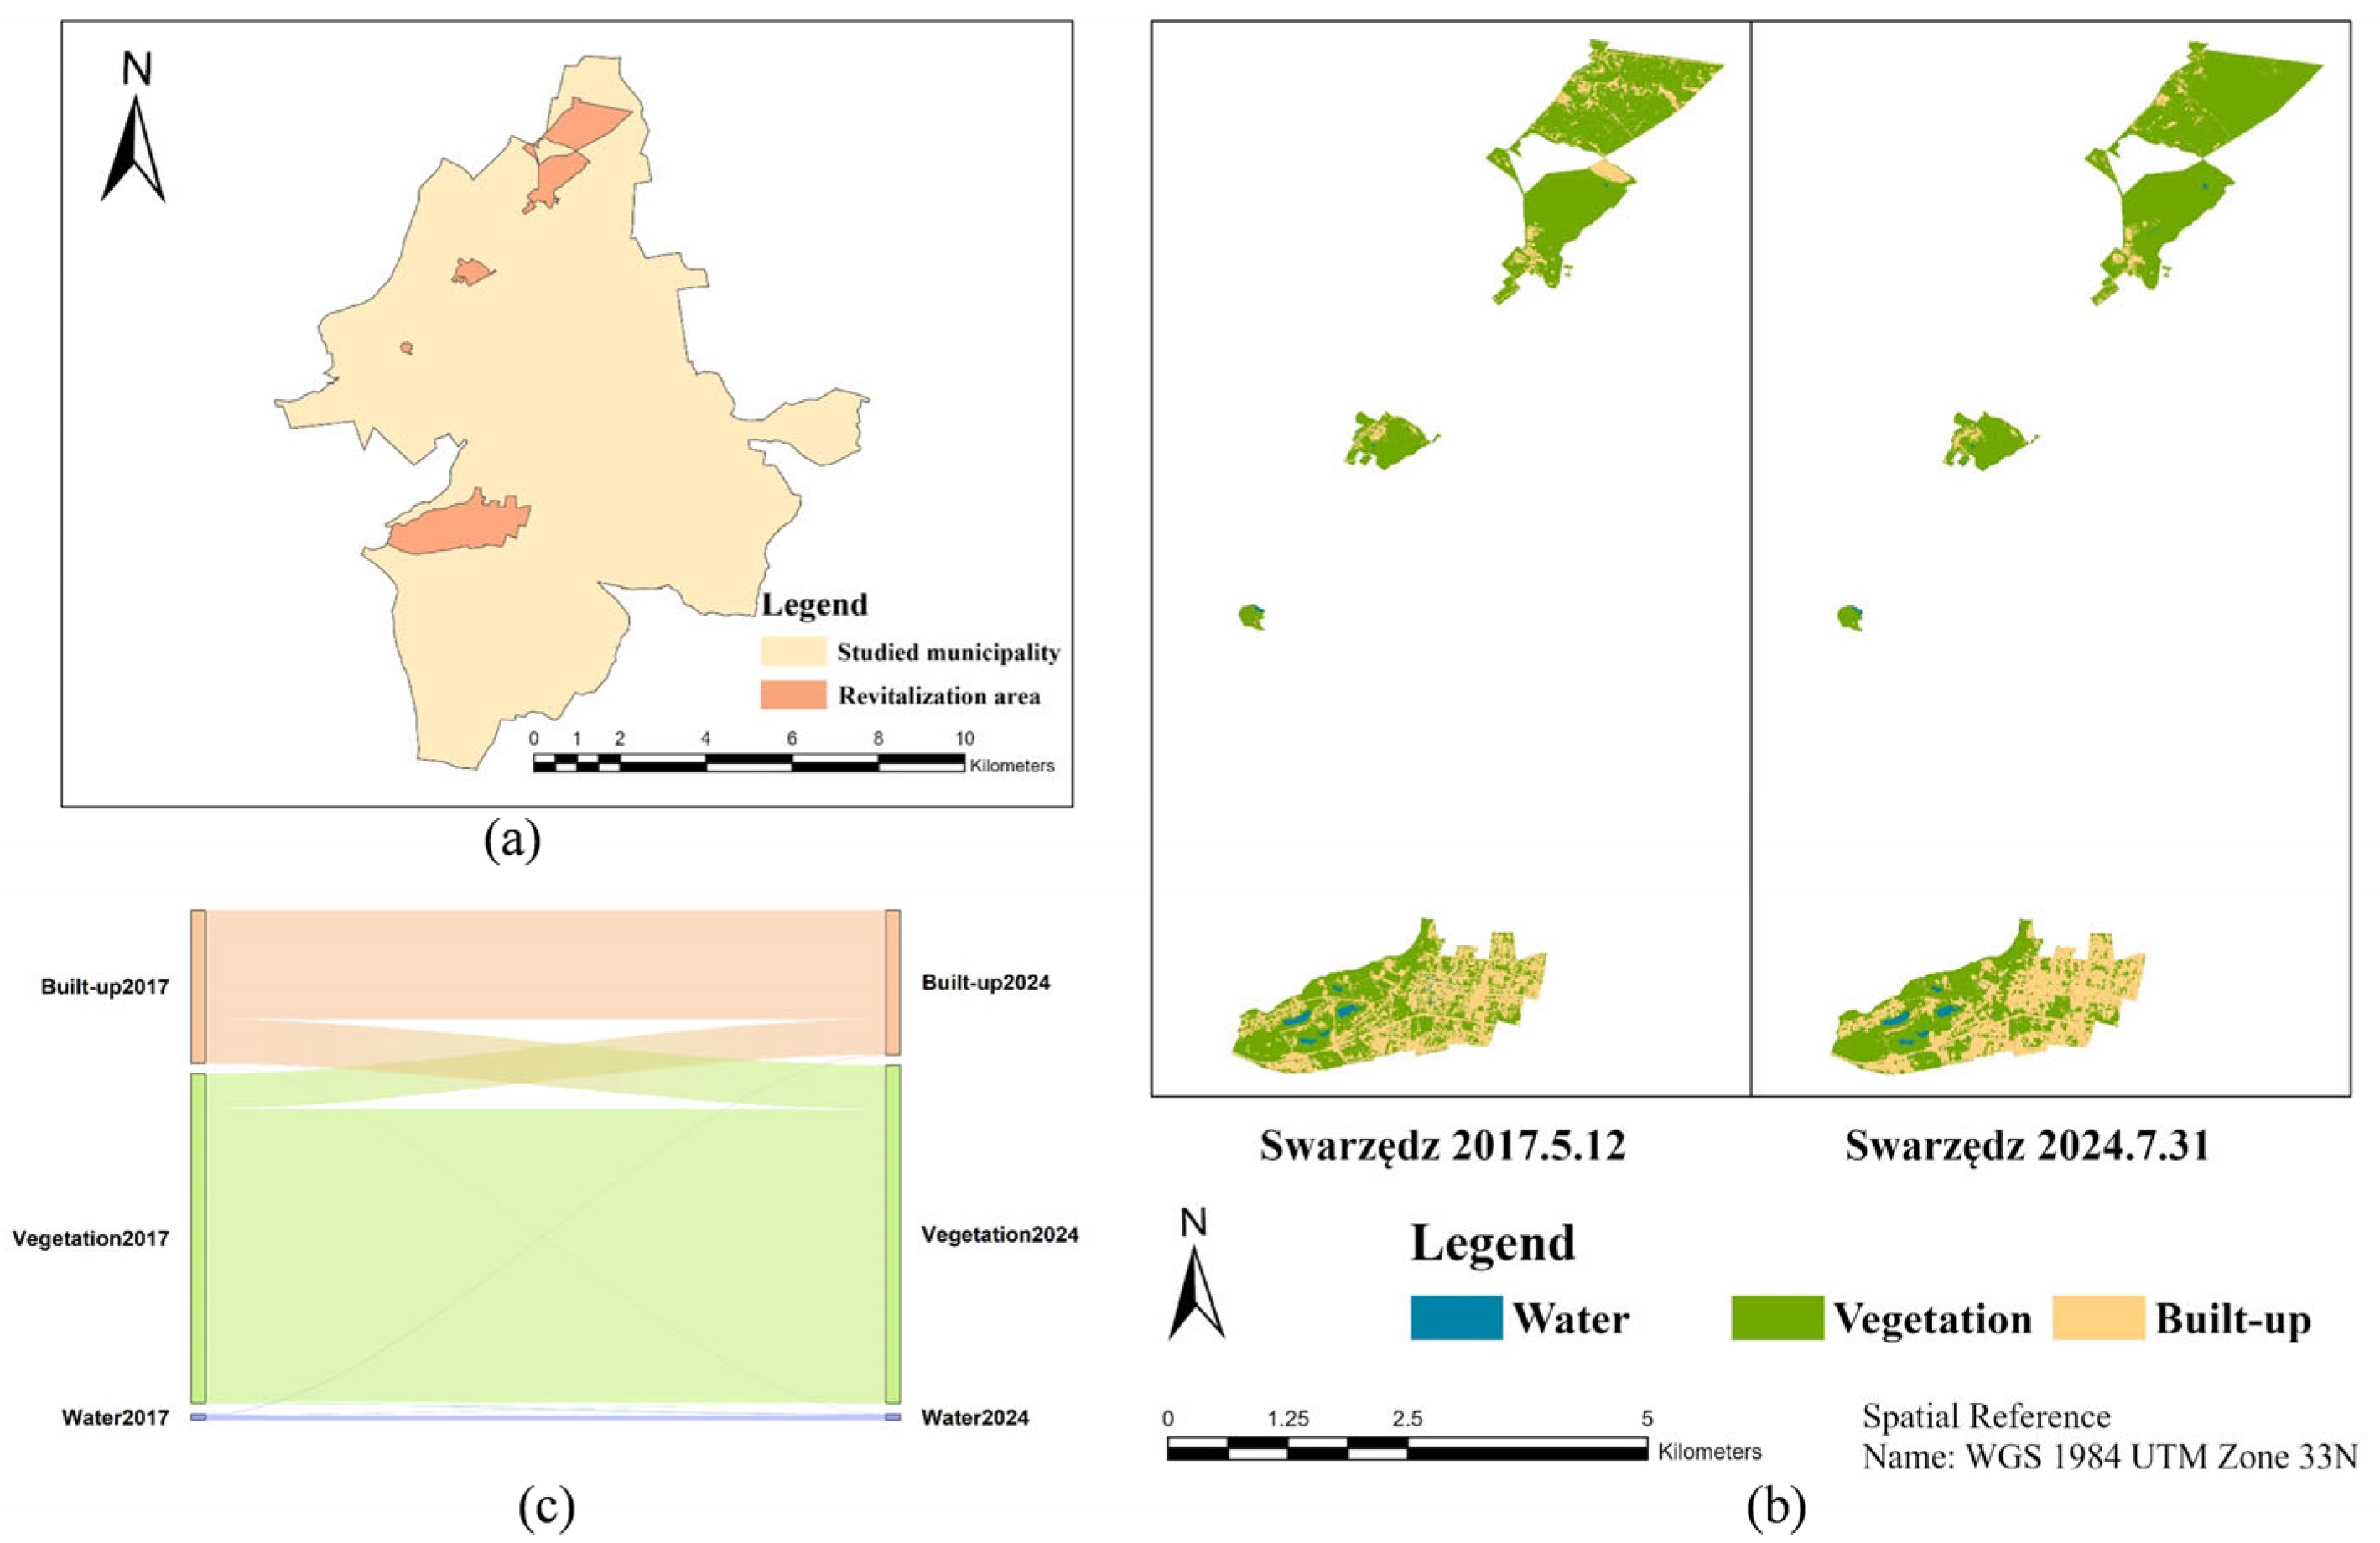
Swarzędz, an urban–rural municipality in western Poland (Figure 7), has implemented its Local Revitalization Program of Swarzędza for the years 2017–2023 across six subzones in 5.3778 km2: two within Swarzędz town, two in Wierzenica village, and one each in Wierzonka and Karłowice villages [37].
Through collaborative governance, the program focuses on enhancing public spaces, upgrading infrastructure, and fostering socioeconomic–cultural vitality. Post-revitalization areas aim to create inclusive living environments with diversified community activities, particularly targeting youth retention through improved amenities (Figure A5 and Figure A6).
To observe the changes due to revitalization, 12 May 2017 and 31 July 2024 are chosen for LULC analysis and the results are shown in Figure 7.

3.2.5. Parczew

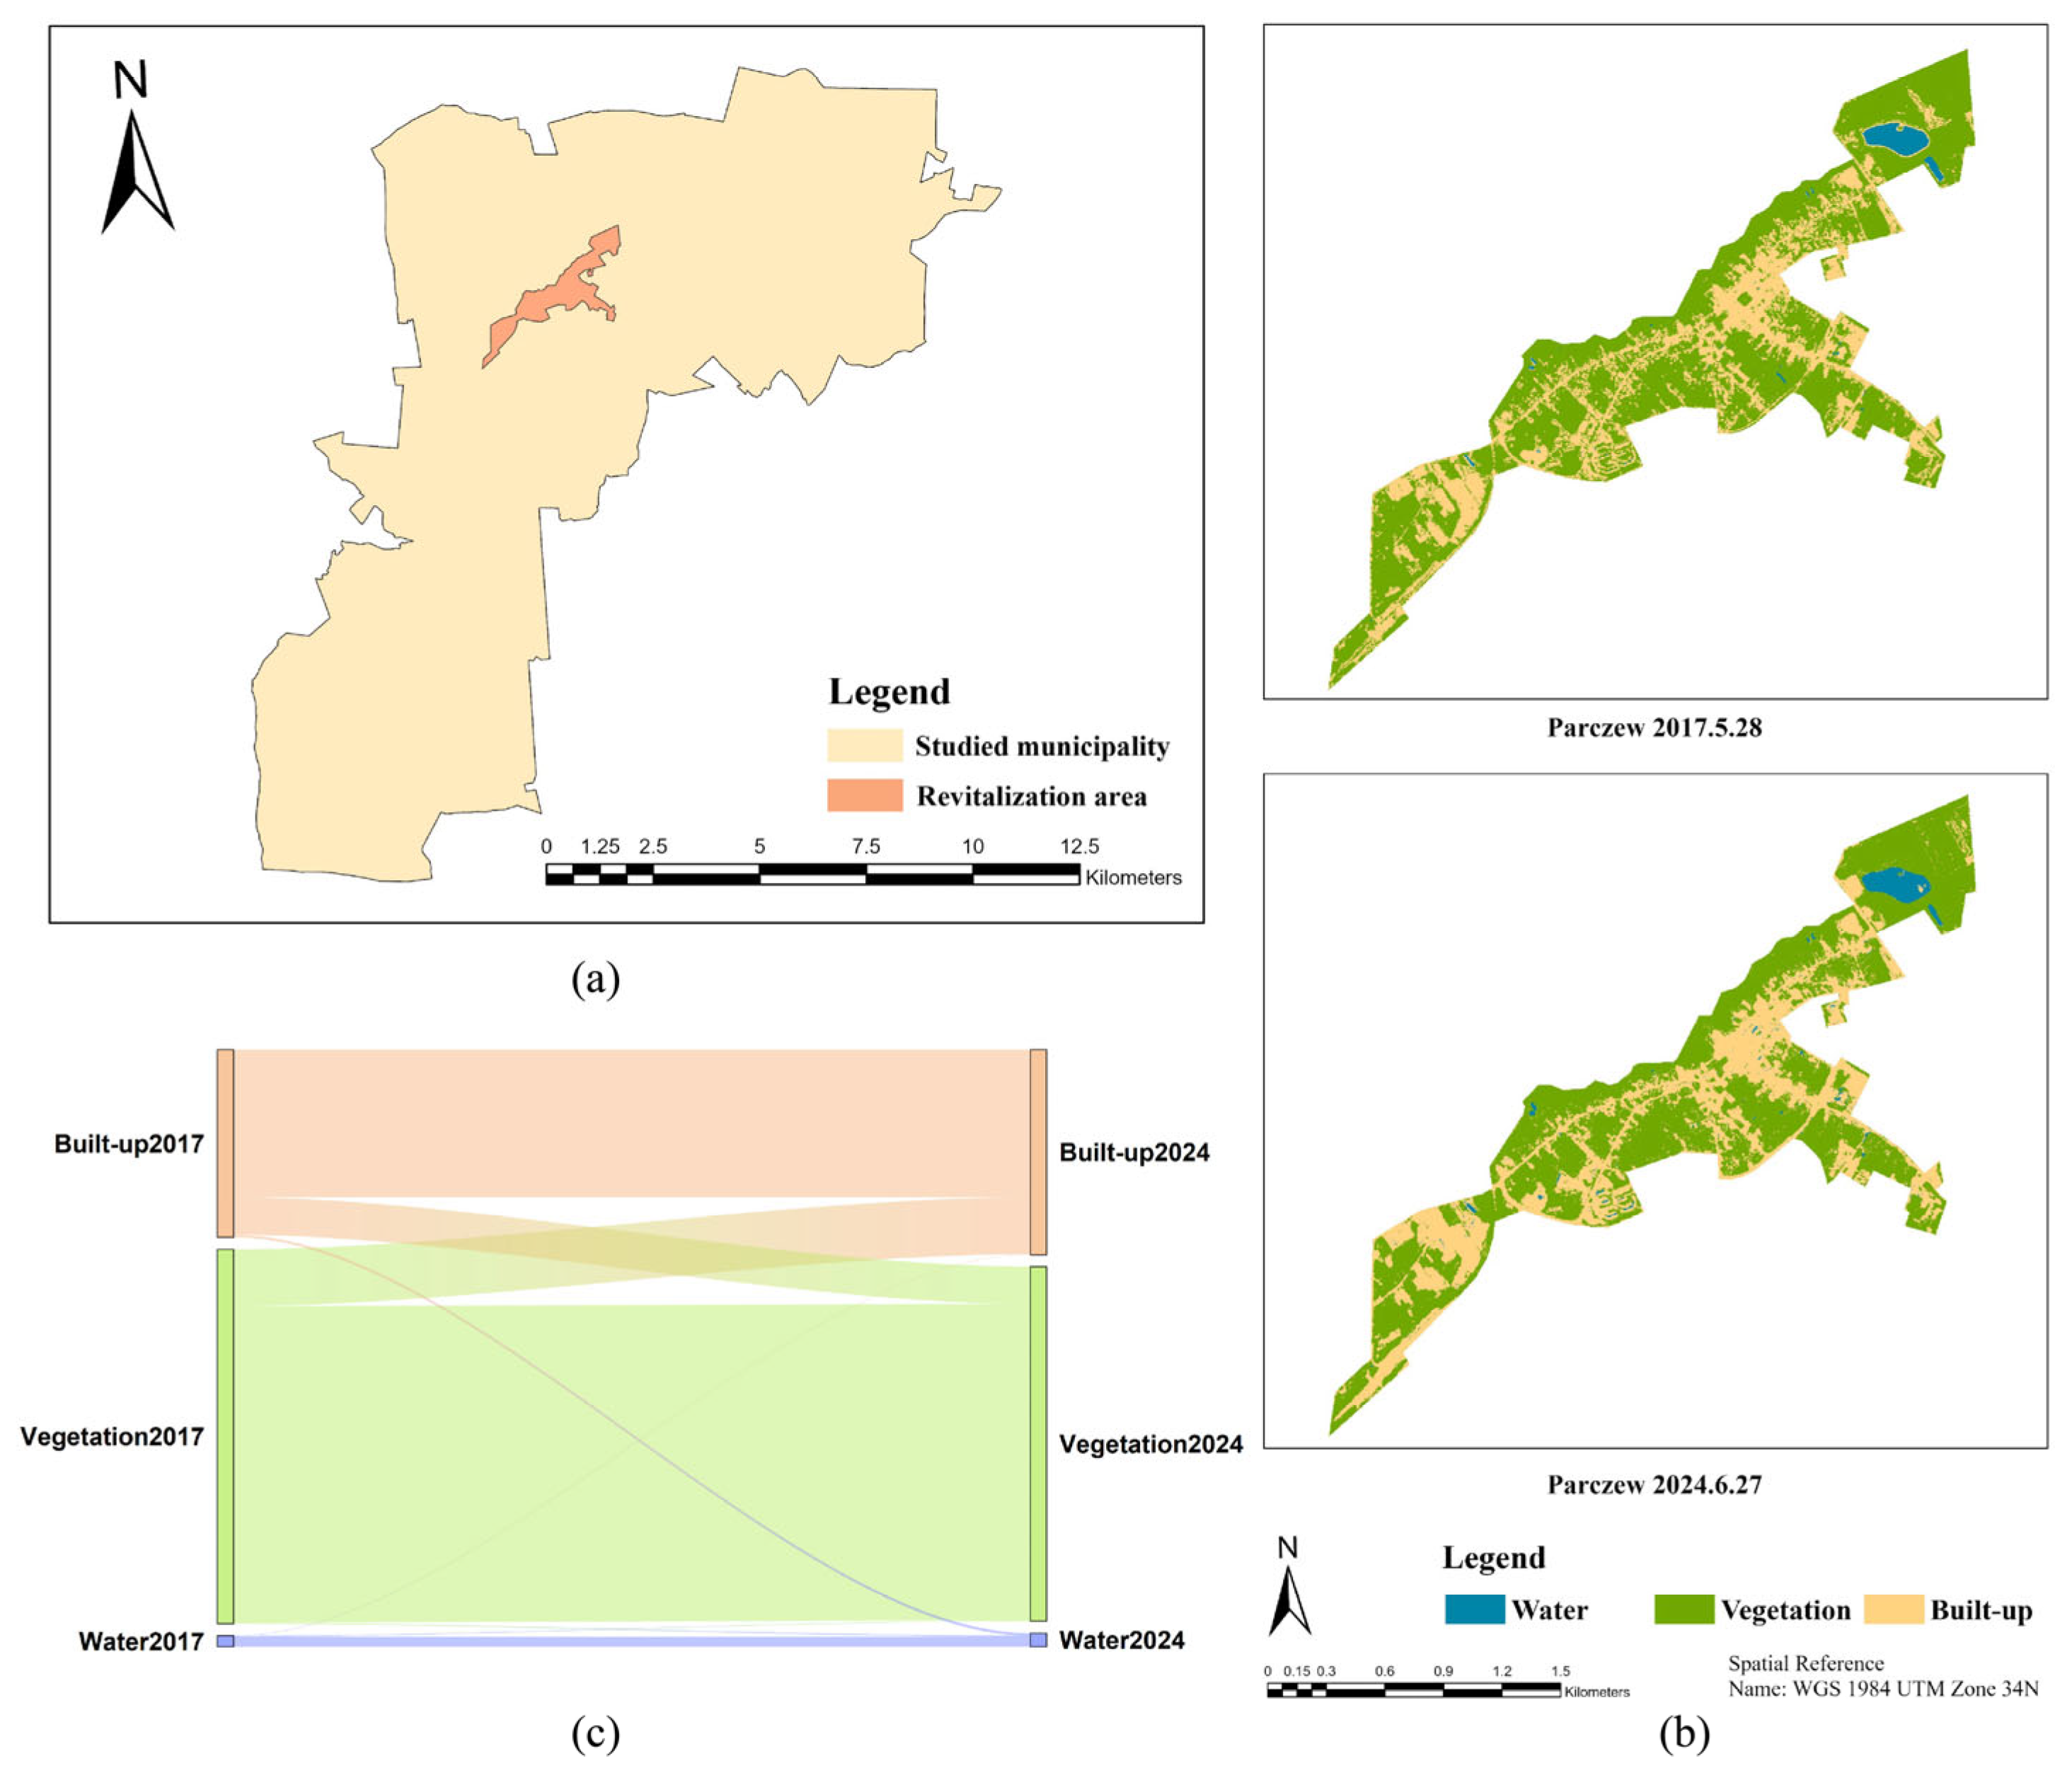
Parczew is an urban–rural municipality located in eastern Poland, covering an area of 147 km2. This study focused on the town of Parczew with an area of 8.05 km2, which belongs to Parczew Municipality, as shown in Figure 8. Based on the Update of the Local Revitalization Program of Parczew City for 2017–2023, the revitalization area most severely affected by the cumulative impact of crisis factors was designated [38]. The revitalization area, consisting of four neighborhoods (Osiedle nr 1, Osiedle nr 2, Osiedle nr 3, and Osiedle nr 4), stretches from the PKP Railway Station to 1 Maja Street and extends southeast along Kościelna Street.
The revitalization plan aimed to enhance residents’ quality of life, promote local company and economic vitality, optimize spatial layout and infrastructure, improve technological conditions of public facilities, and strengthen environmental protection and resource management.

3.2.6. Mosina

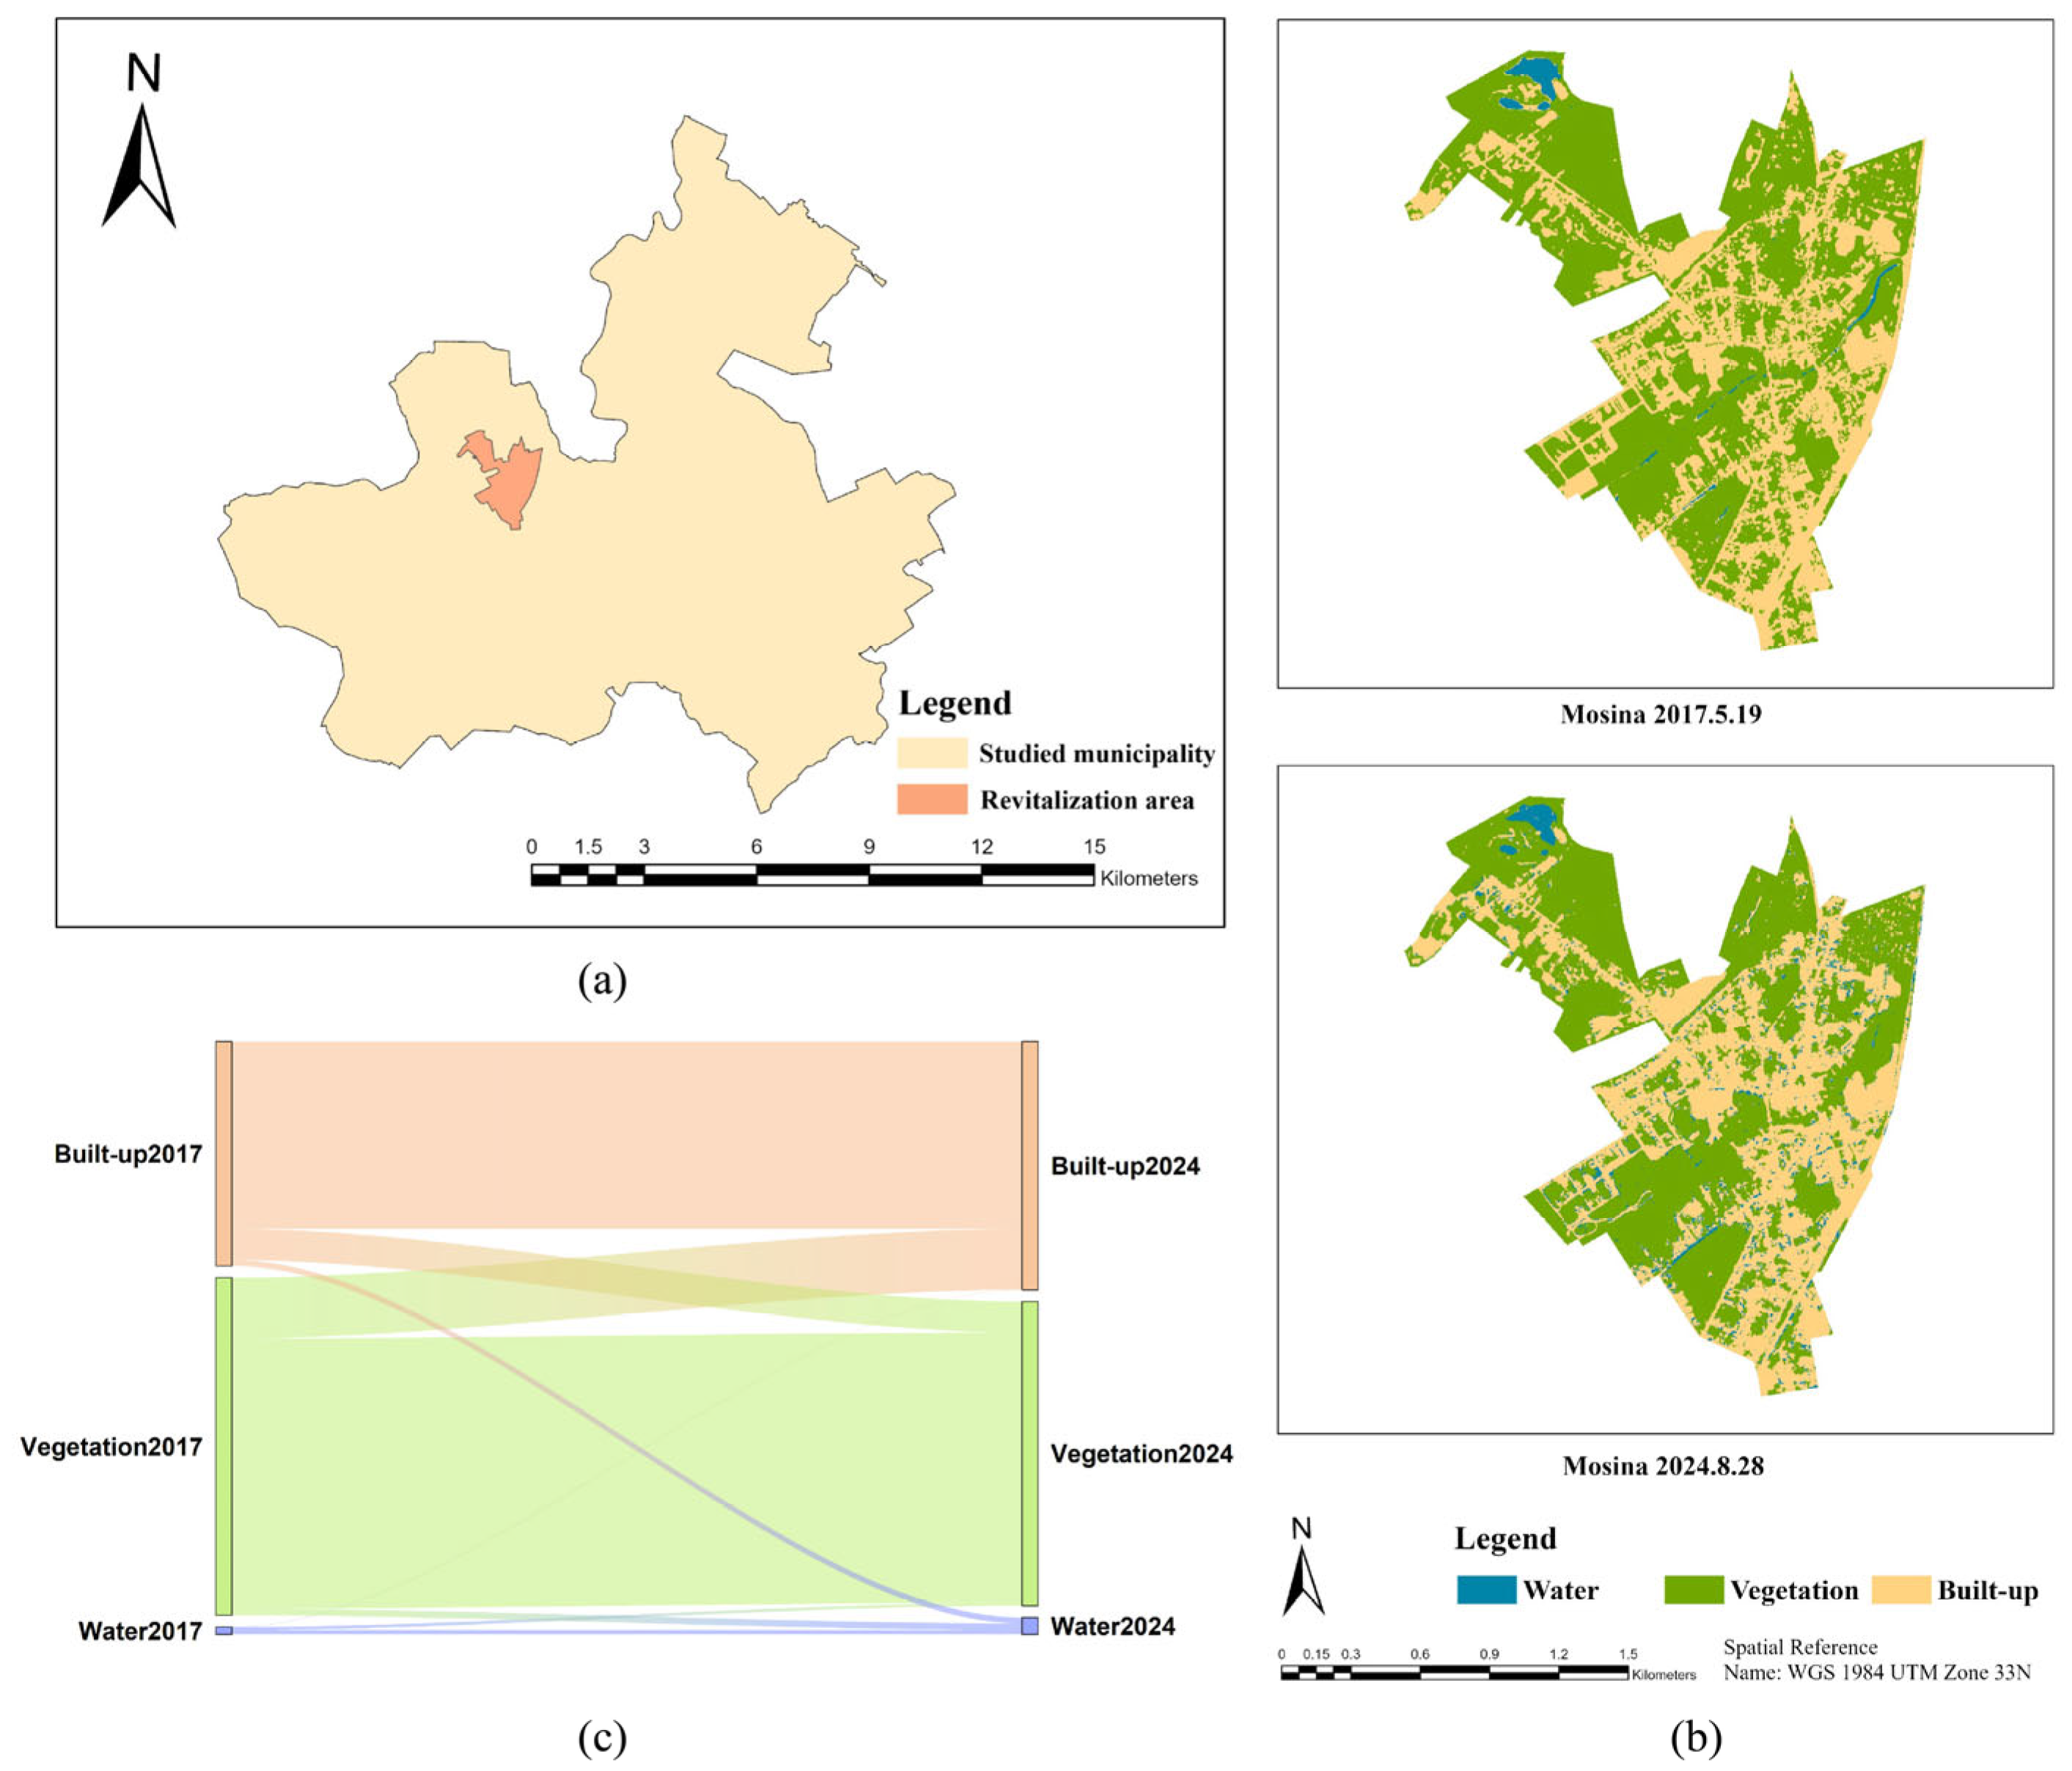
Mosina is an urban–rural municipality located in western Poland. Based on the Municipal Revitalization Program for the Mosina Municipality for the years 2017–2027, the downtown area of Mosina in Figure 9 has been designated as a revitalization zone, covering an area of approximately 2.1548 km2 with 7750 people [39].
The program aims to reserve area degradation through integrated actions targeting social, spatial, and economic improvement—including population dynamics, employment, infrastructure, and green areas. Its main goal is to raise residents’ income and enhance social cohesion by minimizing exclusion and reducing poverty and unemployment.
Since the project has not been completed as of yet, two dates selected to analyze the changes were 19 May 2017 and 28 August 2024. The LULC changes before and after revitalization area shown in Figure 9.
From the LULC analyses of eight cases, Table 4 was calculated. The transformation of three LULC categories—water, vegetation, and built-up areas—were analyzed, including the metrics of the area before revitalization and after revitalization (km2), persistence, net change rate, gain rate, loss rate, and swap rate [40].
LULC change analysis across the eight cases indicates that different land categories exhibit significant differential characteristics during the revitalization process. A comparative synthesis reveals three dominant patterns. First, changes in water area are the most drastic, showing high instability, with both gain and loss rates generally high, reflecting this land category’s extreme sensitivity to human intervention and natural processes. Second, vegetation area generally shows a decreasing trend, with net loss observed in six out of the eight case studies, indicating that vegetation often becomes the primary target of encroachment and source of conversion during the expansion of other land categories. In contrast, the expansion of built-up areas remains the dominant development pattern, with net growth observed in six out of the eight cases; simultaneously, its persistence is the highest among all land categories, indicating that once construction land is formed, it possesses strong stability and rarely reconverted.
This structural change in LULC is essentially the result of policy tool selection in spatial governance acting on local functional positioning, thereby guiding the land use behaviors of various stakeholders. In the case of Beijing Shougang Park, the increase in vegetation area is precisely based on the clear orientation of green transition goals within the Framework policies, achieved by integrating ecological spaces into newly developed public areas and venue construction, realizing “retaining vacant land for greening” in urban revitalization [31]. The increase in water areas in the Core Area of Nanjing Jiangbei New area is a direct outcome of the combined action of proactive ecological restoration initiatives and the national “Yangtze River Conservation” policy.
The cases collectively demonstrate that the trajectory of LULC change is not random but is a direct manifestation of overarching policy directives. Instances of ecological improvements (e.g., net gain in vegetation or successful water area restoration) are consistently tied to explicit green transition goals and proactive ecological restoration initiatives. Conversely, the pervasive expansion of built-up areas underscores the continued dominance of economic development objectives within the revitalization agenda, highlighting a common tension observed across the study areas.

4. Discussion

There are significant differences in the driving forces and core objectives of their urban revitalization, which directly shape the pathways and implications of LULC change.
China’s urban revitalization exhibits a typical “top-down”, strategically driven character. The central government sets the macro-strategic direction through top-level design. Framework such as ‘Ecological Civilization Construction’, the “integrated protection of mountains, waters, forests, farmlands, lakes, grasslands, and deserts”, and “ecological restoration and urban repair” constitute the macro-framework guiding national development. Indicators for resource consumption, environmental damage, and ecological benefits are fully incorporated into the comprehensive evaluation system for local economic and social development, and area decomposed and delegated to local governments level by level. Consequently, land cover optimization in China, particularly the restoration of vegetation and water bodies, is often tightly bundled with national-level major projects (e.g., the Beijing–Tianjin–Hebei coordinated development, the Yangtze River Delta Eco-Green Integrated Development Demonstration Zone) and large international events (e.g., the Beijing Winter Olympics) [41,42,43]. For instance, the dramatic vegetation increase in Beijing Shougang Park was a direct physical manifestation of its role in Beijing Winter Olympics, an event of national strategic importance. Similarly, the binding targets of the national “Yangtze River Conservation” campaign directly drove the recovery of the fluctuating water bodies in the Core Area of Nanjing Jiangbei New Area. Additionally, as Feng’s study showed, in China, the average urban vegetation coverage across 328 cities dropped from 0.38 in 1990 to 0.35 in 2005, but subsequently rebounded to 0.45 by 2022. This shift was profoundly influenced by China’s national policy of increasing the amount of green space coverage in cities after 2004 [44]. Its core objective is to enhance the city’s comprehensive carrying capacity, ecological resilience, and global competitiveness, reshaping the urban image through large-scale ecological investment to serve broader regional and national development strategies.
In contrast, Poland’s urban revitalization, formed under the principles of adapting to EU policies [45], reflects an interweaving of “top-down” and “bottom-up” processes [46]. As an EU member state, a significant number of Poland’s urban revitalization projects receive funding and technical support within the framework of the “EU Cohesion Policy” [47]. The core objective is to promote balanced development within EU regions and reduce social and economic disparities. This compels Polish revitalization projects to respond to principles advocated by the EU, such as “public participation” [48]. Therefore, the practices of Poland, as cases in Mosina and Swarzędz, are addressing livelihood issues: unemployment, population outflow, lack of social facilities, and consequent social problems (e.g., alcoholism). Here, the environmental improvement is not the ultimate goal but rather a medium and tool for solving social problems and activating endogenous drivers of regional development.
In the majority of previous studies on city LULC changes, remote sensing data with coarse spatial resolution have been widely used. For large-scale analyses, MODIS datasets with 500 m resolution are commonly used, while medium-to-small-scale studies rely on Landsat imagery (mainly 30 m resolution) with the longest temporal continuity and Sentinel imagery (10–20 m resolution) [49,50,51,52,53]. These datasets are subject to mixed pixel issues. Compared to contiguous residential built-up areas and concentrated water bodies, urban green spaces and narrow rivers are generally smaller and more fragmented, making them difficult to accurately identify in coarse-resolution satellite imagery, thereby introducing uncertainties in the results [13,44,54,55,56]. Although PlanetScope imagery with 3 m resolution was used in this study, such issues still exist. However, enhancing spatial resolution is a critical pathway for reducing interpretation errors, particularly in heterogeneous landscapes dominated by mixed pixels.
Additionally, under the constraint of fixed spatial resolution, AI-integrated approaches such as the synergistic fusion of machine learning and deep learning can also reduce uncertainties in the results.
It should be noted that this study selected a limited set of representative cases for analysis. Due to the small sample size and the focus on short-term urban revitalization interventions, the observations here cannot be generalized as universal trends. Future research should focus on long-term monitoring of these ongoing cases to capture delayed policy effects and ecological feedback, as the current findings are constrained by incomplete temporal coverage of case studies.

5. Conclusions

In the process of urban revitalization, the expansion of built-up areas is common in the eight cases, which has occupied the original vegetation and water areas to varying degrees. Such behavior leads to a negative impact on the regional cycle and living environment, and the related issues have not received sufficient attention in urban revitalization planning. From the perspective of urban sustainable development, it is recommended that the government provide more policy support for ecological space protection when formulating revitalization plans, and balance the relationship between development and ecological protection through scientific planning.
Urban revitalization constitutes a phased, long-term, and dynamic process. The evolving policy and environments necessitate timely adjustments to revitalization strategies. Continuous monitoring enables governments to identify potential risks proactively, thereby facilitating strategic adaptations and responsive measures. This approach achieves an equilibrium between development demands and future risks, ultimately fostering a harmonious integration of urban development efficiency, ecological protection, and social equity.
A comparative analysis of revitalization pathways in China and Poland reveals distinct governance models. China exemplifies a state-led paradigm of spatial production, where land cover optimization serves as an instrument for achieving strategic urban objectives. In contrast, Poland’s approach operates within the governance framework and funding mechanisms of the EU, with its revitalization strategies deeply embedded in local community needs and livelihood concerns. While both countries have significantly transformed their land surfaces through different policy instrument mixes, their distinct driving logics and objective orientations form a representative contrast in urban revitalization models within the context of globalization.
Looking forward, China may benefit from integrating more publication participation mechanisms into its macro-level strategic planning, while Poland could develop local successes into more cohesive regional development strategies. Such cross-learning could enhance the adaptability and sustainability of revitalization efforts in both contexts.

Author Contributions

Conceptualization, A.C. and Y.W.; methodology, A.C. and Y.W.; validation, Y.W.; formal analysis, Y.W.; resources, A.C. and Y.W.; writing—original draft preparation, Y.W.; writing—review and editing, A.C. and Y.W.; visualization, Y.W.; supervision, A.C.; funding acquisition, A.C. All authors have read and agreed to the published version of the manuscript.

Funding

This research was funded by the National Science Center of Poland (Narodowe Centrum Nauki), grant number 2022/47/D/HS4/01313.

Institutional Review Board Statement

Not applicable.

Informed Consent Statement

Not applicable.

Data Availability Statement

All the data are provided in the main manuscript.

Acknowledgments

We gratefully acknowledge the free data that Planet Team (2025) provided. Planet Application Program Interface: In Space for Life on Earth. San Francisco, CA. (https://api.planet.com, accessed on 30 May 2025).

Conflicts of Interest

The authors declare no conflicts of interest.

Abbreviations

The following abbreviations are used in this manuscript:
RSRemote Sensing
GISGeographic Information System
LULCLand Use and Land Cover
RFRandom Forest
SVMSupport Vector Machine
MLCMaximum Likelihood Classifier

Appendix A

Figure A1. Beijing and Nanjing Cities in China.
Sustainability 17 10126 g0a1
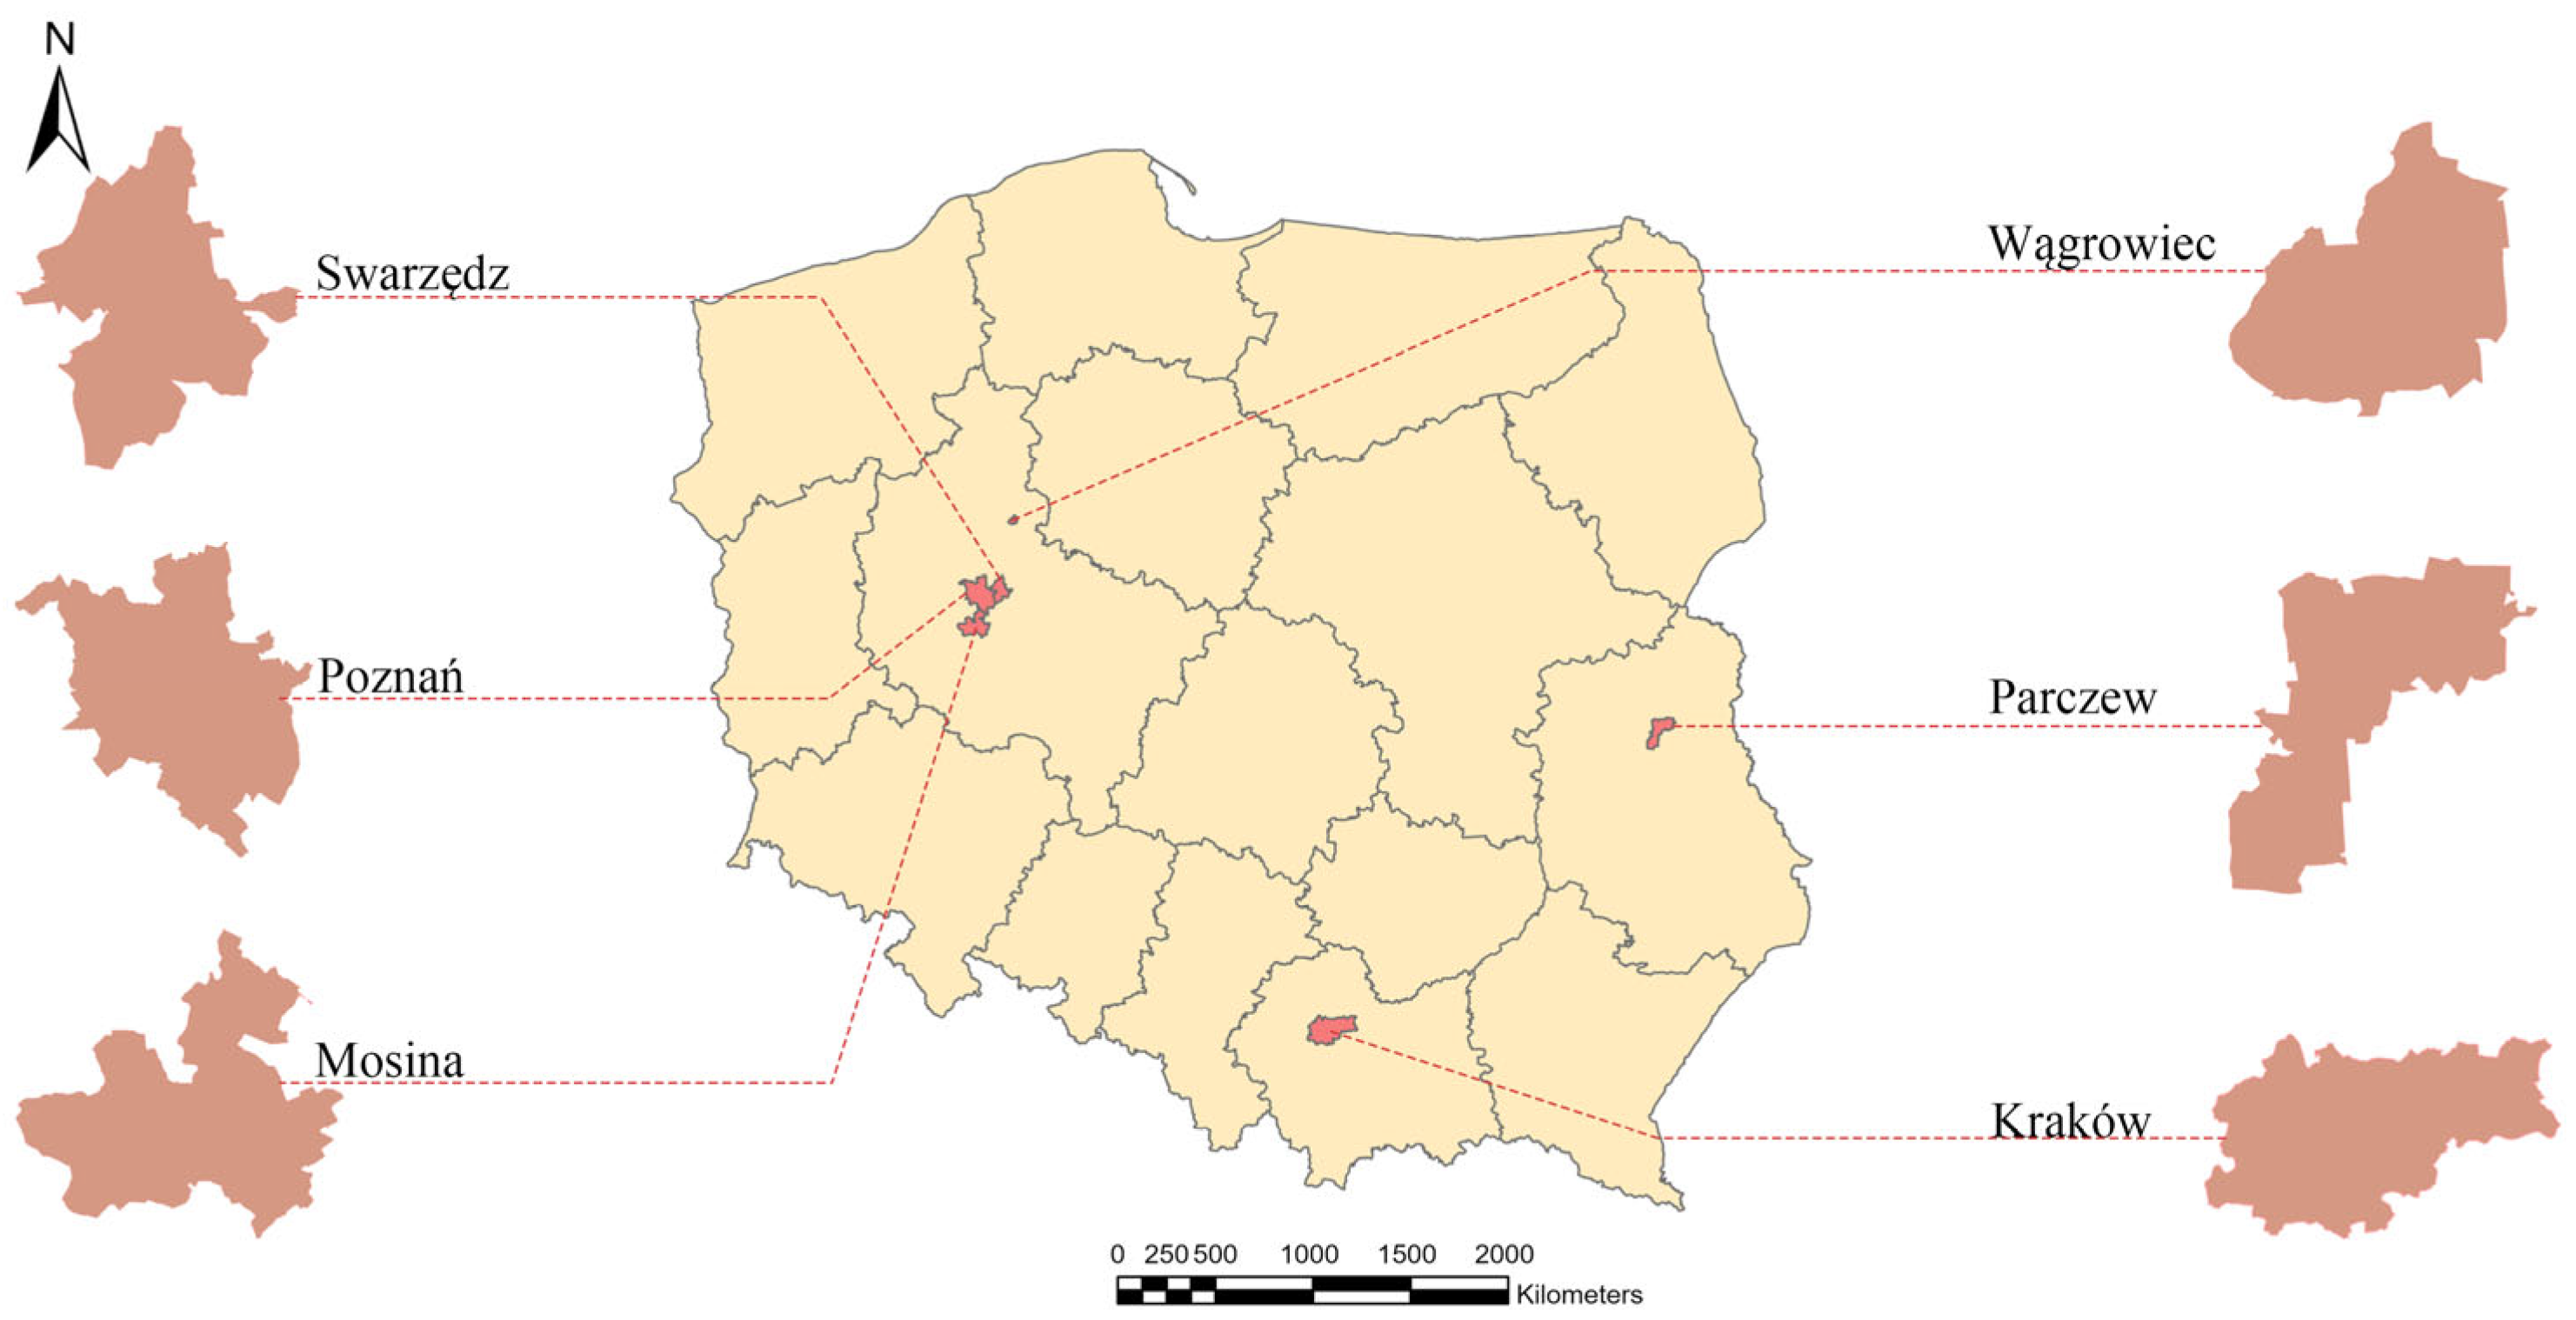
Figure A2. Poznań, Wągrowiec, Kraków, Parczew, Swarzędz, and Mosina Municipalities in Poland.
Sustainability 17 10126 g0a2
Figure A3. View of revitalized area in Beijing (Source: The People’s Government of Beijing Municipality, https://www.beijing.gov.cn, accessed 30 April 2025).
Sustainability 17 10126 g0a3
Figure A4. Views of revitalization areas in Poznań (photographs by the author Y. Wang).
Sustainability 17 10126 g0a4
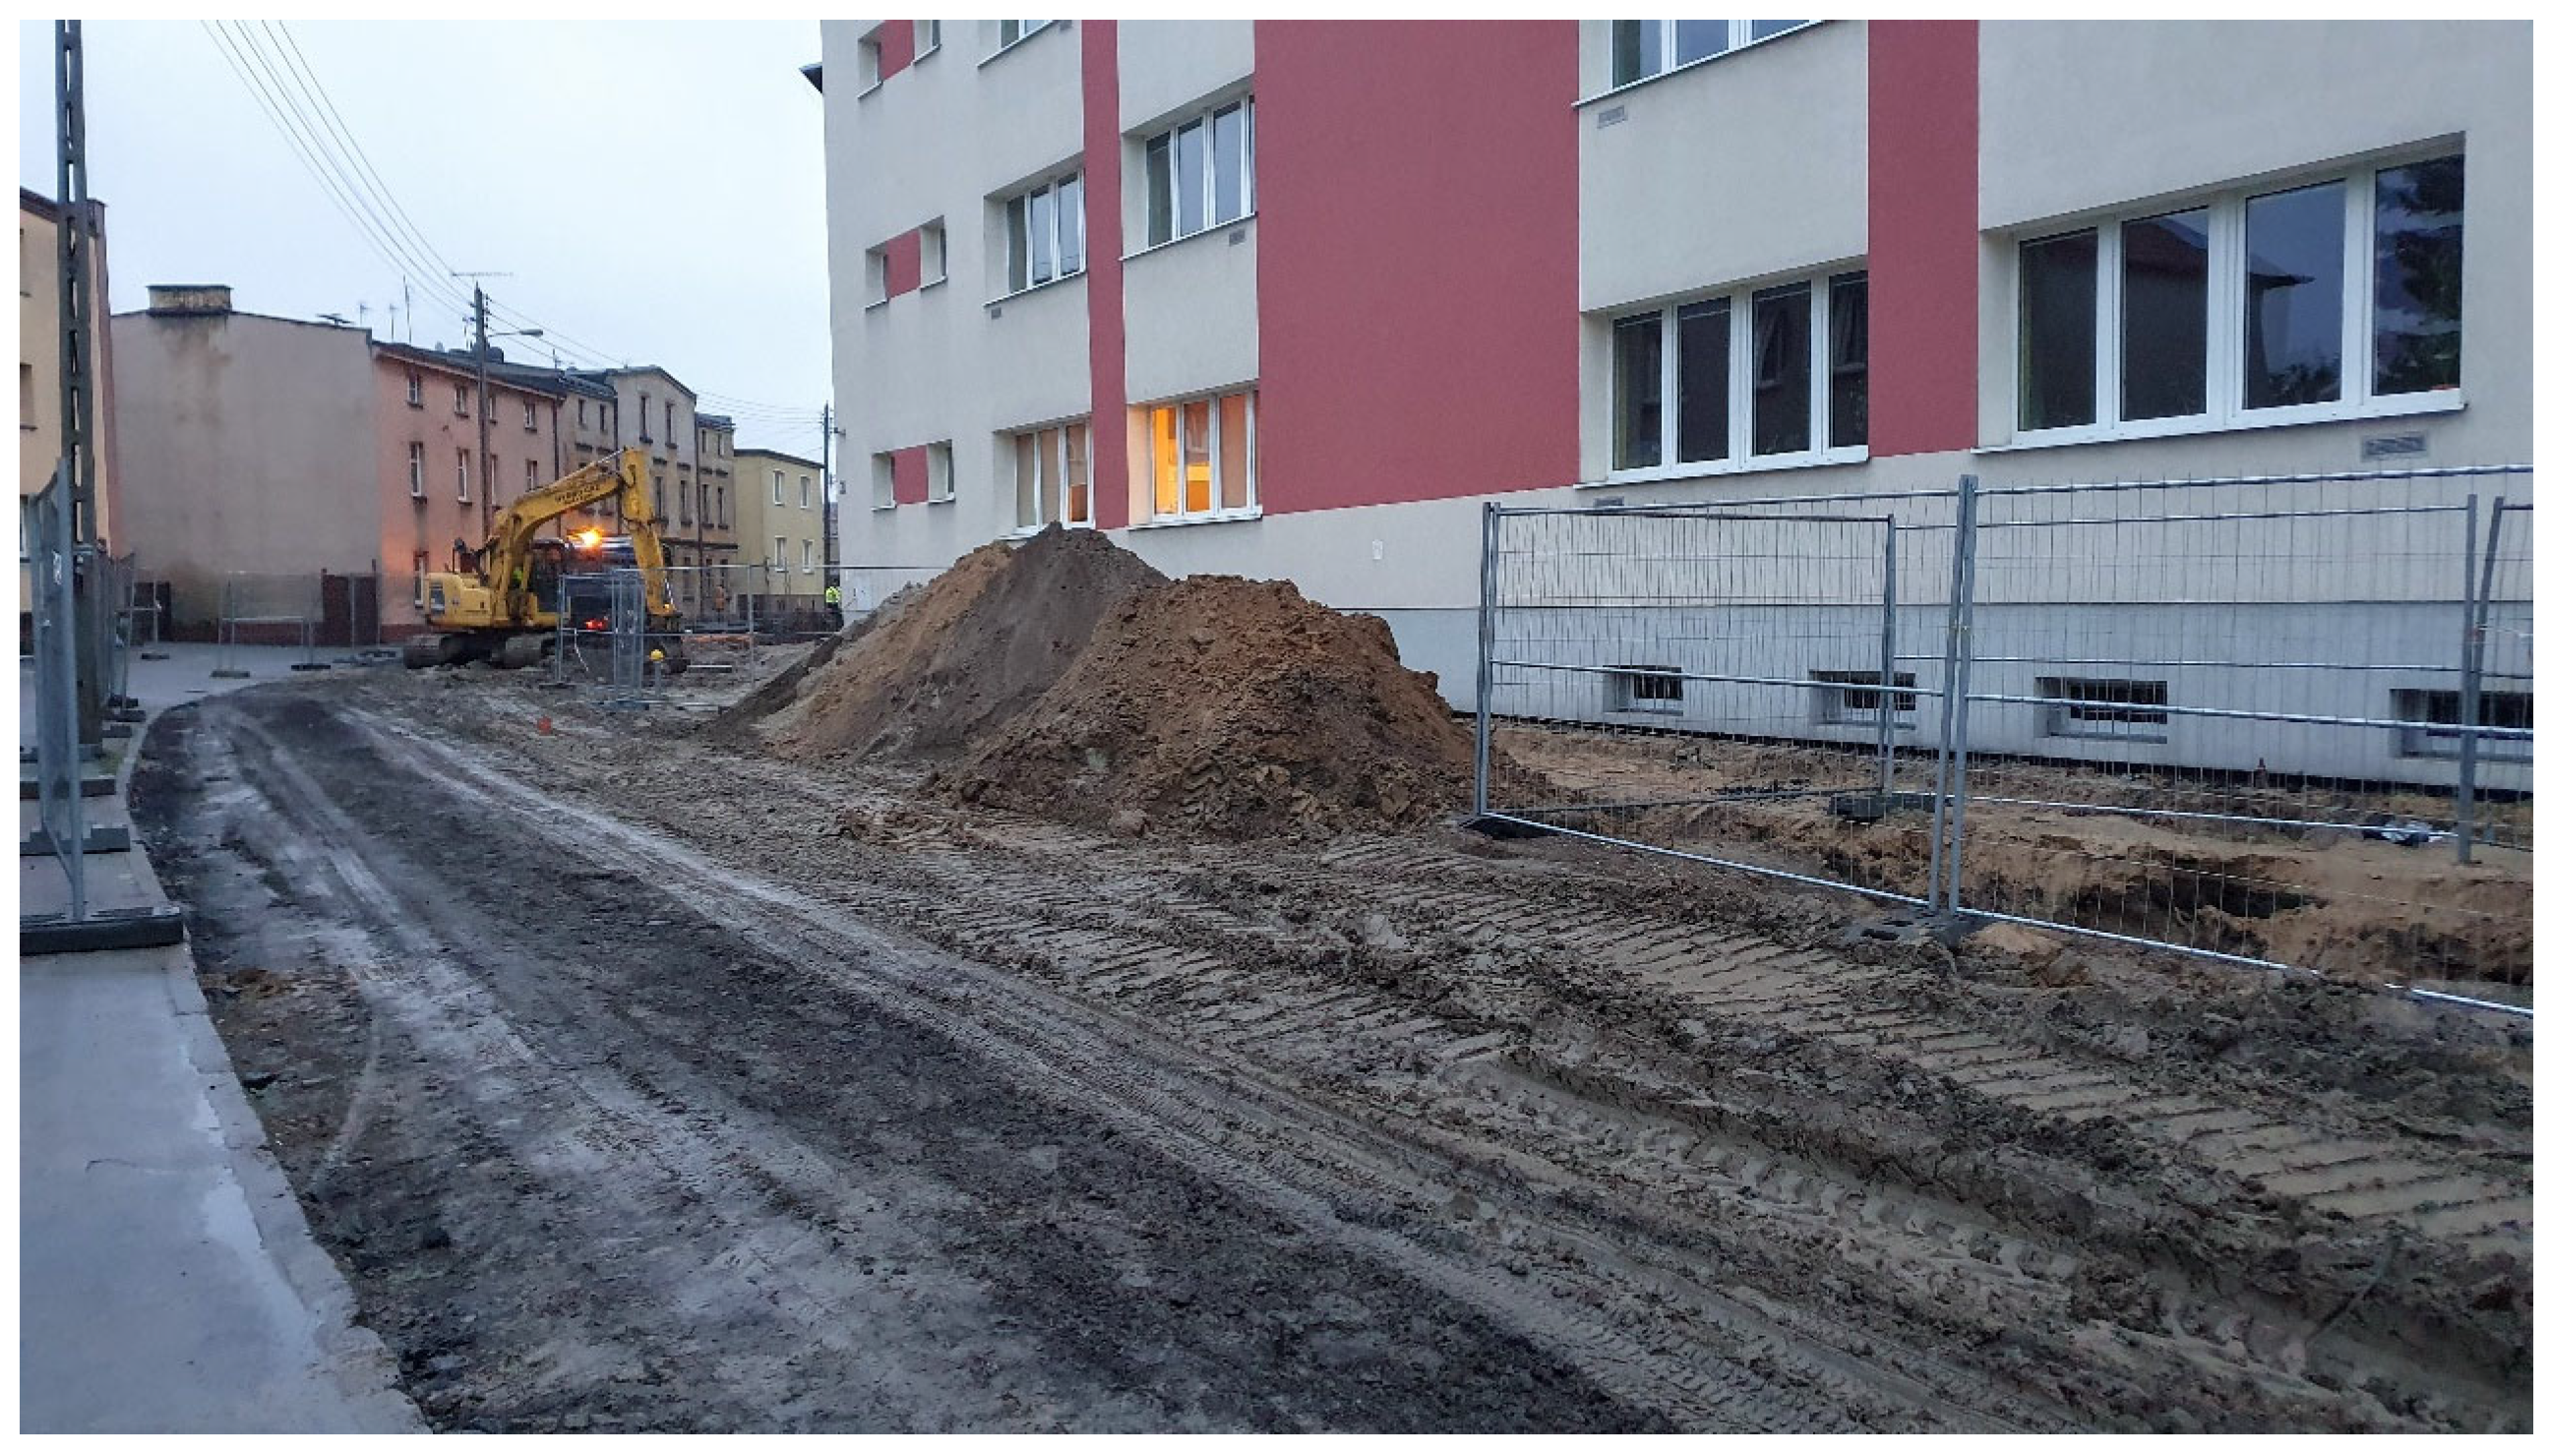
Figure A5. View of area in Swarzędz before revitalization (photograph by A. Choryński).
Sustainability 17 10126 g0a5
Figure A6. View of revitalized area in Swarzędz (photograph by A. Choryński).
Sustainability 17 10126 g0a6
Table A1. Socioeconomic features of the selected cities and municipalities.
BeijingNanjingPoznańKrakówWągrowiecSwarzędzParczewMosina
Number of inhabitants (thousand)21,8589425536.818807.64425.39456.87313.62235.552
Area/km216,410.546587.0226232718102147172
Population density (person/km2)133214312055.82466.61425.30556.693.3207
Type of municipalityurbanurbanurbanurbanurbanurban–ruralurban–ruralurban–rural
Yearly budget expenditure in USD (million)82,199.6622,193.911536.142072.5642.77128.6223.859.88
Unemployment rate (registered)3.08%2.70%0.68%1.32%1.83%0.45%2.69%0.57%

References

  1. Biegańska, J.; Środa-Murawska, S.; Rogatka, K.; Finc, D.; Cielicki, M.; Kuczmowski, W.; Kwiatkowski, M.; Werner, M.; Kopczyńska, L. Revitalization of urban space—Case study of Ghent, Belgium. Acta Sci. Pol. Adm. Locorum 2019, 18, 33–47. [Google Scholar] [CrossRef]
  2. Sandholz, S. Urban Centres in Asia and Latin America; Springer: Cham, Switzerland, 2017. [Google Scholar] [CrossRef]
  3. Peng, H.; Lou, H.; Liu, Y.; He, Q.; Zhang, M.; Yang, Y. Spatial and Temporal Evolution Assessment of Landscape Ecological Resilience Based on Adaptive Cycling in Changsha–Zhuzhou–Xiangtan Urban Agglomeration, China. Land 2025, 14, 709. [Google Scholar] [CrossRef]
  4. Zhang, J.; Zhang, Z.; Liu, L.; Bai, X.; Wang, S.; Kang, L.; Cai, X. The Coupling Relationship and Driving Mechanism between Urbanization and Ecosystem Services in the Yellow River Basin from a Multi-Spatial Scale Perspective. PLoS ONE 2023, 18, e0293319. [Google Scholar] [CrossRef]
  5. Choryński, A.; Pińskwar, I.; Graczyk, D.; Krzyżaniak, M. The Emergence of Different Local Resilience Arrangements Regarding Extreme Weather Events in Small Municipalities—A Case Study from the Wielkopolska Region, Poland. Sustainability 2022, 14, 2052. [Google Scholar] [CrossRef]
  6. Chaudhuri, A.S.; Singh, P.; Rai, S.C. Modelling LULC change dynamics and its impact on environment and water security: Geospatial technology based assessment. Ecol. Environ. Conserv. 2018, 24, S292–S298. [Google Scholar]
  7. Ahmed, A.; Rotich, B.; Czimber, K. Assessment of the Environmental Impacts of Conflict-Driven Internally Displaced Persons: A Sentinel-2 Satellite Based Analysis of Land Use/Cover Changes in the Kas Locality, Darfur, Sudan. PLoS ONE 2024, 19, e0304034. [Google Scholar] [CrossRef] [PubMed]
  8. Kanchan, A.; Nitivattananon, V.; Tripathi, N.K.; Winijkul, E.; Mandadi, R.R. A Spatio-Temporal Examination of Land Use and Land Cover Changes in Smart Cities of the Delhi–Mumbai Industrial Corridor. Land 2024, 13, 957. [Google Scholar] [CrossRef]
  9. Liu, X.; Fu, D.; Zevenbergen, C.; Busker, T.; Yu, M. Assessing Sponge Cities Performance at City Scale Using Remotely Sensed LULC Changes: Case Study Nanjing. Remote Sens. 2021, 13, 580. [Google Scholar] [CrossRef]
  10. Supiyandi, S.; Mailok, R. binti Advances in Spatial Analysis for Land Change Science: A Systematic Review of Geospatial Methodologies. J. Komput. Teknol. Inf. Sist. Inf. 2025, 4, 1085–1103. [Google Scholar] [CrossRef]
  11. Jurkowski, W.; Latocha-Wites, A.; Grochowska, A. Landscape Effects of Urbanisation in a Post-Socialist City. A Case Study of Wrocław (Poland). Cities 2024, 145, 104730. [Google Scholar] [CrossRef]
  12. Huang, Y.; Wei, L.; Liu, G.; Cui, W.; Xie, F.; Deng, X. “Inspiring” Policy Transfer: Analysis of Urban Renewal in Four First-Tier Chinese Cities. Land 2023, 12, 118. [Google Scholar] [CrossRef]
  13. Sahoo, S.; Majumder, A.; Swain, S.; Gareema; Pateriya, B.; Al-Ansari, N. Analysis of Decadal Land Use Changes and Its Impacts on Urban Heat Island (UHI) Using Remote Sensing-Based Approach: A Smart City Perspective. Sustainability 2022, 14, 11892. [Google Scholar] [CrossRef]
  14. Zhong, L.; Mu, R.; Zhang, D.; Zhao, P.; Zhang, Z.; Wang, N. An Observational Analysis of Warm-Sector Rainfall Characteristics Associated with the 21 July 2012 Beijing Extreme Rainfall Event. J. Geophys. Res. Atmos. 2015, 120, 3274–3291. [Google Scholar] [CrossRef]
  15. Pińskwar, I.; Choryński, A.; Graczyk, D. Risk of Flash Floods in Urban and Rural Municipalities Triggered by Intense Precipitation in Wielkopolska of Poland. Int. J. Disaster Risk Sci. 2023, 14, 440–457. [Google Scholar] [CrossRef]
  16. Zhuang, T.; Qian, Q.K.; Visscher, H.J.; Elsinga, M.G.; Wu, W. The Role of Stakeholders and Their Participation Network in Decision-Making of Urban Renewal in China: The Case of Chongqing. Cities 2019, 92, 47–58. [Google Scholar] [CrossRef]
  17. Martone, A.; Sepe, M. Creativity, Urban Regeneration and Sustainability/The Bordeaux Case Study. J. Urban Regen. Renew. 2012, 5, 164–183. [Google Scholar] [CrossRef]
  18. Thomas, H. The Local Press and Urban Renewal: A South Wales Case Study. Int. J. Urban Reg. Res. 1994, 18, 315–333. [Google Scholar] [CrossRef]
  19. DzU 2015 Poz. 1777, Ustawa z Dnia 9 Października 2015 r. o Rewitalizacji, 2015. Available online: https://isap.sejm.gov.pl/isap.nsf/download.xsp/WDU20150001777/T/D20151777L.pdf (accessed on 30 October 2024).
  20. Tenah, B.; Chadli, M.; Badreddine, R.; Wail, D.A.; Saad, C. Urban Expension Analysis of New Cities in North Africa, Using Remote Sensing and GIS Betewen 2004–2024. Case Study of Sidi Abdellah, Algeria. J. Inf. Syst. Eng. Manag. 2025, 10, 1828–1840. [Google Scholar] [CrossRef]
  21. Gaur, S.; Singh, R. A Comprehensive Review on Land Use/Land Cover (LULC) Change Modeling for Urban Development: Current Status and Future Prospects. Sustainability 2023, 15, 903. [Google Scholar] [CrossRef]
  22. Alshari, E.A.; Abdulkareem, M.B.; Gawali, B.W. Classification of Land Use/Land Cover Using Artificial Intelligence (ANN-RF). Front. Artif. Intell. 2023, 5, 964279. [Google Scholar] [CrossRef]
  23. Yao, Z.; Zhao, Y.; Wang, H.; Li, H.; Yuan, X.; Ren, T.; Yu, L.; Liu, Z.; Zhang, X.; Li, S. Comparison and Assessment of Data Sources with Different Spatial and Temporal Resolution for Efficiency Orchard Mapping: Case Studies in Five Grape-Growing Regions. Remote Sens. 2023, 15, 655. [Google Scholar] [CrossRef]
  24. Ribeiro, M.T.; Singh, S.; Guestrin, C. “Why Should I Trust You?” Explaining the Predictions of Any Classifier. In Proceedings of the 2016 Conference of the North American Chapter of the Association for Computational Linguistics: Human Language Technologies, Proceedings of the Demonstrations Session (NAACL-HLT 2016), San Diego, CA, USA, 12–17 June 2016; pp. 97–101. [Google Scholar] [CrossRef]
  25. Song, A.; Choi, J. Fully Convolutional Networks with Multiscale 3D Filters and Transfer Learning for Change Detection in High Spatial Resolution Satellite Images. Remote Sens. 2020, 12, 799. [Google Scholar] [CrossRef]
  26. Gangwisch, M.; Saha, S.; Matzarakis, A. Spatial Neighborhood Analysis Linking Urban Morphology and Green Infrastructure to Atmospheric Conditions in Karlsruhe, Germany. Urban Clim. 2023, 51, 101624. [Google Scholar] [CrossRef]
  27. Lefulebe, B.E.; Van der Walt, A.; Xulu, S. Fine-Scale Classification of Urban Land Use and Land Cover with PlanetScope Imagery and Machine Learning Strategies in the City of Cape Town, South Africa. Sustainability 2022, 14, 9139. [Google Scholar] [CrossRef]
  28. Breiman, L. Random Forests. Mach. Learn. 2001, 45, 5–32. [Google Scholar] [CrossRef]
  29. Avci, C.; Budak, M.; Yagmur, N.; Balcik, F.B. Comparison between Random Forest and Support Vector Machine Algorithms for LULC Classification. Int. J. Eng. Geosci. 2023, 8, 1–10. [Google Scholar] [CrossRef]
  30. Congalton, R.G.; Green, K. Assessing the Accuracy of Remotely Sensed Data: Principles and Practices. In Assessing the Accuracy of Remotely Sensed Data, 3rd ed.; CRC Press: Boca Raton, FL, USA, 2019. [Google Scholar] [CrossRef]
  31. General Administration of Sport of China. Framework Agreement on Preparing for the 2022 Winter Olympics and Establishing a National Sports Industry Demonstration Zone; General Administration of Sport of China: Beijing, China, 2025. [Google Scholar]
  32. Nanjing Jiangbei New District Management Committee. Environmental Impact Assessment Brief of Core Area and Surrounding Regions Planning in Nanjing Jiangbei New District (2018–2030); Nanjing Jiangbei New District Management Committee: Nanjing, China, 2018. [Google Scholar]
  33. Posadzińska, I.; Sieg, P.; Jóźwiak, M. New Product Concept Development as an Effect of Revitalizing the Old Market in Bydgoszcz. In Scientific Papers of Silesian University of Technology Organization and Management Series; Silesian University of Technology Publishing House: Gliwice, Poland, 2022; Volume 2022. [Google Scholar] [CrossRef]
  34. Uchwała Rady Miasta Poznania z Dnia 7 Listopada 2017 r. Nr LVI/1021/VII/2017, w Sprawie Przyjęcia Gminnego Programu Rewitalizacji Dla Miasta Poznania. Available online: https://bip.poznan.pl/bip/uchwaly/uchwala-nr-lvi-1021-vii-2017-z-dnia-2017-11-07,71611/ (accessed on 30 October 2024).
  35. Uchwała Nr LXII/1373/17, Rady Miasta Krakowa z Dnia 11 Stycznia 2017 r. w Sprawie Przyjęcia z Aktualizacji Miejskiego Programu Rewitalizacji Krakowa. Available online: https://bip.krakow.pl/zarzadzenia/2017/3322/X19UUF9fNDQxMzY=/aMPRK_fin_16_11_2017.doc.pdf (accessed on 30 October 2024).
  36. Uchwała Rady Miejskiej w Wągrowcu z Dnia 22 Czerwca 2017 r. Nr XXXIII/225/2017, w Sprawie Przyjęcia Lokalnego Programu Rewitalizacji Miasta Wągrowca Na Lata 2017–2025. Available online: https://www.wagrowiec.eu/assets/files/dzialy/dokumenty-strategiczne/uchwala-lpr_2017-2025.pdf (accessed on 30 October 2024).
  37. Uchwała Rady Miejskiej w Swarzędzu z Dnia 28 Listopada 2017 r. Nr XLIV/422/2017, w Sprawie Przyjęcia Lokalnego Programu Rewitalizacji Swarzędza Na Lata 2017–2023. Available online: https://bip.swarzedz.pl/fileadmin/BIP/Prawo/Uchwaly/2017/422_2017.pdf (accessed on 30 October 2024).
  38. Uchwała Rady Miejskiej w Parczewie z Dnia 29 Maja 2017 r. Nr XXXV/256/2017 w Sprawie Przyjęcia Aktualizacji Lokalnego Programu Rewitalizacji Miasta Parczew Na Lata 2017–2023. Available online: https://www.parczew.com/images/2024/ZIT_MOF/Projekt%20GPR%20Parczew.pdf (accessed on 30 October 2024).
  39. Uchwała Rady Miejskiej w Mosinie z Dnia 26 Października 2017 r. Nr LVII/645/17 w Sprawie Przyjęcia Gminnego Programu Rewitalizacji Dla Gminy Mosina Na Lata 2017–2027. Available online: http://bip.mosina.pl/um/prawo/uchwaly-rady/kadencja-2014-20181/lvii-sesja-rady-miejskiej-w-mosinie-26.10.2017-r.html?pid=12535 (accessed on 30 October 2024).
  40. de Souza, J.M.; Morgado, P.; da Costa, E.M.; de Novaes Vianna, L.F. Modeling of Land Use and Land Cover (LULC) Change Based on Artificial Neural Networks for the Chapecó River Ecological Corridor, Santa Catarina/Brazil. Sustainability 2022, 14, 4038. [Google Scholar] [CrossRef]
  41. Wang, T.; Du, H.; Cheng, W.; Zhao, Z.; Zhang, J.; Zhou, C. Influence of Meteorological Conditions on the Air Quality during the 2022 Winter Olympics in Beijing. Front. Environ. Sci. 2022, 10, 987272. [Google Scholar] [CrossRef]
  42. Gong, S.; Zhang, L.; Pang, J. The Spatial–Temporal Evolution of the Trade-Offs and Synergy between the Suburban Rural Landscape’s Production–Living–Ecological Functions: A Case Study of Jiashan in the Yangtze River Delta Eco-Green Integrated Development Demonstration Zone, China. Sustainability 2024, 16, 7439. [Google Scholar] [CrossRef]
  43. Yan, X.; Xia, H.; Zhang, X. How to Promote the Coordinated Development of Beijing, Tianjin and Hebei Under the Background of Digitalization? In Digitalization and Management Innovation III; IOS Press: Amsterdam, The Netherlands, 2025. [Google Scholar] [CrossRef]
  44. Fei, F.; Xin, Y.; Baoquan, J.; Xiaoting, L.; Xianwen, L.; Chengyang, X.; Kaicun, W. Long-term characteristics and driving factors of vegetation cover changes in 328 Chinese cities. SSTe 2024, 54, 486–502. [Google Scholar] [CrossRef]
  45. Żuber, P.; Szmigiel-Rawska, K.; Krukowska, J. Boosting National Urban Policies by European Integration. The Case of Poland. In A Modern Guide to National Urban Policies in Europe; Edward Elgar Publishing: Cheltenham, UK, 2021. [Google Scholar] [CrossRef]
  46. Krajewska, M.; Szopińska, K.; Siemińska, E.; Kostov, I. Revitalization as an Action in Space-Case Study of Large Cities in Poland and Bulgaria. GIS Odyssey J. 2022, 2, 153–173. [Google Scholar] [CrossRef]
  47. Churski, P. Cohesion Policy in Poland Assumptions and Implementation. In Proceedings of the 11th Slovak-Czech-Polish Seminar “Flows, Spaces and Societies in Central Europe”, Trenčianske Teplice, Slovakia, 14–16 June 2017. [Google Scholar]
  48. Czupich, M. Level of Social Participation in the Creation of Urban Regeneration Programmes-The Case Study of Small Towns in Poland. Eur. Spat. Res. Policy 2018, 25, 81–98. [Google Scholar] [CrossRef]
  49. Darem, A.A.; Alhashmi, A.A.; Almadani, A.M.; Alanazi, A.K.; Sutantra, G.A. Development of a Map for Land Use and Land Cover Classification of the Northern Border Region Using Remote Sensing and GIS. Egypt. J. Remote Sens. Space Sci. 2023, 26, 341–350. [Google Scholar] [CrossRef]
  50. Abdulrahman, A.I.; Ameen, S.A. Predicting Land Use and Land Cover Spatiotemporal Changes Utilizing CA-Markov Model in Duhok District between 1999 and 2033. Acad. J. Nawroz Univ. 2020, 9, 71–80. [Google Scholar] [CrossRef]
  51. Kuang, W.; Zhang, S.; Li, X.; Lu, D. A 30 m Resolution Dataset of China’s Urban Impervious Surface Area and Green Space, 2000–2018. Earth Syst. Sci. Data 2021, 13, 63–82. [Google Scholar] [CrossRef]
  52. Shi, Y.; Qi, Z.; Liu, X.; Niu, N.; Zhang, H. Urban Land Use and Land Cover Classification Using Multisource Remote Sensing Images and Social Media Data. Remote Sens. 2019, 11, 2719. [Google Scholar] [CrossRef]
  53. Vaid, T.; Pathania, S.S. Land Use-Land Cover Changes and Associated Drivers: A Case of Salooni Block of Chamba. Curr. World Environ. 2024, 19, 491–504. [Google Scholar] [CrossRef]
  54. Ramírez-Cuesta, J.M.; Minacapilli, M.; Motisi, A.; Consoli, S.; Intrigliolo, D.S.; Vanella, D. Characterization of the Main Land Processes Occurring in Europe (2000–2018) through a MODIS NDVI Seasonal Parameter-Based Procedure. Sci. Total Environ. 2021, 799, 149346. [Google Scholar] [CrossRef]
  55. Sengan, S.; Karn, A.L.; Pustokhin, D.A.; Pustokhina, I.V.; Alharbi, M. A Hybrid Learning Model for Efficient Classification of Land Use and Land Change from Satellite Images. Phys. Chem. Earth Parts A/B/C 2022, 128, 103284. [Google Scholar] [CrossRef]
  56. Erasu, D. Remote Sensing-Based Urban Land Use/Land Cover Change Detection and Monitoring. J. Remote Sens. GIS 2017, 6, 5. [Google Scholar] [CrossRef]
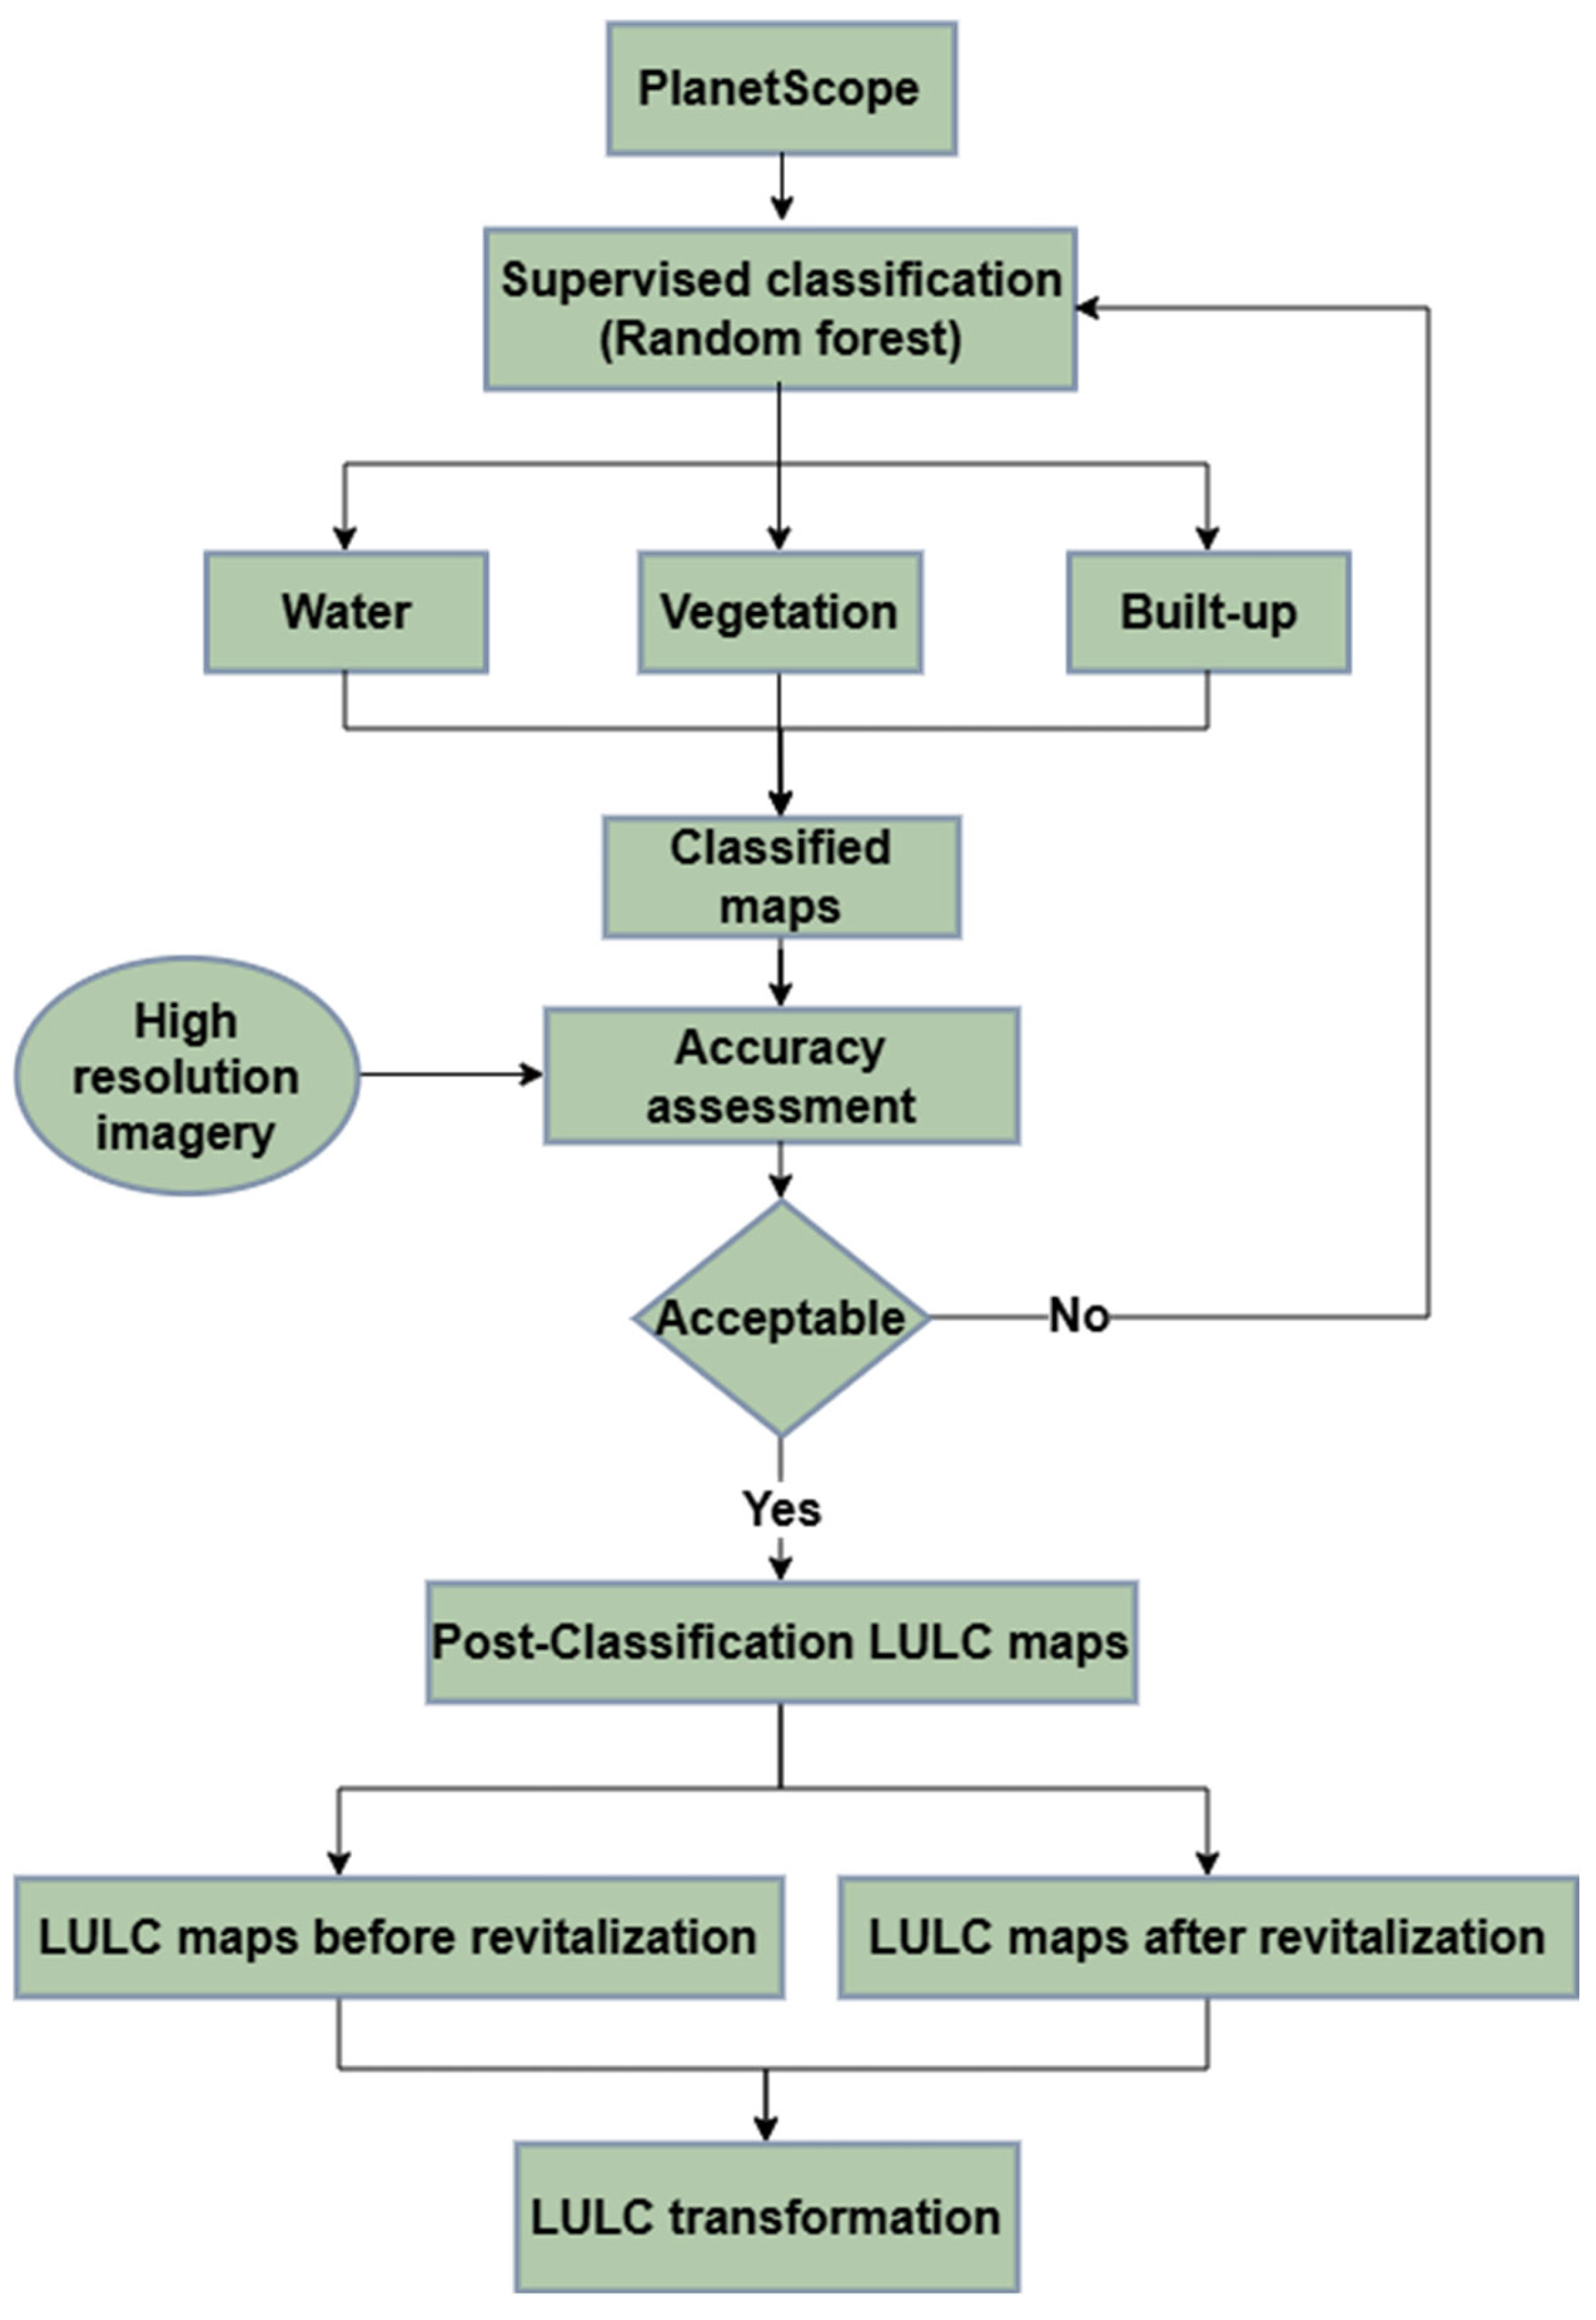
Figure 1. Methods used in data analysis.
Sustainability 17 10126 g001
Figure 2. Shougang Park in Beijing. (a) The location of Shougang Park (revitalization area) in Beijing (studied city). (b) LULC results before (4 August 2017) and after (10 August 2022) revitalization in Beijing Shougang Park. (c) LULC transitions from 4 August 2017 to 10 August 2022 in Beijing Shougang Park.
Sustainability 17 10126 g002
Figure 3. The Core Area of Nanjing Jiangbei New Area. (a) The location of the Core Area of Nanjing Jiangbei New Area (revitalization area) in Nanjing (studied city). (b) LULC results before (23 August 2017) and after (28 September 2024) revitalization in the Core Area of Nanjing Jiangbei New Area. (c) LULC transitions from 23 August 2017 to 28 September 2024 in the Core Area of Nanjing Jiangbei New Area.
Sustainability 17 10126 g003
Figure 4. The revitalization area in Poznań. (a) The location of the revitalization area in Poznań (studied municipality). (b) LULC results before (19 September 2017) and after (14 August 2024) revitalization in Poznań revitalization area. (c) LULC transitions from 19 September 2017 and to 14 August 2024 in the Poznań revitalization area.
Sustainability 17 10126 g004
Figure 5. Revitalization area in Kraków. (a) The location of the revitalization area in Kraków (studied municipality). (b) LULC results before (30 September 2016) and after (24 September 2024) revitalization in the western and eastern parts of Kraków revitalization area. (c) LULC transitions from 30 September 2016 to 24 September 2024 in Kraków revitalization area.
Sustainability 17 10126 g005
Figure 6. Revitalization area in Wągrowiec municipality. (a) The location of revitalization area in Wągrowiec (studied municipality). (b) LULC results before (16 July 2017) and after (22 September 2024) revitalization in Wągrowiec revitalization area. (c) LULC transitions from 16 July 2017 to 22 September 2024 in Wągrowiec revitalization area.
Sustainability 17 10126 g006
Figure 7. Revitalization area in Swarzędz municipality. (a) The location of revitalization area in Swarzędz (studied municipality). (b) LULC results before (12 May 2017) and after (31 July 2024) revitalization in Swarzędz revitalization area. (c) LULC transitions from 12 May 2017 to 31 July 2024 in Swarzędz revitalization area.
Sustainability 17 10126 g007
Figure 8. Revitalization area in Parczew Municipality. (a) The location of revitalization area in Parczew (studied municipality). (b) LULC results before (28 May 2017) and after (27 June 2024) revitalization in Parczew revitalization area. (c) LULC transitions from 28 May 2017 to 27 June 2024 in Parczew revitalization area.
Sustainability 17 10126 g008
Figure 9. Revitalization area in Mosina Municipality. (a) The location of revitalization area in Parczew (studied municipality). (b) LULC results before (19 May 2017) and after (28 August 2024) revitalization in Mosina revitalization area. (c) LULC transitions from 19 May 2017 to 28 August 2024 in Mosina revitalization area.
Sustainability 17 10126 g009
Table 1. The PlanetScope and World Imagery Wayback data acquisition dates before and after revitalization.
Before RevitalizationAfter Revitalization
PlanetScopeWorld Imagery WaybackPlanetScopeWorld Imagery Wayback
Beijing4 August 201710 August 201710 August 202210 August 2022
Nanjing23 August 201730 August 201728 September 202419 September 2024
Poznań19 September 201713 September 201714 August 202415 August 2024
Kraków30 September 201612 October 201624 September 202419 September 2024
Wągrowiec16 July 201714 July 201722 September 202419 September 2024
Swarzędz12 May 201717 May 201731 July 202415 August 2024
Parczew28 May 201731 May 201727 June 202427 June 2024
Mosina19 May 201717 May 201728 August 202415 August 2024
Table 2. Classification system of LULC in this study.
LULC CategoryDefinition
VegetationAreas where the land surface is covered by various plants, whether naturally grown or artificially planted.
WaterAreas where the land surface is covered by water, both flowing and stagnant, naturally formed and artificially constructed.
Built-upAreas predominantly covered by impermeable artificial constructions (e.g., buildings, roads, pavement, squares) that seal the natural ground, primarily used for human habitation, commerce, transportation, and recreation.
Table 3. Accuracy assessment results (kappa coefficient and overall accuracy).
Accuracy AssessmentKappa CoefficientOverall Accuracy
Before RevitalizationAfter RevitalizationBefore RevitalizationAfter Revitalization
Beijing0.900.890.950.94
Nanjing0.860.830.920.90
Poznań0.800.910.890.95
Kraków0.800.800.890.89
Wągrowiec0.820.810.900.90
Swarzędz0.830.800.910.90
Parczew0.830.830.910.91
Mosina0.790.800.890.89
Table 4. The area before and after revitalization, persistence, net change rate, gain rate, loss rate, and swap rate for the transformation of three LULC categories, water, vegetation, and built-up area, among the eight cases in this study.
City/MunicipalityLand Cover CategoriesArea (Before Revitalization/km2)Area (After Revitalization/km2)Persistence (Area/km2)Net Change Rate/%Gain Rate/%Loss Rate/%Swap Rate/%
BeijingWater0.290.250.14−12.9838.3251.3076.64
Vegetation2.562.751.467.3650.3542.9985.97
Built-up5.785.634.44−2.6220.5723.1941.14
NanjingWater0.622.500.42302.31334.5232.2164.42
Vegetation15.7913.148.38−16.7930.0946.8960.19
Built-up16.9617.7311.104.5439.1134.5769.14
PoznańWater0.710.460.39−35.3010.3445.6320.67
Vegetation14.3612.2811.42−14.486.0520.5212.09
Built-up9.7212.058.8623.9832.758.7717.53
KrakówWater0.010.010.0006−1.7291.3693.09182.73
Vegetation4.293.803.36−11.3310.2021.5220.39
Built-up4.194.683.7511.5822.0310.4520.90
WągrowiecWater0.020.060.01288.51332.8144.2988.59
Vegetation1.311.201.12−8.026.3414.3612.69
Built-up0.900.960.806.7917.7710.9821.97
SwarzędzWater0.070.070.051.1823.5922.4244.83
Vegetation3.703.803.302.5713.5210.9421.89
Built-up1.721.621.23−5.5923.2028.7946.40
ParczewWater0.050.060.0421.6332.4310.7921.59
Vegetation1.531.451.29−5.2810.2115.4920.43
Built-up0.770.840.609.2430.5321.3042.59
MosinaWater0.030.060.02128.41168.7740.3680.71
Vegetation1.271.151.02−9.9010.0819.9820.16
Built-up0.850.940.7110.6227.1316.5133.02
Disclaimer/Publisher’s Note: The statements, opinions and data contained in all publications are solely those of the individual author(s) and contributor(s) and not of MDPI and/or the editor(s). MDPI and/or the editor(s) disclaim responsibility for any injury to people or property resulting from any ideas, methods, instructions or products referred to in the content.