1. Introduction
Slope instabilities persist as a significant issue for transportation routes, open-pit mines [
1], and linear infrastructure, as earthworks and cuts must coexist with diverse geology and changing pore pressures [
2,
3,
4]. Along roads, railways, canals, and pipelines, translational and rotational failures disrupt traffic and supply chains, damage property, and endanger lives [
5]. Highway agencies observe that heavy rainfall is increasingly destabilizing roadside slopes, leading to detours, backups, and delays, while also increasing fuel and repair costs [
6]. Beyond immediate repair costs, emergency earthworks consume energy, mobilize equipment, and often result in significant embodied carbon losses due to reconstruction and waste disposal [
7,
8]. Slopes at mine pits and along haul roads significantly impact production schedules and worker safety; unexpected failures can halt operations, disrupt commodity supply chains, and necessitate carbon-intensive remedial work [
9]. Recent international studies have also examined the stability of open-pit mine slopes using deterministic and numerical frameworks [
10,
11]. In renewable energy projects, cut-and-fill slopes provide access to wind turbine pads and support cable trenches for solar arrays; instability can halt power generation, necessitate regrading, and threaten climate mitigation efforts [
12]. These examples underscore the importance of integrating risk, sustainability, and resilience concepts promoted in the United Nations’ 2030 Agenda, which emphasizes infrastructure that supports inclusive, sustainable industrialization while addressing climate change [
13]. This connection between slope reliability and renewable energy reliability highlights how geotechnical stability directly underpins the long-term sustainability of energy transition infrastructure.
Climate change worsens these challenges. The Intergovernmental Panel on Climate Change (IPCC) states that landslides and rockfalls are often caused by factors related to precipitation intensity, duration thresholds, and prior wet periods [
14,
15]. As climate-driven rainfall events become more frequent and severe, the amount of water in slopes increases, pore pressures build up, and effective stresses diminish [
16]. Thawing permafrost and retreating glaciers further destabilize mountain slopes [
17]. Therefore, transportation agencies face an increasing risk of rainfall-triggered failures [
6]. Traditional classifications of slopes as “stable” or “unstable” may not provide enough guidance amid this uncertainty [
18]. Instead, professionals need probabilistic failure forecasts that estimate the likelihood of instability based on soil properties and slope shape, enabling better prioritization, staged interventions, and more efficient budget allocation [
19]. Reliability-based approaches, such as those in Eurocode 7, require geotechnical parameters to be treated as random variables, with design limits set so that the likelihood of exceeding a failure threshold remains below a specified level (for example, a 5% chance of surpassing the limit when selecting characteristic values) [
20]. Probabilistic measures naturally fit with existing design standards and asset management strategies [
21,
22].
This paper presents an interpretable, probabilistic workflow for risk-informed slope stability screening. Unlike earlier machine-learning methods that primarily emphasize classification accuracy, the proposed framework integrates probability calibration, monotone constraints, and explainable feature attribution into a unified, auditable pipeline. This integration guarantees physically consistent predictions and transparent, risk-aware outputs that connect data-driven modeling with geotechnical design practices. Building on the 627-case circular failure database reported by Ma and co-authors (2022) [
23], six conventional predictors: unit weight (γ), cohesion (c), friction angle (φ), slope angle (β), slope height (H), and pore pressure ratio (r
u) are used to train a gradient boosting tree classifier (XGBoost). The database was compiled from published data on homogeneous slopes and includes both stable and failed cases. Gradient boosting was selected because it can capture nonlinear interactions, handle non-Gaussian inputs, and manage class imbalance without relying on strict distributional assumptions. The algorithm creates an ensemble of decision trees, where each tree corrects the errors of the previous ones, leading to high predictive accuracy; however, unlike deep neural networks, its structure remains interpretable. To encourage adoption by engineers, interpretability is crucial. Therefore, Shapley Additive exPlanations (SHAP) are used to decompose each prediction into contributions from the six input parameters, enabling interpretation of model behavior in the context of Mohr–Coulomb mechanics (e.g., higher shear strength reduces failure probability, whereas steeper slope angles increase it). Model uncertainty is summarized through a straightforward bootstrap procedure that resamples the training data and assesses the variability in predicted probabilities, eliminating the need for complex Bayesian methods. Together, these components produce calibrated failure probabilities (P
f) for each slope in the database.
A risk-informed approach extends beyond simply predicting whether a slope might fail; it supports informed decision-making across asset portfolios. The failure probability can be categorized into qualitative risk levels that match reliability-based practices. Steep slopes may require immediate action or detailed site-specific evaluations, while moderate risks can lead to increased monitoring or drainage solutions; low risks can be managed through routine maintenance [
24]. This continuum enables staged responses and helps prevent over-engineering or premature reconstruction. Notably, early interventions often involve low-carbon, nature-based solutions, such as surface-water control, drainage blankets, vegetative bioengineering, or regrading with local materials [
25]. By acting before a failure, agencies can lower emergency response costs, reduce embodied carbon emissions, and minimize social impacts of service disruptions [
8]. This method supports sustainability and resilience objectives, as the Sustainable Development Goals emphasize the importance of resilient infrastructure and urgent climate action [
26]. Meanwhile, transportation agencies must operate within tight budgets and prioritize slope repairs. Probability-based screening serves as a decision bridge between data-driven predictions and policy frameworks, such as Eurocode 7, which already incorporate reliability concepts [
27].
To illustrate the practical value of this risk-informed methodology, consider an access road cut leading to a hilltop wind farm in complex terrain. The cut may have variable cohesion, a moderate friction angle, and a steep incline; the model might estimate a failure probability of, say, 0.35. This moderate risk could lead the developer to install surface drains and vegetative covers early in the project, thereby reducing the chance of an emergency slope repair that could delay turbine installation and increase the project’s carbon footprint. A second example involves reservoir-adjacent slopes at a hydropower project. Seasonal drawdown cycles raise pore pressure ratios and destabilize the slopes. A high predicted failure probability would justify preemptive reinforcement or the installation of drainage wells to ensure generation reliability and prevent unplanned outages. Third, consider the berms and cable corridors connecting arrays in a utility-scale solar farm on gently sloping terrain. Although the geometry appears benign, low cohesion and intense storms could raise failure risks; risk-aware screening would recommend targeted erosion control and monitoring to ensure continuous power delivery. These examples demonstrate how probabilistic predictions can enhance availability, minimize rework, and reduce embodied emissions across renewable energy assets.
The primary objective of this study is to develop an interpretable, calibrated, and physically consistent machine learning framework for probabilistic slope stability assessment. The proposed process combines gradient-boosted tree modeling, probability calibration, and uncertainty quantification to estimate the probability of slope failure (Pf) using standard geotechnical parameters. Physically guided monotone constraints ensure that the model aligns with soil mechanics principles, while SHAP analysis provides transparent explanations of feature influence at both overall and specific levels. By integrating calibration, interpretability, and uncertainty assessment within a single, auditable framework, the study seeks to support risk-informed and sustainable geotechnical decision-making across infrastructure, mining, and renewable energy sectors.
3. Methodology
3.1. Dataset Description
This study uses the slope-stability database reported in a single source (Ma et al., 2022) [
23], which compiles 627 documented cases specifically prepared for machine-learning analysis of circular-mode failures. Each entry includes six geometric and geotechnical predictors: unit weight (γ, kN/m
3), cohesion (c, kPa), internal friction angle (φ, °), slope angle (β, °), slope height (H, m), and pore-pressure ratio (r
u), along with a binary stability label (stable or failed). The class distribution in the dataset is nearly balanced (311 stable, 316 failed), reducing the risk of severe class imbalance bias during model training and evaluation.
The database encompasses both soil and rock cases, including clay, silt, sand, gravel, weathered soils, highly weathered rock masses, epimetamorphic rocks, and waste rock dumps. It features examples from diverse environments like natural hillslopes (often triggered by rainfall) and engineered slopes such as road cuts, fills, embankments, mining benches, and waste-rock dumps. Geographically, the records encompass multiple regions, including Guizhou and the Qing River basin in China, highway slopes in Southeast Asia, and additional cases from Europe, Asia, and North America. The source studies depend on field investigations and case histories; when necessary, geotechnical parameters were back-calculated using standard limit-equilibrium methods, resulting in a consistent set of six inputs per case [
58].
Descriptive statistics (n = 627) highlight the breadth and heterogeneity of the inputs (summarized in
Table 2). For γ, the mean is 20.19 kN/m
3 (SD 7.04) with a range of 0.49–33.16 and quartiles Q
1 = 18.77, median = 20.96, Q
3 = 25.00. Cohesion c has a mean of 25.60 kPa (SD 31.04), a range of 0–300.00, and Q
1 = 8.00, median = 19.69, Q
3 = 34.77. The friction angle φ has mean 25.31° (SD 12.33), range 0–49.50°, and Q
1 = 19.94°, median = 28.80°, Q
3 = 35.00°. The slope angle β has mean 32.60° (SD 13.71), range 0.30–65.00°, and Q
1 = 25.00°, median = 34.98°, Q
3 = 44.52°. Slope height H has a mean of 90.29 m (SD 120.14), a range of 0.018–565.00 m, and Q
1 = 12.00 m, median = 45.80 m, Q
3 = 100.00 m. The pore-pressure ratio r
u has a mean of 0.25 (SD 0.26), a range of 0–1.00, and Q
1 = 0.00, median = 0.25, Q
3 = 0.35. These wide, non-symmetric distributions, especially in H, c, and r
u, indicate heterogeneous geological and hydrological conditions across cases, motivating the nonlinear, probabilistic modeling choices developed in subsequent sections.
3.2. Data Preprocessing
Before model development, the dataset of 627 slope-stability cases was screened to ensure consistency and geotechnical interpretability. All six input variables, unit weight (γ), cohesion (c), friction angle (φ), slope angle (β), slope height (H), and pore-pressure ratio (ru), were retained with their original units, thereby preserving direct comparability with conventional slope-stability formulations. The outcome variable was encoded as a binary class label, with 0 representing stable slopes and 1 representing failures.
The dataset had no missing entries, though the wide ranges in cohesion, slope height, and pore-pressure ratio reflected diverse geological and hydrological conditions across the case histories. These features, as shown in the descriptive statistics (
Table 2), prompted the use of flexible, probabilistic machine-learning models that can handle nonlinear relationships and potential class imbalance.
For supervised learning, the data were structured into feature vectors (X) and target labels (y). No feature scaling or normalization was applied, as tree-based ensemble methods are invariant to monotonic transformations of input variables and preserve the geotechnical meaning of each parameter for subsequent interpretability analyses [
59].
A brief data-quality check was also performed to confirm physical consistency. Extremely unrealistic unit-weight values (γ < 10 kN/m3 or >27 kN/m3) were replaced with the column median, while all other parameters were checked to ensure they fell within plausible geotechnical ranges. This light-touch correction preserved the dataset’s integrity without altering its statistical structure.
3.3. Model Selection and Training
Model choice was guided by the evidence that tree-ensemble methods perform exceptionally well on the same 627-case database used in this study [
23]. In particular, Ma et al. [
23] (2022) trained 8208 pipelines via H
2O-AutoML and reported that stacked ensembles and tree ensembles (GBM, DRF/XRT) achieved top discriminative power on this task (test AUC ≈ 0.97; ACC ≈ 0.90), outperforming manually tuned baselines. These results indicate that nonlinear, interaction-aware tree models are well-suited to the heterogeneous, non-Gaussian distributions of γ, c, φ, β, H, and r
u, and they further motivate the adoption of a gradient-boosted tree classifier in this study.
A stratified 80/20 hold-out split was applied to preserve the nearly balanced class distribution. All hyperparameter tuning was confined to the training data to prevent information leakage. Bayesian optimization was carried out using the Optuna framework over 100 trials, employing five-fold stratified cross-validation and mean AUC as the objective function. The search space included tree depth (3–12), learning rate (0.01–0.3, log-scaled), number of estimators (100–2000), subsample and colsample_bytree (0.5–1.0), min_child_weight (1–10), and regularization parameters λ and α (0–10).
During hyperparameter optimization, Bayesian search was performed using the Optuna framework, with five-fold stratified cross-validation and AUC as the objective function. To enforce physically meaningful model behavior, monotone constraints were included (0, −1, −1, +1, +1, +1), ensuring that the predicted failure probability decreases with cohesion and friction angle and increases with slope angle, height, and pore-pressure ratio.
3.4. Model Evaluation
Model evaluation was performed using a hold-out method with a stratified 80/20 train-test split on the 627-case dataset, ensuring balanced class distribution in both subsets. Hyperparameter tuning was performed solely on the training data using Optuna, with five-fold stratified K-fold cross-validation to optimize the area under the receiver operating characteristic curve (AUC) as the target metric. The final model was trained on the entire training set with the best hyperparameters. The hold-out test set comprised 20% of the total data (n = 125) and remained strictly unseen throughout model training and tuning to ensure unbiased performance evaluation.
Performance was evaluated on the unseen test set using both threshold-independent and threshold-dependent metrics. Discrimination was measured with AUC based on predicted failure probabilities. At a default probability threshold of 0.5, threshold-dependent metrics included accuracy, F1-score, Matthews correlation coefficient (MCC), and balanced accuracy.
Additionally, probability calibration and diagnostic analyses were performed to verify the reliability of the probabilistic outputs. The Brier score and its decomposition, along with expected and maximum calibration errors (ECE and MCE), were calculated, and reliability (calibration) curves were plotted to evaluate the agreement between predicted and observed failure frequencies. Precision–recall analysis (PR-AUC) and confusion matrix evaluation were also conducted to characterize model behavior near operational thresholds.
3.5. Probability-Based Risk Classification
The predicted failure probabilities (P
f) were calculated by applying the final trained XGBoost model to the test set features using the model’s predict_proba method, selecting the probability for the positive class (slope failure). In the XGBoost framework with the binary logistic objective, these probabilities are computed using the logistic (sigmoid) function applied to the raw ensemble scores:
where
represents the summed output (raw score) from the boosted trees for input features xx. These probabilities were then categorized into risk levels using predefined thresholds: High Risk for P
f > 0.10 (unacceptable in most cases), Medium Risk for 0.01 ≤ P
f ≤ 0.10 (cautionary or acceptable for low-consequence or temporary scenarios), and Low Risk for P
f < 0.01 (acceptable for moderate- to high-consequence permanent slopes, such as new cuts on interstate highways). These thresholds were selected based on geotechnical engineering guidelines for slope stability, as outlined in references such as Santamarina et al. (1992) [
60] and the WSDOT Geotechnical Design Manual (2013). A summary table was created to report the count and proportion of each risk category.
3.6. Model Interpretability with SHAP
To interpret the behavior of the final XGBoost classifier, Shapley Additive exPlanations (SHAP) were employed using the TreeExplainer framework, which is optimized for tree-based ensemble models. SHAP provides a unified way to decompose each model prediction into contributions from individual input variables, thereby linking machine learning outputs to engineering reasoning.
For each feature
, the corresponding SHAP value
quantifies its average marginal contribution to the model output across all possible feature combinations. It is defined as:
With as the set of all features, as subsets excluding , and as the model’s prediction function conditioned on the subset. This cooperative game-theoretic formulation ensures that contributions from all features sum to the model’s total prediction for each instance.
At the local level, SHAP values describe how much each feature drives an individual prediction toward either the “stable” or “failed” class. At the global level, the mean absolute SHAP value across all samples effectively indicates the overall influence of each feature on the model’s output, serving as a metric for feature importance. Feature-level dependence plots were also generated to verify that the monotone constraints were followed, showing that cohesion (c) and friction angle (φ) decrease Pf, while slope angle (β), height (H), and pore-pressure ratio (ru) increase Pf.
This analysis enables a geotechnically meaningful interpretation: parameters associated with higher shear strength (e.g., and ) generally reduce the predicted failure probability, while larger slope angles () or pore-pressure ratios () increase it. Hence, SHAP not only enhances transparency but also bridges the model’s behavior with established principles of soil mechanics.
3.7. Uncertainty Quantification via Bootstrap Analysis
Uncertainty in the predicted failure probability (Pf) curves was quantified using a model-based bootstrap procedure with 1000 iterations. In each iteration, the training data were resampled with replacement, a new XGBoost model was retrained using the optimized hyperparameters, and the predicted probabilities (Pf) were then calculated on the fixed test set. This method captures both epistemic (model) and aleatoric (data) uncertainty, providing confidence bands for Pf–feature relationships. The resampled data were then binned into 10 bins, using linear spacing for continuous features and categorical binning that included the lowest value for categorical features. The mean Pf was calculated for each bin using grouping operations. This process produced multiple curves for each feature, which were combined into an array. The average, lower bound, and upper bound of the 95% confidence interval (calculated using percentiles) were determined using the averaging and percentile functions.
Additionally, a summary table was generated by calculating the mean Pf at the lower, middle, and upper quantiles of each feature’s values in the original test set. A qualitative trend was assigned based on comparisons between the high and low quantile Pf values: “Strong ↑” if the high value was more than 1.5 times the low value, “Moderate ↑” if more than 1.2 times, “Strong ↓” if less than half the low value, “Moderate ↓” if less than 0.8 times the low value, “Flat” if the absolute difference was small, else “Weak ↑”.
4. Results
4.1. Model Performance
The final monotone-constrained XGBoost classifier showed strong predictive performance on the hold-out test set. As summarized in
Table 3, the model achieved an overall accuracy of 0.80 and an AUC of 0.88, confirming excellent discrimination between stable and failed slopes. At the default probability cutoff of 0.50, the F1-score was 0.82, while the Matthews correlation coefficient (MCC = 0.61) and balanced accuracy (0.80) indicate consistent performance across both classes.
The confusion matrix (
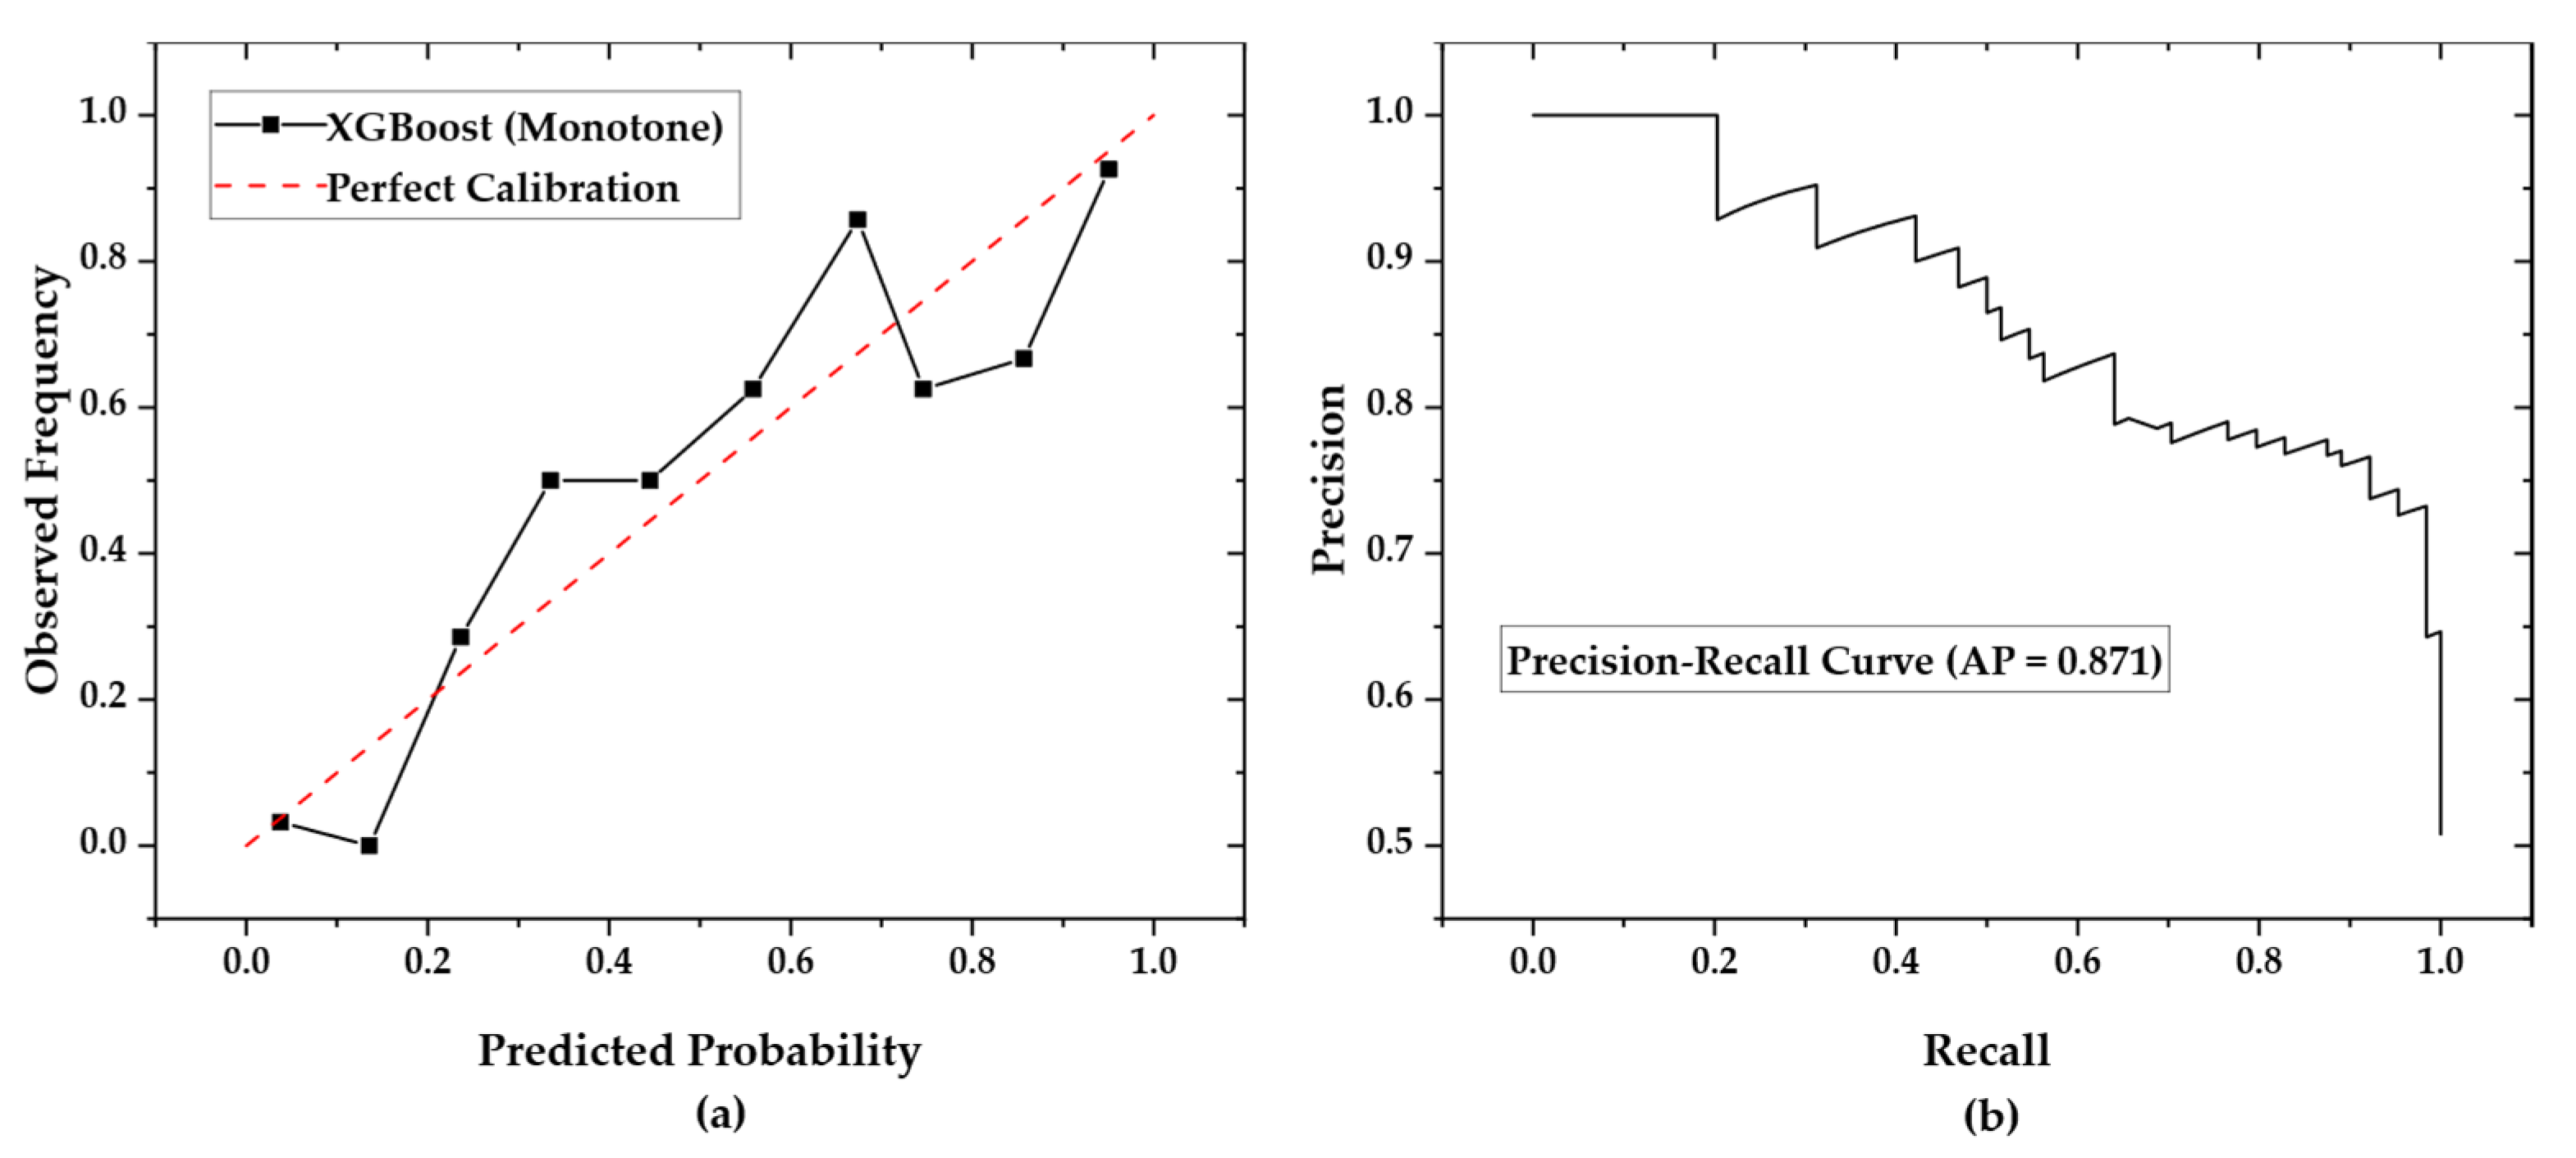
Table 4) shows balanced predictive performance, with low false-negative and moderate false-positive rates at the default probability threshold (0.50). The precision–recall AUC (PR-AUC = 0.87) further confirms strong discrimination within the relevant operational region for risk classification.
Beyond standard metrics, calibration and diagnostic analyses confirmed that the model produces well-calibrated probabilities, making it suitable for risk assessment. The Brier score (0.14), Expected Calibration Error (ECE = 0.10), Maximum Calibration Error (MCE = 0.19), and precision–recall AUC (PR-AUC = 0.87) all show that the predicted failure probabilities are closely aligned with the observed outcomes.
Figure 1 shows the model-validation diagnostics: (a) the reliability (calibration) curve indicating close alignment between predicted and observed failure rates, and (b) the precision–recall (PR) curve showing strong precision across the operational probability range used for risk assessment.
These results show that the gradient-boosted tree framework effectively captures nonlinearities and higher-order interactions among the six geotechnical and geometric predictors, providing a strong baseline that remains competitive with the top ensemble methods reported by Ma et al. (2022) [
23].
4.2. Probability Distribution of Failure
To analyze how the final XGBoost model distributes predicted probabilities of slope failure, the probability outputs (P
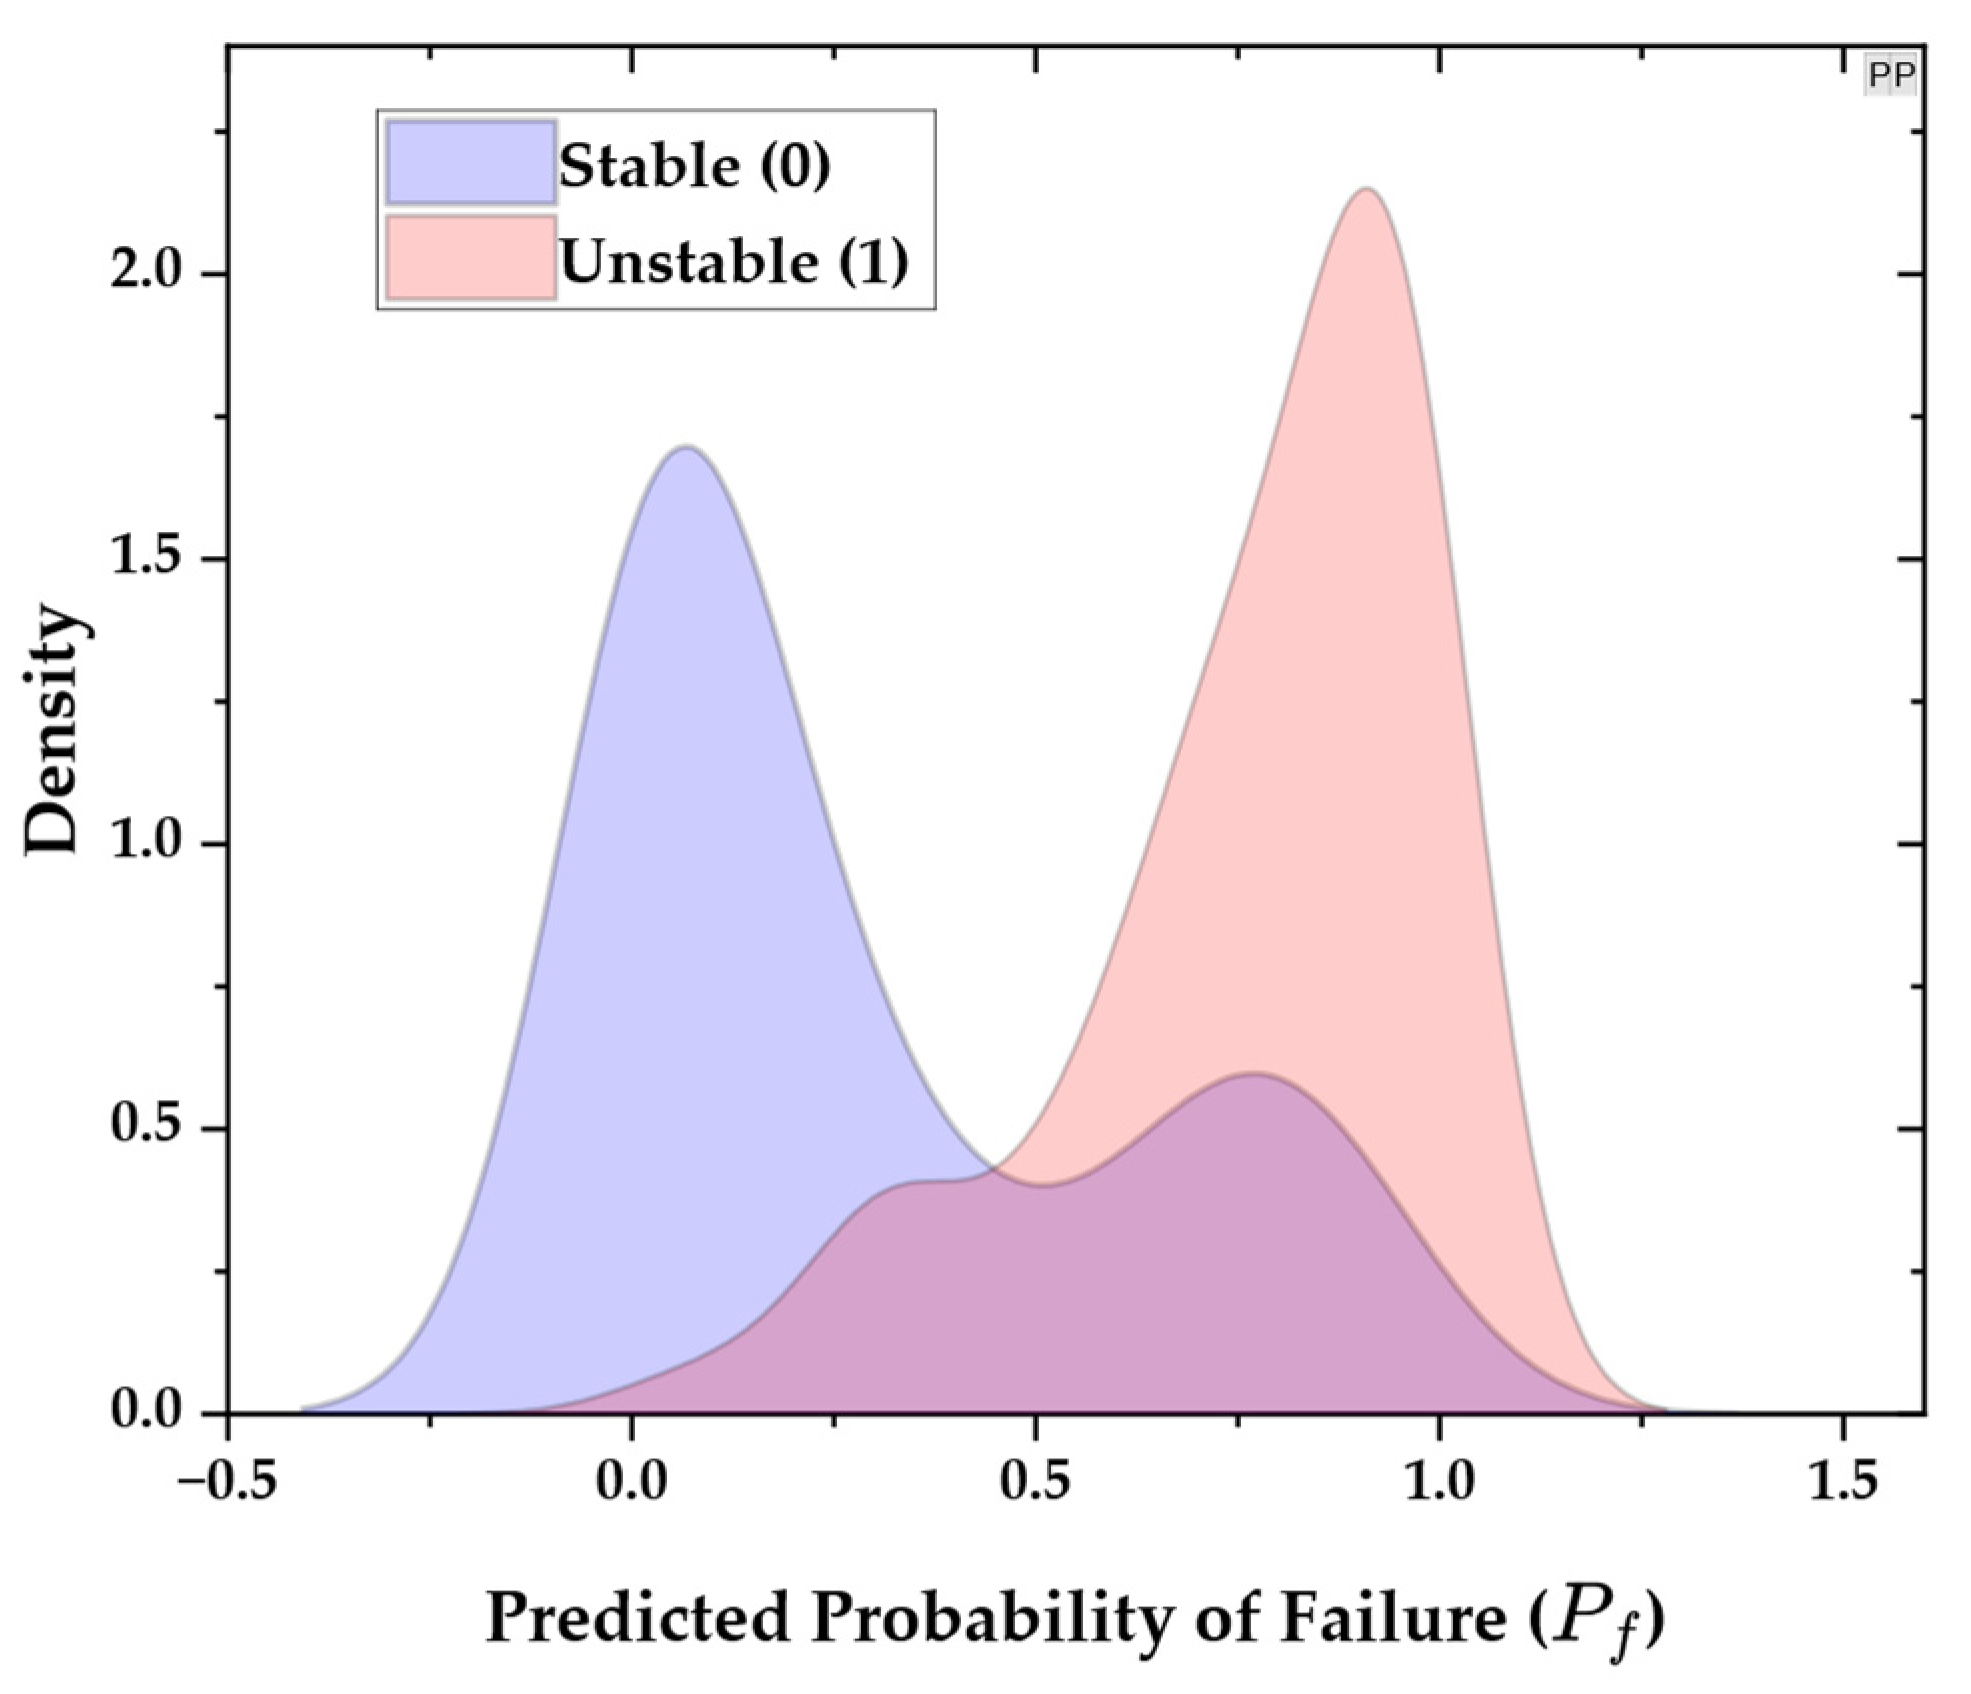
f) were examined across the hold-out test set. The histogram and density curve shown in
Figure 2 demonstrate that the model generates a wide range of P
f values rather than concentrating predictions toward the 0.0 or 1.0 extremes.
Most stable cases are concentrated near low predicted probabilities, while most failed cases are clustered around higher values, confirming good separation between the two classes. However, the overlap in the mid-probability region indicates the presence of uncertain instances where the geotechnical conditions share features of both stable and unstable slopes. This overlap is expected, given the heterogeneity of the dataset (
Section 3.1), and highlights the importance of probabilistic rather than purely deterministic classification in slope engineering.
Overall, the distribution demonstrates that the model not only discriminates effectively between stable and failed slopes but also yields calibrated probabilities that can be meaningfully interpreted for risk stratification, as further explored in
Section 4.3.
4.3. Risk-Informed Classification
To convert predicted probabilities into practical categories for geotechnical decision-making, the calibrated, monotone-constrained XGBoost model outputs (P
f) were divided into three risk classes based on the thresholds outlined in
Section 3.5. As summarized in
Table 5, most slopes (95 cases, 75.40%) were classified as High Risk (P
f > 0.10), indicating conditions that are generally unacceptable for permanent engineered slopes and requiring immediate stabilization or redesign. A smaller group (28 cases, 22.22%) fell into the Medium Risk category (0.01 ≤ P
f ≤ 0.10), which may be acceptable in temporary or low-consequence situations but warrants caution for long-term infrastructure. Only three slopes (2.38%) were considered Low Risk (P
f < 0.01), representing conditions suitable for high-consequence or permanent projects, such as highway cuts or large embankments.
This distribution indicates that most slopes in the dataset have higher failure probabilities, aligning with the inclusion of many case histories from failed or marginally stable slopes. More importantly, the classification demonstrates how probability-based outputs can be linked to engineering risk categories, creating a connection between machine-learning predictions and practical slope design or remediation decisions.
4.4. Feature Importance
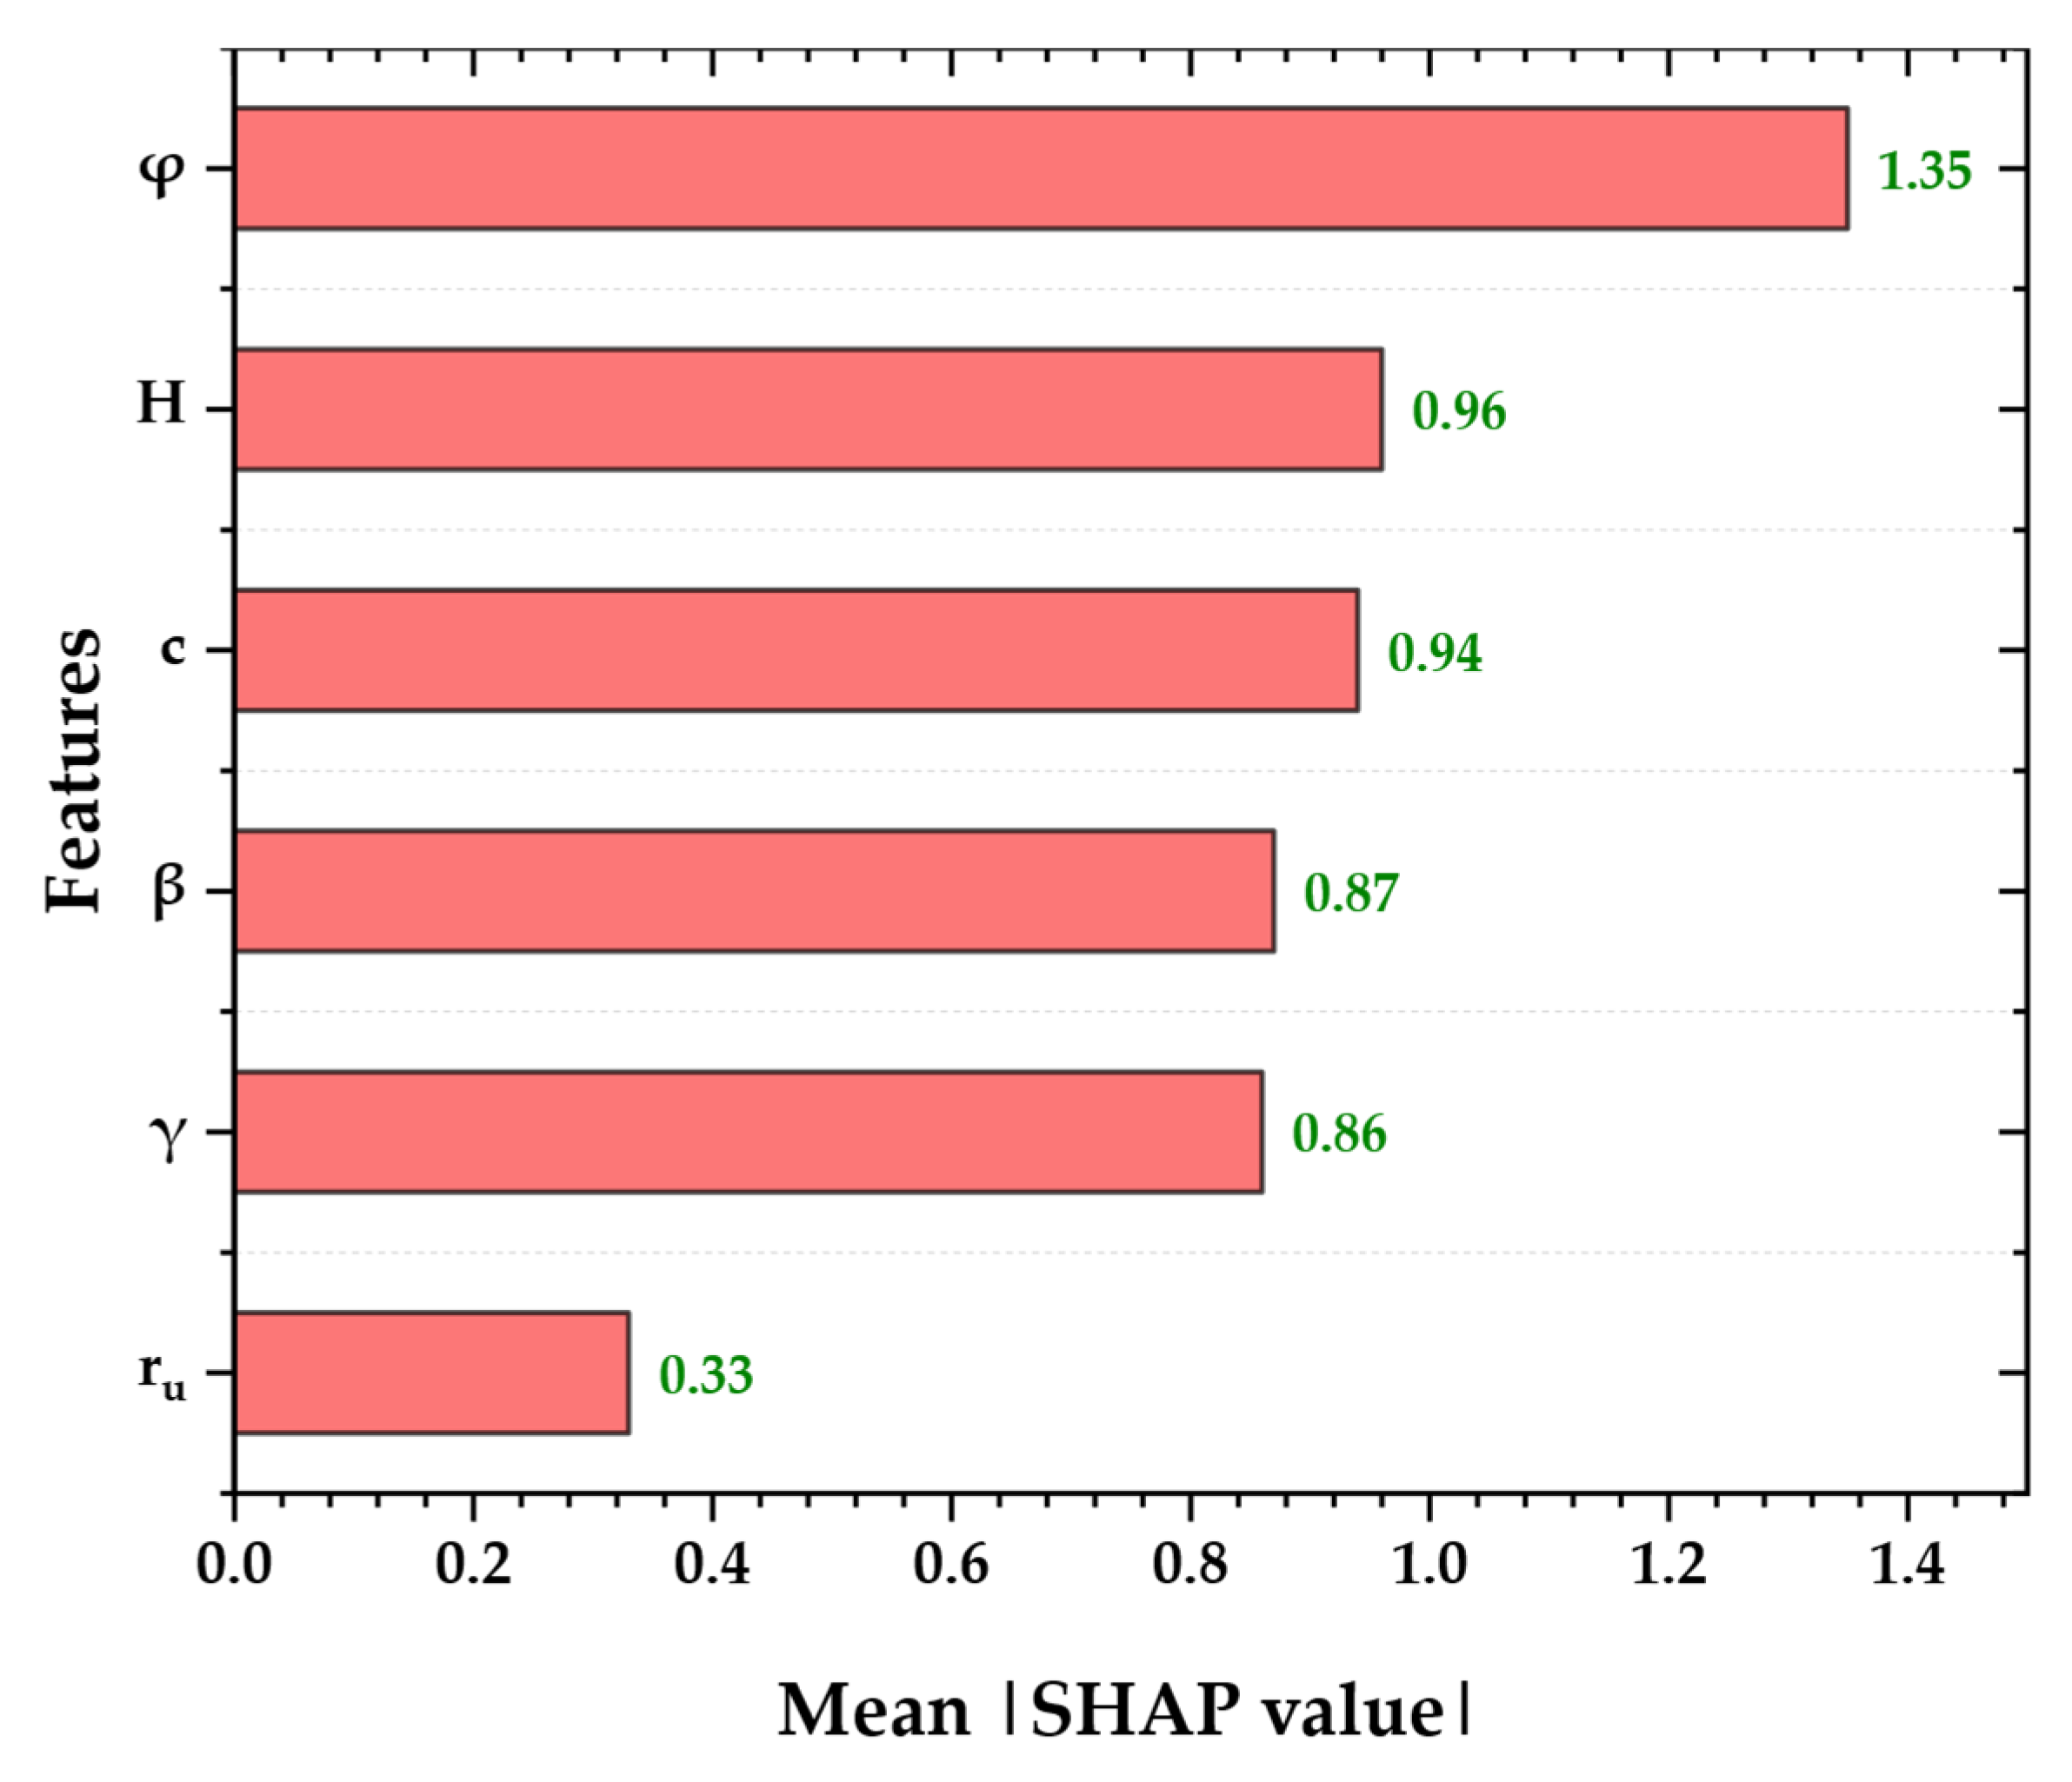
The global feature importance derived from SHAP values is shown in
Figure 3. The results indicate that the friction angle (φ) remains the most influential parameter, with the highest mean |SHAP| value (≈1.35), confirming its dominant role in controlling shear resistance and overall slope stability. Slope height (H) and cohesion (c) follow closely (≈0.96 and ≈0.94, respectively), emphasizing the combined influence of geometry and material strength on slope performance.
Geometric effects remain important: the slope angle (β) (≈0.87) and unit weight (γ) (≈0.86) both have a significant impact on the model’s predictions, reflecting their role in the balance of driving and resisting forces. The pore-pressure ratio (ru), although a crucial variable in classical limit-equilibrium theory, showed the lowest mean |SHAP| value (≈0.33) in this dataset, probably due to the heterogeneous and partly back-calculated nature of the ru values within the compiled case histories.
Overall, the SHAP-based ranking (φ > H ≈ c > β ≈ γ > ru) aligns with fundamental geotechnical mechanics: strength parameters (φ, c) dominate, followed by geometric and stress-related factors (H, β, γ), while ru; plays a secondary, context-dependent role. This confirms that the monotone-constrained XGBoost model maintains physically interpretable and consistent behavior, strengthening confidence in its use for risk-informed slope analysis.
4.5. Uncertainty-Aware Risk Assessment
The model-based bootstrap uncertainty analysis assessed how predicted failure probabilities (P
f) vary across quartiles of the input features. The results, shown in
Table 6, reveal clear and physically consistent patterns across parameters.
For unit weight (γ), the mean Pf stayed nearly constant, with values of 0.60 (Q1), 0.60 (median), and 0.60 (Q3), indicating a flat response. Cohesion (c) showed a slight stabilizing effect: Pf increased slightly from 0.55 at the lower quartile to 0.60 at the upper quartile, suggesting a weak upward trend in stability with higher cohesion. The friction angle (φ) exhibited the opposite behavior, with Pf decreasing from 0.71 (Q1) and 0.70 (median) to 0.55 (Q3), indicating a moderate decreasing trend and confirming that higher friction angles lower the failure probability.
Geometric factors showed flatter relationships: the slope angle (β) had Pf values of 0.52, 0.54, and 0.52 across quartiles, while slope height (H) showed 0.53, 0.56, and 0.57; both are classified as flat trends. The pore-pressure ratio (ru) yielded Pf values of 0.56 (Q1), 0.47 (median), and 0.45 (Q3), indicating a weak upward trend, which suggests that higher pore pressure slightly increases failure risk but remains secondary in this dataset.
Overall, the analysis confirms that strength parameters (φ and c) are the most responsive features under combined epistemic and aleatoric uncertainty, while γ, β, H, and ru have weaker or context-dependent effects. These trends align with soil-mechanics principles and support that the monotone-constrained model produces physically meaningful responses under uncertainty.
5. Discussion
5.1. Model Performance in the Context of Prior Work
The present study achieved strong predictive performance using a monotone-constrained, calibrated XGBoost classifier, with an AUC of 0.88, an accuracy of 0.80, and an MCC of 0.61 on the hold-out test set (
Table 3). These results confirm that gradient boosting methods are effective for slope stability classification and accurately capture the nonlinear relationships among geotechnical variables. In addition, probability calibration and reliability analyses (Brier, ECE/MCE, PR-AUC) confirmed that the model’s probabilistic outputs are well-aligned with observed outcomes, further supporting its use in risk-based applications.
Compared to previous studies, the results closely align with the findings of Ma et al. (2022) [
23], who utilized an automated machine learning (AutoML) framework on the same 627-case database. Their experiments demonstrated that tree ensembles consistently ranked among the top-performing algorithms. Specifically, their single GBM model, trained with H
2O AutoML, achieved an AUC of 0.968, an accuracy of 0.920, and an MCC of 0.840 (Figure 6 in Ma et al., 2022 [
23]). These results place GBM at the high end of single-model performance for this task. At the ensemble level, their stacked ensemble of the top 1000 models further enhanced discrimination power, reaching an AUC of 0.970 and accuracy of 0.904, which currently represents the state-of-the-art for this dataset.
Compared to these benchmarks, the tuned XGBoost model performs slightly worse than both the AutoML-optimized GBM and the stacked ensemble in raw predictive metrics. However, the difference is slight: about 0.05 in AUC and 0.07 in accuracy compared to the single GBM. More importantly, this study emphasizes the importance of model transparency and interpretability, which are crucial for geotechnical engineering applications. By selecting a single XGBoost classifier instead of a complex ensemble, the probability outputs and feature contributions can be directly examined using SHAP analysis (
Section 4.5), thereby combining predictive accuracy with engineering interpretability.
Overall, these findings underscore that gradient-boosted trees remain among the most effective algorithms for predicting slope stability. While AutoML ensembles offer incremental accuracy improvements, a carefully tuned single XGBoost model provides a competitive and interpretable option that aligns well with risk-informed geotechnical practices.
5.2. Interpreting Probability Distributions of Failure
The distribution of predicted failure probabilities (Pf) generated by a calibrated, monotone-constrained XGBoost model offers deeper insights than a simple binary classification of “stable” versus “failed.” While deterministic labels may be sufficient for benchmarking accuracy, they conceal the underlying uncertainty inherent in slope stability assessments, particularly when cases are near the boundary between safe and unsafe states. In contrast, probabilistic predictions directly measure this uncertainty, enabling practitioners to differentiate between slopes that are clearly stable (Pf ≈ 0.0), clearly unstable (Pf ≈ 1.0), and those in uncertain, middle ranges.
This probabilistic approach is beneficial for making informed decisions in real-world situations. Slopes with high Pf values should be prioritized for immediate stabilization or remediation, while slopes with low Pf values may be considered safe under current conditions. Cases with moderate probabilities, where predictions are uncertain, highlight areas that might need further field investigation, monitoring, or cautious design choices. This gradual understanding reflects how geotechnical engineers evaluate risk under uncertainty: not solely by a strict cutoff, but by weighing reliability, potential failure consequences, and available mitigation options.
In this way, the probability distribution output transforms the model from a purely predictive tool into a risk-informed decision support system, directly aiding prioritization of interventions across a portfolio of slopes. This capability complements traditional factor-of-safety methods by providing an additional layer of probabilistic evidence to support engineering judgment.
5.3. Risk-Informed Classification and Engineering Implications
Converting predicted probabilities (P
f) from the calibrated, monotone-constrained XGBoost model into categorical risk levels creates a practical link between machine-learning outputs and geotechnical decision-making frameworks. Using thresholds based on geotechnical reliability practices (
Section 3.5), the test-set slopes were categorized into High Risk (P
f > 0.10), Medium Risk (0.01 ≤ P
f ≤ 0.10), and Low Risk (P
f < 0.01). As summarized in
Table 4, most slopes (95 cases, 75.40%) were classified as High Risk, 28 cases (22.22%) as Medium Risk, and only 3 cases (2.38%) as Low Risk.
This distribution underscores the challenging nature of the compiled dataset, which intentionally includes many case histories of failures or marginally stable slopes. More importantly, it demonstrates how probability-based classification aids in risk prioritization, rather than relying on a single deterministic cutoff. Slopes labeled as High Risk are clearly unsuitable for long-term service without stabilization and should be prioritized for repairs. Medium-risk slopes may be conditionally acceptable during temporary, low-consequence activities (such as short-term excavations or construction phases), but they require close monitoring and a conservative design approach. Low-risk slopes, on the other hand, meet the reliability standards that are necessary for permanent engineered projects, such as highways or other critical infrastructure.
From an engineering perspective, this mapping of probability thresholds to categorical risk levels follows established practices in reliability-based design codes (e.g., Eurocode 7, LRFD), where acceptable Pf values are associated with the consequences of failure. The results, therefore, highlight the practical usefulness of machine-learning outputs: they can be directly interpreted in terms of risk-informed slope management, guiding decisions on monitoring, remediation, or conservative design based on both the likelihood and potential impact of failure.
The predominance of slopes classified as “High Risk” reflects the composition of the source database, which intentionally includes many failed or marginally stable cases collected from published back-analyses. This distribution, therefore, represents a research-focused dataset designed to understand failure mechanisms rather than a balanced sample of field slopes, and should not be interpreted as the expected risk proportion in real infrastructure inventories.
5.4. Feature Importance in Geotechnical Perspective
The global SHAP analysis (
Figure 3) emphasizes the relative influence of the six input variables on the model’s predictions. The ranking shows that the friction angle (φ) is the most influential feature, followed closely by slope height (H) and cohesion (c). This finding aligns with classical soil mechanics, where the Mohr–Coulomb shear strength parameters (c, φ) directly determine the resistance along potential slip surfaces, and slope height governs the magnitude of driving forces. Their prominence in the model indicates that material strength and geometric scale remain the key factors controlling slope stability across diverse geological conditions.
Geometric factors such as the slope angle (β) and unit weight (γ) also contribute meaningfully, reflecting their role in modulating the driving-to-resisting force ratio, although their effects are more context-dependent. The pore-pressure ratio (ru) was identified as the least influential feature overall, which may appear counterintuitive given its importance in limit-equilibrium theory. However, many ru values in the compiled dataset were estimated or back-calculated, introducing variability that reduces their predictive consistency in a statistical framework.
Overall, the SHAP-derived importance ranking (φ > H ≈ c > β ≈ γ > ru) is both statistically robust and geotechnically interpretable. These physically consistent trends, obtained from the monotone-constrained, calibrated XGBoost model, reinforce confidence that the model’s decision logic aligns with fundamental slope-stability principles and demonstrates the value of interpretable machine-learning frameworks in geotechnical applications.
5.5. Implications of Uncertainty in Risk Assessment
The model-based bootstrap analysis of feature responses across quartiles (
Table 6) provides insight into how slope-failure probabilities (Pf) vary under combined epistemic and aleatoric uncertainty in the input parameters. The results show that the friction angle (φ) and cohesion (c) exhibit the strongest and most physically meaningful trends, confirming their role as primary strength parameters. For φ, Pf decreases from about 0.71 at the lower quartile to 0.55 at the upper quartile, indicating a moderate decreasing trend and validating that higher friction angles reduce the likelihood of failure. Cohesion exhibits a weaker but stabilizing effect, with Pf rising slightly from 0.55 to 0.60, indicating a weak upward trend consistent with enhanced shear resistance.
Geometric and stress-related variables have more muted responses. Slope angle (β) and slope height (H) display nearly flat relationships (Pf ≈ 0.52–0.56), while unit weight (γ) remains constant (Pf ≈ 0.60) across quartiles. The pore-pressure ratio (ru) produces a weak upward trend, with Pf declining slightly from 0.56 to 0.45, suggesting a secondary but context-dependent influence on stability.
From an engineering perspective, these patterns highlight that uncertainties in strength parameters (c and φ) exert the most significant influence on slope-failure risk. In contrast, geometric and hydrological factors contribute less unless extreme conditions are present. This emphasizes the importance of accurately characterizing shear-strength properties during site investigations, as even slight variations can shift a slope’s risk category.
Overall, the model-based bootstrap results demonstrate how incorporating both model and data uncertainty enhances probabilistic slope-stability assessment, providing not only point estimates of risk but also confidence intervals that inform conservative design and monitoring decisions.
5.6. Practical and Theoretical Implications
The calibrated and monotone-constrained probabilistic framework developed in this study has direct implications for risk-based slope management. By converting predicted probabilities into actionable categories (
Section 4.4), practitioners can prioritize interventions based on both the likelihood and potential impact of failure. Slopes identified as high risk can be targeted for immediate stabilization or monitoring, while medium-risk slopes can be managed through increased surveillance or temporary operational limits. Low-risk slopes, in turn, can be allocated fewer resources with confidence, enabling a more efficient use of remediation budgets. This prioritization is especially valuable in infrastructure networks, such as highways or open-pit mines, where multiple slopes must be managed simultaneously with limited resources.
In the context of renewable energy systems, where access roads, turbine foundations, and solar array embankments are exposed to changing hydrologic regimes, applying risk-informed slope management ensures the resilience and continuity of clean-energy operations with lower environmental and carbon costs.
At the theoretical level, the results show how machine learning complements rather than replaces classical geotechnical analysis. Limit-equilibrium and numerical methods remain crucial for detailed, site-specific design; however, their assumptions and high data requirements can limit their application. Machine learning brings value by providing a probabilistic, data-driven view across large datasets, capturing nonlinear interactions among parameters that are often simplified in traditional methods. This cooperation highlights that ML should not be seen as a replacement, but as a decision-support tool that enhances traditional analysis with broader pattern recognition and probabilistic insights.
Adopting interpretable ML methods, such as SHAP analysis, in this study helps ensure that model predictions remain aligned with the core principles of soil mechanics. The prominence of φ and c in the feature rankings, the secondary role of slope geometry, and the less prominent but case-specific influence of ru all match well with established geotechnical understanding. Furthermore, the incorporation of probability calibration and model-based bootstrap uncertainty analysis ensures that the framework provides not only accurate predictions but also reliable confidence bounds for engineering decisions. This transparency bridges the gap between black-box models and engineering trust, allowing practitioners to not only rely on predictions but also understand the reasoning behind them. As a result, interpretable ML can accelerate its adoption in practice by demonstrating that data-driven models support, rather than oppose, domain knowledge.
From a sustainability standpoint, probabilistic classification enables earlier, low-impact interventions that can significantly reduce carbon and material expenses. For instance, proactive stabilization or drainage initiated by model-detected high-risk slopes could reduce emergency reconstruction by approximately 30–40%, leading to an estimated 20–25% decrease in embodied carbon compared to reactive repairs, as mentioned in recent slope-management research [
61,
62,
63]. This quantitative example highlights how combining calibrated ML predictions with maintenance planning can produce clear environmental and economic advantages.
5.7. Limitations and Future Work
While the current study highlights the potential of interpretable, calibrated machine learning for slope stability assessment, several limitations should be acknowledged. First, the dataset coverage is limited to 627 cases of circular-mode failures compiled by Ma et al. (2022) [
23]. Although these cases include a variety of soil and rock types, the database is not comprehensive. It may not fully capture complex geological settings such as anisotropic stratifications, blocky rock masses, or progressive failure mechanisms. Second, the pore-pressure ratio (r
u) values were often back-calculated or assumed, which introduces noise and may partly explain their low overall importance in the SHAP analysis. Third, the dataset exhibits a regional bias, with many cases originating from China and Southeast Asia, which may limit its applicability to other geoclimatic regions. Finally, the study is limited to circular slip modes, whereas real-world landslides frequently involve more complex or non-circular geometries that would require more adaptable modeling.
Future research should address these limitations through several avenues. Expanding the database to include non-circular failures, rockslides, and complex geometries would enhance the robustness and applicability of models across a wider variety of slope types. Integrating hybrid ML-mechanistic approaches, where physics-based stability formulations constrain data-driven predictions, could improve both interpretability and generalization. Related advances in multimodal and coupled-process modeling, such as multimodal fusion for TBM thrust prediction and analytical modeling of nonlinear seismic meta-surfaces in saturated porous media, show the potential for future integration of dynamic and porous-media mechanics into geotechnical machine learning frameworks [
64,
65]. Incorporating spatiotemporal data from monitoring systems (such as rainfall records, pore pressure sensors, and displacement time series) would allow models to capture evolving hazard conditions instead of static snapshots. Finally, additional work is needed on uncertainty quantification, exploring Bayesian frameworks, reliability indices, and probabilistic scenario simulations to generate confidence bounds that can be directly aligned with geotechnical design codes and risk-based asset management.
6. Conclusions
This study developed a calibrated and monotone-constrained XGBoost framework for probabilistic slope-stability assessment using the 627-case database of Ma et al. (2022). The model demonstrated strong predictive performance (AUC = 0.88, Accuracy = 0.80, MCC = 0.61) and well-calibrated probabilities, as verified through Brier, ECE, and MCE metrics. SHAP analysis confirmed that physically consistent behavior failure probability decreases with increasing cohesion (c) and friction angle (φ) and increases with slope angle (β), height (H), and pore-pressure ratio (ru).
Risk thresholds (Pf < 0.01, 0.01–0.10, >0.10) translated the probabilistic outputs into actionable Low-, Medium-, and High-risk classes, linking data-driven predictions with reliability-based design practice. Model-based bootstrap analysis, incorporating both epistemic and aleatoric uncertainty, generated confidence bands for Pf–feature trends, indicating that strength parameters have the most significant influence on risk.
The proposed workflow combines accuracy, calibration, and interpretability within a single auditable pipeline suitable for engineering decision-making. It enables practitioners to rank and manage slopes by quantified probability of failure, complementing traditional limit-equilibrium analyses. The framework provides a transparent and reproducible foundation for risk-informed geotechnical design and monitoring, supporting the development of sustainable and resilient infrastructure.