Article

Linking Land Uses and Ecosystem Services Through a Bipartite Spatial Network: A Framework for Urban CO2 Mitigation

Department of Planning, Design, Technology of Architecture, Sapienza University of Rome, Via Flaminia 72, 00196 Rome, Italy
*
Author to whom correspondence should be addressed.
Sustainability 2025, 17(22), 10113; https://doi.org/10.3390/su172210113
Submission received: 2 October 2025 / Revised: 29 October 2025 / Accepted: 11 November 2025 / Published: 12 November 2025

Abstract

Urban CO2 mitigation strategies typically aim at particular zones or sectors but do not account for spatial interdependencies among different components within the city. Understanding how land uses emit within and across districts can reveal systemic leverage points for climate-resilient urban planning. This study applies a bipartite spatial network approach using high-resolution Urban Atlas land-use data and a hierarchical spatial framework for emissions and sequestration estimation. The approach links urban land uses to their emissions profiles, offering a structural view of how different areas interconnect within urban carbon dynamics, moving beyond fragmented emission accounting. Using the Reggio Calabria Functional Urban Area in Italy as a case study, the analysis identifies influential areas and emission-intensive land uses. Subsequently, using centrality metrics highlights the spatial units with strong connections to emission-dense land uses, marking them as points of intervention. Results show that although 53% of districts act as net carbon sinks, their sequestration capacity is outweighed by the intensity of a smaller group of emitter districts. Among these, five central districts (IDs 94, 82, 107, 108, and 72) emit over 500 million kg CO2 per year, making them leverage points for systemic mitigation. The integration of bipartite spatial network and multiscale territorial analysis provides a replicable, data-driven framework for urban CO2 mitigation. Ultimately, the study demonstrates that mapping emissions through spatial interdependencies enables planners to target interventions where localized action yields the greatest network-wide climate impact.

1. Introduction

Urban areas are at the heart of the climate emergency, accounting for a large proportion of the global CO2 emissions [1,2,3]. Cities consume a huge amount of energy and resources due to their economic growth and population growth drivers, which make them both contributors to and potential solutions for climate change [4,5,6]. This duality puts cities at the forefront of global ambitious climate policy; global and European agendas, like the EU’s Green Deal and Fit for 55, Cohesion policy, and others place-based systemic responses to the challenge of decarbonization and spatial equity [7,8,9,10].
Yet, efficient urban CO2 reduction continues to face methodological and empirical barriers, especially in bridging the emission data to applicable spatial planning solutions [11,12,13]. A common limitation in urban mitigation planning is to address emissions in individual sectors or areas without consideration of the complex spatial interdependencies that drive emission patterns in the urban area [1]. Land-use types like residential zones and transport infrastructure do not operate in silos; their effects extend across multiple districts [14,15]. Failing to consider these linkages limits urban planners from being able to target the factors that influence emissions, or to intervene at their most effective locations [16].
Over the past decade, there have been several studies that examined urban CO2 emissions through sectoral, land use, and spatial econometric approaches [16,17,18,19,20]. Most studies rely upon top-down inventories or activity-based energy models, which are robust from an aggregate level but do not provide spatial specificity for urban planning needs [21,22]. Existing work has employed geospatial modeling and remote sensing data to downscale emissions to local spatial scales [23,24,25]. However, these typically treat land uses as independent emission sources, overlooking the functional and relational drivers among spatial units that jointly shape dynamic emission patterns [26].
To complement emission reduction strategies, recent efforts have incorporated the ecosystem services perspective, particularly focusing on regulating services as a key component of nature-based solutions for mitigating urban environmental pressures such as climate change [3,17,18]. Among these regulating services is CO2 sequestration. It is one of the important indicators to monitor environmental performance [19]. It measures the process of sequestering carbon from the air and accumulating it in ecosystem carbon pools, representing net carbon uptake over a given period of time [20,21]. Examining the balance between CO2 sequestration and emissions reveals the spatial dynamics of carbon sources and sinks in urban environments, highlighting current environmental conditions and potential for mitigation [22,23].
Consequently, there is a need for an analytical framework that integrates these spatial interdependencies within urban areas while remaining compatible with existing land-use data. This research addresses that gap by proposing a network-based spatial analysis that models the urban CO2 landscape as a system of interlinked functional relationships between spatial units and land uses [24].
Unlike conventional emission mapping that addresses each spatial unit in individual isolation, the bipartite spatial network formally captures relational dependencies between land-use functions and urban districts. This allows one to identify structurally significant areas whose mitigation would generate network-wide benefits, thus broadening the analytical horizon of urban carbon accounting.
The article uses a bipartite spatial network analysis interconnecting adopted spatial units of the urban CO2 landscape: eco-districts as spatial planning and decision-making units, and land-use types as functional elements influencing emissions. By modeling emissions as a network of relationships between these two node types, weighted by emission intensity, the study identifies which eco-districts are most influenced by high-emission land uses and which land uses contribute the most to CO2 emissions. These spatial units can then be explored in detail at the eco-community and eco-cell levels, as more granular spatial units to locate where targeted interventions could most effectively reduce emissions.
This study is part of larger research activities aiming to develop spatially explicit, data-driven methodologies towards integrating urban ecosystem services into urban planning. Here, the focus is on evaluating CO2 emissions by using a bipartite spatial network analysis to examine the structural dependencies between land use and urban CO2 emissions. The approach links eco-districts to specific land-use categories according to the proportional share of their emissions contribution and applies centrality measures to identify areas with the highest systemic influence potential.
Figure 1 outlines the full methodological workflow of the overall research project, covering data collection, CO2 calculation, spatial modeling with the spatial Durbin model (SDM), and scenario interpretation. Within this broader framework, the present paper specifically develops a spatial network analysis to capture inter-district ecological interactions.
This study is guided by the following research question: How can a bipartite spatial network linking eco-districts and land-use categories be used to reveal structurally influential districts and pinpoint priority locations for targeted CO2-mitigation in an urban area?
The bipartite spatial network model aims to address three analytical questions: (i) which eco-districts are structurally central to the urban CO2 emission system, (ii) which land-use types most influence those districts, and (iii) how these interdependencies can inform spatial prioritization for mitigation. Within this framework, the network metrics are interpreted as follows: weighted degree reflects how strongly a district is connected to its neighbors through adjacency-based relationships; degree centrality indicates how embedded it is within the network of bordering districts; and eigenvector centrality captures its overall influence through connections with other key districts. Together, these indicators act as proxies for prioritizing interventions, translating network-derived insights into spatial planning actions.
To answer the main research question, the study concentrates on three primary objectives:
  • Create a bipartite spatial network connecting eco-districts and land-use types, weighting edges based on land-use-specific CO2 emissions derived from Urban Atlas data and parameters identified in the literature.
  • Identify influential eco-districts and top-emitting land uses using centrality metrics to identify interdependencies that create emissions patterns.
  • Suggest intervention hotspots and recommend spatial actions.
We hypothesize that urban CO2 emissions are not necessarily evenly distributed across space, nor are they merely a consequence of land-use intensity. Instead, spatial structure, connectivity, and functional roles within the built environment will influence in which locations the emissions will be concentrated and how mitigation resources need to be allocated.
The paper is organized as follows: Section 2 provides the background literature and theoretical foundations in spatial network analysis (SNA) and urban ecosystem services; Section 3 outlines methodology, data sources, network construction, and analytical approaches; Section 4 outlines results from the network; Section 5 provides the discussion with particular focus on planning implications; and Section 6 contains a conclusion and potential avenues for further research.

2. Literature Review

Recent scholarship highlights the role of ecosystem services, particularly regulating services, as the basis for nature-based solutions (NbS) to mitigate urban environmental pressures such as climate change [3,17]. Within this perspective, CO2 sequestration has become as a key indicator of urban environmental performance, representing the net carbon uptake of ecosystems over time [18]. Several studies have highlighted that balancing CO2 sequestration and emissions provides valuable insight into the spatial configuration of urban carbon sources and sinks, supporting the design of mitigation and adaptation strategies [21,22].
Urban mitigation strategies have further evolved through technological innovation, policy reforms, and the integration of NbS [25,26,27]. Research on the built environment underscores the importance of green and energy-efficient buildings, which account for nearly 40% of global energy-related CO2 emissions [28]. Parallel studies in urban mobility highlight that enhancing public and active transport, supported by smart technologies, can significantly reduce urban emissions [29,30].
Yet, these approaches often remain sector-specific, and their application might be challenging, for example, in narrowing the gap between systemic understanding and local action and pointing out where land-use changes or design changes would have the most effect [31,32].
In response to this challenge, scholars increasingly investigate how emissions are structured by spatial interdependencies within cities [1,33,34]. Research is now working to uncover the spatial logic of emission sources, offering results that could underpin more targeted, place-specific mitigation responses, although such results still need to be better integrated into planning practice. This has led to an increasing recognition of the need for integrated approaches across sectors and spatial scales [35,36,37,38]. This would offer a foundation for addressing complex emission patterns. It also highlights the need for planning strategies that link high-level sustainability goals with operational, spatially specific interventions.
A study analyzing urban density and carbon emission performance in spatial terms identified a dynamic interaction between urban density and carbon performance with implications that increased density will result in more effective utilization of land as well as reduced emissions [39]. Similarly, research into the spatial patterns of the intensity of CO2 emissions in urban areas highlighted the important role of road network length in shaping emission patterns [40].
Moreover, spatiotemporal analysis based on satellite imagery-based methods estimated the CO2 emissions of cars, revealing different emission hotspots and time patterns [41]. Additionally, studies based on machine learning methods have revealed causal relationships between city form and car CO2 emissions, pointing to the role of destination accessibility and street connectivity in determining emission rates [42].
Furthermore, land-use changes and urbanization have been identified as being significant sources of CO2 emissions. An empirical study on land urbanization in China demonstrated that land-use intensity and structure change have direct effects on urban carbon emissions [43]. In addition, research on carbon metabolism in Beijing’s urban zones emphasized how land-use changes from natural to artificial land components induced high emissions, while other land-use changes facilitated carbon sequestration [44].
Additionally, a study using a spatial Durbin model examined inter-city technology patent transfers in China, showing that technological progress in one city can impact carbon emissions in nearby areas [45]. Also, research on the coupling evolution of urbanization and carbon emissions in the Yangtze River Economic Belt found that urbanization levels and per capita emissions have strong spatial dependence and integration [46].
A growing body of research highlights the importance of nested spatial structures in promoting urban sustainability, in which planning entities at varying scales work to address both systemic broader effects and local interventions [47,48]. Studies also emphasize the value of spatial redundancy, diversity, and multi-scalar frameworks for boosting urban adaptive capacity [32].
This research uses a multiscale territorial strategy based on a hierarchical spatial framework inspired by the Sino-Singapore Tianjin Eco-City project [49]. The framework divides the study area into three spatial units: eco-cell (400 × 400 m), eco-community (800 × 800 m), and eco-districts (1600 × 1600 m). The eco-district serves as the main unit in our analysis, acting as a strategic planning tool to integrate different parts of the city for a systemic study of emissions patterns, land-use functions, and ecosystem services.
Although analysis is focused on the district scale in order to establish city-wide strategies, these lower units are necessary to illustrate how our findings can be scaled down for future, more localized action (see Figure 2). They provide a conceptual framework for identifying specific sites for micro-level interventions, such as tree planting or the introduction of pocket parks, should a more detailed analysis be required at some future point.
The spatial structure identifies eco-districts as the unit of analysis at the primary scale. Eco-districts consist of various eco-cells, allowing for the investigation of aggregate land use and spillover impacts among contiguous areas.
Eco-District: District Unit
The eco-district is defined as 1600 m × 1600 m. This macro-scale analysis focuses on cumulative impacts and regional dynamics, such as overall carbon sequestration capacity. At the district level, we integrate findings to address large-scale challenges and opportunities.
Eco-Community: Residential community Unit
The eco-community is at this intermediate scale, where the exploration of the relations between pressures and impacts will be possible. This level specifies the areas where collective action can be used to increase the ecosystem services to the maximum.
Eco-Cell: Basic community unit
The eco-cell is a 400 m × 400 m square area. This scale is appropriate for examining localized dynamics and assessing how small-scale land use and ecological processes interact.
Eco-community and eco-cell are included within this framework to demonstrate how our findings can be scaled down. They represent an opportunity for a more granular assessment of localized dynamics for future work.
This multiscale approach reflects an increasing recognition in planning the literature of the need to connect regional or city-wide environmental strategies with operational planning tools at the neighborhood or block level. It enables both a reading of broader emission trends and a capacity to implement spatially precise changes that respond to local dynamics.
To apply this framework, consistent land-use-based methods are required for estimating emissions and identifying priority areas. A growing body of research has taken this route, estimating CO2 emissions for various land uses within the same year to allow for detailed spatial analysis and targeted mitigation.
For instance, a study by Shi et al. analyzed CO2 emissions across different land uses in Shanghai’s development zones [50]. Their findings indicated significant interactions between land-use mixing and CO2 emissions, and the necessity of considering spatial configurations in emission reduction efforts [50]. Chuai et al. used terrestrial ecosystem modeling and auxiliary data to spatially simulate carbon emissions by land-use type, showing the functional impact of land-based patterns [51]. Similarly, Li et al. explored the connection between land-use diversity and emissions, identifying a correlation between urban land mixing and CO2 outputs [52]. Morelli et al. conducted a spatiotemporal cluster analysis of greenhouse gas emissions in European NUTS-2 regions between 1990 and 2022, highlighting the spatial heterogeneity of emissions across sectors and land-use categories [53]. Baur et al., studying 52 European cities, found that urban sprawl and low-density development were associated with higher per capita emissions, while compact and fragmented dense urban forms performed more efficiently in terms of emissions [54].
Together, these studies reinforce the relevance of land-use-based CO2 accounting and support the use of spatially explicit planning tools to advance data-driven, adaptive mitigation strategies. Yet, despite the fact that these approaches provide an understanding of emissions in detail, they do not necessarily look at how the various components of a city interact with one another.
While land-use-based emissions provide spatial understanding, it does not reveal how different locations interact within the urban area. To address this, this study uses a bipartite spatial network to analyze the relationship between eco-districts and land-use types based on CO2 emissions. spatial network analysis (SNA) offers a suitable tool for examining complex relationships in urban systems [24]. This spatial network captures territorial units (eco-districts), on one side, and functional categories (land uses) on the other side, with edges connecting them based on their CO2 emission contributions.
In this network, centrality metrics are used to measure a node’s structural influence. High-centrality eco-districts are those strongly connected to land-use types that significantly contribute to urban CO2 emissions. This means interventions in these districts can create widespread positive effects through the network’s interdependencies and spatial spillovers. This approach moves the focus from static emission hotspots to dynamic influencers, offering a more strategic way to target place-specific mitigation efforts while prioritizing network position over specific locations.
A key takeaway of this approach is its potential to guide ecological compensation strategies in urban development, which involves redistributing or improving ecosystem services in areas lacking them by utilizing the capacity of areas with surplus provision [32].
This study applies these concepts in the Reggio Calabria FUA, Italy. The methodology section will illustrate how this framework identifies and links areas with surplus and deficit carbon performance.

3. Methodology

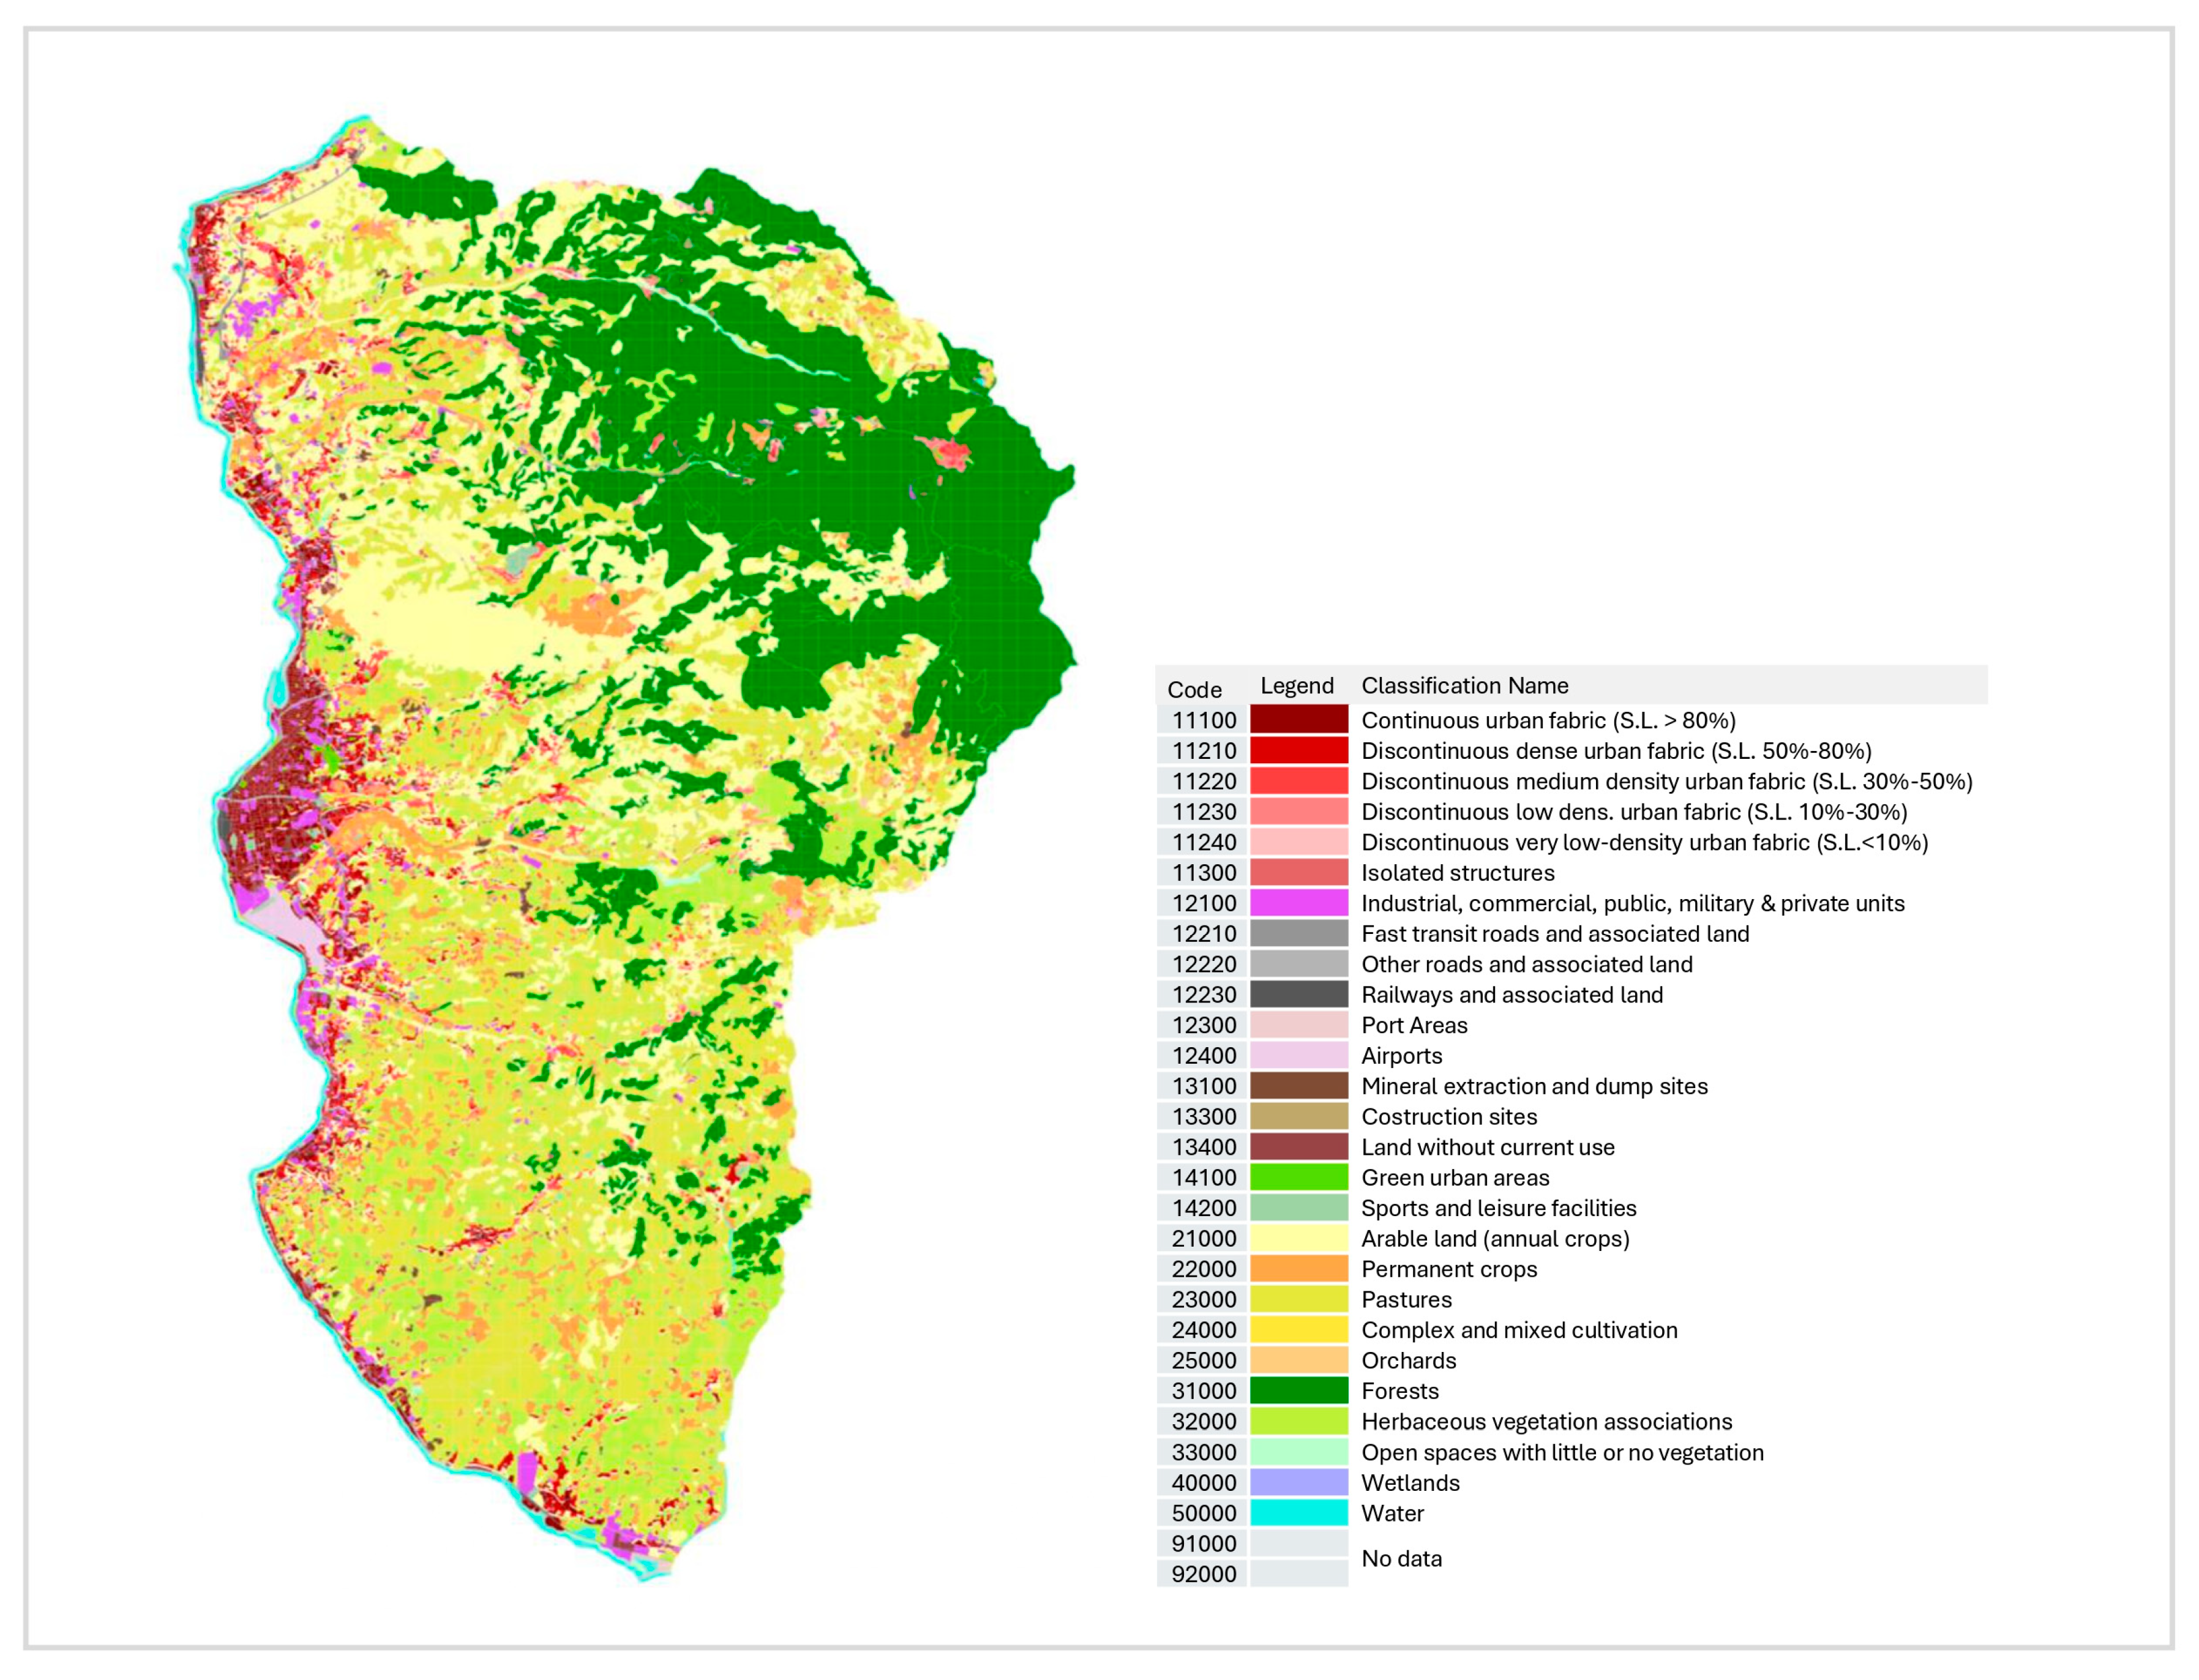
The study is conducted in the Reggio Calabria FUA, an urban area dealing with notable spatial and environmental issues. The choice of this urban setting offers an opportunity to test spatially targeted mitigation strategies in a context where emissions and ecosystem service potentials vary across the area. Figure 3 shows the land-use map of Reggio Calabria FUA, retrieved from the Urban Atlas dataset [55].
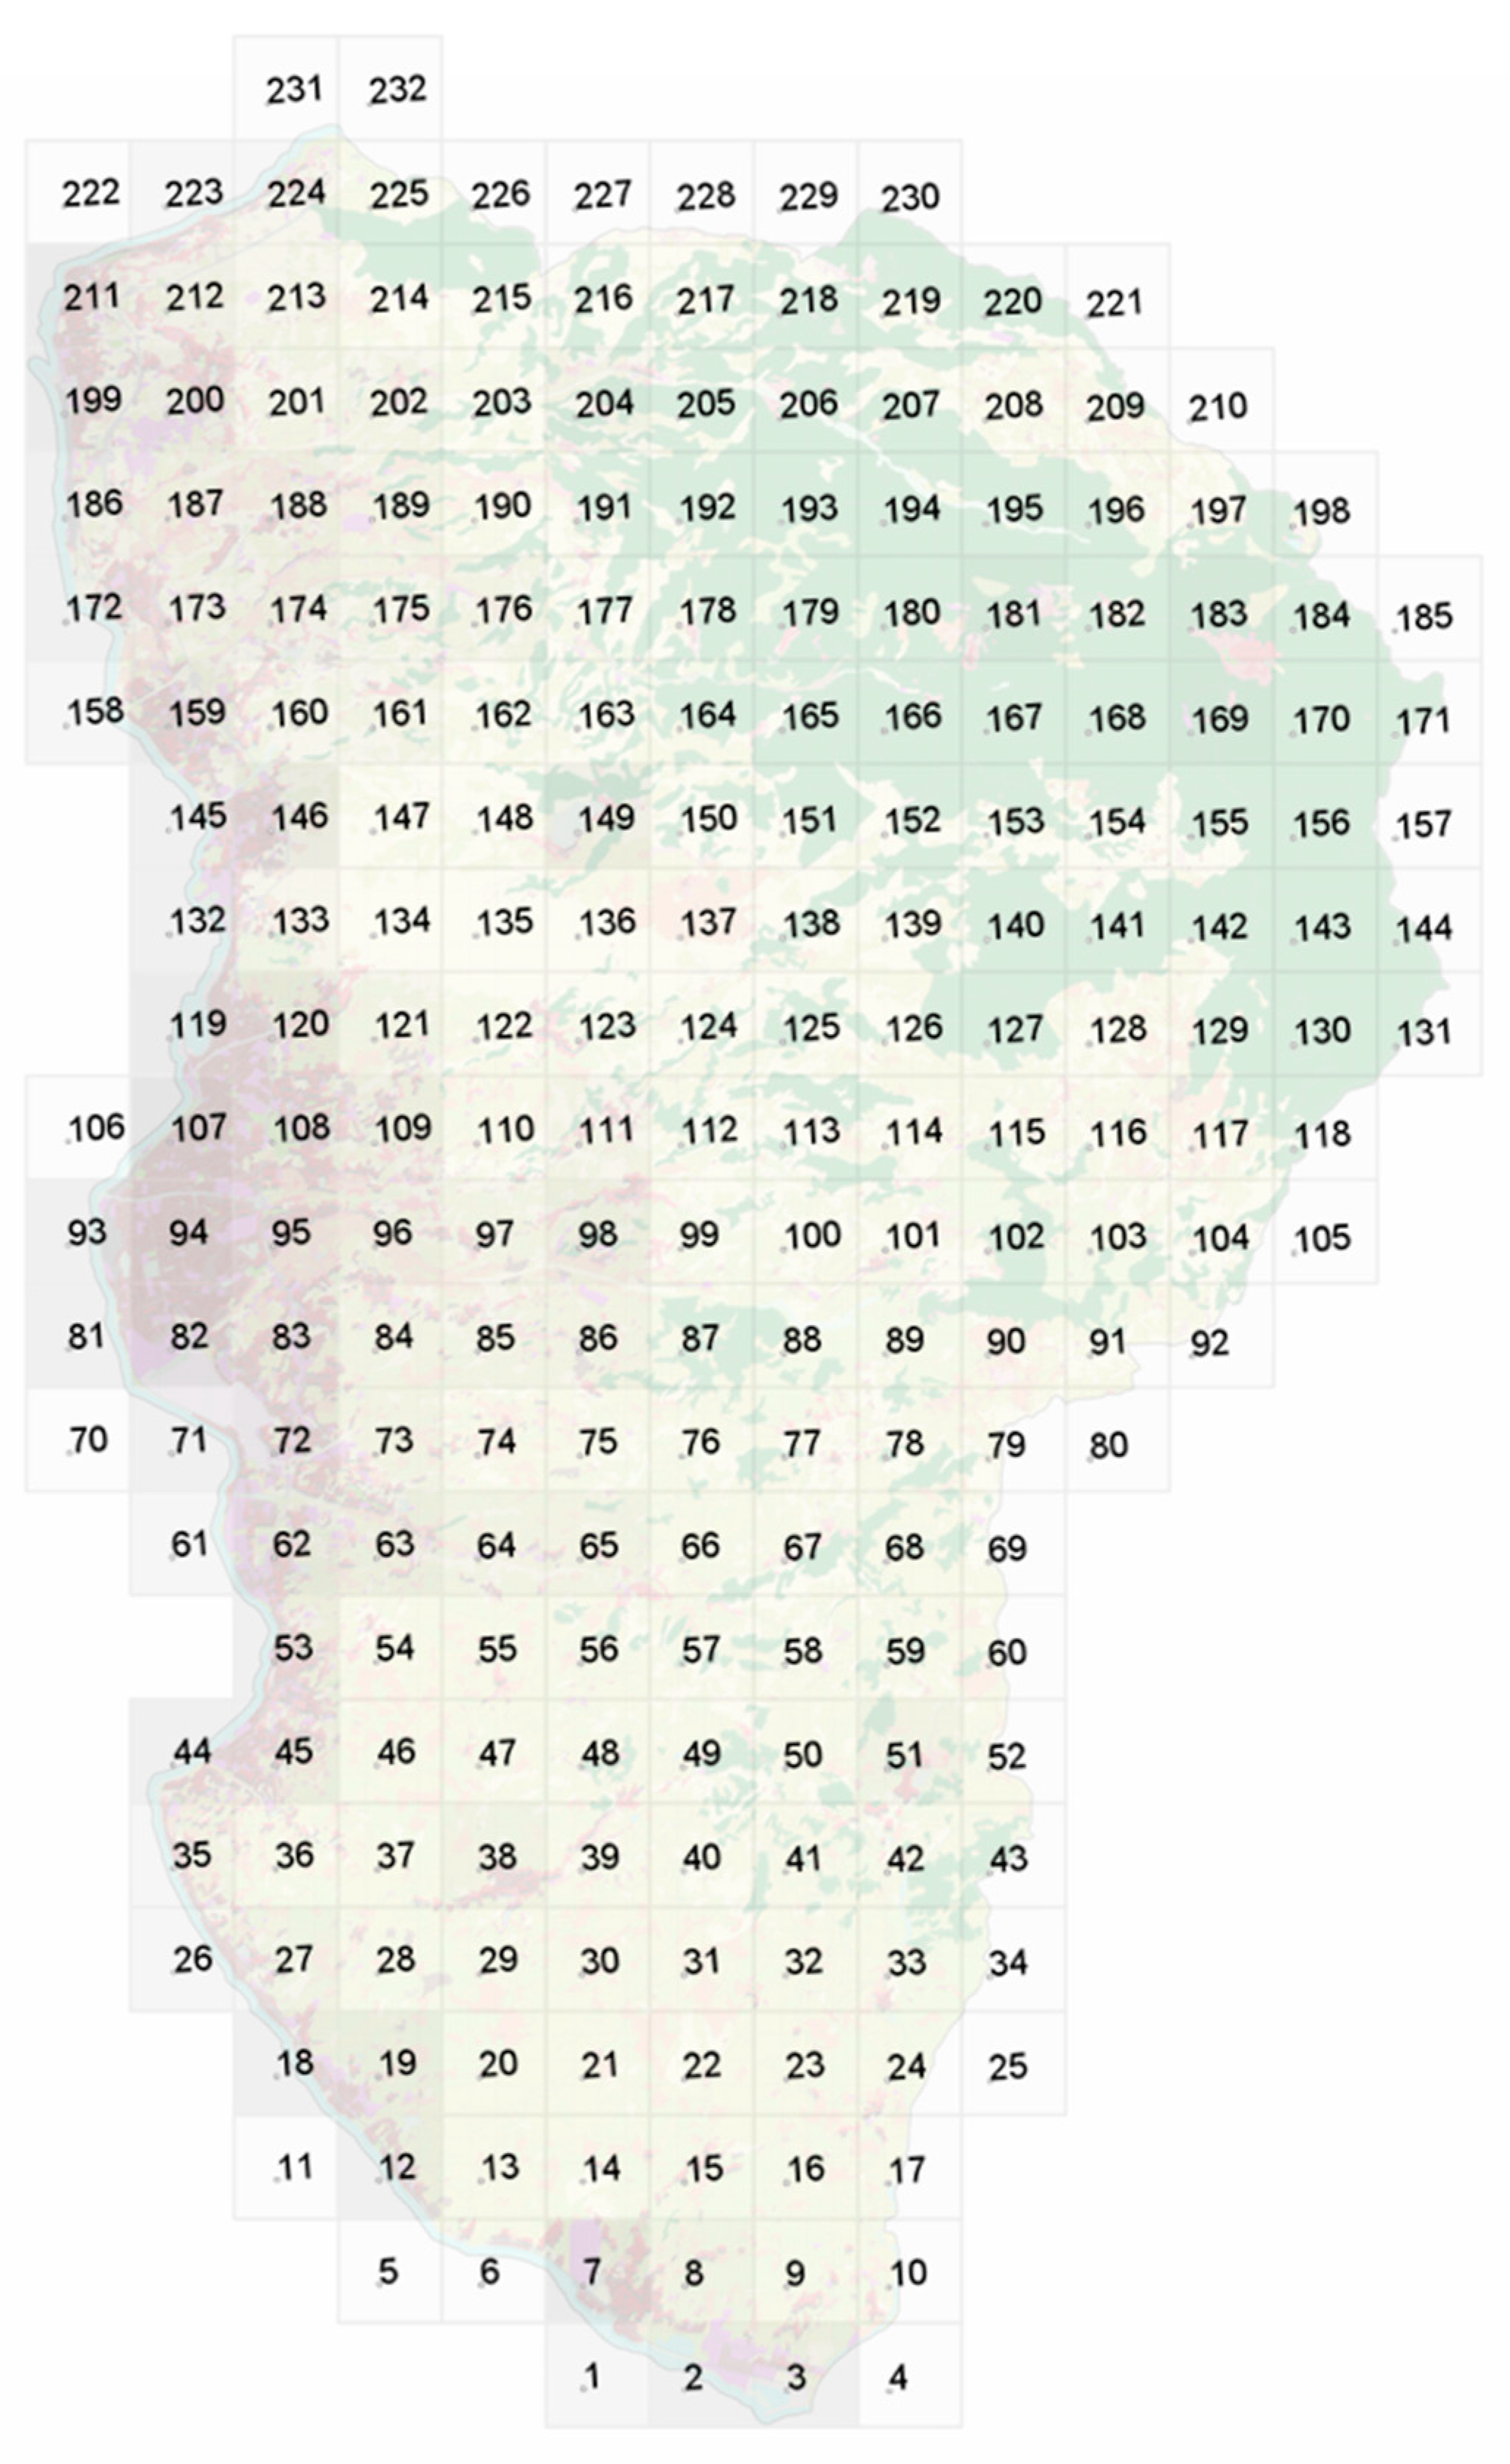
Urban Atlas, developed by the Copernicus Land Monitoring Service, offers standardized and detailed land-use classifications for European Functional Urban Areas. Although not a legal substitute for official zoning regulations, it generates a consistent spatial dataset to support uniform land-use analysis among different urban contexts. Urban Atlas data are used in this study as a proxy for land-use zoning because of its consistent classification and spatial resolution, and thus is particularly well-suited for comparative and analytical research. However, its minimum mapping unit (MMU) of 0.25 ha (2500 m2) for urban classes and 1 ha (10,000 m2) for rural classes is less than ideal for the functional analysis of urban ecosystem services. To address this gap, this study uses a hierarchical system of spatial units. This framework divides the territory into 232 eco-districts (1600 m × 1600 m).
The study primarily considers CO2 emissions, but it is also necessary to consider CO2 sequestration. This provides a clearer picture of the carbon footprint of the area. It allows for an understanding of how much carbon various land types can absorb, which indicates how the area can offset emissions.
Carbon metrics are utilized to estimate how much carbon can be absorbed and how much CO2 is emitted for various land uses. This is based on values from the literature and national databases (Table 1). These parameters provide the average annual rates of absorption or emission for each land-use type, kilograms of CO2 per square meter per year (kgCO2/m2/year). These rates were based on standardized coefficients from national datasets and the prior literature. Although this may overlook localized behavioral variations, it ensures methodological consistency and reproducibility across all spatial units.
To apply this framework, the Reggio Calabria FUA was divided into 232 Eco-Districts (see Figure 4). This primary unit of analysis is a 1600 m × 1600 m grid, which allows for a macro-scale focus on cumulative impacts and regional carbon dynamics, such as overall carbon sequestration capacity. While the analysis is centered on the district level to establish city-wide strategies, the smaller units—the eco-cell and eco-community—are included within this framework to provide a conceptual basis for demonstrating how findings can be scaled down for future, more localized interventions.

Network Construction and Visualization

After calculating the CO2 emissions for each eco-district, each land-use category, and for each land-use type within every eco-district, the resulting dataset was cleaned to remove all records with zero values to ensure analytical consistency. The processed data were then structured in two separate tables corresponding to the nodes and edges of the network.
The node table contained the following attributes: ID, sum (total CO2 emissions), latitude, longitude, and type (distinguishing between eco-districts and land-use categories). The edge table included three columns: Source (eco-district ID), Target (land-use category), and Value (CO2 emissions generated by that land-use type within the corresponding eco-district).
These two datasets were imported into Gephi (version 0.10.1), an open-source network analysis and visualization software, where they were integrated to form a bipartite spatial network linking eco-districts (spatial units) with land-use categories (functional units). Each connection (edge) in the network has a numerical value showing how much CO2 is produced by that land-use type within a specific district.
A geo-layout was then generated in Gephi to spatialize the network, enabling each district node to be positioned according to its real-world geographic coordinates.
In this structure:
  • There are two types of nodes:
    Eco-districts;
    Land-use categories.
  • Nodes are weighted according to the total emissions of each eco-district or land-use category.
  • Edges indicate the emissions contribution of each land-use type within an eco-district.
  • The weights of the edges are determined by calculating the total CO2 emissions generated by a land-use type in a specific district.
The final network was then exported and overlaid with the eco-district map of the Reggio Calabria FUA, to enable the spatial interpretation of emission relationships within the urban fabric.
To accurately analyze inter-district connectivity and ensure that the centrality metrics reflected relationships only among the eco-districts, the bipartite network was projected onto a single-mode network containing only the eco-district nodes, excluding the land-use categories. In this network, districts are connected when they share a common border, allowing the analysis of spatial relationships and adjacency effects influencing emission patterns.
Three centrality measures were computed to quantify the structural properties of the projected network:
  • Degree centrality, representing the number of neighboring districts directly connected through shared borders;
  • Weighted degree, expressing the total strength of adjacency-based connections for each district, reflecting the magnitude of emission linkages with its neighbors;
  • Eigenvector centrality, measuring the overall influence of a district within the network, considering both its direct connections and the importance of its connected neighbors.
In this study, centrality metrics act as a proxy for prioritization, where higher values signal spatial units that are more connected within the urban system, suggesting that targeting these areas could have a bigger impact on reducing CO2.
The next section will outline how this framework is applied to create specific scenarios for the Reggio Calabria FUA.

4. Results

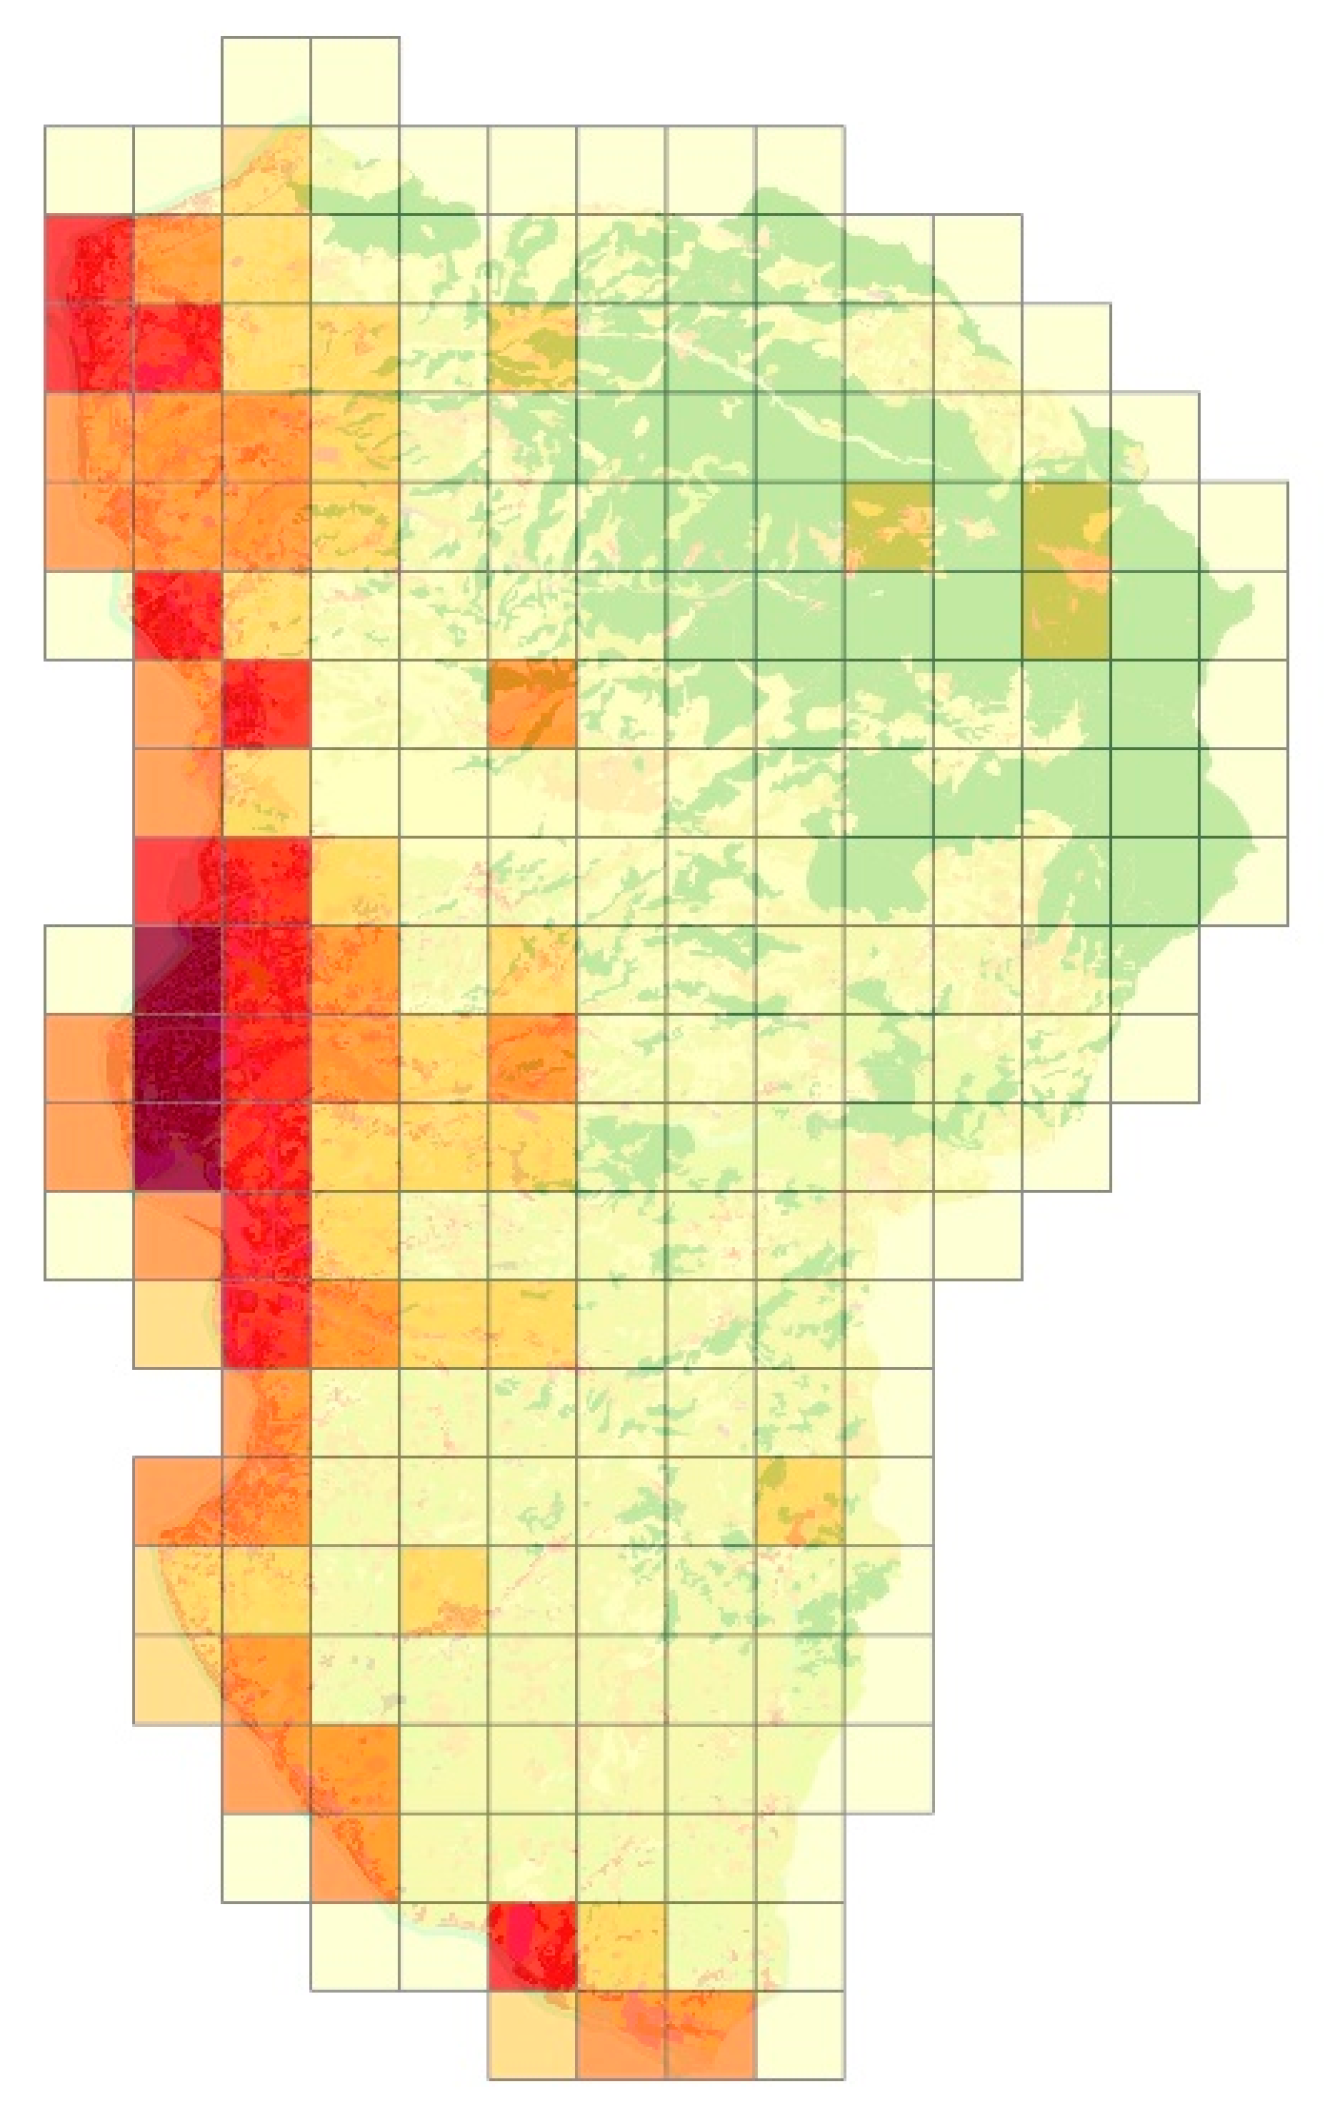
The overall carbon dynamics of the Reggio Calabria FUA reveal an uneven distribution and a structurally imbalanced CO2 profile. Table 2 presents a summary of the net CO2 balance across all eco-districts within the Reggio Calabria FUA. The total CO2 emissions produced by land-use activities across the study area are estimated at approximately 2.22 billion kilograms of CO2 per year. On the other hand, the ecosystem-based sequestration capacity of the urban area, driven by green areas, is estimated at around −369 million kg of CO2 per year (see Figure 5 and Figure 6 for emissions and sequestration visualization in Reggio Calabria FUA). The total of these estimates reveals a net CO2 balance of about 1.85 billion kilograms, emphasizing the substantial disparity between emissions and sequestration.
Interestingly, examining the distribution of eco-districts shows that 123 eco-districts (53%) achieve net sequestration, while 109 eco-districts (47%) are net emitters. This indicates that over half of these spatial units contribute to carbon mitigation, though often to a limited extent. However, the emission intensity in the net emitter cells is much greater than the sequestration capacity of the net sequestering cells. This disproportion implies that while green and semi-natural spaces are present, their spatial coverage is insufficient to counterbalance the dense and emission-heavy urban zones.
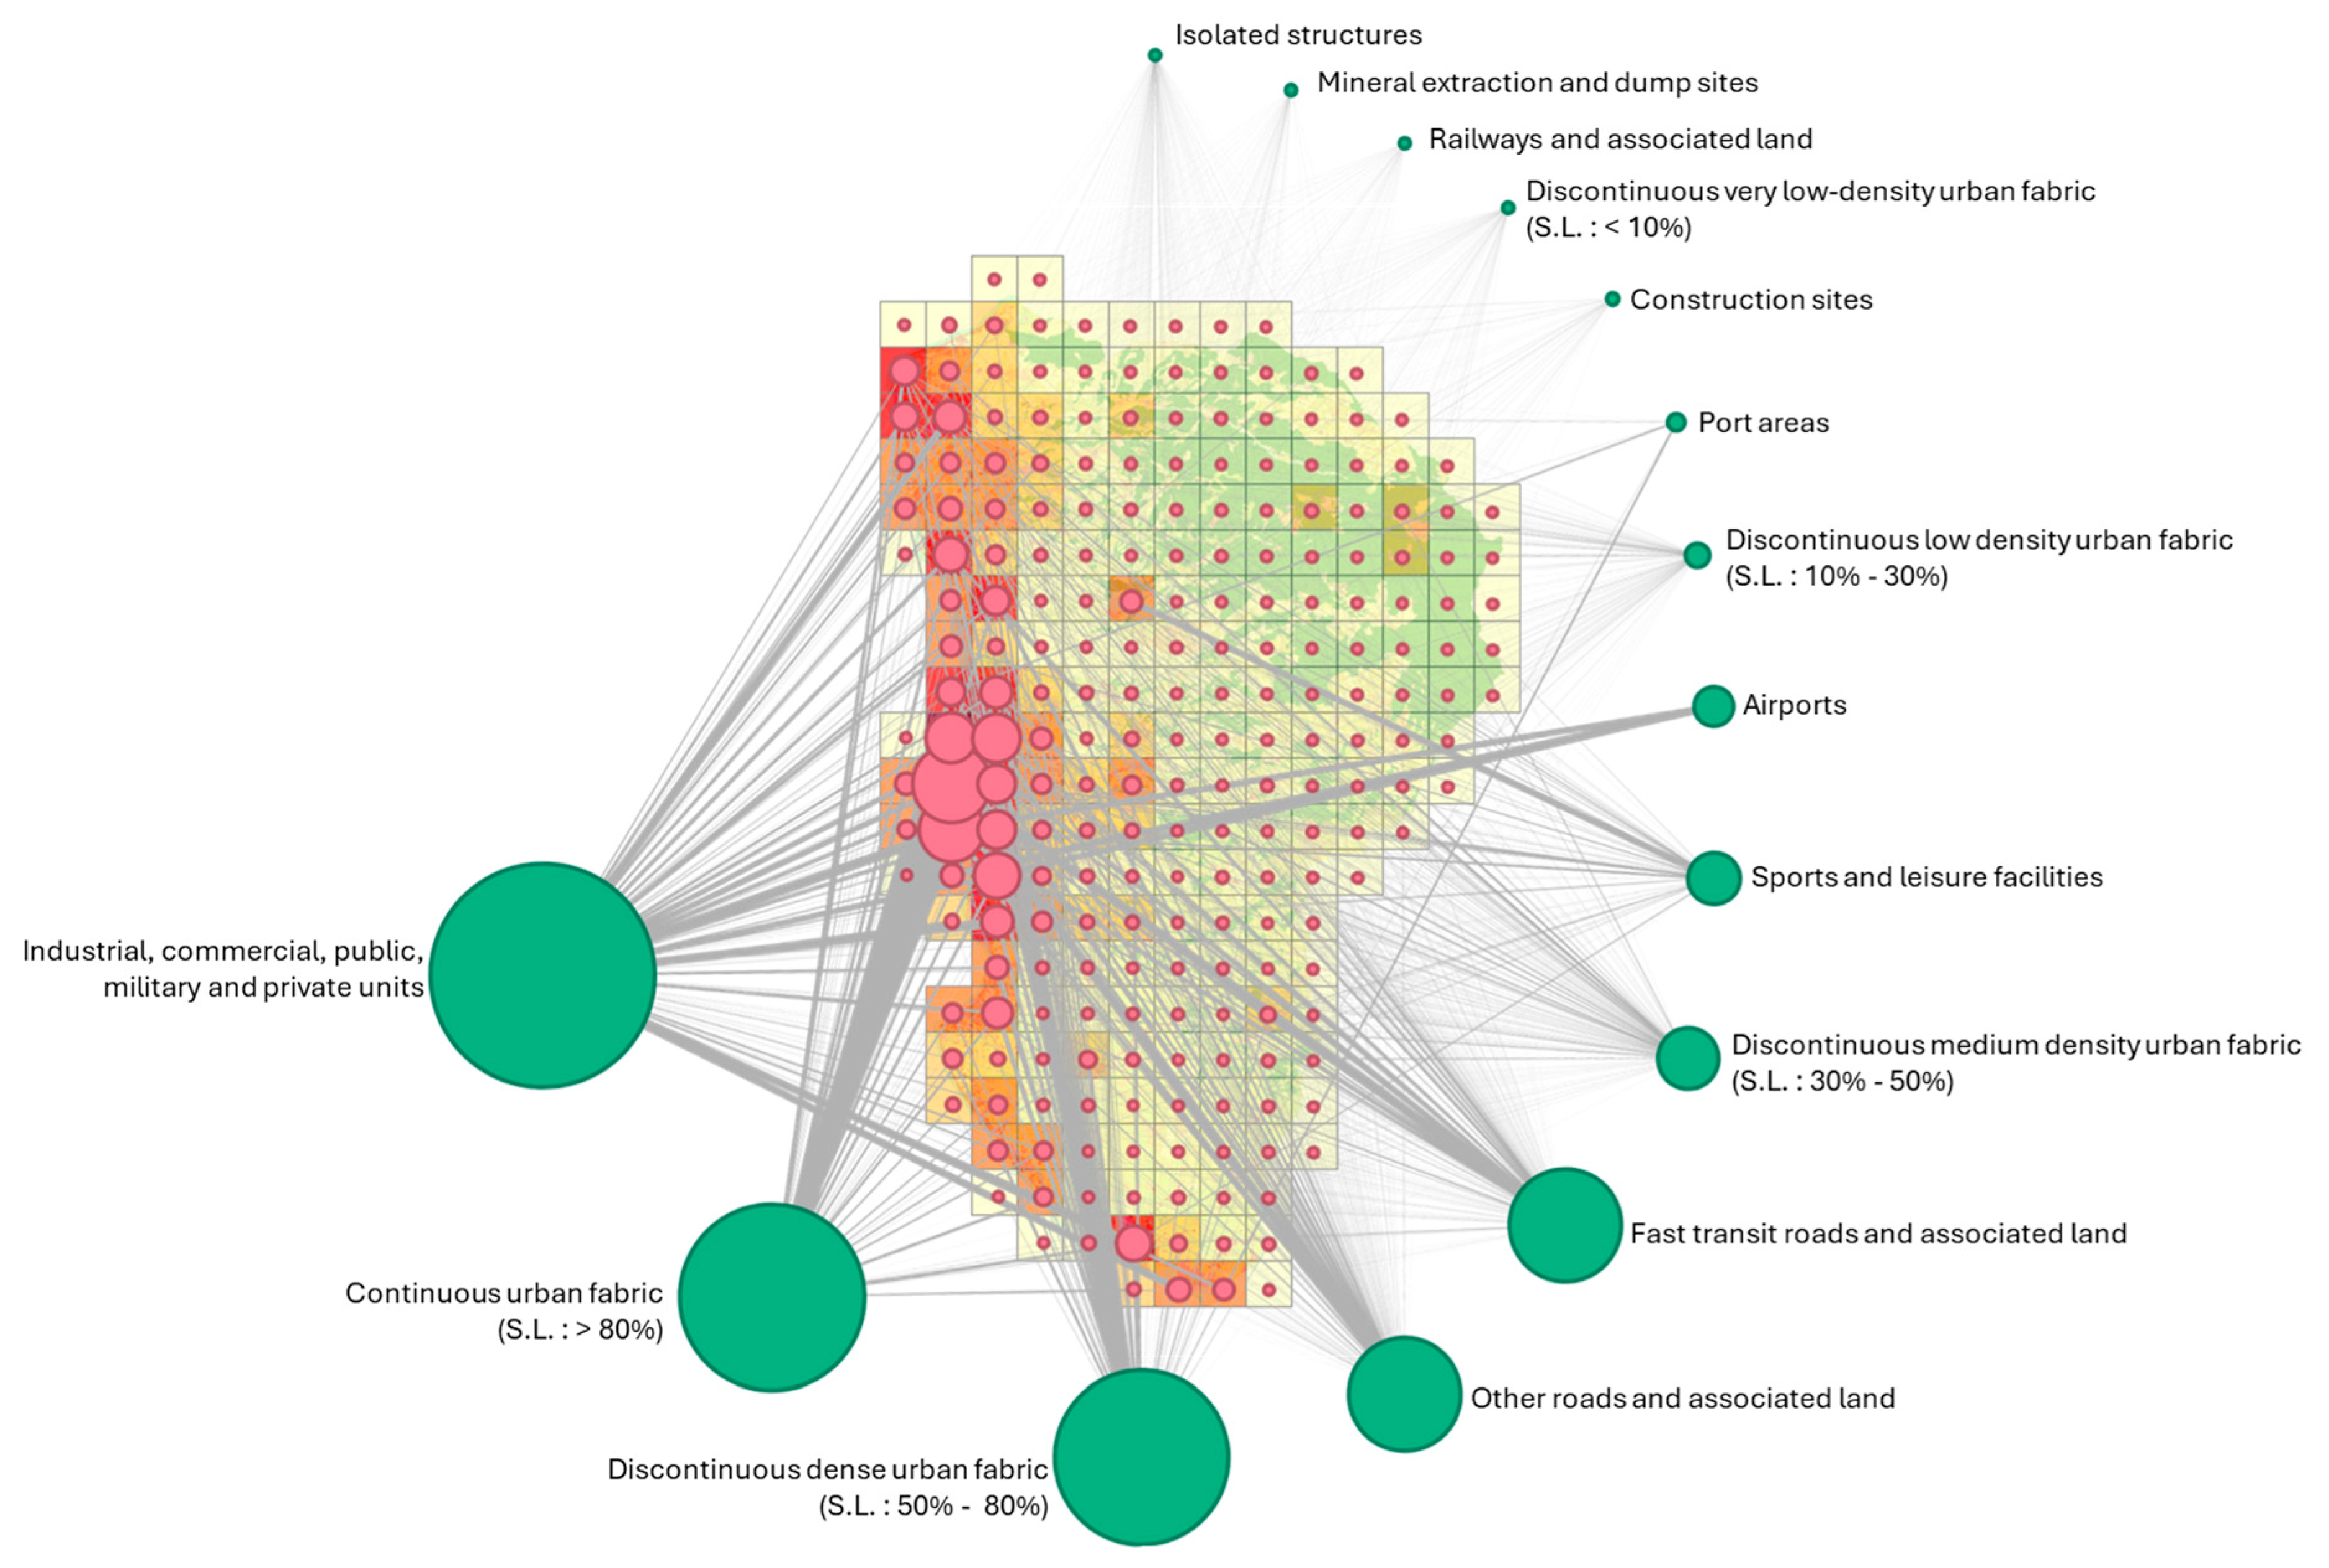
The bipartite spatial network model constructed between eco-districts and land-use types (Figure 7) reveals a highly uneven structure of emissions distribution across Reggio Calabria’s urban fabric. By measuring the cumulative CO2 emissions associated with each district’s land-use configuration, we identified a subset of eco-districts that function as structural hubs within the emissions network.
Among the 232 eco-districts examined, five are the largest emitters of CO2 in the city. They are Districts 94, 82, 107, 108, and 72, with the highest emissions combined. Given that the city of Reggio Calabria is located on the west side of this grid, it is clear that the highest emissions will be concentrated in these western districts. Table 3 provides an overview of these districts, their primary land-use types, and indicates potential planning priorities. Figure 8 presents a close comparison of their emission profiles by land-use type, revealing consistent peaks among significant land use functions.
Since the Reggio Calabria FUA is divided into a grid of squares (the eco-districts) stacked next to and above each other, it is logical to hypothesize that the degree centrality will be identical for most districts, with the exceptions being those on the edges.
The network analysis of the urban grid’s topology reveals the relationship between a district’s connectivity and its emission output. The results from our analysis demonstrate that the highest emitting zones are among those with a high degree of centrality within the network’s core, indicating not only large emission loads (weighted degree) but also strong structural embedding (degree/eigenvector). In other words, changes in these districts are likely to generate wider benefits across their neighboring areas. Table 4 shows the centrality metrics of the highest emitting eco-districts identified in the earlier analysis, along with their CO2 emissions. Eigenvector centrality measures the systemic influence of a district within the network, assigning higher values to districts connected to other highly connected neighbors. Degree centrality indicates the number of directly adjacent districts (those sharing borders). Weighted degree represents the total strength of these adjacency-based connections, reflecting both the number and the intensity of relationships among neighboring districts.
The analysis of degree centrality shows that all of the highest-emission zones (94, 82, 107, 108, and 72) have a degree of 4. The average degree of the entire network is approximately 3.69.
The eigenvector centrality values for the top emission zones are remarkably high (e.g., 0.60 for Zone 94 and 0.72 for Zone 108). This metric measures a zone’s influence by assessing its connections to other highly connected districts. The high values indicate that the high-emission zones are not isolated; they are part of a dense, influential subgraph of the network.
This demonstrates that these areas exhibit the highest aggregated emissions, in addition to being in a central position within the network. Their emissions result from a dense grouping of high-emitting land uses, including industrial land, continuous urban fabric, and transport land. Their centrality means that changes in these districts can affect the emission dynamics of neighboring areas, either through spillover effects or through the redistribution of urban functions.
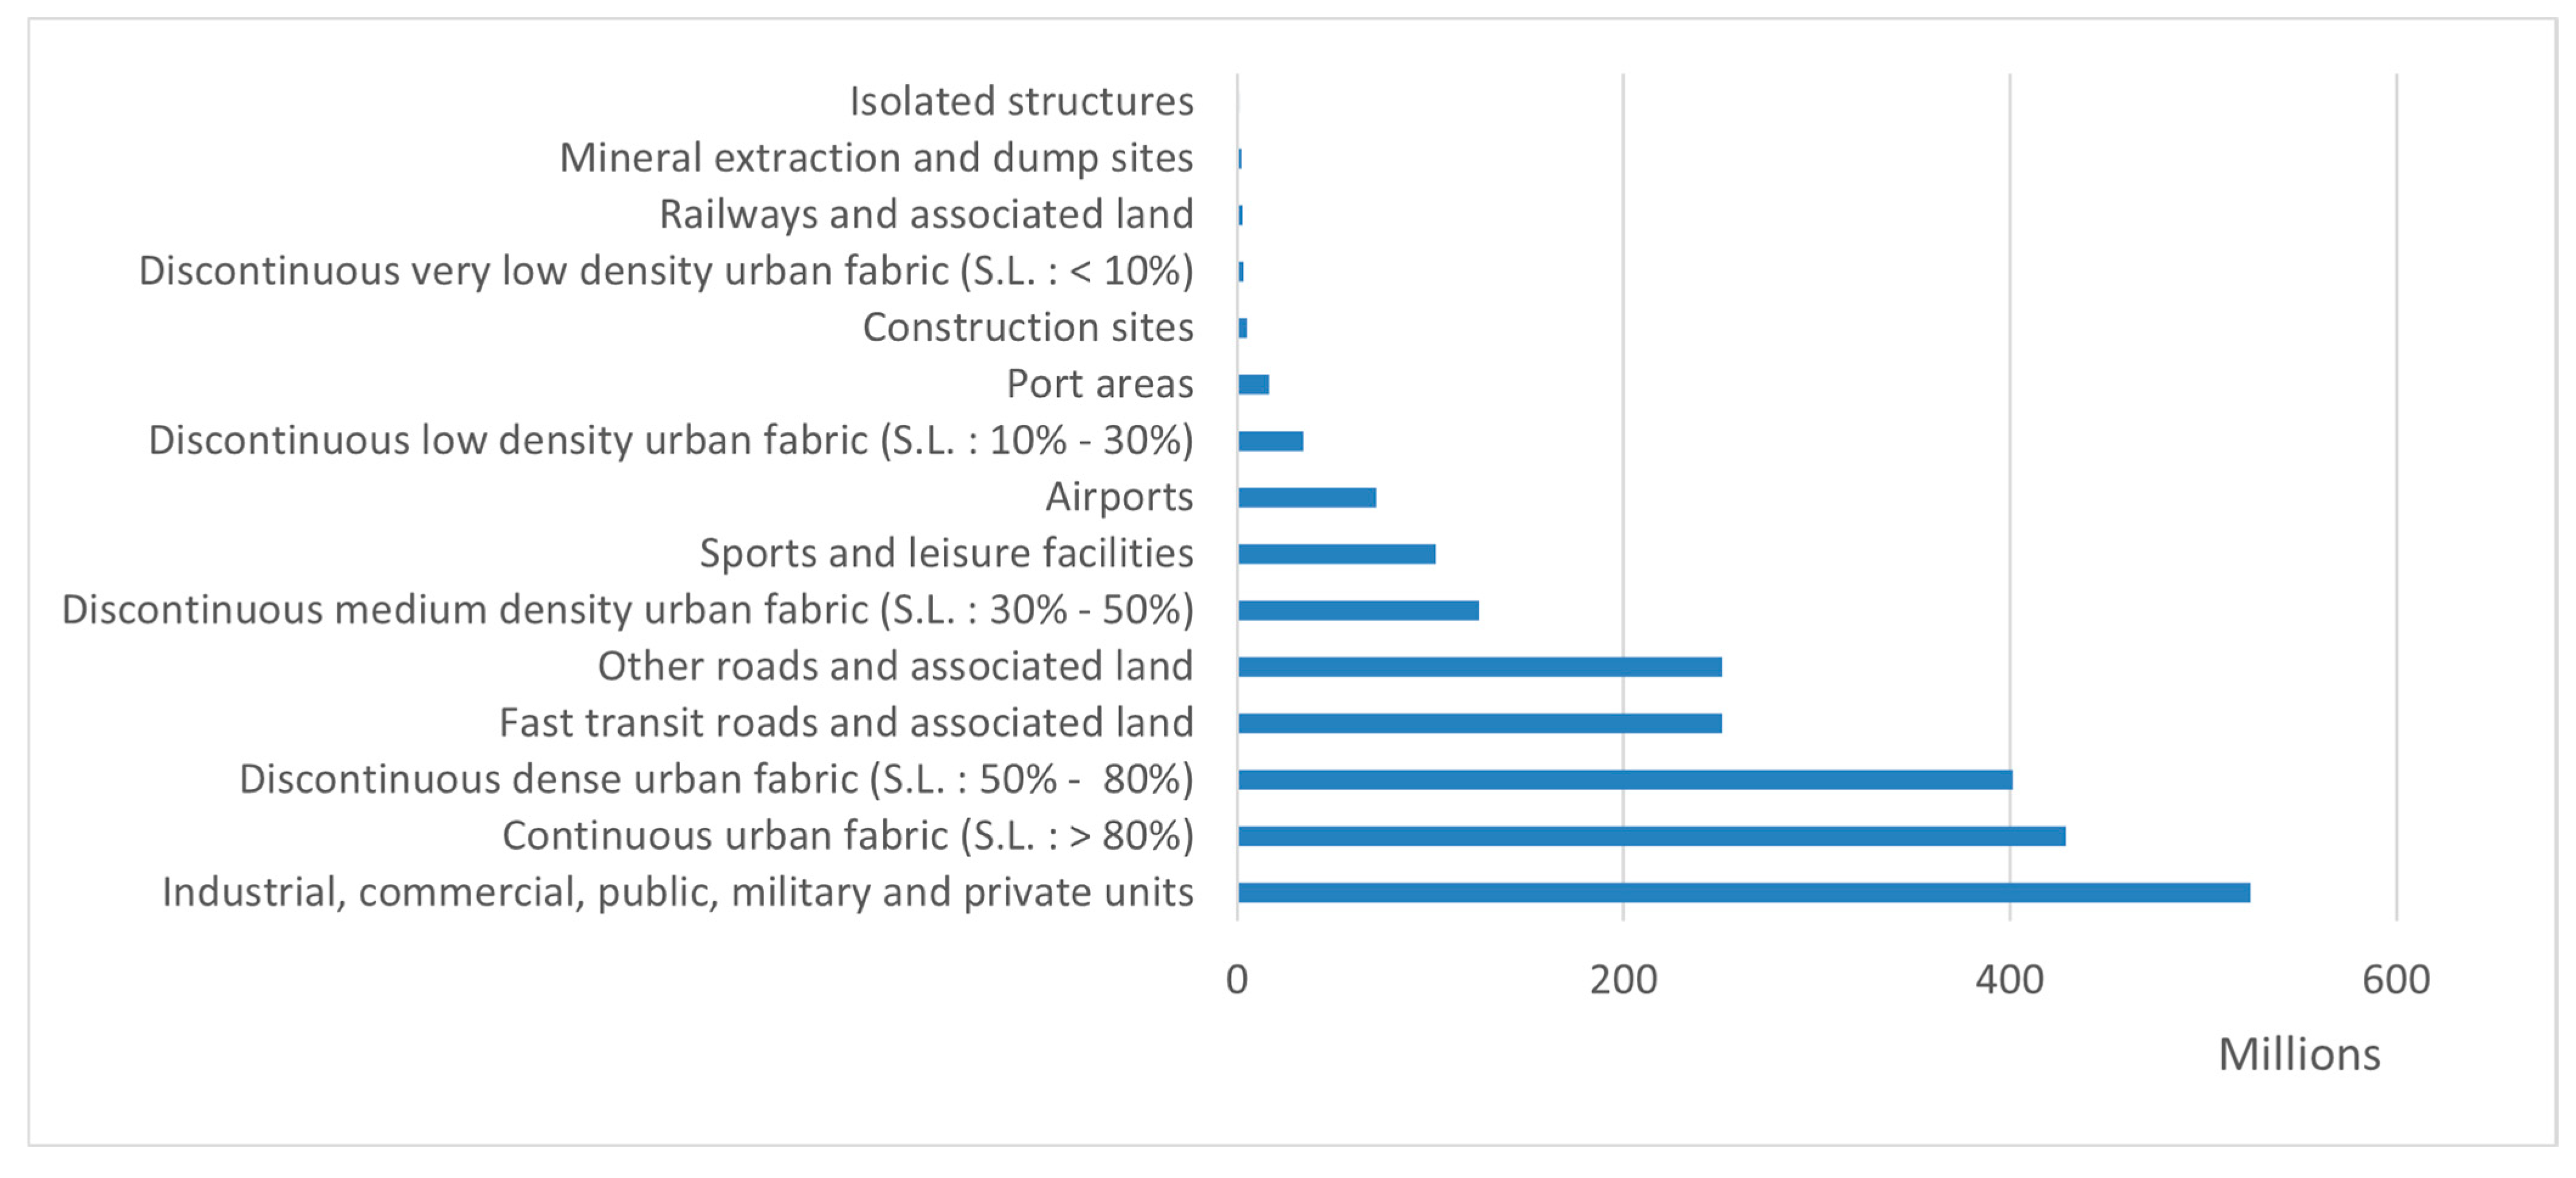
Further examination of the edges of the network, representing the weighted emission contributions of land-use types to eco-districts, gives a hierarchy of land-use intensity based on CO2 output (Figure 9). The five leading land-use types responsible for emissions over the urban extent are as follows:
  • Industrial, commercial, public, military, and private units (Total: ~524.7 million kg CO2);
  • Continuous urban fabric (S.L. > 80%) (Total: ~428.9 million kg CO2);
  • Discontinuous dense urban fabric (S.L. 50–80%) (Total: ~401.5 million kg CO2);
  • Other roads and associated land (Total: ~250.9 million kg CO2);
  • Fast transit roads and associated land (Total: ~250.9 million kg CO2).
Table 5 presents a breakdown of total CO2 emissions by land-use category across all eco-districts in the Reggio Calabria FUA. Industrial, commercial, public, military, and private units stand out as the most emission-intensive, contributing over 524 million kilograms of CO2, or about 28.3% of total emissions, despite appearing in only 63 eco-cells. This is followed by continuous urban fabric (S.L. > 80%) and discontinuous dense urban fabric (S.L. 50–80%), which together account for nearly 45% of emissions and are widely distributed across the territory. Road infrastructure, including fast transit roads and other roads, adds over 27% to the city’s overall emissions.
The land-use mix of these activities confirms that emission intensity is not a function of the presence of land use but rather how those uses are combined and concentrated in particular districts. For example, industrial areas are comparatively few, yet their influence is concentrated in the eco-districts where they prevail. Road infrastructure, on the other hand, is diffused city-wide, generating dispersed emissions patterns. The integration of land use and network analysis highlights the systemic character of emissions in Reggio Calabria FUA. High-emission districts are defined not only by their land-use composition but also by how emission-intensive uses are spatially organized and interconnected within the urban fabric.

5. Discussion

5.1. Interconnected Nature of Urban Emissions

The results collectively show that urban emissions function as part of a connected spatial system rather than as isolated occurrences. This interconnected nature reflects how neighboring districts and their land-use structures influence each other’s carbon outcomes. Such a perspective challenges conventional planning approaches that assess emission sources independently, suggesting instead that interventions in structurally central districts can trigger city-wide mitigation effects. Recognizing these spatial interdependencies allows planners to shift focus from static hotspots to dynamic emission drivers, creating strategies that are both systemic and spatially coordinated.
Importantly, the analysis suggests that emission reduction efforts cannot be confined to high-emitting districts but also to their influence in the network generally. To this end, eco-districts can act as planning units that connect scientific models with zoning policy. Centrality measures, for instance, highlight eco-districts which may not necessarily be emitting the highest level of CO2 but are structurally central in bridging emission-intensive land use towards the city’s territorial organization. Intervention in these structurally fundamental nodes involves greater systemic leverage because improvement in these dimensions is likely to cause spatial ripple effects, either through infrastructure interconnectivity, functional interdependencies, or urban spillovers. This perspective moves the focus from static emission hotspots to active emission drivers, enabling more effective and targeted planning for spatialized mitigation.

5.2. Multiscale Implications for Urban Planning

With the network analysis, the framework assists in shifting from identifying significant areas to pinpointing specific locations where action is required. The eco-districts indicate where actions can have the most impact due to their high centrality and overall CO2 emissions. Yet, eco-district level interventions by themselves run the risk of being too general or extensive. To counter this, the framework can be used by urban planners to zoom in on specific eco-communities and eco-cells within the high-priority districts. This multiscale framework allows for hotspots of emissions to be localized and land-use structures to be assessed in greater detail to guide spatially specific interventions.
The spatial framework adapted in this research provides a multiscale foundation for action-oriented climate planning. At the eco-district level, results support their implementation as strategic planning units best adapted to grasping systemic trends and managing spatial flux. Their centrality within the network implies they are optimally placed for long-term intervention.
At finer scales, eco-community and eco-cell scales are important for identifying spatial distinctions and applying real, localized solutions. The ability to isolate single cells with very specific land-use patterns enables planners to zoom into zones in which the introduction of even the smallest land-use change can stimulate measurable emission reductions. This accuracy at the micro-level makes cities able to reconcile strategic goals with operational needs, creating a planning approach that is systemic in scope and place-specific in execution.
Integration of different scales also enables the establishment of ecological compensation mechanisms between territorial cells. The high-emission eco-cells in central districts can be compensated by increased sequestration in adjacent or structurally associated cells, maintaining a less unequal territorial carbon profile and enabling a concerted trajectory toward urban resilience.
Ultimately, this study successfully addresses its core research question: How can a bipartite spatial network linking eco-districts and land-use categories be used to reveal structurally influential districts and pinpoint priority locations for targeted CO2-mitigation in an urban area? Moreover, the research met its three main objectives by first building the bipartite spatial network between eco-districts and land-use categories. Second, the centrality metrics successfully identified structurally influential eco-districts and dominant emitting land uses. Finally, the analysis of these influential districts and the ability to zoom into lower scales provided a clear basis for suggesting intervention hotspots and proposing spatial actions.

5.3. Methodological Reflection and Scientific Contribution

This study introduces a novel methodological framework that applies bipartite spatial network analysis to urban carbon accounting. Conventional models tend to either estimate emissions by sector or at geographically resolutions, unable to uncover cross-scale structural interdependencies. Conversely, this study combines the land-use emissions’ functional logic with the spatial layout of the city, providing a data-driven yet spatial framework for CO2 mitigation in the city.
The method’s scientific validity lies in its ability to reveal relationships that are not visible through traditional emission inventories. By linking land-use categories with eco-districts, the bipartite structure enables a relational understanding of how emissions are distributed and reinforced across the urban system. Furthermore, the use of network centrality as a proxy for influence and prioritization provides a theoretically grounded way to translate structural properties into actionable planning guidance.
Beyond its analytical innovation, the framework strengthens the interface between carbon accounting and spatial planning practice. It offers a scalable and replicable workflow applicable to other FUAs using standardized datasets such as the Urban Atlas. This enhances the methodological robustness of urban ecosystem service assessments by explicitly incorporating spatial interdependencies.

5.4. Limitations and Future Research

While the spatial and structural dimensions of emissions have been thoroughly explored, in this paper the behavioral and institutional factors that influence emissions over time are not taken into account. For example, whether residents commute to the city, how buildings are used, or the mechanism by which policy in the city promotes green retrofits are outside the current analytical horizon. This exclusion is methodologically justified, as the research sought to isolate the spatial pattern of emissions employing similarly and comparably defined datasets. In doing so, the research creates a replicable and policy-relevant analytical space that can subsequently be generalized when more recent, more dynamic datasets become available.
The model also does not integrate socio-economic overlays since these datasets are typically aggregated at administrative levels that do not align with the eco-district spatial units used in this analysis. Including such data would introduce spatial mismatches and reduce comparability between cities. For this reason, the current study focuses on the physical and functional logic of emissions rather than their socio-economic context. Nevertheless, future research could integrate socio-economic indicators to examine how emission structures intersect with issues of spatial equity, vulnerability, and environmental justice.
The current framework also has a static representation of carbon sequestration and lacks projections of future sequestration or land rehabilitation trends. The choice is both an acknowledgment of current data limitations and an acknowledgment that the study is attempting to construct a spatially explicit rather than predictive framework. Projections of future sequestration capacity would need time-series land-use and vegetation data that are currently not available for the case study. The model is, nevertheless, adaptive and can be adapted to incorporate forecasted land-cover change or rehabilitation scenarios once these data become available, rendering it more useful for climate planning across longer timescales.
Lastly, whereas Reggio Calabria FUA is the appropriate pilot city for medium-sized European urban areas, expanding the methodology to other types of urban settings would make it more applicable.
This research provides a transferable and reproducible framework for structural leverage point identification in urban CO2 mitigation. The approach extends conventional emission inventories with a spatial network methodology that reveals systemic interdependency. Although behavioral, socio-economic, and temporal dynamics were beyond the scope of this research, the model is dynamic and could develop in tandem with data enhancement to make urban climate policy more integrated, fairer, and forward-looking.

5.5. Approaches for Urban Planning to Address Carbon Emissions

From this spatial network analysis, three key approaches for urban planning can be developed to address carbon emissions:
  • Targeted Land Use Reconfiguration
Planners can identify the most emission-heavy eco-cells and target inefficiently used or underutilized land, such as surface parking lots, vacant parcels, and oversized roadways, for redevelopment into green infrastructure. Gradually improving local parks, urban forests, or green roofs can reduce emissions over time and improve microclimatic conditions.
  • Localized Retrofitting and Densification Control
For areas with dense urban development, emissions can be reduced by retrofitting buildings for energy efficiency, controlling densification, and incorporating passive design features. In industrial zones, adopting cleaner technologies or relocating high-emission activities to outer regions with better compensatory capacity can also be effective.
  • Ecological Compensation Across the District
Understanding that certain areas cannot be readily changed because of land-use limitations or socio-economic value, planners are able to establish compensation strategies on the eco-district level. Zones with high emissions can be compensated by improving sequestration in lower-emission or neighboring cells within the same district, achieving a practical ecological equilibrium without interfering with essential urban activities.
This ecological compensation idea is further supported by recognizing the contribution of peripheral, pre-urban lands, typically dense in natural and semi-natural land uses. In Reggio Calabria FUA, these lands can act as key ecological resources, with compensatory functions for more urbanized lands with low-carbon sequestration capacity. The spatial network analysis supports that emissions and environmental activities overflow between individual districts, so a change in one district can affect the others’ environmental performance. This emphasizes the need for a new planning paradigm that moves beyond administrative boundaries and embraces a functional territorial logic. Urban mitigation strategies would then have to consider not only where emissions are generated but where capacities within the natural world are found, particularly in the surrounding areas, and how activities in one location can exacerbate or counter effects in other locations in the urban system.
This analytical framework highlights how emissions-based planning needs to function at both scales together: employing the eco-district to direct systemic decision-making and the eco-cell to apply site-by-site action. The approach illustrates the necessity of spatial specificity in urban climate strategy formation and offers a basis for cities to operationalize ecosystem services toward achieving their decarbonization ambitions.

6. Conclusions

This study demonstrates that urban CO2 emissions are not independent phenomena but part of a spatially interconnected system driven by land-use interactions. Supported by a net emission imbalance of approximately 1.85 billion kg CO2 per year, the bipartite network analysis confirms that a city’s carbon footprint results from relational dynamics among eco-districts rather than isolated sources. The study’s methodological approach provides a novel and compelling window for the identification of both emission hotspots and structurally central influencer, shifting the focus from static, geographically contained problems to dynamic, system-wide solutions.
The findings reveal that urban CO2 emissions are not always evenly spread out or solely influenced by the intensity of land use. Rather, certain eco-districts emerge as hubs of centrality in the emissions system, based on their land use and functional connectivity. For instance, Districts 94, 82, 107, 108, and 72 together account for over 500 million kg CO2 per year, with eigenvector centrality values between 0.54 and 0.72, indicating their structural influence as leverage points for city-wide mitigation. At the scale of these districts, it is possible to identify high-emission intensity areas with dense urban form and industrial use and limited sequestration opportunity.
Through using a dual-scale, network analysis framework, this study presents a new instrument for planners and policymakers seeking to coordinate climate goals into the spatial logic of cities. The method is superior to common emissions mapping due to its quantification not only of where emissions occur, but of how a given place shapes emissions pathways across the city system. This systemic understanding is required to build interconnected, place-targeted strategies that reconcile emission reduction with ecosystem service enhancement.
At a planning scale, the research adds to the emerging discourse on climate-sensitive and ecosystem service-based urbanism. It illustrates the potential of spatial planning to move from static assessments towards evidence-based relational decision-making, where mitigation is localized as well as strategically distributed across space. Incorporating CO2 emissions and sequestration within a network context also increases the ability of planning to act as an intermediary between environmental objectives and spatial transformation.
The proposed approach is not just analytically but also highly adaptable. It relies on publicly available geospatial data and scalable processes, thus being transferable to other urban agglomerations with similar challenges. Highly spatially diverse and more sustainability-focused cities can benefit greatly from this framework.
In sum, the study suggests the application of multiscale, network-analysis tools that coordinate spatial interventions with environmental performance. In an era where cities across the world are concerned about balancing growth with decarbonization and resilience, methodologies such as the one presented here offer a promising pathway to translate ecosystem service values into actionable and equitable urban policy.

Author Contributions

Conceptualization, C.B.; methodology, N.H.; visualization, N.H. and P.S.; writing—original draft preparation, N.H.; writing—review and editing, N.H. and P.S.; supervision, C.B.; project administration, C.B. All authors have read and agreed to the published version of the manuscript.

Funding

This research was funded by the European Union—NextGenerationEU PNRR—Missione 4 “Istruzione e Ricerca”—Componente 2 “Dalla Ricerca all’Impresa”—Investimento 1.1—Fondo per il Programma Nazionale della Ricerca (PNR) within the “ECO-SET—A Multidisciplinary approach to plan Ecosystem Services for cities in Transition” project.

Institutional Review Board Statement

Not applicable.

Informed Consent Statement

Not applicable.

Data Availability Statement

The raw data used in this study are openly available in the European Environment Agency’s Urban Atlas at https://land.copernicus.eu/en/products/urban-atlas/urban-atlas-2018 (accessed on 9 December 2024).

Conflicts of Interest

The authors declare no conflicts of interest.

References

  1. Crippa, M.; Guizzardi, D.; Pisoni, E.; Solazzo, E.; Guion, A.; Muntean, M.; Florczyk, A.; Schiavina, M.; Melchiorri, M.; Hutfilter, A.F. Global Anthropogenic Emissions in Urban Areas: Patterns, Trends, and Challenges. Environ. Res. Lett. 2021, 16, 074033. [Google Scholar] [CrossRef]
  2. United Nations Human Settlements Programme. Urban Climate Action: The Urban Content of the NDCs—Global Review 2022; UN-Habitat: Nairobi, Kenya, 2023. [Google Scholar] [CrossRef]
  3. Pu, Y.; Wang, Y.; Wang, P. Driving Effects of Urbanization on City-Level Carbon Dioxide Emissions: From Multiple Perspectives of Urbanization. Int. J. Urban Sci. 2022, 26, 108–128. [Google Scholar] [CrossRef]
  4. Creutzig, F.; Baiocchi, G.; Bierkandt, R.; Pichler, P.-P.; Seto, K.C. Global Typology of Urban Energy Use and Potentials for an Urbanization Mitigation Wedge. Proc. Natl. Acad. Sci. USA 2015, 112, 6283–6288. [Google Scholar] [CrossRef] [PubMed]
  5. Zarco-Soto, I.M.; Zarco-Periñán, P.J.; Sánchez-Durán, R. Influence of Cities Population Size on Their Energy Consumption and CO2 Emissions: The Case of Spain. Environ. Sci. Pollut. Res. 2021, 28, 28146–28167. [Google Scholar] [CrossRef]
  6. Garschagen, M.; Romero-Lankao, P. Exploring the Relationships between Urbanization Trends and Climate Change Vulnerability. Clim. Change 2015, 133, 37–52. [Google Scholar] [CrossRef]
  7. Das, S.; Choudhury, M.R.; Chatterjee, B.; Das, P.; Bagri, S.; Paul, D.; Bera, M.; Dutta, S. Unraveling the Urban Climate Crisis: Exploring the Nexus of Urbanization, Climate Change, and Their Impacts on the Environment and Human Well-Being–A Global Perspective. AIMS Public Health 2024, 11, 963. [Google Scholar] [CrossRef]
  8. Eichhorn, S.; Rusche, K.; Weith, T. Integrative Governance Processes towards Sustainable Spatial Development—Solving Conflicts between Urban Infill Development and Climate Change Adaptation. J. Environ. Plan. Manag. 2021, 64, 2233–2256. [Google Scholar] [CrossRef]
  9. Grafakos, S.; Trigg, K.; Landauer, M.; Chelleri, L.; Dhakal, S. Analytical Framework to Evaluate the Level of Integration of Climate Adaptation and Mitigation in Cities. Clim. Change 2019, 154, 87–106. [Google Scholar] [CrossRef]
  10. OECD. Decarbonising Urban Mobility with Land Use and Transport Policies: The Case of Auckland, New Zealand; OECD Publishing: Paris, France, 2020. [Google Scholar] [CrossRef]
  11. Ghorbany, S.; Hu, M. Urban Embodied Carbon Assessment: Methodology and Insights from Analyzing over a Million Buildings in Chicago. Carbon Manag. 2024, 15, 2382993. [Google Scholar] [CrossRef]
  12. Kılkış, Ş. Urban Emissions and Land Use Efficiency Scenarios for Avoiding Increments of Global Warming. Energy 2024, 307, 132174. [Google Scholar] [CrossRef]
  13. Wang, S.-H.; Huang, S.-L.; Huang, P.-J. Can Spatial Planning Really Mitigate Carbon Dioxide Emissions in Urban Areas? A Case Study in Taipei, Taiwan. Landsc. Urban Plan. 2018, 169, 22–36. [Google Scholar] [CrossRef]
  14. Dadashpoor, H.; Panahi, H. Exploring an Integrated Spatially Model for Land-Use Scenarios Simulation in a Metropolitan Region. Environ. Dev. Sustain. 2021, 23, 13628–13649. [Google Scholar] [CrossRef]
  15. Raimbault, J. An Interdisciplinary Bibliometric Analysis of Models for Land-Use and Transport Interactions. arXiv 2021, arXiv:2102.13501. [Google Scholar] [CrossRef]
  16. Stokes, E.C.; Seto, K.C. Climate Change and Urban Land Systems: Bridging the Gaps between Urbanism and Land Science. J. Land Use Sci. 2016, 11, 698–708. [Google Scholar] [CrossRef]
  17. Gómez-Baggethun, E.; Barton, D.N. Classifying and Valuing Ecosystem Services for Urban Planning. Ecol. Econ. 2013, 86, 235–245. [Google Scholar] [CrossRef]
  18. Mengist, W.; Soromessa, T.; Feyisa, G.L. A Global View of Regulatory Ecosystem Services: Existed Knowledge, Trends, and Research Gaps. Ecol. Process. 2020, 9, 40. [Google Scholar] [CrossRef]
  19. Skrzypczak, D.; Gorazda, K.; Mikula, K.; Mironiuk, M.; Kominko, H.; Sawska, K.; Evrard, D.; Trzaska, K.; Moustakas, K.; Chojnacka, K. Towards Carbon Neutrality: Enhancing CO2 Sequestration by Plants to Reduce Carbon Footprint. Sci. Total Environ. 2025, 966, 178763. [Google Scholar] [CrossRef]
  20. Keith, H.; Vardon, M.; Lindenmayer, D.; Mackey, B. Accounting for Carbon Stocks and Flows: Storage and Sequestration Are Both Ecosystem Services. In Proceedings of the 25th Meeting of the London Group on Environmental Accounting, Melbourne, Australia, 7–10 October 2019; pp. 7–10. [Google Scholar]
  21. Kim, J.; Kang, Y.; Kim, D.; Son, S.; Kim, E.J. Carbon Storage and Sequestration Analysis by Urban Park Grid Using I-Tree Eco and Drone-Based Modeling. Forests 2024, 15, 683. [Google Scholar] [CrossRef]
  22. Haase, D.; Larondelle, N.; Andersson, E.; Artmann, M.; Borgström, S.; Breuste, J.; Gomez-Baggethun, E.; Gren, Å.; Hamstead, Z.; Hansen, R.; et al. A Quantitative Review of Urban Ecosystem Service Assessments: Concepts, Models, and Implementation. AMBIO 2014, 43, 413–433. [Google Scholar] [CrossRef]
  23. Park, C.; Jeong, S.; Park, M.-S.; Park, H.; Yun, J.; Lee, S.-S.; Park, S.-H. Spatiotemporal Variations in Urban CO2 Flux with Land-Use Types in Seoul. Carbon Balance Manag. 2022, 17, 3. [Google Scholar] [CrossRef] [PubMed]
  24. Bevilacqua, C.; Sohrabi, P.; Hamdy, N. Spatializing Social Networking Analysis to Capture Local Innovation Flows towards Inclusive Transition. Sustainability 2022, 14, 3000. [Google Scholar] [CrossRef]
  25. Sahu, P.; Debsarma, C. Climate Change and Urban Environment Sustainability: Issues and Challenges. In Climate Change and Urban Environment Sustainability; Disaster Resilience and Green Growth; Pathak, B., Dubey, R.S., Eds.; Springer Nature: Singapore, 2023; pp. 1–13. ISBN 978-981-19-7617-9. [Google Scholar]
  26. Pan, H.; Page, J.; Shi, R.; Cong, C.; Cai, Z.; Barthel, S.; Thollander, P.; Colding, J.; Kalantari, Z. Contribution of Prioritized Urban Nature-Based Solutions Allocation to Carbon Neutrality. Nat. Clim. Change 2023, 13, 862–870. [Google Scholar] [CrossRef]
  27. World Wide Fund for Nature (WWF) Nature Based Solutions for Mitigation and Adaptation towards Climate Change. Available online: https://wwfeu.awsassets.panda.org/downloads/2023_wwf_report_nbs.pdf (accessed on 16 April 2025).
  28. OECD. Global Monitoring of Policies for Decarbonising Buildings: A Multi-Level Approach; OECD Urban Studies; OECD: Paris, France, 2024; ISBN 978-92-64-45449-1. [Google Scholar]
  29. Sabet, S.; Farooq, B. Exploring the Combined Effects of Major Fuel Technologies, Eco-Routing, and Eco-Driving for Sustainable Traffic Decarbonization in Downtown Toronto. Transp. Res. Part A Policy Pract. 2025, 192, 104385. [Google Scholar] [CrossRef]
  30. Shen, J.; Zheng, F.; Ma, Y.; Deng, W.; Zhang, Z. Urban Travel Carbon Emission Mitigation Approach Using Deep Reinforcement Learning. Sci. Rep. 2024, 14, 27778. [Google Scholar] [CrossRef]
  31. Saarikoski, H.; Primmer, E.; Saarela, S.-R.; Antunes, P.; Aszalós, R.; Baró, F.; Berry, P.; Blanko, G.G.; Goméz-Baggethun, E.; Carvalho, L. Institutional Challenges in Putting Ecosystem Service Knowledge in Practice. Ecosyst. Serv. 2018, 29, 579–598. [Google Scholar] [CrossRef]
  32. Eraydin, A. “Resilience Thinking” for Planning. In Resilience Thinking in Urban Planning; Springer: Dordrecht, The Netherlands, 2012; pp. 17–37. ISBN 978-94-007-5476-8. [Google Scholar]
  33. Chen, S.; Liu, Z.; Chen, B.; Zhu, F.; Fath, B.D.; Liang, S.; Su, M.; Yang, J. Dynamic Carbon Emission Linkages Across Boundaries. Earth’s Future 2019, 7, 197–209. [Google Scholar] [CrossRef]
  34. Milnar, M.; Ramaswami, A. Impact of Urban Expansion and In Situ Greenery on Community-Wide Carbon Emissions: Method Development and Insights from 11 US Cities. Environ. Sci. Technol. 2020, 54, 16086–16096. [Google Scholar] [CrossRef]
  35. Gallotti, R.; Sacco, P.; De Domenico, M. Complex Urban Systems: Challenges and Integrated Solutions for the Sustainability and Resilience of Cities. Complexity 2021, 2021, 1782354. [Google Scholar] [CrossRef]
  36. Hamdy, N.; Bevilacqua, C. Assessing the Role of the Blue Economy in the Comprehensive Development of Lagging Coastal Areas. A Case Study of Calabria. In New Metropolitan Perspectives; Smart Innovation, Systems and Technologies; Bevilacqua, C., Balland, P.-A., Kakderi, C., Provenzano, V., Eds.; Springer: Cham, Switzerland, 2023; Volume 639, pp. 21–45. ISBN 978-3-031-34210-3. [Google Scholar]
  37. UN-Habitat World Cities Report 2022: Envisaging the Future of Cities. Available online: https://unhabitat.org/world-cities-report-2022-envisaging-the-future-of-cities (accessed on 23 October 2024).
  38. URBACT II. Sustainable Regeneration in Urban Areas: URBACT II Capitalisation. Available online: https://www.dotaceeu.cz/Dotace/media/SF/FONDY%20EU/2014-2020/Programy/URBACT/Pokyny%20pro%20p%C5%99%C3%ADjemce%2031_12_2016/Sustainable-regeneration-in-urban-areas_1.pdf (accessed on 13 January 2025).
  39. Yang, Y.; Zhang, J.; Huang, J.; Zhao, Y.; Zhao, Q. Urban Density and Spatial Carbon Emission Performance of Megacities in China. Sci. Rep. 2024, 14, 23862. [Google Scholar] [CrossRef]
  40. Yang, Y.; Takase, T. Spatial Characteristics of Carbon Dioxide Emission Intensity of Urban Road Traffic and Driving Factors: Road Network and Land Use. Sustain. Cities Soc. 2024, 113, 105700. [Google Scholar] [CrossRef]
  41. Yaacob, N.F.F.; Yazid, M.R.M.; Abdul Maulud, K.N.; Khahro, S.H.; Javed, Y. Spatio-Temporal Analysis of CO2 Emissions from Vehicles in Urban Areas: A Satellite Imagery Approach. Sustainability 2024, 16, 10765. [Google Scholar] [CrossRef]
  42. Wagner, F.; Nachtigall, F.; Franken, L.; Milojevic-Dupont, N.; Pereira, R.H.M.; Koch, N.; Runge, J.; Gonzalez, M.; Creutzig, F. Using Machine Learning to Understand Causal Relationships between Urban Form and Travel CO2 Emissions across Continents. arXiv 2023, arXiv:2308.16599. [Google Scholar] [CrossRef]
  43. Tang, M.; Hu, F. Land Urbanization and Urban CO2 Emissions: Empirical Evidence from Chinese Prefecture-Level Cities. Heliyon 2023, 9, e19834. [Google Scholar] [CrossRef] [PubMed]
  44. Hu, Y.; Sun, J.; Zheng, J. Spatiotemporal Analysis of Urban Carbon Metabolism and Its Response to Land Use Change: A Case Study of Beijing, China. Atmosphere 2023, 14, 1305. [Google Scholar] [CrossRef]
  45. Wei, L.; Zeng, B. Urban Technology Transfer, Spatial Spillover Effects, and Carbon Emissions in China. Sustainability 2024, 16, 9662. [Google Scholar] [CrossRef]
  46. Fu, H.; Li, B.; Liu, X.; Zheng, J.; Yin, S.; Jiang, H. Spatio-Temporal Coupling Evolution of Urbanisation and Carbon Emission in the Yangtze River Economic Belt. Int. J. Environ. Res. Public Health 2023, 20, 4483. [Google Scholar] [CrossRef]
  47. Lu, Y.; Zhai, G.; Zhou, S.; Shi, Y. Risk Reduction through Urban Spatial Resilience: A Theoretical Framework. Hum. Ecol. Risk Assess. Int. J. 2021, 27, 921–937. [Google Scholar] [CrossRef]
  48. Zetterberg, L.; Eriksson, M.; Ravry, C.; Santosa, A.; Ng, N. Neighbourhood Social Sustainable Development and Spatial Scale: A Qualitative Case Study in Sweden. Local Environ. 2023, 28, 793–810. [Google Scholar] [CrossRef]
  49. Ye, Y. Sino-Singapore Tianjin Eco-City (Case: CHN-Tianjin). Available online: https://atlasofurbantech.org/cases/chn-tianjin/ (accessed on 22 April 2025).
  50. Shi, Y.; Zheng, B.; Wang, Z.; Zheng, J. Mixed Land Use and Its Relationship with CO2 Emissions: A Comparative Analysis Based on Several Typical Development Zones in Shanghai. Land 2023, 12, 1675. [Google Scholar] [CrossRef]
  51. Chuai, X.; Xu, H.; Liu, Z.; Xiang, A.; Luo, Y.; Mao, W.; Wang, T.; Ye, X.; Miao, L.; Zhao, R. Promoting Low-Carbon Land Use: From Theory to Practical Application through Exploring New Methods. Humanit. Soc. Sci. Commun. 2024, 11, 727. [Google Scholar] [CrossRef]
  52. Li, Q.; Chen, X.; Jiao, S.; Song, W.; Zong, W.; Niu, Y. Can Mixed Land Use Reduce CO2 Emissions? A Case Study of 268 Chinese Cities. Sustainability 2022, 14, 15117. [Google Scholar] [CrossRef]
  53. Morelli, C.; Maranzano, P.; Otto, P. Spatiotemporal Clustering of GHGs Emissions in Europe: Exploring the Role of Spatial Component. arXiv 2025, arXiv:2503.11909. [Google Scholar] [CrossRef]
  54. Baur, A.H.; Förster, M.; Kleinschmit, B. The Spatial Dimension of Urban Greenhouse Gas Emissions: Analyzing the Influence of Spatial Structures and LULC Patterns in European Cities. Landsc. Ecol. 2015, 30, 1195–1205. [Google Scholar] [CrossRef]
  55. EEA Urban Atlas Land Cover/Land Use 2018 (Vector), Europe, 6-Yearly, July 2021. Available online: https://sdi.eea.europa.eu/catalogue/copernicus/api/records/fb4dffa1-6ceb-4cc0-8372-1ed354c285e6 (accessed on 23 March 2025).
  56. ENEA SIAPE—Sistema Informativo sugli Attestati di Prestazione Energetica. Available online: https://siape.enea.it/ (accessed on 22 January 2025).
  57. International Union of Railways (UIC) Carbon Footprint of Railway Infrastructure: Comparing Existing Methodologies on Typical Corridors; Recommendations for a Harmonised Approach. Available online: https://uic.org/IMG/pdf/carbon_footprint_of_railway_infrastructure.pdf (accessed on 13 March 2025).
  58. Enea, D.; Mastrilli, A. Sustainable Planning: The Case Study of the Strait of Messina Ports. Environ. Sci. Pollut. Res. 2024, 31, 15348–15363. [Google Scholar] [CrossRef] [PubMed]
  59. Fregola, R.A.; Ciccolella, A.; Festa, V.; Ruggieri, G.; Schingaro, E.; Tursi, F.; Ventruti, G. Review of Polymetallic Mineralization in the Sila and Serre Massifs (Calabria, Southern Italy). Minerals 2023, 13, 439. [Google Scholar] [CrossRef]
  60. Ralph, J.; Von Bargen, D.; Martynov, P.; Zhang, J.; Que, X.; Prabhu, A.; Morrison, S.M.; Li, W.; Ma, X. Metropolitan City of Reggio Calabria, Calabria, Italy. Available online: https://www.mindat.org/loc-31470.html (accessed on 3 February 2025).
  61. Brilli, L.; Toscano, P.; Carotenuto, F.; Di Lonardo, S.; Di Tommasi, P.; Magliulo, V.; Manco, A.; Vitale, L.; Zaldei, A.; Gioli, B. Long-Term Investigation of Methane and Carbon Dioxide Emissions in Two Italian Landfills. Heliyon 2024, 10, e29356. [Google Scholar] [CrossRef]
  62. Weigert, M.; Melnyk, O.; Winkler, L.; Raab, J. Carbon Emissions of Construction Processes on Urban Construction Sites. Sustainability 2022, 14, 12947. [Google Scholar] [CrossRef]
  63. Groth, P.; Miller, R.; Nadkarni, N.; Riley, M.; Shoup, L. Quantifying the Greenhouse Gas Benefits of Urban Parks. Available online: http://cloud.tpl.org/pubs/benefits_greenhouse_gases_and_parks_whitepaper.pdf (accessed on 22 July 2025).
  64. European Climate Change Programme (ECCP) Agricultural Soils-Final Report. Available online: https://climate.ec.europa.eu/system/files/2016-11/finalreport_agricsoils_en.pdf (accessed on 13 February 2025).
  65. Lopez-Bellido, P.J.; Lopez-Bellido, L.; Fernandez-Garcia, P.; Muñoz-Romero, V.; Lopez-Bellido, F.J. Assessment of Carbon Sequestration and the Carbon Footprint in Olive Groves in Southern Spain. Carbon Manag. 2016, 7, 161–170. [Google Scholar] [CrossRef]
  66. Scandellari, F.; Caruso, G.; Liguori, G.; Meggio, F.; Palese, A.M.; Zanotelli, D.; Celano, G.; Gucci, R.; Inglese, P.; Pitacco, A. A Survey of Carbon Sequestration Potential of Orchards and Vineyards in Italy. Eur. J. Hortic. Sci. 2016, 81, 106–114. [Google Scholar] [CrossRef]
  67. Intergovernmental Panel on Climate Change (IPCC) Land Use, Land-Use Change, and Forestry—Chapter 3: Projecting Land-Use Change. Available online: https://archive.ipcc.ch/ipccreports/sres/land_use/index.php?idp=28 (accessed on 2 March 2025).
  68. Pan, Y.; Birdsey, R.A.; Fang, J.; Houghton, R.; Kauppi, P.E.; Kurz, W.A.; Phillips, O.L.; Shvidenko, A.; Lewis, S.L.; Canadell, J.G.; et al. A Large and Persistent Carbon Sink in the World’s Forests. Science 2011, 333, 988–993. [Google Scholar] [CrossRef]
  69. Xu, W.; Zhang, B.; Xu, Q.; Gao, D.; Zuo, H.; Ren, R.; Diao, K.; Chen, Z. Enhanced Carbon Storage in Mixed Coniferous and Broadleaf Forest Compared to Pure Forest in the North Subtropical–Warm Temperate Transition Zone of China. Forests 2024, 15, 1520. [Google Scholar] [CrossRef]
  70. Gratani, L.; Varone, L.; Ricotta, C.; Catoni, R. Mediterranean Shrublands Carbon Sequestration: Environmental and Economic Benefits. Mitig. Adapt. Strateg. Glob. Change 2013, 18, 1167–1182. [Google Scholar] [CrossRef]
  71. Canu, D.M.; Ghermandi, A.; Nunes, P.A.; Lazzari, P.; Cossarini, G.; Solidoro, C. Estimating the Value of Carbon Sequestration Ecosystem Services in the Mediterranean Sea: An Ecological Economics Approach. Glob. Environ. Change 2015, 32, 87–95. [Google Scholar] [CrossRef]
  72. Taylor, S.; Gilbert, P.J.; Cooke, D.A.; Deary, M.E.; Jeffries, M.J. High Carbon Burial Rates by Small Ponds in the Landscape. Front. Ecol. Environ. 2019, 17, 25–31. [Google Scholar] [CrossRef]
  73. Malak, D.A.; Marín, A.I.; Trombetti, M.; Roman, S.S. Carbon Pools and Sequestration Potential of Wetlands in the European Union; ETC/ULS Report No. 10/2021; European Topic Centre on Urban, Land and Soil Systems: Viena, Austria; Malaga, Spain, 2021; ISBN 978-3-200-07433-0. [Google Scholar] [CrossRef]
Figure 1. Workflow diagram of the research project methodology for modeling urban CO2 emissions and spatial dynamics.
Sustainability 17 10113 g001
Figure 2. Hierarchical spatial framework for urban analysis.
Sustainability 17 10113 g002
Figure 3. Land-use map of Reggio Calabria FUA, derived from the Urban Atlas dataset [55].
Sustainability 17 10113 g003
Figure 4. Map of eco-districts and their ID numbers in Reggio Calabria FUA.
Sustainability 17 10113 g004
Figure 5. CO2 emission map of Reggio Calabria FUA. The color gradient represents estimated CO2 emission intensity for each eco-district, ranging from dark red (highest emissions) to light yellow (lowest emissions).
Sustainability 17 10113 g005
Figure 6. CO2 sequestration map of Reggio Calabria FUA. The color gradient represents CO2 sequestration capacity for each eco-district, where dark green areas indicate higher sequestration potential and light green areas indicate lower sequestration capacity.
Sustainability 17 10113 g006
Figure 7. Network visualization of land-use contributions to CO2 emissions across grid eco-districts over the thematic CO2 emission map of Reggio Calabria FUA. Legend: Green nodes represent land-use categories and pink nodes represent eco-districts. Node size is proportional to CO2 emissions (green: by land-use type; pink: by eco-district). Edge width indicates the emission share of each land-use type within a specific eco-district.
Sustainability 17 10113 g007
Figure 8. CO2 emissions (in million kg) by land-use category across the five most emission-intensive eco-districts in Reggio Calabria FUA.
Sustainability 17 10113 g008
Figure 9. Emissions (in million kg) by land-use type.
Sustainability 17 10113 g009
Table 1. Land-use categories and CO2 emission/sequestration coefficients.
CodeClassification NameParameterSource
11100Continuous urban fabric (S.L. > 80%)37.5 kg CO2/m2/yr × 100%[56]
11210Discontinuous dense urban fabric (S.L. 50–80%)37.5 kg CO2/m2/yr × 65%
11220Discontinuous medium density urban fabric (S.L. 30–50%)37.5 kg CO2/m2/yr × 40%
11230Discontinuous low dens. Urban fabric (S.L. 10–30%)37.5 kg CO2/m2/yr × 20%
11240Discontinuous very low-density urban fabric (S.L. < 10%)37.5 kg CO2/m2/yr × 5%
11300Isolated structures37.5 kg CO2/m2/yr × 1%
12100Industrial, commercial, public, military, and private units62.8 kg CO2/m2/yr
12210Fast transit roads and associated landRegional road transport CO2 emissions downscaled to Reggio Calabria FUA, distributed per capita, then allocated to roads based on area.
12220Other roads and associated land
12230Railways and associated land50 kgCO2/m2/yr[57]
12300Port AreasVilla San Giovanni port emissions ~ 10,640 tCO2/yr
Reggio Calabria port emissions ~ 950 tCO2/yr
[58]
12400Airports72,104 tCO2/yrAuthor’s calculations based on data retrieved from the airport’s official website (flight schedules and destinations), Flightradar24 (air traffic monitoring), and emission factors by destination/travel distance.
13100Mineral extraction and dump sitesLandfills: 0.88–2.08 kg CO2/m2/yrThere are no active mining activities in Reggio Calabria [59,60]; therefore, the parameter applies only to landfills [61].
13300Construction sites9.31 kg CO2/m2[62]
13400Land without current use0
14100Green urban areas−1.06 kg CO2/m2/yr[63]
14200Sports and leisure facilities75.9 kg CO2/m2/yr[56]
21000Arable land (annual crops)−0.1 to −0.3 kg CO2/m2/yr[64]
22000Permanent crops−0.22 to −2.17 kg CO2 m2 yr1[65,66]
23000Pastures−0.2 to −0.7 kg CO2/m2/yr[64]
24000Complex and mixed cultivation−0.15 to −0.5 kg CO2/m2/year
25000OrchardsThere are no Orchards in Reggio Calabria FUA
31000Forests−1.36 kg CO2/m2/yr[67,68,69]
32000Herbaceous vegetation associations−0.22 to −2.17 kg CO2 m2/yr[70]
33000Open spaces with little or no vegetation0
40000WetlandsThere are no wetlands in Reggio Calabria FUA.
50000WaterBeaches: −0.007 kg CO2/m2/year[71]
Small lakes and ponds: −0.52 kg CO2/m2/year[72]
Rivers: −0.65 kg CO2/m2/year[73]
91000No data0
92000No data0
Table 2. Summary of net CO2 balance for Reggio Calabria FUA.
Total CO2 Emissions (million kg)2222.49
Total CO2 Sequestration (million kg)−368.96
Net Emissions (million kg)1853.53
Number of Eco-Districts232
Number of Net Emitter Eco-Districts109
Number of Net Sequestering Eco-Districts123
Table 3. The top 5 emission-intensive eco-districts.
Eco-District IDTotal Emissions (Million kg)Most Dominant Land Use
94165.8Continuous urban fabric (S.L.: >80%)
82133.9Industrial, commercial, public, military, and private units
10798.0Continuous urban fabric (S.L.: >80%)
10893.3Continuous urban fabric (S.L.: >80%)
7287.4Airports
Table 4. Network metrics for the top 5 highest-emitting eco-districts.
Eco-District’s IdEmissionsEigenvector CentralityDegreeWeighted Degree
941.66 × 1080.603356371416
821.34 × 1080.618014525416
1079.80 × 1070.540203015416
1089.33 × 1070.723252115416
728.74 × 1070.720772309416
Table 5. Emissions by land-use category.
Land-Use CategoryTotal Emissions (Million kg CO2)% of Total EmissionsEco-Districts Frequency
Continuous urban fabric (S.L.: >80%)428.9220%63
Discontinuous dense urban fabric (S.L.: 50–80%)401.4519%115
Discontinuous medium-density urban fabric (S.L.: 30–50%)125.276%112
Discontinuous low-density urban fabric (S.L.: 10–30%)34.102%106
Discontinuous very low-density urban fabric (S.L.: <10%)3.460%74
Isolated structures1.130%158
Industrial, commercial, public, military, and private units524.7125%113
Fast transit roads and associated land250.9012%189
Other roads and associated land250.9012%189
Railways and associated land2.530%38
Port areas16.681%6
Airports72.073%4
Mineral extraction and dump sites2.340%49
Construction sites5.030%37
Disclaimer/Publisher’s Note: The statements, opinions and data contained in all publications are solely those of the individual author(s) and contributor(s) and not of MDPI and/or the editor(s). MDPI and/or the editor(s) disclaim responsibility for any injury to people or property resulting from any ideas, methods, instructions or products referred to in the content.