1. Introduction
The 2011 Thailand Great Flood was among the nation’s most severe natural disasters, affecting millions and causing extensive damage to agriculture, infrastructure, and the economy, particularly throughout the Chao Phraya River Basin (CPRB) and Bangkok [
1]. This catastrophe was driven by unusually heavy and early rainfall (25% above normal), multiple tropical storms, and the La Niña climate phenomenon, which together led to excess water inflows at major reservoirs such as Bhumibol (BB) and Sirikit (SK). Inefficient water management and delayed releases further intensified flooding downstream [
1,
2]. High tides, inadequate drainage capacity, and insufficient flood monitoring at key locations compounded the disaster, resulting in prolonged inundation and exposed gaps in Thailand’s water management and emergency response systems [
3]. These events have underscored the urgent need for real-time hydrological monitoring, integrated data management, and sustainable frameworks to support effective flood mitigation and disaster resilience in the future.
Previous research has explored multiple approaches for improving flood-forecasting accuracy, including remote sensing, optimization, and machine learning. Satellite imagery from sensors such as RADARSAT-2, ThaiChote, ASTER, and TerraSAR-X has been used to delineate flooded areas, although urban flood detection remains constrained by resolution limitations [
4,
5]. Graph-theory and multi-reservoir operation models have been applied to optimize drainage and floodgate efficiency in the Chao Phraya Basin, emphasizing the need for better coordination between upstream inflow and downstream discharge [
6,
7]. In addition, satellite-based flood volume estimation has enhanced real-time forecasting by integrating inflow and outflow data [
3]. Recent studies have further advanced regional hydrological and climate impact assessments in Thailand and neighboring areas by incorporating high-resolution datasets, improved scenario frameworks, and ensemble-based modeling approaches [
8,
9,
10,
11,
12].
Conventional statistical and physical models have been widely used for hydrological prediction, but their limitations in handling nonlinear patterns have motivated the adoption of machine learning (ML) approaches. Neural network models, including multilayer perceptron (MLP) and support vector regression (SVR), have shown improved short-term inflow prediction performance in reservoirs such as BB [
13,
14]. Ensemble learning techniques have further advanced predictive accuracy by integrating diverse models. Multi-model ensemble (MME) frameworks combining regression and deep learning algorithms have achieved greater precision in forecasting daily inflows under complex rainfall conditions [
15]. Studies employing Long Short-Term Memory (LSTM) networks and other deep architectures have demonstrated enhanced temporal pattern recognition and inflow optimization for hydropower generation [
16,
17].
Recent developments in deep learning for hydroclimatic forecasting have introduced several breakthrough approaches that surpass traditional LSTM and conventional machine learning methods. Transformer-based architectures have emerged as particularly powerful tools, with Dong et al. achieving 34% and 26% lower RMSE than raw ECMWF forecasts through enhanced CNN-ResNet blocks coupled with hybrid Xin’anjiang-LSTM models for sub-seasonal precipitation and streamflow forecasting [
18]. Demiray et al. demonstrated Transformer model superiority over LSTM, GRU, and Seq2Seq approaches for 120-h streamflow prediction across 125 diverse locations, maintaining higher NSE and KGE scores while exhibiting lower NRMSE values [
19]. Hybrid LSTM-Transformer architectures have shown exceptional performance, with Li et al. achieving NSE values of 0.970 and 0.953 for flood forecasting applications [
20].
Advanced attention mechanisms have significantly enhanced LSTM architectures, with Wang et al. reporting 8.85% improvement in Nash–Sutcliffe efficiency using multi-head attention flood forecasting models compared to standard LSTM under 3-h lead times [
21]. Graph Neural Networks (GNNs) have revolutionized spatial–temporal modeling in hydrology, with Zandsalimi et al. achieving 67% reduction in prediction error using physics-informed graph neural networks enhanced with Kolmogorov–Arnold Networks [
22]. Kazadi et al. developed FloodGNN-GRU, combining graph neural networks with Gated Recurrent Units for spatio-temporal flood prediction, outperforming baselines by 17% in RMSE while being 1000× faster than physics-based models [
23]. Vision Transformers have been successfully adapted for hydrological applications, with Shafiee Roudbari et al. integrating LiDAR terrain elevation data through Vision Transformers for enhanced hydrometric prediction accuracy [
24].
The Coupled Model Intercomparison Project Phase 5 (CMIP5) provides comprehensive climate projections and has been extensively applied in climate and hydrological studies [
25]. However, its coarse spatial resolution limits applicability for regional analysis in countries like Thailand, where localized weather patterns are critical. CMIP5 has been employed across various domains, such as drought assessment [
26], oceanographic prediction [
27], agricultural yield forecasting [
28], and greenhouse gas emission modeling [
29]. To enhance its relevance for Thailand, statistical downscaling is required to adjust grid resolution and improve the representation of regional climate variability.
MMEs have become an essential strategy for improving predictive accuracy across diverse scientific fields. Early ensemble techniques relied on equal-weight averaging [
30], whereas modern approaches employ Bayesian weighting and machine-learning-based fusion to dynamically adjust model contributions according to performance [
31]. MMEs have proven especially effective in climate modeling by combining multiple General Circulation Models (GCMs) to refine precipitation and temperature forecasts [
32,
33]. More recently, spatiotemporal-aware ensemble frameworks have been proposed to further enhance precipitation predictability by leveraging spatial correlations and temporal dependencies among climate models [
34]. In this study, MMEs are used to average climate models from the CMIP5 project, employing 19 models from the NEX-GDDP dataset to capture variability and uncertainty in climate forecasts.
The Discrete Wavelet Transform (DWT) has emerged as a powerful tool for analyzing data in both temporal and frequency domains [
35]. Widely used in image processing and feature extraction [
36,
37,
38], DWT effectively decomposes time-series data into multiple components, enabling the distinction between short-term fluctuations and long-term hydrological trends. This capability enhances noise reduction and feature extraction, which are critical for improving inflow and discharge forecasting accuracy.
The Nonlinear Autoregressive Model with Exogenous Factor (NARX) has demonstrated strong performance in modeling nonlinear and dynamic systems across various disciplines [
39]. It has been applied in engineering, process optimization, and hydrological forecasting due to its ability to capture long-term dependencies and integrate external variables. Recent studies combining NARX with deep learning architectures such as LSTM and Gated Recurrent Units (GRUs) have improved time-series prediction accuracy for complex hydrological and oceanographic systems [
40,
41,
42,
43]. NARX-based models have also been used for flood risk assessment and short-term forecasting of river water levels, proving effective in supporting disaster preparedness and mitigation strategies [
43].
Building on these foundations, previous research integrated machine learning techniques with climate model outputs to improve hydrological forecasting [
44]. The earlier model combined the Stationary Wavelet Transform (SWT) with NARX to manage nonstationary inflow data, preserving fine-scale temporal patterns. In the present study, SWT is replaced with DWT for computational efficiency, and the model is extended to include both inflow and discharge data. CMIP5-based climate projections are integrated with an MME framework, and DWT is applied for feature extraction with NARX for dynamic modeling. This approach aims to enhance forecasting accuracy for the BB and SK reservoir inflows and the Nakhon Sawan Discharge Station (C2), thereby contributing to sustainable flood management and long-term water resource resilience in Thailand’s CPRB.
2. Sustainable Development Goals (SDGs)
The Sustainable Development Goals, adopted by the United Nations in 2015, comprise 17 interconnected global development objectives to be achieved by 2030. This research directly contributes to three primary SDGs through enhanced hydrological forecasting and adaptive water management.
2.1. SDG 6: Clean Water and Sanitation
SDG 6: “Ensure availability and sustainable management of water and sanitation for all” addresses universal access to safe water and integrated water resource management (IWRM). Key targets include equitable water allocation (Target 6.1), water-use efficiency and scarcity reduction (Target 6.4), IWRM implementation (Target 6.5), and ecosystem protection (Target 6.6). The forecasting framework enables water managers to allocate resources equitably, optimize reservoir operations while maintaining environmental flows, reduce water loss through improved efficiency, and implement coordinated basin-scale management.
2.2. SDG 11: Sustainable Cities and Communities
SDG 11: “Make cities and human settlements inclusive, safe, resilient and sustainable” emphasizes disaster risk reduction and climate-resilient infrastructure. Target 11.5 seeks to significantly reduce deaths and economic losses from disasters, including water-related hazards. The 2011 Great Flood in Thailand resulted in approximately 865 deaths and USD 40 billion in economic losses, exemplifying the catastrophic impacts SDG 11.5 aims to prevent. Advanced hydrological forecasting enables early warning systems, timely evacuation, emergency resource mobilization, and infrastructure planning, thereby directly reducing mortality and economic losses from floods.
2.3. SDG 13: Climate Action
SDG 13: “Take urgent action to combat climate change and its impacts” calls for strengthening resilience and adaptive capacity to climate-related hazards. Key targets include resilience building (Target 13.1) through enhanced understanding of future climate impacts and integration of climate measures into policy and planning (Target 13.2). This research employs climate projections (CMIP5) under multiple emissions scenarios to quantify future hydrological extremes, providing the scientific evidence base for developing and implementing climate adaptation strategies.
2.4. SDG Interconnections in Water Resource Management
Water security directly enables achievements across multiple SDGs: food security (SDG 2), public health (SDG 3), renewable energy (SDG 7), economic development (SDG 8), responsible consumption (SDG 12), ecosystem conservation (SDG 15), and global cooperation (SDG 17). In the CPRB, multi-functional reservoirs serve hydropower generation (30% of Thailand’s electricity), irrigation (supporting 60% of national agricultural production), and municipal water supply. Improved hydrological forecasting strengthens integrated management of these competing objectives, simultaneously advancing multiple SDGs and exemplifying SDG mainstreaming approaches essential for sustainable development.
3. Materials and Methods
3.1. Study Area
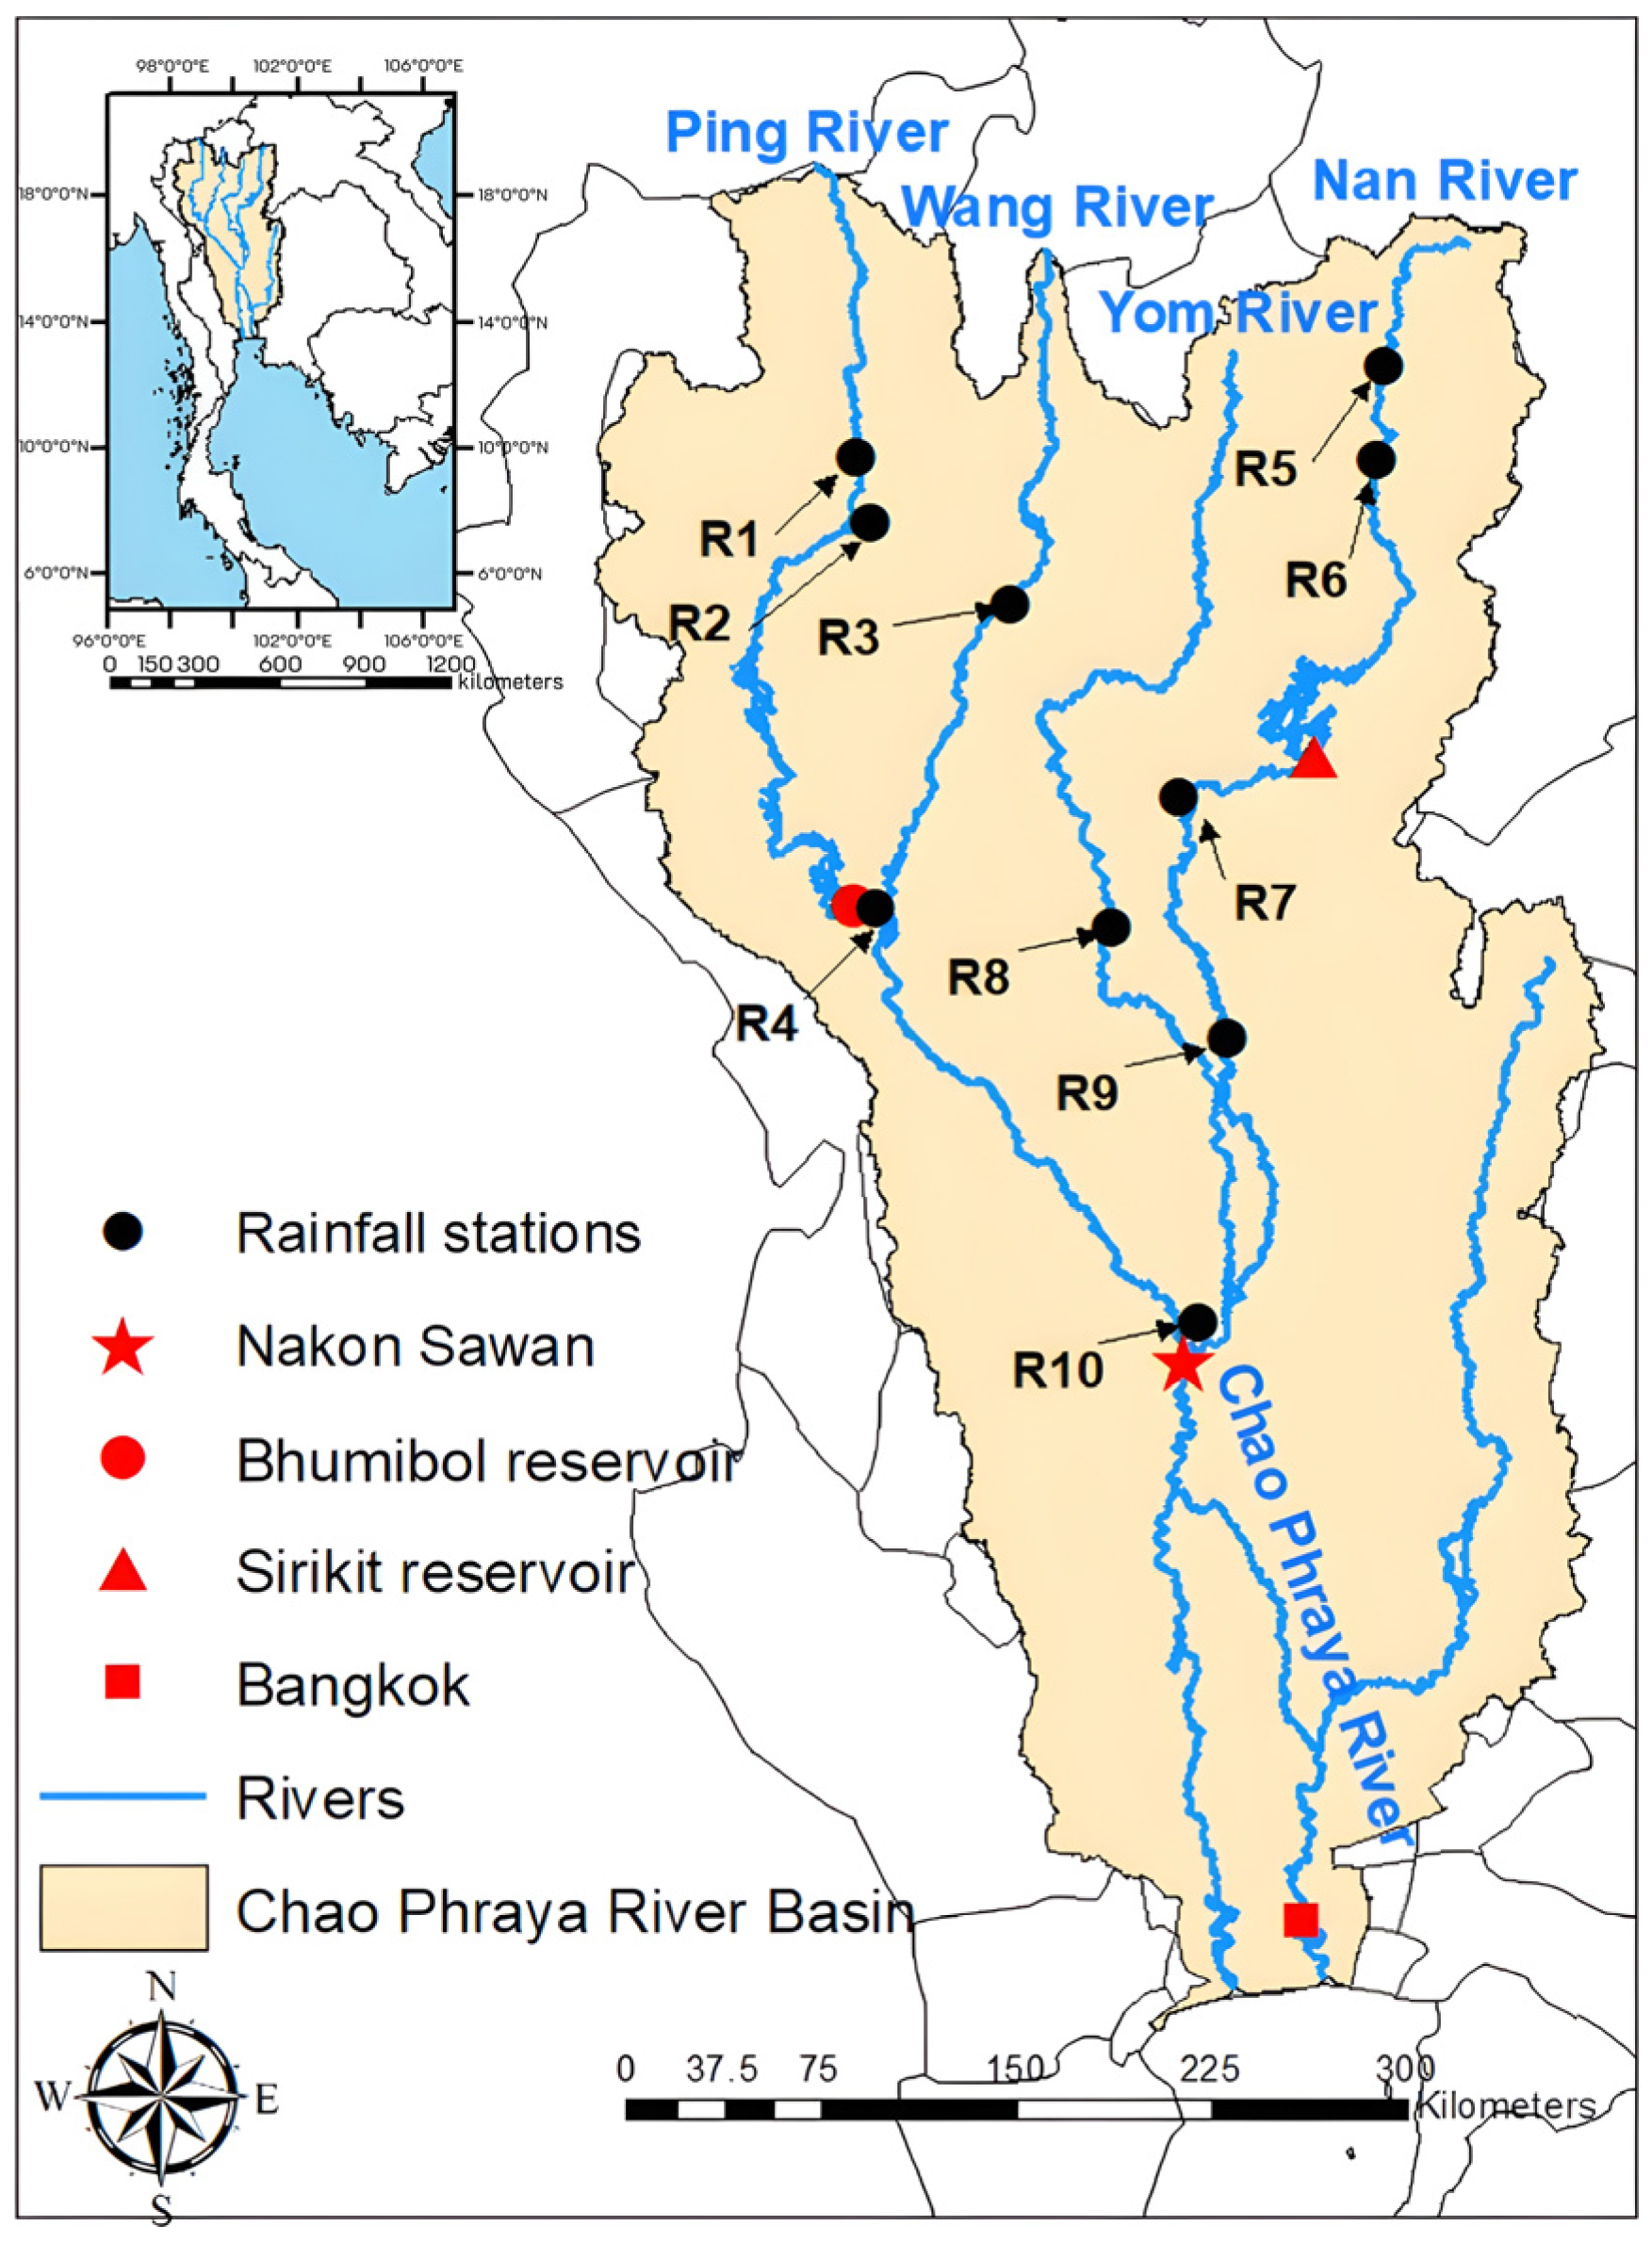
The CPRB (
Figure 1) is the largest river basin in Thailand and a key contributor to the 2011 Thailand Great Flood, the most severe inundation event in the nation’s history. The basin covers approximately 159,000 square kilometers, representing around 35% of Thailand’s total landmass, and supports nearly 30 million people. The region is primarily agricultural, with rice, sugarcane, and maize as the dominant crops. Geographically, it is located between 13.5° N–19° N latitude and 98° E–101° E longitude. Four major tributaries—the Ping, Wang, Yom, and Nan rivers—originate in the northern highlands and converge at the C2 to form the CPRB. The river then flows southward through major economic and industrial zones, including Ayutthaya and Bangkok, before discharging into the Gulf of Thailand.
3.2. Methodological Framework
The CPRB is shaped by a tropical monsoon climate, with heavy rainfall from May to October due to the southwest monsoon, which accounts for nearly 90% of annual precipitation. Low-lying southern areas, at elevations around 2.5 m above sea level, are highly susceptible to flooding, as observed during the 2011 Great Flood. In contrast, the dry season (January to June) brings significantly reduced rainfall, necessitating managed water releases from major reservoirs such as BB and SK to support agricultural, municipal, and industrial needs. These pronounced seasonal variations present ongoing challenges for flood management and equitable water distribution within the basin.
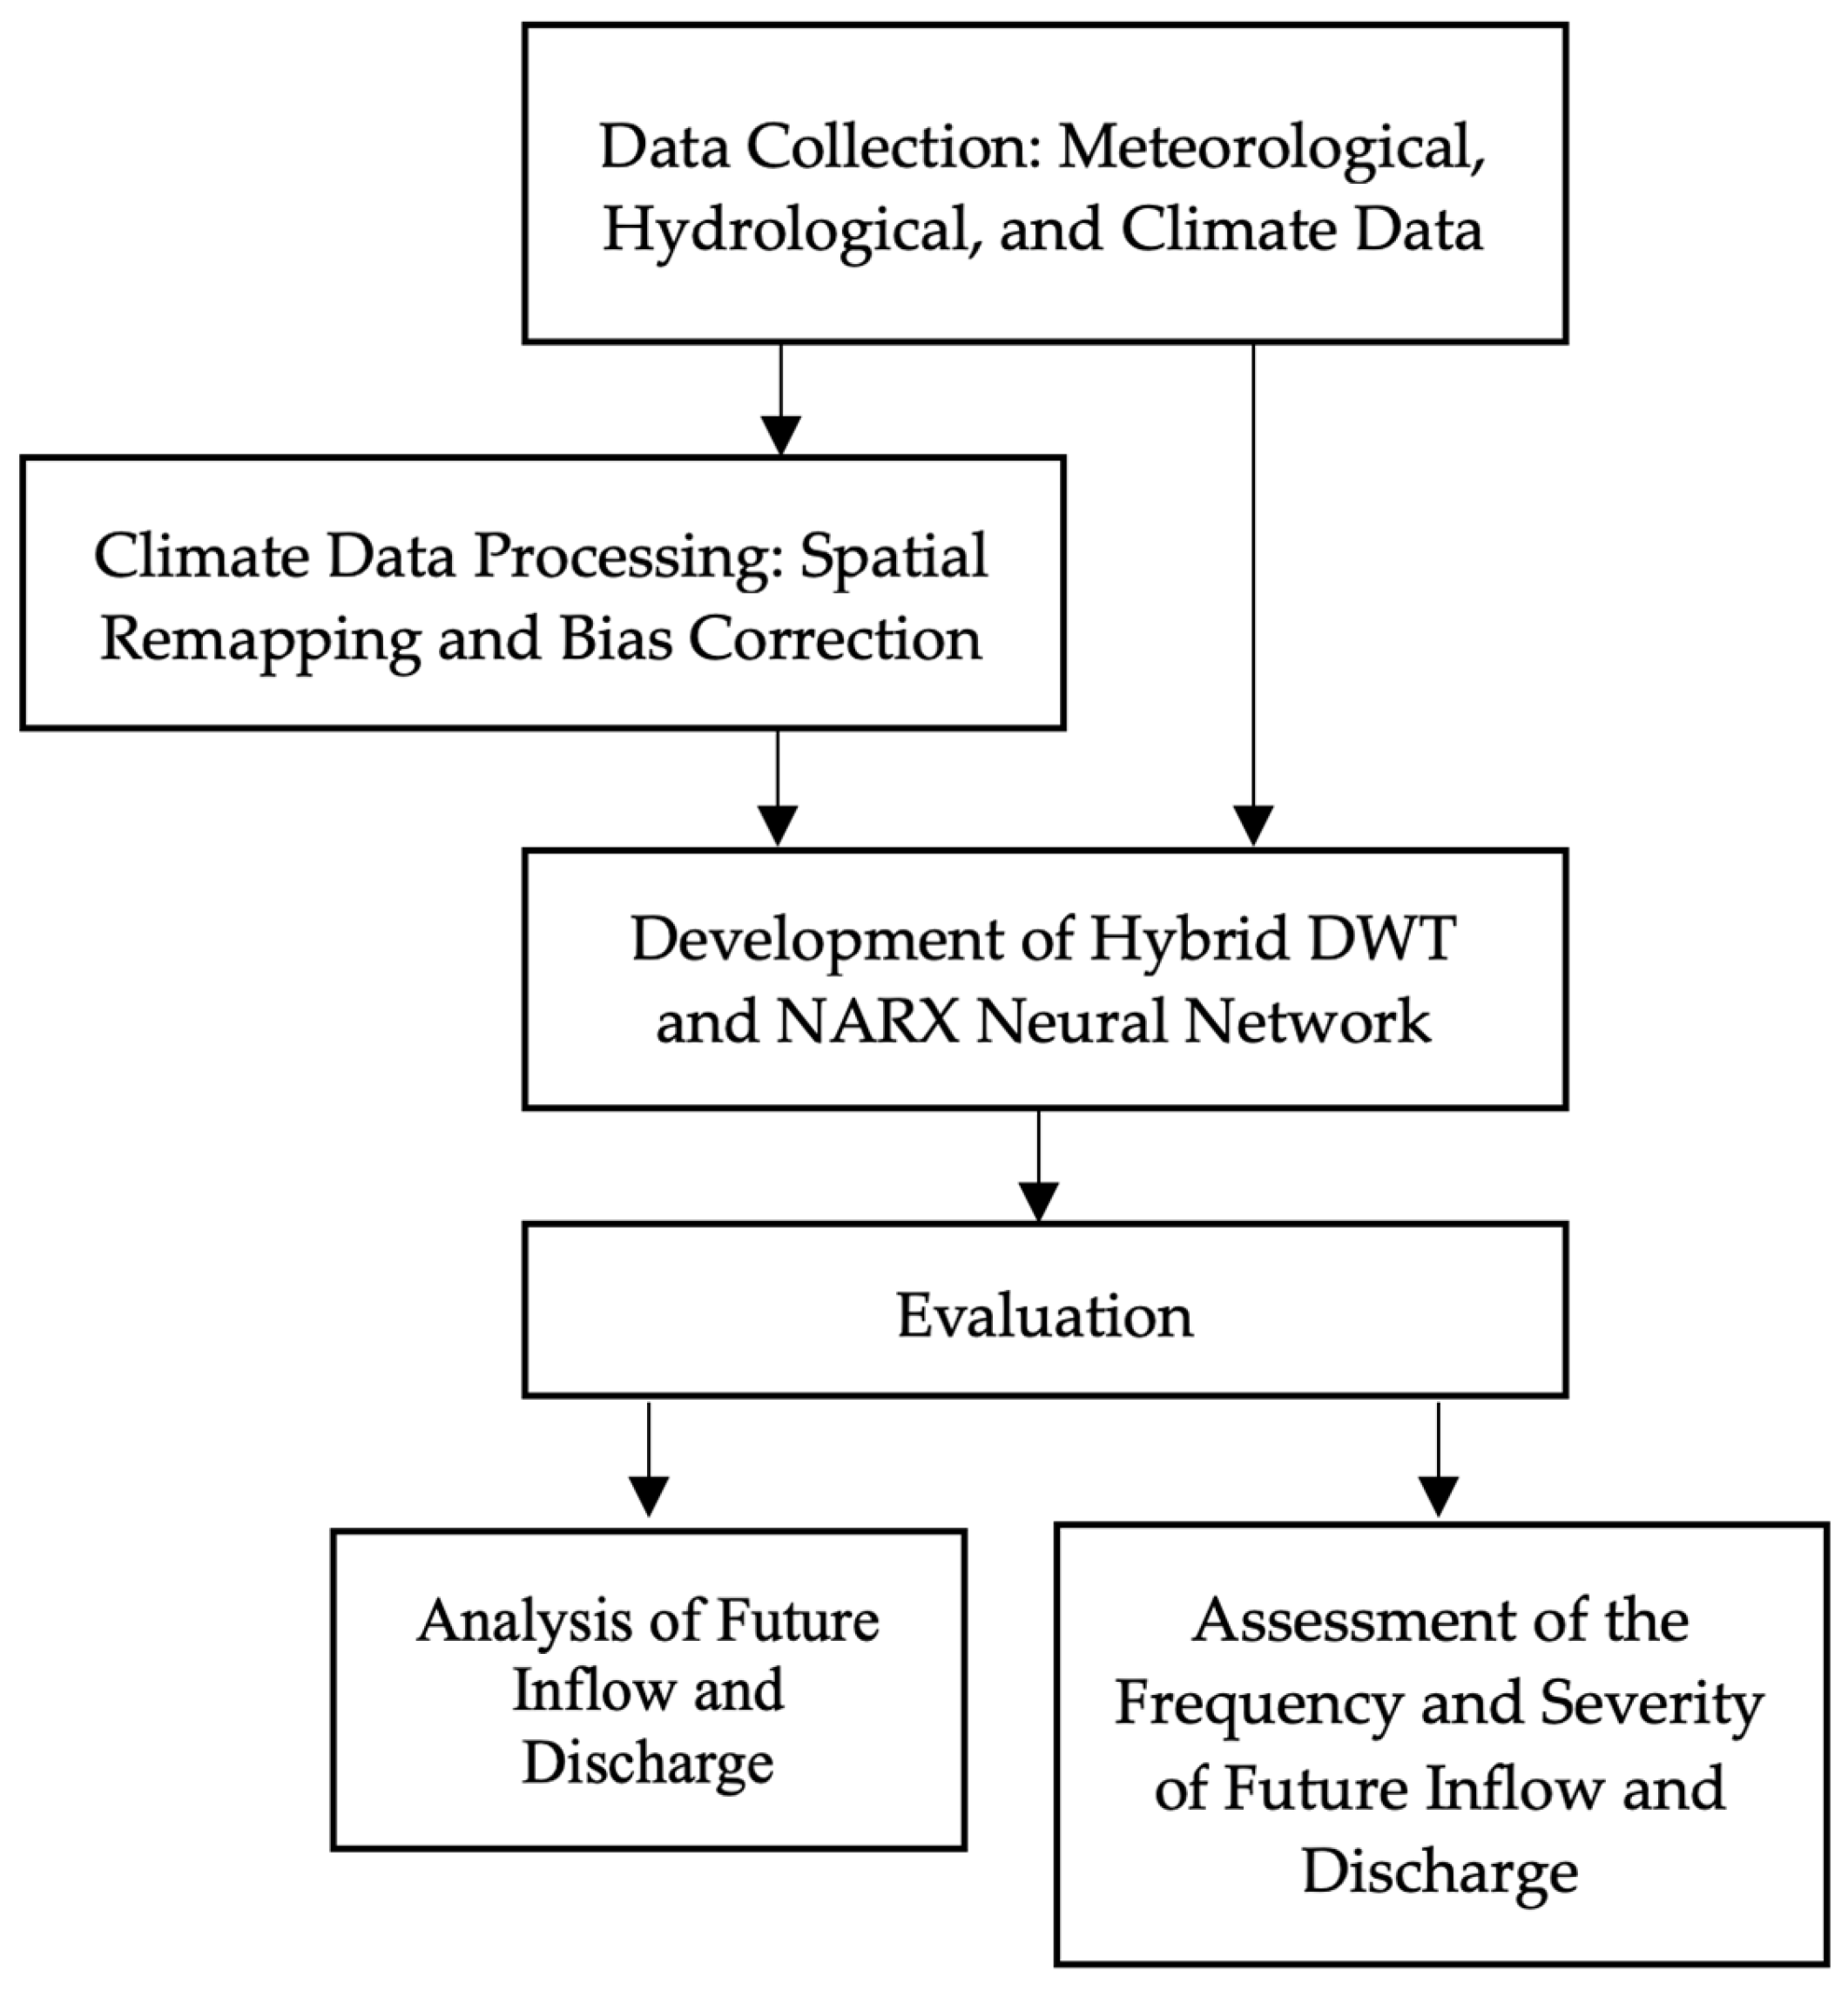
To address these issues, this study develops an advanced forecasting framework for reservoir inflow and discharge management in the CPRB. The approach incorporates climate projections refined by spatial remapping and bias correction to improve local applicability. DWT is used for extracting essential features from time-series data, and a NARX is applied for hydrological forecasting. The framework, summarized in
Figure 2, begins with the collection of meteorological, hydrological, and climate data across the basin. Next, climate data undergo spatial remapping and bias correction to ensure the accuracy and local relevance of the Global Climate Model (GCM) projections. The refined data are then used to develop a hybrid forecasting model that integrates DWT for feature extraction with a Nonlinear Autoregressive Neural Network with Exogenous Inputs (NARX) for predictive modeling.
Once the model is built and trained, its performance is evaluated using appropriate validation metrics. The evaluated model is subsequently applied to project future reservoir inflows and discharge under various climate scenarios. Finally, the results are analyzed to assess patterns in future inflow and discharge, including the frequency and severity of hydrological extremes, to support adaptive water management and flood risk reduction in the basin.
3.3. Data Collection
Understanding the hydrological and meteorological dynamics of the CPRB is essential for improving the prediction of reservoir inflow and discharge, particularly in light of the 2011 flood. This section outlines the datasets and procedures used to develop and validate the forecasting model, which predicts inflows to the BB and SK reservoirs and discharge at the C2 gauging station. Three primary categories of data are used: meteorological, hydrological, and climate model datasets.
3.3.1. Meteorological Data
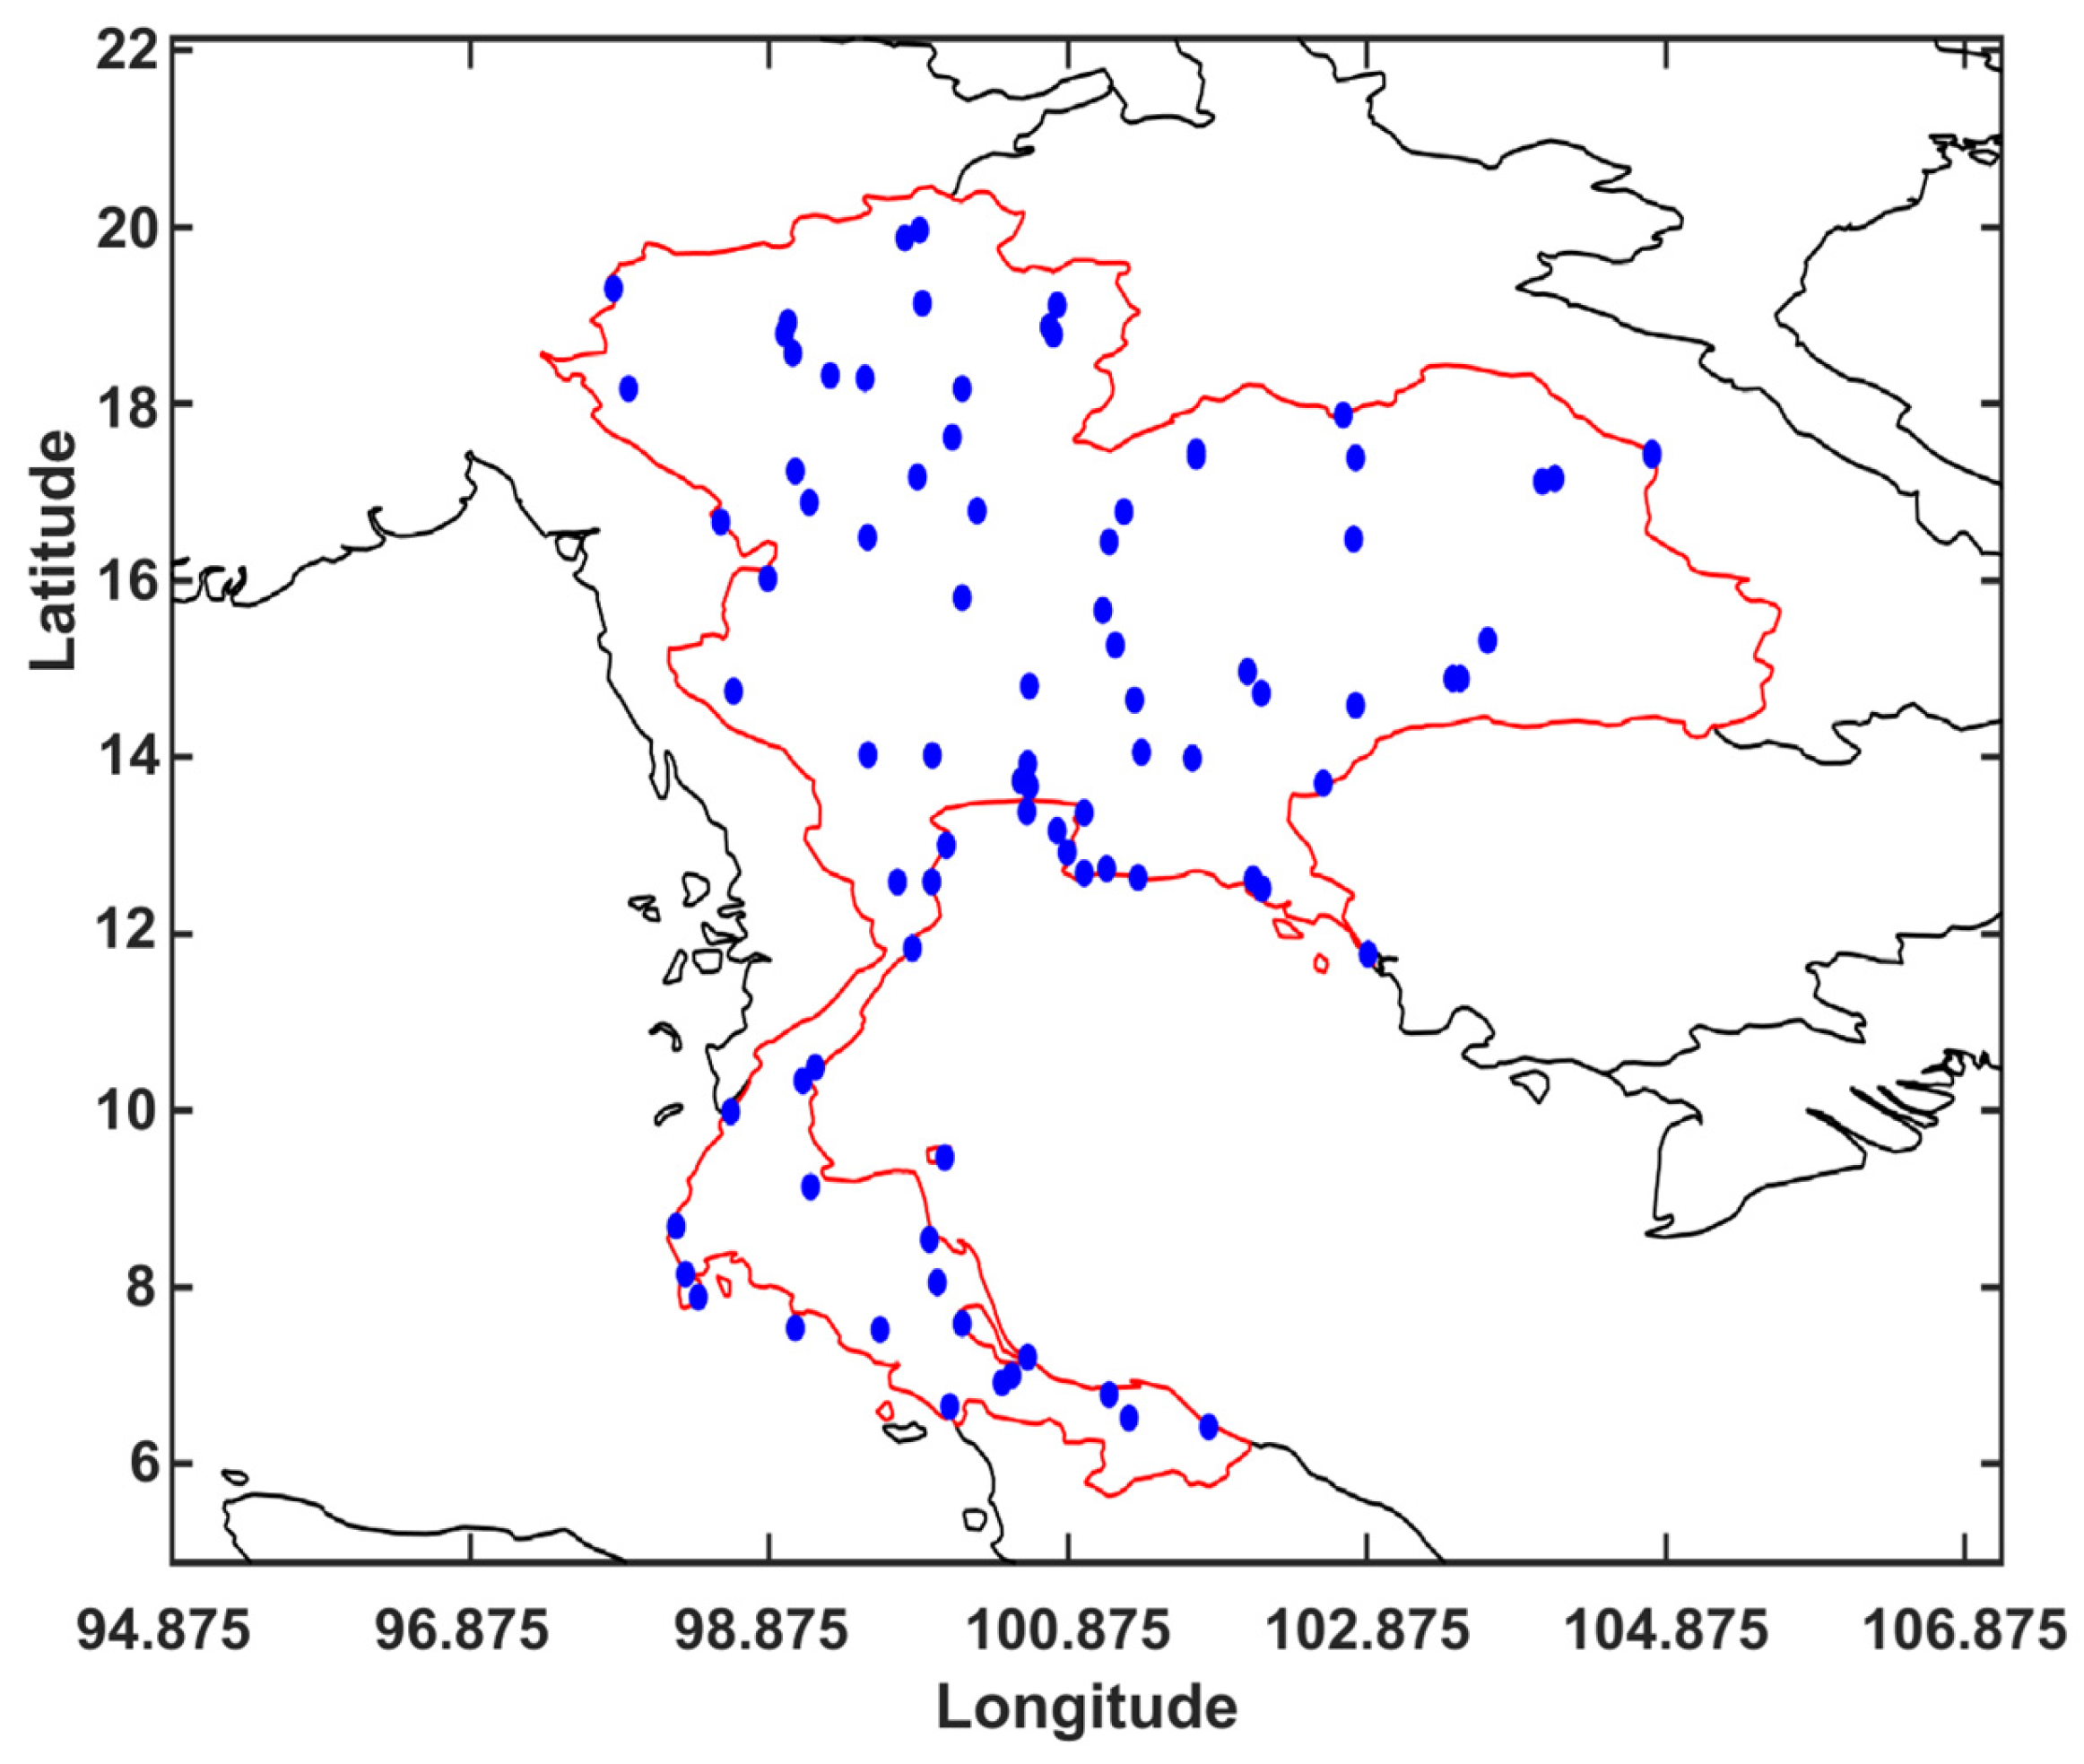
Daily rainfall data from 88 meteorological stations distributed across Thailand were used, covering the period from 1980 to 2005. These data were obtained from the Thai Meteorological Department (TMD), which maintains an extensive observation network representing the country’s diverse climatic regions.
Figure 3 shows the spatial distribution of these rainfall stations. The availability of continuous, multi-decadal precipitation records enables the analysis of long-term rainfall patterns and provides reliable input for hydrological model calibration. The extended observation period enhances model robustness and supports the accurate prediction of extreme rainfall events, such as those that contributed to the 2011 Great Flood.
3.3.2. Hydrological Data
Hydrological data, including reservoir inflows and river discharge measurements, were collected to evaluate and forecast water availability and flood potential in the CPRB. The Electricity Generating Authority of Thailand (EGAT) provided monthly inflow records for the BB and SK reservoirs, which are Thailand’s largest and most critical water storage systems. The Royal Irrigation Department (RID) supplied monthly discharge data for the C2 for the same 1980–2005 period. The C2 station, located at the confluence of the Ping, Wang, Yom, and Nan rivers, serves as a key hydrological gauge for assessing downstream flood conditions.
Figure 4 illustrates monthly inflow fluctuations for the BB and SK reservoirs and corresponding discharge at the C2 station. These datasets are vital for calibrating and validating hydrological models and support the development of improved early warning systems. The historical analysis of these inflow and discharge records also provides insight into the factors that contributed to the 2011 flood, where excessive reservoir releases and inadequate discharge management amplified downstream inundation.
3.3.3. Climate Data
Future climate projections were derived from Global Climate Models (GCMs) under the Coupled Model Intercomparison Project Phase 5 (CMIP5) framework. Nineteen GCMs were selected using precipitation data from the NASA Earth Exchange Global Daily Downscaled Projections (NEX-GDDP) dataset. These models provide high-resolution, bias-corrected daily climate data suitable for assessing hydrological variability under different climate scenarios.
Table 1 lists the CMIP5 models utilized in this study.
Two Representative Concentration Pathways (RCPs) were used: RCP4.5, representing a moderate emission scenario (radiative forcing of 4.5 W/m2), and RCP8.5, representing a high-emission scenario (8.5 W/m2). These scenarios facilitate a comparative analysis of potential hydrological changes under different greenhouse gas trajectories. Combining climate model projections with historical hydrological and meteorological observations strengthens the capacity to forecast future inflow and discharge variability. This integration supports improved flood preparedness, sustainable water allocation, and adaptive resource management across the CPRB.
3.4. Climate Data Processing
Accurate precipitation inputs are essential for hydrological modeling in the CPRB, where intense rainfall can trigger major flooding. To improve the usability of climate model outputs for basin-scale applications, we applied two complementary procedures: remapping to increase spatial resolution and bias correction to align simulations with observed station data. These steps enhance precipitation estimates that drive forecasts of inflows to BB and SK reservoirs and discharge at the C2.
3.4.1. Spatial Remapping
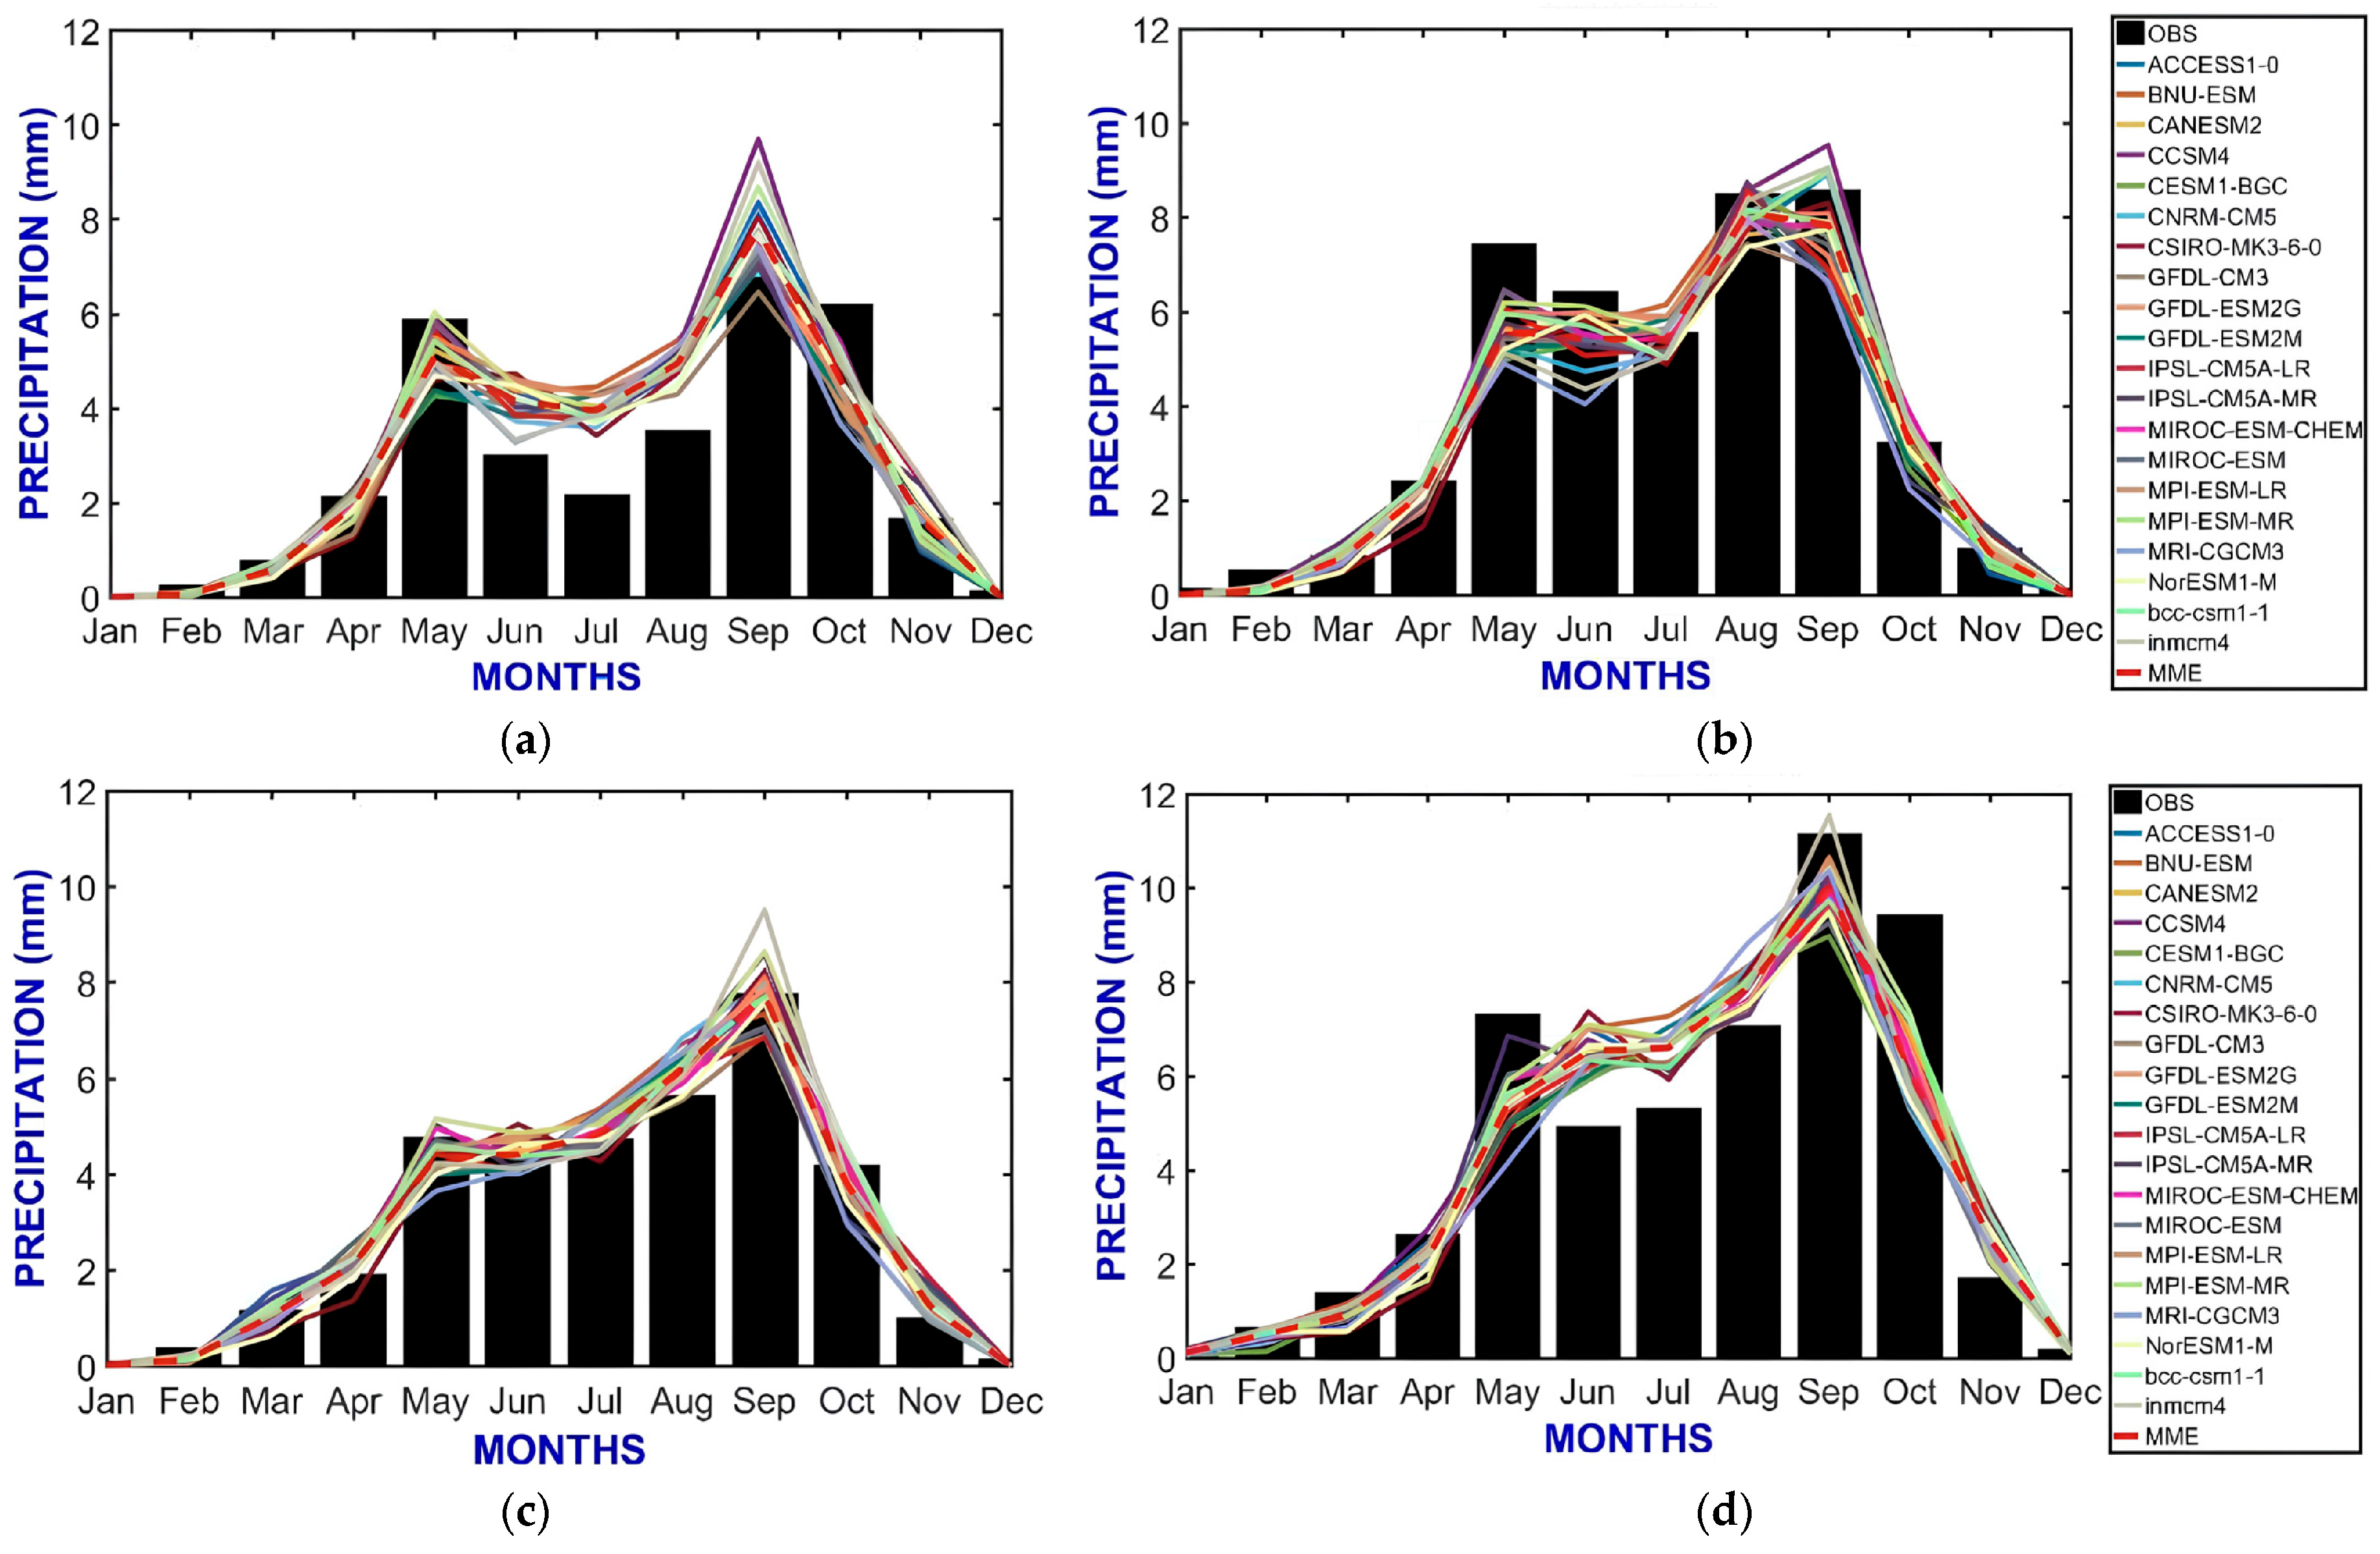
Global Climate Models (GCMs) in CMIP5 operate at coarse resolutions that are not directly suitable for regional hydrology. We remapped daily precipitation from 19 CMIP5 models to a 0.25° grid using bilinear interpolation, yielding a domain of 1440 longitude by 556 latitude points. This resolution better captures spatial gradients in rainfall that influence reservoir inflows and river discharge. To assess consistency with observations, the remapped series were compared against historical station records throughout the CPRB.
Figure 5 summarizes average monthly precipitation for the baseline period 1980–2005 at key locations, highlighting inter-model spread and the performance of the MME relative to observations.
3.4.2. Bias Correction
While CMIP5 models reproduce seasonal variability, systematic biases in magnitude remain and require correction. We applied the Linear Scaling (LS) method which rescales model precipitation by month using ratios between observed and simulated climatologies. Let
denote precipitation,
the daily time index, and
the month. The bias-adjusted historical and future series are computed as
where
is observed station rainfall,
is historical model output,
is the future projection, and
is the monthly mean operator used to derive the scaling factor. The LS adjustment was applied to the historical period 1980–2005 and to future projections for 2010–2100 under RCP4.5 and RCP8.5. Aligning model climatology with observations improves the fidelity of precipitation inputs for hydrological simulation and forecasting.
The spatial remapped and bias-corrected precipitation fields are then used to drive the hybrid modeling system, supporting more reliable forecasts of BB and SK inflows and C2 discharge. Incorporating these refined climate inputs into the hydrological workflow strengthens flood preparedness, risk assessment, and sustainable water resource planning in the CPRB.
3.5. Development of Hybrid DWT–NARX Neural Network
3.5.1. NARX Neural Network for Hydrological Forecasting
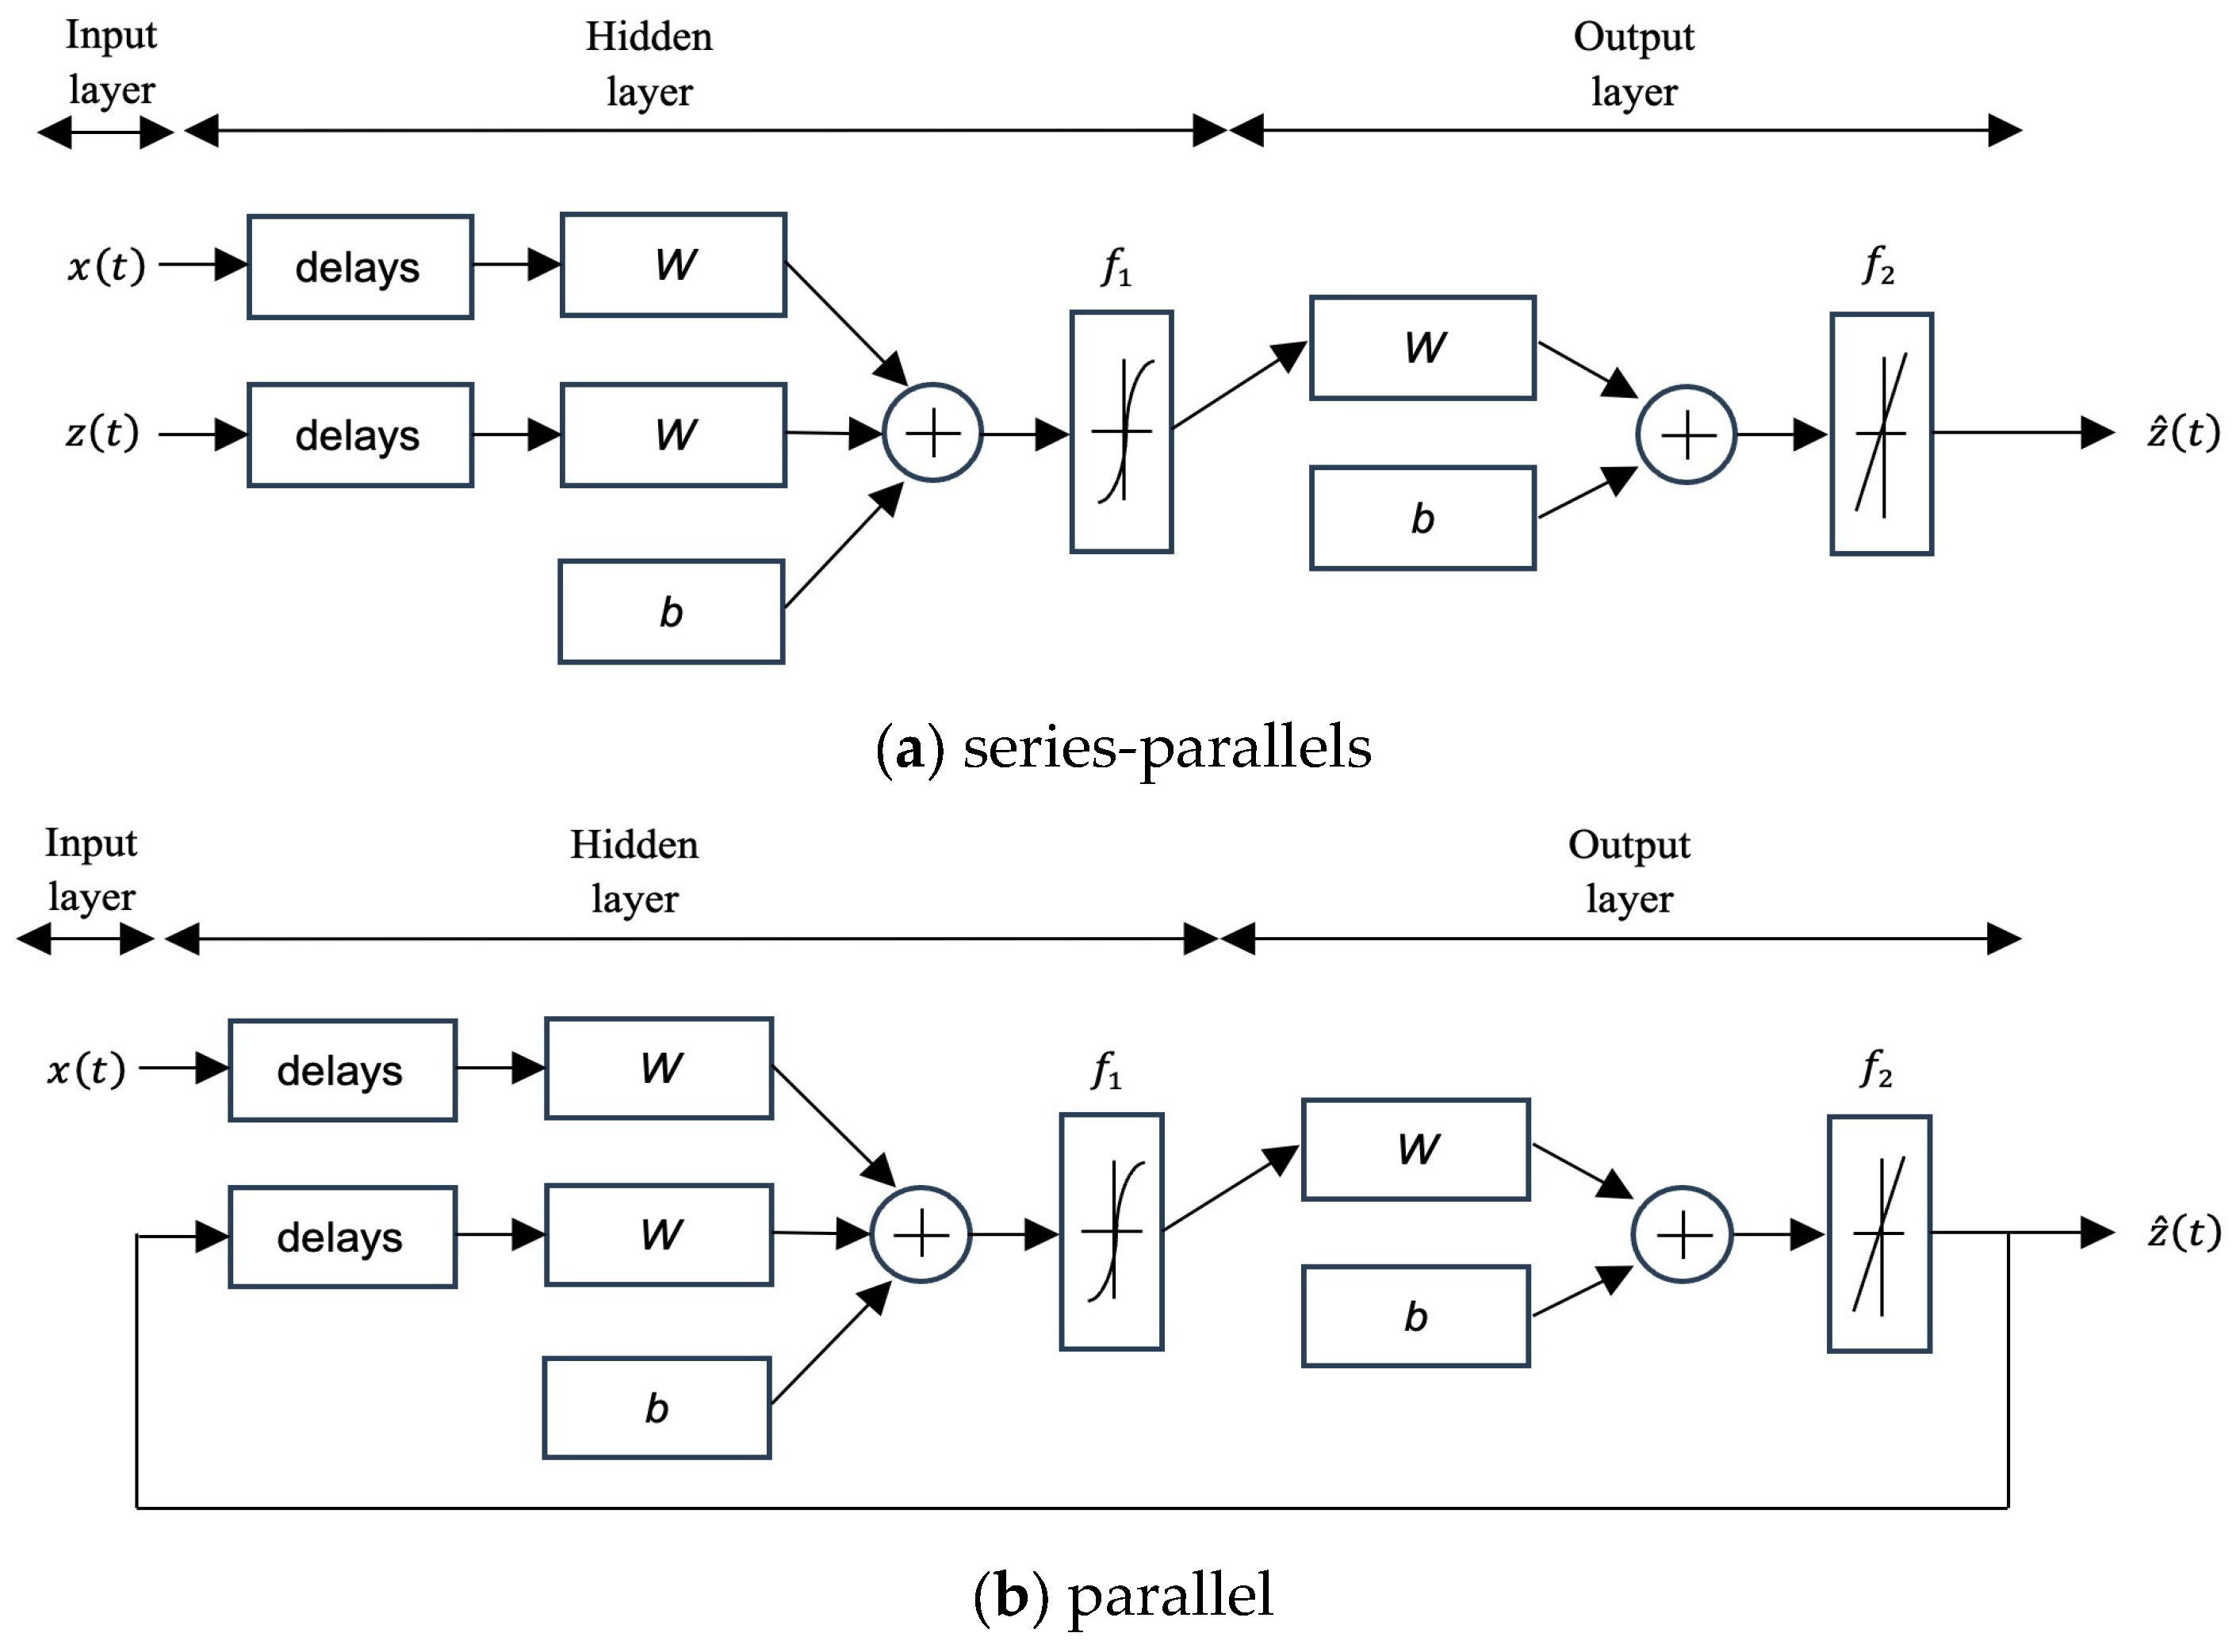
A primary challenge in hydrological forecasting is capturing nonlinear interactions among precipitation, reservoir inflow, and river discharge. We employ a NARX, which uses both historical outputs and external drivers such as precipitation. In this study, NARX is used to forecast inflows to the BB and SK reservoirs and discharge at the C2, supporting flood preparedness and water resource management in the CPRB. The two architectural variants are shown in
Figure 6a (series-parallel) and
Figure 6b (parallel).
The NARX model predicts the output
at time
lagged outputs and lagged exogenous inputs as in Equation (3) for series-parallel and Equation (4) for parallel inference.
Here,
denotes the MME precipitation at rainfall station
,
and
are the input and output lags, and
is a nonlinear mapping learned by a neural network. In series–parallel mode, actual outputs are used during training and testing. In parallel mode, actual outputs are used during training and predicted outputs are fed back during inference, which enables multi-step forecasting over future horizons, as depicted in
Figure 6b.
A hidden layer neuron
at time
is computed as:
where
is the number of rainfall stations,
the number of input delays,
the number of output delays,
and
are trainable weights,
is a bias term, and
is a nonlinear activation function. The role of rainfall stations and delays corresponds to the connections illustrated in
Figure 6.
3.5.2. DWT Method
The DWT provides multiresolution time–frequency analysis suited to non-stationary hydrological signals [
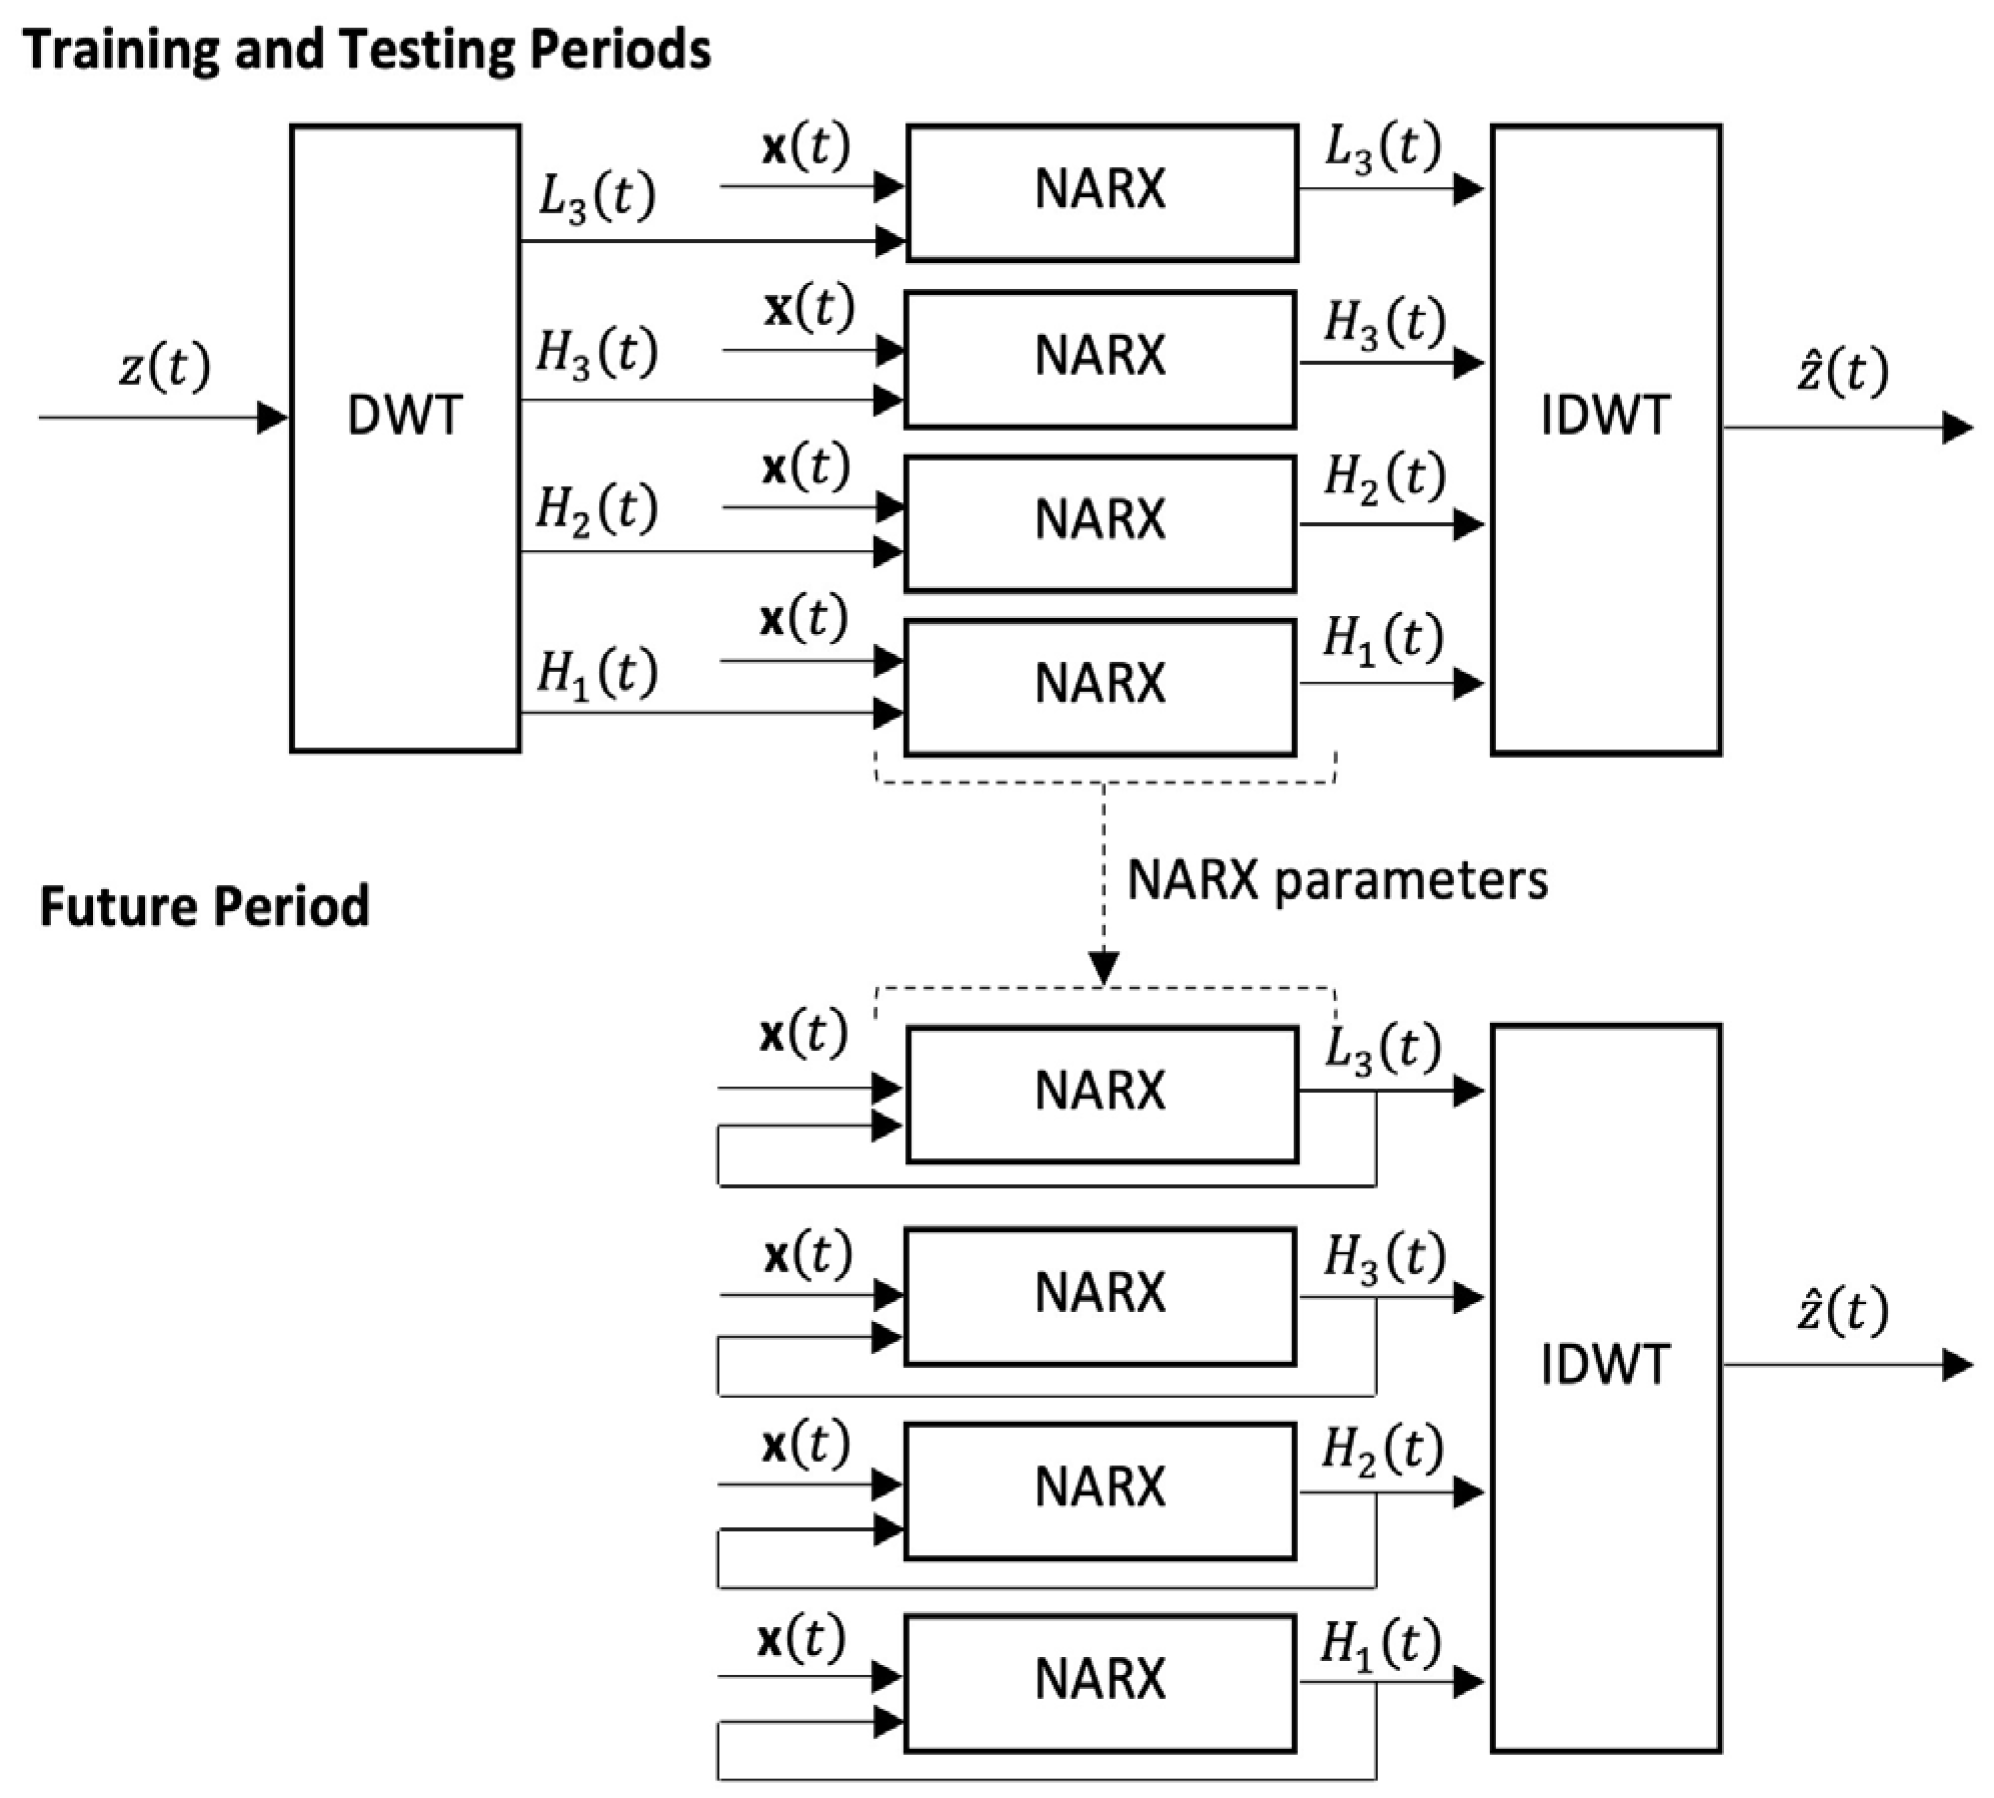
40]. DWT decomposes an input time series into an approximation (low-frequency) and multiple detail (high-frequency) components. The three-level decomposition used in this study is illustrated in
Figure 7, where the original signal
is split into
,
,
, and
. Equations (6)–(8) define the level-3 approximation, level-
details, and reconstruction, respectively. The component labels in Equations (4)–(6) match the blocks shown in
Figure 7.
For a three-level decomposition of a time series
, the approximation at level 3 and the details at levels
are:
The original signal can be reconstructed by the inverse DWT:
3.5.3. Hybrid DWT–NARX Neural Network
We integrate DWT with NARX to improve forecasting performance. Monthly MME precipitation remapped to nearby rainfall stations serves as the exogenous input vector
under RCP4.5 and RCP8.5. Station metadata are summarized in
Table 2, and the input-to-target mapping is provided in
Table 3. The overall workflow, including component-wise modeling and reconstruction, is depicted in
Figure 8.
Training and Testing Periods
The initial reservoir inflow and discharge series are decomposed into
,
,
, and
as in
Figure 7. Each component, together with exogenous inputs
, is modeled by a dedicated NARX in series–parallel mode for training and testing. The training period is 1985–2005, and the hold-out testing period is 1980–1984 with unseen data. After component-wise forecasts are obtained, the inverse DWT reconstructs the final inflow and discharge predictions. Trained parameters are retained for future projections.
Future Projections
For 2010–2099, the parallel NARX architecture is used. Forecasting is initialized with actual values at the start of the future period. Thereafter, predicted outputs are recursively fed back as inputs to generate multi-step forecasts, using bias-corrected, remapped precipitation under RCP4.5 and RCP8.5.
3.6. Evaluation
We compare DWT-NARX against baseline NARX, LSTM, RNN, and BNN for BB and SK inflows and C2 discharge. To address comparative structural design and computational complexity, each model is described below.
Long Short-Term Memory (LSTM) employs memory cells with forget, input, and output gates to capture long-term dependencies in time-series data. The computational complexity per time step is O(W), where W is the total number of network parameters. For our implementation, LSTM processes the raw hydrological time series without prior feature decomposition, requiring the network to learn both feature extraction and temporal dynamics simultaneously.
Vanilla Recurrent Neural Network (RNN) uses simple recurrent connections with a single hidden state. Its computational complexity per time step is similar to LSTM at O(W), but without the gating mechanisms that help mitigate vanishing gradients. Vanilla RNNs are prone to vanishing gradients over long sequences, which is particularly problematic for monthly hydrological data spanning multiple seasonal cycles.
Backpropagation Neural Network (BNN) is a feedforward multilayer perceptron that lacks recurrent connections. BNN requires explicit feature engineering to capture temporal relationships, as it has no inherent temporal modeling capability.
DWT-NARX hybrid model combines discrete wavelet decomposition with NARX neural networks. The DWT preprocessing exhibits O(n) linear computational complexity using fast wavelet transform algorithms, performed once to generate 4 frequency-separated components. Each component is then processed by an independent NARX network. This architectural design separates signal preprocessing from temporal modeling, where each NARX network operates on reduced-complexity, frequency-specific signals rather than full-resolution sequences. The decomposition enables efficient parallel processing and reduces the learning burden on individual networks by isolating distinct temporal patterns (seasonal trends, inter-annual variability, and high-frequency noise) into separate wavelet components.
We compare DWT–NARX against baseline NARX, LSTM, and Vanilla RNN for BB and SK inflows and C2 discharge. Root Mean Squared Error (RMSE) and Pearson correlation coefficient (
) are defined in Equations (9) and (10).
where
are the observed inflow or discharge values,
are the corresponding forecast values,
and
are their respective sample means, and
is the number of paired observations.
To analyze frequency and magnitude, we fit Gamma probability density functions to inflow and discharge, as defined in Equation (11).
Here, (q) denotes the shape parameter and (s) the scale parameter. Hydrological time series such as reservoir inflow and precipitation are commonly modeled with a Gamma probability density function [
45,
46].
4. Results
All experiments were conducted using the historical baseline period from 1980 to 2005, which was divided into 240 training data points (80%) and 60 testing data points (20%) for forecasting the inflow of the BB and SK reservoirs and the discharge at the C2 station. The parameters of the DWT-NARX model were determined through multiple experimental runs. A comprehensive search for the optimal parameters was performed by varying the time delay between 2 and 4 and adjusting the number of neurons from 1 to 10. The selection of wavelet parameters was based on commonly used wavelet functions, including Coiflet (coif1, coif2, coif3, coif4, coif5), Daubechies (db1, db2, db3, db4, db5, db6, db7, db8, db9, db10), Discrete Meyer (dmey), Haar (haar), and Symlet (sym1, sym2, sym3, sym4, sym5, sym6, sym7, sym8, sym9, sym10), using one to five levels of scale decomposition. The parameters used in the DWT-NARX model for the historical baseline are summarized in
Table 4. The experimental results include the future inflow projection, future discharge projection, and assessment of frequency and severity.
4.1. Future Inflow Projection
The DWT-NARX model exhibits the highest performance in terms of RMSE and CC during both the training and testing periods, as indicated in
Table 4. This represents a significant improvement over other methods, including NARX, LSTM, RNN, and BNN. In addition,
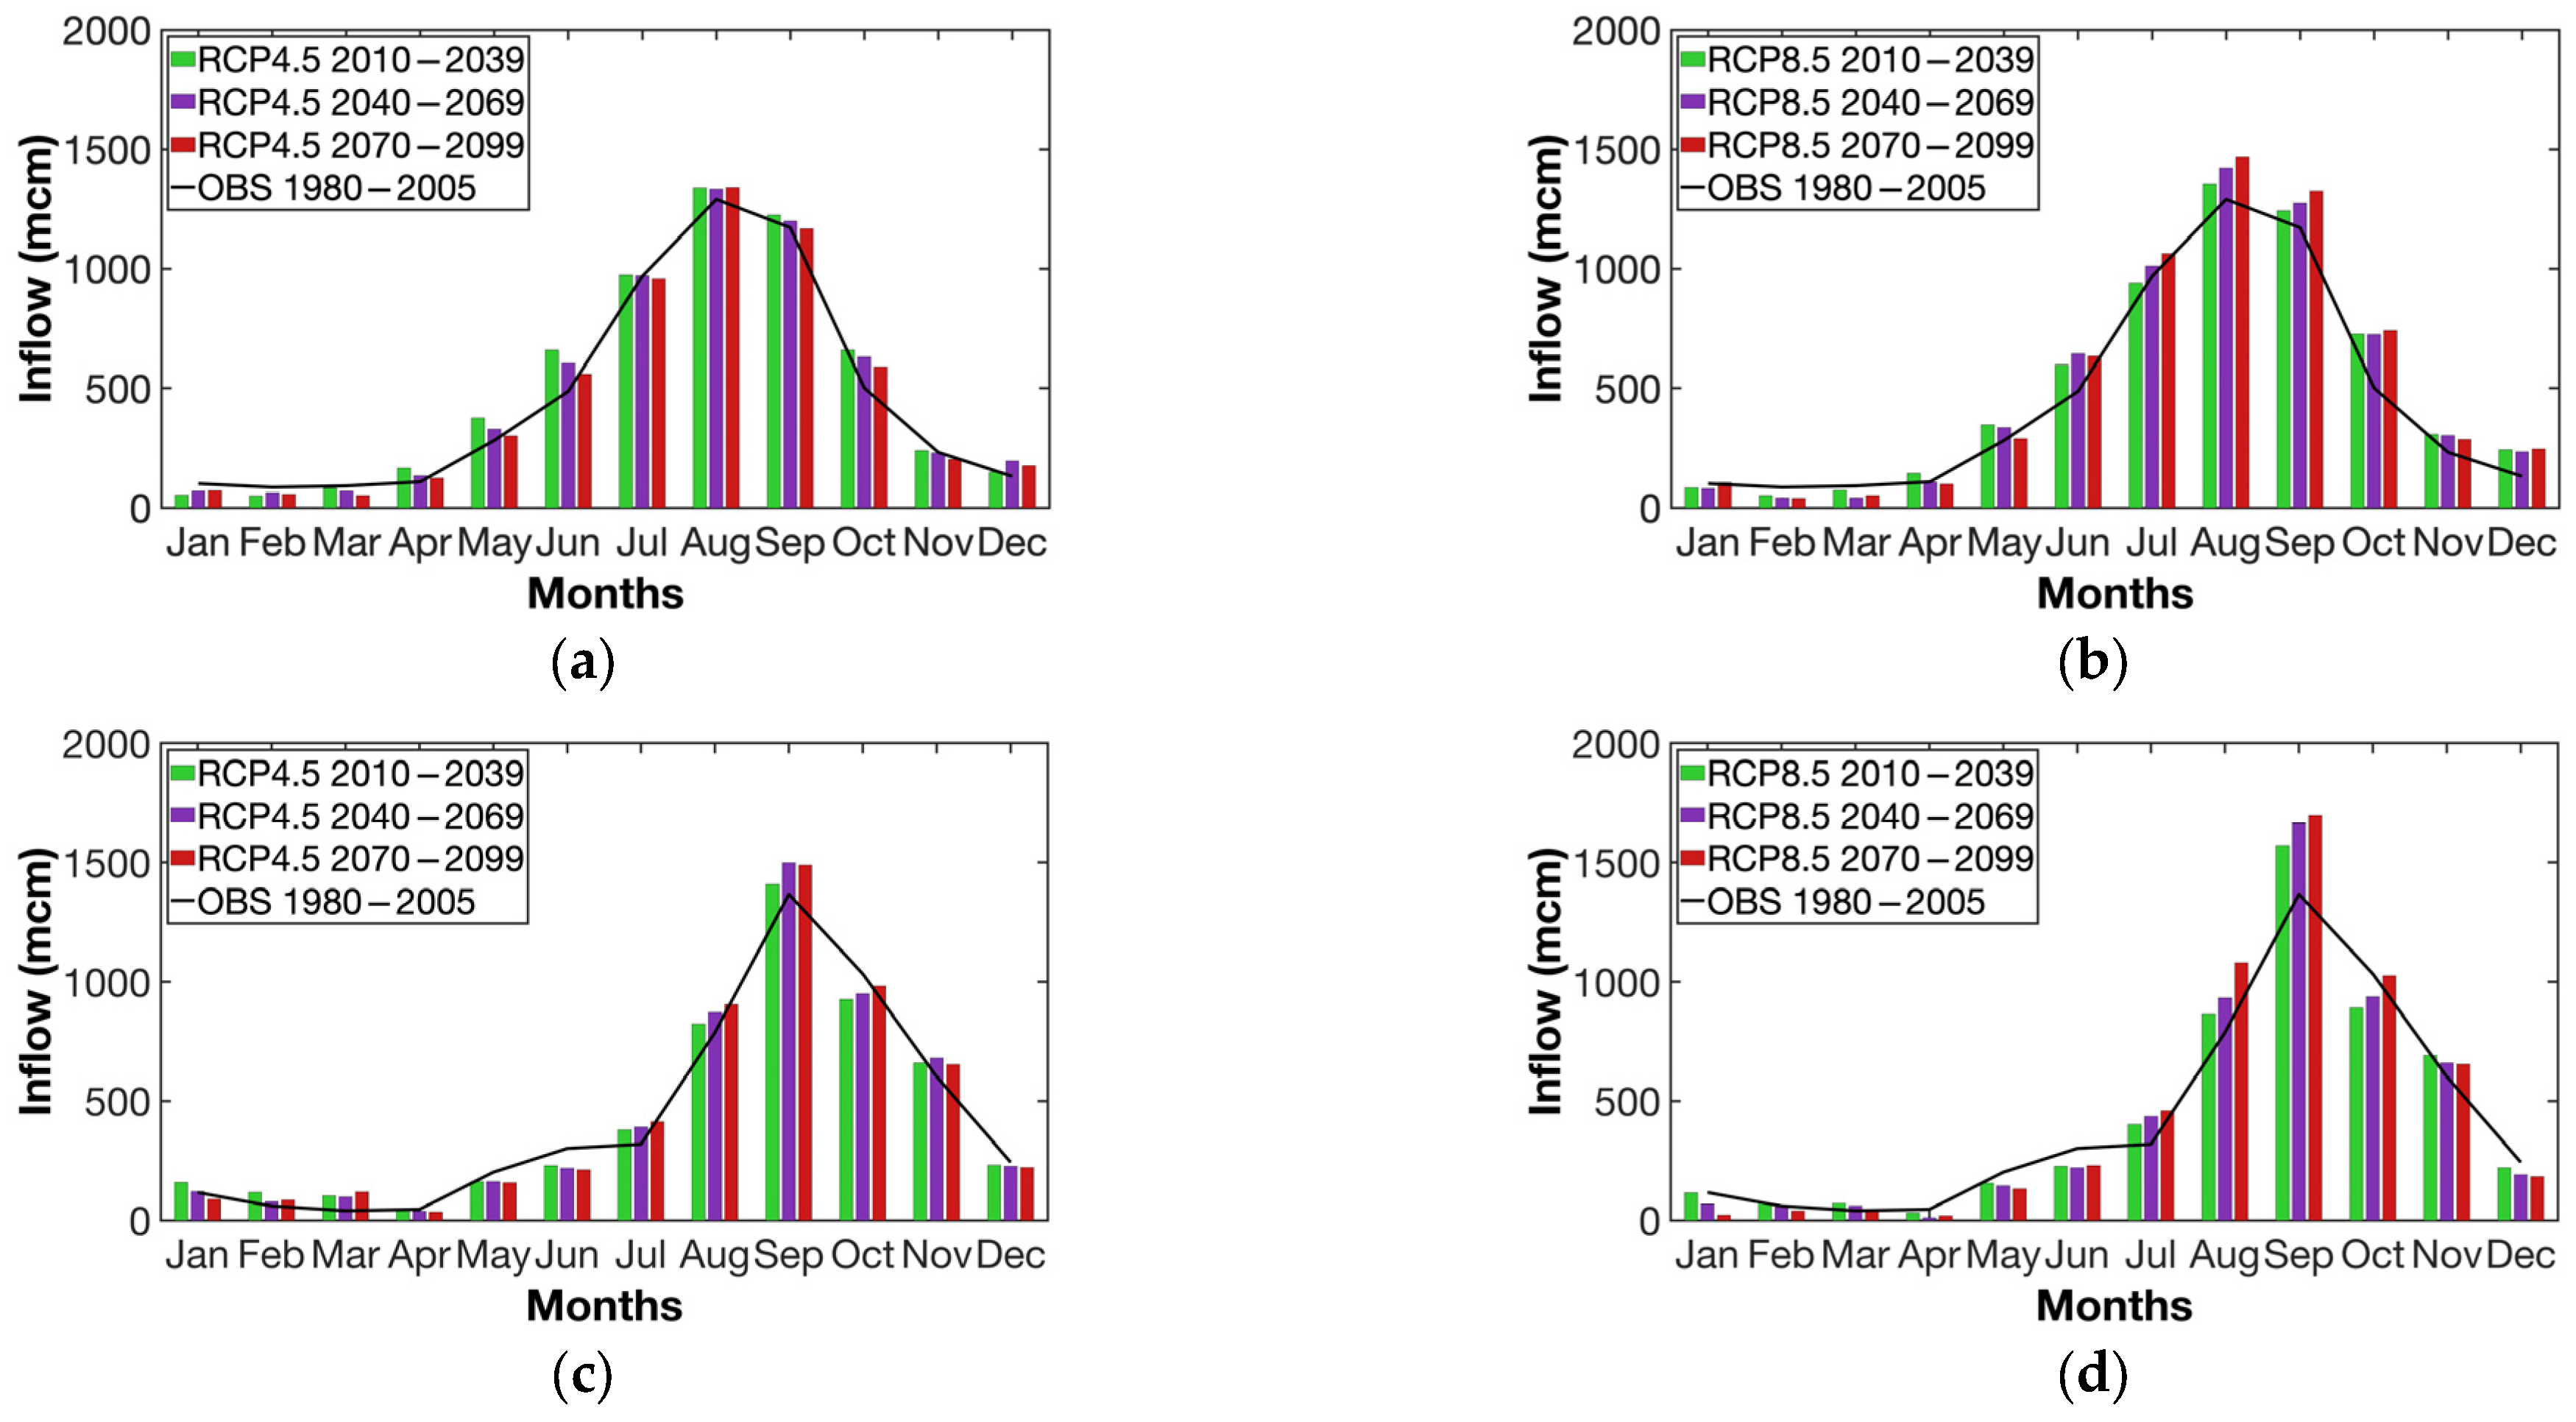
Table 5 presents the performance evaluation of the DWT-NARX model for forecasting reservoir inflow during the wet (May–October) and dry (February–April) seasons. The results indicate that the model performs better in the dry season than in the wet season for both study areas, reflecting lower data variability during the dry season, which allows the model to learn the underlying patterns more effectively. Moreover, the SK reservoir shows higher accuracy than the BB reservoir in both the training and testing periods. Notably, the lowest RMSE value (2.12) is observed during the dry season testing period, indicating a very low prediction error. Furthermore, all CC values are very high (>0.91), demonstrating a strong relationship between the model predictions and the observed data. The DWT-NARX model uses historical baseline data to forecast inflow for the future period from 2010 to 2099. In this study, we divided the future projections into three 30-year periods: the short-term future (2010–2039), the medium-term future (2040–2069), and the long-term future (2070–2099), for inflow projections under RCP4.5 and RCP8.5 of the CMIP5-based precipitation scenarios, as shown in
Figure 9.
Figure 9 presents the forecasted inflows for the BB and SK reservoirs for the short-term, medium-term, and long-term future periods, depicted in green, purple, and red bar graphs, respectively, with observed data shown by the black line. As shown in
Figure 9a,b, for the BB reservoir inflow forecasts, inflow tends to increase from June to October (the rainy season) across the short-, medium-, and long-term future periods. Conversely, during the dry period (November to April), there is a decreasing trend in inflow for these same future periods. Notably, in September of the long-term future period, inflow into the BB reservoir increases substantially under both RCP4.5 and RCP8.5, with percentage increases of 8.68% (613 mcm) and 24.03% (1697 mcm), respectively.
Figure 9c,d illustrate the inflow into the SK reservoir, showing that during the peak inflow month (August), there is an extreme 13.76% increase in average inflow in the long-term future period under the RCP8.5 scenario, reaching 1467 mcm compared to the historical baseline. On the other hand, during the dry season (February to April), the inflow into the SK reservoir is projected to decrease by 33.50%, equivalent to 31.42 mcm.
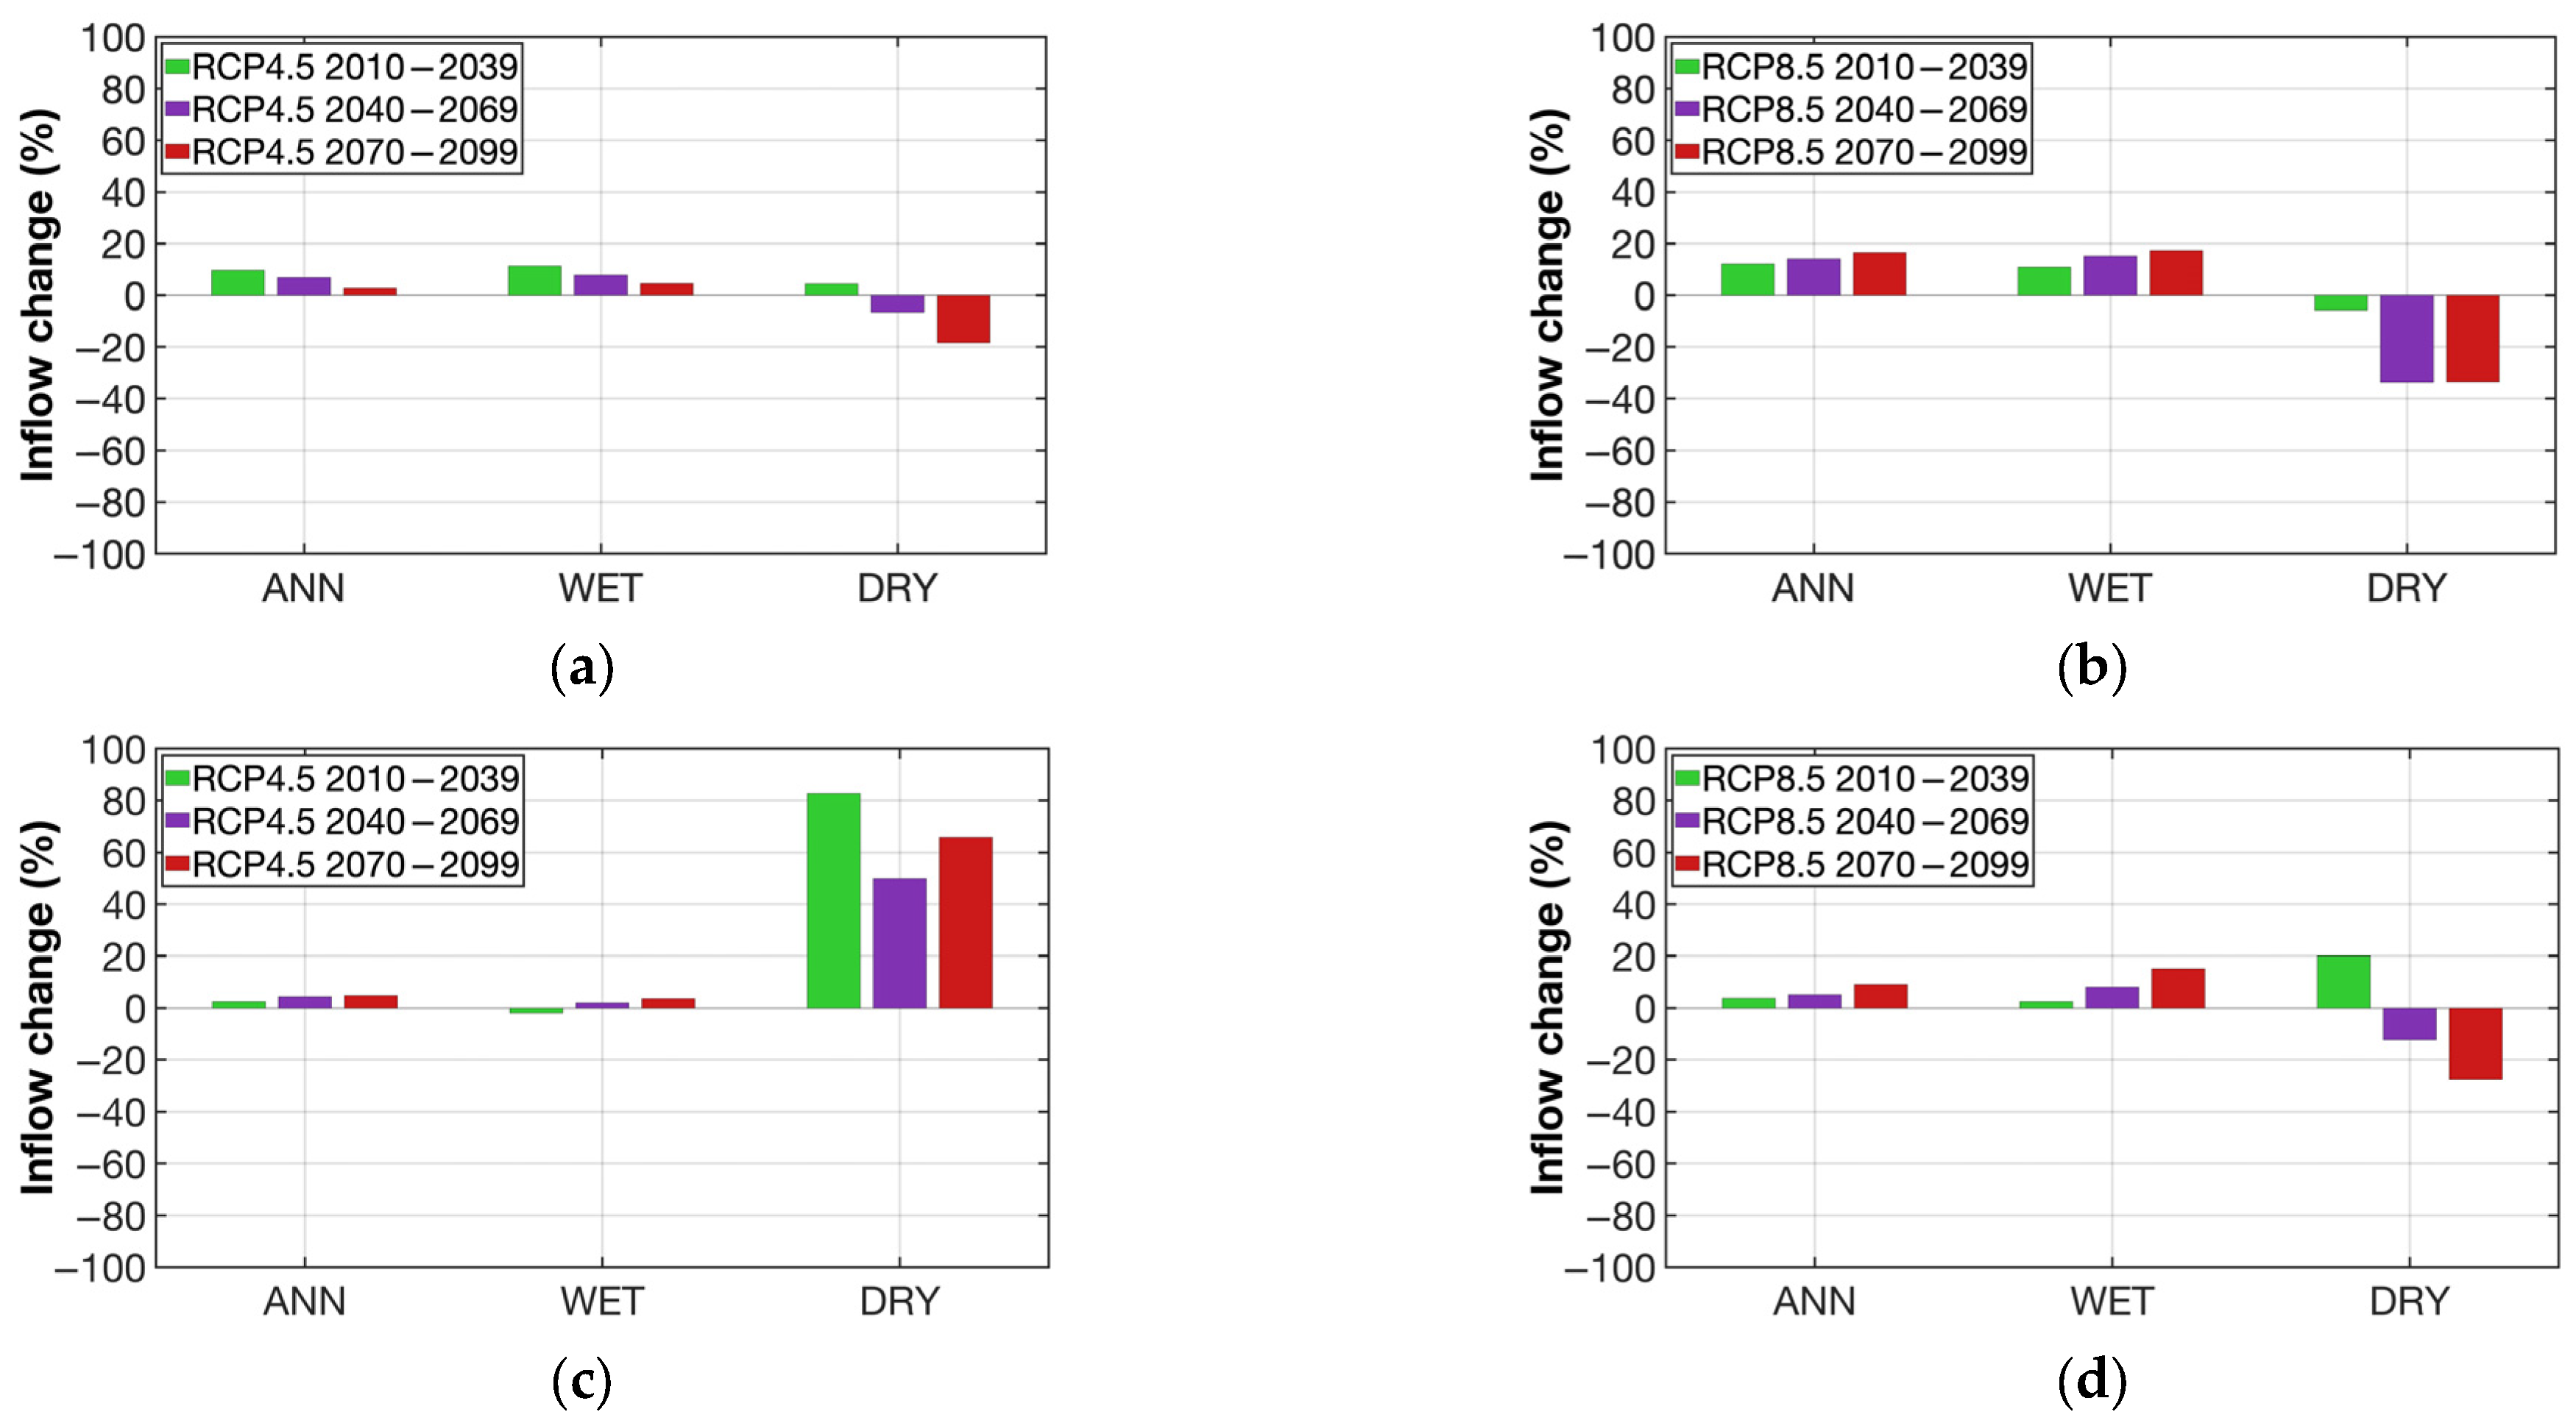
Furthermore, the magnitude of projected inflow for the annual (January–December), wet and dry seasons was determined in comparison with the historical baseline data, as illustrated in
Figure 10. The findings indicate that the inflows of both reservoirs have consistently increased on an annual basis. The SK Reservoir exhibits a more pronounced increase across all future periods than the BB Reservoir. It is anticipated that the BB Reservoir will experience inflow increases of 3.8% in the short-term future (2010–2039), 5.1% in the medium-term future (2040–2069), and 9.14% in the long-term future (2070–2099) under the RCP8.5 scenario, as illustrated in
Figure 9a,b. In
Figure 9c,d, the SK Reservoir shows even greater increases of 11.42%, 13.4%, and 15.76% in the short-, medium-, and long-term future periods, respectively.
This positive trend is also evident during the wet season, with inflow steadily rising as projections extend further into the future. The most considerable increase during the long-term future period (2070–2099) underscores a potential intensification of monsoon-driven inflows. In particular, the runoff to the BB Reservoir is anticipated to increase by 6.61%, while the SK Reservoir will experience a more substantial increase of 17.41% in the distant future.
In contrast to the annual and wet-season trends, the dry-season inflow shows a substantial decline, particularly in the medium- and long-term future. Although the inflow of the BB Reservoir is projected to increase by 20% during the short-term future period (2010–2039), this trend is expected to reverse in the medium-term (2040–2069) and long-term (2070–2099) futures, with projected declines of −12.4% and −27.7%, respectively. However, under the RCP4.5 scenario, the inflow to the BB Reservoir during the dry season increases substantially by approximately 49.88% to 82.6% in the short-term future. The decline is even more severe for the SK Reservoir, where inflow is expected to decrease by −5.77%, −33.71%, and −33.5% across the corresponding periods.
These seasonal variations highlight the critical need for targeted water management strategies to mitigate future climate impacts on water availability.
4.2. Future Discharge Projection
This study examines flood behavior by analyzing the discharge at the C2 station, a key factor influencing flood dynamics from Nakhon Sawan downstream to Bangkok and its metropolitan areas.
Table 6 shows that the DWT-NARX model outperforms the NARX, LSTM, RNN, and BNN methods in terms of RMSE and CC for forecasting discharge at the C2 station.
Table 7 demonstrates the performance of the DWT-NARX model in forecasting discharge at the C2 station during wet and dry seasons. The model shows higher correlation coefficients in the wet season, indicating strong agreement between observed and predicted flows despite greater hydrological variability, whereas the dry season yields lower RMSE values, reflecting smaller prediction errors due to more stable flow conditions. Overall, the results confirm that the DWT-NARX model performs effectively in both seasons, with stronger pattern recognition during the wet period and more accurate magnitude prediction during the dry period. The model forecasts the discharge at C2 for the future period (2010–2099) and compares it with the historical baseline period (1980–2005) under the RCP4.5 and RCP8.5 greenhouse gas emission scenarios, as illustrated in
Figure 11.
Discharge levels increase from January to September, peaking around September to October. Under RCP4.5, the discharge at C2 station is expected to increase by 7.83%, 10.23%, and 12.39% in the short-term (2010–2039), medium-term (2040–2069), and long-term (2070–2099) future periods, respectively, compared to the historical baseline. Under RCP8.5, a more substantial increase is projected, with 10.58% in the short-term, 12.68% in the medium-term, and a significant rise of 20.92% in the long-term future period.
As shown in
Figure 12, discharge values under RCP8.5 are generally higher than those under RCP4.5, particularly during the peak months, indicating a stronger impact of higher greenhouse gas emissions on hydrological patterns. The maximum discharge is projected to reach 1775 m
3/s in October during the long-term future period under the RCP8.5 scenario.
Additionally, the future discharge magnitude for the annual, wet, and dry seasons shows distinct variations. By the long-term future, discharge is expected to increase consistently on an annual basis, reaching a maximum of 12.4% under RCP4.5 and a substantially higher level of 20.9% under RCP8.5. Under RCP8.5, the wet season exhibits notably larger increases, with discharge rising from 15.8% (short-term) to 32.2% (long-term), suggesting intensification of monsoon-driven flows. In contrast, the dry season displays significant variability, initially increasing by 14.4% in the medium-term future under RCP4.5 but ultimately decreasing by approximately −20.2% (medium-term) and −15.4% (long-term) under RCP8.5.
These findings underscore the heightened probability of water scarcity during the dry season and emphasize the importance of adaptive management strategies to mitigate future seasonal water extremes.
4.3. Assessment of Frequency and Severity
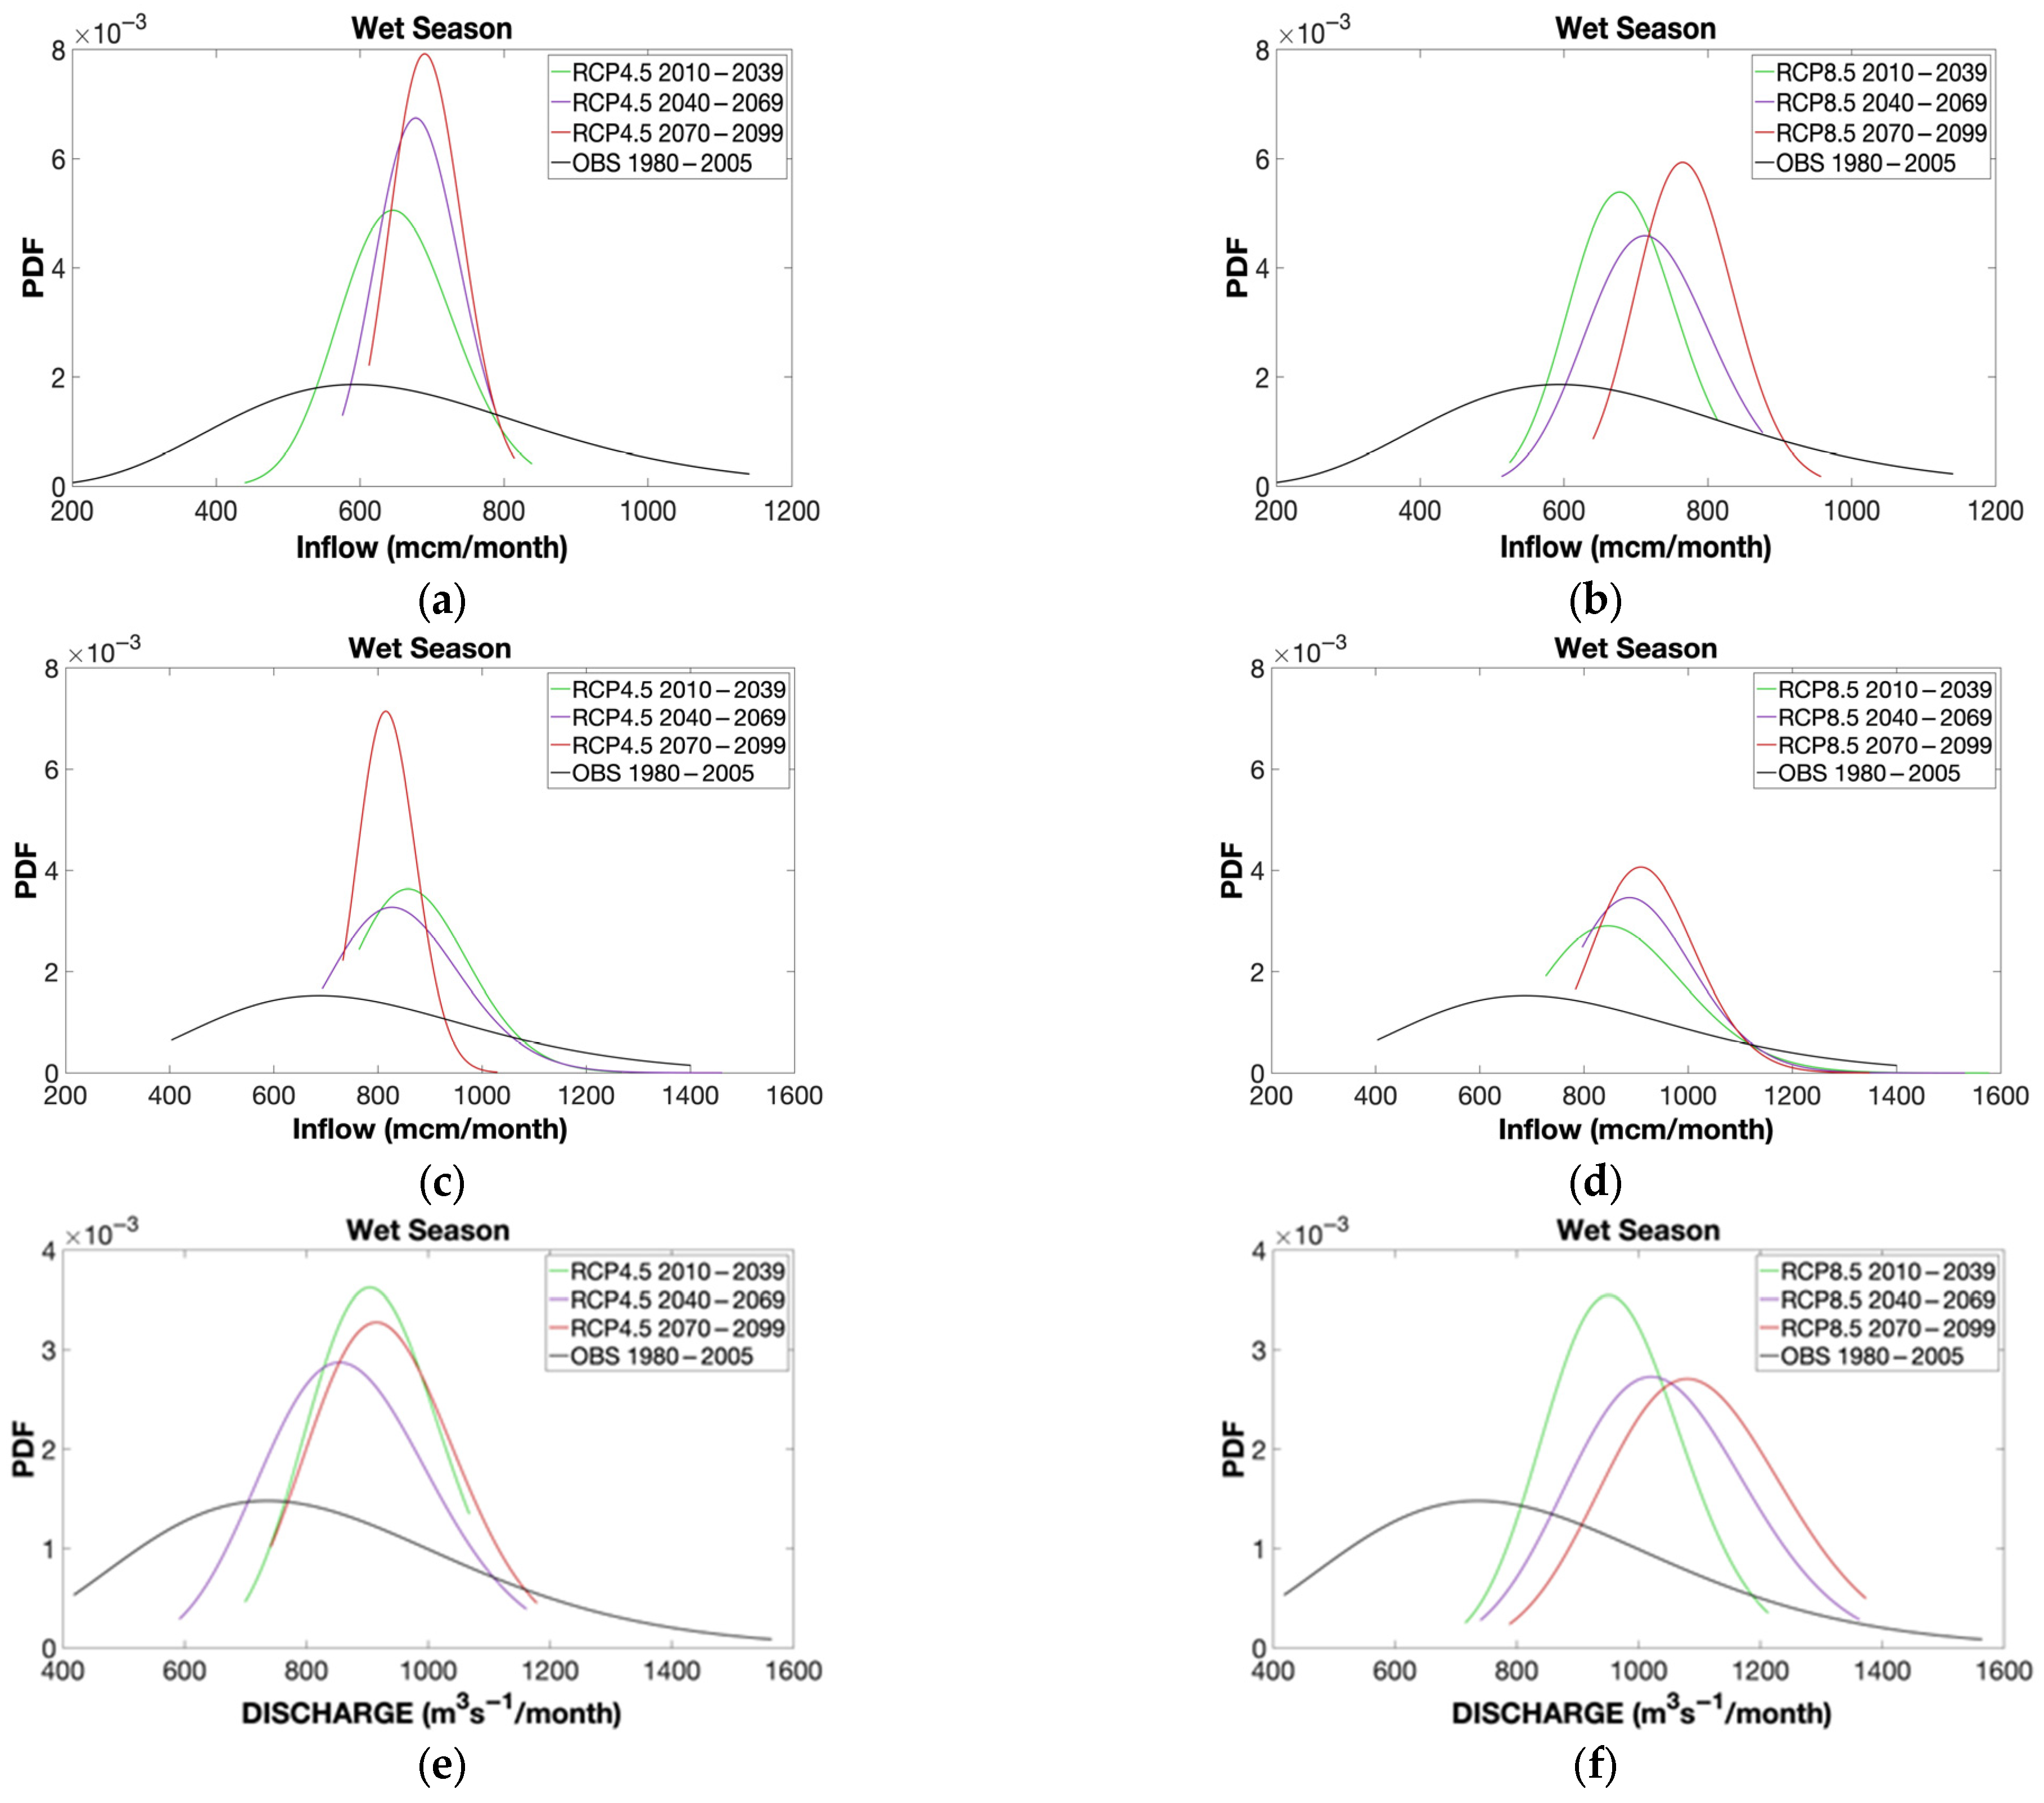
The gamma probability distributions of reservoir inflow at the BB and SK reservoirs, as well as discharge at the C2 station, are illustrated in
Figure 13 and
Figure 14. These figures present the distributions for both the wet and dry seasons during the historical baseline and future periods under the CMIP5 scenarios RCP4.5 and RCP8.5.
In the wet season under both RCP4.5 and RCP8.5, the gamma probability distributions of reservoir inflow for the BB and SK reservoirs, as well as discharge at the C2 station, shift toward the right, indicating an overall increase in inflow and discharge in the future periods. As shown in
Figure 13a,b, under the extreme RCP8.5 scenario, the modal inflow values increase by approximately 28.89% and 31.39%, with probabilities higher than 0.0059 and 0.0041 for the BB and SK reservoirs, respectively. Peak discharge volumes shift markedly from the historical 735 m
3/s per month to approximately 1079 m
3/s per month in the long-term future under the RCP8.5 scenario, highlighting significant hydrological changes. These results provide important insights for water resource planning and adaptation by illustrating projected changes in reservoir inflows and downstream discharge under future climate conditions.
Figure 14 shows that most probability distributions exhibit a leftward shift (decrease in value) during the dry season, indicating a substantial reduction in water availability. However, inflow at the BB reservoir and discharge at the C2 station under the RCP4.5 scenario shift slightly to the right, suggesting a small increase in water availability in these particular cases. In contrast, the SK reservoir under RCP8.5 demonstrates a pronounced decrease in both inflow and discharge. Historical inflow peaked at approximately 5.5 mcm/month but concentrates sharply near 3.33 mcm/month in the future period, reflecting severe inflow reductions and more frequent extremely low inflow events. Similarly, the average inflow at the SK reservoir declines from its historical mean of approximately 81.45 mcm/month to 24.27 mcm/month, indicating increasingly severe drought conditions.
The discharge at the C2 station also shows a substantial decline, decreasing from its historical maximum of approximately 371 m3/s per month to 310 m3/s, 218 m3/s, and 293 m3/s per month in the short-term, medium-term, and long-term future periods, respectively.
5. Discussion
5.1. Model Performance and Implications for SDG 6 (Clean Water and Sanitation)
The hybrid DWT-NARX model demonstrated superior predictive performance compared to baseline approaches (NARX, LSTM, RNN, BNN). The model achieved RMSE values of 4.53–10.67 mcm for BB reservoir and 4.03–7.45 mcm for SK reservoir, representing 55–98% improvements over baseline methods, with Pearson correlation coefficients exceeding 0.91 across all forecasting horizons. This robust accuracy directly supports SDG 6: Clean Water and Sanitation by enabling water managers to: (1) allocate freshwater resources equitably between competing agricultural, municipal, and industrial demands; (2) optimize reservoir operations while maintaining environmental flows; (3) reduce water loss through improved efficiency; and (4) implement integrated water resources management at basin scale.
5.2. Implications for SDG 11 (Sustainable Cities and Communities)
The model achieved RMSE of 172–247 mcm and correlation coefficients of 0.91–0.94 in predicting discharge at the C2 station. Under RCP8.5 scenarios, discharge is projected to increase by 10.58% for the period 2010–2039, 12.68% for 2040–2069, and 20.92% for 2070–2099, with peak discharge reaching approximately 1775 m3/s. This substantial increase translates to heightened flood risks for Bangkok and surrounding areas. The model’s strong predictive accuracy directly supports SDG 11.5: Disaster Risk Reduction by enabling: (1) multi-month flood forecasts providing early warning; (2) strategic evacuation planning; (3) emergency resource pre-positioning; (4) controlled reservoir discharge coordination; and (5) evidence-based urban infrastructure design.
5.3. Implications for SDG 13 (Climate Action)
The integration of CMIP5 climate projections under RCP4.5 and RCP8.5 scenarios directly supports SDG 13: Climate Action. Key climate findings reveal intensification of seasonal extremes: wet-season inflows to SK reservoir are projected to increase by 11.42% for the short-term period, 13.4% for the medium-term period, and 15.76% for the long-term period under RCP8.5, while dry-season inflows decline by 5.77–33.5%, with modal values declining from 81.45 mcm/month historically to as low as 24.27 mcm/month (70% reduction). Gamma probability distributions demonstrate that extreme events are becoming more frequent and severe, with rightward shifts during wet seasons and leftward shifts during dry seasons, indicating a fundamentally altered hydroclimatic regime. These quantitative projections provide the scientific foundation for climate adaptation strategies aligned with SDG 13 targets.
5.4. Methodological Considerations and Future Directions
This study aims to improve the accuracy of reservoir inflow and discharge forecasts in the CPRB, Thailand. A hybrid forecasting model was successfully developed by integrating the DWT with Nonlinear Autoregressive with Exogenous Input (NARX) neural networks. Compared with conventional models such as standalone NARX, Long Short-Term Memory (LSTM), Recurrent Neural Networks (RNNs), and Backpropagation Neural Networks (BNNs), the DWT-NARX model demonstrated superior predictive performance by incorporating remapped precipitation projections from 19 CMIP5 climate models under the RCP4.5 and RCP8.5 scenarios.
Future climate projections indicate significant increases in annual and wet-season inflows for both the BB and SK reservoirs, reflecting an intensification of monsoon activity. The existing flood mitigation infrastructure is likely to face greater challenges due to the substantial inflow increases projected for the SK reservoir. In contrast, drought conditions may worsen during the dry season as a result of notable decreases in reservoir inflows, emphasizing the need for targeted and sustainable water management strategies.
Discharge projections at the C2 station suggest that peak flows will rise considerably, particularly under the RCP8.5 scenario, increasing the risk of flooding in downstream communities, including Bangkok and surrounding metropolitan areas. The gamma probability distribution analysis further highlights the growing frequency and severity of extreme hydrological events, offering valuable insights for water resource managers and policymakers to support long-term sustainability and climate resilience.
The proposed DWT-NARX model provides a robust and reliable approach for assessing hydrological impacts under changing climatic conditions. Its application is essential for proactive water resource management and the design of adaptive, sustainable flood and drought mitigation strategies. Overall, the integration of advanced signal processing and machine learning techniques enhances the capability to predict and manage future hydrological variability in a changing and increasingly climate-stressed environment.
Comparative studies [
47,
48] indicate that while CMIP6 projects slightly higher precipitation increases (3–7% greater by 2100), directional hydrological trends remain consistent between CMIP5 and CMIP6: both show intensifying wet seasons, declining dry seasons, and increased extreme event frequency. For streamflow projections, differences between CMIP5 and CMIP6 are typically less than 5% after bias correction, suggesting our CMIP5-based conclusions remain scientifically robust while potentially conservative.
However, there are inherent limitations in using CMIP5 data, as more recent CMIP6 models have improved representation of climate processes and variability, particularly in monsoon regions. Similarly, our use of remapping via bilinear interpolation and Linear Scaling (LS) for bias correction does not fully account for the spatial heterogeneity of precipitation and may underrepresent extremes. These methodological choices may limit the resolution and accuracy of projected hydrological extremes. We acknowledge these constraints and plan to compare alternative bias correction and downscaling techniques, as well as to incorporate CMIP6 datasets, in future research to refine and validate our projections for Thailand-specific hydrological impacts.
