Abstract
With the increasing frequency of extreme rainfall events, pluvial flooding has become a critical challenge to the safety and sustainable development of megacities worldwide. This study proposes a multi-dimensional framework for assessing urban pluvial flood resilience (UPFR) by integrating a coupled hydrological-hydrodynamic model with system performance curves. The framework characterizes the dynamic evolution of resilience across three dimensions: rainfall characteristics, risk thresholds, and spatial scales. Results show that short-duration intense rainfall triggers instantaneous pipe overloading, whereas long-duration storms impose cumulative stress that leads to sustained systemic weakening, with the lowest resilience observed under extreme prolonged rainfall conditions. The specification of risk thresholds strongly influences resilience ranking, with the vehicle stalling risk (VSR) consistently showing the lowest resilience, followed by building inundation risk (BIR) and human instability risk (HIR). Spatially, pipes represent the weakest components, nodes maintain resilience under moderate stress, and the regional system exhibits a pattern of local weakness but overall stability, accompanied by delayed recovery. These findings highlight the importance of incorporating multi-threshold and multi-scale perspectives in flood resilience assessment and management. The proposed framework provides a scientific basis to support staged prevention measures and adaptive emergency response strategies, thereby enhancing urban flood resilience in megacities.
1. Introduction
With the intensification of global climate change and human activities, extreme rainfall events have become more frequent and intense. As a result, urban flooding now occurs more frequently and causes increasingly severe damage []. In recent years, several major floods have devastated cities worldwide. The 2021 flood in western Germany killed nearly 200 people and caused economic losses of tens of billions of euros. In 2022, one-third of Pakistan was submerged, affecting more than 33 million people. In China, the extreme rainfall on 20 July 2021, in Zhengzhou, Henan Province, triggered catastrophic pluvial flooding, resulting in direct losses exceeding RMB 100 billion. Heavy rainfall in July 2023 also led to large-scale waterlogging in Beijing’s Mentougou District and in Zhuozhou in Hebei Province, forcing hundreds of thousands of residents to evacuate. These events demonstrate that floods can inflict enormous social and economic losses, posing serious threats to public safety and sustainable urban development [,,].
According to the United Nations Human Settlements Programme (UN-Habitat), nearly 70% of the global population will live in cities by 2050 []. Rapid urbanization will inevitably increase the risk of pluvial flooding. In megacities, dense built-up areas create extensive impervious surfaces, while the limited capacity of drainage systems often fails to cope with extreme rainfall [,]. These conditions disrupt transportation, damage buildings, and endanger human lives. They also undermine the operation of critical infrastructure and the stability of urban economies []. Therefore, assessing how cities resist and recover from pluvial floods has become an urgent task for ensuring urban water security.
The concept of the “resilient city” has received growing attention in disaster risk research. It emphasizes a system’s ability to resist, adapt to, and recover from external shocks. Within this context, urban pluvial flood resilience (UPFR) reflects how well a city can cope with flooding events [,]. However, research on UPFR remains limited. Current regulations and guidelines still lack clear definitions or standardized methods for quantifying resilience, even though such tools are essential for sustainable urban planning []. Previous studies have developed several approaches, including indicator-based assessments [], process-oriented numerical simulations [,], and integrated frameworks incorporating social, economic, and ecological factors [,]. Data-driven methods have also been used to capture flood dynamics by integrating satellite imagery, mobile phone data, and social media information []. Some studies combine hydrodynamic modeling with indicator systems to assess drainage performance under extreme rainfall [,]. Despite these advances, three key challenges remain. Many studies focus solely on static or post-disaster assessments, overlooking how resilience evolves during an event. Assessments are often restricted to a single spatial scale, ignoring variations between local and regional responses. Moreover, resilience thresholds are not standardized, and their inconsistent definitions can lead to markedly different results, reducing their usefulness for flood management and decision-making.
This study examines the dynamic resilience of urban systems to pluvial flooding in the Dahongmen drainage area, an upstream catchment of the Liangshui River in Beijing. We develop a multi-dimensional resilience framework to characterize the processes of resistance, response, and recovery, moving from static evaluation toward a dynamic, process-based assessment. By integrating representative risk thresholds, we explore spatial variations in resilience and provide insights for phased flood prevention and emergency planning. The findings enhance understanding of urban pluvial flood resilience and support science-based strategies for risk reduction and adaptive urban management. The remainder of this paper is organized as follows. Section 2 describes the study area, data, and methods. Section 3 presents model calibration and validation results and analyzes resilience responses under different rainfall conditions, risk thresholds, and spatial scales. Section 4 discusses the causes of flooding hotspots and related mitigation strategies, highlights the importance of threshold and scale selection, and outlines limitations and future directions. Section 5 summarizes the main conclusions.
2. Materials and Methods
2.1. Study Area
The Liangshui River is a major flood discharge channel in southern Beijing. It serves as a key urban drainage route for the southern districts and helps divert floodwater from the southern section of the central city. The river originates in Shijingshan District and flows through several major administrative districts, including Haidian, Xicheng, Fengtai, Chaoyang, Daxing, and Tongzhou. Its total length is approximately 68 km []. It plays a vital role in flood defense and pluvial flood management in Beijing.
This study focuses on the drainage area upstream of the Dahongmen Sluice Gate in the Liangshui River basin (Figure 1). The study area extends from 116°9′ to 116°25′ E and from 39°48′ to 39°56′ N. The main channel is 25.71 km long and drains a catchment area of 131.47 km2. The topography gently slopes from northwest to southeast. Plains account for about 80% of the area. Land use is dominated by built-up zones, characterized by the high imperviousness typical of dense urban environments.
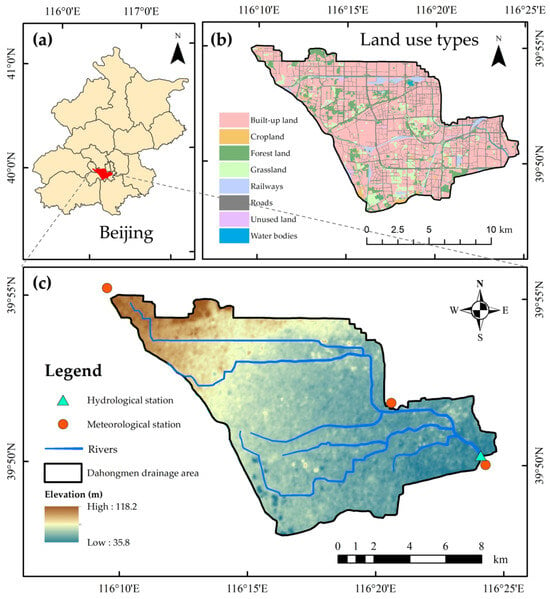
Figure 1.
Spatial information of the study area: (a) location in Beijing; (b) land use types; (c) elevation, river network, and locations of hydrological and meteorological stations.
The hydrological system is relatively complex and includes tributaries such as the Shuiya Canal, Xinfengcao River, Zaoyu River, and Macao River. The mean annual precipitation is 522.4 mm, of which 81.6% occurs during the flood season (June–September) []. Rainfall varies greatly both between and within years []. Because of its flat terrain, extensive impervious surfaces, and concentrated rainfall, the region is highly prone to pluvial flooding. Historical records identify 35 waterlogging hotspots in the study area, 16 of which were inundated during the extreme rainfall event of 21 July 2012, causing traffic disruptions and infrastructure damage. These characteristics make the Dahongmen drainage area representative of studies on UPFR in Beijing.
2.2. Urban Flood Simulation
InfoWorks ICM (2021.1, Innovyze Ltd., Wallingford, UK) is an integrated hydrological-hydrodynamic model designed to simulate urban water systems. It simulates rainfall–runoff and flooding processes, effectively linking one-dimensional (1D) drainage networks with two-dimensional (2D) surface flows []. The 2D module generates an unstructured mesh from terrain data and accounts for microtopographic features such as roads, buildings, surface roughness, and infiltration. This enables high-resolution simulation of flood dynamics across urban areas []. The model supports mesh refinement in key areas and employs GPU-based parallel computing to reduce computational time []. Model outputs include the extent, depth, and duration of waterlogging, which serve to assess system performance and resilience.
The datasets used in this study are listed in Table 1. Rainfall data were collected from the Shijingshan, You’anmen, and Dahongmen hydrological stations during two major storm events on 21 July 2012 and 20 July 2016. Rainfall distribution across subcatchments was determined using the Thiessen polygon method. The drainage network consists of 5876 pipes, 5995 nodes, and 119 outfalls, with diameters ranging from 300 to 4000 mm. Subcatchments were delineated based on the drainage network, digital elevation model (DEM), and road layout. Runoff parameters were assigned according to land use type.

Table 1.
Data and sources.
In the 2D model, terrain corrections were applied to improve accuracy. Building elevations were adjusted upward by 5 m to represent their blocking effect, while road elevations were adjusted downward by 0.15 m to reflect low-lying areas []. Road grids were further refined because they are more prone to waterlogging. A total of 251,343 grids were generated, with cell sizes ranging from 25 to 2500 m2.
2.3. Rainfall Scenario Design
Short- and long-duration intense rainfall events are the major drivers of urban pluvial flooding. Therefore, rainfall scenarios were developed according to rainfall duration and intensity.
For short-duration scenarios, rainfall durations of 1 h and 3 h were chosen based on observed rainfall patterns in Beijing and the runoff concentration time of the study area. Return periods of 1 year (1a), 50 years (50a), and 500 years (500a) were considered. According to the Technical Standard for Stormwater System Planning and Design of Beijing (DB11/T 969-2016, hereafter referred to as the Standard) [], synthetic design storms were generated using the Beijing Rainstorm Intensity Formula combined with the Chicago hyetograph method []. The rainfall intensity for each design storm was calculated using Equation (1):
where q is the design rainfall intensity (L/(s·hm2)), t is the design rainfall duration (min), and P denotes the return period (years).
For the long-duration scenarios, four representative storm events were selected. The rainstorms on 21 July 2012 and 20 July 2016 were selected, as both caused severe urban flooding in Beijing and are widely recognized as representative historical events. The third scenario was the storm on 31 July 2023. As the complete rainfall record was unavailable, the 24 h rainfall pattern recommended in the Standard was used instead. The storm was reconstructed by adjusting the design rainfall to match the observed maximum 1 h intensity of 111.8 mm/h. In addition, a synthetic 24 h storm with a 500-year return period was generated using the Beijing Hydrological Manual and the Standard to assess system performance under extreme rainfall [].
For clarity, the four long-duration scenarios are denoted as “2012 7·21”, “2016 7·20”, “24h-2023”, and “24h-500a”.
As shown in Figure 2, these scenarios encompass a wide range of rainfall characteristics, including both typical historical storms and design events.
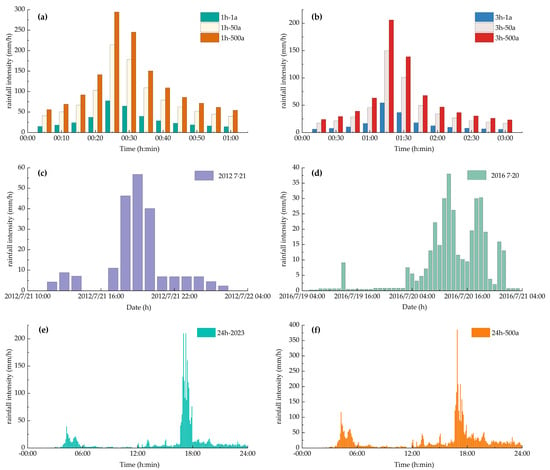
Figure 2.
Rainfall processes: (a,b) short-duration events, (c–f) long-duration events.
2.4. Resilience Assessment Framework
UPFR was evaluated dynamically using the system performance curve method. This method captures how urban drainage performance changes over time during storm events. It reflects the system’s ability to resist disturbance, adapt to external stress, and recover after the event [,]. As shown in Figure 3, the curve describes a continuous dynamic process. The pre-storm stage (t0–t1) represents resistance, when system performance remains stable before disturbance. During the storm-response stage (t1–t2), performance declines under external stress, reflecting adaptation. The post-storm stage (t2–tn) captures recovery, when performance gradually returns to its original level. The yellow shaded area in Figure 3 indicates the severity of flooding. The time-integrated performance serves as a summary indicator of UPFR, capturing the combined effects of resistance, response, and recovery. By linking resilience quantification with dynamic response processes, this framework provides a clear and comprehensive measure of UPFR [].
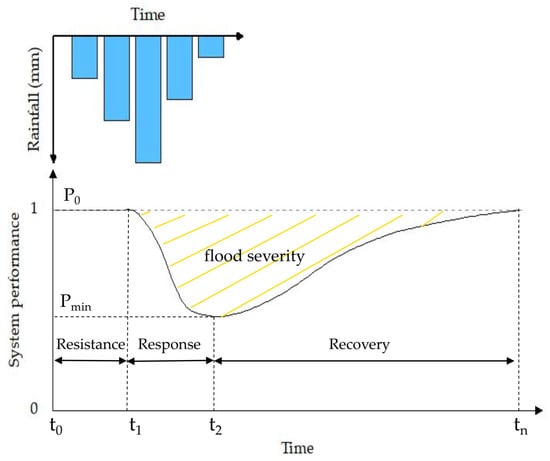
Figure 3.
Theoretical curve of system performance. P0 represents the initial system performance, and Pmin denotes the minimum performance reached at time t2.
UPFR was assessed at three spatial levels (the node, pipe, and region levels) using specific inundation depth thresholds.
Nodal performance and resilience were calculated based on the hydraulic state of each node. A node is considered failed when its inundation depth exceeds the threshold for a cumulative duration of at least 30 min [].
The state of a node is defined by the function:
The number of failed nodes at time t, denoted as Nnode(t), is calculated as:
The nodal system performance at time t, Pnode(t), is defined as the ratio of functional nodes to the total number of nodes, expressed as:
The nodal flood resilience, Resnode, represents the time-averaged performance over the entire simulation period and is quantified as:
where hnode(i,t) represents the inundation depth of node i at time t (m), hc is the inundation depth threshold (m), T(i,t) is the cumulative duration for which the inundation depth threshold is exceeded (min), N is the total number of nodes, tn is the total simulation period (min).
Pipe performance and resilience were evaluated based on the hydraulic state of each pipe. A pipe is considered failed when its filling ratio Spipe(i,t) exceeds the threshold value of 1 [].
The state of a pipe is defined by the function:
The total length of failed (i.e., surcharged) pipes at time t, denoted as Lpipe(t), is calculated as:
The system performance at the pipe level, Ppipe(t) is defined as the ratio of normally functioning pipe length to the total pipe length:
The pipe-level flood resilience represents the time-averaged performance over the entire simulation period and is expressed as:
where M is the total number of pipes, L is the total pipe length (m), and tn is the total simulation period (min).
Regional performance and resilience were evaluated from the hydraulic state of each grid cell within the study area. A grid is considered inundated when its water depth exceeds the threshold [].
The state of a grid cell is defined by the function:
The total inundated area at time t, denoted as Asys(t), is calculated as:
The performance of the regional system at time t, Psys(t), is defined as the ratio of non-inundated area to the total study area:
The regional flood resilience, Ressys, represents the time-averaged performance of the regional system throughout the simulation period and is expressed as:
where h(i,t) is the inundation depth of grid i at time t (m), K is the total number of grids, and A is the total study area excluding buildings (ha).
System performance ranges from 0 to 1. Higher values indicate better overall drainage function at a given time. A higher performance value indicates fewer failed nodes, fewer surcharged pipes, and smaller inundated areas, reflecting stronger drainage capacity. From a broader perspective, it also represents the city’s ability to maintain effective stormwater drainage and reduce surface flooding under extreme rainfall events. Similarly, resilience, also ranging from 0 to 1, characterizes the system’s integrated capacity to maintain and restore its functionality during and after flooding. A value closer to 1 signifies limited performance degradation, rapid recovery, and strong adaptive capacity across multiple spatial scales.
Three risk thresholds were defined to represent different levels of flood impact. The vehicle stalling risk (VSR, 0.27 m) corresponds to the water depth at which vehicle exhaust pipes become submerged, causing engine failure and subsequent traffic disruption. The building inundation risk (BIR, 0.4 m) indicates the onset of ground-floor water intrusion into buildings, marking a critical point for property damage. The human instability risk (HIR, 0.6 m) represents a severe threat to pedestrian safety, as such water depth can cause loss of balance and potential drowning. These thresholds follow the standards adopted by the Beijing Water Authority for flood emergency response []. They were also validated using observations from past urban flood events []. By integrating these hydraulic thresholds into the system performance framework, UPFR can be dynamically quantified across different spatial scales and rainfall scenarios. This provides a robust methodological foundation for the following analysis and discussion.
3. Results
3.1. Model Calibration and Validation
To verify the reliability of the InfoWorks ICM model, observed rainfall from the extreme storm on 21 July 2012, was used as input. The model simulated the spatial distribution of inundation across the study area. It was calibrated and validated using observed water depths at representative flood-prone sites, obtained from social media records. Table 2 compares the simulated and observed water depths. The relative errors were mostly within 15%, indicating that the model can reasonably reproduce the actual inundation conditions.

Table 2.
Comparison of simulated and measured water depths.
Figure 4 presents the measured and simulated flow hydrographs at the main outlet of the study area, Dahongmen Gate. The simulated hydrographs closely match the observed ones in both peak timing and magnitude, indicating that the ICM model reliably reproduces the flood flow hydrographs.
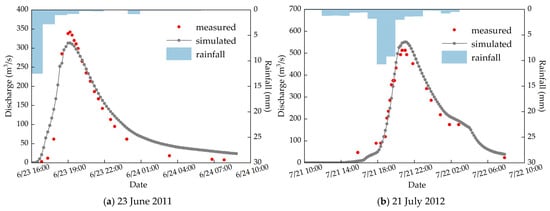
Figure 4.
Measured and simulated flow hydrographs at the main outlet of the study area.
Figure 5 illustrates the spatial distribution of simulated and observed urban waterlogging under the 21 July 2012 rainfall event. The simulated inundation points corresponded closely with the observed flood locations. Approximately 80% of the simulated points overlapped with the recorded floods, demonstrating strong agreement between the model and the observations. These results confirm that the model accurately captures the spatial pattern of urban waterlogging in the Dahongmen drainage area. The simulated high-risk zones are also consistent with those on the official flood risk map published by the Beijing Water Authority. Overall, the results verify that the ICM model developed in this study is reliable and provides a solid basis for subsequent scenario analyses.
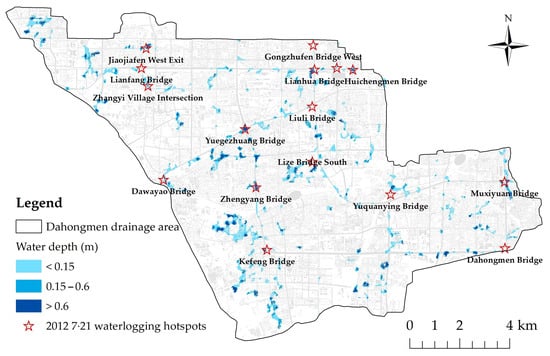
Figure 5.
Spatial distribution of simulated and measured urban waterlogging under the 2012 7·21 rainfall scenario.
The parameter values for different underlying surfaces are listed in Table 3.

Table 3.
Model parameter values.
3.2. Urban Flood Resilience Under Different Rainfall Scenarios
Previous studies have shown that rainfall intensity and duration are key factors affecting UPFR and resilience [,]. In this study, resilience was quantified at both the node and regional scales using the vehicle stalling threshold of 0.27 m. Differences in resilience among the node, pipe, and regional scales under various rainfall scenarios were compared to reveal how rainfall characteristics affect UPFR (Table 4, Figure 6).

Table 4.
Comparison of urban pluvial flood resilience (UPFR) under different rainfall scenarios at the vehicle stalling risk (VSR) threshold.
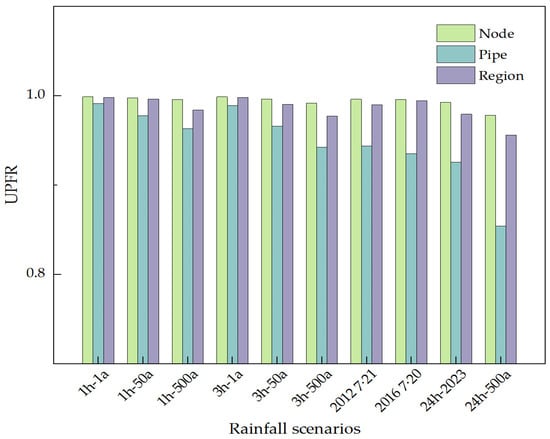
Figure 6.
Node-, pipe-, and regional-scale UPFR under different rainfall scenarios.
In short-duration rainfall scenarios, resilience at the node, pipe, and regional scales decreased as total rainfall and rainfall intensity increased []. For example, in the 1 h scenario, when rainfall increased from 31.4 mm to 119.3 mm (1a to 500a), resilience at the node, pipe, and regional scales decreased by 0.003, 0.028, and 0.014, respectively. In the 3 h scenario, the declines were greater, reaching 0.007, 0.047, and 0.020, respectively. These results indicate that pipe resilience is most sensitive to short-duration storms. Peak inflows quickly exceed the pipe capacity, leading to widespread surcharge []. In contrast, nodes and the region retained some buffering capacity, which resulting in smaller declines []. Therefore, under short-duration extreme storms, the dominant failure mechanism is the rapid surcharge and overflow of pipes.
At the same return period, longer durations consistently resulted in lower resilience. For instance, at the 500-year return period, resilience values for the 3 h storm were lower than those for the 1 h storm, decreasing by 0.004, 0.021, and 0.007 at the node, pipe, and regional scales, respectively. This indicates that long-duration storms impose cumulative stress by maintaining high inflows over extended periods. This process gradually increases the number of failed nodes, overloaded pipes, and inundated areas []. Unlike the sudden failures caused by short storms, long-duration rainfall produces gradual cumulative failures that weaken resilience more persistently and extensively [].
Historical and design storm events further highlight these differences. The 24h-500a storm produced a total rainfall of 507.0 mm, with a peak intensity of 110.3 mm/h, slightly lower than that of the 3h-500a storm (115.0 mm/h). However, the prolonged inflows caused resilience to decline to 0.9782 (nodes), 0.9559 (region), and 0.8541 (pipes), which were the lowest values among all scenarios. This finding shows that long-duration storms weaken resilience mainly through sustained inflows rather than short-term peaks.
The resilience of the node, pipe, and regional systems during the 21 July 2012 event (16 h, 203.0 mm) was used as a benchmark for low resilience in the comparison. The results show that resilience in both the 500a short-duration and all long-duration scenarios remained within the low-resilience range, confirming the strong impact of extreme events on urban drainage systems. In contrast, the 20 July 2016 event (46 h, 340.2 mm) showed higher regional resilience. Although total rainfall was higher, rainfall intensity stayed below 33.6 mm/h for most of the event, reducing concentrated stress on the drainage network. By comparison, the 24h-500a scenario combined high total rainfall, long duration, and strong intensity, leading to the sharpest decline in resilience.
In summary, short-duration storms mainly trigger rapid pipe overloads, while long-duration storms cause systemic failures through cumulative inflows, posing the greatest challenge for flood risk management. These findings suggest that future drainage system design and operation should not only improve peak flow capacity but also focus on spreading and reducing peak discharges during extreme events to lower the risk of total system failure [].
3.3. Urban Flood Resilience Under Different Risk Thresholds
Figure 7 compares resilience under three thresholds: Vehicle Stalling Risk (VSR), Building Inundation Risk (BIR), and Human Inundation Risk (HIR), corresponding to depths of 0.27 m, 0.40 m, and 0.60 m. Across all rainfall scenarios, resilience consistently followed the order VSR < BIR < HIR. This pattern suggests that lower thresholds respond more acutely to flood disturbances, with VSR marking the earliest stage of system degradation. Specifically, shallow water first accumulates on low-lying roads and around manholes, and once the depth exceeds 0.27 m, vehicle exhaust pipes become submerged, leading to engine failure and traffic disruption [,]. In contrast, BIR and HIR occur only at higher water levels, showing greater resilience but also leading to more severe impacts once exceeded. VSR therefore serves as the most sensitive indicator of early-stage degradation and provides an early warning of resilience loss.
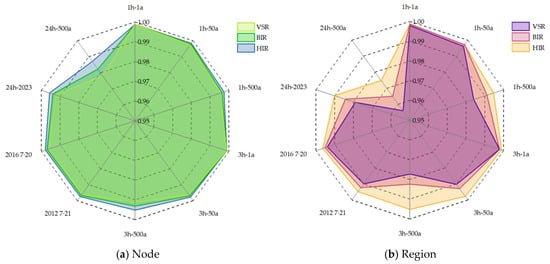
Figure 7.
UPFR under VSR, BIR, and HIR. (a) node-scale UPFR, (b) regional-scale UPFR.
Across different rainfall scenarios, resilience under all three risk types declined as rainfall intensity and duration increased. Among them, VSR showed the steepest decline and the largest variability. Short-duration extreme storms, such as 1h-500a and 3h-500a, often trigger rapid, localized waterlogging at road intersections and streets. This quickly disrupts traffic and causes a sharp decline in VSR at both node and regional scales. In contrast, long-duration heavy rainfall, such as 24h-500a, sustains node overflow and street waterlogging over time. These cumulative effects can paralyze the traffic network, resulting in the lowest VSR resilience at the regional scale. Resilience under BIR and HIR also declined during extreme rainfall, but their higher depth thresholds made them less sensitive to short-duration peaks, showing greater stability. This difference highlights how different societal functions respond to risk. The transportation system is most vulnerable to disturbance, whereas buildings and pedestrians retain some buffering capacity. However, once these thresholds are exceeded, the resulting damage is more immediate and severe [,].
Overall, the chosen risk depth thresholds directly shape the ranking of flood resilience. Rainfall duration and intensity further amplify these differences, particularly for VSR, where the effect is most pronounced. These findings suggest that during extreme rainfall, flood control efforts should prioritize maintaining the operational safety of transportation systems. Measures may include improving the temporary drainage capacity of roadside inlets and pipelines, applying early traffic restrictions and detours, and deploying emergency pumping and waterlogging monitoring systems. Additionally, for long-duration heavy rainfall, regional retention and drainage coordination should be optimized to delay the spread of cumulative risks and improve overall urban flood resilience.
3.4. Urban Flood Resilience Across Spatial Scales
Figure 8 and Figure 9 present the performance curves and resilience maps of nodes, pipes, and the region under various rainfall scenarios. The results indicate clear differences in flood resilience across spatial scales.
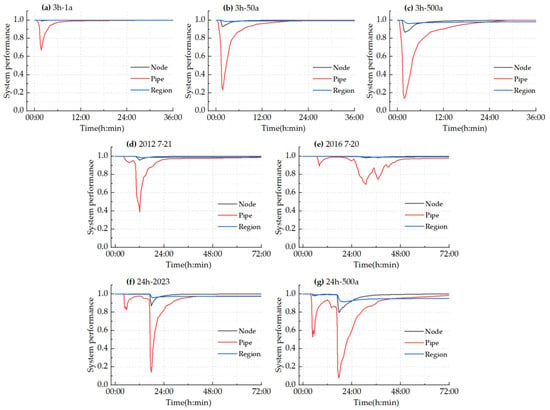
Figure 8.
System performance curves at node, pipe, and regional scales under different rainfall scenarios. (a–c) short-duration rainfall, (d–g) long-duration rainfall.
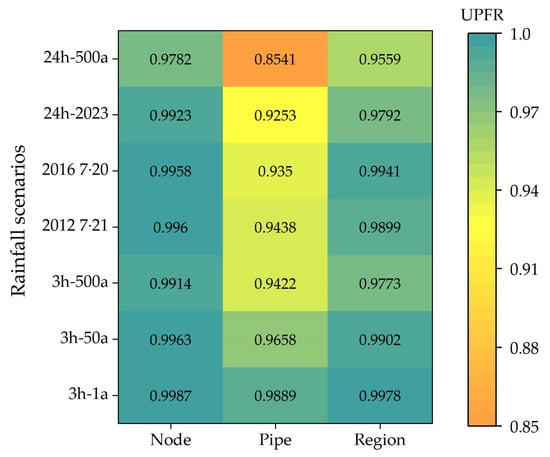
Figure 9.
Heatmaps of node-, pipe-, and regional-scale UPFR under different rainfall scenarios.
Nodes showed high resilience during mild and moderate storms, including short-duration, low-frequency rainfall events such as 3h-1a and long, low-intensity events such as the 2016 7·20 storm. In these cases, node performance fluctuated slightly during peak rainfall and quickly returned to its normal state, maintaining a high level of resilience. However, during short-duration, high-frequency storms such as 3h-500a and long, high-intensity storms such as 24h-500a, node performance declined sharply. The lowest value approached 0.8, and resilience fell to 0.9782, with a noticeably slower recovery. This occurred because moderate rainfall did not cause sustained overflow at nodes. Localized waterlogging drained quickly thanks to the spare capacity of the pipe network. In contrast, extreme rainfall often led to persistent node flooding caused by manhole overflow and backflow. Although the flooding was scattered, some system robustness still remained [,,].
In all scenarios, pipe resilience was lower than that of nodes and the region, consistent with the findings of Dai et al. []. Under the 24h-2023 and 24h-500a storms, pipe resilience dropped sharply to 0.9253 and 0.8541, showing the weakest performance. Pipe performance curves showed steep drops during rainfall peaks in both short and long high-intensity storms. For instance, in the 3h-500a, 24h-2023, and 24h-500a events, performance fell below 0.2 and required several hours to recover. In some storms, such as 2016 7·20 and 24h-2023, the performance curves showed multiple peaks, suggesting repeated surcharging from several high-flow pulses []. Overall, pipes were the weakest part of the drainage system during extreme rainfall. Their limited capacity directly affected both performance loss and the delay in system recovery.
Regional resilience was less affected by rainfall, remaining above 0.97 in most cases. Even during the 24h-500a storm, it only fell to 0.9559. The regional response was similar to that of nodes. It remained strong under moderate rainfall but declined markedly under extreme storms. However, the post-storm performance restoration at the regional scale was much slower than at the node level. Once the rainfall ceased, it took longer for the system to return to normal conditions. This delayed restoration was attributed to several factors, including surface water ponding, low-lying terrain, limited infiltration, and the time lag between runoff and system discharge. Collectively, these processes explain the slower regional response compared with individual nodes [,].
4. Discussion
The results show clear differences in urban pluvial flood resilience (UPFR) under various rainfall scenarios, risk thresholds, and spatial scales, including nodes, pipes, and the regional scale. Based on these findings, the discussion focuses on three main aspects: identifying key flood-prone areas and strategies for risk reduction, examining how risk thresholds and assessment scales affect resilience evaluation, and outlining the study’s limitations and future research directions.
4.1. Key Flood-Prone Areas and Disaster Reduction Strategies
Analysis of the extreme 24h-500a scenario, which exhibited the lowest resilience, was used to identify critical flood-prone areas in the Dahongmen drainage district. The results indicate that during long-duration, high-intensity storms, inundation was widespread across the study area, without clear spatial clustering. However, recurring hotspots appeared at road intersections, depressed underpasses, and densely built low-lying zones, as shown in Figure 10d. Typical high-risk locations include Lianfang Bridge and Lugu Avenue in the northwest, Yuegezhuang Bridge, Lianhua Bridge, and Lize Bridge in the north–central area, Fengtai Bridge, Kefeng Bridge, and Yonghezhuang Village in the south, and Yuquanying Bridge and Muxiyuan Bridge in the east.
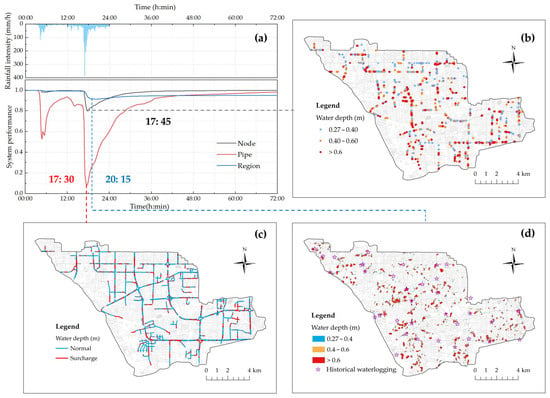
Figure 10.
System performance and waterlogging under the 24h-500a rainfall scenario: (a) performance curves at node, pipe, and regional scales; (b–d) waterlogging distribution at node, pipe, and regional scales.
Further inspection of the drainage system showed that the spatial distribution of failed nodes and overloaded pipes closely matched the inundation hotspots, indicating that limited conveyance capacity was a key factor driving widespread flooding []. Mechanistic analysis suggests several interacting causes. First, local low-lying terrain and gentle slopes restrict natural drainage, with elevation strongly influencing the rate of water recession []. Second, in areas where the drainage network is sparse, a single inlet often collects runoff from a large subcatchment, creating excessive hydraulic loads. Third, mismatches in pipe diameters and slopes between upstream and downstream sections, together with insufficient inlet density, reduce flow efficiency. Finally, in densely built-up areas, a high proportion of impervious surfaces limits infiltration, increasing surface runoff and further overloading the system [].
Performance curves revealed a sequential pattern of system failure under extreme storms. Pipe performance declined first, node failures followed within approximately fifteen minutes, and regional performance decreased roughly three hours later. This cascading process reflects the internal response dynamics of the drainage network. Pipes rapidly reached surcharge conditions, manholes provided short-term buffering, and regional inundation developed later due to overflow, surface ponding, and delayed discharge.
This sequence offers practical insights for flood preparedness and management. As shown in Figure 10a,c, pipes exhibited the lowest resilience and the fastest decline, suggesting that early emergency actions should focus on overloaded pipe sections. Overflow control, temporary pumping, and regular maintenance of key trunk lines are essential to prevent cascading failure. Node resilience decreased soon after pipe failure, as shown in Figure 10a,b, indicating a strong dependency on upstream overloading. Timely node-level interventions, such as clearing inlets, inspecting flood-prone sites, and installing temporary flow diversions, can reduce localized waterlogging. Regional resilience remained relatively high but recovered slowly after prolonged rainfall, as shown in Figure 10a,d, indicating that surface ponding and delayed drainage dominated the recovery process. During late flood stages, coordinated cross-district drainage, staggered storage operations, and downstream water-level monitoring can mitigate cascading impacts and enhance post-flood system performance.
Resilience based on the vehicle stalling risk (VSR) declined most sharply during short-duration storms (Figure 7), underscoring the vulnerability of transportation systems. Strengthening roadside inlets, implementing temporary traffic restrictions, and deploying mobile pumping units can reduce early disruptions and improve safety. In addition, adopting nature-based solutions such as green roofs, rain gardens, and detention green spaces can help attenuate inflows and enhance overall flood resilience [,].
4.2. Influence of Risk Threshold Specification and Assessment Scales on UPFR
This study shows that both the specification of risk thresholds and the choice of spatial assessment scales strongly influence UPFR evaluation.
The findings suggest that how thresholds are defined strongly shapes the interpretation of UPFR. When thresholds are set too high, small degradations in performance may not be recognized as failures, leading to an overestimation of resilience. In contrast, very low thresholds amplify minor fluctuations, resulting in lower resilience estimates. In essence, threshold choice regulates how sensitive the system performance curve is to disturbance. High thresholds emphasize the system’s capacity to maintain overall operation, while low thresholds reveal the vulnerability of local elements. Previous studies have also noted that increasing water depth thresholds reduces the number of inundated cells and improves the apparent system recovery [,,]. Therefore, the specification of thresholds not only affects how risks are classified but also determines how accurately system resilience is perceived.
Spatial scale further influences resilience outcomes. Node-level resilience is generally higher than that of pipes, and regional resilience typically outperforms both. This “node > region > pipe” hierarchy reflects the effect of spatial aggregation. Localized failures can cause sharp drops in pipe performance, but unaffected areas at the regional level can offset these losses, creating an overall pattern of “local weakness with general stability”. However, this aggregation effect may also hide the vulnerability of critical components, making it harder to identify high-risk nodes or pipe segments when relying only on averaged metrics.
To examine the sensitivity of resilience estimates to threshold settings, two additional scenarios of 0.15 m and 1.0 m were introduced alongside the original thresholds of 0.27 m, 0.4 m, and 0.6 m. In general, water depths above 0.15 m can be considered surface flooding, while depths exceeding 1.0 m represent high-risk conditions. Taking regional flood resilience as an example, the results show that as the threshold increases from 0.15 m to 1.0 m, UPFR rises overall, but the growth rate gradually slows, forming a clear stepwise pattern (Figure 11). Within the 0.15–0.6 m range, UPFR is most responsive to threshold variation, and resilience improves significantly. Beyond 0.6 m, the UPFR curve tends to flatten, suggesting a steady resilience state. Therefore, a sensitivity interval of approximately 0.15–0.6 m can be defined for assessing urban drainage system resilience. Within this interval, small changes in threshold settings can noticeably alter resilience outcomes, while beyond it, the assessment results remain relatively stable.
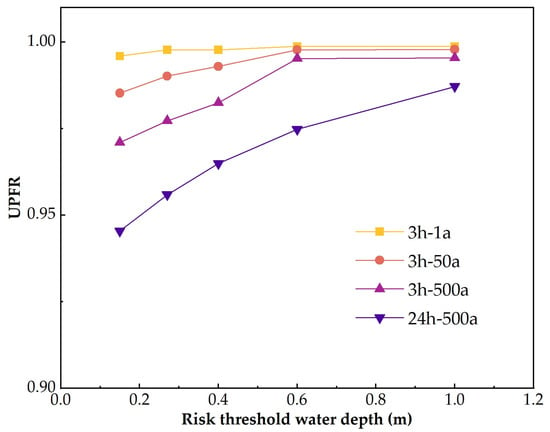
Figure 11.
Variation in UPFR under different risk threshold water depths.
From a practical standpoint, selecting appropriate thresholds and spatial scales is vital for effective urban flood resilience planning and management. For key drainage nodes and major traffic corridors, lower thresholds combined with fine-scale, high-resolution simulations are recommended to ensure that vulnerable areas are not overlooked. At the broader planning level, moderate thresholds integrated with multi-scale assessments can help balance local risk control with overall system stability. Furthermore, joint analyses across different thresholds and scales can reveal the dynamic relationship between local fragility and global robustness, providing a sound scientific basis for hierarchical management and adaptive operation of urban drainage systems.
4.3. Limitations and Future Research Directions
This study has several limitations concerning model structure, data detail, scenario design, and resilience evaluation. The drainage network was simplified, with minor branches and hydraulic structures not fully represented, which may have reduced local accuracy. The DEM resolution was also insufficient to capture fine topographic variations and flow paths, potentially affecting inundation and hydrodynamic results. Future work will use high-resolution DEMs from UAV photogrammetry or LiDAR to enhance model accuracy and realism.
The rainfall scenarios relied on idealized design storms and past events, which did not fully reflect spatiotemporal variability or potential future climatic changes. Future studies should integrate multi-source rainfall data with climate projections to improve the dynamic prediction of urban flood resilience.
The current assessment framework also has methodological constraints. At the node and pipe scales, the analysis does not consider the relative importance of key components. At the regional level, it also neglects variations in population density and the distribution of critical infrastructure. As a result, the assessment is better suited for identifying overall system trends than for guiding targeted interventions. Future research will incorporate weighted indicators to reflect the relative importance of nodes, pipes, and regions, allowing a more precise representation of spatial variations in flood resilience.
In addition, the current framework mainly focuses on hydraulic performance and does not yet include economic, transport, or social dimensions. Including these factors in future work will help develop a more comprehensive, multi-dimensional framework for assessing urban flood resilience.
5. Conclusions
This study developed a multi-dimensional, process-oriented framework to quantify urban pluvial flood resilience (UPFR) by integrating the InfoWorks ICM model with system performance curves. The framework captures how rainfall characteristics, risk thresholds, and spatial scales jointly affect resilience. The key conclusions are as follows:
- (1)
- Rainfall characteristics strongly shaped resilience patterns. Short-duration storms caused rapid pipe overloading, whereas long-duration storms led to sustained cumulative failures. The 24h-500a scenario resulted in the lowest resilience, highlighting the need for drainage systems to manage both peak flows and prolonged inflows.
- (2)
- Risk thresholds strongly influenced resilience evaluation. VSR, representing the vehicle stalling risk, was the most sensitive and failed first in most scenarios, reflecting the vulnerability of urban transportation. BIR and HIR were more robust but caused severe impacts when exceeded. These findings emphasize that transportation safety should be prioritized in urban flood management.
- (3)
- Resilience varied across spatial scales, following a clear hierarchy, with pipes exhibiting the lowest resilience, nodes performing better, and the regional system showing the highest resilience. Pipes consistently showed the weakest performance, while nodes maintained resilience under moderate stress. The regional system remained generally stable but recovered more slowly because of accumulated ponding and delayed surface drainage. This highlights the importance of combining local low-threshold assessments with system-wide, multi-scale evaluations.
- (4)
- Failure propagated sequentially from pipes to nodes and then to the region during extreme rainfall. This sequential pattern provides guidance for phased flood response: immediate overflow control at pipes and nodes, targeted protection of critical road sections, and coordinated drainage and storage operations at the regional scale.
Overall, the framework effectively captured varied resilience patterns across rainfall events, risk thresholds, and spatial scales. It provides practical insights for improving flood risk management and enhancing urban resilience in megacities. Future research should incorporate climate projections and socio-economic factors to develop a more comprehensive and multi-dimensional assessment of urban flood resilience.
Author Contributions
Conceptualization, R.L.; methodology, R.L.; software, R.L.; validation, R.L. and Y.H.; formal analysis, R.L.; investigation, Y.H.; resources, Z.X.; data curation, R.L.; writing—original draft preparation, R.L.; writing—review and editing, R.L. and Z.X.; visualization, R.L. and Y.H.; supervision, Z.X.; project administration, Z.X.; funding acquisition, Z.X. All authors have read and agreed to the published version of the manuscript.
Funding
This research was funded by the National Natural Science Foundation of China: 52239003.
Institutional Review Board Statement
Not applicable.
Informed Consent Statement
Not applicable.
Data Availability Statement
The original contributions presented in the study are included in the article; further inquiries can be directed to the corresponding author.
Acknowledgments
We extend our sincere gratitude to the reviewers and editors for their valuable comments, as well as to all those who have supported this research.
Conflicts of Interest
The authors declare no conflicts of interest.
Abbreviations
| UPFR | urban pluvial flood resilience |
| VSR | vehicle stalling risk |
| BIR | building inundation risk |
| HIR | human instability risk |
References
- IPCC. Climate Change 2021: The Physical Science Basis. Contribution of Working Group I to the Sixth Assessment Report of the Intergovernmental Panel on Climate Change; Cambridge University Press: Cambridge, UK, 2021. [Google Scholar]
- Strauss, B.H.; Orton, P.M.; Bittermann, K.; Buchanan, M.K.; Gilford, D.M.; Kopp, R.E.; Kulp, S.; Massey, C.; Moel, H.D.; Vinogradov, S. Economic damages from Hurricane Sandy attributable to sea level rise caused by anthropogenic climate change. Nat. Commun. 2021, 12, 2720. [Google Scholar] [CrossRef]
- Devi, N.N.; Sridharan, B.; Kuiry, S.N. Impact of urban sprawl on future flooding in Chennai city, India. J. Hydrol. 2019, 574, 486–496. [Google Scholar] [CrossRef]
- Bao, S.; Yu, C.; Wan, Z. Spatial mismatch and attribution analysis of flood risk and resilience in megacities: Insights from a “risk-resilience-effect” framework and an interpretable XGBoost-SHAP model. Sustain. Cities Soc. 2025, 131, 106758. [Google Scholar] [CrossRef]
- United Nations Human Settlements Programme (UN-Habitat). The Value of Sustainable Urbanization: World Cities Report 2020; United Nations Human Settlements Programme: Nairobi, Kenya, 2020; Available online: https://unhabitat.org/sites/default/files/2020/10/wcr_2020_report.pdf (accessed on 15 September 2025).
- Tang, Z.; Wang, P.; Li, Y.; Chen, C.; Lou, Y.; Hu, T. Contributions of urbanization and population growth to changes in urban flood exposure in recent decades. Sustain. Cities Soc. 2025, 130, 106592. [Google Scholar] [CrossRef]
- Deopa, R.; Thakur, D.A.; Kumar, S.; Mohanty, M.P.; Asha, P. Discerning the dynamics of urbanization-climate change-flood risk nexus in densely populated urban mega cities: An appraisal of efficient flood management through spatiotemporal and geostatistical rainfall analysis and hydrodynamic modeling. Sci. Total Environ. 2024, 952, 175882. [Google Scholar] [CrossRef]
- Zang, Y.; Huang, J.; Wang, H. Dynamic impact assessment of urban floods on the compound spatial network of buildings-roads-emergency service facilities. Sci. Total Environ. 2024, 926, 172007. [Google Scholar] [CrossRef] [PubMed]
- Bertilsson, L.; Wiklund, K.; de Moura Tebaldi, I.; Rezende, O.M.; Veról, A.P.; Miguez, M.G. Urban flood resilience—A multi-criteria index to integrate flood resilience into urban planning. J. Hydrol. 2019, 573, 970–982. [Google Scholar] [CrossRef]
- Zhu, S.; Li, D.; Feng, H.; Zhang, N. The influencing factors and mechanisms for urban flood resilience in China: From the perspective of social-economic-natural complex ecosystem. Ecol. Indic. 2023, 147, 109959. [Google Scholar] [CrossRef]
- Rözer, V.; Mehryar, S.; Surminski, S. From managing risk to increasing resilience: A review on the development of urban flood resilience, its assessment and the implications for decision making. Environ. Res. Lett. 2022, 17, 123006. [Google Scholar] [CrossRef]
- Nguyen, H.N.; Fukuda, H.; Nguyen, M.N. Assessment of the susceptibility of urban flooding using GIS with an analytical hierarchy process in Hanoi, Vietnam. Sustainability 2024, 16, 3934. [Google Scholar] [CrossRef]
- Fu, C.; Fu, Y.; Xiao, C.; Deng, J.; Wang, L.; Pei, W. Analysis of urban waterlogging resilience based on MIKE FLOOD model in Yingtan city. Adv. Sci. Technol. Water Resour. 2022, 42, 33–39. (In Chinese) [Google Scholar]
- Fava, M.C.; de Macedo, M.B.; Buarque, A.C.S.; Saraiva, A.M.; Delbem, A.C.B.; Mendiondo, E.M. Linking urban floods to citizen science and low impact development in poorly gauged basins under climate changes for dynamic resilience evaluation. Water 2022, 14, 1467. [Google Scholar] [CrossRef]
- Cao, F.; Xu, X.; Zhang, C.; Kong, W. Evaluation of urban flood resilience and its space-time evolution: A case study of Zhejiang province, China. Ecol. Indic. 2023, 154, 110643. [Google Scholar] [CrossRef]
- Huang, X.; Wang, D. Urban flood resilience in a megacity context: Multidimensional assessment and spatial differentiation in Shenzhen. Sustainability 2025, 17, 7852. [Google Scholar] [CrossRef]
- Pastor-Escuredo, D.; Torres, Y.; Martínez-Torres, M.; Zufiria, P.J. Rapid Multi-Dimensional Impact Assessment of Floods. Sustainability 2020, 12, 4246. [Google Scholar] [CrossRef]
- Ahmad, S.; Peng, X.; Ashraf, A.; Yin, D.; Chen, Z.; Ahmed, R.; Israr, M.; Jia, H. Building resilient urban drainage systems by integrated flood risk index for evidence-based planning. J. Environ. Manag. 2025, 374, 124130. [Google Scholar] [CrossRef]
- Gao, Y.; Xu, M.; Zheng, H.; Liu, Y.; Xu, J. Modeling and application of urban waterlogging resilience assessment based on PSR-NES framework and analysis of driving mechanisms. Water Sci. Technol. 2024, 90, 1589–1614. [Google Scholar] [CrossRef]
- Liao, R.; Xu, Z.; Ye, C.; Zuo, B.; Xiang, D.; Shu, X. Parameters sensitivity analysis methods of strom water management model. J. Hydroelectr. Eng. 2022, 41, 11–21. (In Chinese) [Google Scholar]
- Shi, R.; Li, J.; Zhang, Y.; Chen, K.; Wang, H.; Wang, H. Analysis and experiences of the “23·7” fainfall-flood process in Liangshui River. Beijing Water 2024, 2, 7–12. (In Chinese) [Google Scholar]
- Liao, R.; Xu, Z.; Ye, C.; Shu, X.; Yang, D. Simulation of rainstrom waterlogging in Dahongmen drainage area based on SWMM and InfoWorks ICM models. Water Resour. Prot. 2023, 39, 109–117. (In Chinese) [Google Scholar]
- Luo, Y. Analysis and Optimization of Urban Flooding Control Measures in a Central District of the Pearl River Delta. Master’s Thesis, Guangzhou University, Guangzhou, China, 2025. (In Chinese). [Google Scholar]
- Zhang, H. Effect of Climate Change and Urbanization on Urban Flood and Waterlogging Disaster Risk in the Pearl River Delta. Ph.D. Dissertation, South China University of Technology, Guangzhou, China, 2019. (In Chinese). [Google Scholar]
- Liu, L. Assessment of Urban Waterlogging Risk Level and Optimization of Waterlogging Regulation and Storage Based on Scenario Simulation-Projection Pursuit Method. Ph.D. Dissertation, Chongqing Jiaotong University, Chongqing, China, 2024. (In Chinese). [Google Scholar]
- Chen, J. Research on Flood Disaster Risk Assessment Methods in Urbanized Areas Under Different Spatial Scales. Ph.D. Dissertation, South China University of Technology, Guangzhou, China, 2023. (In Chinese). [Google Scholar]
- DB11/T 969-2016; Standard of Rainstorm Runoff Calculation for Urban Storm Drainage System Planning and Design—Local Standard of Beijing. Beijing Municipal Commission of Planning and Land Resources Management; Beijing Municipal Bureau of Quality and Technical Supervision: Beijing, China, 2016. (In Chinese)
- Beijing Municipal Water Authority. Atlas of Rainstorms in Beijing Hydrology Manual; Beijing Municipal Water Authority: Beijing, China, 1999. (In Chinese) [Google Scholar]
- Beijing Municipal Water Authority. Beijing Hydrology Manual—Volume II: Flood; Beijing Municipal Water Authority: Beijing, China, 2005. (In Chinese) [Google Scholar]
- Zheng, J. Research on the Assessments of Urban Flood Resilience and Flood Risk at Different Spatial Scales. Ph.D. Dissertation, South China University of Technology, Guangzhou, China, 2024. (In Chinese). [Google Scholar]
- Wang, Y.; Meng, F.; Liu, H.; Zhang, C.; Fu, G. Assessing catchment scale flood resilience of urban areas using a grid cell based metric. Water Res. 2019, 163, 114852. [Google Scholar] [CrossRef]
- Zheng, J.; Li, J.; Zeng, J.; Huang, G.; Chen, W. Application of a time-dependent performance-based resilience metric to establish the potential of coupled green-grey infrastructure in urban flood management. Sustain. Cities Soc. 2024, 112, 105608. [Google Scholar] [CrossRef]
- Dai, X.; Huang, H.; Yu, F.; Wu, A.; Shi, D.; Zhang, P. Research on community resilience stress testing method under rainstrom waterlogging disaster. J. Tsinghua Univ. (Sci. Technol.) 2024, 64, 1587–1596. (In Chinese) [Google Scholar]
- Zhou, H.; Zhao, X.; Zheng, J. Dynamic flood risk mapping for hill urban area based on full hydrodynamic modeling and system performance curves. J. Catastrophol. 2025, 40, 32–38. (In Chinese) [Google Scholar]
- Beijing Institute of Water Science and Technology. Beijing releases the first urban waterlogging risk map. Beijing Water 2022, 5, 12. (In Chinese) [Google Scholar]
- Yang, Q.; Zhang, S.; Dai, Q.; Yao, R. Assessment of community vulnerability to different types of urban floods: A case for Lishui city, China. Sustainability 2020, 12, 7865. [Google Scholar] [CrossRef]
- Li, Y.; Li, H.; Han, Y.; Huang, T.; Wang, Q.; Wang, X. Impact analysis of urban super-standard flood disasters based on MIKE+. Nat. Hazards 2025, 121, 15949–15963. [Google Scholar] [CrossRef]
- Wu, Y.; Yu, G.; Shao, Q. Resilience benefit assessment for multi-scale urban flood control programs. J. Hydrol. 2022, 613, 128349. [Google Scholar] [CrossRef]
- Liao, R.; Xu, Z.; Ye, C.; Shu, X.; Huang, Y.; Jia, S. Study on the runoff regulation effects of typical low impact development facilities in multi-scale regions. Water Resour. Hydropower Eng. 2025, 56, 61–75. (In Chinese) [Google Scholar]
- Zhang, J.; Zhang, H.; Li, X.; Yang, Y. Risk analysis of pipeline drainage capacity at typical time of urban rainstorm waterlogging process. Nat. Hazards 2025, 121, 20193–20215. [Google Scholar] [CrossRef]
- Wan, Y.; Li, M.; Zhang, N.; Li, Y.; Huang, P.; Zhang, H.; Huang, H.; Wei, W.; Zhu, S. Overflow Simulation and Optimization of a Drainage System in an Urban Area in the Northern Anhui Plain. Water 2024, 16, 1781. [Google Scholar] [CrossRef]
- Bibi, T.S.; Reddythta, D.; Kebebew, A.S. Assessment of the drainage systems performance in response to future scenarios and flood mitigation measures using stormwater management model. City Environ. Interact. 2023, 19, 100111. [Google Scholar] [CrossRef]
- Bartos, M.; Kerkez, B. Hydrograph Peak-Shaving Using a graph-theoretic algorithm for placement of hydraulic control structures. Adv. Water Resour. 2019, 127, 167–179. [Google Scholar] [CrossRef]
- Pregnolato, M.; Ford, A.; Wilkinson, S.M.; Dawson, R.J. The impact of flooding on road transport: A depth-disruption function. Transp. Res. Part D Transp. Environ. 2017, 55, 67–81. [Google Scholar] [CrossRef]
- Wang, N.; Hou, J.; Du, Y.; Jing, H.; Wang, T.; Xia, J.; Gong, J.; Huang, M. A Dynamic, Convenient and Accurate Method for Assessing the Flood Risk of People and Vehicle. Sci. Total Environ. 2021, 797, 149036. [Google Scholar] [CrossRef]
- Li, Q.; Xia, J.; Xu, Z.; Liang, D.; Hinkelmann, R. Agent-based vulnerability model for pedestrians exposed to urban floodwaters. J. Hydrol. 2025, 662, 134058. [Google Scholar] [CrossRef]
- Liu, S.; Zhu, Z.; Wu, W.; Peng, D.; Zhang, D. Effects of building configuration and upstream buildings on pedestrian risk around ideal buildings in a floodwater-wind joint environment. J. Hydrol. 2024, 642, 131865. [Google Scholar] [CrossRef]
- Chen, Z.; Huang, G. Numerical simulation study on the effect of underground drainage pipe network in typical urban flood. J. Hydrol. 2024, 638, 131481. [Google Scholar] [CrossRef]
- Qiu, J.; Cheng, L.; Zhou, C.; Wu, K.; Zhou, L.; Yang, Y.; Liu, P.; Xia, J. High-efficient urban waterlogging simulation based on coupled SWMM–SIMWE hydrological-hydrodynamic model. Water Resour. Prot. 2025. Available online: https://oversea.cnki.net/KCMS/detail/detail.aspx?dbcode=CAPJ&dbname=CAPJLAST&filename=SZYB2025081400A&uniplatform=OVERSEA&v=7jixFnUuk0wxYH_i-Ge_UZ7rtGTNOF-yPzhAiQrx92lpFm2qpFagEFhhsyBwJeHY (accessed on 5 November 2025). (In Chinese).
- Ma, S.; Zayed, T.; Xing, J.; Shao, Y. A state-of-the-art review for the prediction of overflow in urban sewer systems. J. Clean. Prod. 2024, 434, 139923. [Google Scholar] [CrossRef]
- Jiang, A.-L.; Hsu, K.; Sanders, B.F.; Sorooshian, S. Topographic hydro-conditioning to resolve surface depression storage and ponding in a fully distributed hydrologic model. Adv. Water Resour. 2023, 176, 104449. [Google Scholar] [CrossRef] [PubMed]
- Haghbin, S.; Mahjouri, N. Quantifying and improving flood resilience of urban drainage systems based on socio-ecological criteria. J. Environ. Manag. 2023, 339, 117799. [Google Scholar] [CrossRef]
- Cheng, S.; Yang, M.; Li, C.; Xu, H.; Chen, C.; Shu, D.; Jiang, Y.; Gui, Y.; Dong, N. An improved coupled hydrologic-hydrodynamic model for urban flood simulations under varied scenarios. Water Resour. Manag. 2024, 38, 5523–5539. [Google Scholar] [CrossRef]
- Su, X.; Wang, L.; Li, L.; Li, X.; Wang, Y.; Liu, Y.; Hu, Q. Assessing watershed flood resilience based on a grid-scale system performance curve that considers double thresholds. Sustainability 2024, 16, 9101. [Google Scholar] [CrossRef]
- Hossain Anni, A.; Cohen, S.; Praskievicz, S. Sensitivity of urban flood simulations to stormwater infrastructure and soil infiltration. J. Hydrol. 2020, 588, 125028. [Google Scholar] [CrossRef]
- Koucka, M.; Poor, C.; Wolfand, J.; Chang, H.; Shandas, V.; Aiona, A.; Stevens, H.; Kurtz, T.; Hedin, S.; Fancher, S.; et al. The first thirty years of green stormwater infrastructure in Portland, Oregon. Sustainability 2025, 17, 7159. [Google Scholar] [CrossRef]
- Park, S.; Kim, J.; Yun, H.; Kang, J. Exploring the network structure of coupled green-grey infrastructure to enhance urban pluvial flood resilience: A scenario-based approach focusing on ‘centralized’ and ‘decentralized’ structures. J. Environ. Manag. 2024, 370, 122344. [Google Scholar] [CrossRef] [PubMed]
- Zheng, J.; Huang, G. A novel grid cell-based urban flood resilience metric considering water velocity and duration of system performance being impacted. J. Hydrol. 2023, 617, 128911. [Google Scholar] [CrossRef]
- Wang, Y.; Zhang, C.; Chen, A.S.; Wang, G.; Fu, G. Exploring the relationship between urban flood risk and resilience at a high-resolution grid cell scale. Sci. Total Environ. 2023, 893, 164852. [Google Scholar] [CrossRef] [PubMed]
Disclaimer/Publisher’s Note: The statements, opinions and data contained in all publications are solely those of the individual author(s) and contributor(s) and not of MDPI and/or the editor(s). MDPI and/or the editor(s) disclaim responsibility for any injury to people or property resulting from any ideas, methods, instructions or products referred to in the content. |
© 2025 by the authors. Licensee MDPI, Basel, Switzerland. This article is an open access article distributed under the terms and conditions of the Creative Commons Attribution (CC BY) license (https://creativecommons.org/licenses/by/4.0/).