Abstract
Vertical-Axis Wind Turbines (VAWTs) are efficient solutions for renewable energy generation, especially in regions with variable wind conditions. This study presents an optimized design of a small-scale H-type VAWT through the integration of Design of Experiments (DOE) and Computational Fluid Dynamics (CFD), using a fractional factorial 2k−p approach to evaluate the influence of geometric and operational parameters on power output and power coefficient (Cp), which ranged from 0.15 to 0.35. The research began with a comprehensive assessment of renewable resources in Isla Fuerte, Colombia. Solar analysis revealed an average of 5.13 Peak Sun Hours (PSHs), supporting the existing 175 kWp photovoltaic system. Wind modeling, based on meteorological data and Weibull distribution, showed speeds between 2.79 m/s and 5.36 m/s, predominantly from northeast to northwest. Under these conditions, the NACA S1046 airfoil was selected for its aerodynamic suitability. The turbine achieved power outputs from 0.46 W to 37.59 W, with stabilization times analyzed to assess dynamic performance. This initiative promotes environmental sustainability by reducing reliance on Diesel Generators (DGs) and empowering local communities through participatory design and technical training. The DOE-CFD methodology offers a replicable model for energy transition in insular regions of developing countries, linking technical innovation with social development and education.
1. Introduction
Currently, growing concerns about environmental sustainability and the preservation of natural resources have driven interest in the development of innovative methods for sizing and evaluating energy capture technologies [1]. This trend reflects the urgent need to identify alternatives that are not only energy-efficient but also minimize the environmental impact associated with traditional generation methods. In this context, government policies have played a crucial role in promoting the transition toward renewable energy sources, such as wind power, which is widely recognized as one of the most effective strategies for encouraging the rational and responsible use of energy resources [2]. The adoption of wind energy not only contributes to the diversification of the energy matrix but also supports the reduction of greenhouse gas emissions, aligning with international commitments to mitigate climate change.
In island communities like Isla Fuerte, the Educational Institution of Isla Fuerte stands as a vital pillar for the development of a population that, despite its rich natural and cultural heritage, faces significant challenges in accessing basic services and achieving sustainability. The island’s geographic isolation, combined with its socioeconomic conditions, limits access to reliable electricity, directly impacting the quality of education. The lack of continuous power restricts the use of technological tools in classrooms, shortens study hours, and compromises the preservation of food and medicine. This situation hinders progress toward several Sustainable Development Goals (SDGs), particularly SDG 7 (affordable and clean energy), SDG 4 (quality education), and SDG 10 (reduced inequalities) [3,4]. Currently, Isla Fuerte relies heavily on costly diesel-powered generators. A polluting and inefficient energy source. This dependence constrains development opportunities and threatens the well-being of its residents. Therefore, a transition to clean and sustainable energy sources is urgently needed. Thanks to its privileged location, Isla Fuerte has high potential for harnessing renewable energy, especially solar and wind power. The installation of small-scale VAWTs, supported by prior CFD studies, would enable the Educational Center to access a continuous, clean, and self-sufficient energy source. This would significantly improve teaching conditions and reduce reliance on fossil fuels.
CFD is a crucial field in everyday life, as it enables the selection of fittings, materials, and various components, facilitating the modeling of a wide range of systems and leading to significant resource savings [5,6]. Moreover, analytical and experimental physical methods can lead to increased costs due to the extensive use of resources and time required for analyzing systems governed by fluid mechanics. In the field of VAWTs research, Wisniewski et al. [7] demonstrated that vertically dividing the rotor into two levels can significantly reduce bending moments, thereby extending the operational lifespan of industrial-scale turbines. Wang and Ferng [8] complement this perspective by showing how CFD simulations can simultaneously optimize aerodynamic performance and noise mitigation in small-scale VAWTs. Sadman and Todd [9] delve into the aerodynamic design of large-scale Darrieus turbines, highlighting how variables such as blade number and aspect ratio influence both energy production and structural loading. Zamre and Lutz [10] reinforce the importance of urban context by revealing that rooftop placement can enhance the performance of H-type Darrieus VAWT (H-VAWTs) due to favorable interactions with turbulent flows, as captured through advanced CFD techniques. Therefore, these studies underscore the critical role of CFD simulations and experimental validation in accurately assessing the energy and fluid dynamic behavior of VAWTs; the implementation of statistical techniques aimed at optimizing the use of essential resources offers a significant advantage before the quotation of materials, the fabrication of equipment, and even the purchase of prefabricated components [11]. In studies conducted by Attie et al. [12], the performance of an H-VAWTs was optimized by incorporating a single slotted trailing edge flap on the blade to improve turbine efficiency and reduce development time, then CFD and DOE methodologies were applied simultaneously in order to achieve system optimization, which resulted in an improved design for the H-VAWT.
On the other hand, in the research conducted by Shen et al., 2024 [13], a multi-objective particle swarm optimization algorithm was developed to improve the Cp and reduce the maximum instantaneous Moment coefficient (Cm) of a double Darrieus VAWT system. Their study highlights the importance of combining statistical DOE techniques with CFD to optimize systems involving VAWTs. The combined use of statistical methods, specifically DOE and advanced CFD techniques, such as moving mesh domains and rigid body modeling, allows for a more efficient allocation of resources and improves the effectiveness of developing a customized VAWT system [14]. This study introduces the following novelties: the integration of DOE and CFD to optimize the geometry and aerodynamic performance of a VAWT under varying wind and design conditions, the development of a renewable energy model specifically tailored to the environmental and energy needs of Isla Fuerte, and an interdisciplinary approach that connects engineering research with social development and educational enhancement. By focusing on the energy needs of the island community and its local educational institution, this study contributes not only to applied engineering but also to sustainability studies, offering a replicable framework for energy transition in vulnerable coastal regions.
2. Materials and Methods
2.1. Island Community
Isla Fuerte is located in the department of Bolívar, in the Colombian Caribbean, at latitude 09°22′60″ N, longitude 76°10′40″ W, and an elevation of 1 m above sea level. It is home to an estimated population of approximately 2500 residents, with an average of more than 3.7 individuals per household, according to data from the National Administrative Department of Statistics (DANE), as illustrated in Figure 1.
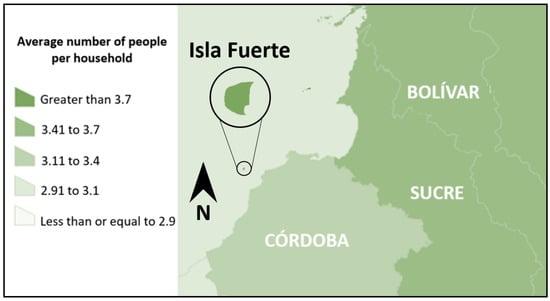
Figure 1.
Inhabitants per household for Isla Fuerte—Bolívar.
Despite its rich natural and cultural heritage, the island faces serious limitations in access to basic services, particularly electricity. Currently, the energy supply in Isla Fuerte is outsourced and provides only 3 to 12 h of electricity per day, as reported by Colombia’s National Monitoring Center (CNM). This limited availability significantly restricts the community’s daily, educational, and productive activities.
The island’s energy infrastructure consists of a poly-generation system that includes Photovoltaic Solar Panels (PSP) with an installed capacity of 175 kWp, complemented by two DGs of 400 kW each, manufactured by Cummins. The system also includes a battery bank of 432 units, each with a capacity of 3850 Ah at 2 V, as shown in Figure 2. While this setup allows for some energy storage, it remains insufficient to meet the population’s continuous demand.
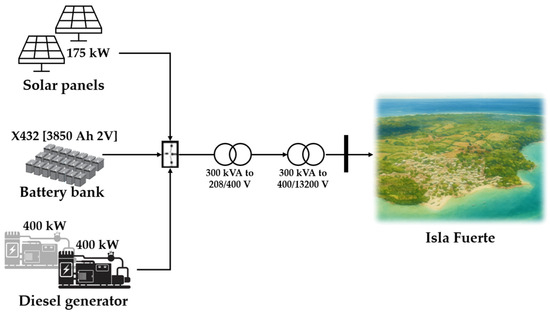
Figure 2.
Energy scheme of the Isla Fuerte community.
This situation critically affects institutions such as the Isla Fuerte Educational Institution, which depends on the island’s energy supply for essential services. The limited availability of electricity hinders the use of educational technologies, the preservation of food in school cafeterias, access to potable water through electric pumping systems, and digital connectivity, thereby deepening educational and social disparities.
Regarding the SDGs, SDG 7 (Affordable and Clean Energy) highlights the need for Isla Fuerte to transition toward more sustainable, reliable, and continuous energy systems. Improving energy storage and reducing dependence on diesel are key steps to ensuring universal access to clean energy. SDG 4 (Quality Education) emphasizes that the lack of electricity limits school operations, prevents the use of digital tools, and negatively impacts learning quality. Ensuring a stable energy supply is essential to improving educational conditions, especially in insular regions like Isla Fuerte. SDG 10 (Reduced Inequalities) underscores that island communities face structural inequalities in accessing basic services. Enhancing the energy infrastructure in Isla Fuerte and its associated institutions would help bridge social, economic, and educational gaps, promoting more equitable inclusion.
2.2. Renewable Energy Potential on Isla Fuerte
This insular region shows significant renewable energy potential, mainly from solar resources, followed by wind energy. Currently, Isla Fuerte’s energy infrastructure includes photovoltaic systems; however, the installed capacity does not achieve the desired level of energy independence. As a result, the use of DGs remains necessary, mainly to prolong the lifespan of battery storage systems. Improving the energy infrastructure by expanding photovoltaic systems or integrating wind energy technologies would greatly enhance the island’s energy independence. Such improvements would also support the transition to clean energy, in line with national government policies on energy transition and decarbonization. The renewable energy potential of this insular zone is assessed using historical telemetry data from meteorological stations provided by the governmental agency Institute of Hydrology, Meteorology and Environmental Studies (IDEAM), and cross-checked with the Prediction of Worldwide Energy Resources (POWER) database developed by NASA. The estimation of available solar radiation and PSHs was performed using the Bird and Hulstrom atmospheric transmittance model [15]. The results of this analysis are shown in Figure 3 and Figure 4, covering the period from 2019 to 2024.
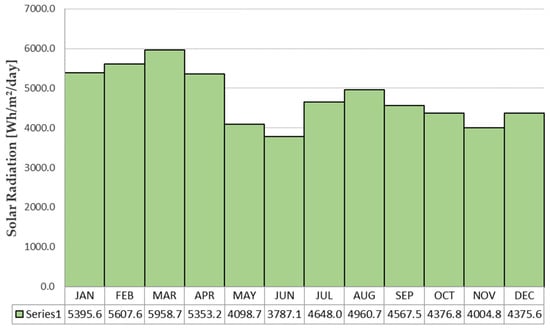
Figure 3.
Annual solar radiation on Isla Fuerte.
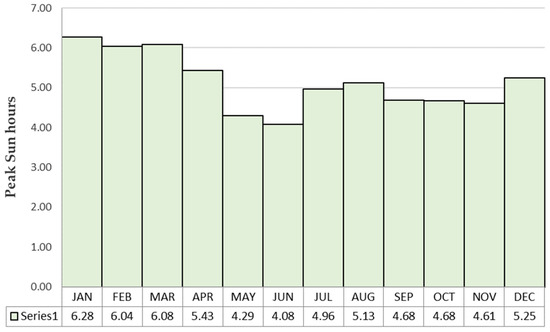
Figure 4.
Annual peak sun hours on Isla Fuerte.
It is notable that the solar potential in this region is highly exploitable, with an average daily solar irradiance of 4764.5 Wh/m2/day, corresponding to an average of 5.13 PSHs per day. This presents a promising opportunity to expand photovoltaic systems within Isla Fuerte’s energy infrastructure. However, increasing photovoltaic capacity also requires expanding battery storage systems, as the effective operation of solar systems depends on daily PSHs. This highlights the importance of diversifying the energy mix by incorporating wind energy systems, which can operate continuously throughout the day. To do this, it is vital to quantify the available wind potential through detailed wind analysis, including the evaluation of wind direction, the frequency of specific wind speeds per direction, and applying statistical models such as Weibull, Rayleigh, Normal, and Gamma distributions, which are commonly used in wind resource assessment [16].
Figure 5 below shows the wind direction patterns throughout the year, based on data from 2019 to 2024 for the insular region. The analysis indicates that the most common wind direction is toward the north. However, a wide variety of wind directions is also observed in the study area, reflecting a variable wind field. This variability supports the use of VAWTs, since these systems can capture wind energy from any direction without needing precise positioning or tracking. This makes VAWTs especially suitable for regions with changing wind directions, such as Isla Fuerte.
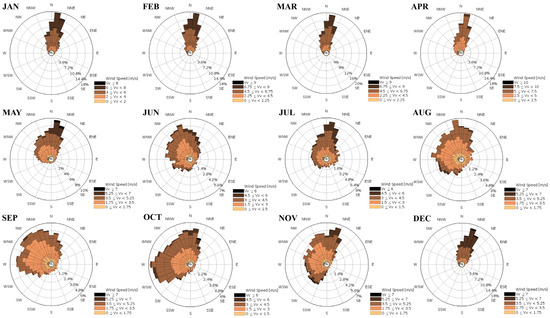
Figure 5.
Monthly Behavior of Annual Wind Roses on Isla Fuerte.
By mapping the annualized wind rose behavior into a single chart, as shown in Figure 6, a broad range of wind speeds between 2.5 and 5 m/s can be observed across all cardinal directions, with greater intensity from West-Northwest (WNW) to East-Northeast (ENE). Additionally, a distinct group of wind speeds ranging from 5 to 7.5 m/s appears with a higher frequency in the North-Northwest (NNW) to North-Northeast (NNE) direction.
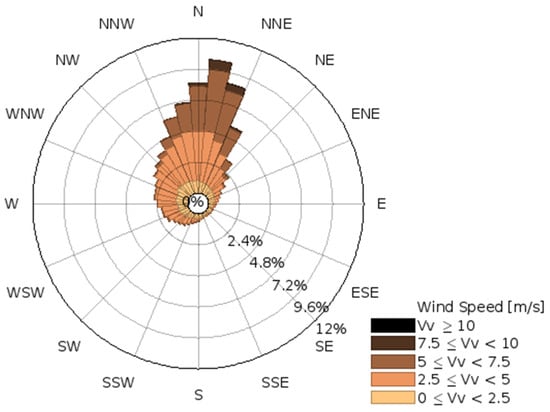
Figure 6.
Behavior of annual wind roses on Isla Fuerte.
Figure 7 presents the annual average wind speeds calculated for the insular region. The lowest monthly average wind speed was recorded in September, with a value of 2.79 m/s, while the highest occurred in February, reaching 5.36 m/s. The overall annual average wind speed for the period analyzed is 3.75 m/s.
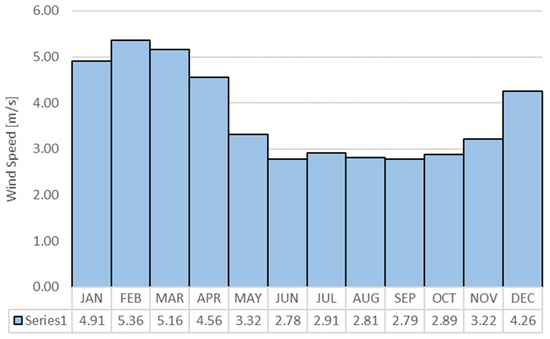
Figure 7.
Average monthly wind speed values on Isla Fuerte.
The wind speed behavior observed in the insular region of Isla Fuerte highlights several key characteristics: varying observation points, diverse wind directions, high variability in wind speed recurrence depending on direction, as well as monthly and annual average values, and a range of speeds from nearly stagnant to exceeding 10 m/s. However, accurately analyzing the probability of wind speed recurrence requires statistical frequency distribution models.
Therefore, Figure 8 presents a frequency histogram overlaid with probability density functions based on Weibull, Rayleigh, Normal, and Gamma distributions. The chart indicates that the most common wind speeds range from 2 to 5 m/s, following a pattern close to a normal distribution, with the Weibull distribution showing a most probable wind speed of 3.37 m/s, a key reference for wind energy studies. These normally distributed ranges will serve as design parameters for the subsequent analysis of VAWTs.
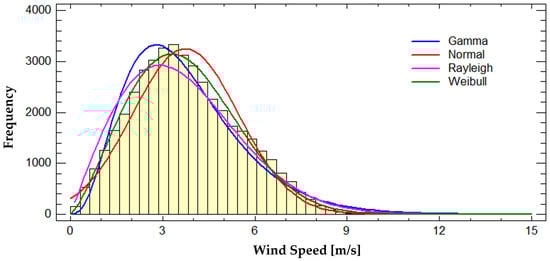
Figure 8.
Frequency Histogram and Probability Distribution of Wind Speed on Isla Fuerte.
2.3. VAWT Type Selection
VAWTs are essential tools for generating electricity from renewable energy sources. Their design makes them particularly suitable for environments with high variability in wind direction. This is unlike Horizontal Axis Wind Turbines (HAWTs), which typically operate under more stable wind conditions.
Through Computational Fluid Dynamics (CFD) simulations, advanced technological tools enable the modeling and analysis of energy performance and electricity generation. These simulations allow for the parametrization of process variables and the statistical evaluation of results. Moreover, CFD facilitates design optimization by reducing material costs and minimizing aerodynamic drag, ultimately contributing to more efficient and cost-effective turbine configurations.
For the purpose of this study, two types of VAWTs were selected: a straight-blade H-VAWT and the helical-blade Turby VAWT (T-VAWT), as shown in Figure 9. These models represent different rotor geometries—straight and helical blades—allowing for comparative analysis in the design phase.
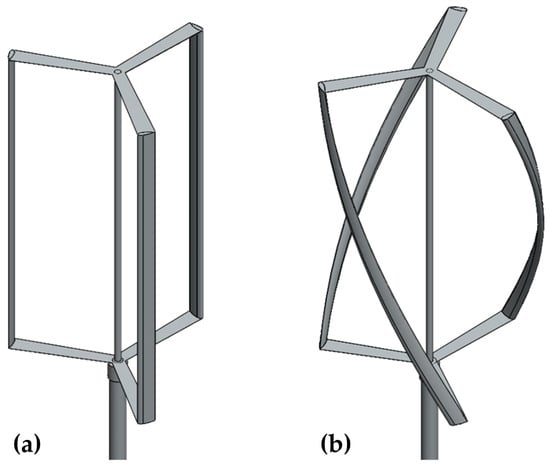
Figure 9.
(a) H-VAWT with straight blade, (b) T-VAWT with helical blade.
It is important to highlight that both types of VAWTs are well-suited for urban or constrained environments and are capable of operating efficiently under moderate wind conditions, which aligns with the characteristics observed in the case study area of Isla Fuerte.
2.4. Selecting the NACA Profile for the VAWT Model
For the previously selected VAWT model, an airfoil from the NACA family has been chosen for the blades, as these profiles are widely used in Darrieus-type turbines due to their strong aerodynamic performance and ease of manufacturing. Before selecting the most suitable airfoil, a comparative analysis was conducted to evaluate the behavior of several NACA series profiles. This study considered two well-known symmetric profiles, NACA 0012 and NACA 0018, as well as the cambered profile NACA 4412. Additionally, the modified symmetric profile NACA S1046, specifically designed for Darrieus turbine applications, was included in the analysis. These profiles are illustrated in Figure 10, shown below.
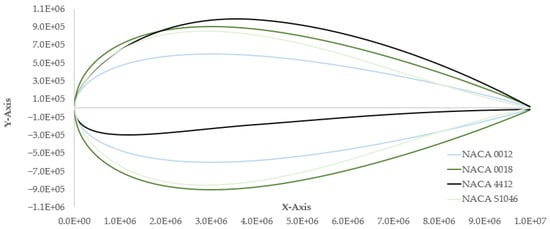
Figure 10.
The NACA profile for the VAWT model.
Based on the selected NACA blade profiles, the following section presents the behavior of the lift coefficients (Cl) in relation to the drag coefficients (Cd), as a function of the blade’s angle of attack (α) for each of the analyzed profiles. The Cl/Cd ratio, commonly referred to as aerodynamic efficiency (AEf), is a key parameter in wind turbine design. A higher numerical value of this ratio indicates a greater ability to generate useful aerodynamic force with less resistance, which translates into higher power output from the turbine. However, in the case of the rotational motion of a VAWT, this ratio should remain relatively consistent for both positive and negative angles of attack. Significant variations across these ranges can lead to operational instability, negatively impacting the turbine’s performance and durability.
Figure 11 above presents the AEf of the selected NACA profiles, based on Reynolds numbers corresponding to wind speeds ranging from 2 m/s to 8 m/s. This range was established according to wind studies conducted for the insular region of Isla Fuerte.
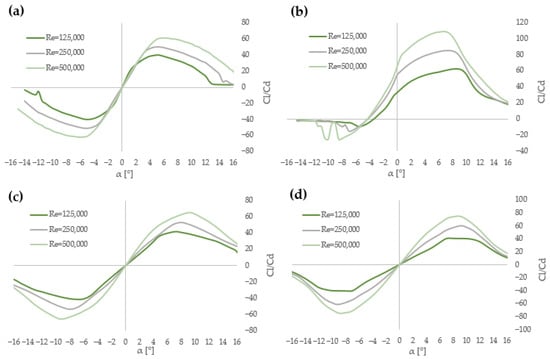
Figure 11.
Aerodynamic efficiency (a) NACA 0012, (b) NACA 4412, (c) NACA 0018, (d) NACA S1046.
As shown in Figure 11b, the NACA 4412 profile exhibits higher AEf compared to the other profiles. However, its AEf drops to nearly zero at negative angles of attack beyond −4°, making it a highly unstable option for VAWTs. In contrast, the profiles NACA 0012, NACA 0018, and NACA S1046 demonstrate fully symmetric AEf behavior for both positive and negative angles of attack. This symmetry makes them highly suitable for VAWT applications, as it ensures stable performance throughout the rotational cycle [17]. Additionally, their symmetric geometry simplifies the manufacturing process. Among these profiles, NACA S1046 stands out by offering the highest AEf values, especially at angles of attack of up to 10°, making it the most advantageous choice for maximizing energy capture in VAWTs systems.
Figure 12 above illustrates the behavior of the Cm as a function of the α for the NACA profiles analyzed. The Cm is a critical parameter in wind energy studies, as it reflects the tendency of an airfoil to generate torque around its axis. In the context of VAWTs, this value directly affects the rotational stability of the system and the efficiency of energy conversion. For VAWT applications, the most suitable Cm values are those that remain relatively low and stable across a wide range of positive and negative α. This aerodynamic stability helps ensure smoother turbine operation, reducing vibrations and mechanical stresses that could compromise performance and durability.
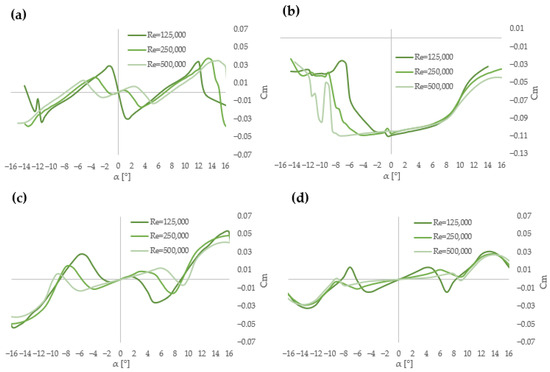
Figure 12.
Moment coefficients (a) NACA 0012, (b) NACA 4412, (c) NACA 0018, (d) NACA S1046.
From Figure 12, it is evident that the symmetric profiles NACA 0012, NACA 0018, and NACA S1016 exhibit a relatively low and consistent Cm behavior across both positive and negative α values, making them well-suited for VAWT applications. Notably, the NACA S1046 profile demonstrates an even more favorable performance, with a more stable and lower Cm compared to the other symmetric profiles. In contrast, the NACA 4412 profile shows significant instability, making it unsuitable for use in VAWTs.
Based on the analysis of the NACA profiles studied in this research, the NACA S1046 profile has been selected due to its favorable aerodynamic performance. This profile will be used to develop the initial design, which will be evaluated through CFD analysis. To optimize resources and improve the efficiency of the evaluation process, DOE statistical techniques will be applied.
2.5. Statistical Treatment by DOE
DOE is a structured method used to analyze the effect of design variables on output responses, with the goal of optimizing the system and predicting its behavior. The technique chosen depends on the system characteristics, time and cost constraints, and the designer’s expertise. One such technique is the Fractional Factorial Experimental Design (FFED) [18,19], which efficiently evaluates the main factors and their interactions by reducing the number of experimental runs while preserving the significant effects in the analysis.
Five factors are considered for the VAWT system to be studied, for the wind potential conditions previously analyzed, each with two-level variations: two discontinuous variables and three continuous variables. The selected factors cover a wind speed range from 2 to 5 m/s, reflecting the insular wind conditions observed in Isla Fuerte. The turbine axis height varies from 0.8 m to 1.6 m, and the rotor diameter ranges from 0.5 m to 1 m, aligning with typical commercial design standards. Additionally, the number of blades is set between 3 and 4, and the blade type is categorized as either straight (denoted as −1) or helical (denoted as 1). Once the most effective turbine type was established, specialized simulation software was utilized to create a geometric and inertial turbine model. The subsequent phase involves setting up the boundary conditions and analyzing the fluid dynamic response of the system using CFD modeling. This research process includes developing a methodology for VAWT system simulation using CFD tools and DOE design approaches to achieve results. The factors and their levels are presented in Table 1 below.

Table 1.
Factors and levels to be treated.
A range of small geometric sizes was selected to ensure optimal performance of the CFD simulation tool while minimizing computational resource usage. This research aims to verify the impact of the selected factors on the power output and performance of the VAWT.
With the full factorial design 2k, a total of 2k−1 effects, including all two-way interactions, can be studied:
As shown in Table 2 above, a Full Factorial Design (FFD) with 2 levels and 5 factors, 25, results in a total of 32 experimental runs to evaluate 31 effects. Among these, 15 are considered significant non-ignorable effects. However, conducting 32 experiments demands considerable resources, which is why the FFED method is used to reduce the number of experimental trials. By applying a 25−1 model, the number of runs is reduced to 16. In this case, a 24 FFD still captures the same 15 effects as the 25 FFD non-ignorable effects, as derived from the application of Equation (1). Therefore, using a 2k−p fractional factorial design model is appropriate for this research.
Table 2.
Effects in full factorial designs.
The treatment route to be developed to obtain the response power and Cp variables in simulations for a VAWT is then presented in Table 3.
Table 3.
Treatment route for feed.
2.6. CFD Method
To initiate the simulation process based on the previously defined experimental path, it is necessary to design the VAWT model to be simulated. A small-scale VAWT was selected, using a NACA S1046 blade profile, which has been applied in previous studies for the design of this type of turbine [20], and justified in the previous AEf analysis. Figure 13 shows the T-VAWT model configured according to the experimental factors, using steel for the main structure, which includes the shaft and side supports, and fiberglass for the blades.
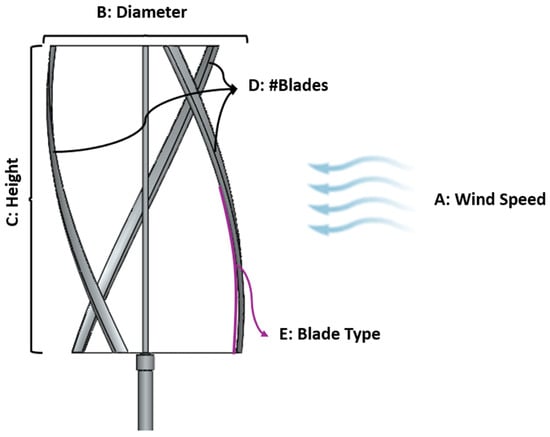
Figure 13.
T-VAWT system configuration for experimental factors.
The CFD simulation strategy is carried out starting with the import of the geometry according to the treatment conditions specified in Table 3, followed by the generation of the volumetric mesh for the system domains, the assignment of boundary conditions, the application of solution methods, and subsequently, the post-processing stage to obtain the results. See Figure 14.
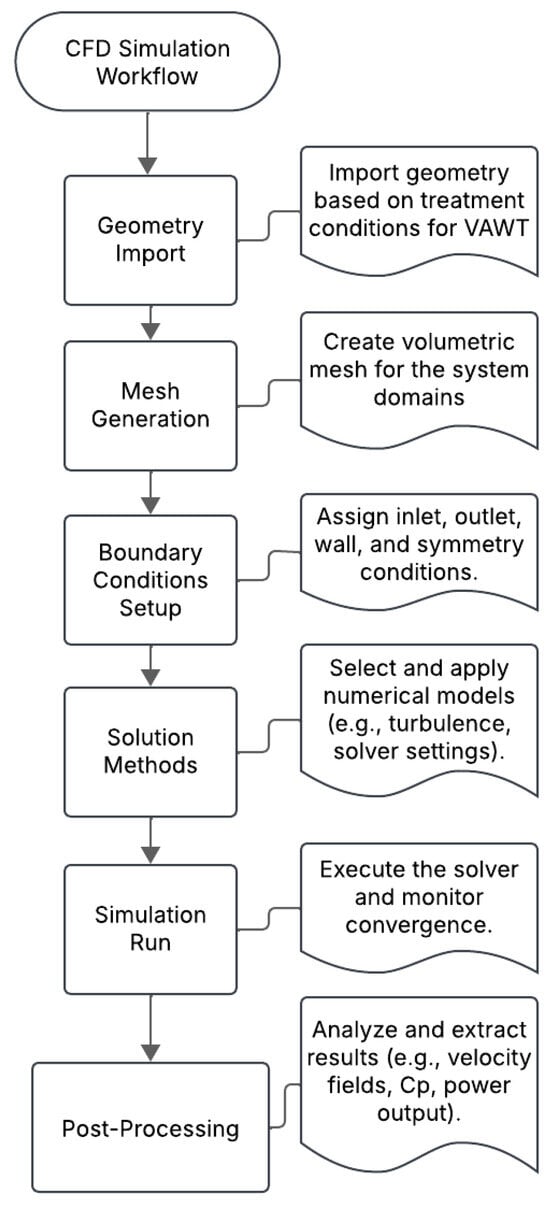
Figure 14.
CFD simulation strategy.
Figure 15 presents the boundary conditions and the assignment of the volumetric mesh in the VAWT.
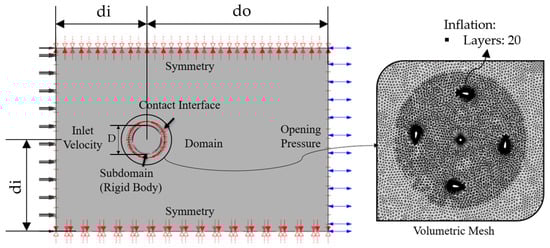
Figure 15.
Boundary conditions and volumetric mesh of the system.
Figure 15 illustrates the main conditions regarding the size of the computational domain to be simulated. The distances di and do have been extensively studied in previous research, which focused on achieving high accuracy in the results, particularly when the variation of Cp with respect to the azimuthal angle (the turbine’s rotational angle) becomes negligible in a VAWT [21,22,23].
Lisowski and Augustin [21] reported that when di = 5D and do = 10D, the variation in Cp due to domain size becomes negligible. Rezaeiha et al. [22] highlighted that the variation in Cp is less than 1% when do ranges from 10D to 20D. Furthermore, Rezaeiha et al. [23] found that using di = 2.5D in the computational domain can lead to approximately 6% differences in Cp.
Based on the findings of these studies, the present research analyzes the behavior of Cp once the VAWT reaches a stabilized state over time. Since two rotor diameters are considered across the 16 treatments analyzed, independence tests were conducted for the smallest turbine (0.5 m diameter) under the highest wind demand (T14), and for the largest turbine (T16) with a diameter of 1 m.
For turbine T14, tests were performed using di values of 6D and 20D, and do set to 20D. In this configuration, no significant variations were observed in the results. For turbine T16, di values of 3D, 5D, and 10D were tested, with do fixed at 10D. Mesh independence was confirmed by ensuring that Y+ < 1, indicating adequate boundary layer resolution and stability. Additionally, time step independence was evaluated by varying the time step between 0.001 s and 0.01 s, as detailed in Table 4. It was also noted that from the fifth revolution onward, the average Cp value remained stable, showing no significant fluctuations.
Table 4.
Mesh independence tests for treatment T16.
The k-ω Shear stress transport turbulence model is selected. This is an empirical model based on transport equations for turbulent kinetic energy (k) and specific dissipation rate (ω). It is commonly used in engineering practice for time-dependent flow calculations due to its robustness, computational efficiency, and reasonable accuracy across a wide range of turbulent flows. Additionally, it is a semi-empirical model, with the derivation of its governing equations based on phenomenological insights and empirical data. When combined with shear stress transport, the definition of turbulent viscosity is modified to account for the Shear stress transport [24,25,26].
Below are Equations (2) and (3), implemented for the selected turbulence model [27].
where the fluid density is represented by , the fluid velocity is symbolized by u, and x refers to the spatial coordinate. The generation of turbulent kinetic energy is indicated by Gk, while its dissipation is expressed by Yk. Additionally, user-defined source terms for k may be included, designated as Sk, with Γk representing the effective diffusivity of k. Similarly, the generation of the turbulent dissipation rate is captured by Gω, and its dissipation is noted as Yω. The corresponding user-defined source terms for ω are denoted by Sω, while Γω refers to the effective diffusivity of ω.
The Rigid Body Model (RBM) is also employed to simulate the motion of an object as a solid, undeformable entity under the action of external forces, without accounting for internal deformations. This approach is particularly useful in fluid–structure interaction simulations, turbomachinery, or rotating systems such as VAWTs, where the objective is to analyze the dynamic behavior of the object without solving the full structural mechanics. The models used are presented in Equations (4)–(13) below [28].
where the variables x, y, and z represent the position coordinates of a body in three-dimensional space, defining its location relative to a reference frame. The symbol P denotes the linear momentum, F represents the net force acting on an object, t denotes time. The variable π is used to represent the angular momentum of a body; m refers to the torque, which causes changes in its angular motion. The I variable stands for the moment of inertia, representing the distribution of mass relative to the axis of rotation and influencing the resistance to angular acceleration. The angle θ describes the rotational displacement of the body, the angular velocity, and the angular acceleration. The subscript G is used to denote quantities that are specifically referenced to the center of mass of the object, such as position or torque about the center of mass.
The primary objective of the CFD analysis is to model the behavior of a VAWT by varying its geometric characteristics and wind conditions, while maintaining consistent operational parameters. The aim is to determine which design configurations yield the highest Cp and power output. The computational domain size and meshing properties are detailed below.
Blade and Shaft Meshing: Boundary layer with smooth transition; the first layer thickness was 0.01 mm, a maximum of 20 layers, and a growth rate of 1.1.
Global Mesh Settings: The mesh type used in this study was based on a medium-quality mesh, supported by the findings of Lisowski and Augustin [21], who highlighted a stable mesh topology suitable for CFD simulations of VAWTs. Based on this reference, a defeature size of 0.0005 m, a maximum element size of 0.05 m, and a curvature normal angle of 18° were adopted.
The T16 turbine configuration was selected for pilot testing due to its complex geometry, which demands higher meshing precision. These tests involved varying mesh density and time step values. Time steps ranged from 0.001 s to 0.01 s, within which result stability was maintained. Mesh densities varied from 12,189,953 to 2,796,601 elements.
Boundary conditions were modeled as illustrated in Figure 15. A fixed rectangular mesh domain was defined for the inlet velocity, outlet pressure, symmetry walls, and a cylindrical interface wall. This interface connects to a cylindrical subdomain with a moving mesh that surrounds the turbine blades. The moving mesh subdomain was configured using the rigid body tool, allowing the assignment of inertial properties such as mass and moments of inertia to each turbine. This enabled a more realistic rotational modeling, driven by wind interaction with the turbine blades, while also employing the sliding mesh method for a fixed boundary and a rotating moving boundary.
The total simulation time was determined based on the stabilization of both the power output and the angular velocity of the turbines. For each VAWT configuration tested, this stabilization occurred within a time range of approximately 6 to 14 s.
The solver settings for the simulations were carefully selected to ensure numerical stability and accuracy. The advection scheme was set to High Resolution, while the transient scheme employed the Second-Order Backward Euler method to capture time-dependent behavior with improved precision.
Convergence control was configured with a maximum of 20 coefficient loops per iteration, and a residual target of RMS 0.0001 defined the convergence criteria. Additionally, the global run settings were set to Double Precision to enhance the accuracy of the calculations, particularly in regions with fine mesh and complex flow dynamics.
The CFD methodology for evaluating the turbine’s energy performance was previously validated using a Savonius-type turbine. Manufacturer-provided power curves were used for comparison, and the simulated model showed a deviation of less than 5% from real-world performance [25].
3. Results and Discussion
3.1. Sequence of Treatments in DOE
A total of 16 experimental runs were conducted using the CFD tool to model the various geometric and process variations defined in the proposed FFED design. Initially, the treatment table is obtained with the results of the response variables, as shown in Table 5 below.
Table 5.
Treatment route for feed.
In addition, the fluid dynamic behavior profiles of the wind through the studied VAWT are presented, resulting in velocity profiles for the different treatments conducted according to the DOE methodology. The measured power output ranges from 0.46 to 37.59 W, consistent with typical values for this type of turbine under varying wind speeds [29].
3.2. DOE Analysis Results
From the DOE using the FFED method, a Pareto chart is obtained. This chart is a graphical tool used to identify, among a group of factors, which ones have the most significant impact on the behavior of the response variables, in this case, power output and the Cp. The Pareto chart ranks the effects of the factors in descending order of significance, making it easier to focus on those with the greatest influence on system performance [30]. Below are the Pareto charts corresponding to the analyzed response variables.
Figure 16 and Figure 17 illustrate the effects of the studied factors on the response variables defined in the design. It is noteworthy that, for power output and the Cp, the most significant effect is observed with Factor A (Wind Speed). This highlights the direct relationship between wind potential and power generation: the higher the wind speed, the greater the energy produced by the system. However, when analyzing power output, all the evaluated factors show a significant influence on the Pareto chart. For Cp behavior, the Pareto chart only indicates wind speed as the main factor. The interactions between factors (AD, BE, CD) suggest that a performance metric is sensitive to the combination of geometric and operational parameters.
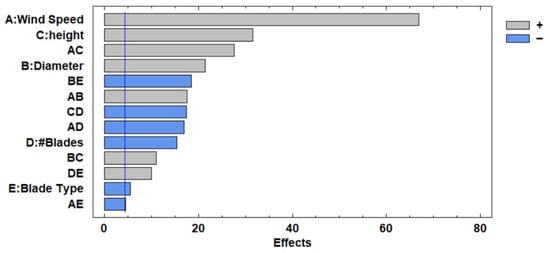
Figure 16.
Pareto chart for power output in a VAWT.
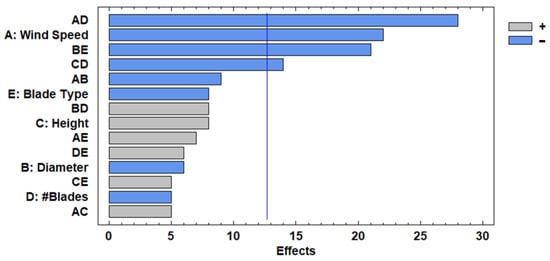
Figure 17.
Pareto chart for power coefficient in a VAWT.
The main effects graphs better explain the behavior of the variation in levels between factors with respect to the response variables.
Figure 18 shows that the effect with the greatest impact on power generation for a VAWT is wind speed, based on its geometric characteristics. However, this graph also shows that the variation in Diameter and the number of blades have a moderate impact on the behavior of the power generated by the VAWT. Additionally, the type of blade (straight or helical) is less influential than the other factors in determining the power generated by the studied VAWT.
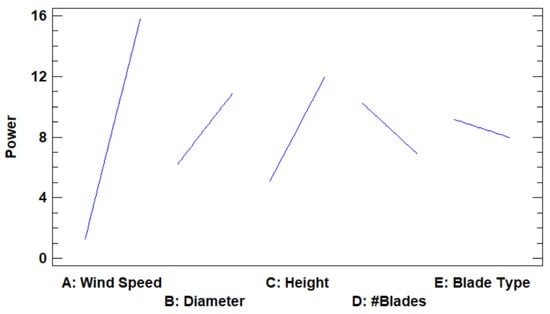
Figure 18.
Main effects plot for power output in a VAWT.
Figure 19 shows the behavior of cp values of 0.22 to 0.28 typical in these VAWTs [31,32,33]. All the factors have a significant impact on the behavior of the Cp of these VAWTs. This implies that, in order to improve the performance of a VAWT such as the one studied in this research, it is essential to analyze the influence of combinations in all design aspects. A comprehensive approach that considers the combined effects of geometric, operational, and environmental parameters is necessary to optimize the system’s efficiency and maximize energy capture.
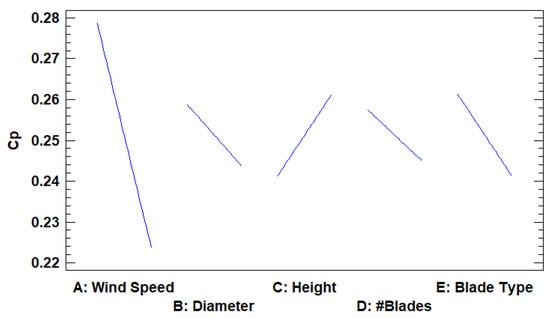
Figure 19.
Main effects plot for power coefficient in a VAWT.
Figure 20 and Figure 21 present response surface contours, which serve as a dynamic visualization tool for analyzing how power output and Cp vary according to different combinations of factor conditions. These response surfaces provide valuable insights into the interactions between key variables, allowing researchers and designers to identify optimal operating regions and better understand the sensitivity of the system’s performance to changes in design and environmental parameters.
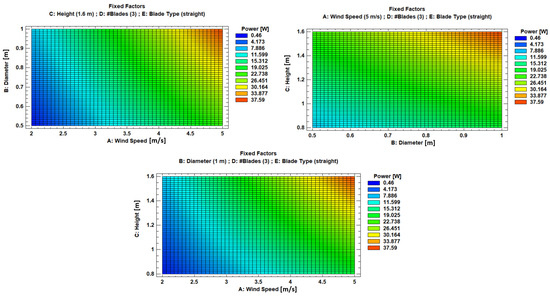
Figure 20.
Response surface contours for achieving maximum power output in a VAWT.
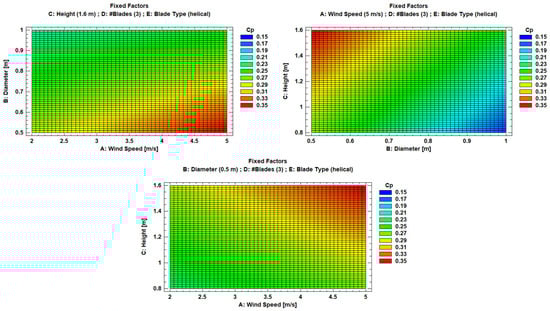
Figure 21.
Response surface contours for achieving maximum power coefficient in a VAWT.
From Table 6, it is noteworthy that both response variables, power output and Cp, agree in identifying wind speed as one of the most influential factors at their optimal operating point. In both cases, the maximum performance is achieved when the wind speed reaches its highest evaluated level. Additionally, the configuration with 3 blades and the height also correspond to the optimal conditions for both response variables. This suggests a strong correlation between aerodynamic design parameters and performance outcomes, highlighting the critical role of both wind conditions and rotor geometry in maximizing efficiency.
Table 6.
Optimized values for the response variables.
The turbine configuration with the optimal output power was designated VAWT-V1, and the configuration with the optimal Cp was designated VAWT-V2. Using these two optimal configurations, an analysis was performed starting from a wind speed of 1 m/s up to a maximum of 10 m/s to determine which of the two designs would ultimately be selected for implementation in the island region of Isla Fuerte.
3.3. Analysis of the Behavior of Optimal VAWTs
From the CFD analyses conducted on the selected optimal VAWT designs, the power output behavior and Cp were obtained, evaluated across wind speeds ranging from 1 m/s to 10 m/s. These results confirmed the findings established by the previously implemented DOE strategy. Figure 22 below illustrates the power output and Cp curves for both turbine designs.
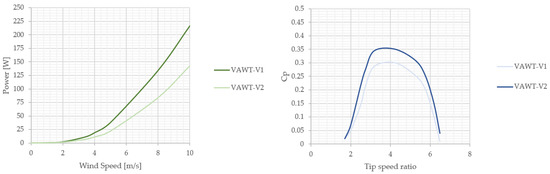
Figure 22.
Power output and Cp curves for optimally designed VAWTs.
As shown in Figure 22, the performance of the VAWT-V1, designed for higher power generation as indicated by the implemented DOE strategy, meets expectations across all modeled wind speed ranges. Specifically, for each evaluated wind speed, VAWT-V1 consistently produces more power than VAWT-V2. In line with its design goals, VAWT-V2, although not delivering higher power output within the studied wind speed range, shows better performance in terms of its Cp compared to VAWT-V1 at all data points of the Tip speed ratio.
Using the wind speed of 3.37 m/s, determined through the Weibull distribution and wind behavior analysis for the insular region of Isla Fuerte, as a reference, VAWT-V1 achieves an output power of 10.59 W and a Cp of 0.276. In contrast, VAWT-V2 generates 6.402 W with a Cp of 0.334. A focused evaluation at this wind speed, as illustrated in Figure 23, reveals that both turbine designs reach a stable state in angular velocity and power output within a short period, confirming the dynamic stability of the studied VAWTs.
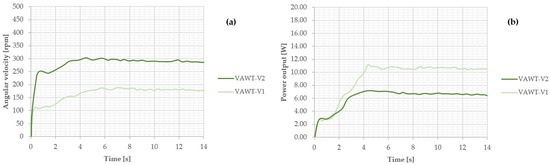
Figure 23.
Performance behavior of VAWTs designed at 3.37 m/s wind speed for (a) the rotation speed, (b) the power output.
As shown in Figure 23, the VAWT-V2, which features a smaller diameter, reaches a higher angular velocity compared to VAWT-V1, with approximate equilibrium values of 290 rpm and 180 rpm, respectively. Consequently, due to its larger diameter, VAWT-V1 achieves a higher power output than VAWT-V2, with values of approximately 10.6 W versus 6.4 W for the analyzed turbines. Both angular velocity and power output behaviors stabilize approximately 6 to 8 s after wind onset, indicating a rapid dynamic response and operational stability for both VAWT designs under the evaluated conditions.
These behaviors, obtained through rigorous CFD analyses, are presented in Figure 24, which illustrates the wind speed profiles and the dynamic response of the studied turbine designs. The figure highlights the aerodynamic performance and operational characteristics of both VAWTs under the evaluated conditions, reinforcing the reliability of the simulation results.
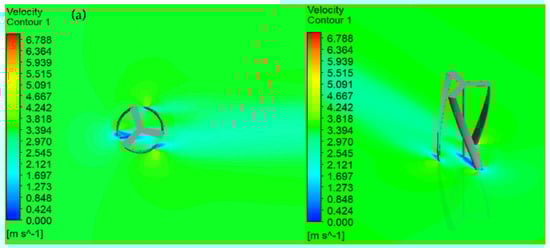
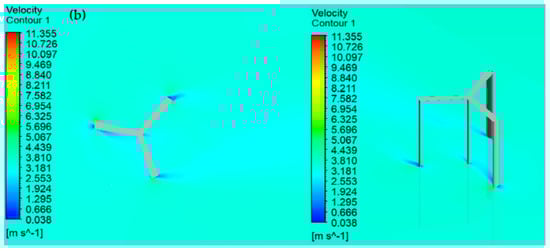
Figure 24.
Velocity profiles through the turbines, (a) VAWT-V2, (b) VAWT-V1.
Figure 25 shows pressure contours on the turbine surfaces as wind passes through. VAWT-V2 operates within an approximate overpressure of 5.85 Pa and a suction of −31 Pa, indicating a more moderate pressure profile compared to VAWT-V1, which operates at about 11.77 Pa of overpressure and −80 Pa of suction. This suggests that VAWT-V1 has stronger vortex formations, boosting lift force and resulting in higher power output. However, it also leads to increased aerodynamic resistance and potential vibration. On the other hand, VAWT-V2 displays a more stable and balanced aerodynamic pattern, with lower pressure gradients, supporting its better performance in terms of Cp.
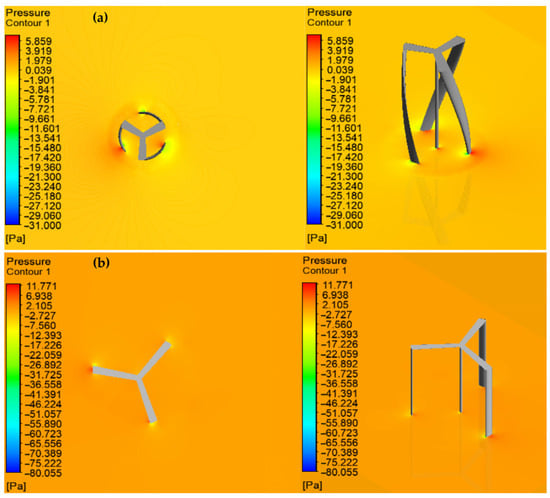
Figure 25.
Pressure contours on the turbines, (a) VAWT-V2, (b) VAWT-V1.
3.4. Energy Analysis Reasoning
Following the solar potential assessment in the insular region of Isla Fuerte, an average of 5.13 PSHs was identified for a 175 kWp solar installation. This results in a daily photovoltaic energy output of approximately 897.75 kWh, excluding the contribution from two DGs, each with a capacity of 400 kW. This installed capacity enables the system to provide electricity for periods ranging from 3 to 12 h per day. However, to achieve full energy autonomy for 24 h operation, additional energy is required. This demand can be quantified using telemetry data provided by IPSE and CNM of Colombia for the insular zone. The relevant figures for January 2025 are presented in Figure 26 below.
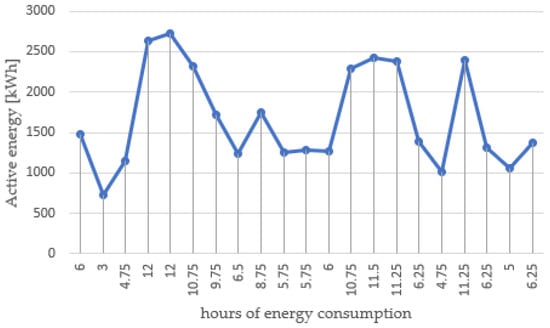
Figure 26.
Active energy consumption by the population of Isla Fuerte.
The average active energy consumption in the insular region of Isla Fuerte is about 1674.3 kWh, which provides roughly 7.8 h of daily electricity service. On peak days, energy demand reached up to 2720 kWh, allowing for up to 12 h of service. These figures show that the current energy system needs to be expanded to achieve full independence and guarantee an uninterrupted 24 h electricity supply.
To address this energy gap sustainably, diversifying the energy matrix becomes essential. Integrating wind energy through the deployment of VAWTs, alongside expanding the existing solar infrastructure, offers a viable solution. For instance, under persistent wind conditions of 3.37 m/s as determined by the Weibull distribution, the VAWT-V1 design generates approximately 254.4 Wh per day. While this output is modest on an individual scale, the strategic deployment of multiple units can contribute meaningfully to local energy needs.
One practical and socially impactful application is the electrification of the Isla Fuerte Educational Institution. Beyond supplying clean energy, this initiative promotes environmental education and technological literacy among students in a vulnerable community. By engaging in the design, construction, and evaluation of renewable energy systems such as VAWTs, students gain hands-on experience and awareness of sustainable development practices. Moreover, the integration of wind and solar energy significantly reduces dependence on DGs, which are commonly used in isolated regions. This transition not only lowers operational costs but also contributes to a substantial reduction in greenhouse gas emissions and environmental degradation. By minimizing the carbon footprint and promoting renewable energy education, the project aligns with global sustainability goals and fosters long-term resilience for the community.
4. Conclusions
This study effectively combined DOE with CFD to assess and enhance the energy efficiency of small-scale H-VAWTs. By systematically adjusting design parameters such as turbine height, blade count, and blade geometry, the research offered insights into aerodynamic behavior and energy output.
Results showed that turbine height and blade number significantly influence power generation, while helical blades enhance aerodynamic efficiency by reducing turbulence and improving airflow. The Cp values ranged from 0.15 to 0.35, consistent with expected performance for this turbine type.
Beyond technical optimization, the study evaluated the renewable energy potential of Isla Fuerte, including solar and wind resources. Wind behavior was analyzed using statistical methods and the Weibull distribution, while the solar assessment showed an average of 5.13 PSHs, supporting the feasibility of a 175 kWp installation.
To meet full energy demand and reduce reliance on diesel generators, the study proposes a diversified energy matrix combining solar and VAWTs, improving system autonomy and sustainability.
The project also includes an educational component, engaging students from the local institution in the design and evaluation of renewable systems. This fosters environmental awareness, technical skills, and community involvement, contributing to sustainable development and energy equity.
Using CFD guided by DOE minimized the need for early-stage physical prototyping, streamlining the design process and reducing costs. Future work may involve experimental validation to refine models and confirm simulation reliability.
Overall, the study advances clean energy technologies and promotes sustainable development in insular communities.
Author Contributions
Conceptualization, J.F.-V. and A.P.-D.; methodology, J.F.-V. and A.P.-D.; software, J.F.-V.; validation, J.F.-V., L.M.P.-P., A.M.A.-C. and A.P.-D.; formal analysis, J.F.-V., L.M.P.-P., A.M.A.-C. and A.P.-D.; investigation, J.F.-V., L.M.P.-P., A.M.A.-C. and A.P.-D.; resources, J.F.-V., L.M.P.-P., A.M.A.-C. and A.P.-D.; data curation, J.F.-V., L.M.P.-P., A.M.A.-C. and A.P.-D.; writing—original draft preparation, J.F.-V., L.M.P.-P., A.M.A.-C. and A.P.-D.; writing—review and editing, J.F.-V., L.M.P.-P., A.M.A.-C. and A.P.-D.; visualization, J.F.-V.; supervision, J.F.-V., L.M.P.-P., A.M.A.-C. and A.P.-D.; project administration, J.F.-V.; funding acquisition, J.F.-V., L.M.P.-P., A.M.A.-C. and A.P.-D. All authors have read and agreed to the published version of the manuscript.
Funding
This research received no external funding.
Institutional Review Board Statement
Not applicable.
Informed Consent Statement
Not applicable.
Data Availability Statement
The raw data supporting the conclusions of this article will be made available by the authors on request.
Acknowledgments
This research, part of Jonathan Fabregas’s Ph.D. at Universidad Tecnológica de Bolívar, combines CFD and DOE to enhance VAWT performance. It includes a renewable resource assessment in Isla Fuerte and encourages sustainability by decreasing diesel reliance. The project also promotes environmental education in vulnerable communities through practical learning in clean energy technologies.
Conflicts of Interest
The authors declare no conflicts of interest.
Abbreviations
The following abbreviations are used in this manuscript:
| VAWT | Vertical-axis wind turbine |
| HAWT | Horizontal-axis wind turbine |
| CFD | Computational fluid dynamics |
| DOE | Design of experiments |
| Cp | Power coefficient |
| Cm | Moment coefficient |
| Cl | Lift coefficient |
| Cd | Drag coefficient |
| AEf | Aerodynamic efficiency |
| FFED | Fractional factorial experimental design |
| FFD | Full factorial design |
| H-VAWT | H-type Darrieus turbine VAWT |
| T-VAWT | Turby VAWT |
| SGDs | Sustainable Development Goals |
| DANE | National Administrative Department of Statistics |
| CNM | National Monitoring Center |
| PSP | Photovoltaic Solar Panels |
| DG | Diesel Generator |
| IDEAM | Institute of Hydrology, Meteorology and Environmental Studies |
| POWER | Prediction of Worldwide Energy Resources |
| PSHs | Peak Sun Hours |
| α | Angle of attack |
| ρ | Density |
| k | Turbulent kinetic energy |
| ω | Turbulent dissipation rate |
| u | Fluid velocity |
| x, y, z | Position coordinate |
| Gk | Generation of turbulent kinetic energy |
| Yk | Dissipation of turbulent kinetic energy |
| Sk | User-defined source terms k |
| Γk | Effective diffusivity of k |
| Gω | Generation of turbulent dissipation rate |
| Yω | Dissipation of turbulent dissipation rate |
| Sω | User-defined source terms ω |
| Γω | Effective diffusivity of ω |
| P | Linear momentum |
| m | Torque |
| I | Inertia moment |
| F | Net force |
| θ | Rotational displacement |
| Angular velocity | |
| Angular acceleration |
References
- Kassa, B.Y.; Baheta, A.T.; Beyene, A. Current Trends and Innovations in Enhancing the Aerodynamic Performance of Small-Scale, Horizontal Axis Wind Turbines: A Review. ASME Open J. Eng. 2024, 3, 031001. [Google Scholar] [CrossRef]
- Lu, Y.; Khan, Z.A.; Alvarez-Alvarado, M.S.; Zhang, Y.; Huang, Z.; Imran, M. A Critical Review of Sustainable Energy Policies for the Promotion of Renewable Energy Sources. Sustainability 2020, 12, 5078. [Google Scholar] [CrossRef]
- Fábregas, J.; Tovar, I.; Palencia, A. Electrification as a development and sustainability approach in rural areas using renewable energy sources. Global J. Environ. Sci. Manag. 2024, 10, 2115–2126. [Google Scholar] [CrossRef]
- Fabregas, J.; Palencia, A. The significance of clean energy, education, and environmental management in fostering a sustainable future. Global J. Environ. Sci. Manag. 2025, 11, 1001–1018. [Google Scholar] [CrossRef]
- Abraham, A.M.; Anil Lal, S. Multi-Objective Optimization of an Axial Flow Turbine Design Using Surrogate Modeling and Genetic Algorithm. ASME Open J. Eng. 2022, 1, 011022. [Google Scholar] [CrossRef]
- Rhenals, M.; Robledo, A.; Fábregas, J.; Carpintero, J. Analysis of Fluid Pressure Drop through a Globe Valve Using Computational Fluid Dynamics and Statistical Techniques. J. Adv. Res. Fluid Mech. Therm. Sci. 2024, 115, 70–82. [Google Scholar] [CrossRef]
- Sakib, M.S.; Griffith, D.T. Parked and operating load analysis in the aerodynamic design of multi-megawatt-scale floating vertical-axis wind turbines. Wind Energy Sci. 2022, 7, 677–696. [Google Scholar] [CrossRef]
- Wang, W.Y.; Ferng, Y.M. Numerical model for noise reduction of small vertical-axis wind turbines. Wind Energy Sci. 2024, 9, 651–664. [Google Scholar] [CrossRef]
- Wiśniewski, J.; Rogowski, K.; Gumowski, K.; Szumbarski, J. Wind tunnel comparison of four VAWT configurations to test load-limiting concept and CFD validation. Wind Energy Sci. 2021, 6, 287–294. [Google Scholar] [CrossRef]
- Zamre, P.; Lutz, T. Computational-fluid-dynamics analysis of a Darrieus vertical-axis wind turbine installation on the rooftop of buildings under turbulent-inflow conditions. Wind Energy Sci. 2022, 7, 1661–1677. [Google Scholar] [CrossRef]
- Day, H.; Ingham, D.; Ma, L.; Pourkashanian, M. Adjoint Based Optimisation for Efficient VAWT Blade Aerodynamics Using CFD. J. Wind. Eng. Ind. Aerodyn. 2021, 208, 104431. [Google Scholar] [CrossRef]
- Attie, C.; ElCheikh, A.; Nader, J.; Elkhoury, M. Performance Enhancement of a Vertical Axis Wind Turbine Using a Slotted Deflective Flap at the Trailing Edge. Energy Convers. Manag. 2022, 273, 116388. [Google Scholar] [CrossRef]
- Shen, Z.; Gong, S.; Zu, H.; Guo, W. Multi-Objective Optimization Study on the Performance of Double Darrieus Hybrid Vertical Axis Wind Turbine Based on DOE-RSM and MOPSO-MODM. Energy 2024, 299, 131406. [Google Scholar] [CrossRef]
- Rasekh, S.; Aliabadi, S.K.; Hansen, M.O.L. Toward Improving the Performance of a Variable Pitch Vertical Axis Wind Turbine (VP-VAWT), Part 1: Sensitivity Analysis Using Taguchi-CFD Approach. Ocean Eng. 2023, 279, 114478. [Google Scholar] [CrossRef]
- Benharrats, F.; Mahi, H. Clear Sky Global Surface Solar Irradiance Estimation from Bird & Hulstrom Radiometric Model/MODIS Atmospheric Data Combination. J. Renew. Energ. 2023, 26, 31–39. [Google Scholar] [CrossRef]
- Younis, A.; Elshiekh, H.; Osama, D.; Shaikh-Eldeen, G.; Elamir, A.; Yassin, Y.; Omer, A.; Biraima, E. Wind Speed Forecast for Sudan Using the Two-Parameter Weibull Distribution: The Case of Khartoum City. Wind 2023, 3, 213–231. [Google Scholar] [CrossRef]
- Wang, X.; Ali, A.; Ke, H.; Huang, B.; Yang, J. Numerical Simulation of Aerodynamic Performance Degradation of Naca0012 Airfoils Under Icing Conditions for Vertical-Axis Wind Turbines. Case Stud. Therm. Eng. 2025, 72, 106433. [Google Scholar] [CrossRef]
- Beigmoradi, S.; Vahdati, M. Multi-Objective Optimization of a Hatchback Rear End Utilizing Fractional Factorial Design Algorithm. Eng. Comput. 2021, 37, 139–153. [Google Scholar] [CrossRef]
- Chan, W.; D’Ambrogio, A.; Zacharewicz, G.; Mustafee, N.; Wainer, G.; Page, E. A Tutorial on Design of Experiments for Simulation Modeling. IEEE Proc. Winter Simul. Conf. 2017, 1, 550–564. [Google Scholar] [CrossRef]
- Foust, E.C. The Behavior of Vertical Axis Water Turbine with Flexible Blades: Self-Start, Ventilation, and Cavitation. ASME Open J. Eng. 2023, 2, 021041. [Google Scholar] [CrossRef]
- Lisowski, F.; Augustyn, M. Analytical and Computational Fluid Dynamics Methods for Determining the Torque and Power of a Vertical-Axis Wind Turbine with a Carousel Rotor. Appl. Sci. 2025, 15, 208. [Google Scholar] [CrossRef]
- Rezaeiha, A.; Montazeri, H.; Blocken, B. Towards accurate CFD simulations of vertical axis wind turbines at different tip speed ratios and solidities: Guidelines for azimuthal increment, domain size and convergence. Energy Conv. Manag. 2018, 156, 301–316. [Google Scholar] [CrossRef]
- Rezaeiha, A.; Montazeri, H.; Blocken, B. Characterization of aerodynamic performance of vertical axis wind turbines: Impact of operational parameters. Energy Conv. Manag. 2018, 168, 45–77. [Google Scholar] [CrossRef]
- Ji, B.; Zhong, K.; Xiong, Q.; Qiu, P.; Zhang, X.; Wang, L. CFD Simulations of Aerodynamic Characteristics for the Three-Blade NREL Phase VI Wind Turbine Model. Energy 2022, 249, 123670. [Google Scholar] [CrossRef]
- Hornshøj-Møller, S.D.; Nielsen, P.D.; Forooghi, P.; Abkar, M. Quantifying Structural Uncertainties in Reynolds-Averaged Navier–Stokes Simulations of Wind Turbine Wakes. Renew. Energy 2021, 164, 1550–1558. [Google Scholar] [CrossRef]
- Michna, J.; Rogowski, K. A Refined Approach for Angle of Attack Estimation and Dynamic Force Hysteresis in H-Type Darrieus Wind Turbines. Energies 2024, 17, 6264. [Google Scholar] [CrossRef]
- Fábregas, J.; Palencia, A.; Buitrago, C. Analyzing and Validating Energy Performance through Computational Simulation of a Helical Vertical Axis Wind Turbine. J. Adv. Res. Fluid Mech. Therm. Sci. 2024, 119, 103–113. [Google Scholar] [CrossRef]
- Alvarez, J.; Fábregas, J.; Márquez, M.; Carpintero, J. Energy Evaluation of Synthesis Gas in a Turbocharger System Employing CFD Tools. CFD Lett. 2024, 16, 109–119. [Google Scholar] [CrossRef]
- Bang, C.S.; Rana, Z.A.; Prince, S.A. CFD Analysis on Novel Vertical Axis Wind Turbine (VAWT). Machines 2024, 12, 800. [Google Scholar] [CrossRef]
- Ayaz Atalan, Y.; Atalan, A. Testing the Wind Energy Data Based on Environmental Factors Predicted by Machine Learning with Analysis of Variance. Appl. Sci. 2025, 15, 241. [Google Scholar] [CrossRef]
- Mohan Kumar, P.; Sivalingam, K.; Lim, T.-C.; Ramakrishna, S.; Wei, H. Review on the Evolution of Darrieus Vertical Axis Wind Turbine: Large Wind Turbines. Clean Technol. 2019, 1, 205–223. [Google Scholar] [CrossRef]
- Mohan Kumar, P.; Sivalingam, K.; Lim, T.-C.; Ramakrishna, S.; Wei, H. Strategies for Enhancing the Low Wind Speed Performance of H-Darrieus Wind Turbine—Part 1. Clean Technol. 2019, 1, 185–204. [Google Scholar] [CrossRef]
- El Maani, R.; Radi, B.; El Hami, A. Numerical Study and Optimization-Based Sensitivity Analysis of a Vertical-Axis Wind Turbine. Energies 2024, 17, 6300. [Google Scholar] [CrossRef]
Disclaimer/Publisher’s Note: The statements, opinions and data contained in all publications are solely those of the individual author(s) and contributor(s) and not of MDPI and/or the editor(s). MDPI and/or the editor(s) disclaim responsibility for any injury to people or property resulting from any ideas, methods, instructions or products referred to in the content. |
© 2025 by the authors. Licensee MDPI, Basel, Switzerland. This article is an open access article distributed under the terms and conditions of the Creative Commons Attribution (CC BY) license (https://creativecommons.org/licenses/by/4.0/).