Article

Geo-Spatial Optimization and First and Last Mile Accessibility for Sustainable Urban Mobility in Bangkok, Thailand

by
Sornkitja Boonprong
1,
Pariwate Varnnakovida
2,3,*,
Nawin Rinrat
2,
Napatsorn Kaytakhob
4 and
Arinnat Kitsamai
2
1
Faculty of Social Sciences, Kasetsart University, Bangkok 10900, Thailand
2
KMUTT Geospatial Engineering and Innovation Center, Faculty of Science, King Mongkut’s University of Technology Thonburi, Bangkok 10140, Thailand
3
Department of Mathematics, Faculty of Science, King Mongkut’s University of Technology Thonburi, Bangkok 10140, Thailand
4
Graduate School of Communication Arts and Management Innovation, National Institute of Development Administration (NIDA), Bangkok 10240, Thailand
*
Author to whom correspondence should be addressed.
Sustainability 2025, 17(21), 9653; https://doi.org/10.3390/su17219653
Submission received: 8 September 2025 / Revised: 22 October 2025 / Accepted: 27 October 2025 / Published: 30 October 2025

Abstract

Urban mobility in Bangkok is constrained by congestion, modal fragmentation, and gaps in First and Last Mile (FLM) access. This study develops a GIS-based framework that combines maximal-coverage location allocation with post-optimization accessibility diagnostics to inform intermodal hub siting. The network model compares one-, three-, and five-hub configurations using a 20 min coverage standard, and we conduct sensitivity tests at 15 and 25 min to assess robustness. Cumulative isochrones and qualitative overlays on BTS, MRT, SRT, Airport Rail Link, and principal water routes are used to interpret spatial balance, peripheral reach, and multimodal alignment. In the one-hub scenario, the model selects Pathum Wan as the optimal central node. Transitioning to a small multi-hub network improves geographic balance and reduces reliance on the urban core. The three-hub arrangement strengthens north–south accessibility but leaves the west bank comparatively underserved. The five-hub configuration is the most spatially balanced and network-consistent option, bridging the west bank and reinforcing rail interchange corridors while aligning proposed hubs with existing high-capacity lines and waterway anchors. Methodologically, the contribution is a transparent workflow that pairs coverage-based optimization with isochrone interpretation; substantively, the findings support decentralized, polycentric hub development as a practical pathway to enhance FLM connectivity within Bangkok’s current network structure. Key limitations include reliance on resident population weights that exclude floating or temporary populations, use of typical network conditions for travel times, a finite pre-screened candidate set, and the absence of explicit route choice and land-use intensity in the present phase.

1. Introduction

1.1. Urban Mobility Challenges in Bangkok

Bangkok, as Thailand’s primary urban center, confronts acute mobility challenges driven by sustained urban expansion [1]. Despite considerable investment in expanding urban rail networks (including the BTS Skytrain, MRT Subway, and newer lines), road-based travel remains the dominant mode of transport. Mode choice studies indicate commuters prefer private vehicles over walking, waiting, or paying for parking, which reinforces car dependency and entrenches traffic congestion as a daily reality [2]. This persistent congestion leads to prolonged travel times and severe environmental consequences, most notably worsening air quality. The high concentration of fine particulate matter (PM2.5) from traffic emissions is recognized as a significant threat to public health, contributing to thousands of premature mortalities annually in the city [3]. Thailand’s ranking in international competitiveness assessments of transport infrastructure highlights systemic inefficiencies in connectivity and intermodal integration.
These challenges are especially pronounced in Bangkok’s peripheral districts, where First and Last Mile (FLM) connectivity to mass transit stations is weak. Residents in these areas often depend on informal services, particularly motorcycle taxis, to bridge the gap between their homes and the main public transport systems [4]. This reliance on private vehicles is further evidenced by the sharp increase in vehicle registrations within the Bangkok Metropolitan Region, which grew from approximately 6.3 million to 10 million vehicles between 2007 and 2015 [5]. The combination of incomplete public transport networks and a growing dependency on private and informal transport underscores the urgent need for a more integrated approach to urban mobility reform (Figure 1).

1.2. First and Last Mile (FLM) as a Barrier to Mode Shift

While Bangkok’s expanding mass transit network has improved station accessibility along major corridors, its overall effectiveness remains constrained by persistent FLM deficiencies. FLM denotes the initial and final segments of a trip that connect a traveler’s origin or destination to a principal transit node. In Bangkok, these segments are frequently characterized by poor pedestrian infrastructure, uncomfortable walking conditions, and safety concerns, which collectively undermine the attractiveness of using rail and other formal public transport. Recent analyses emphasize that accessibility is the fundamental link enabling mode shift and explicitly document how the city’s walking environment around stations hampers safe, comfortable access, with the performance of sois and sidewalk quality emerging as decisive factors for FLM feasibility [6,7].
Empirical evidence further indicates that FLM conditions strongly influence mode choice. Where walkability is low and perceived personal safety is weak, the appeal of active access modes diminishes, reducing the likelihood that travelers will walk to stations [6,7]. In such contexts, travelers often rely on informal or semi-formal services to bridge FLM gaps. In Bangkok, motorcycle taxis function as critical connectors to rail stations, with their complementarity to rail particularly pronounced in outer suburban areas and varying by local spatial attributes [4].
Despite the recognized importance of FLM, planning priorities in Bangkok have historically emphasized rail extensions more than the everyday mechanics of station access and egress. A grid-based equity assessment of the Bangkok Metropolitan Region demonstrates pronounced supply–demand mismatches, with more than half of residents located in low-supply, high-demand cells and approximately sixty percent of the population receiving less than five percent of total public transport supply [8]. In the absence of targeted measures that improve the FLM environment, particularly pedestrian access and feeder connectivity, these spatial inequities constrain the practicality of accessing stations and weaken the conditions required for sustained mode shift as underscored by the accessibility framework [7]. Finally, FLM barriers are unevenly distributed across demographic groups. Elderly residents often face compounded difficulties related to limited mobility and stair climbing, which diminish the practicality of shifting to public transport without explicit accessibility improvements [9].

1.3. Role of Spatial Integration and Digital Transport Services

Improving mobility in Bangkok requires not only continued transit expansion but also purposeful spatial integration of modes and user-centered digital services. We define accessibility using a cumulative-opportunity metric on a multimodal network, A i ( τ ) = j O j   1 [ t i j τ ] , where O j denotes the size of opportunities at location j and t i j is the network travel time; the indicator equals 1 when t i j τ and 0 otherwise. Full notation and the MCLP specification are provided in Section 2. Spatial integration entails coordinated planning of interchanges, station-area land uses, and FLM access infrastructure. Evidence-driven Geographic Information Systems approaches, including accessibility and location-allocation modeling, offer robust tools to identify optimal multimodal transfer sites and diagnose spatial mismatches between transit supply and potential demand [10,11,12,13,14].
In parallel, digital mobility platforms within Mobility as a Service frameworks can lower transaction costs for planning, booking, and payment, thereby reducing transfer friction and enhancing perceived quality. In Bangkok, recent work demonstrates the relevance of MaaS for managing peak congestion and improving user welfare when integrated with everyday activity-travel patterns [15]. A practical opportunity is progressive integration of prevalent informal access services, particularly motorcycle taxis, into regulated digital interfaces that connect reliably with rail stations. Empirical estimates indicate substantial willingness to pay for safety, comfort, and time savings in access trips, underscoring the policy value of formalizing and upgrading such services within a digital ecosystem [16]. Reviews from Global South contexts similarly find that successful MaaS implementations depend on locally adapted integration of informal transport and staged governance and data-sharing arrangements [17].
Beyond MaaS, on-demand and community-managed feeder solutions can be scalable where conventional scheduled services are not economically viable, especially in peripheral or low-density catchments. Regional evidence on app-mediated motorcycle taxi and shared services shows their potential to bridge spatial disconnects and improve door-to-door connectivity, while highlighting the need for clear regulatory design to ensure safety and environmental performance [18]. Ultimately, the effectiveness of digital and community-based solutions depends on spatial alignment with existing infrastructure and a granular understanding of user travel patterns and behavioral preferences in Bangkok, which shape perceived convenience, reliability, and mode choice responses [2,15].

1.4. Research Gaps and Objectives

Despite increased attention to public transport development, much of the literature still takes a fragmented perspective, treating spatial planning, travel behavior, and service innovation as separate lines of inquiry rather than integrated elements of a coherent mobility paradigm. Foundational work on sustainable mobility argues for a shift toward integrative approaches that explicitly link land use, accessibility, and behavioral responses within a single policy framework, highlighting the need to overcome disciplinary silos that hinder system-wide effectiveness [19].
Within GIS-based transport modeling, methodological advances have prioritized accessibility indicators and network performance evaluation, yet connections to individual-level perceptions and heterogeneous behavioral responses remain underdeveloped. Recent research agendas call for bridging technical accessibility metrics with perceived accessibility and user-centered evaluation, as well as for embedding temporal and equity considerations to make modeling outputs decision-relevant in complex urban contexts [20]. These priorities align with integrative accessibility frameworks that link transport, land use, temporal constraints, and individual needs in a single evaluative structure [21].
Conversely, while travel behavior research has increasingly acknowledged the importance of the built environment, meta-analytic evidence shows that destination accessibility and urban design features shape travel outcomes in ways that policy can leverage, and parallel work on transport-related social exclusion demonstrates that institutional and social contexts condition mobility choices and accessibility outcomes. These insights underscore the need for frameworks that integrate spatial structure, governance arrangements, and user heterogeneity, particularly for FLM decisions [22,23].
In parallel, the feasibility of emerging solutions such as Mobility as a Service in Southeast Asian mega-urban settings remains underexplored, with specific challenges arising from the integration of informal services and from data standardization, sharing, and governance. Comparative reviews in the Global South emphasize that successful implementations require locally adapted service bundles and staged data-sharing agreements under clear public oversight to ensure equitable outcomes [17].
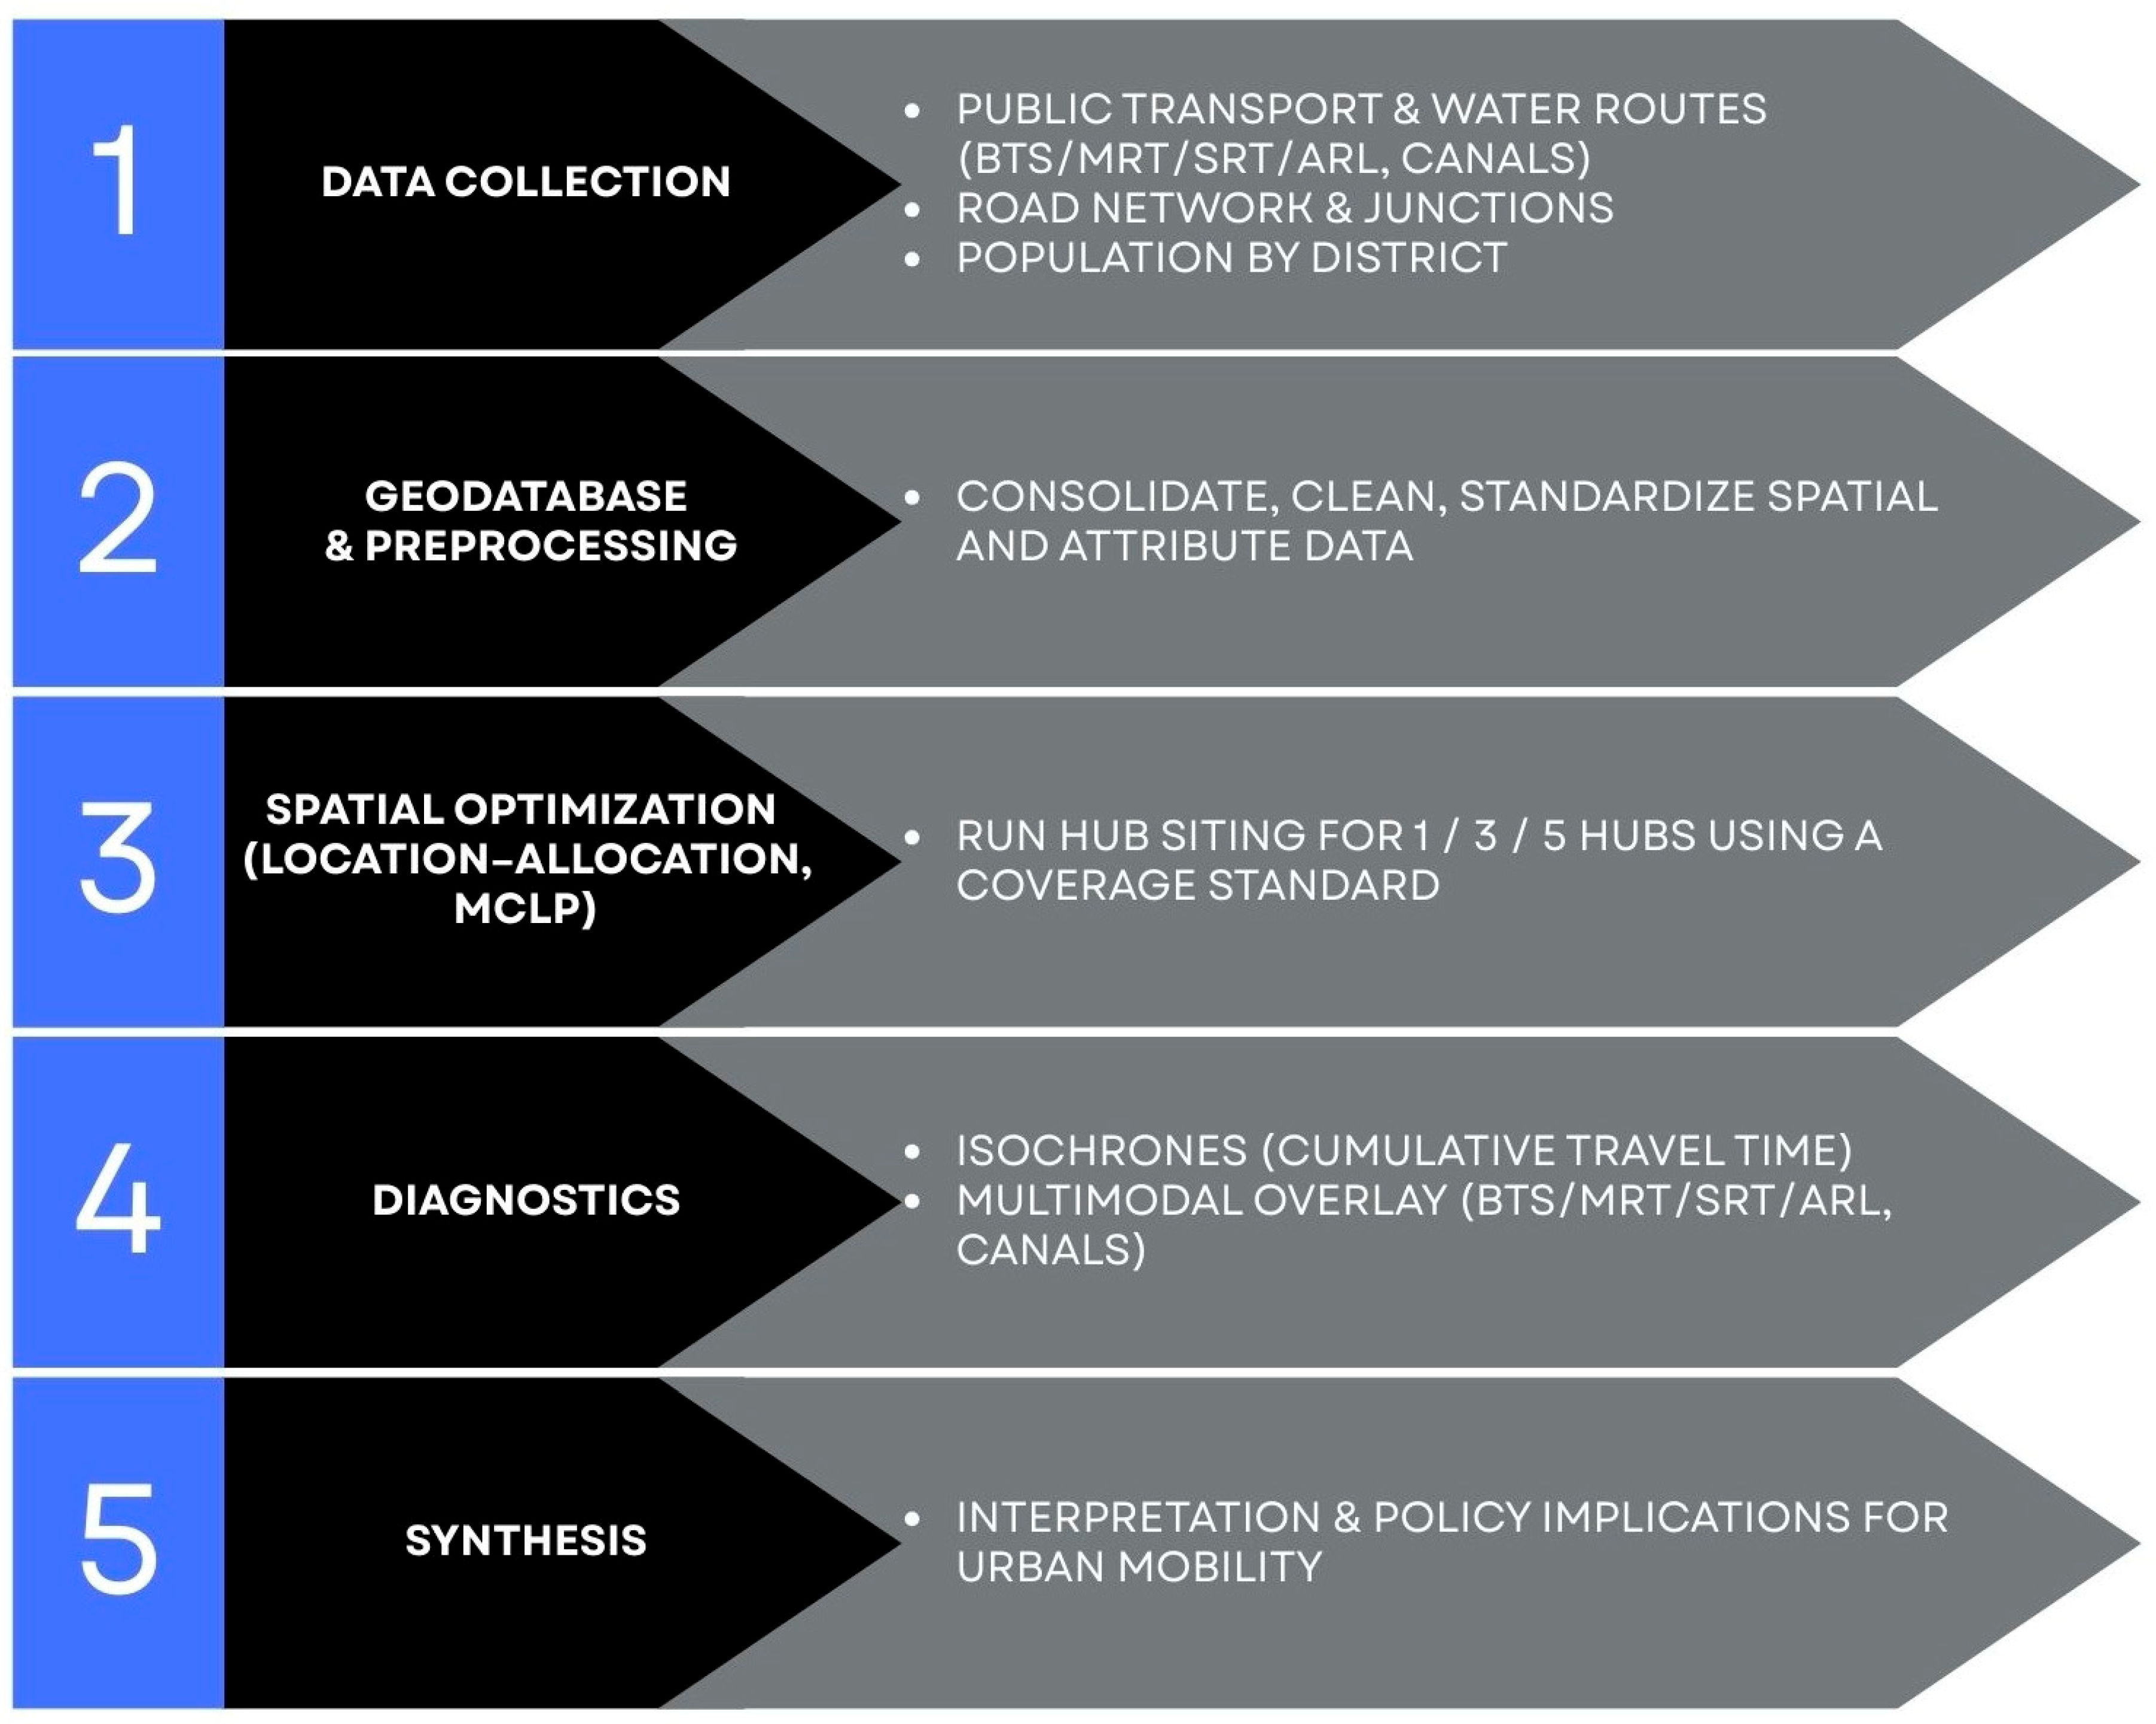
To address these gaps, this study develops an integrated, GIS-based framework for sustainable urban mobility planning in Bangkok. The present analysis pursues three objectives: (i) to identify optimal locations for intermodal transfer hubs using a maximal-coverage location-allocation model under one-, three-, and five-hub scenarios; (ii) to examine practical accessibility through cumulative travel-time isochrones and qualitative overlays with existing BTS, MRT, SRT, Airport Rail Link, and principal water routes, assessing spatial balance, peripheral reach, and multimodal consistency; and (iii) to interpret planning implications for inclusive, low-emission urban mobility in Bangkok. The research design follows a five-step workflow from data collection to policy synthesis, ensuring transparency and reproducibility (Figure 2). Methodologically, this study advances a transparent and reproducible GIS workflow that couples a coverage-based location-allocation model with cumulative isochrone diagnostics and compact threshold sensitivity at 15, 20, and 25 min. Substantively, the Bangkok application shows that a small multi-hub configuration can rebalance cross-river accessibility and align transfer opportunities with existing high-capacity corridors, providing an implementable, policy-salient blueprint for improving first- and last-mile connectivity without new heavy infrastructure.

2. Materials and Methods

2.1. Study Area Description

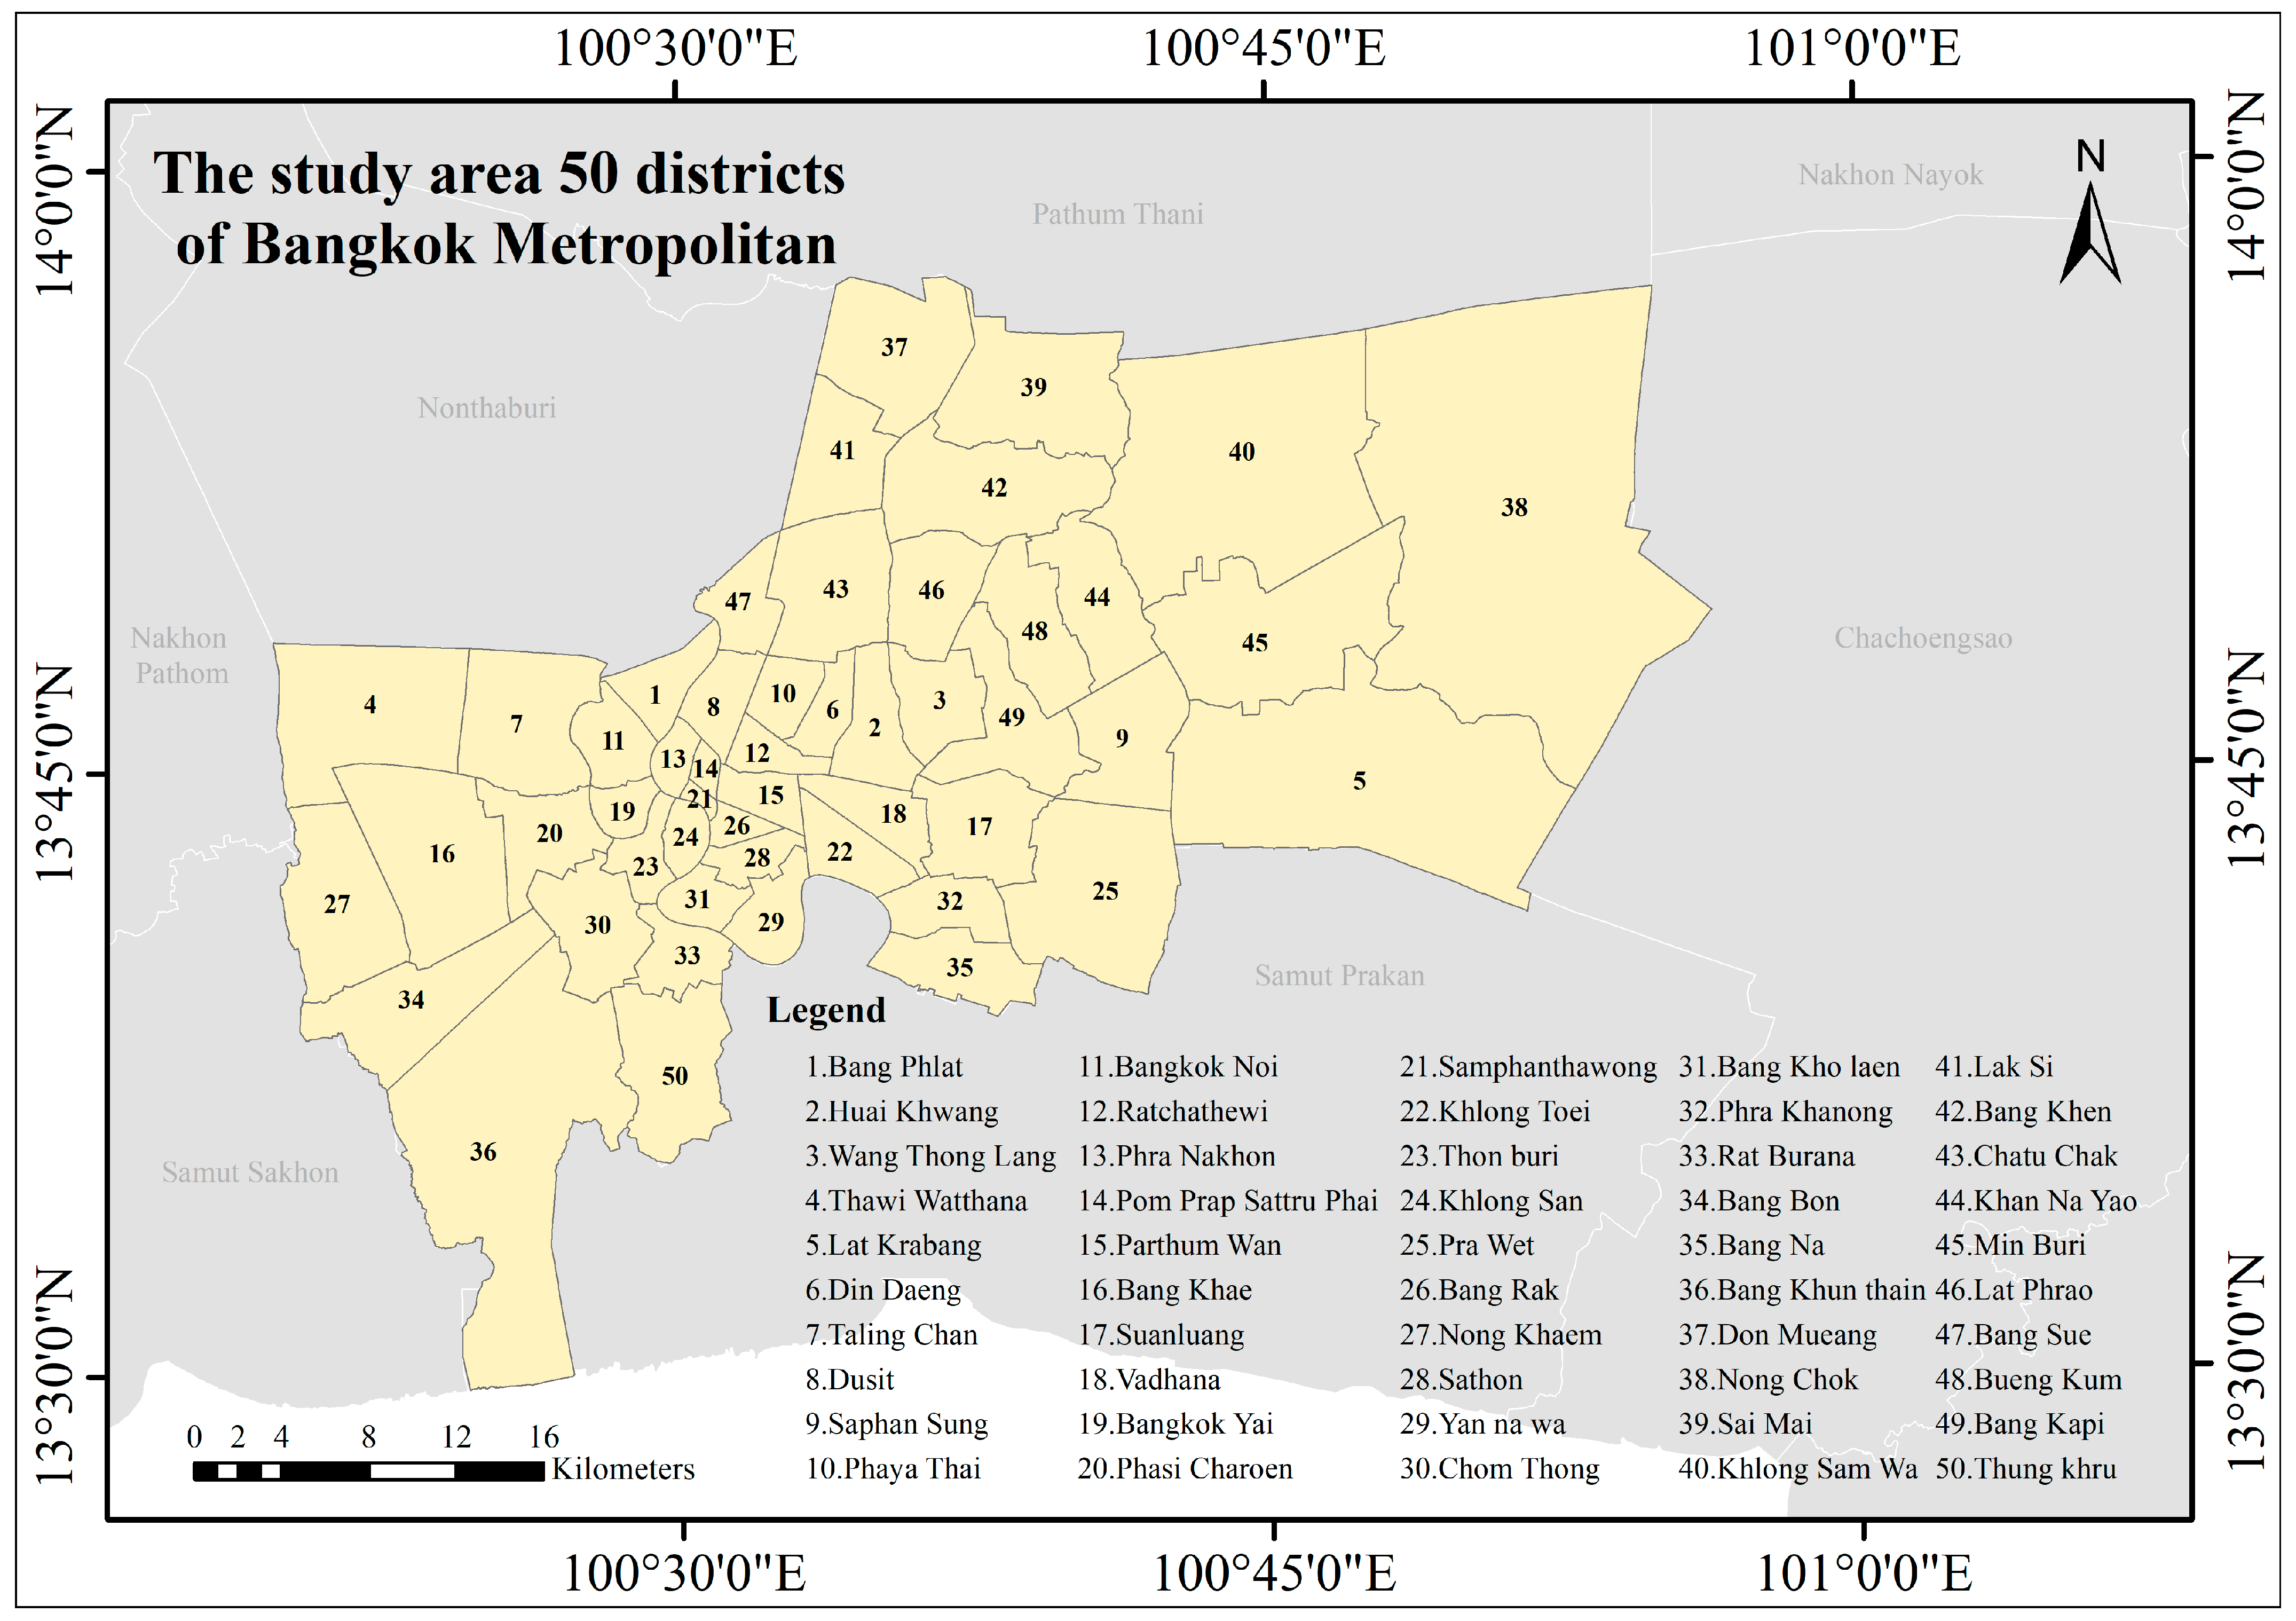
The empirical focus of this study is Bangkok (Figure 3), the capital and primate city of Thailand, administered under the Bangkok Metropolitan Administration. The municipality occupies approximately 1568 km2 within the Chao Phraya River delta, a geomorphic setting that yields a predominantly flat and low-lying terrain with an average elevation of approximately 1.5 m above mean sea level [24]. Geologically, Bangkok overlies a deep sedimentary basin characterized by soft alluvial deposits that amplify ground motion, a feature that distinguishes the basin’s subsurface and informs infrastructure risk assessments [25]. Recurrent flooding remains a salient hazard for the metropolitan region, with long-term exposure patterns that bear directly on the resilience of urban infrastructure and the planning of transport systems [26].
Administratively, Bangkok is divided into fifty districts distributed on both sides of the Chao Phraya River, with the western sector corresponding to the historical Thonburi area and the eastern sector to Phra Nakhon. The urban fabric is highly compact and functionally mixed, comprising residential, commercial, and industrial uses. The metropolitan landscape is interwoven with an extensive canal network, locally known as khlongs, which historically structured settlement and mobility in the delta and continues to retain potential for integration within a multimodal transport system [27,28].
Bangkok’s transport infrastructure comprises multiple rail-based mass transit systems, including elevated and underground lines, complemented by extensive road networks and formal water-based services operating on the Chao Phraya River and major canals. Despite recent expansions of the rail network, chronic congestion persists and FLM connectivity remains insufficient, while the city’s hydrogeomorphic context continues to impose constraints that must be addressed in transport and infrastructure planning [26].

2.2. Behavioral and Travel Context (Secondary Descriptive Profile)

We assemble a secondary descriptive profile of FLM conditions in Bangkok to contextualize the hub-scenario analysis. The profile summarizes indicative mode shares and salient decision factors based on available official statistics and prior reports. These descriptors provide background context only and are not used as inputs to the location-allocation optimization.

2.3. Geographic Information Systems (GIS) Analysis

2.3.1. Geo-Database Creation

A consolidated geodatabase was developed to serve as the spatial backbone of the study. Primary survey outputs and secondary institutional datasets from the Bangkok Metropolitan Administration and the Office of Transport and Traffic Policy and Planning were integrated into harmonized vector and attribute schemas. Core layers included road centerlines, electric rail systems, water transport routes, administrative boundaries, and population data. All datasets were standardized to the UTM projection, Zone 47N, WGS84 datum to ensure interoperability. Preprocessing steps comprised format harmonization, attribute validation, duplicate removal, and reconciliation of overlapping alleys and centerlines to support network-based analysis in subsequent tasks.

2.3.2. Network and Location-Allocation Modeling

Network analysis and location-allocation modeling were conducted to identify intermodal hub locations under one-, three-, and five-hub scenarios. The Maximal Covering Location Problem (MCLP) was implemented in ArcMap Network Analyst (version 10.7) with identical network and impedance settings across scenarios to ensure strict comparability. Demand weights were derived from population counts at the administrative unit reported in the results.
Sixteen candidate hubs were pre-screened using physical and implementation-oriented criteria to ensure intermodal feasibility and realism. Each site co-locates rail and/or water nodes, provides continuous and safe pedestrian connections on the mapped street network, and offers proximate arterial access together with adjacency to major trip attractors such as employment centers, higher-education campuses, and retail or recreation clusters. Typical distance bands from the centroid of each candidate to the nearest stations or piers were 500 to 1000 m along the network. Implementation criteria prioritized consistency with station-area accessibility objectives, anticipated ease of management and right-of-way, and cross-river representation where coverage gaps were observed. This screening yielded a compact but plausible candidate set without constraining the subsequent optimization.
For this study, an intermodal hub is operationally defined as a candidate location that co-locates at least two primary fixed-guideway or water-based modes included in the study geodatabase and provides continuous walk access on the mapped street network to the nearest stations or piers within the evaluated travel time thresholds. Network impedance was specified as travel time under normal traffic conditions.
To evaluate robustness, the service time threshold was varied across τ ∈ {15, 20, 25} min, and each scenario was solved with k ∈ {1, 3, 5} facilities under identical network and demand settings. The MCLP objective maximizes population-weighted coverage subject to a fixed number of facilities and a time-based coverage condition. A 10 km geographic buffer was used only for preliminary screening and mapping context and was not a binding constraint in the optimization. Model outputs comprised scenario-specific facility selections and their service areas at each τ, which were then used to produce thematic maps and to inform the accessibility diagnostics, including the post-optimization isochrone analysis in Section 2.3.3 and the results reported in Section 3.2.1.
We adopt a 20 min access benchmark as a policy-salient tolerance that supports clear communication of coverage outcomes under typical operating conditions in Bangkok. To guard against arbitrariness, we evaluate sensitivity at 15 min and 25 min and find that the spatial priorities and cross-river balance remain stable across these thresholds. The 20 min value therefore serves as a practical mid-point that reflects realistic walking and feeder-vehicle times in congested urban contexts while preserving interpretability for planning practice.
Computational scalability in our workflow is governed by the size of the candidate set and the granularity of demand units. With origin-destination impedances precomputed on the same multimodal network, solving a coverage-based location-allocation instance scales with the product of the number of candidates and the number of demand units. City-wide problems with hundreds of facilities are tractable with standard GIS heuristics, while memory is dominated by the impedance matrix. When needed, hierarchical screening or regional tiling preserves solution quality and keeps runtime within practical bounds. The isochrone diagnostics reuse the identical network and impedance settings, so adding thresholds or expanding the extent incurs minimal additional overhead and preserves strict comparability across scenarios.

2.3.3. Isochrone-Based Accessibility Diagnostics and Multimodal Overlay

An isochrone represents the set of locations that can reach a specified destination within a given travel-time threshold on the study network. In this study, it visualizes, for each scenario, the spatial extent from which at least one selected hub is reachable within successive thresholds, thereby making the structure of accessibility legible in map form. Following the MCLP optimization in Section 2.3.2, cumulative travel-time isochrones were generated at 5 min intervals up to 60 min using the same multimodal network and impedance settings. These layers are diagnostic outputs that do not alter the optimization constraints and are used to interpret spatial balance, peripheral reach, cross-river coverage, and potential overlap or redundancy among hubs in the one-, three-, and five-hub scenarios.
The isochrones were constructed by computing one-to-many network travel times from the hub set selected for each scenario and then delineating contour bands at 5 min increments. For multiple hubs, we evaluated the union of individual hub isochrones at each threshold to represent reachability to the scenario’s hub set. For the integration appraisal, the selected hubs and their isochrone bands were overlaid in GIS with the linework and nodes compiled in Section 2.3.1, including BTS, MRT, SRT, Airport Rail Link, BRT, and principal water routes. Proximity to stations and piers and alignment with trunk corridors were assessed as map-based walking adjacency. No additional constraints were added to the optimization model.
The diagnostic value of isochrones lies in their direct linkage to the accessibility concept formalized in Section 1.3. Let t i h denote network travel time from demand unit i to hub h and let H be the set of hubs in a scenario. The coverage condition visualized by an isochrone of threshold τ is m i n h H t i h τ . Consistent with the MCLP weights, we summarize population coverage as C ( τ ) = i w i   1 [ m i n h H t i h τ ] i w i . Thus, the isochrone map is a cartographic expression of the cumulative-opportunity function, making it possible to read off where coverage begins, where barriers such as river crossings constrain reach, where bands overlap to indicate redundancy, and how the extent of covered areas evolves between thresholds.

3. Results

3.1. Road Intersection Density (Network Analysis)

The road network of Bangkok was analyzed using GIS-based network analysis to identify spatial concentrations of intersections that function as key nodes in the city’s mobility system. The dataset comprised 135,347 road-intersection points across the metropolitan area. The highest intersection densities occur in inner Bangkok, particularly in Pathum Wan, Ratchathewi, and Bang Rak, where complex street geometries, high building densities, and intensive commercial and residential activity co-occur. In contrast, peripheral districts such as Nong Chok and Lat Krabang exhibit markedly lower intersection densities, reflecting suburban and semi-rural land-use patterns.
The spatial distribution of intersection density aligns with population concentration, public transport demand, and existing congestion levels. High-density areas often experience bottlenecks and overloaded feeder systems, yet they also present significant opportunities for effective multimodal integration because of their proximity to major rail and water corridors. These findings provide a foundation for identifying intermodal hub locations that can alleviate pressure on dense traffic nodes while enhancing overall network efficiency. Figure 4 maps these patterns, illustrating the clustering of high-density nodes in central districts and sparser configurations toward the periphery.
For transparency, intersection points were operationally defined as nodes derived from the road-centerline dataset using network-based extraction with duplicate removal, and all layers followed the projection standard specified in Section 2.3 (UTM Zone 47N, WGS84).

3.2. Hub Scenario Modeling (1, 3, and 5 Hubs)

To identify effective locations for intermodal transfer hubs in Bangkok, a location-allocation analysis using the Maximum Coverage model was applied across three scenarios: single-hub, three-hub, and five-hub configurations. The objective was to maximize the population served within an acceptable travel time threshold while ensuring alignment with existing transit infrastructure. All scenarios were solved under identical network settings as specified in Section 2.3.2 to ensure comparability of results.
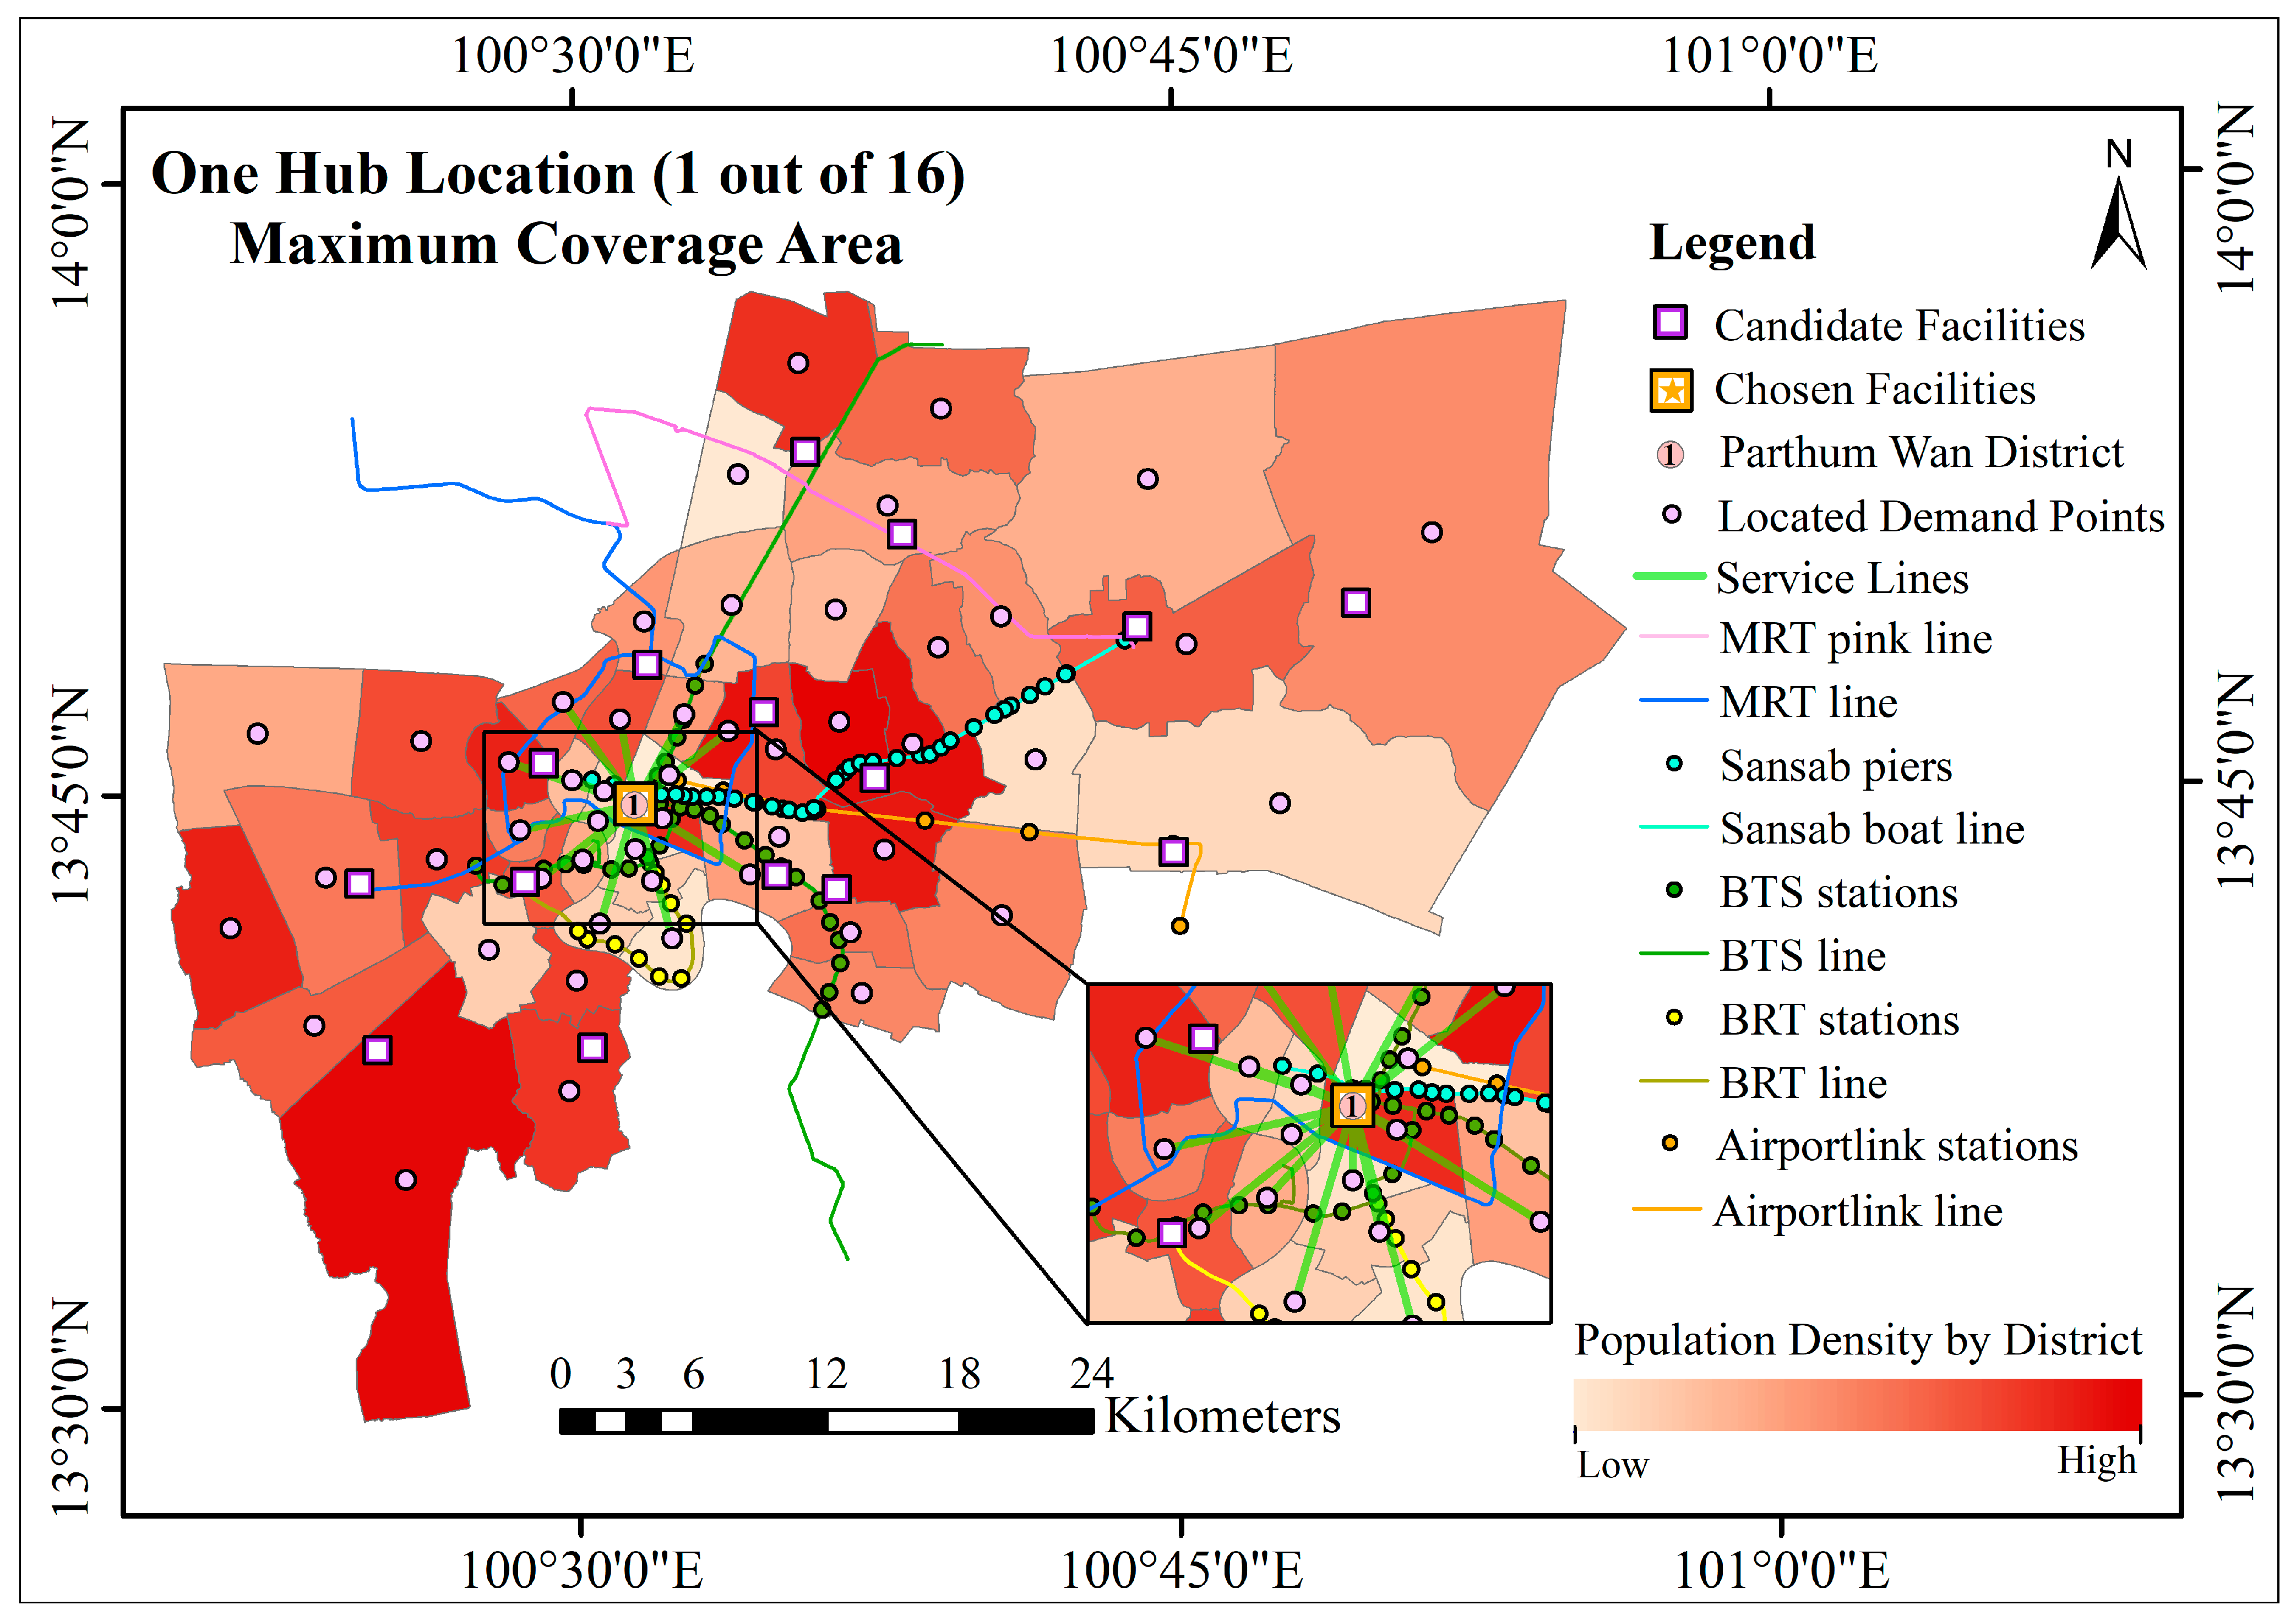
In the one-hub scenario, Pathum Wan district emerged as the optimal site. Situated near BTS and MRT lines and in proximity to Charoen Phon Bridge Pier, the proposed hub affords direct access to multimodal services. This location serves an internal district population of 40,844 residents and extends coverage to seventeen surrounding districts within an approximately 8621.62 m radius. The central position is advantageous given the concentration of transit lines and high pedestrian volumes.
Spatially, the maximum-coverage footprint in Figure 5 places the single hub at the Pathum Wan CBD node where BTS-MRT interchanges, the BRT corridor, and the Saen Saep boat spine converge. The zoom-in inset highlights that the chosen site sits at the intersection of multiple service lines and high densities of located demand points, allowing short FLM walks and direct transfers to rail and boat services. Under the specified travel-time threshold, this configuration captures an aggregate catchment of 1,238,114 residents across 17 districts (including 40,844 residents within Pathum Wan itself) within an effective network radius of 8.62 km. The map’s district-level population gradient shows the hub centrally embedded in the highest-density belt, explaining the stability of Pathum Wan as the top 1 of 16 candidate solutions.
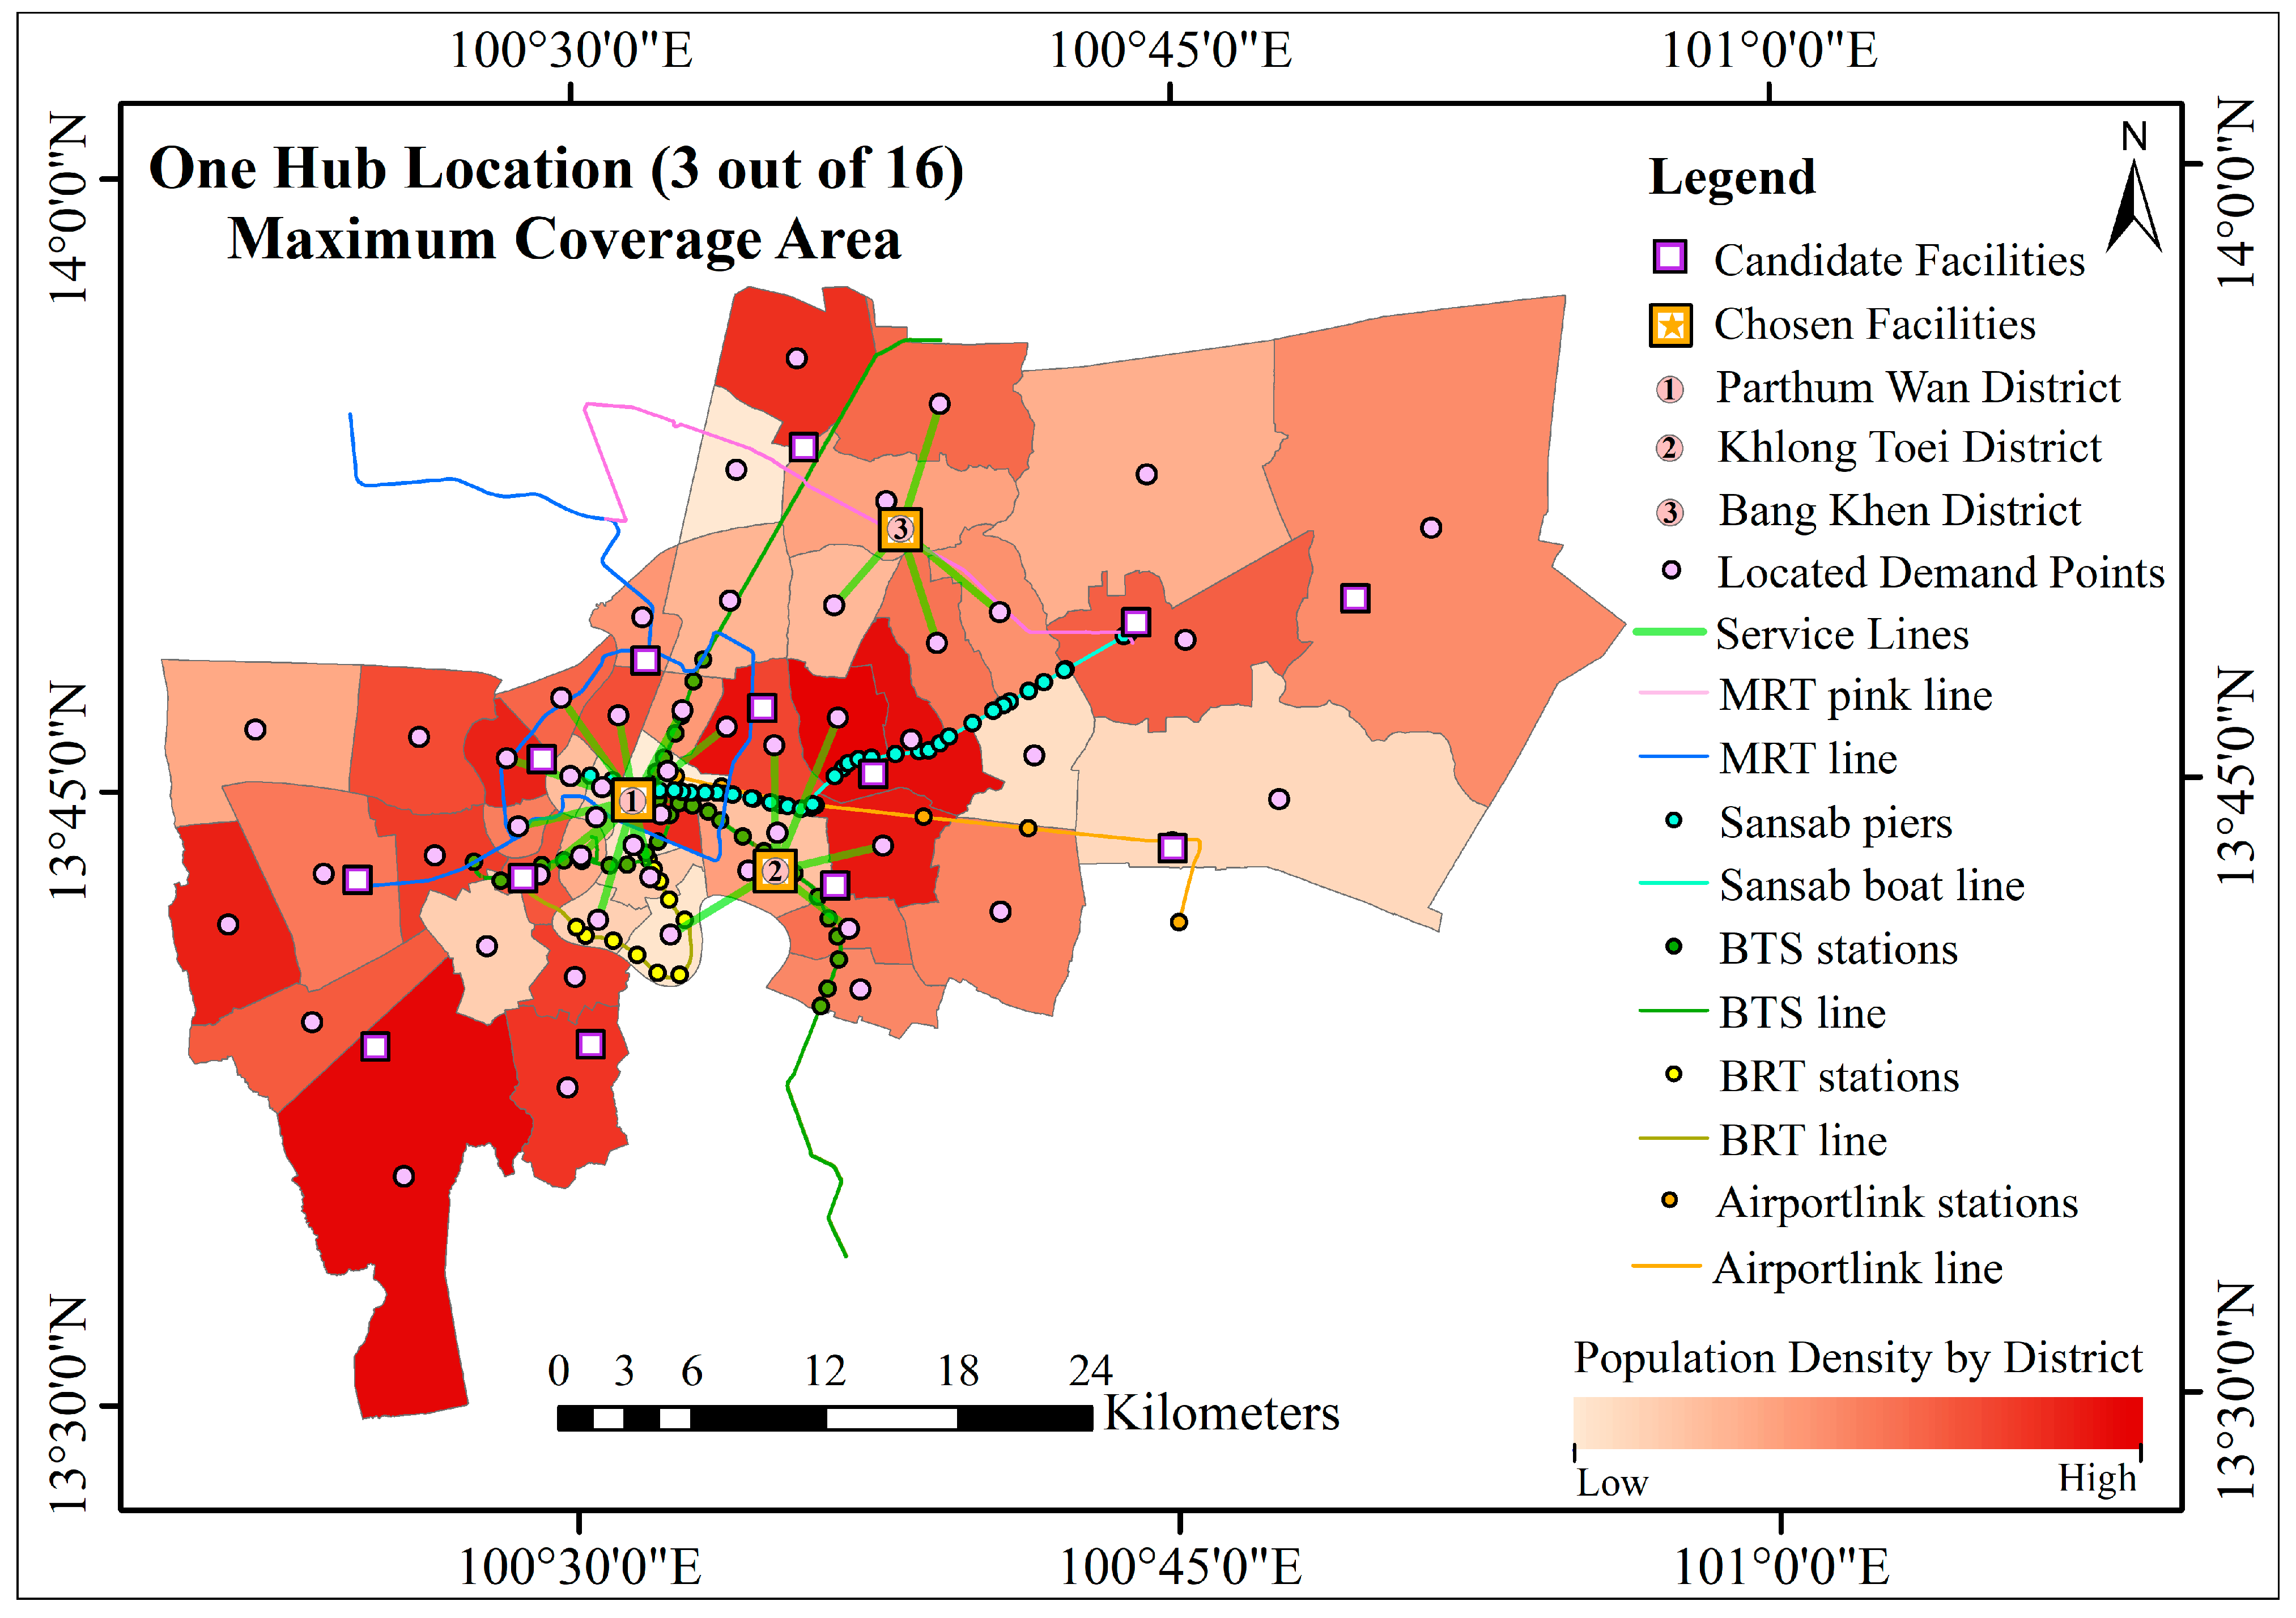
Adding hubs southward at Khlong Toei and northward at Bang Khen (Figure 6) expands coverage along the port/BRT axis and the Pink-Line corridor, respectively, while retaining Pathum Wan as the core transfer node. This triad elevates the total population served to 2,458,026 people, partitioned as 1,073,554 (Pathum Wan), 642,327 (Khlong Toei), and 742,145 (Bang Khen). The spatial pattern shows denser southern and northern catchments pulling in demand clusters that lie beyond the one-hub reach, with the new hubs sitting directly on rail or BRT spines to suppress FLM penalties and reduce reliance on low-capacity feeders. Notably, the west-bank (Thon Buri side) remains comparatively under-covered at this stage, consistent with fewer cross-river rail connectors in the network.
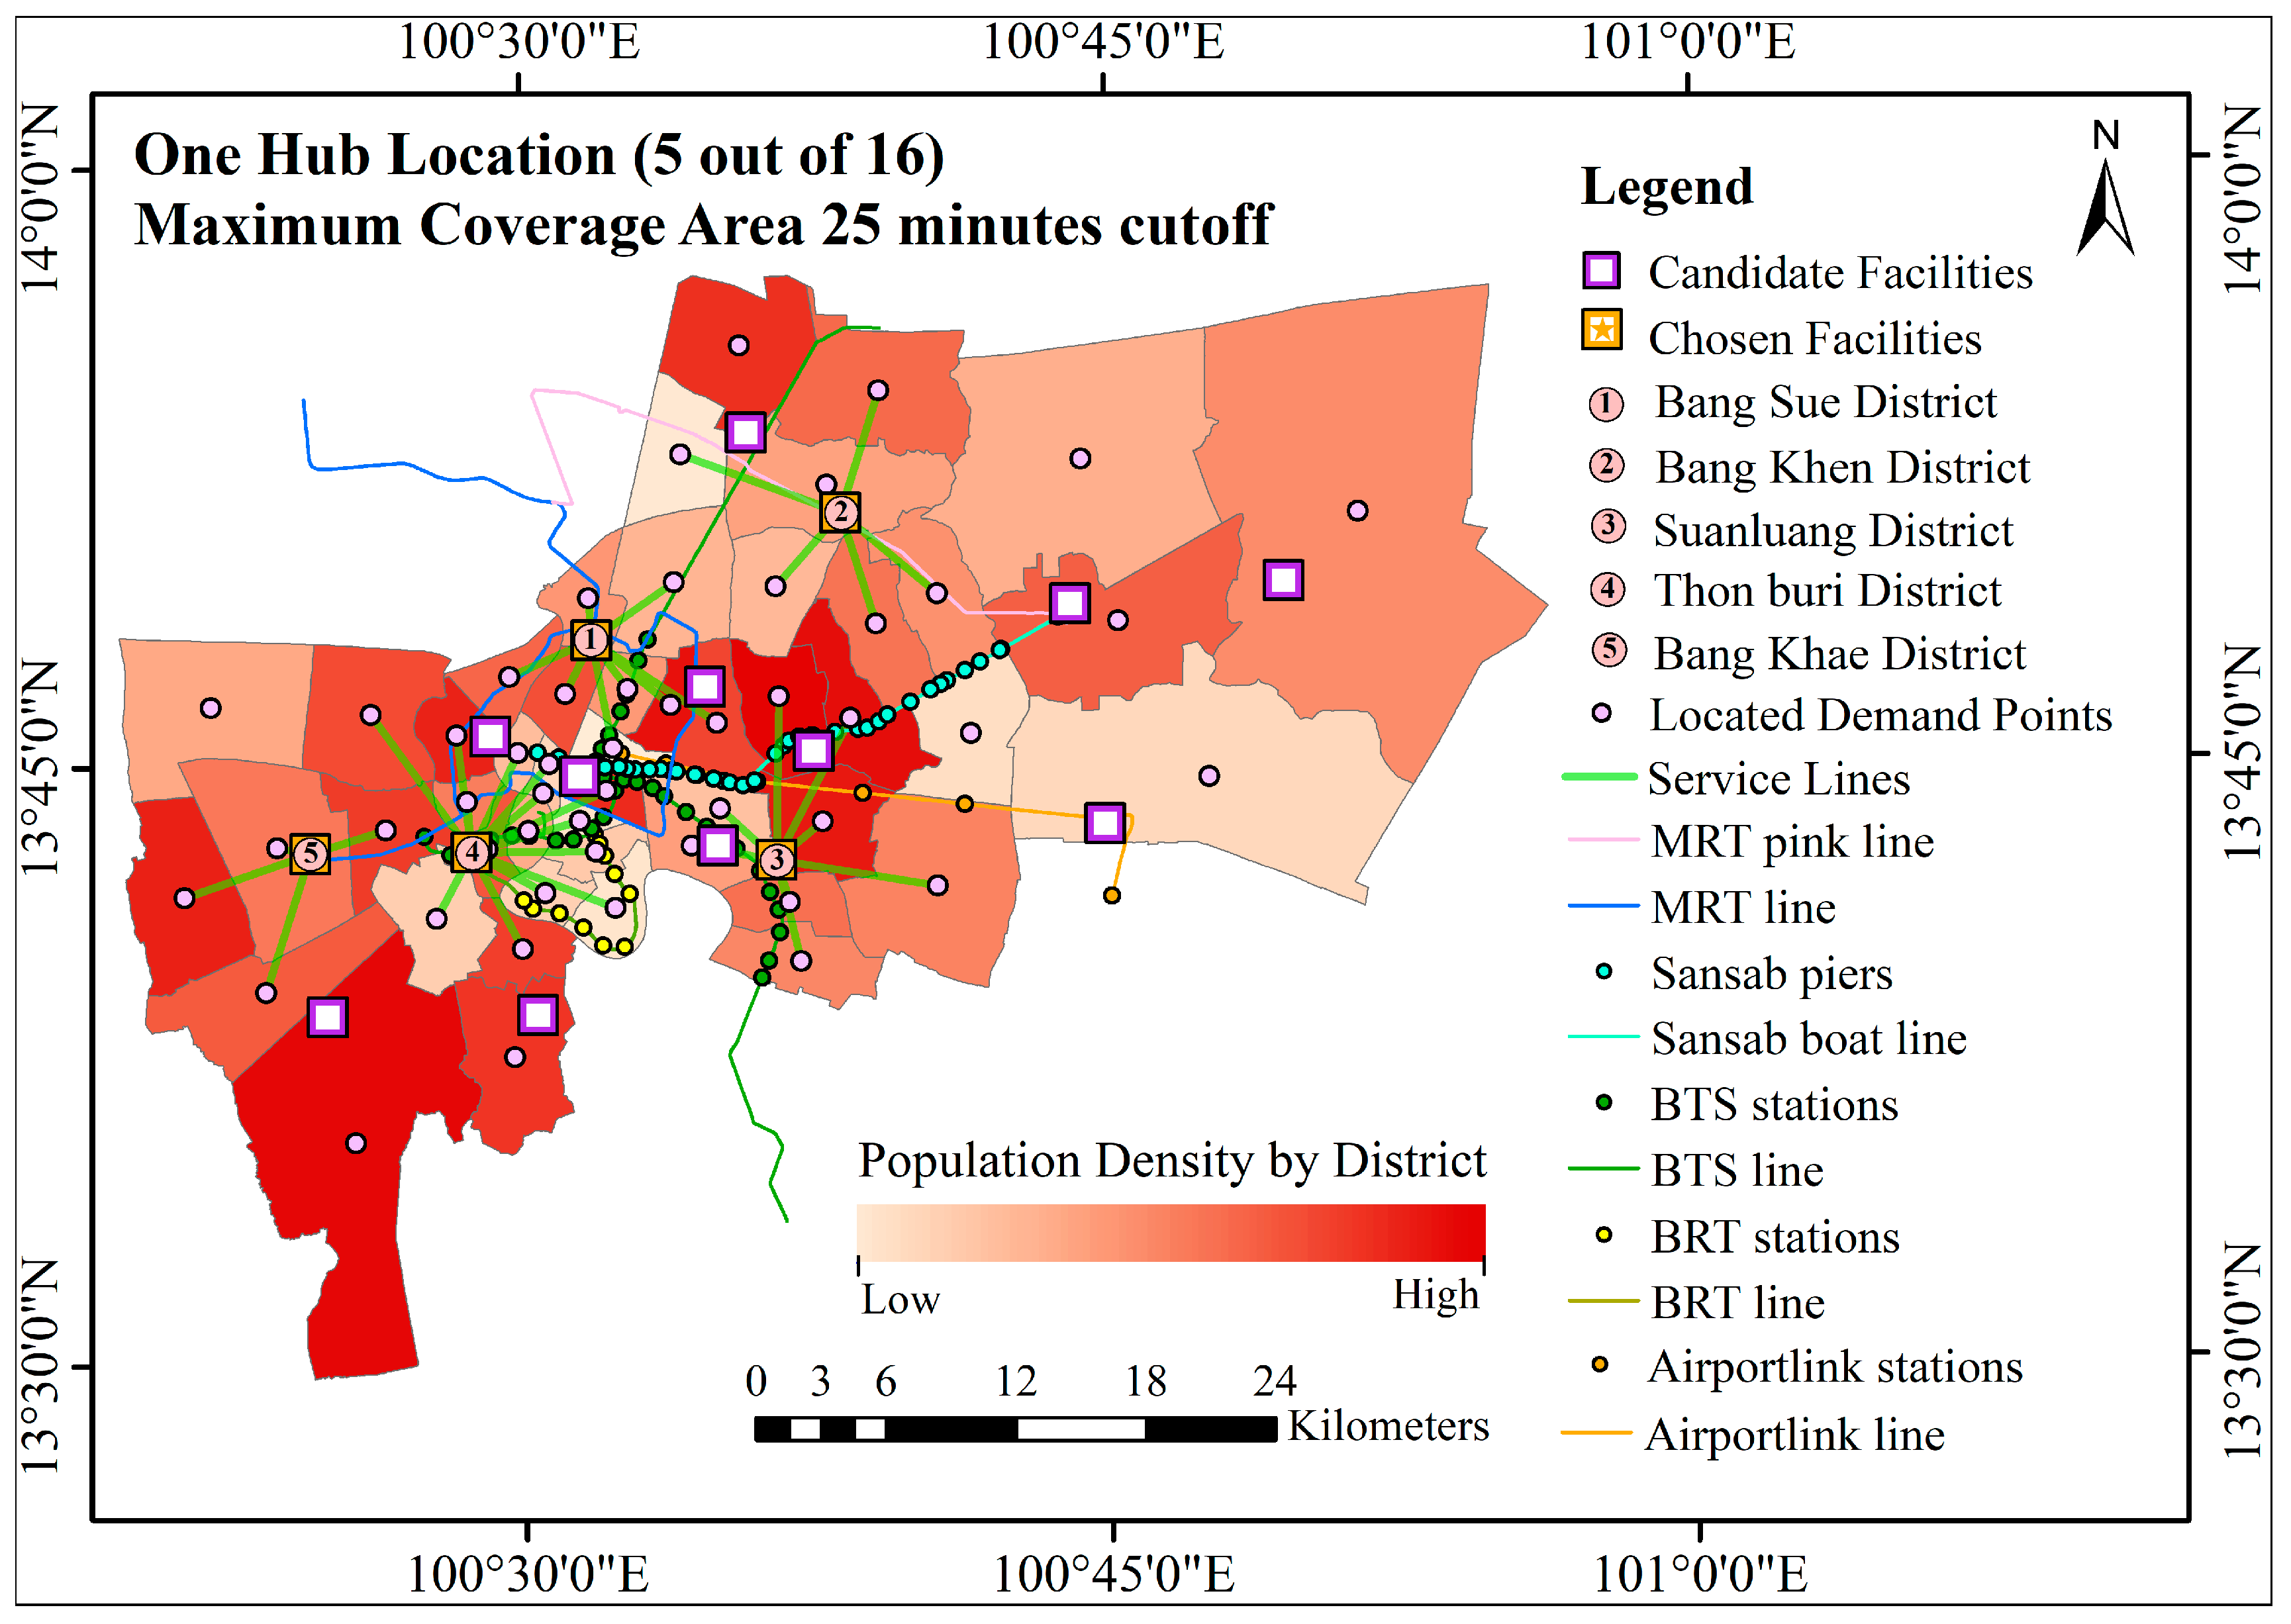
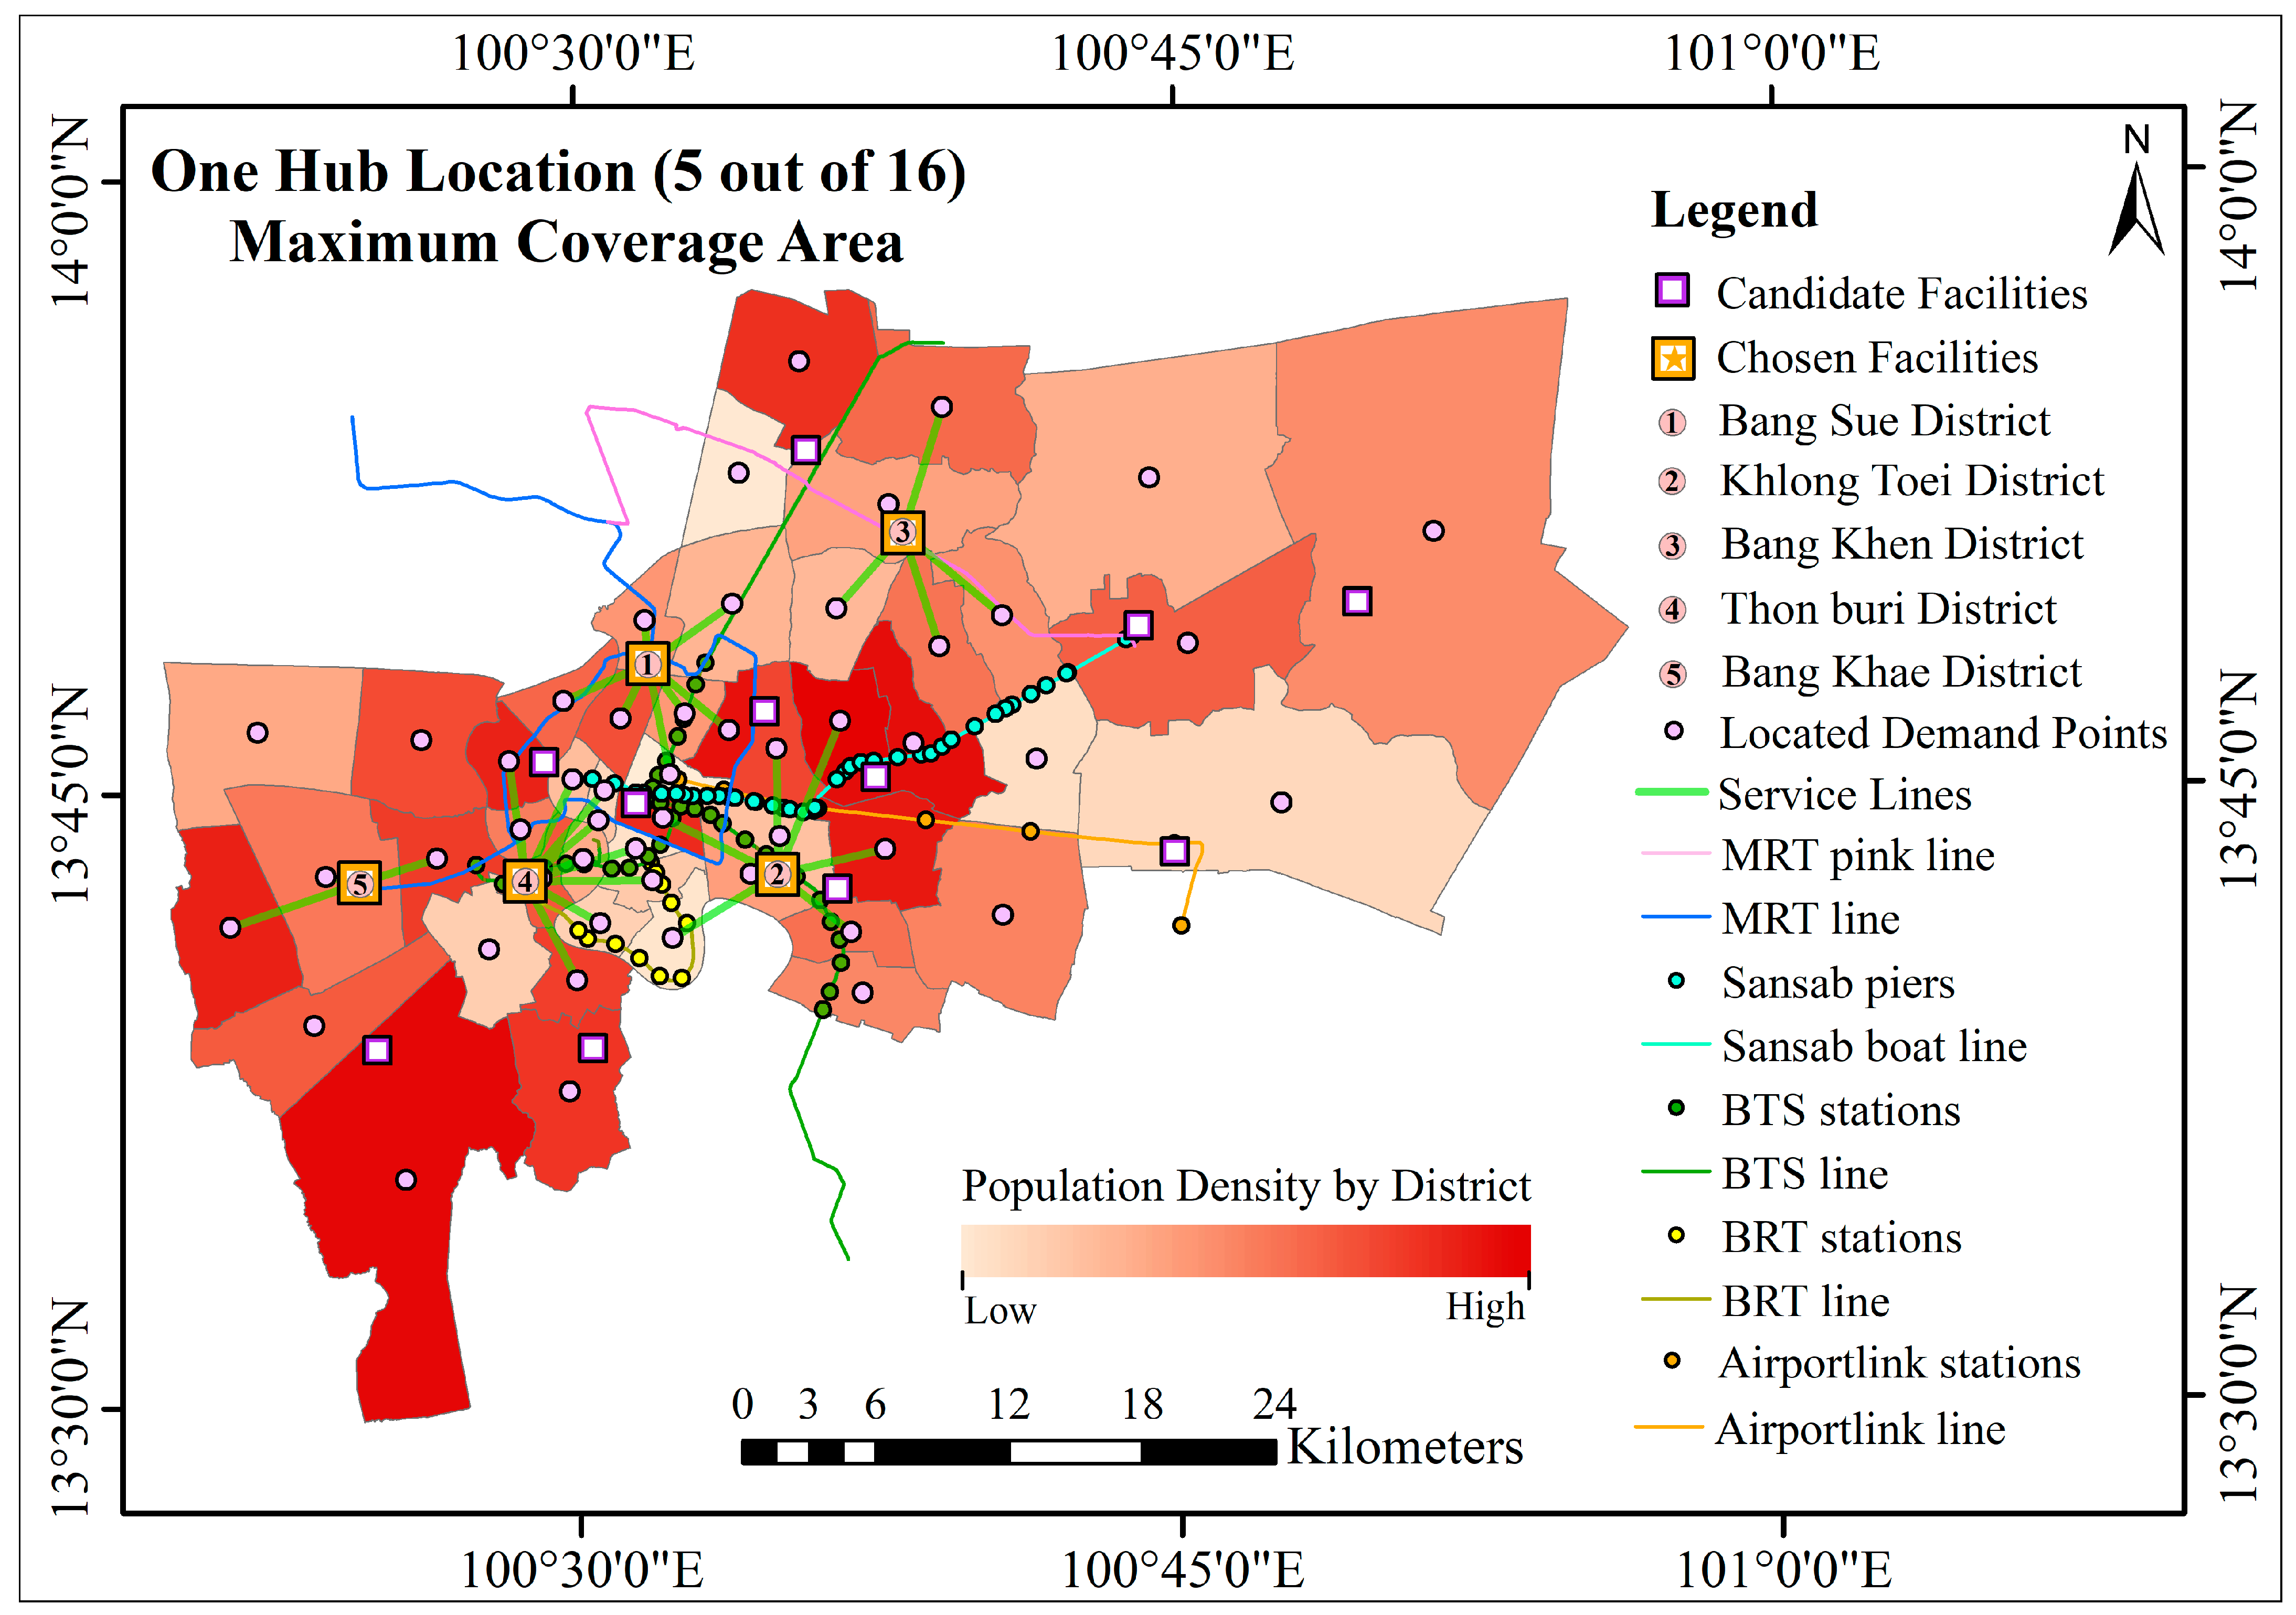
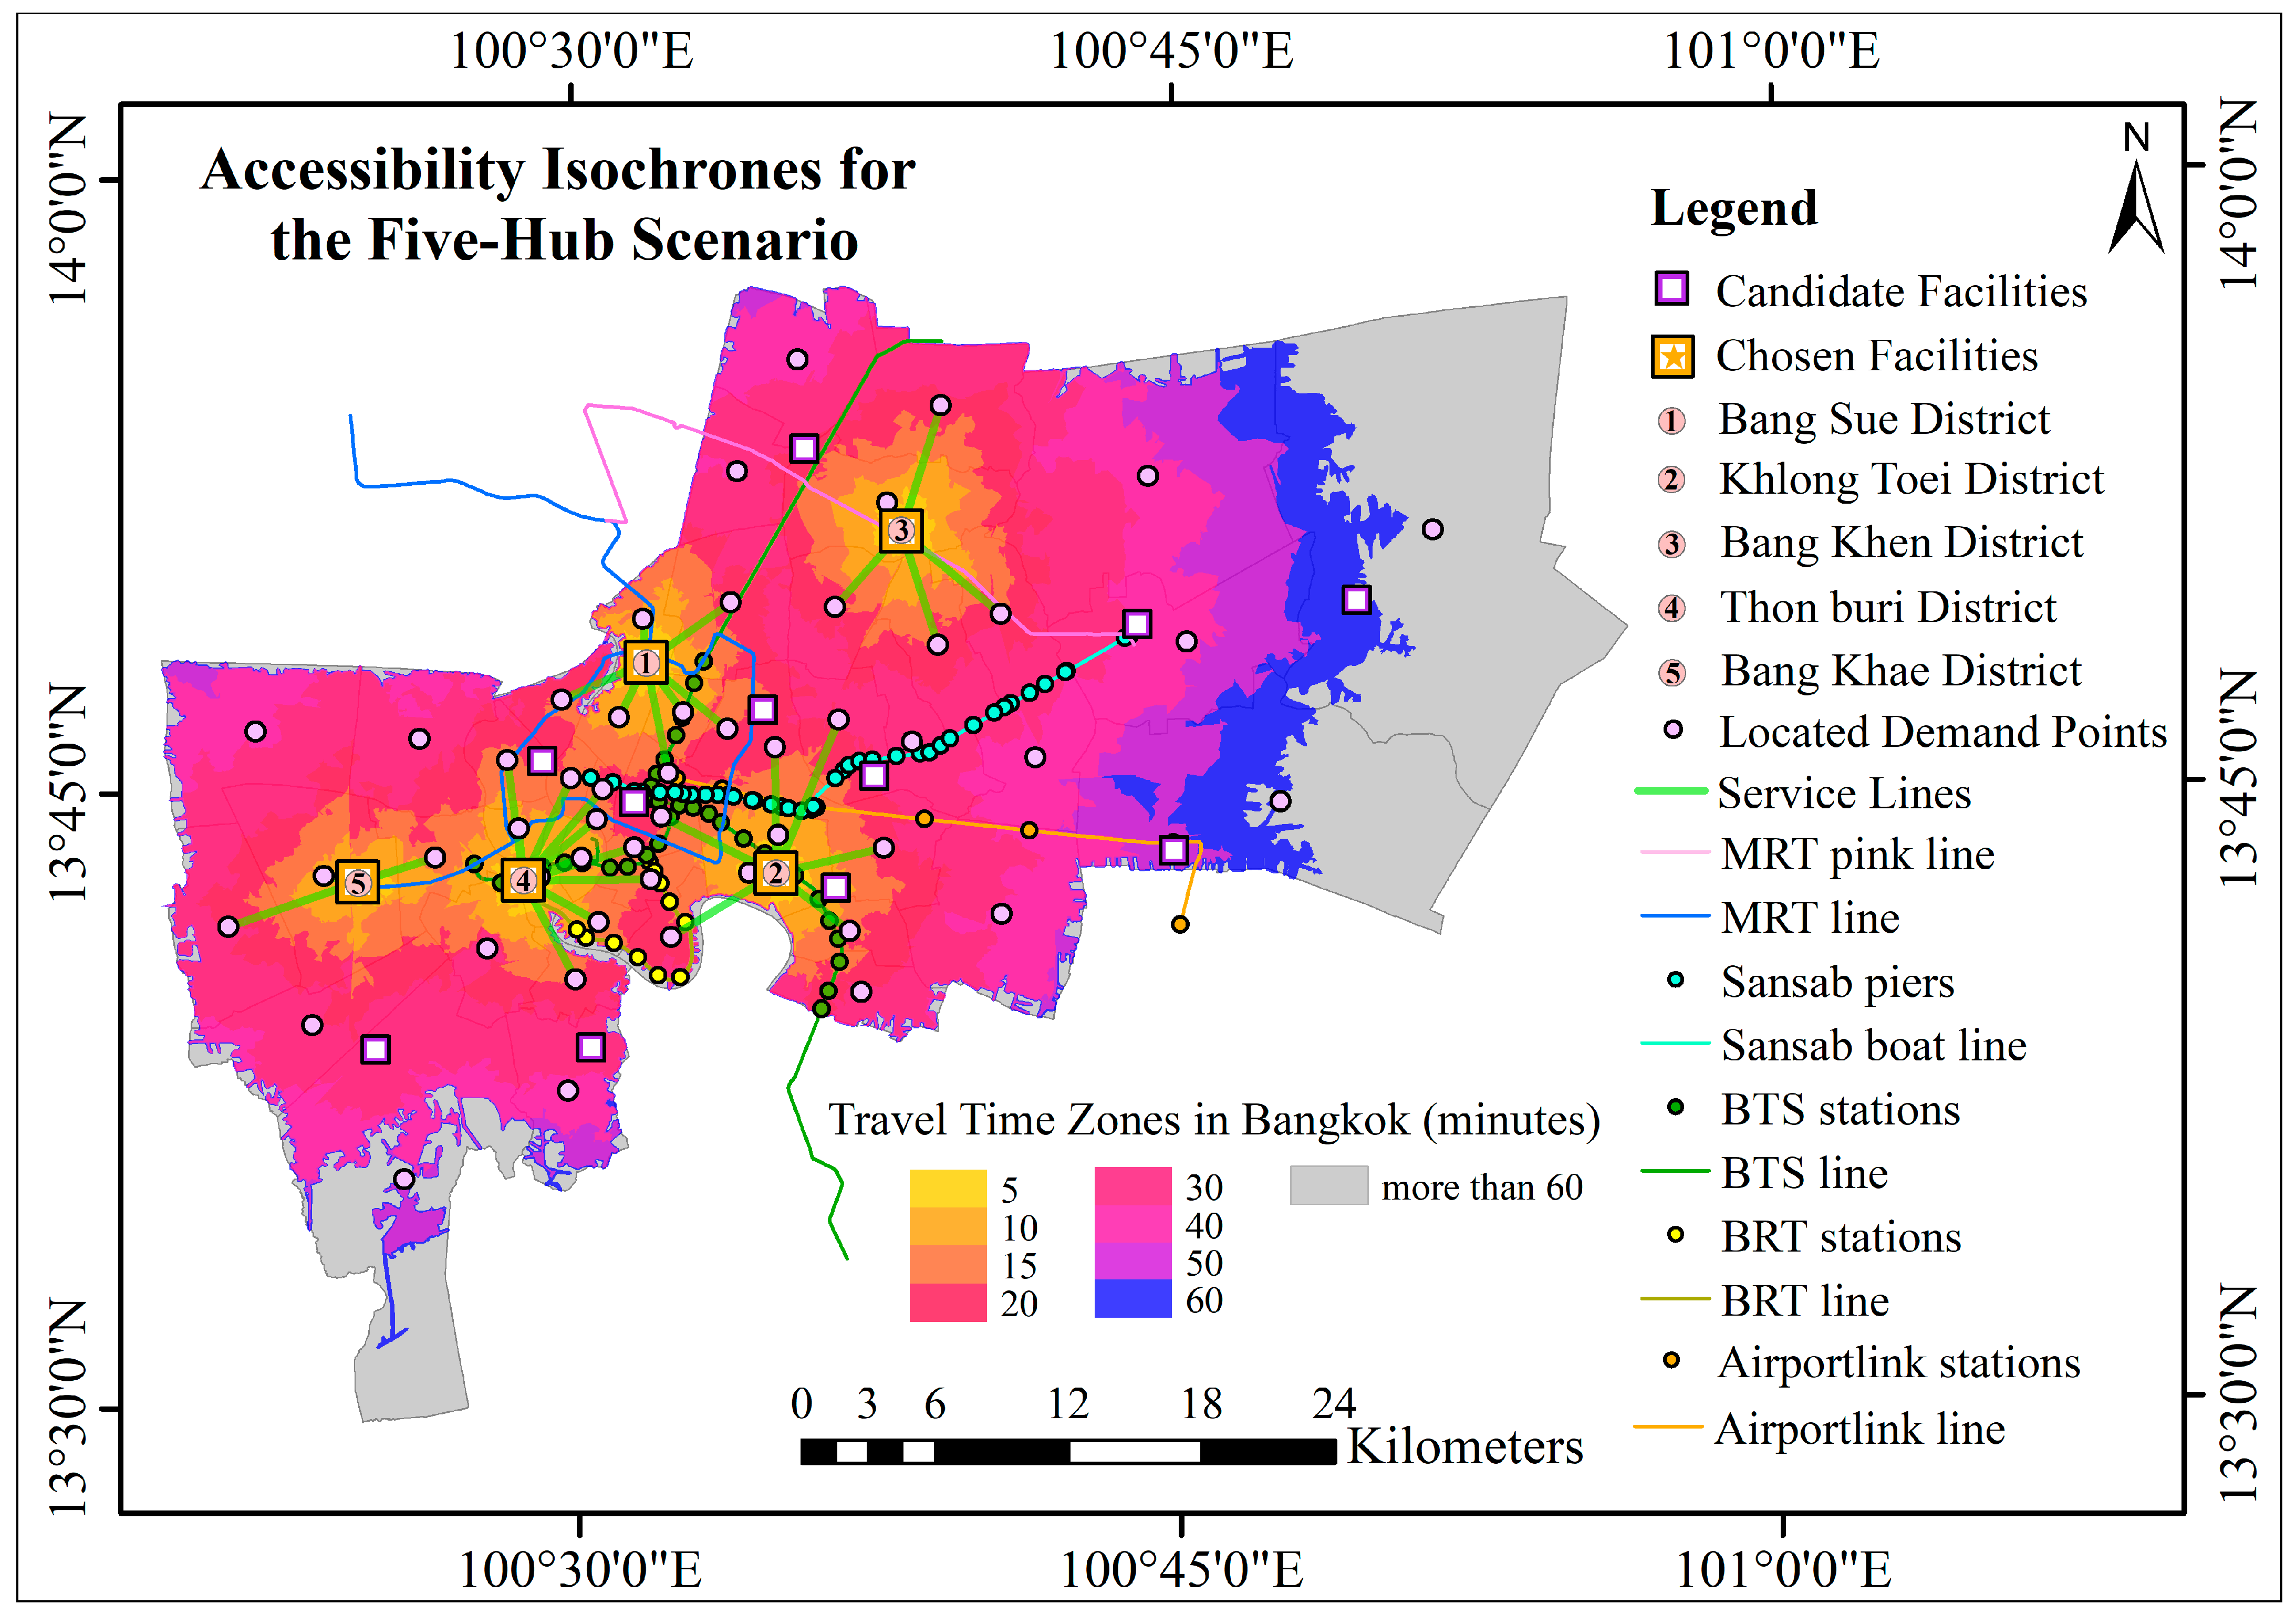
The five-hub solution (Figure 7) completes a cross-river and cross-city lattice by adding Thon Buri and Bang Khae to the west bank and Bang Sue on the north-west rail convergence, while keeping Bang Khen and Khlong Toei. This configuration maximizes coverage to 3,277,405 residents overall, with hub-level catchments of 700,617 (Thon Buri), 469,566 (Bang Khae), 681,906 (Bang Sue), 742,145 (Bang Khen), and 683,171 (Khlong Toei). The two west-bank hubs bridge the river discontinuity and capture high-density districts previously outside the modeled service threshold, whereas Bang Sue closes a gap along the MRT/BTS interchange belt and the intercity rail interface. The resulting spatial coverage is markedly more balanced across Bangkok’s demographic gradient, aligning hubs with observable demand clusters and major service lines while minimizing uncovered pockets at the urban periphery.
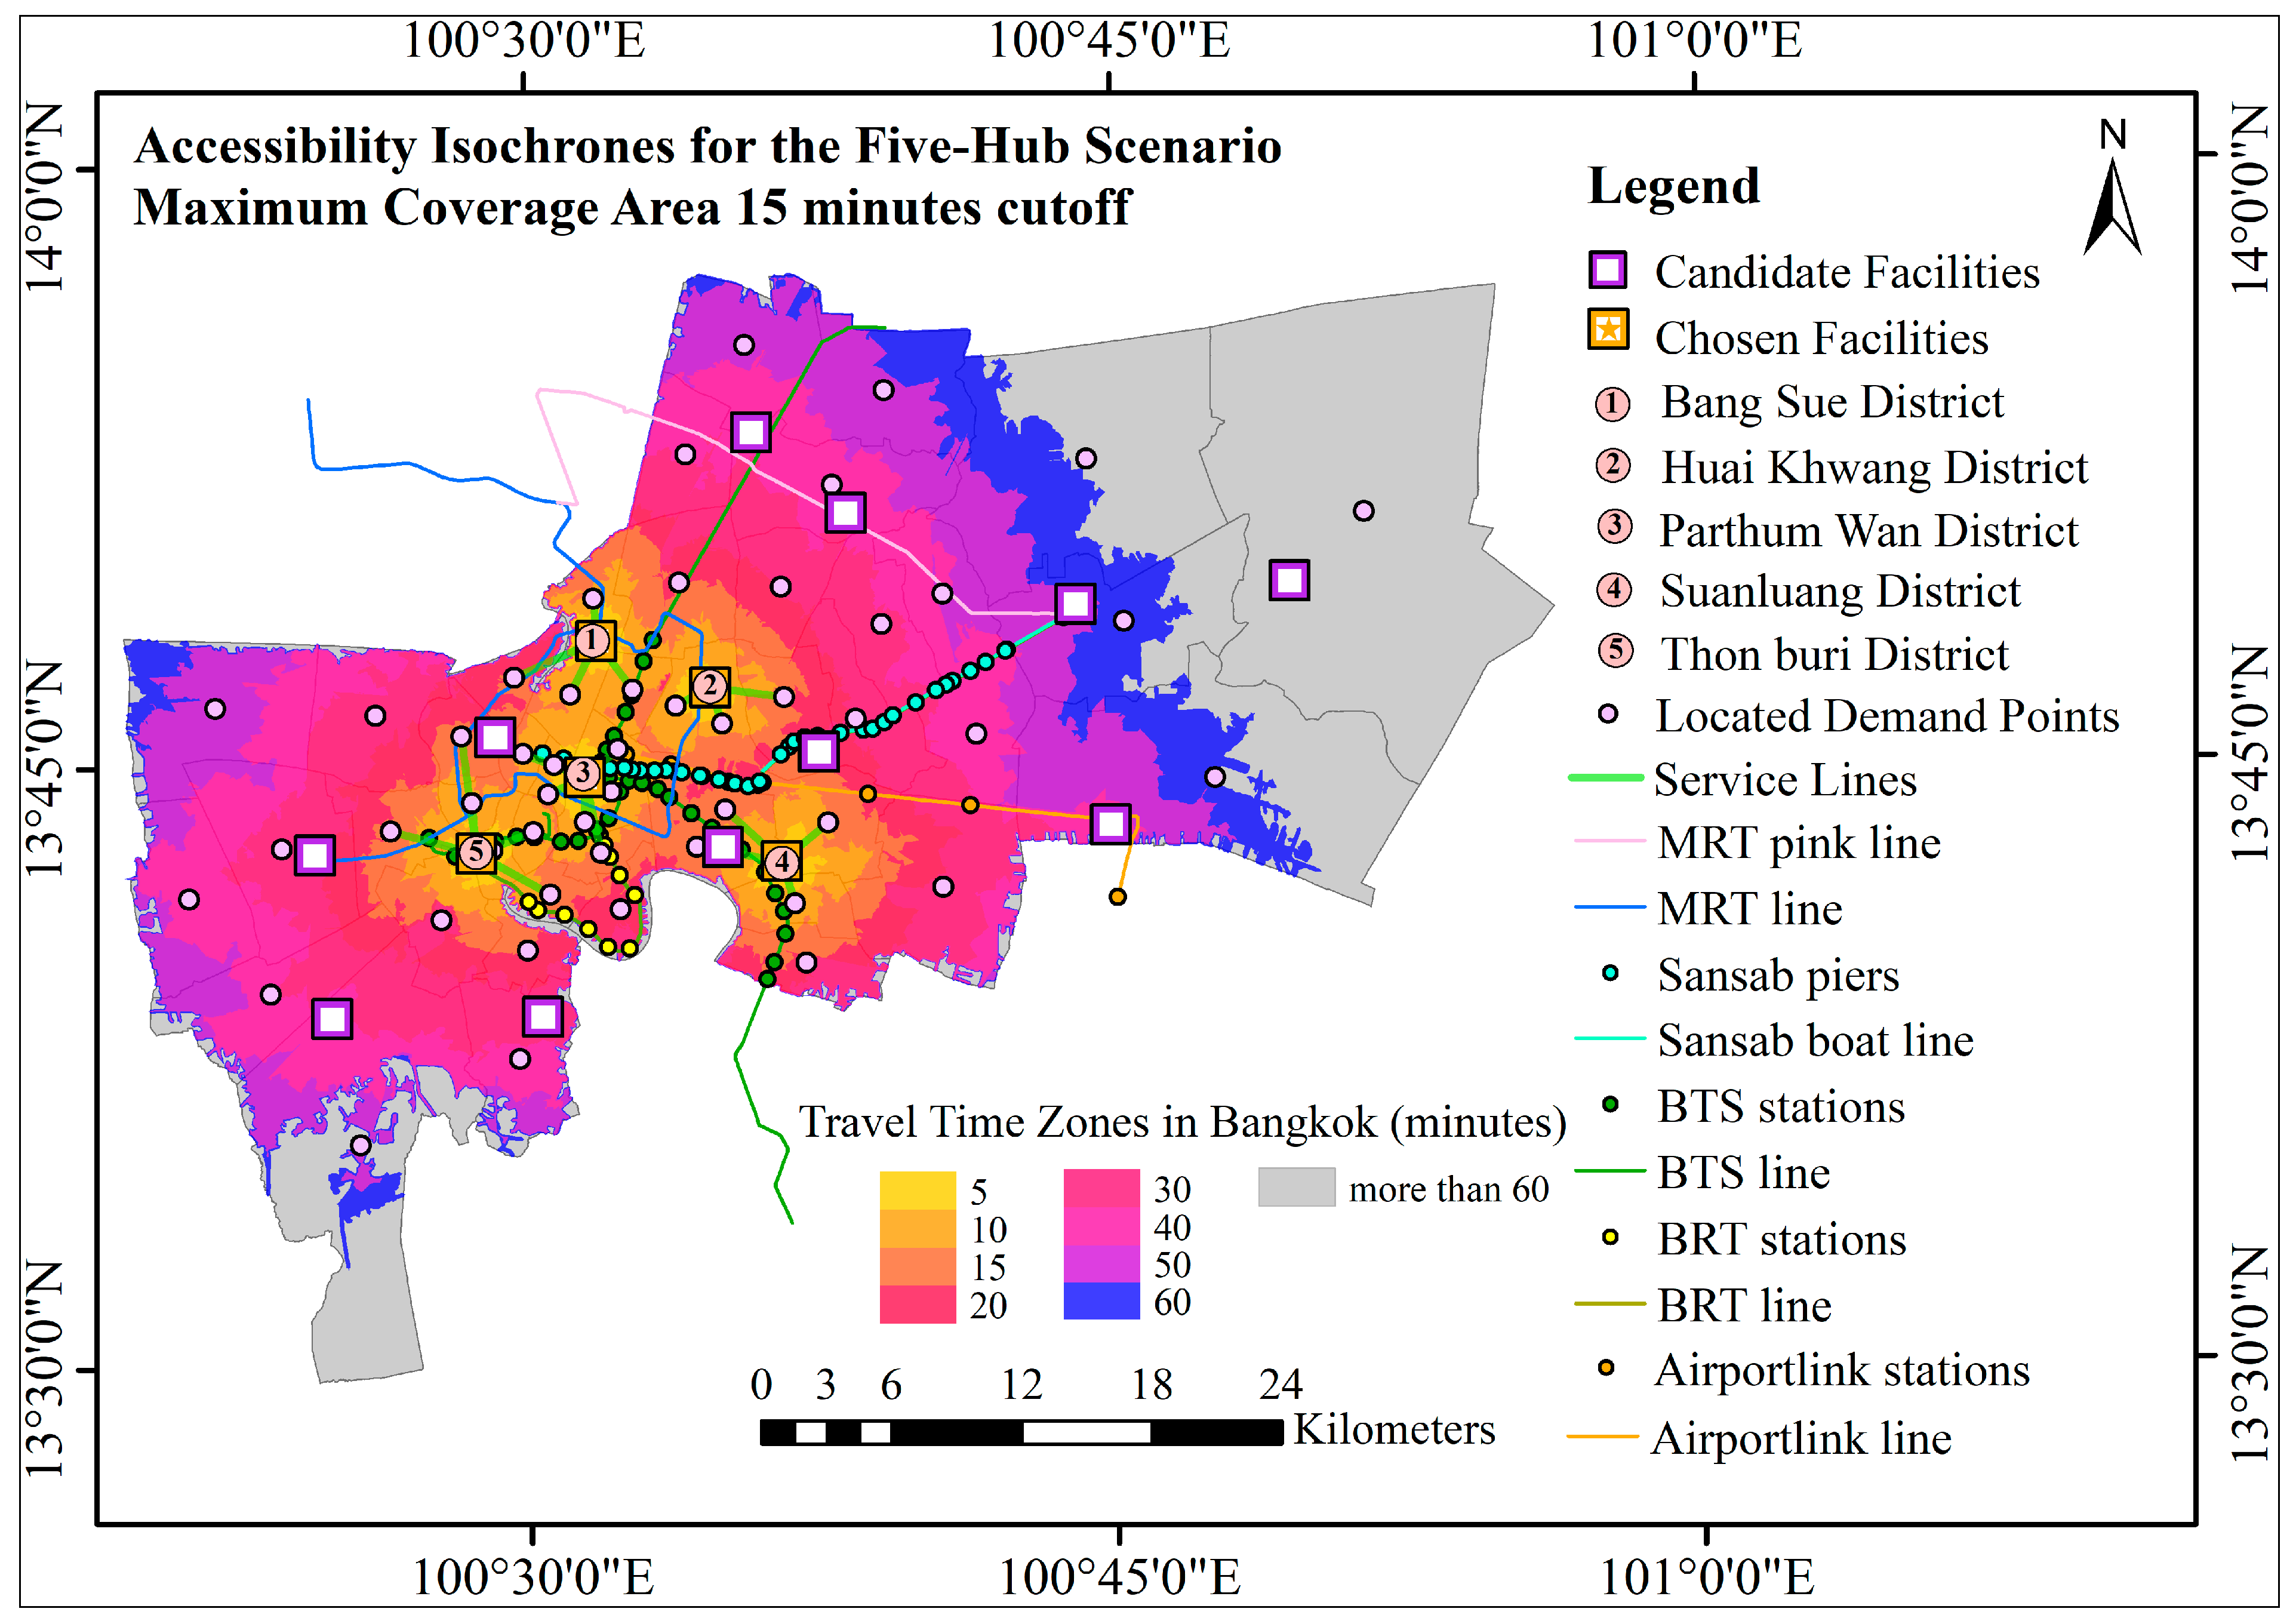
A sensitivity check at 15 and 25 min confirms the robustness of the spatial patterns. Figure A1, Figure A2, Figure A3, Figure A4, Figure A5 and Figure A6 (Appendix A) show coverage footprints for one-, three-, and five-hub configurations under 15 and 25 min, with corresponding isochrones in Figure A7, Figure A8, Figure A9, Figure A10, Figure A11 and Figure A12. Table A1 summarizes covered administrative units and total covered population for each configuration, together with hub-level catchments.

3.2.1. Service Radii and Travel Time

To evaluate practical accessibility, each hub configuration was modeled using cumulative travel-time thresholds from 5 to 60 min under typical network conditions. Isochrones were derived from network-based impedance calculations consistent with Section 2.3, delineating coverage in incremental time bands and visualizing the progressive decay of accessibility with distance from multimodal transfer points. The 20 min reference surfaces are reported in Figure 8, Figure 9 and Figure 10, with sensitivity isochrones at 15 and 25 min provided in Figure A7, Figure A8, Figure A9, Figure A10, Figure A11 and Figure A12 together with coverage counts in Table A1.
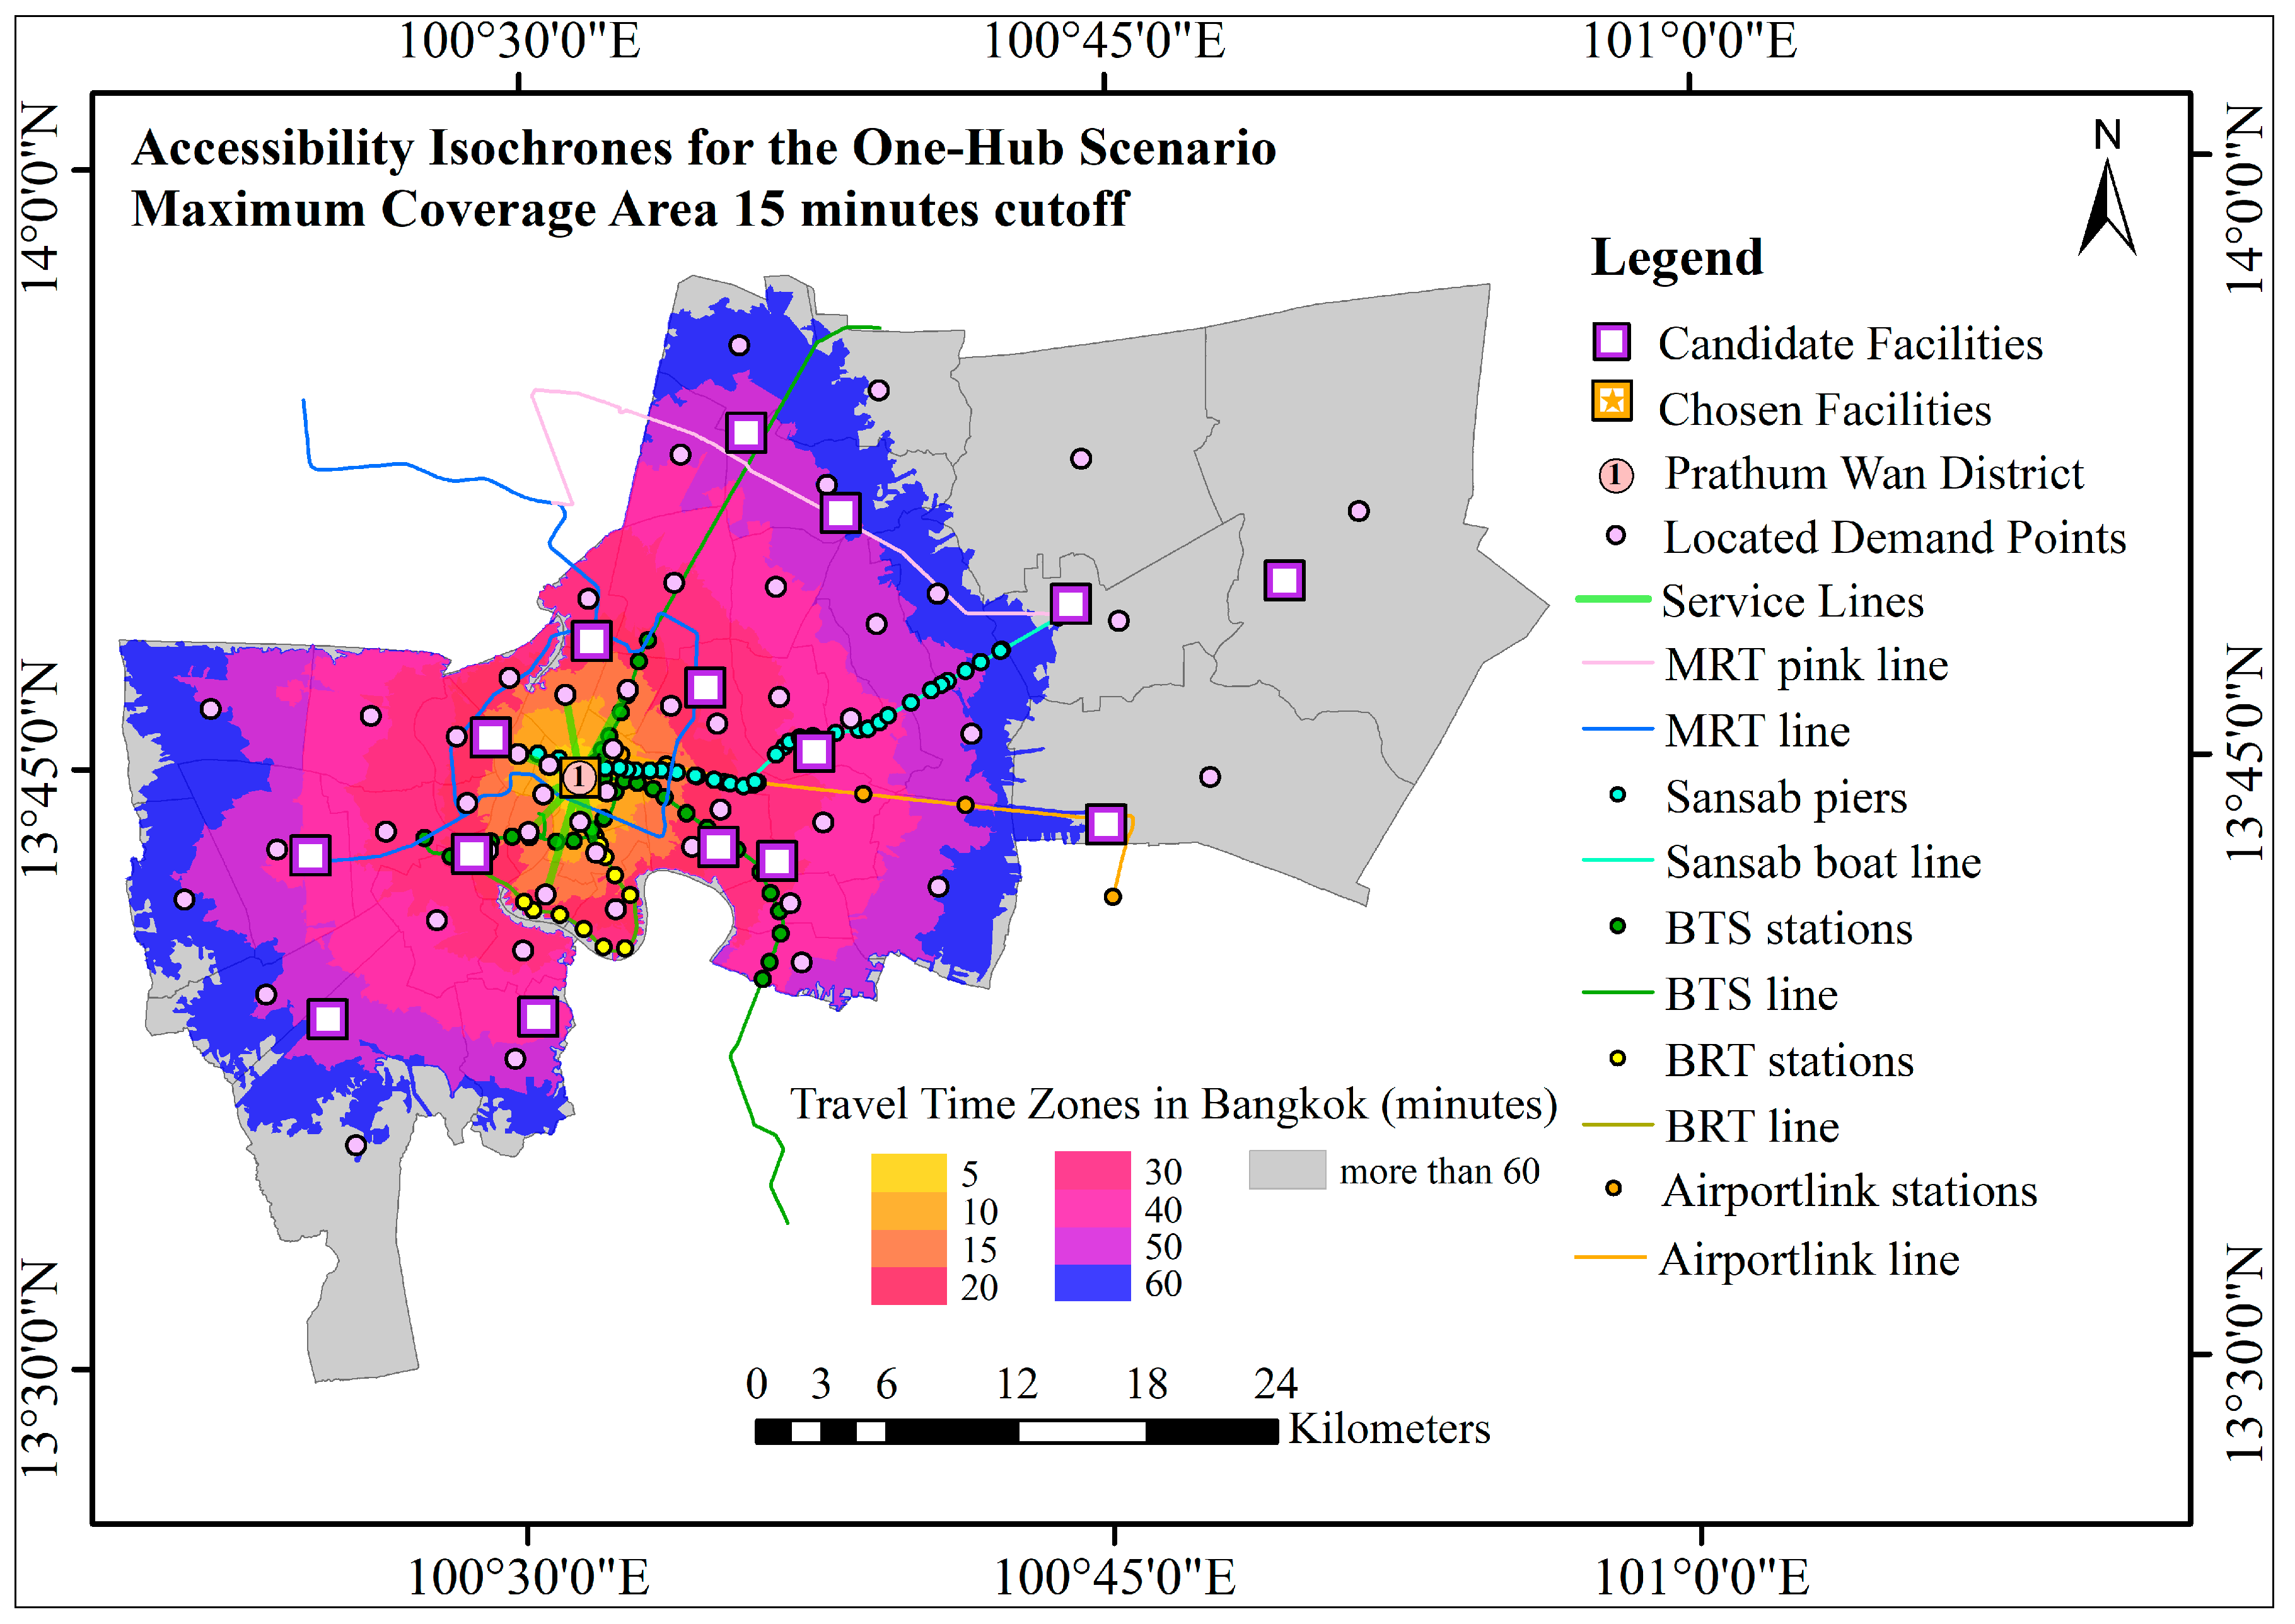
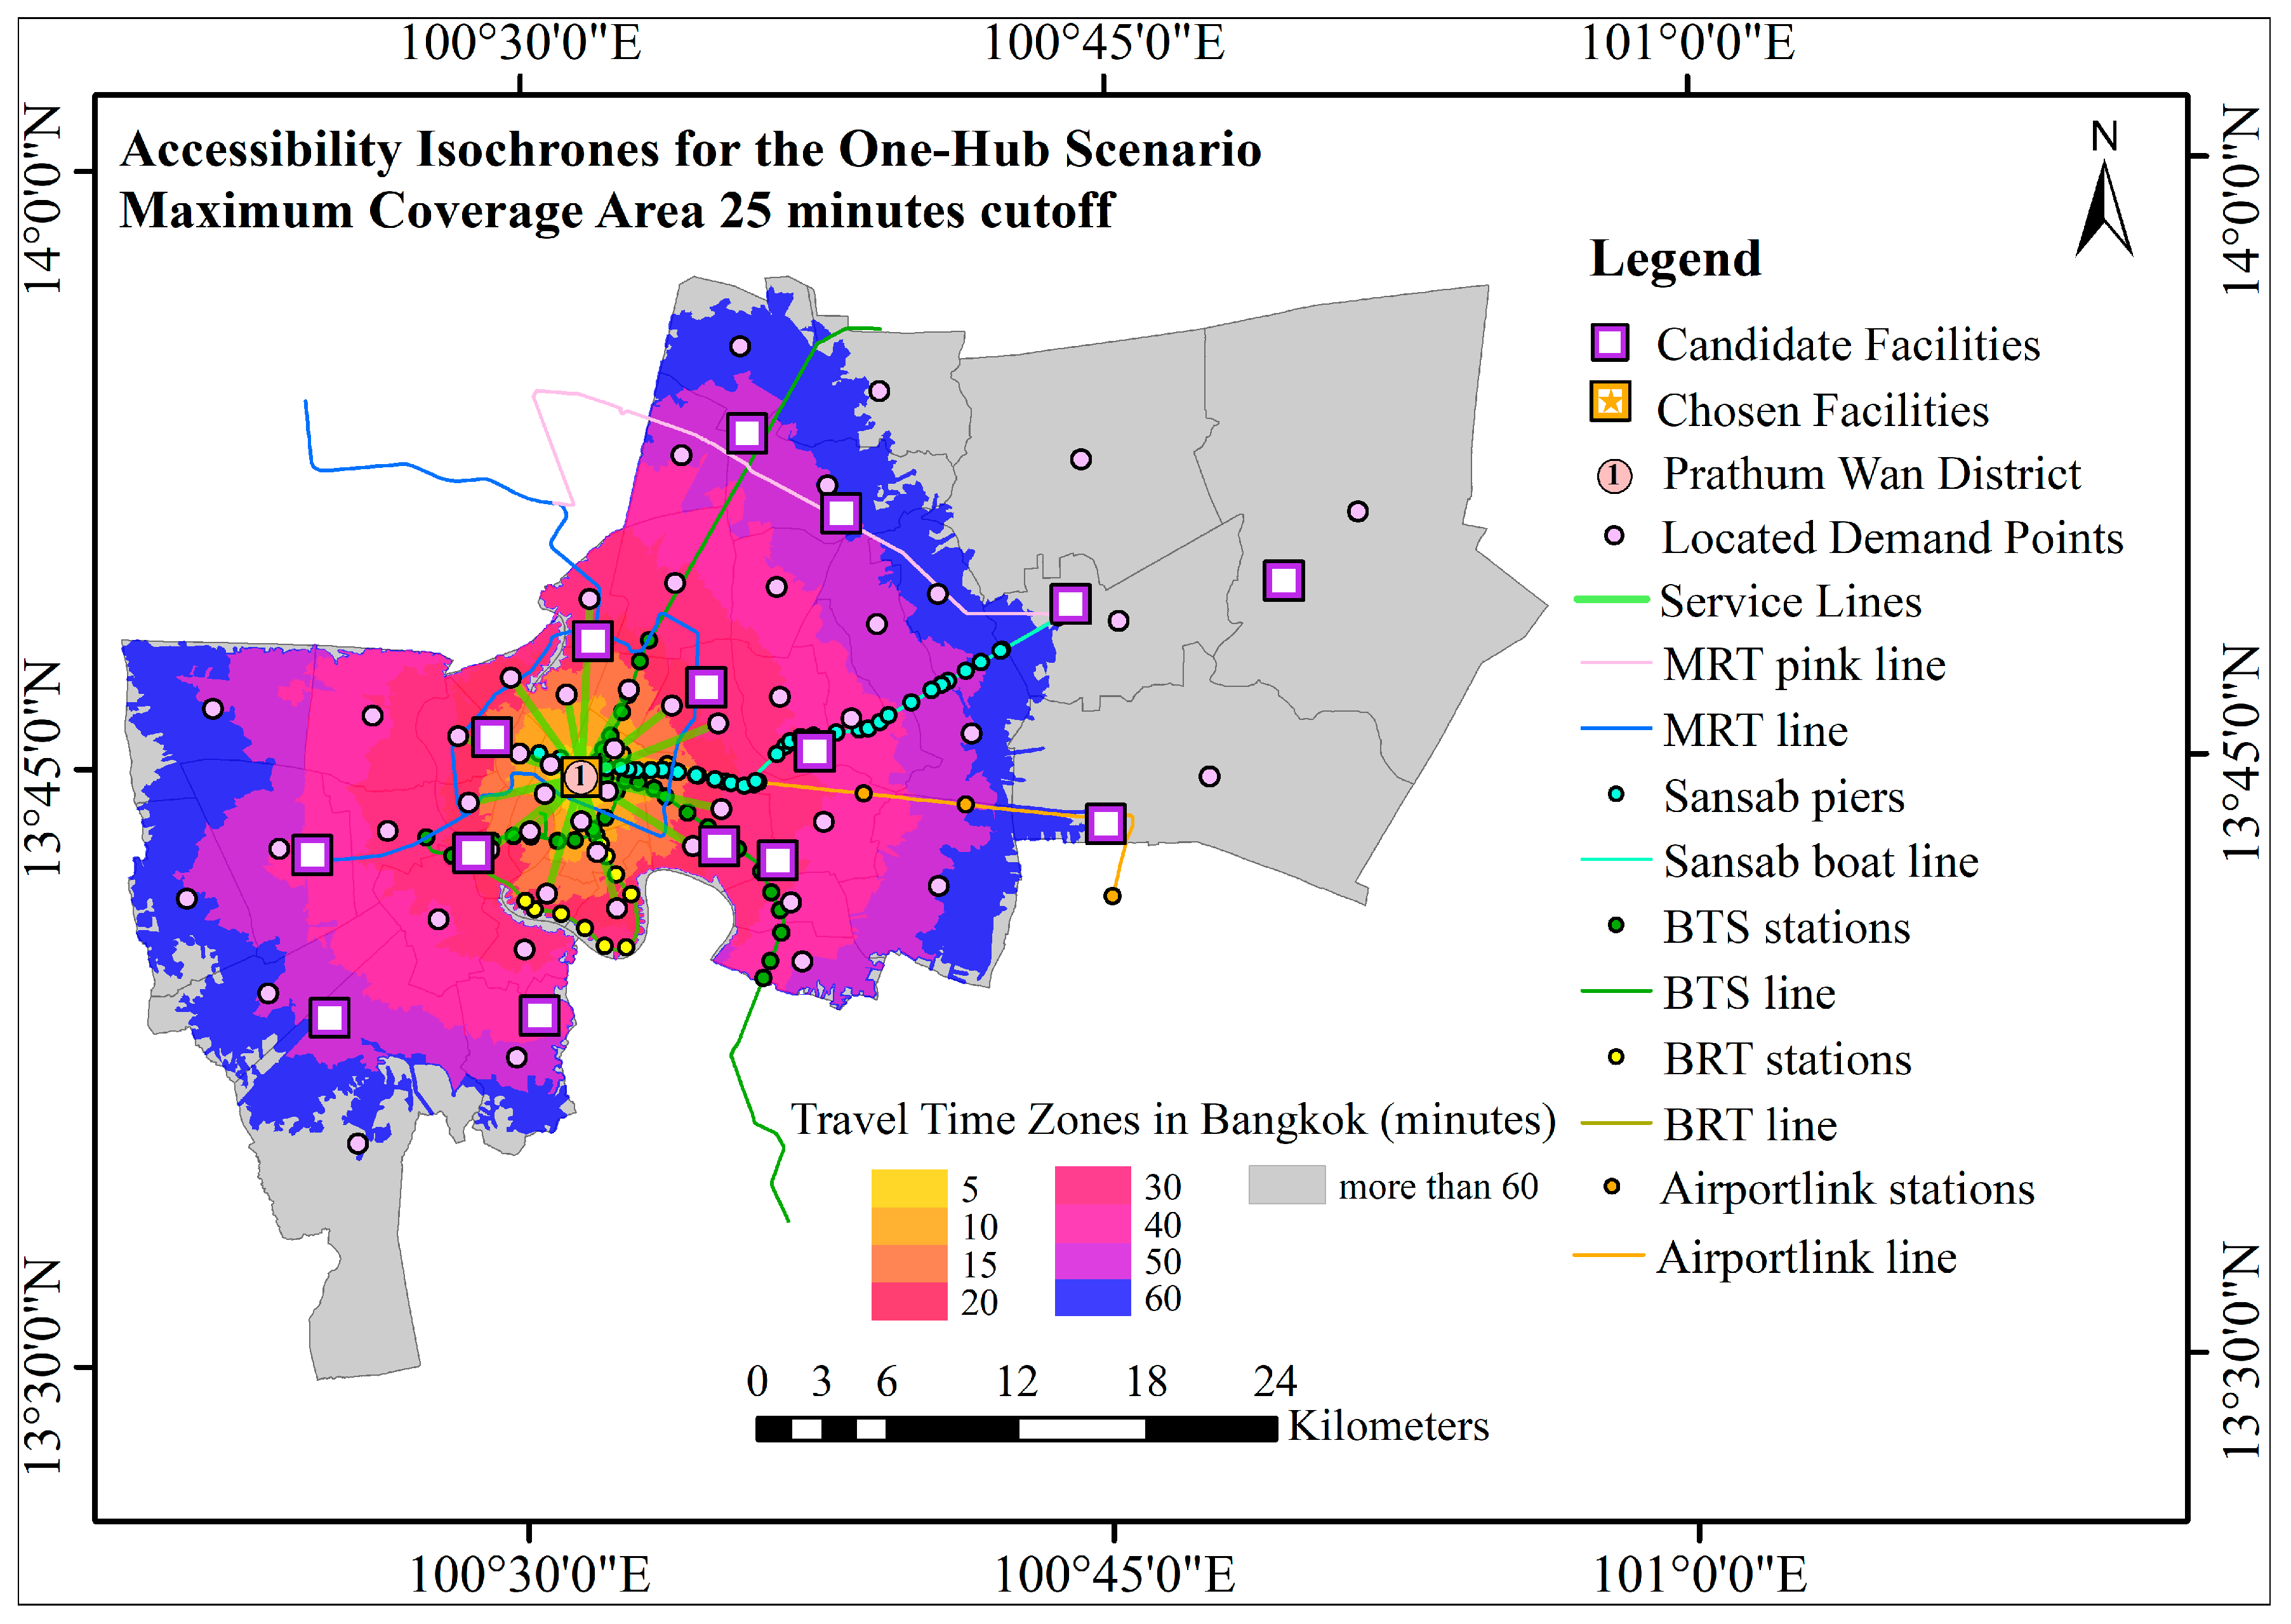
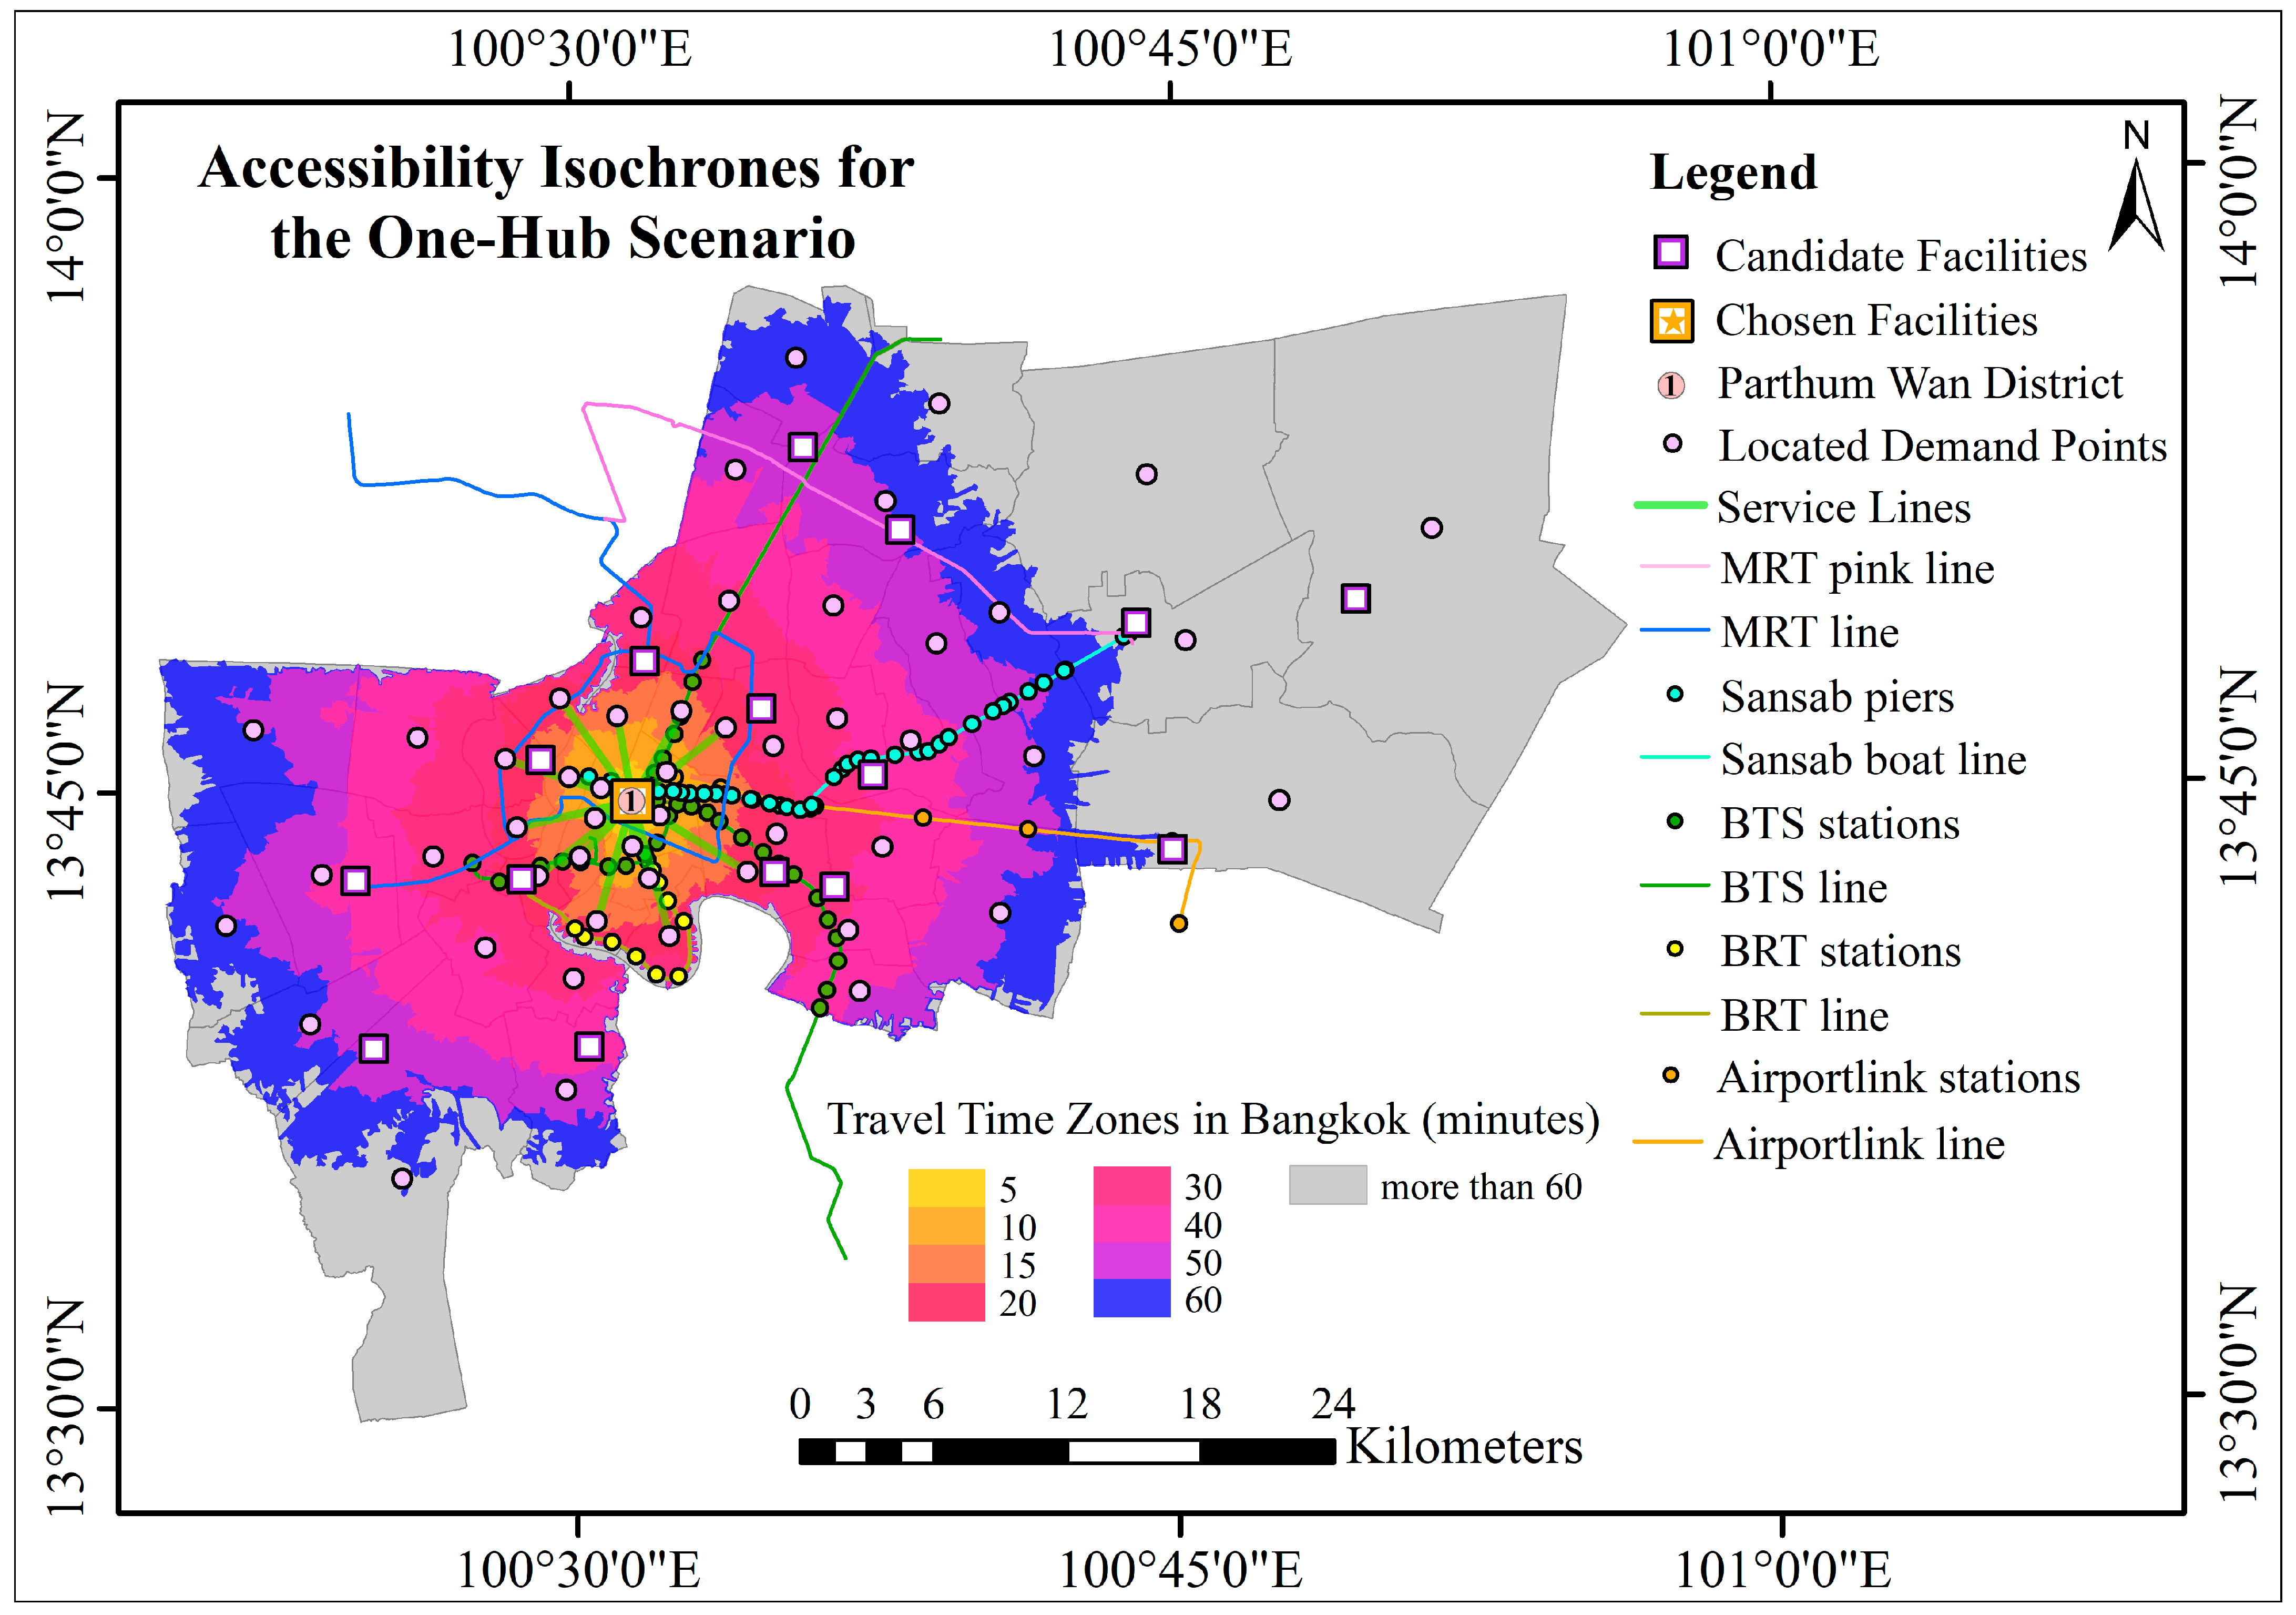
In the one-hub scenario (Figure 8), Pathum Wan functions as the central node. The 5 to 20 min bands concentrate over the central business districts and inner Bangkok, while reach declines toward the periphery, leaving large portions of Thon Buri, Min Buri, and Lat Krabang beyond 60 min. The sensitivity maps confirm this pattern: at 15 min the accessible surface remains tightly confined to the core (Figure A7), whereas at 25 min it expands along the main rail and boat corridors yet still leaves outer districts uncovered (Figure A8). Counts of covered administrative units increase from 11 to 21 between 15 and 25 min, as reported in Table A1.
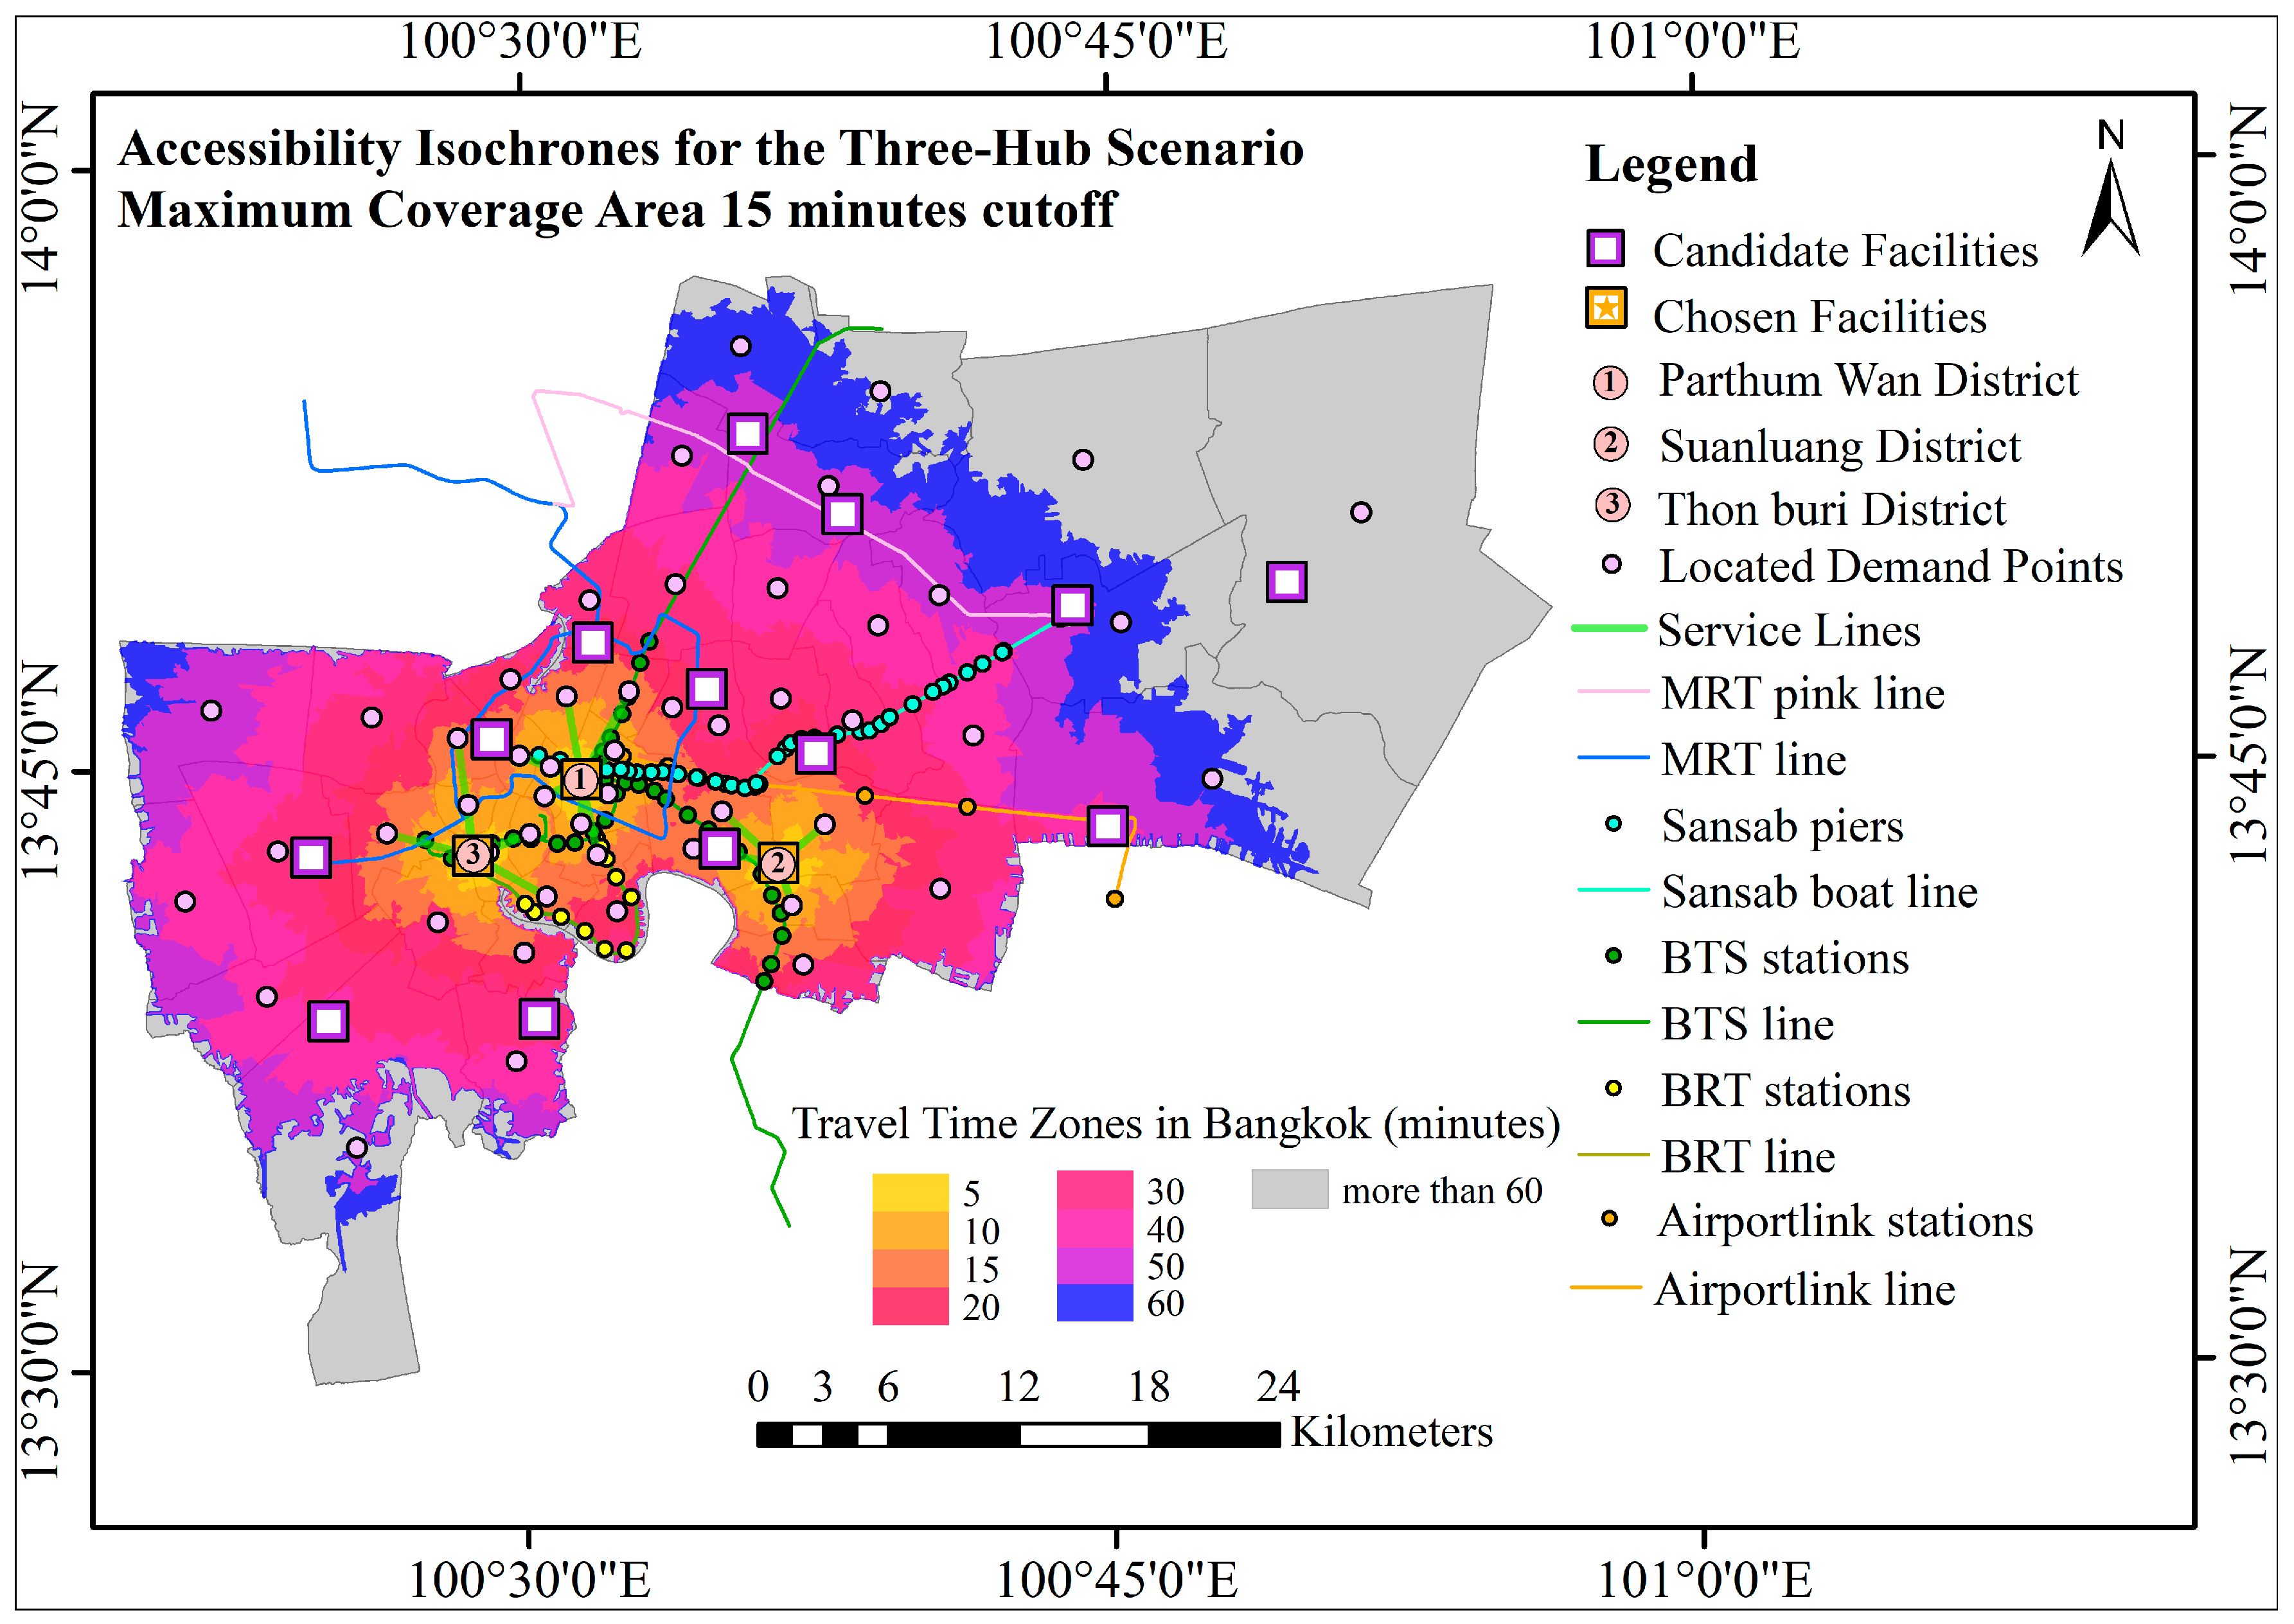
In the three-hub scenario (Figure 9), additional hubs reshape the surface along north–south axes. The southern extension reduces travel time toward the port and the eastern BRT corridor, and the northern hub draws a broad catchment along the Pink Line corridor. Sensitivity isochrones show that hub composition influences near-term reach: at 15 min the hubs at Pathum Wan, Suanluang, and Thon Buri generate a more balanced but still asymmetric surface with limited west-bank penetration (Figure A9); at 25 min the selected hubs at Huai Khwang, Bang Khen, and Thon Buri pull extensive areas into the 20 to 40 min bands with improved cross-river continuity (Figure A10). Covered administrative units rise from 19 to 35 across these thresholds (Table A1).
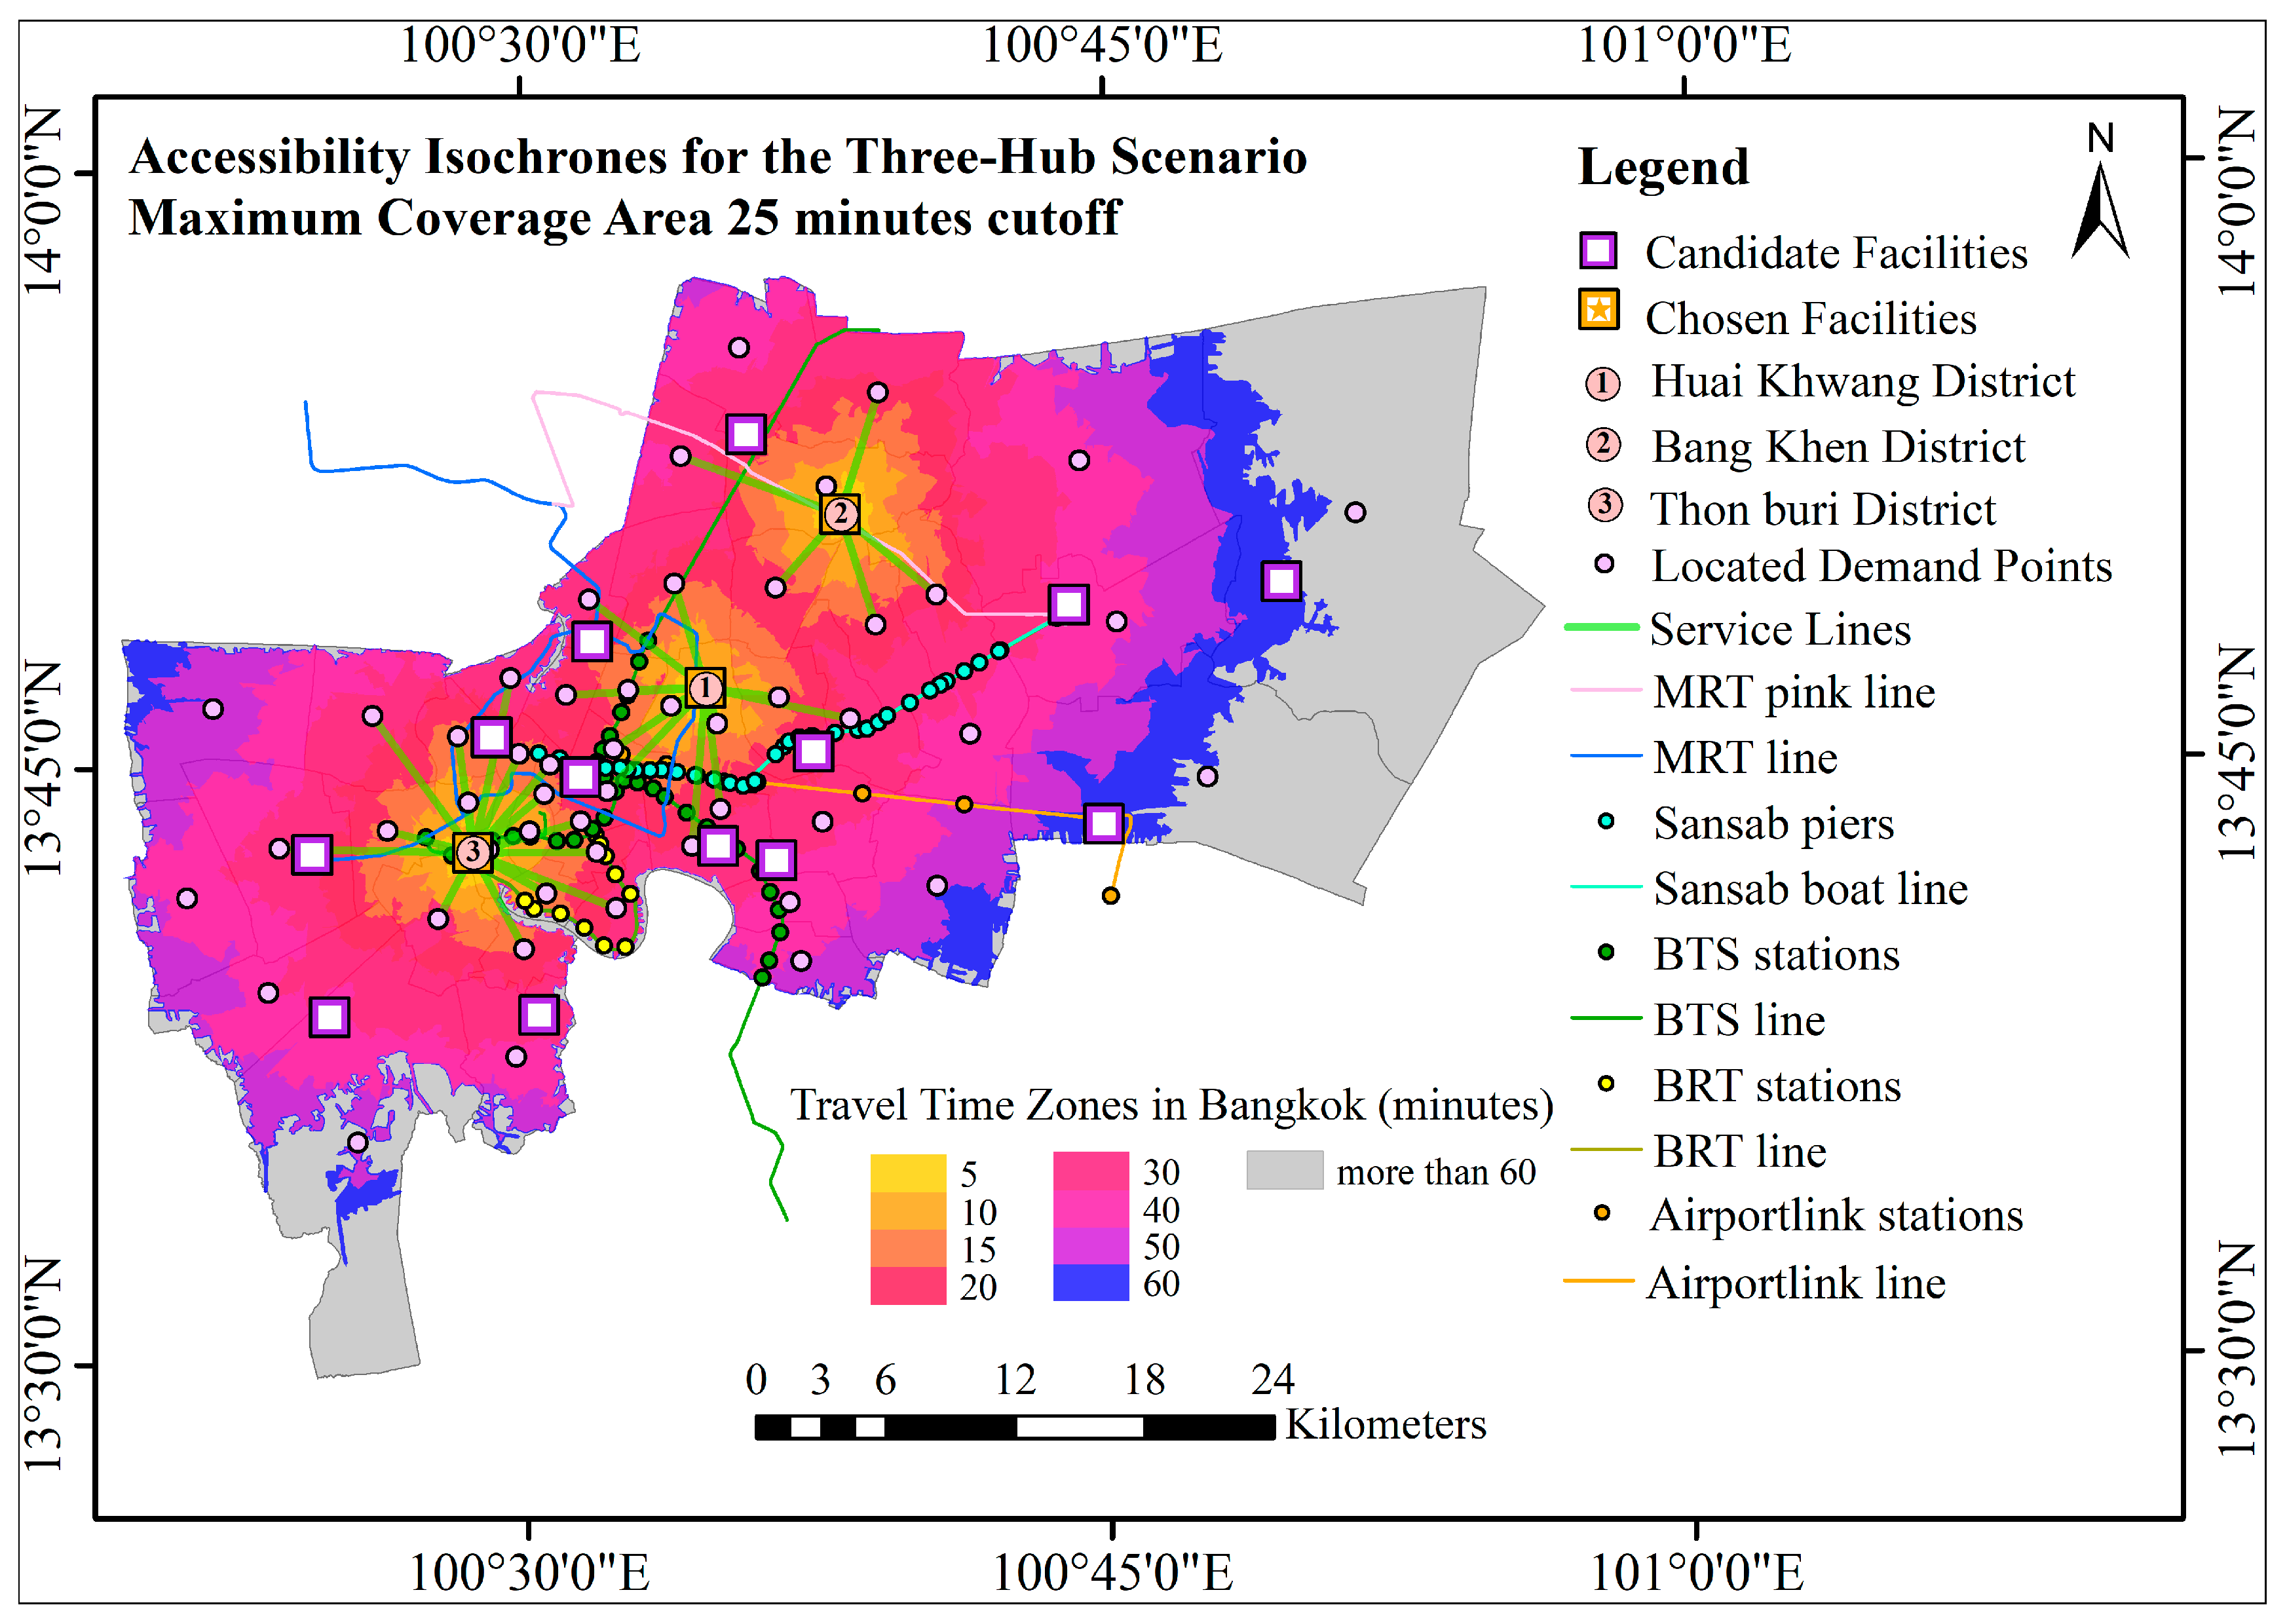
The five-hub configuration (Figure 10) yields the most extensive and even distribution. With hubs at Bang Sue, Khlong Toei, Bang Khen, Thon Buri, and Bang Khae, the isochrones spread coverage more uniformly across the metropolis. The west bank benefits from marked travel-time reductions as Thon Buri and Bang Khae capture districts previously beyond policy-relevant ranges, and Bang Sue strengthens the northwestern corridor by bridging MRT interfaces and the intercity rail node. Sensitivity maps corroborate these gains: at 15 min the surface already spans both banks with discernible redundancy around central corridors (Figure A11), and at 25 min the reach consolidates across peripheral belts with few areas remaining beyond 60 min (Figure A12). The number of administrative units covered increases from 24 to 41 between 15 and 25 min (Table A1).
These accessibility patterns highlight the operational advantages of distributed hubs. While the one-hub layout concentrates service in the urban core, the three- and five-hub configurations progressively broaden and equalize accessibility. The sensitivity isochrones demonstrate that the spatial ordering of priority areas remains stable across 15, 20, and 25 min, supporting phased implementation that begins where marginal gains and cross-river connections are largest.

3.2.2. Integration with Existing Lines

To assess how potential hub locations correspond with Bangkok’s multimodal system, the modeled sites were overlaid with existing and planned BTS, MRT, BRT, Airport Rail Link, and waterborne corridors. This integration analysis highlights walking proximity to stations and piers, interchange opportunities, and complementarities with both trunk and feeder systems.
In the one-hub scenario, the sole Pathum Wan hub demonstrates high network centrality and direct multimodal alignment (Figure 8). The site is situated within walking distance of the BTS Silom Line (National Stadium Station), the MRT Blue Line (Hua Lamphong Station), and the Saen Saep Canal at Charoen Phon Pier. This convergence supports seamless interchange between road-based services, heavy rail, and inland water transport, making Pathum Wan a natural nucleus for centralized transfers. However, reliance on a single core node limits integration for peripheral corridors, especially those wests of the Chao Phraya River.
In the three-hub scenario, multimodal integration is significantly broadened (Figure 9). The Khlong Toei hub anchors the southern corridor, adjacent to the Sukhumvit BTS Line (Ekkamai/Phra Khanong section), arterial roads, and proximate bus routes, strengthening access to the eastern urban fringe. The Bang Khen hub is strategically positioned along the MRT Pink Line alignment and outer arterial expressways, offering interchange with both rail and paratransit feeders in the northern districts. Pathum Wan remains the central hub, ensuring continuity with the inner core. Together, these three hubs decentralize transfer opportunities and establish a north–south axis that better distributes connectivity across high-demand corridors.
The five-hub scenario delivers the most spatially balanced integration (Figure 10). The Bang Sue hub emerges as a super-interchange where the MRT Blue and Purple Lines intersect with the SRT Red Line, directly linking urban rail to regional and intercity services. On the west bank, the Thon Buri and Bang Khae hubs create long-missing multimodal anchors across the Chao Phraya River. Thon Buri connects to the BTS Silom Line (Talat Phlu Station), the BRT corridor, and water transport piers, while Bang Khae lies along the MRT Blue Line extension and interfaces with radial road networks serving the western periphery. Meanwhile, Bang Khen and Khlong Toei continue to reinforce coverage along the northern and southern axes. Collectively, this distribution links dense inner districts with emerging suburban growth poles, reduces dependence on a single interchange, and enhances cross-river integration.
Overall, the overlay analysis indicates that the modeled hub configurations align closely with existing and planned mass transit infrastructure. The one-hub scenario maximizes central multimodal convergence, whereas the three- and five-hub networks distribute transfer capacity more evenly across Bangkok’s geography. In particular, the five-hub model integrates multiple lines and modes into a resilient lattice, consistent with Mobility as a Service (MaaS) principles and supportive of future FLM innovations.

3.3. FLM Behavior

To situate the planned behavioral analysis, a brief descriptive profile of the survey is summarized here. Rail-based modes account for 57 percent of main trips in the study area, followed by scheduled buses at 20 percent, motorcycles at 12 percent, private cars at 6 percent, taxis at 3 percent, and walking at 2 percent. Among decision factors, out-of-pocket cost is the most influential at 40 percent, followed by travel time at 32 percent, waiting time at 15 percent, the access distance between trip ends and mass-transit stations at 10 percent, and the number of required transfers at 3 percent. With respect to trip purposes, work travel accounts for 58 percent and study-related travel for 22 percent, with other purposes at lower shares in the sample.
These descriptive indicators help interpret accessibility outcomes in relation to travelers’ modal preferences and decision factors. They provide behavioral context for the spatial optimization results presented in Section 3.1 and Section 3.2. A detailed behavioral modeling phase using primary survey data and latent class choice analysis is planned as a subsequent extension of this study.

4. Discussion

4.1. Interpretation of Hub Scenario Effectiveness

The comparative scenario analysis indicates that decentralizing intermodal transfers from a single central node to a small multi-hub network improves the geographic balance of accessibility while reducing overreliance on the urban core. This finding is consistent with evidence that distributing transfer opportunities across the network enhances coverage and supports more inclusive access patterns, particularly where peripheral districts would otherwise remain beyond reasonable FLM tolerances. In location-allocation terms, the logic aligns with maximum-coverage formulations frequently applied in transport planning, which specify short service-time thresholds to expand the reachable population within realistic operational limits [29].
The three-hub configuration already attenuates the spatial asymmetries inherent in a single-hub design by adding high-connectivity nodes in the southern and northern sectors, while the west bank remains comparatively under-covered at this stage. The five-hub configuration extends this effect by bridging the west bank (Thon Buri, Bang Khae) and strengthening the north–northwest corridors (Bang Sue/Bang Khen), and by introducing redundancy where service areas overlap. From a systems perspective, such redundancy is desirable because it mitigates fragility at individual transfer points and helps preserve accessibility during localized disruptions. Recent empirical work on decentralized mobility hubs underscores this rationale, showing that distributed hub infrastructures can strengthen multimodality and reduce dependence on private cars when embedded in existing street and transit fabrics [30]. Interpreting the results through the lens of accessibility and equity reinforces the policy relevance of a multi-hub solution. Accessibility is a core currency of transport equity, and frameworks that evaluate coverage relative to settlement patterns provide a transparent basis for prioritizing interventions that are both spatially fair and operationally feasible [31]. In Bangkok’s context, empirical analyses of mobility using rail-gate and probe data have demonstrated how mass-transit corridors structure movement patterns across the metropolis, suggesting that hub placement which leverages these corridors will yield disproportionate gains in effective reach [32].
The choice of access thresholds is consequential. Short travel time cutoffs, such as 15 to 20 min, are widely used in coverage-based planning to represent tolerable FLM conditions for urban users; however, thresholds should be interpreted as policy parameters rather than universal constants and tested for sensitivity as data allow [29].
As a compact sensitivity summary that complements the maps, Table A1 and Table A2 compare the one-, three-, and five-hub configurations across two policy thresholds t x and t y set to 15 and 25 min, respectively. Consistent with the indicator defined in Section 2.3.3, the table reports the selected hub sets and the monotonic expansion of the reachable envelopes between t x and t y , with corresponding isochrone references in Figure A1, Figure A2, Figure A3, Figure A4, Figure A5, Figure A6, Figure A7, Figure A8, Figure A9, Figure A10, Figure A11 and Figure A12. This presentation allows readers to assess robustness to threshold choice without introducing additional model constraints and keeps interpretation aligned with the coverage logic and the isochrone analysis in Section 2.3.3.
In parallel, current debates on “x-minute city” paradigms caution that extreme decentralization absent high-quality public transport can compromise sustainability and equity outcomes, underscoring the importance of anchoring any hub strategy in robust rail and trunk line connectivity rather than dispersal alone [33].
Finally, the integration opportunities highlighted in the scenarios merit emphasis. Co-locating hubs with existing BTS, MRT, SRT, and water-based corridors allows the framework to capitalize on built capacity and accelerate implementation through coordinated interchange design. While the empirical base in this paper is intentionally framework-oriented, comparative research indicates that urban waterways can contribute to multimodal access when physical and environmental conditions permit, which aligns with the observed potential in Bangkok’s khlong network [34]. In sum, the five-hub configuration offers the strongest balance among spatial coverage, temporal accessibility within policy thresholds, and network integration, advancing a polycentric, multimodal approach that is consistent with contemporary sustainable transport principles and equity-aware accessibility planning [29,31].
Relative to p-median and min-max siting, the coverage-based formulation used here is directly aligned with policy thresholds and yields equity-legible outputs, answering who falls within a 15–25 min tolerance rather than only improving an average or a worst case. Coupling the optimization with cumulative isochrone diagnostics makes barrier effects, redundancy, and cross-river balancing explicit, which supports communication with planners and facilitates phased implementation. The data requirements remain modest, including demand weights, a realistic candidate set, and network travel times, and the workflow scales to city-wide applications because precomputed impedances and GIS heuristics keep both runtime and memory predictable.

4.2. Strategic Role of GIS in Mega-Urban Contexts

The findings illustrate the strategic value of GIS as a decision support environment in a mega-urban setting where spatial heterogeneity, informality, and fragmented networks complicate transport planning. In such contexts, GIS provides an integrative platform for assembling multimodal infrastructure, sociodemographic indicators, and policy layers, and for translating them into transparent, map-based evidence that can guide investment choices. Prior research has shown that GIS frameworks are well suited to rapid scenario appraisal, accessibility analytics, and communication of results to planners and non-specialists, reinforcing their role in evidence-based mobility governance [10,35]. In the present analysis, GIS underpins the consolidated geodatabase, the location-allocation optimization, and the post-optimization accessibility diagnostics reported in the Results.
A centralized geodatabase enables harmonization of road, rail, and water networks with population and land use data, which supports calculation of network distances, service-area isochrones, and coverage zones that are not readily derived from conventional statistics alone. GIS-based accessibility toolkits operationalize generalized travel cost and network impedance to reveal spatial patterns of reach, while coverage-oriented evaluations show how service provision expands or contracts under alternative configurations [10,36]. Consistent with this approach, the study generates maximal-coverage service areas and cumulative isochrones at 5 min increments up to 60 min to interpret spatial balance and peripheral reach, and it summarizes coverage sensitivity across 15, 20, and 25 min at the administrative-unit level for one-, three-, and five-hub scenarios (Figure 5, Figure 6, Figure 7, Figure 8, Figure 9 and Figure 10).
Network analysis further allows interrogation of connectivity and potential bottlenecks at granular scales, moving beyond infrastructure density to consider redundancy and route logic. Recent urban case studies demonstrate how GIS can combine real-time traffic information, remote sensing, and crowdsourced data to diagnose congestion dynamics and to evaluate infrastructure interventions, which shows adaptability to data-rich and data-poor conditions alike [37]. The present analysis applies typical network conditions that are adequate for the coverage-based siting problem addressed here, and it recognizes as a limitation that dynamic congestion and travelers’ route choice behavior are not modeled in this phase.
The scenario design relies on location-allocation modeling. The Maximal Covering Location Problem formalizes the policy question by selecting a fixed number of facilities to maximize population within a specified service threshold, thereby offering a principled basis for comparing single versus multi-hub layouts [38]. Within a GIS environment, the same database can support comparisons with alternative siting logics, such as minimizing average travel time or minimizing worst-case access, as part of future work on trade-offs between efficiency and equity.
GIS also facilitates integration of top-down network modeling with bottom-up knowledge production. By coupling spatial analytics with participatory and public participatory GIS, planners can elicit stakeholder priorities, map perceived barriers, and embed local experiential knowledge into design choices. Reviews and applications in transport and spatial planning consistently report that PPGIS enhances the legitimacy and usability of resulting plans, particularly when combined with quantitative evaluation methods such as multi-criteria analysis [39,40].
The Bangkok context offers corroborating evidence of the suitability of GIS for service-area and network-based planning. Citywide analyses that map emergency medical service catchments and travel-time envelopes show that GIS can quantify coverage gaps and test reconfiguration options at the metropolitan scale, providing decision-makers with actionable cartographic outputs for prioritization [41]. In this study, the same logic is applied to intermodal hubs by aligning service areas and isochrones with BTS, MRT, SRT, Airport Rail Link, and water routes to identify where phased deployment would yield the greatest marginal improvements.
Finally, the contribution of GIS is not limited to technical modeling. Because accessibility is central to transport equity debates, GIS-based indicators extend planning beyond infrastructure counts to evaluate who gains or loses under alternative scenarios. This equity-aware lens, implemented through spatial accessibility metrics, visual analytics, and simple administrative-unit coverage summaries, supports transparent comparison of options and fosters multi-actor engagement around distributional outcomes in mega-urban settings [31].

4.3. Role of Intra-Household Travel Decision-Making

Understanding intra-household decision processes is essential for explaining variation in FLM choices across Bangkok’s heterogeneous residential contexts. Households mediate time budgets, access to resources, and role expectations, which together shape the feasibility and acceptability of specific FLM modes. A recent systematic review shows that activity-travel behavior is co-produced by intra-household negotiations and constraints and calls for models that represent these interactions explicitly rather than treating choices as purely individual [42].
A behaviorally informed lens that draws on latent class choice modeling and the concept of household modality styles aligns with emerging work that captures heterogeneity in group decision-making. Empirical applications at the household level show that latent classes differentiate car-oriented and multimodal segments with distinct sensitivities to FLM travel time, station accessibility, and network characteristics [43]. Evidence at the individual level reinforces these patterns by linking modality styles to built environment contexts and travel attitudes, while segmentation studies highlight the roles of normative beliefs and contextual factors in shaping style-based typologies [44,45].
Specific attributes commonly implicated in intra-household FLM choices include vehicle availability, the presence of young children or elderly members, gendered task assignments, and employment schedules. Studies that integrate household interactions into tour-based mode choice demonstrate that joint travel, car allocation, and spatio-temporal constraints shape mode selection in car-negotiating households, with measurable differences by household roles and caregiving responsibilities [46,47,48].
Methodological evidence further supports the inclusion of intra-household mechanisms in operational models that inform policy. Incorporating within-household interactions into random utility frameworks improves model fit and interpretation of mode choice, while joint models that couple mode choice with travel distance reveal cross-member influences that are obscured when decisions are modeled in isolation [49,50]. The present phase is spatial and coverage oriented and does not estimate route choice behavior; these behavioral components are reserved for the planned modeling extension.
Interpreting the hub and accessibility findings through this intra-household lens provides a behaviorally nuanced basis for intervention design. Segments characterized by multimodal modality styles are promising candidates for flexible, integrated Mobility as a Service solutions, whereas segments with stable car-oriented styles tend to respond to measures that rebalance generalized costs through improved pedestrian access, micro-mobility support, and better station interfaces. Positioning hub strategies and service orchestration with reference to household modality styles can strengthen the social responsiveness of policies intended to improve FLM connectivity and reduce car dependence in Bangkok [43,44].

4.4. MaaS and Co-Sharing: Readiness and Design

The feasibility of deploying Mobility as a Service and Co-Sharing in Bangkok rests on aligning institutional governance, data interoperability, and place-specific service design with the city’s mixed formal and informal mobility landscape. Evidence from MaaS governance studies shows that successful implementations depend on multi-actor coordination, clear allocation of roles among public authorities, operators, and prospective platform brokers, and early attention to data-sharing and fare-integration protocols as necessary preconditions rather than add-ons [51]. At the platform layer, a recent literature review emphasizes interoperable data, standardized booking and payment interfaces, and transparent governance arrangements as central determinants of viability in multi-provider environments [52]. Complementary work on data, AI, and governance argues that sustainable outcomes require explicit institutional rules for data access, accountability, and algorithmic decision support rather than purely technical fixes, which is pertinent to Bangkok’s fragmented operator environment [53].
Grounding these principles in the spatial findings, the hub scenarios identify where access gains concentrate and where cross-river and peripheral connectors are pivotal. A governance-first pathway can therefore be sequenced around the selected hubs as anchor nodes. Phase 1 focuses on information, booking, and payments integration for rail, boat, and regulated feeder services at the chosen hubs, accompanied by basic station-area management such as wayfinding, curb access for feeders, and sheltered walking links. Phase 2 expands to integrated ticketing, service-level agreements for FLM providers, and standard data interfaces for schedules and occupancy. Phase 3 pilots dynamic dispatch and demand-responsive feeders in catchments where the isochrones indicate persistent gaps. This sequencing aligns platform functions with locations that the coverage analysis flags as high-leverage, which reduces speculative elements and concentrates effort where near-term benefits are most likely [15,51,52,53].
Bangkok-specific scholarship indicates that the question of who should be the MaaS provider is a regulatory choice that shapes data stewardship, consumer protection, and alignment with public objectives. Expert evidence for Thailand outlines models ranging from a public-sector broker to a regulated private aggregator, each with distinct implications for interoperability and policy alignment [54]. In parallel, Bangkok-focused design concepts frame MaaS as a broader demand-management instrument that coordinates activity timing and space-time patterns, not merely a channel for modal substitution, linking platform design to congestion mitigation and quality-of-life objectives in the metropolis [15].
Co-Sharing, understood here as community-managed or cooperative services tailored to neighborhood needs, can complement a MaaS architecture when recognized as part of the integrated mobility offer rather than an adjunct. International evidence on community transport shows that such services support social objectives and extend coverage in thin-demand areas and can sit within a MaaS bundle under appropriate contractual and regulatory arrangements [55]. Where community providers operate, willingness-to-pay studies indicate scope for curated bundles that approach financial sustainability when supported by targeted subsidies and integration with mainstream public transport, which is salient for peripheral Bangkok districts with infrequent fixed-route service [56].
Two design risks require attention. First, fare and convenience advantages within MaaS can shift some users from public transport toward car-centric services unless pricing rules, caps, and bundle curation safeguard mass-transit primacy [57]. Second, large-scale integration may stall if it overreaches at inception. Incremental approaches such as MaaS Lite, which prioritize information, booking, and payments integration around existing public-transport corridors while adding selected FLM feeders, are recommended for contexts with heterogeneous providers and evolving standards, which describes Bangkok’s current stage [58].
Taken together, Bangkok-focused evidence and the wider MaaS literature point toward a staged pathway that connects spatial and behavioral levers. Early phases should establish a neutral data and payment backbone under public oversight, with formal operators, paratransit, and community services connected via standardized interfaces and transparent business rules. This orientation is consistent with multi-stakeholder findings that emphasize aligning platform functionality with public goals, equity safeguards, and operator incentives from the outset [59]. In practical terms, options include district-scale MaaS bundles centered on the identified hubs that integrate rail, bus, boat, and regulated feeder services, the testing of co-managed neighborhood shuttles where maps and isochrones show persistent gaps, and the use of performance indicators that track administrative-unit coverage, access time proxies from isochrones, and hub-based transfer reliability rather than platform uptake alone. Interpreted alongside the hub-accessibility results, these principles position MaaS and Co-Sharing as complementary instruments that bridge infrastructural investments and everyday travel practices in Bangkok’s FLM context [15,51,52,53,54,55,56,57,58,59].

4.5. Policy Implications and Study Limitations

4.5.1. Policy Implications

Evidence from the hub scenarios and the GIS workflow indicates that Bangkok can pursue carbon-neutral mobility through a sequenced strategy that aligns spatial restructuring with behaviorally informed and digitally enabled services. A decentralized, multimodal hub system supports compact, transit-oriented urban form and shortens FLM chains, which international reviews identify as core pathways to reduce motorized travel demand and associated emissions through a shift toward public and active modes [60]. Consolidating access around well-located hubs that interface directly with existing BTS, MRT, SRT, and water routes leverages current assets rather than relying on greenfield infrastructure, consistent with transit-oriented development literature linking integrated land use and transport planning to lower car dependence and lower system-wide emission intensities [61]. The sensitivity analysis at 15, 20, and 25 min reinforces these implications by showing that priority areas for intervention remain stable across policy-relevant thresholds, which supports phased deployment that begins where marginal coverage gains are largest and cross-river connectors are critical.
Behavioral segmentation sharpens policy design by matching interventions to modality styles rather than applying uniform measures citywide. Targeted incentives for segments predisposed to multimodality can accelerate mode shift without large capital outlays, whereas pedestrian-safety upgrades and reliable feeder services can support segments facing caregiving and time constraints. Embedding shared mobility within this portfolio requires attention to rebound risks. Empirical assessments of car sharing show that city-level and household-level emission outcomes vary with prior car ownership, fleet composition, and complementary policies, which implies that any public support for co-sharing in Bangkok should be conditional on designs that displace private car use, avoid empty relocations, and favor efficient or electric fleets [62]. This conditional approach aligns environmental performance with service expansion and reduces the likelihood that shared services introduce new vehicle kilometers without commensurate social benefit.
Digital integration is an enabler rather than an end. MaaS platforms can lower transaction costs of multimodality and make hubs function as genuine interchange points, but the sustainability value depends on data governance, algorithmic objectives, and operator interoperability. Recent work on MaaS governance underscores that platform rules and data-sharing arrangements must encode public goals to prevent rebound effects and to ensure equitable service availability across neighborhoods and user groups [53]. For Bangkok, a city-level data stewardship framework that standardizes interfaces for ticketing, scheduling, and occupancy data across public and private providers would allow journey planning, service coordination, and demand management to operate coherently around the proposed hubs.
To translate these elements into measurable climate action, transport planning should be coupled with carbon budgeting at the sectoral level. Sectoral carbon budgets provide a transparent way to allocate a finite emissions envelope to surface transport, to test whether hub deployment, service integration, and shared mobility programs collectively remain within a Paris-aligned trajectory, and to prioritize projects by marginal abatement effectiveness rather than by throughput alone [63]. Incorporating a carbon budget into routine appraisal would allow Bangkok to rank hub investments and MaaS or co-sharing pilots against explicit emissions constraints while maintaining co-benefits for accessibility and equity. This governance architecture connects spatial decisions to behavioral outcomes and platform design and is consistent with international evidence that compact land use, high-quality public and active transport, and demand management are mutually reinforcing pillars of a carbon-neutral urban mobility pathway [60].
Taken together, these implications point to a practical policy package. First, prioritize the multi-hub configuration in districts where accessibility gains and mass-transit adjacency are highest, consistent with the modeled five-hub scenario. Second, deploy MaaS functions tied to open interfaces and public-interest data governance, including service-level agreements that prevent discriminatory pricing or spatial exclusion [53]. Third, authorize co-sharing pilots only under environmental performance conditions and with monitoring that verifies displacement of private car travel rather than induced demand [62]. Fourth, institutionalize a transport-sector carbon budget and require all hub and service proposals to report expected contributions to budget compliance using standardized methods [63]. Implemented together, these measures would allow Bangkok to reduce private car dependency while improving inclusive access to the existing high-capacity network, thereby advancing a credible and locally grounded path toward carbon-neutral mobility [60,61]. This approach resonates with prior applications of GIS-based maximal covering models that identify underserved areas and support facility siting decisions in other policy domains, such as health care planning [64].

4.5.2. Study Limitations and Scope

This analysis is a spatial optimization and diagnostics exercise and should be interpreted within several boundaries. Demand weights rely on officially reported resident population at the administrative unit. Floating or temporary populations are not included. Bangkok hosts substantial transient groups whose magnitudes are difficult to measure reliably, so excluding them may under- or over-represent demand in particular districts relative to daytime conditions. Network travel times reflect typical conditions and do not incorporate time-of-day congestion dynamics, incident disruption, or capacity constraints. Seasonality and service variability on waterways are not modeled. Cumulative isochrones at 5 to 60 min are used only for interpretation and do not constrain the optimization. The optimization applies a 20 min coverage standard that is treated as a policy parameter and is examined for conceptual sensitivity at 15 and 25 min in the Results. Hub selection draws from a finite set of 16 pre-screened candidates defined by physical and policy criteria, and results may be sensitive to the definition of this candidate set. Integration with BTS, MRT, SRT, Airport Rail Link, and principal water routes is appraised through a qualitative GIS overlay. Quantitative pedestrian-network quality, detailed station-area walking buffers, and micro-scale design attributes are outside the present scope. Population and accessibility are analyzed at administrative-unit resolution without disaggregation by socio-demographic group, and distributional equity effects are therefore not resolved. Travelers’ route choice behavior and the spatial distribution of jobs and services are not modeled in this phase, which limits causal interpretation of modal responses and may attenuate explanatory power in some districts. Primary travel surveys, stakeholder readiness assessments, and multi-criteria synthesis are not part of the present phase and are identified as priorities for subsequent work aligned with the planned behavioral modeling.
Future work will undertake a systematic city-wide assessment of scalability by enlarging the candidate hub set and by disaggregating demand to finer spatial units. We will benchmark solution quality and runtime against alternative objectives such as p-median and min-max under identical network and impedance settings to quantify trade-offs between coverage, mean access time, and worst-case protection. We will also evaluate parallel tiling and hierarchical screening for memory management when origin-destination matrices become very large, while maintaining strict comparability across thresholds and scenarios.

5. Conclusions

This study developed and applied an integrated GIS-based framework for hub scenario modeling and accessibility diagnostics to guide sustainable mobility planning in Bangkok. The framework shows how spatial analytics can support FLM decisions by combining maximal-coverage location allocation, network-based isochrones, and multimodal overlays within a coherent workflow.
The scenario analysis indicates that a decentralized, multimodal configuration performs better than a single central hub when the objectives are to broaden accessible coverage within defined travel-time thresholds and to connect peripheral districts to high-capacity corridors. The five-hub layout is the most balanced option because it extends access to previously underserved areas, bridges the west bank, and strengthens interfaces with existing BTS, MRT, SRT, and water routes. Service-radius and travel-time patterns confirm the operational logic of distributing transfer opportunities across the network, and the integration overlays show that the recommended hubs co-locate with Bangkok’s transit backbone. Sensitivity tests at 15, 20, and 25 min corroborate the spatial ordering of priority areas and support phased implementation that begins where marginal gains and cross-river connections are largest.
Governance and service design remain central to realizing these spatial opportunities. Evidence from the Mobility as a Service literature highlights preconditions related to data interoperability, role allocation, and public-interest platform rules, which are pertinent to Bangkok’s mixed formal and informal provider landscape. Readiness factors are therefore best aligned with hub placement and staged deployment rather than treated as separate concerns.
A synthesis pathway can be structured through multi-criteria analysis that integrates spatial opportunity with behavioral and institutional considerations, providing decision-makers with a transparent basis for comparing alternatives and justifying staged deployment. In parallel, behavioral segmentation offers a complementary lens for tailoring measures to modality styles, emphasizing pedestrian access, feeder reliability, and user safeguards where they matter most.
Key limitations are summarized in Section 4.5.2. In brief, population weights reflect official resident counts and exclude floating or temporary populations; travel times represent typical conditions; isochrones are diagnostic rather than constraints; hub selection draws from a finite candidate set; multimodal integration is assessed through qualitative overlay; and socio-demographic disaggregation, land-use intensity, and explicit route choice are not modeled in this phase.
Future work will extend the framework by incorporating primary FLM behavioral evidence, systematically evaluating scalability with enlarged candidate sets and finer demand partitions, assessing environmental and equity outcomes of representative hub configurations, and examining governance and data-sharing arrangements for digitally enabled services. Considered together, the findings provide a locally grounded evidence base for reducing car dependence, strengthening multimodal access, and advancing Bangkok’s transition toward inclusive, low-carbon urban mobility.

Author Contributions

Conceptualization, S.B. and P.V.; methodology, S.B. and P.V.; validation, S.B. and P.V.; formal analysis, S.B., P.V., N.R., N.K. and A.K.; investigation, S.B. and P.V.; resources, S.B. and P.V.; data curation, N.R. and N.K.; writing—original draft preparation, S.B., N.R. and N.K.; writing—review and editing, S.B.; visualization, N.R. and N.K.; supervision, S.B. and P.V.; project administration, S.B. and P.V.; funding acquisition, P.V. All authors have read and agreed to the published version of the manuscript.

Funding

This research project is supported by King Mongkut’s University of Technology Thonburi (KMUTT), Thailand Science Research and Innovation (TSRI), and the National Science, Research and Innovation Fund (NSRF) Fiscal year 2024 Grant number (FRB670016/0164).

Institutional Review Board Statement

Not applicable.

Informed Consent Statement

Not applicable.

Data Availability Statement

Derived data supporting the findings of this study are available from the corresponding author on request.

Acknowledgments

The authors would like to thank the anonymous reviewers for their constructive and valuable suggestions on the earlier drafts of this manuscript.

Conflicts of Interest

The authors declare no conflicts of interest.

Appendix A

Table A1. Sensitivity summary.
ScenarioCovered UnitsNot Covered UnitsCovered Population
One hub, 15 min1139614,128
One hub, 25 min21291,521,868
Three hubs, 15 min19311,377,339
Three hubs, 25 min35153,400,177
Five hubs, 15 min24261,883,268
Five hubs, 25 min4194,134,771
Table A2. Hub-level catchments by configuration.
ConfigurationsUnitsCatchments
One hub, 15 minPathum Wan614,128 (11 units)
One hub, 25 minPathum Wan1,521,868 (21 units)
Three hubs, 15 minThon Buri528,411 (6 units)
Pathum Wan468,686 (9 units)
Suanluang380,242 (4 units)
Three hubs, 25 minThon Buri1,421,661 (17 units)
Huai Khwang1,136,011 (12 units)
Bang Khen842,505 (6 units)
Five hubs, 15 minThon Buri528,411 (6 units)
Suanluang380,242 (4 units)
Bang Sue350,783 (4 units)
Pathum Wan324,809 (7 units)
Huai Khwang299,023 (3 units)
Five hubs, 25 minThon Buri1,060,707 (15 units)
Suanluang895,348 (8 units)
Bang Khen842,505 (6 units)
Bang Sue765,399 (8 units)
Bang Khae570,812 (4 units)
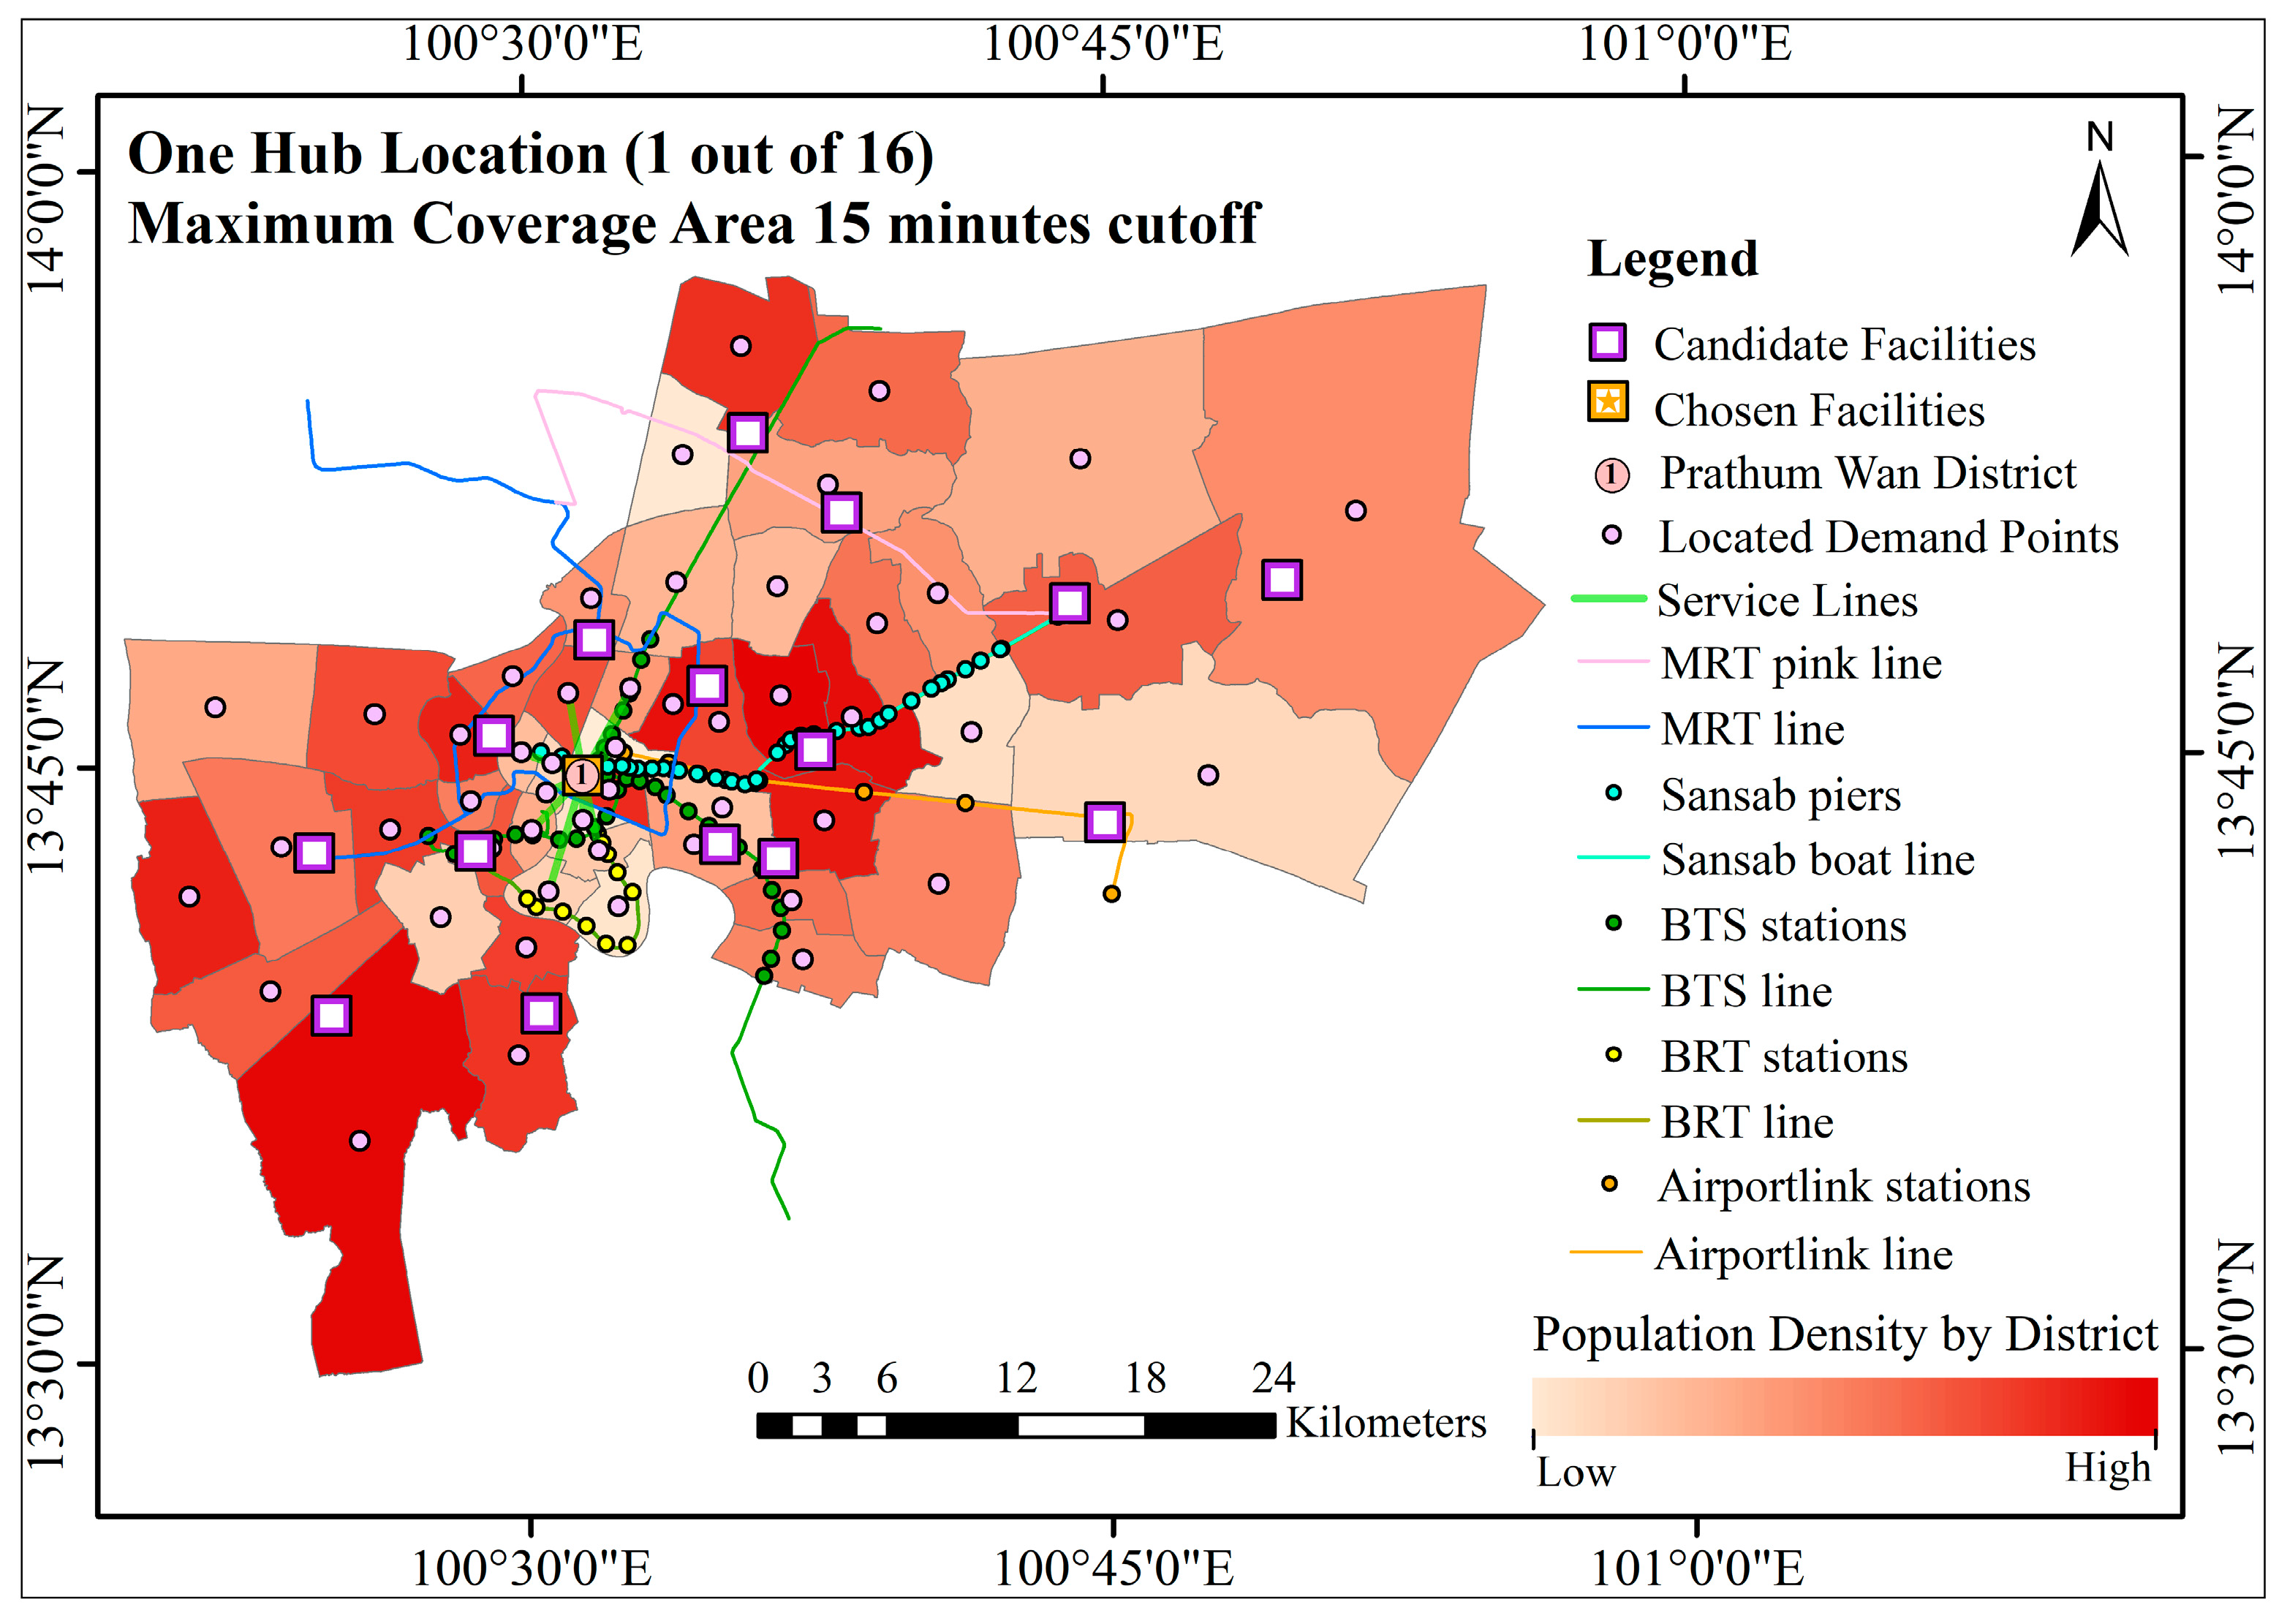
Figure A1. One-hub coverage at 15 min, selected hub Pathum Wan, covered 11 of 50 units, 614,128 residents.
Sustainability 17 09653 g0a1
Figure A2. One-hub coverage at 25 min, selected hub Pathum Wan, covered 21 of 50 units, 1,521,868 residents.
Sustainability 17 09653 g0a2
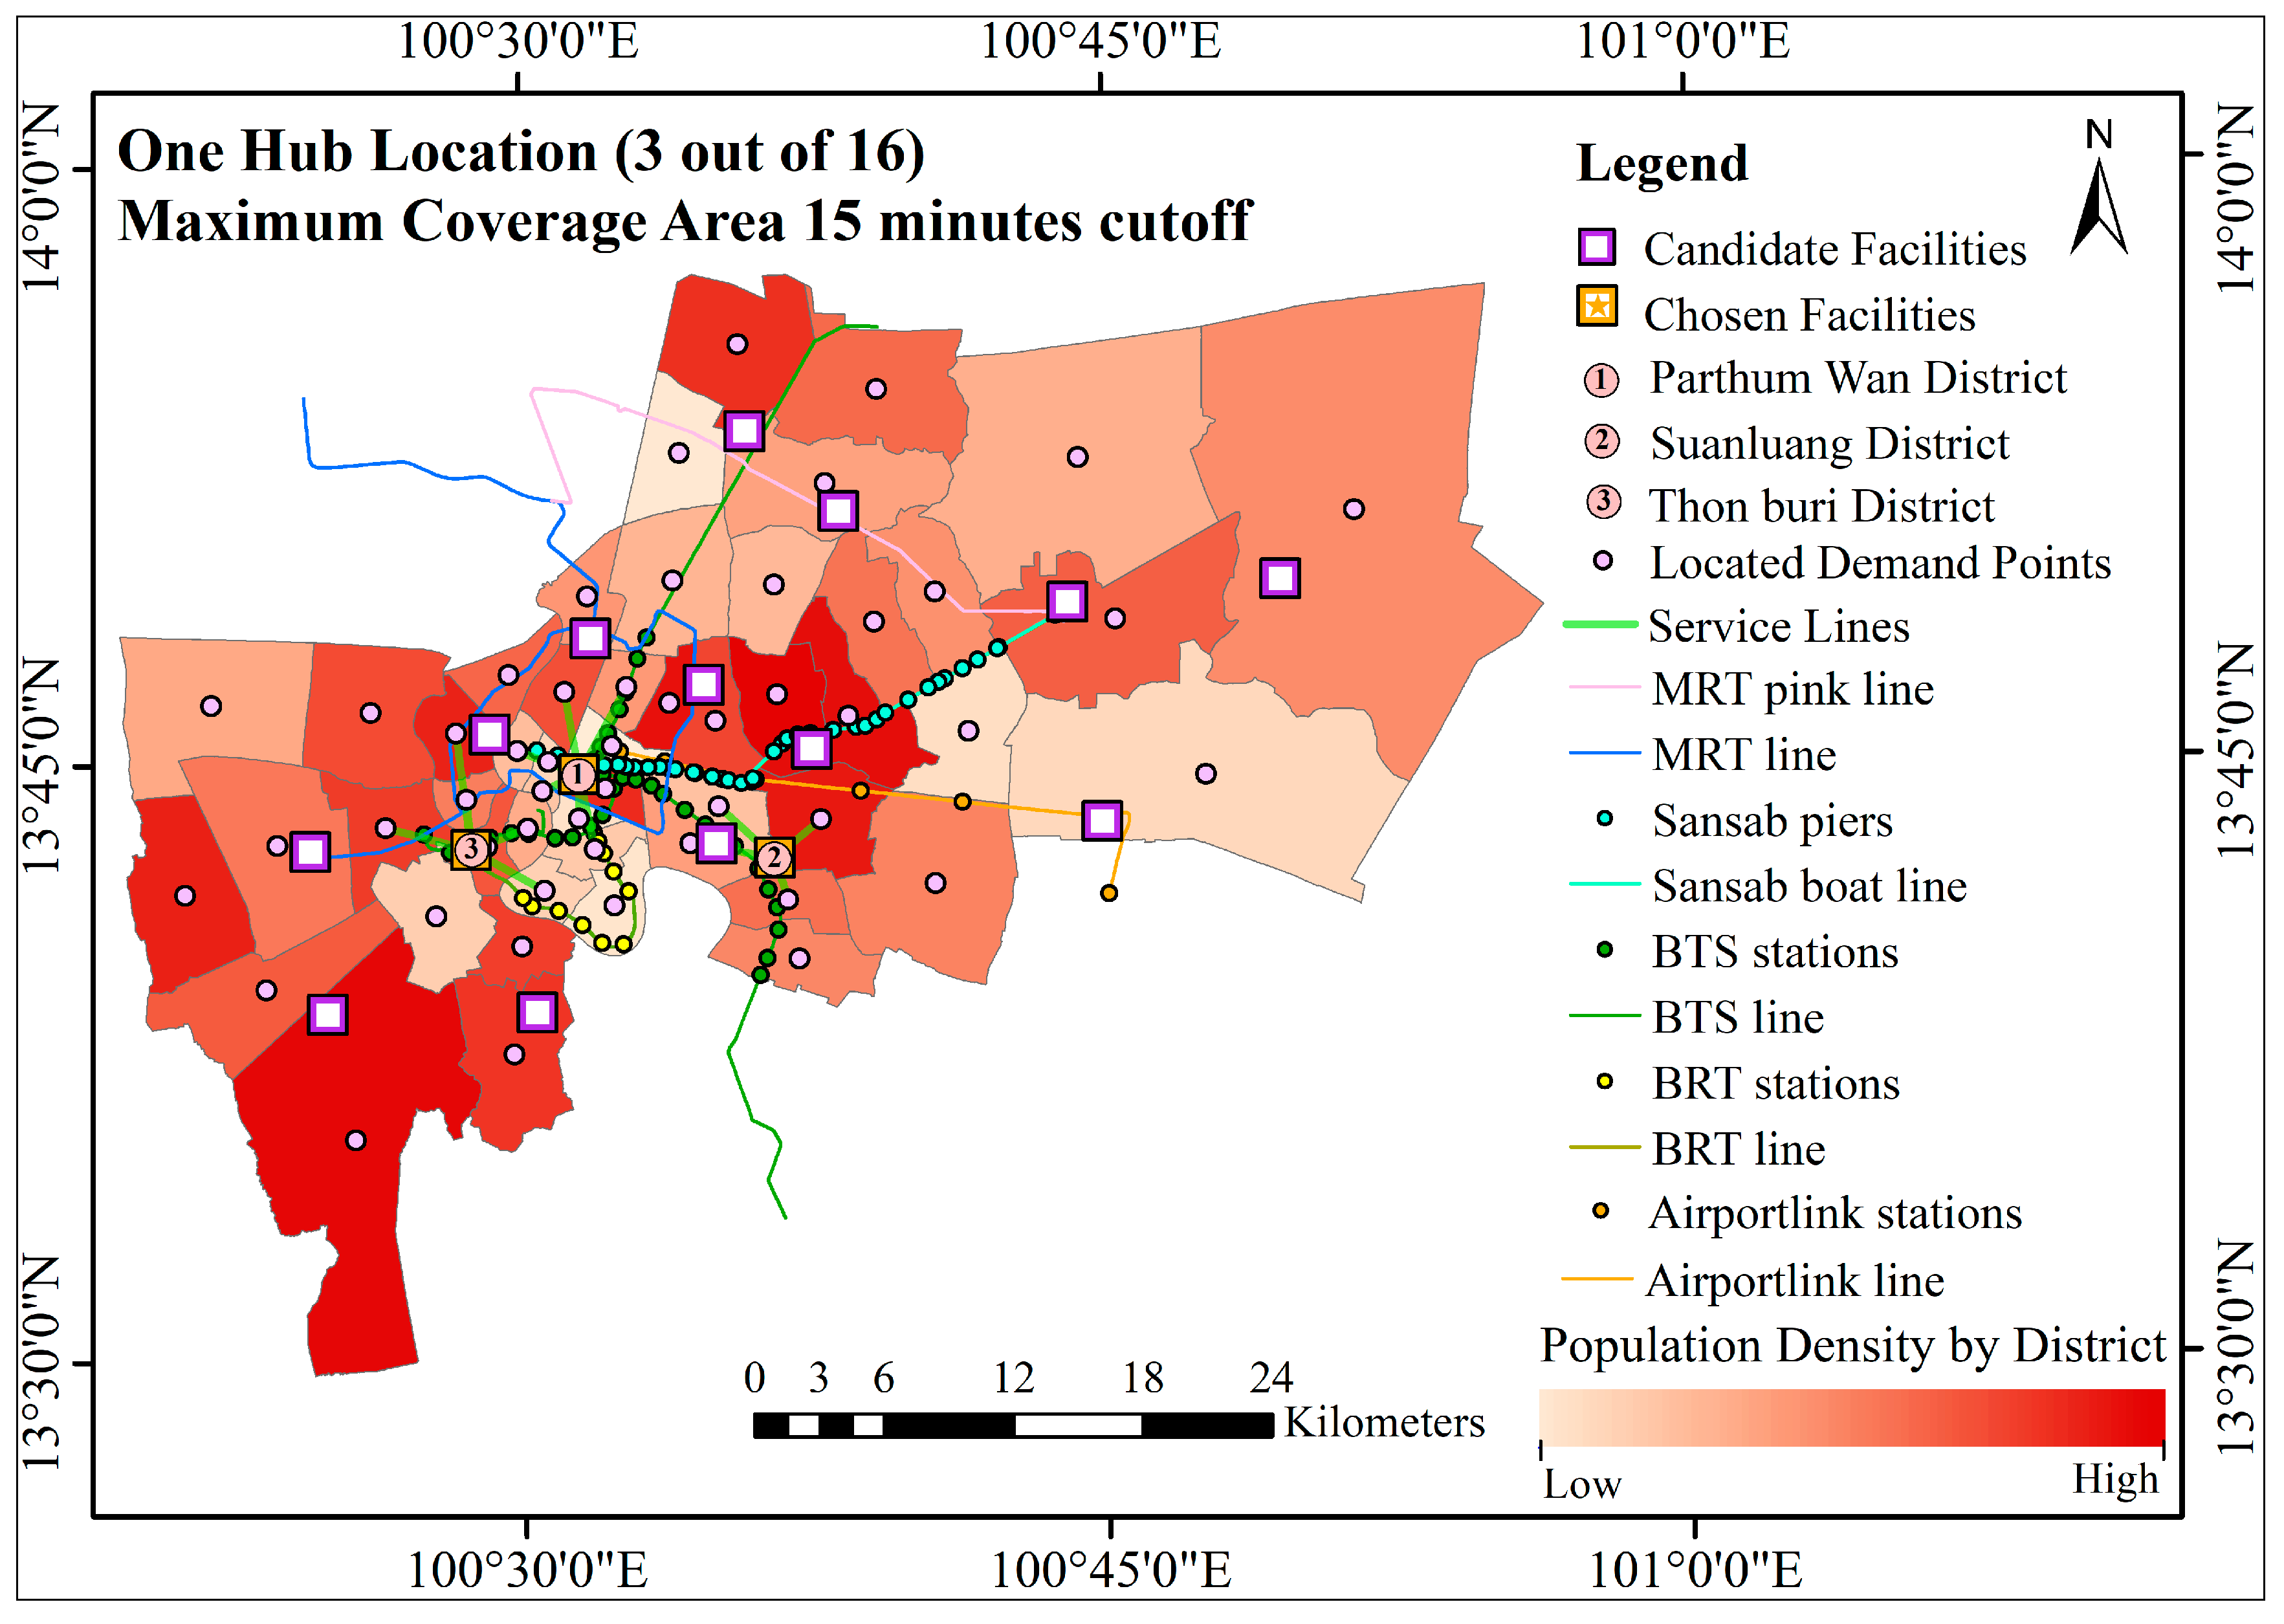
Figure A3. Three-hub coverage at 15 min, selected hubs Pathum Wan-Suanluang-Thon Buri, covered 19 of 50 units, 1,377,339 residents; hub catchments 528,411, 468,686, 380,242.
Sustainability 17 09653 g0a3
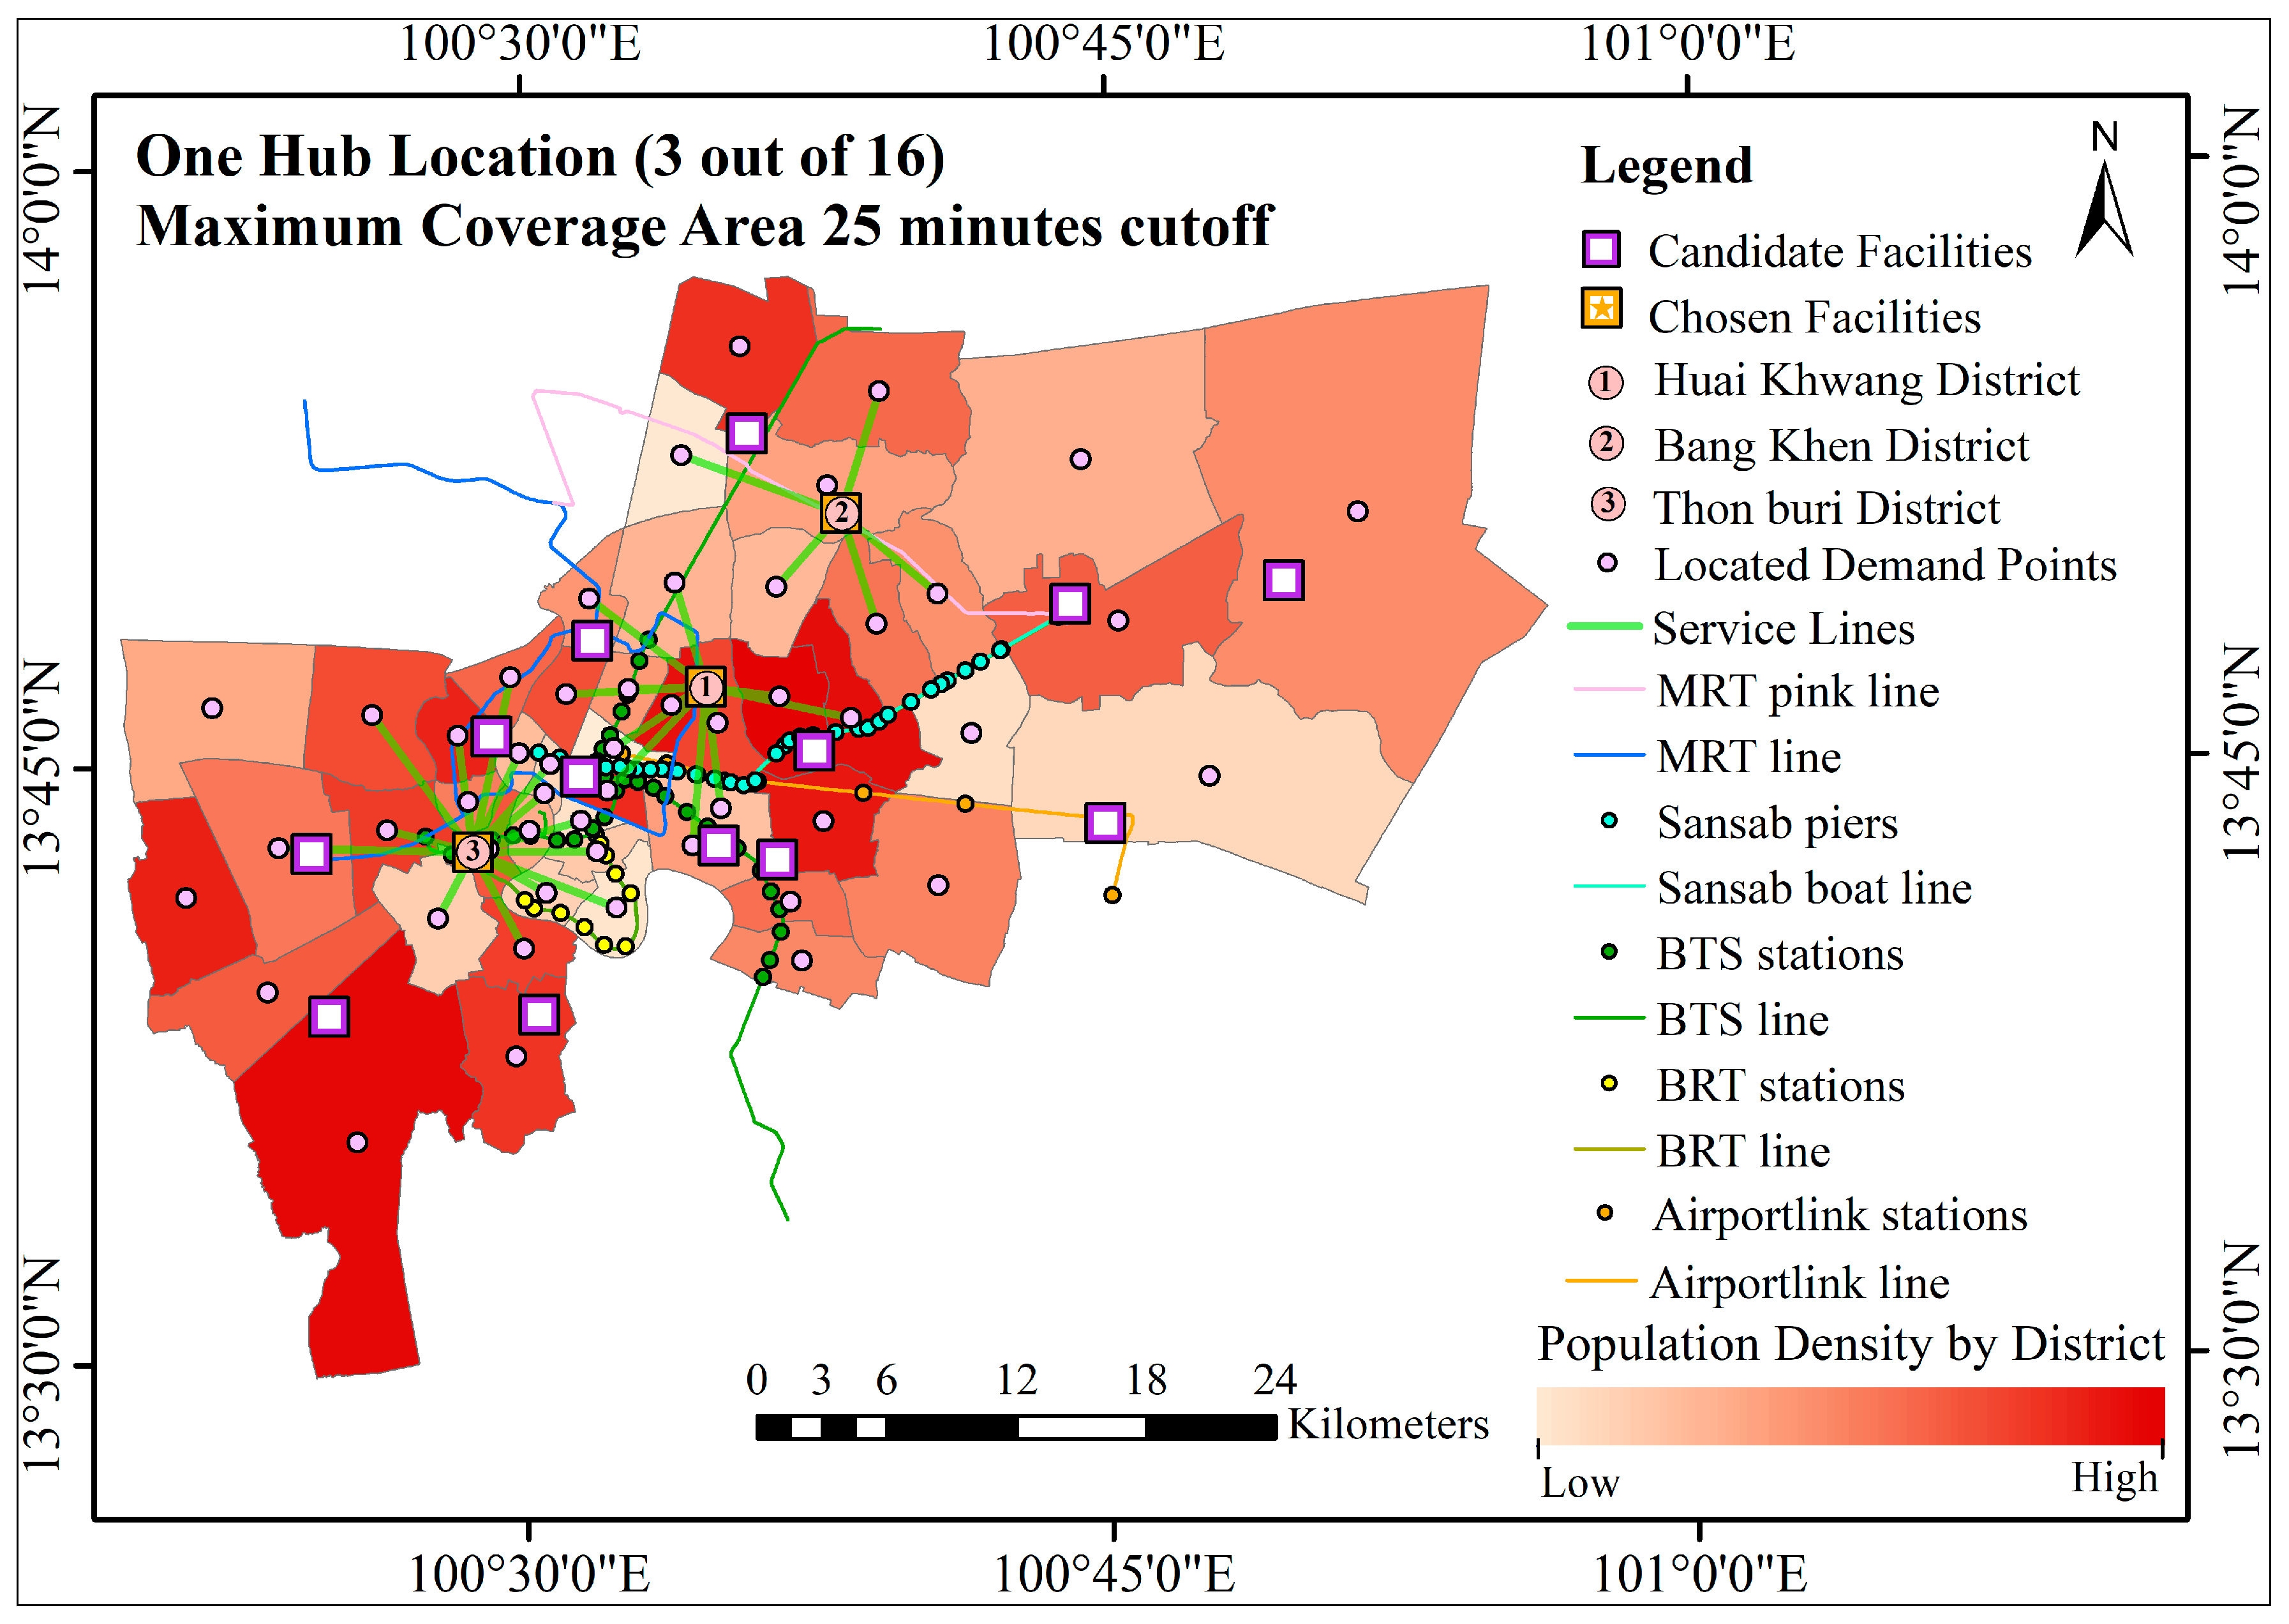
Figure A4. Three-hub coverage at 25 min, selected hubs Huai Khwang-Bang Khen-Thon Buri, covered 35 of 50 units, 3,400,177 residents; hub catchments 1,421,661, 1,136,011, 842,505.
Sustainability 17 09653 g0a4
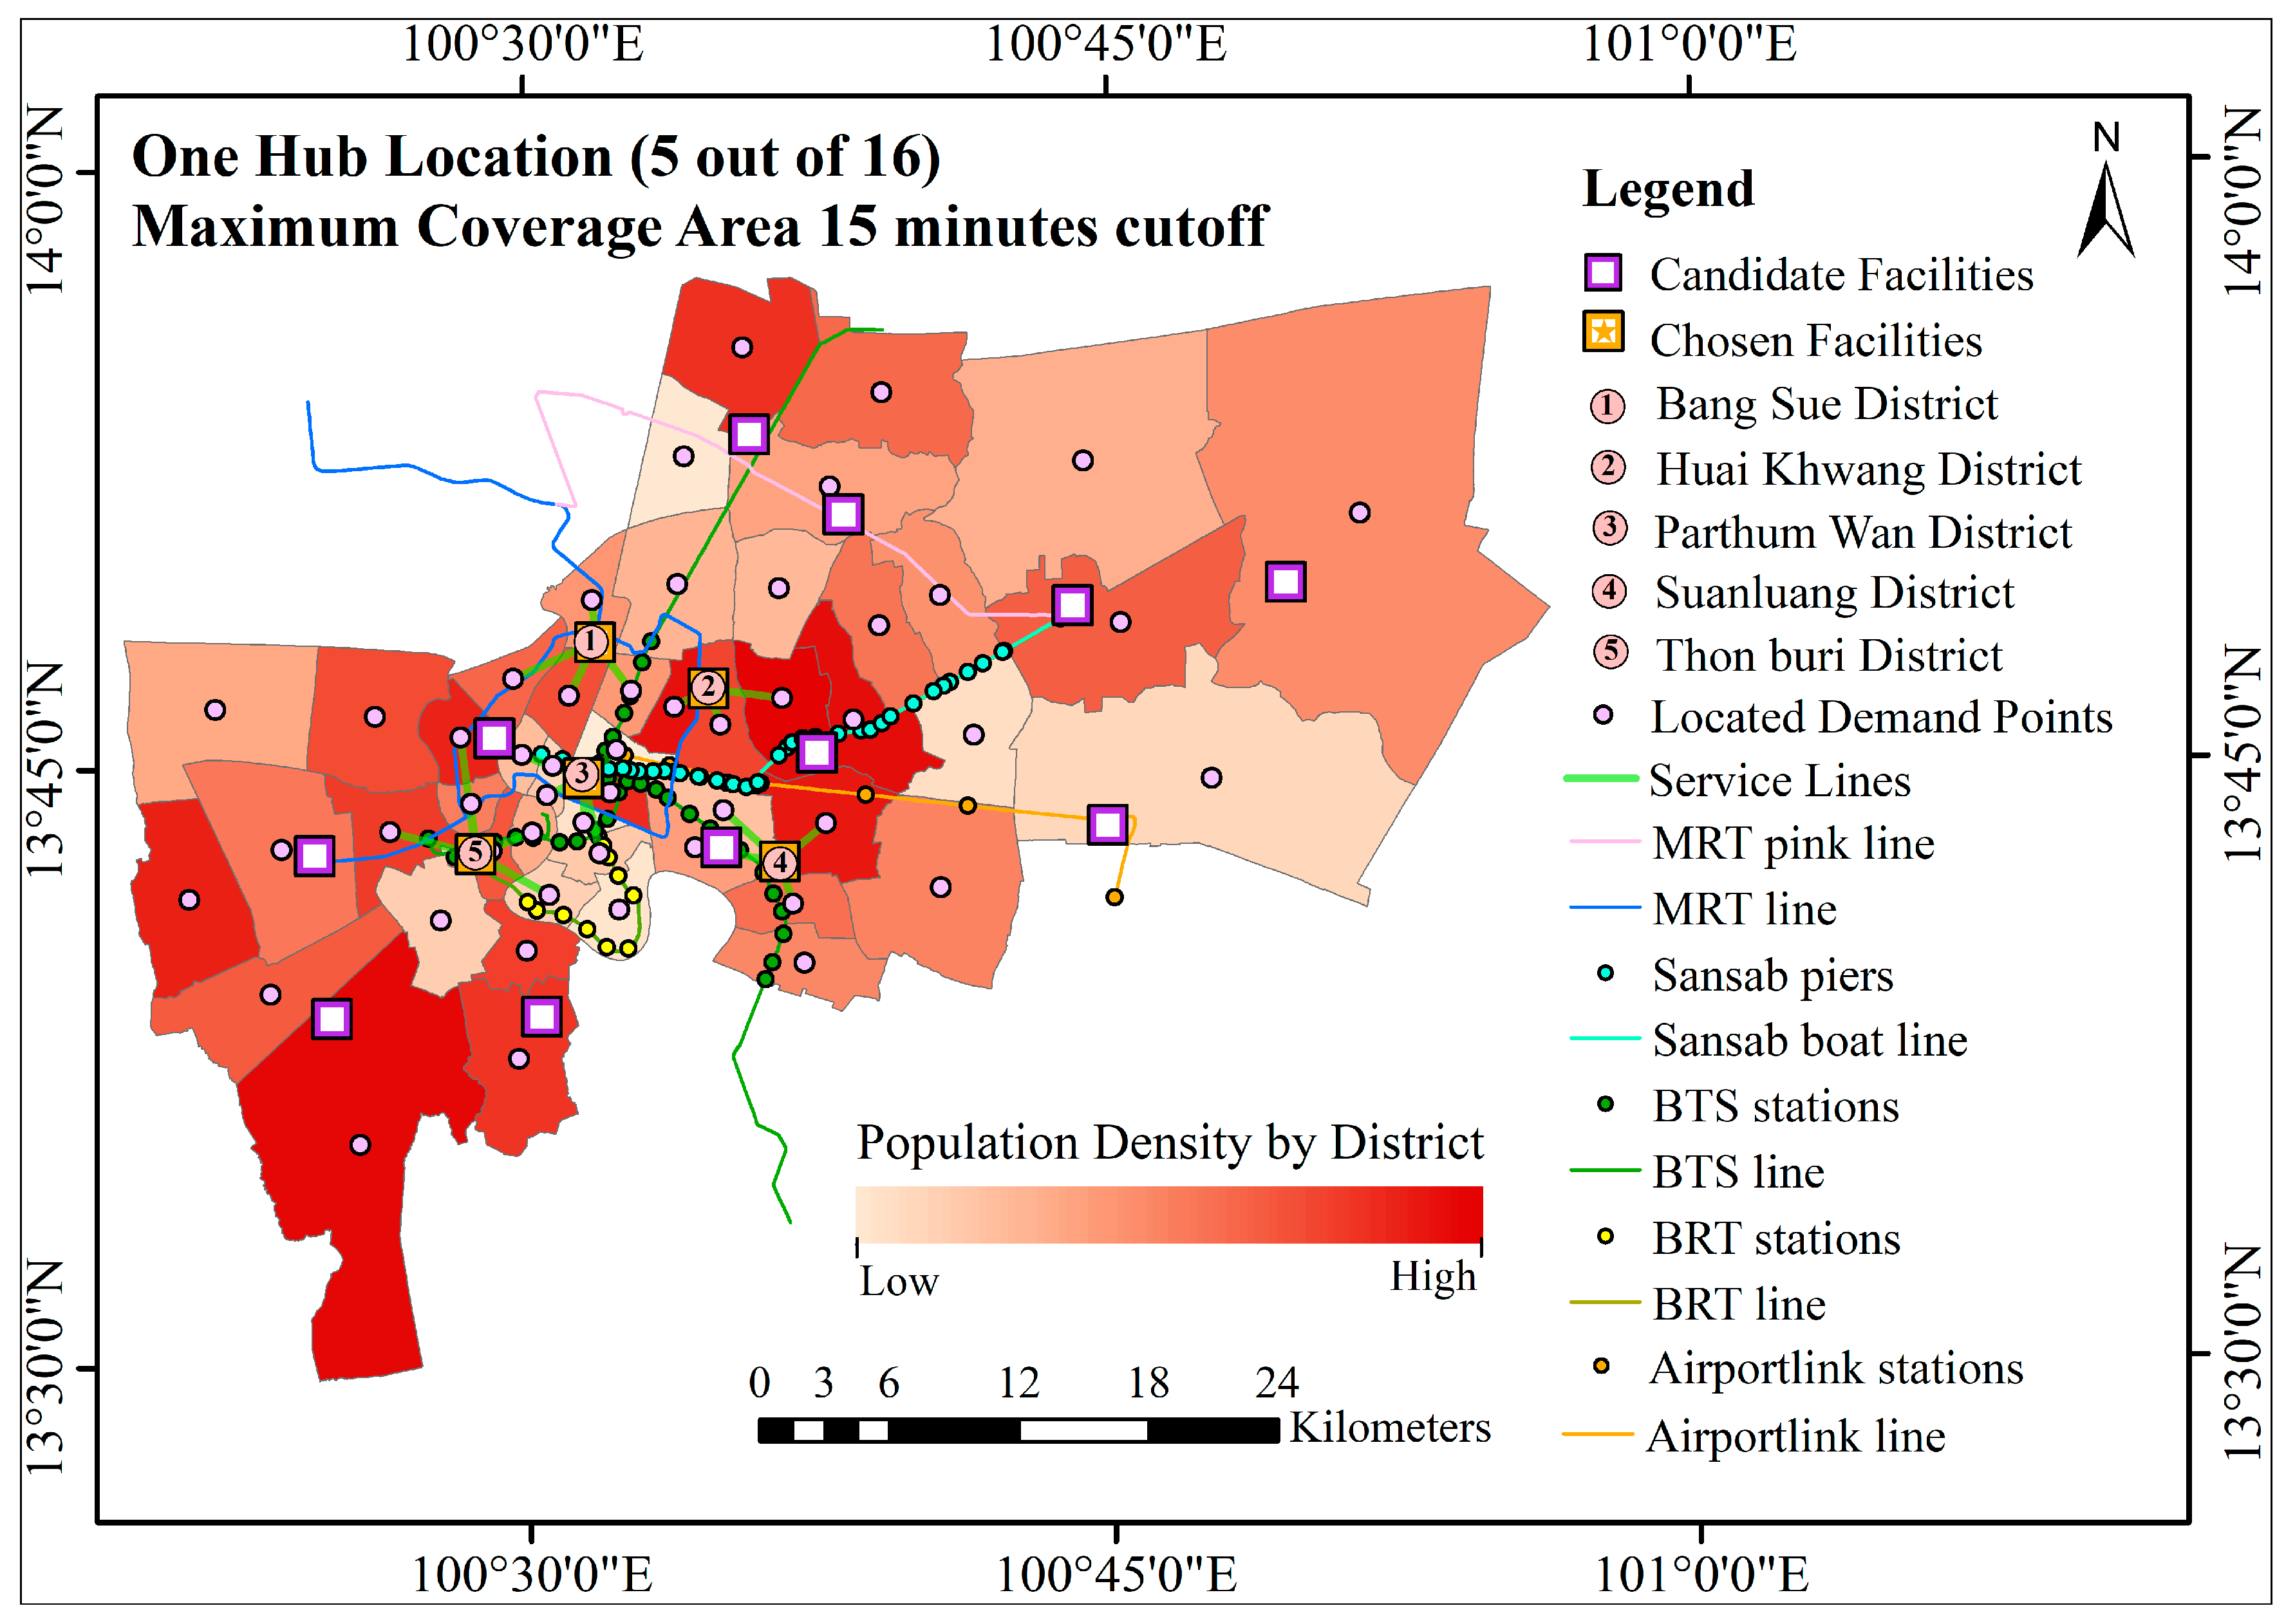
Figure A5. Five-hub coverage at 15 min, selected hubs Bang Sue-Huai Khwang-Pathum Wan-Suanluang-Thon Buri, covered 24 of 50 units, 1,883,268 residents; hub catchments 350,783, 299,023, 324,809, 380,242, 528,411.
Sustainability 17 09653 g0a5
Figure A6. Five-hub coverage at 25 min, selected hubs Bang Sue-Bang Khen-Bang Khae-Suanluang-Thon Buri, covered 41 of 50 units, 4,134,771 residents; hub catchments 765,399, 842,505, 570,812, 895,348, 1,060,707.
Sustainability 17 09653 g0a6
Figure A7. Accessibility isochrones for the one-hub scenario at the 15 min cutoff. Selected hub at Pathum Wan.
Sustainability 17 09653 g0a7
Figure A8. Accessibility isochrones for the one-hub scenario at the 25 min cutoff. Selected hub at Pathum Wan.
Sustainability 17 09653 g0a8
Figure A9. Accessibility isochrones for the three-hub scenario at the 15 min cutoff. Selected hubs at Pathum Wan, Suanluang, and Thon Buri.
Sustainability 17 09653 g0a9
Figure A10. Accessibility isochrones for the three-hub scenario at the 25 min cutoff. Selected hubs at Huai Khwang, Bang Khen, and Thon Buri.
Sustainability 17 09653 g0a10
Figure A11. Accessibility isochrones for the five-hub scenario at the 15 min cutoff. Selected hubs at Bang Sue, Huai Khwang, Pathum Wan, Suanluang, and Thon Buri.
Sustainability 17 09653 g0a11
Figure A12. Accessibility isochrones for the five-hub scenario at the 25 min cutoff. Selected hubs at Bang Sue, Bang Khen, Bang Khae, Suanluang, and Thon Buri.
Sustainability 17 09653 g0a12

References

  1. Losiri, C.; Nagai, M.; Ninsawat, S.; Shrestha, R.P. Modeling Urban Expansion in Bangkok Metropolitan Region Using Demographic-Economic Data through Cellular Automa-ta-Markov Chain and Multi-Layer Perceptron-Markov Chain Models. Sustainability 2016, 8, 686. [Google Scholar] [CrossRef]
  2. Ayaragarnchanakul, E.; Creutzig, F.; Javaid, A.; Puttanapong, N. Choosing a Mode in Bangkok: Room for Shared Mobility? Sustainability 2022, 14, 9127. [Google Scholar] [CrossRef]
  3. Fold, N.R.; Allison, M.R.; Wood, B.C.; Thao, P.T.B.; Bonnet, S.; Garivait, S.; Kamens, R.; Pengjan, S. An Assessment of Annual Mortality Attributable to Ambient PM2.5 in Bangkok, Thailand. Int. J. Environ. Res. Public Health 2020, 17, 7298. [Google Scholar] [CrossRef]
  4. Chalermpong, S.; Ratanawaraha, A.; Anuchitchanchai, O. Motorcycle Taxis’ Varying Degrees of Complementarity and Substitution with Public Transit in Bangkok. J. Transp. Geogr. 2023, 108, 103557. [Google Scholar] [CrossRef]
  5. Cheewaphongphan, P.; Junpen, A.; Garivait, S.; Chatani, S. Emission Inventory of On-Road Transport in Bangkok Metropolitan Region (BMR) Development during 2007 to 2015 Using the GAINS Model. Atmosphere 2017, 8, 167. [Google Scholar] [CrossRef]
  6. Bando, Y.; Yoh, K.; Sou, K.; Chou, C.-C.; Doi, K. AI-Based Evaluation of Streets for People in Bangkok: Perspectives from Walkability and Lingerability. Sustainability 2023, 15, 16884. [Google Scholar] [CrossRef]
  7. Iamtrakul, P.; Padon, A.; Chayphong, S.; Hayashi, Y. Unlocking Urban Accessibility: Proximity Analysis in Bangkok, Thailand’s Mega City. Sustainability 2024, 16, 3137. [Google Scholar] [CrossRef]
  8. Peungnumsai, A.; Miyazaki, H.; Witayangkurn, A.; Kim, S.M. A Grid-Based Spatial Analysis for Detecting Supply-Demand Gaps of Public Transports: A Case Study of the Bangkok Metropolitan Region. Sustainability 2020, 12, 10382. [Google Scholar] [CrossRef]
  9. Chaisomboon, M.; Jomnonkwao, S.; Ratanavaraha, V. Elderly Users’ Satisfaction with Public Transport in Thailand Using Different Importance Performance Analysis Approaches. Sustainability 2020, 12, 9066. [Google Scholar] [CrossRef]
  10. Ford, A.C.; Barr, S.L.; Dawson, R.J.; James, P. Transport Accessibility Analysis Using GIS: Assessing Sustainable Transport in London. ISPRS Int. J. Geo-Inf. 2015, 4, 124–149. [Google Scholar] [CrossRef]
  11. So, J.; Chae, M.; Hong, J.; Youm, J.; Kim, S.H.; Kim, J. Integrated Mobility Hub Location Selection for Sustainable Urban Mobility. Sustain. Cities Soc. 2023, 99, 104950. [Google Scholar] [CrossRef]
  12. Żochowska, R.; Kłos, M.J.; Soczówka, P.; Pilch, M. Assessment of Accessibility of Public Transport by Using Temporal and Spatial Analysis. Sustainability 2022, 14, 16127. [Google Scholar] [CrossRef]
  13. Zhou, L.; Wang, S.; Xu, Z. A Multi-factor Spatial Optimization Approach for Emergency Medical Facilities in Beijing. ISPRS Int. J. Geo-Inf. 2020, 9, 361. [Google Scholar] [CrossRef]
  14. Wang, W.; Xu, Z.; Sun, D.; Lan, T. Spatial Optimization of Mega-City Fire Stations Based on Multi-Source Geospatial Data: A Case Study in Beijing. ISPRS Int. J. Geo-Inf. 2021, 10, 282. [Google Scholar] [CrossRef]
  15. Achariyaviriya, W.; Hayashi, Y.; Takeshita, H.; Kii, M.; Vichiensan, V.; Theeramunkong, T. Can Space-Time Shifting of Activities and Travels Mitigate Hyper-Congestion in an Emerging Megacity, Bangkok? Effects on Quality of Life and CO2 Emission. Sustainability 2021, 13, 6547. [Google Scholar] [CrossRef]
  16. Vichiensan, V.; Wasuntarasook, V.; Malaitham, S.; Fukuda, A.; Rujopakarn, W. Willingness to Pay for Station Access Transport: A Mixed Logit Model with Heterogeneous Travel Time Valuation. Sustainability 2025, 17, 6715. [Google Scholar] [CrossRef]
  17. Hasselwander, M.; Bigotte, J.F. Mobility as a Service (MaaS) in the Global South: Research findings, gaps, and directions. Eur. Transp. Res. Rev. 2023, 15, 27. [Google Scholar] [CrossRef]
  18. Suatmadi, A.Y.; Creutzig, F.; Otto, I.M. On-demand motorcycle taxis improve mobility, not sustainability. Case Stud. Transp. Policy 2019, 7, 218–229. [Google Scholar] [CrossRef]
  19. Banister, D. The sustainable mobility paradigm. Transp. Policy 2008, 15, 73–80. [Google Scholar] [CrossRef]
  20. van Wee, B. Accessible accessibility research challenges. J. Transp. Geogr. 2016, 51, 9–16. [Google Scholar] [CrossRef]
  21. Geurs, K.T.; van Wee, B. Accessibility evaluation of land-use and transport strategies: Review and research directions. J. Transp. Geogr. 2004, 12, 127–140. [Google Scholar] [CrossRef]
  22. Ewing, R.; Cervero, R. Travel and the Built Environment: A Meta-Analysis. J. Am. Plan. Assoc. 2010, 76, 265–294. [Google Scholar] [CrossRef]
  23. Lucas, K. Transport and social exclusion: Where are we now? Transp. Policy 2012, 20, 105–113. [Google Scholar] [CrossRef]
  24. Keeratikasikorn, C.; Bonafoni, S. Urban Heat Island Analysis over the Land Use Zoning Plan of Bangkok by Means of Landsat 8 Imagery. Remote Sens. 2018, 10, 440. [Google Scholar] [CrossRef]
  25. Ornthammarath, T.; Warnitchai, P.; Asano, K.; Waly, M.F. Preliminary Analysis of Amplified Ground Motion in Bangkok Basin Using HVSR Curves from Recent Moderate to Large Earthquakes. Geoenviron. Disast. 2023, 10, 28. [Google Scholar] [CrossRef]
  26. Darnkachatarn, S.; Phanlalong, S.; Wattanakij, N.; Wongsa, S.; Chumchuay, R.; Sarapirom, S.; Vongrueng, P.; Peerapon, N. Long-Term Flood Exposure Assessment Using Satellite-Based Land Use Change Detection and Inundation Simulation: A 30-Year Case Study of the Bangkok Metropolitan Region. J. Flood Risk Manag. 2024, 17, e12997. [Google Scholar] [CrossRef]
  27. Hossain, M.; Iamtrakul, P. Water Transportation in Bangkok: Past, Present, and the Future. J. Archit./Plan. Res. Stud. 2018, 5, 1–24. [Google Scholar] [CrossRef]
  28. Chankrajang, T.; Vechbanyongratana, J. Canals and Orchards: The Impact of Transport Network Access on Agricultural Productivity in Nineteenth-Century Bangkok. J. Econ. Hist. 2020, 80, 996–1030. [Google Scholar] [CrossRef]
  29. Abd El Karim, A.; Awawdeh, M.M. Integrating GIS Accessibility and Location-Allocation Models with Multicriteria Decision Analysis for Evaluating Quality of Life in Buraidah City, KSA. Sustainability 2020, 12, 1412. [Google Scholar] [CrossRef]
  30. Czarnetzki, F.; Siek, F. Decentralized mobility hubs in urban residential neighborhoods improve the contribution of carsharing to sustainable mobility: Findings from a quasi-experimental study. Transportation 2023, 50, 2193–2225. [Google Scholar] [CrossRef]
  31. Antipova, A.; Sultana, S.; Hu, Y.; Rhudy, J.P., Jr. Accessibility and Transportation Equity. Sustainability 2020, 12, 3611. [Google Scholar] [CrossRef]
  32. Siangsuebchart, S.; Ninsawat, S.; Witayangkurn, A.; Pravinvongvuth, S. Public Transport GPS Probe and Rail Gate Data for Assessing the Pattern of Human Mobility in the Bangkok Metropolitan Region, Thailand. Sustainability 2021, 13, 2178. [Google Scholar] [CrossRef]
  33. Mouratidis, K. Time to challenge the 15-minute city: Seven pitfalls for sustainability, equity, livability, and spatial analysis. Cities 2024, 153, 105274. [Google Scholar] [CrossRef]
  34. van der Meulen, E.S.; van de Ven, F.H.M.; van Oel, P.R.; Rijnaarts, H.H.M.; Sutton, N.B. Improving suitability of urban canals and canalized rivers for transportation, thermal energy extraction and recreation in two European delta cities. Ambio 2023, 52, 195–209. [Google Scholar] [CrossRef]
  35. Liu, X.; Payakkamas, P.; Dijk, M.; de Kraker, J. GIS Models for Sustainable Urban Mobility Planning: Current Use, Future Needs and Potentials. Future Transp. 2023, 3, 384–402. [Google Scholar] [CrossRef]
  36. Domènech, A.; Gutiérrez, A. A GIS-Based Evaluation of the Effectiveness and Spatial Coverage of Public Transport Networks in Tourist Destinations. ISPRS Int. J. Geo-Inf. 2017, 6, 83. [Google Scholar] [CrossRef]
  37. Droj, G.; Droj, L.; Badea, A.-C.; Dragomir, P.I. GIS-Based Urban Traffic Assessment in a Historical European City under the Influence of Infrastructure Works and COVID-19. Appl. Sci. 2023, 13, 1355. [Google Scholar] [CrossRef]
  38. Church, R.; ReVelle, C. The maximal covering location problem. Pap. Reg. Sci. 1974, 32, 101–118. [Google Scholar] [CrossRef]
  39. Giuffrida, N.; Le Pira, M.; Inturri, G.; Ignaccolo, M. Mapping with Stakeholders: An Overview of Public Participatory GIS and VGI in Transport Decision-Making. ISPRS Int. J. Geo-Inf. 2019, 8, 198. [Google Scholar] [CrossRef]
  40. Bąkowska-Waldmann, E. Residents’ Experiential Knowledge and Its Importance for Decision-Making Processes in Spatial Planning: A PPGIS Based Study. ISPRS Int. J. Geo-Inf. 2023, 12, 102. [Google Scholar] [CrossRef]
  41. Sreemongkol, K.; Lohatepanont, M.; Cheewinsiriwat, P.; Bunlikitkul, T.O.; Supasaovapak, J. GIS Mapping Evaluation of Stroke Service Areas in Bangkok Using Emergency Medical Services. ISPRS Int. J. Geo-Inf. 2021, 10, 651. [Google Scholar] [CrossRef]
  42. Jiang, S.; van Wee, B.; Ettema, D. Intra-household interactions and travel behavior: A systematic review. J. Transp. Geogr. 2022, 102, 103485. [Google Scholar] [CrossRef]
  43. Lu, Y.; Prato, C.G.; Sipe, N.; Kimpton, A.; Corcoran, J. The role of household modality style in first and last mile travel mode choice. Transp. Res. A Policy Pract. 2022, 158, 95–109. [Google Scholar] [CrossRef]
  44. Lu, Y.; Prato, C.G.; Corcoran, J. Disentangling the behavioural side of the first and last mile problem: The role of modality style and the built environment. J. Transp. Geogr. 2021, 91, 102936. [Google Scholar] [CrossRef]
  45. Krueger, R.; Vij, A.; Rashidi, T.H. Normative beliefs and modality styles: A latent class and latent variable model of travel behaviour. Transportation 2018, 45, 789–825. [Google Scholar] [CrossRef]
  46. Ji, Y.; Liu, Y.; Liu, Q.; He, B.; Cao, Y. How household roles influence individuals’ travel mode choice under intra-household interactions? KSCE J. Civ. Eng. 2018, 22, 4635–4644. [Google Scholar] [CrossRef]
  47. Anggraini, R.; Arentze, T.A.; Timmermans, H.J.P. Car allocation between household heads in car deficient households: A decision model. Eur. J. Transp. Infrastruct. Res. 2008, 8, 301–319. [Google Scholar] [CrossRef]
  48. Ho, C.; Mulley, C. Intra-household interactions in tour-based mode choice: The role of social, temporal, spatial and resource constraints. Transp. Policy 2015, 38, 52–63. [Google Scholar] [CrossRef]
  49. Roorda, M.J.; Miller, E.J.; Kruchten, N. Incorporating within-household interactions into mode choice model with genetic algorithm for parameter estimation. Transp. Res. Rec. 2006, 1985, 171–179. [Google Scholar] [CrossRef]
  50. Liu, S.; Yamamoto, T.; Yao, E. Joint modeling of mode choice and travel distance with intra-household interactions. Transportation 2023, 50, 1527–1552. [Google Scholar] [CrossRef]
  51. Pangbourne, K.; Mladenović, M.N.; Stead, D.; Milakis, D. Questioning Mobility as a Service: Unanticipated Implications for Society and Governance. Transp. Res. A Policy Pract. 2020, 131, 35–49. [Google Scholar] [CrossRef]
  52. Maas, B. Literature Review of Mobility as a Service (MaaS). Sustainability 2022, 14, 8962. [Google Scholar] [CrossRef]
  53. Servou, E.; Behrendt, F.; Horst, M. Data, AI and Governance in MaaS: Leading to Sustainable Mobility? Transp. Res. Interdiscip. Perspect. 2023, 19, 100806. [Google Scholar] [CrossRef]
  54. Narupiti, S. Exploring the Possibility of MaaS Service in Thailand: Who Should Be the MaaS Provider in Bangkok? IATSS Res. 2019, 43, 226–234. [Google Scholar] [CrossRef]
  55. Mulley, C.; Nelson, J.D.; Wright, S. Community Transport Meets Mobility as a Service: On the Road to a New and Flexible Future. Res. Transp. Econ. 2018, 69, 583–591. [Google Scholar] [CrossRef]
  56. Mulley, C.; Ho, C.; Balbontin, C.; Hensher, D.; Stevens, L.; Nelson, J.D.; Wright, S. Mobility as a Service in Community Transport in Australia: Can It Provide a Sustainable Future? Transp. Res. A Policy Pract. 2020, 131, 107–122. [Google Scholar] [CrossRef]
  57. Alyavina, E.; Nikitas, A.; Njoya, E.T. Mobility-as-a-Service and Unsustainable Travel Behaviour: Exploring the Car Ownership and Public Transport Trip Replacement Side-Effects of the MaaS Paradigm. Transp. Policy 2024, 150, 53–70. [Google Scholar] [CrossRef]
  58. Pickford, A.; Chung, E. The Shape of MaaS: The Potential for “MaaS Lite”. IATSS Res. 2019, 43, 219–225. [Google Scholar] [CrossRef]
  59. López-Carreiro, I.; Monzón, A.; López, E. MaaS Implications in the Smart City: A Multi-Stakeholder Approach. Sustainability 2023, 15, 10832. [Google Scholar] [CrossRef]
  60. Nieuwenhuijsen, M.J. Urban and transport planning pathways to carbon neutral, liveable and healthy cities; A review of the current evidence. Environ. Int. 2020, 140, 105661. [Google Scholar] [CrossRef]
  61. Ali, L.; Nawaz, A.; Iqbal, S.; Aamir Basheer, M.; Hameed, J.; Albasher, G.; Shah, S.A.R.; Bai, Y. Dynamics of Transit Oriented Development, Role of Greenhouse Gases and Urban Environment: A Study for Management and Policy. Sustainability 2021, 13, 2536. [Google Scholar] [CrossRef]
  62. Arbeláez Vélez, A.M.; Plepys, A. Car Sharing as a Strategy to Address GHG Emissions in the Transport System: Evaluation of Effects of Car Sharing in Amsterdam. Sustainability 2021, 13, 2418. [Google Scholar] [CrossRef]
  63. Steininger, K.W.; Meyer, L.; Nabernegg, S.; Kirchengast, G. Sectoral Carbon Budgets as an Evaluation Framework for the Built Environment. Build. Cities 2020, 1, 337–360. [Google Scholar] [CrossRef]
  64. Messina, J.P.; Shortridge, A.M.; Groop, R.E.; Varnakovida, P.; Finn, M.J. Evaluating Michigan’s community hospital access: Spatial methods for decision support. Int. J. Health Geogr. 2006, 5, 42. [Google Scholar] [CrossRef] [PubMed]
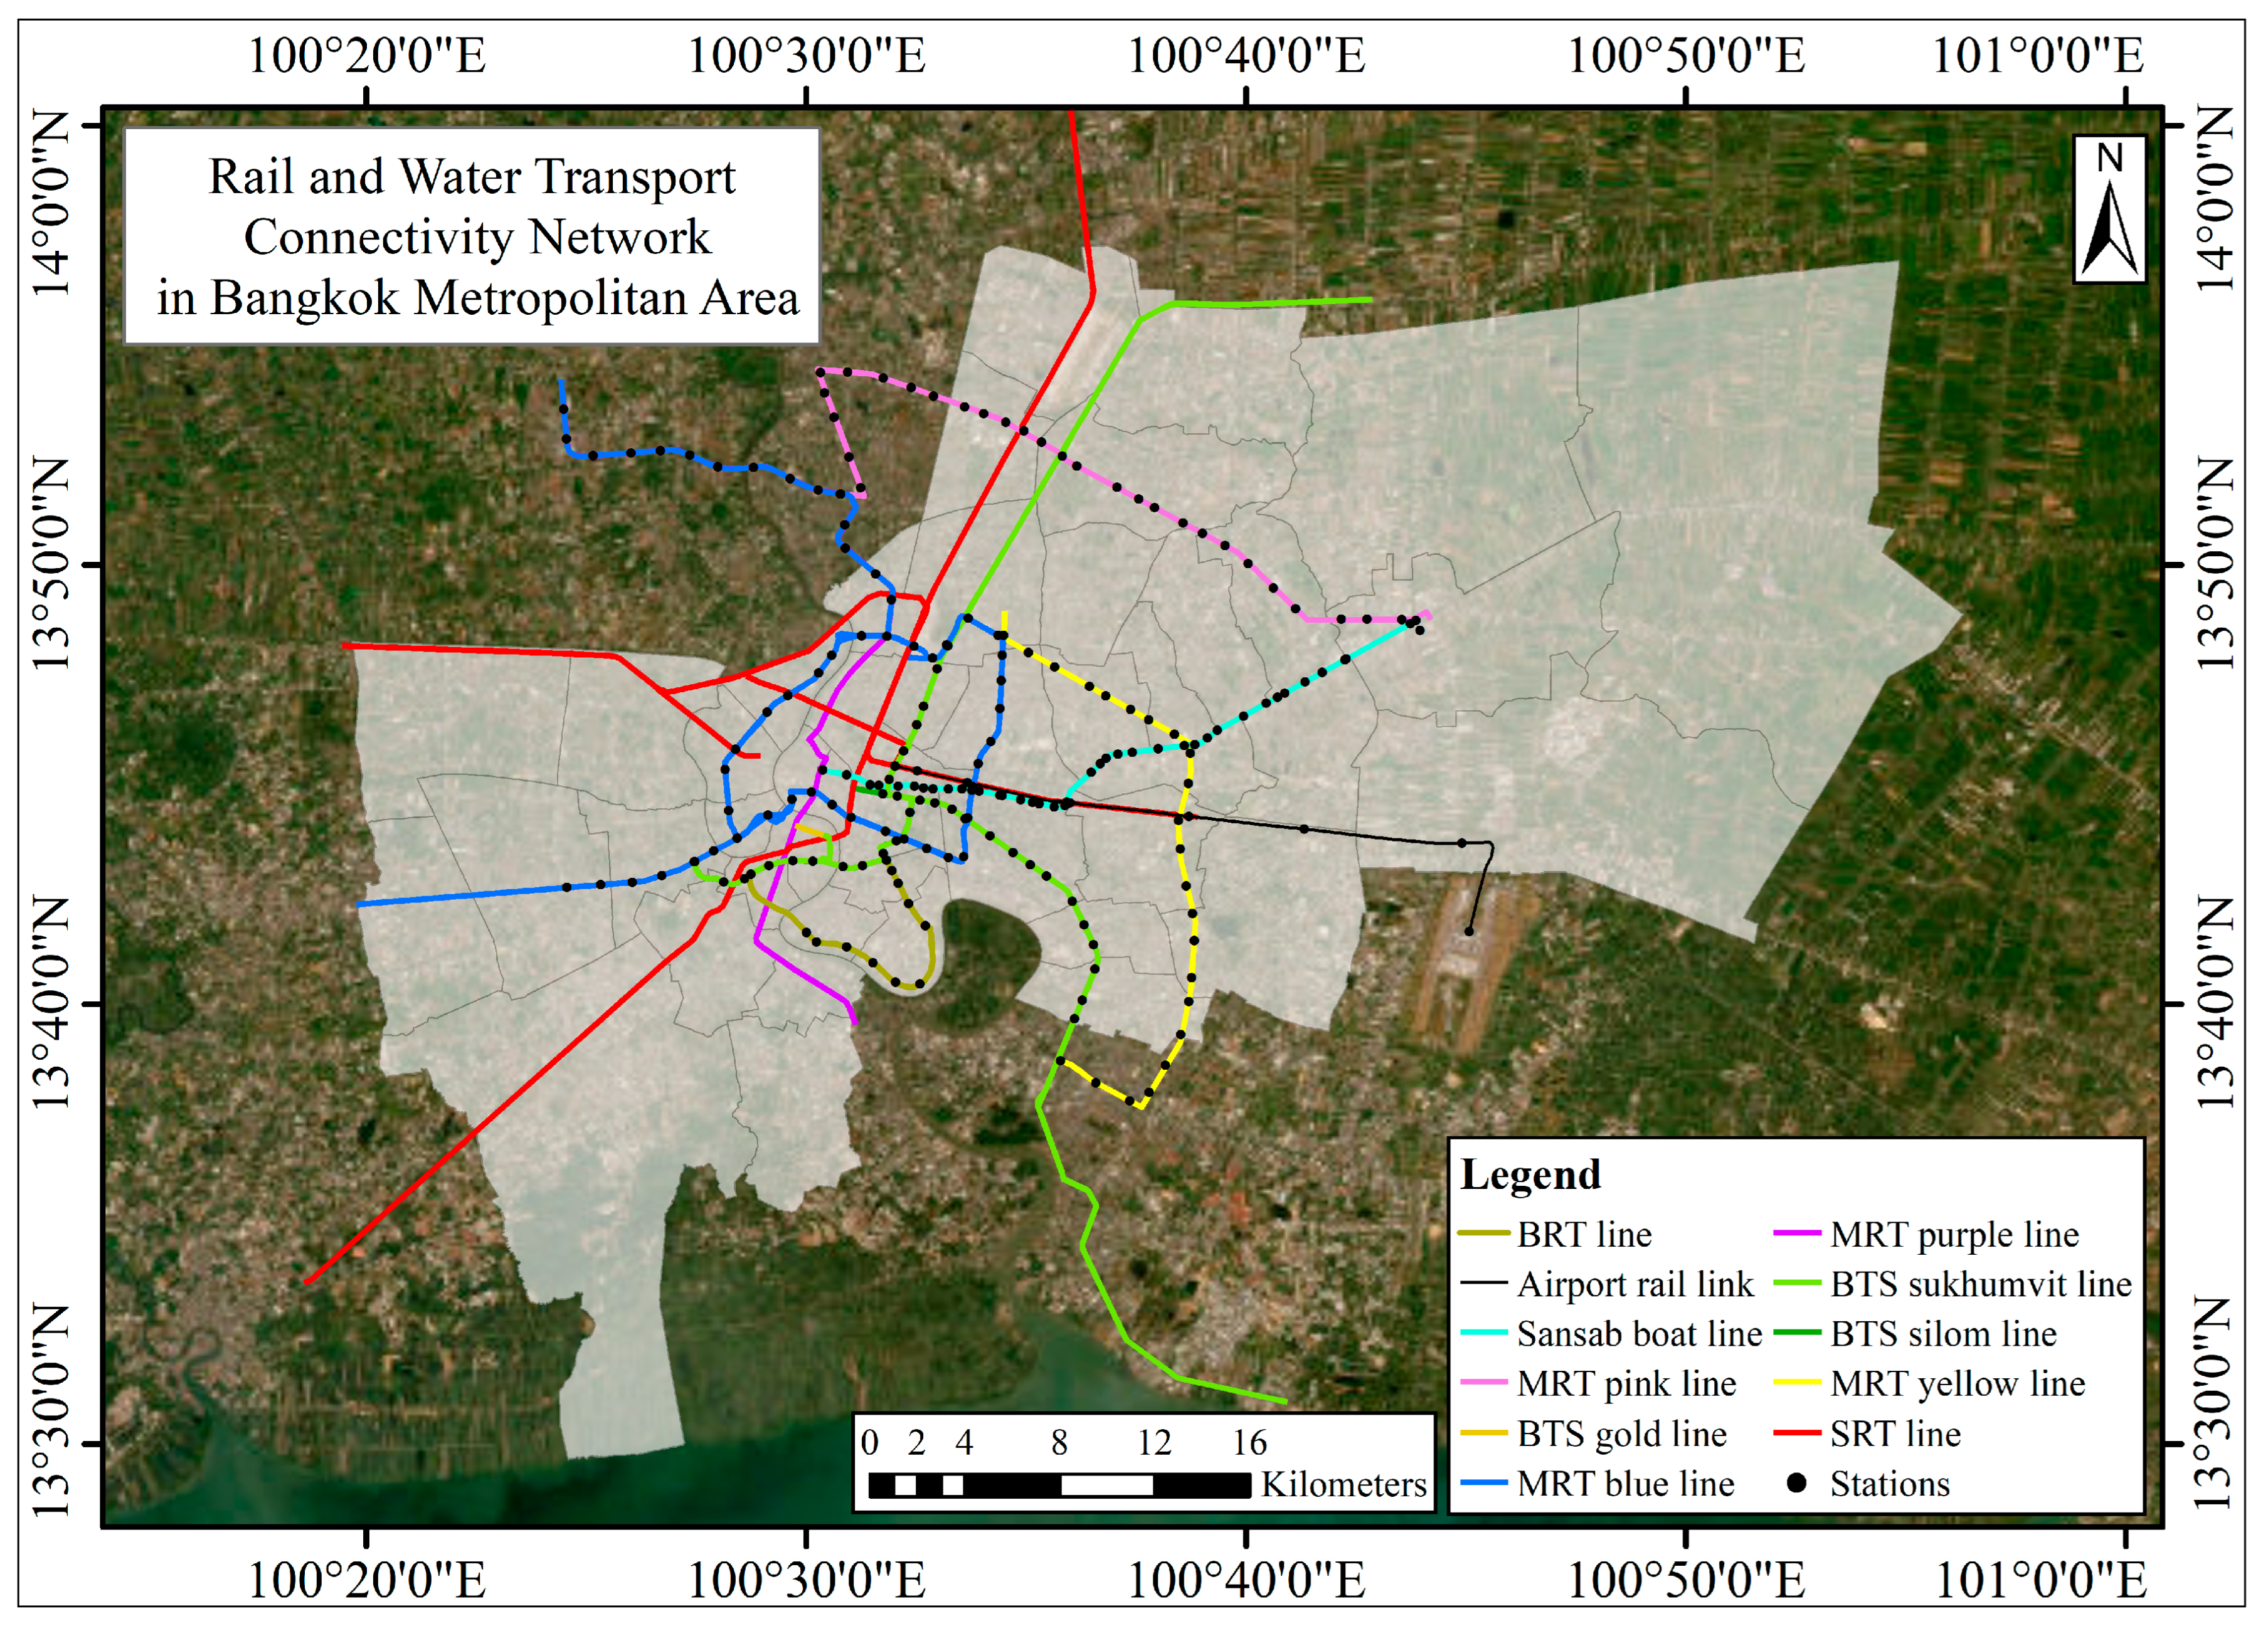
Figure 1. Rail and water transport connectivity network in Bangkok Metropolitan Area, including BTS, MRT, SRT, Airport Rail Link, BRT, and major canal routes. All station icons are represented as circles for visual consistency.
Sustainability 17 09653 g001
Figure 2. Research workflow: data collection, geodatabase development, spatial optimization with location allocation (MCLP), accessibility diagnostics, and synthesis for policy interpretation.
Sustainability 17 09653 g002
Figure 3. Administrative boundaries of the 50 districts of Bangkok Metropolitan Region used as the study area.
Sustainability 17 09653 g003
Figure 4. Road network intersection density across Bangkok, highlighting high-density zones in inner-city districts and lower-density peripheries.
Sustainability 17 09653 g004
Figure 5. One-hub maximum-coverage placement at Pathum Wan (top 1/16), with zoom-in showing multimodal convergence and dense demand points.
Sustainability 17 09653 g005
Figure 6. Three-hub coverage (Pathum Wan-Khlong Toei-Bang Khen), illustrating north–south expansion along rail/BRT spines.
Sustainability 17 09653 g006
Figure 7. Five-hub coverage (Thon Buri-Bang Khae-Bang Sue-Bang Khen-Khlong Toei), demonstrating cross-river balancing and citywide maximization.
Sustainability 17 09653 g007
Figure 8. Isochrones for the one-hub scenario showing concentrated accessibility around Pathum Wan and limited peripheral reach.
Sustainability 17 09653 g008
Figure 9. Isochrones for the three-hub scenario indicating expanded coverage north and south with more balanced accessibility.
Sustainability 17 09653 g009
Figure 10. Isochrones for the five-hub scenario illustrating comprehensive and more equitable coverage, including west-bank and outer districts.
Sustainability 17 09653 g010
Disclaimer/Publisher’s Note: The statements, opinions and data contained in all publications are solely those of the individual author(s) and contributor(s) and not of MDPI and/or the editor(s). MDPI and/or the editor(s) disclaim responsibility for any injury to people or property resulting from any ideas, methods, instructions or products referred to in the content.