Article

A Study on the Coupling and Coordination Between Urban Economic Resilience and High-Quality Development of Tourism in the Yangtze River Economic Belt

1
Business School, Guizhou University of Finance and Economics, Guiyang 550025, China
2
College of Management, Chongqing University of Technology, Chongqing 400054, China
*
Author to whom correspondence should be addressed.
Sustainability 2025, 17(21), 9657; https://doi.org/10.3390/su17219657
Submission received: 25 September 2025 / Revised: 24 October 2025 / Accepted: 28 October 2025 / Published: 30 October 2025

Abstract

Studying the coordination between urban economic resilience (ER) and high-quality tourism development (HQTD) is crucial to understanding tourism’s role in responding to economic shifts and driving urban economic transformation. Using 2010–2023 panel data from the Yangtze River Economic Belt (YREB) and a “measurement—evolution—disparity—diagnosis” framework, this study examines their coupling coordination via the coupling coordination degree (CCD) model, kernel density estimation, Gini coefficient decomposition, and influence coordination force index, elucidating spatiotemporal evolution, regional disparities, and drivers. The results show: (1) YREB synergies strengthened significantly, with ER and HQTD increasingly reinforcing each other; (2) Eastern coordination levels markedly exceeded central and western ones, reflecting persistent regional imbalances; (3) Coupling coordination converged toward higher levels, with inter-city gaps narrowing. Recommendations include enhancing regional coordination, balancing ecology and economy, fostering industrial innovation, and promoting social participation. This study provides empirical support for integrated, sustainable regional economic-tourism development.

1. Introduction

In the context of growing global uncertainties—such as economic volatility, ecological crises, and social disruptions—enhancing Economic Resilience (ER) and promoting High-Quality Tourism Development (HQTD) have become urgent priorities in the international sustainable development agenda. The United Nations’ 2030 Agenda for Sustainable Development explicitly advocates strengthening regional resilience. It suggests achieving this by improving ER and building sustainable cities, which helps societies better respond to external shocks and long-term transformation pressures [1]. Similarly, the OECD’s Tourism Trends and Policies emphasizes that the future of tourism must be based on green development, digital innovation, and regional collaboration. These three elements together form the foundation for achieving sustainability and long-term resilience in the tourism sector [2].
To address these global imperatives, major international organizations and economies have actively launched strategies to foster ER and sustainable tourism. For example, the World Bank’s Global Economic Prospects (2023) proposes supporting global economic recovery. This is particularly important for the services sector, including tourism, and can be done by expanding the digital economy and promoting green finance [3]. The European Union’s European Green Deal calls for a low-carbon transition in tourism. It advocates ecotourism and the use of green investment funds to enhance destination resilience [4]. Likewise, the G20 Global Infrastructure Investment Partnership (GIH) encourages member countries to prioritize investments in smart infrastructure and sustainable development projects within the tourism sector [5]. This is to build the sector’s long-term resilience [6].
As the world’s second-largest economy, China has actively adapted to this global shift. National strategies like the 14th Five-Year Plan and the dual circulation paradigm highlight three key needs: improving internal economic stability, optimizing regional economic structures, and facilitating green, innovative development. The tourism industry has been identified as a strategic pillar. It not only drives economic growth but also advances ecological conservation, digital transformation, and regional equity.
Within this national framework, the YREB holds strategic significance. It spans 11 provinces and accounts for over 40% of China’s GDP, serving as a critical economic, ecological, and cultural corridor. The YREB plays a vital role in three areas: promoting cross-regional integration, supporting green transformation, and driving innovation-led development. As a major global economic corridor, it also contributes significantly to regional ER and HQTD. However, some cities in the region still face persistent obstacles. These include lagging industrial structural restructuring, tightening ecological and environmental constraints, and inadequate regional coordination mechanisms. Such issues not only weaken the region’s overall economic stability but also hinder the sustainable and high-quality growth of the tourism industry.
Therefore, under the evolving global and domestic sustainable development frameworks, constructing a model that integrates ER with HQTD in the YREB has become both a theoretical necessity and a practical challenge. While academic interest in this area is growing, most existing studies tend to treat ER and tourism development separately. They rarely investigate the interdependent dynamics or coordinated evolution of the two at the regional level. Then, what kind of coupling coordination relationship exists between ER and HQTD across regions? This study draws on global best practices and uses quantitative methods to examine the coupling coordination relationship between urban ERand HQTD across cities in the YREB. Its aim is twofold: to provide actionable policy recommendations and to enrich theoretical frameworks for advancing high-quality, sustainable regional development.
Accordingly, this study proposes the following hypotheses:
H1: 
The synergistic effect between urban ER and HQTD in the YREB is strengthening.
H2: 
The gap in coupling coordination among regions shows a narrowing trend, and the spatial spillover effect is increasing.

2. Literature Review

Against the backdrop of intertwined global economic fluctuations, public health crises, and climate risks, ER has been widely regarded as a core foundation for regional sustainable development. ER reflects a region’s ability to resist external shocks, recover quickly, and achieve adaptive transformation [7,8]. Urban ER is composed of three dynamically interactive components: foundational resilience and recovery capacity, adaptive and restructuring capabilities, and innovative transformation capacity, which collectively determine the strength of ER. Foundational resilience and recovery capacity reflects a city’s recovery speed and stability under external shocks, primarily shaped by industrial structure, resource allocation efficiency and environmental governance capacity. Adaptive and restructuring capabilities represent the urban economic system’s aptitude to optimize resource allocation and recalibrate developmental trajectories amid changing conditions, involving policy regulation, market mechanism and social participation. Innovative transformation capacity determines whether the city can transcend traditional growth paradigms to promote long-term sustainable development through technological progress and industrial upgrading [9,10]. Existing studies have pointed out that industrial structure adjustment, financial support, infrastructure improvement, and human capital accumulation are key factors in enhancing ER [11]. A higher level of ER can not only buffer external shocks but also provide a stable macro environment for subsequent industrial recovery [12,13].
On this basis, ER significantly affects the speed and quality of tourism recovery after a crisis. Tourism is one of the sectors most vulnerable to crises, but it shows strong recovery potential under the support of a resilient economic system. Its recovery depends on the fiscal capacity, industrial linkage, and policy flexibility of the overall economy [14,15]. Studies have shown that regions with stronger ER are more capable of recovering related industries such as transportation, accommodation, and cultural and creative industries, forming a pattern of multi-industry coordinated recovery, thereby shortening the duration of the crisis’s impact [16]. It can be seen that ER provides a key foundation for the tourism industry to achieve rapid recovery.
The recovery process further extends to the promotion of HQTD. Existing studies emphasize that HQTD is characterized by green transformation, digital empowerment, ecological protection, and social well-being [17,18]. With the support of ER, the recovering tourism industry can accelerate digital transformation, optimize industrial structure, and strengthen ecological coordination, thereby realizing the transformation from scale expansion to quality improvement [11,19]. At the same time, HQTD feeds back into ER by promoting industrial upgrading, boosting employment growth, and enhancing ecological sustainability, forming a virtuous cycle [20,21].
From an international perspective, this progressive mechanism is reflected in different types of tourist destinations. Research in Vietnam shows that spiritual tourism has significantly enhanced the ER of destinations by improving tourist satisfaction and integrating ESG practices, proving that even tourism forms centered on cultural experiences can build a resilience foundation through sustainable development practices [22]. The case of remote areas in northern Australia reveals the complex relationship between nature-based tourism and regional resilience from the perspective of community net benefits [23]. The study found that although tourism has brought employment and business opportunities, it has also caused environmental and social pressures. By optimizing the tourist structure, improving facilities, and strengthening local participation, the net social benefits can be significantly increased, and long-term resilience can be enhanced.
In the Chinese context, the YREB provides an important case for examining the above progressive relationship. As a national strategic region covering 11 provinces and accounting for over 40% of the country’s GDP, the YREB not only has a prominent economic status but also boasts rich tourism resources [24]. Studies have shown that due to benefiting from a stronger industrial foundation and innovation capabilities, cities in the eastern part of the YREB perform better in coordinating ER and HQTD, while the central and western regions are still constrained by structural rigidity and resource limitations [25]. Nevertheless, the overall coordination level of the YREB has steadily improved and regional gaps have gradually narrowed, demonstrating the practical significance of linking ER, post-crisis tourism recovery, and quality improvement in large-scale regional systems.
In summary, the literature underscores a sequential mechanism in which stronger ER creates the conditions for rapid post-crisis tourism recovery, and this recovery in turn fosters HQTD. This pathway not only deepens the understanding of the coupling relationship between ER and HQTD but also provides a valuable analytical lens for exploring sustainable regional development, particularly within the YREB.
This study focuses on the coupling and coordination relationship between urban ER and HQTD in the YREB. Its core innovations are reflected in four aspects: micro-scale research, methodological breakthroughs, theoretical framework integration, and precision in practical strategies. Firstly: For the first time, 108 prefecture-level cities in the YREB are taken as the basic research units and subdivided into eastern, central, and western regions. This approach breaks through the “homogeneity assumption” of traditional macro-analyses, accurately captures the heterogeneity of cities in terms of industrial structure, ecological constraints, and other aspects, reveals the “intra-regional differentiation phenomenon” masked by macro perspectives, and provides micro-data support for “precision policy implementation.” Secondly, an CI is constructed, integrating key variables to quantify the direction and intensity of the impacts of different factors on the coupling and coordination between ER and HQTD. This index not only evaluates “coordination levels” but also identifies “driving factors,” significantly enhancing the policy orientation of the research. Thirdly, the study deeply integrates global sustainable development goals with the practical experience of prefecture-level cities in the YREB, validates the applicability of international experiences in cities of different regional locations, and constructs a “global/national/prefecture-level city” multi-level theoretical framework. Finally, based on prefecture-level city data and results of spatio-temporal evolution analysis, “region-specific optimization strategies for eastern, central, and western regions” are proposed, breaking through the “one-size-fits-all” model and enhancing the operational feasibility of policies. In summary, through micro-scale analysis, methodological innovation, theoretical integration, and optimization of practical strategies, this study provides an innovative theoretical reference and practical path for high-quality sustainable development in the YREB and similar regions worldwide.

3. Overview of the Research Area and Data Sources

3.1. Overview of the Research Area

The YREB spans a vast area in eastern and central China, extending along the Yangtze River Basin from Shanghai to Yunnan, and covers 11 provinces and municipalities in China, with rich cultural and tourism resources and a rapidly growing tourism market. YREB represents a crucial economic corridor. It traverses 11 provinces (municipalities) across the three regions of the East, Middle, and West of China, using the Yangtze River, a golden waterway, as its connecting element (Figure 1). According to the regional division in the Outline of Strategic Plan for the Development of the YREB, the eastern region encompasses Shanghai, Zhejiang, and Jiangsu. The central region comprises Anhui, Jiangxi, Hubei, and Hunan. Meanwhile, the western region includes Chongqing, Sichuan, Yunnan, and Guizhou. The YREB boasts an abundance of high-quality cultural and tourism resources. It stands as one of the regions with the most robust comprehensive strength and the greatest strategic significance in bolstering China’s tourism industry [26].
Prominent core economic hub cities like Shanghai, Wuhan, and Chongqing are part of the YREB, which has a diverse economic structure with high-end service and advanced manufacturing sectors alongside growing industries, generating a robust ER to hazards. By bolstering the preservation and development of ecological resources including nature reserves and world heritage, the region is committed to green development, actively promoting a low-carbon economy and sustainable tourism, and achieving synergistic economic and environmental development. Nonetheless, there are still noticeable variations in the basin’s development environment, operational effectiveness, and resource allocation. The tourism and cultural industries currently play a major role in the region’s growth as a key strategic area for fostering excellent economic and social development. Natural reserves, picturesque locations, and world heritage sites abound in the area, including the national protected areas of Jiuzhaigou, Wuyishan Mountain, and Huangshan Mountain. These resources serve as a vital foundation for the ecotourism sector’s explosive expansion. With 126 5A-grade beautiful locations as of 2023, the YREB boasts one of the largest concentrations of A-grade scenic spots in China, attracting a significant number of both domestic and foreign tourists. The 11 provinces and cities that comprise the YREB have made some progress in recent years by persistent cooperation in the development of tourism resources, industrial transformation, and upgrading. Nonetheless, there are significant disparities in the level of tourism development among regions, and obstacles to cross-regional cooperation persist. In 2023, the YREB welcomed 8.118 billion visitors, generating approximately 10.63 trillion yuan in tourism revenue—a sizeable amount of the nation’s total tourism earnings. The applicable plan states that the YREB will improve resource integration across different regions, promote balanced growth between urban and rural areas, and provide a support system and strategic framework for the high-quality development of tourism. The project will also strive for reciprocal advancement and smooth cooperation between the local economy and the cultural and tourism sectors [27].

3.2. Data Sources

The socioeconomic data used in this study came from the 2010–2023 China Urban Statistical Yearbook, China Regional Economic Statistical Yearbook, statistical yearbooks, and national economic and social development statistical bulletins from 108 prefecture-level cities spread across 11 provincial-level regions of the YREB. Part of the tourism-related data is sourced from the annual reports of prefecture-level municipal bureaus of culture and tourism, the National Tourism Supervision and Service Platform of the Ministry of Culture and Tourism, and data from third-party tourism platforms. Evaluation indicator data is obtained from third-party data institutions. Some of the environment-related data comes from the annual reports (ambient air quality bulletins) of prefecture-level municipal bureaus of ecology and environment. Satisfaction scores are derived from the statistics of questionnaire survey data (e.g., annual tourism satisfaction survey reports). Missing data in the above sources is supplemented using the linear interpolation method. The linear interpolation method was used to fill in the gaps for some of the missing data. Following data collection, ArcGIS 10.8 created a geographic database for integration and standardized the spatial projection coordinate system for every theme map.

4. Research Framework and Methodology

4.1. The Coupling and Coordination Mechanism Between ER and HQTD

The tourism industry’s development and resilience are mutually reinforcing and closely intertwined. On one hand, they forge innovative pathways for the tourism sector, unlocking latent value-added potential and driving the industry toward high-quality advancement; on the other hand, they continuously enrich the economic and cultural depth of tourism, effectively catalyzing the enhancement of regional tourism resilience. ER provides a risk-resistant foundation and transformation impetus for the tourism industry, while HQTD reversely enhances the stability and innovative vitality of the economic system through consumption upgrading and industrial optimization. Together, they form the key core and pillar supporting regional sustainable development [16].
Under this framework, the coupling mechanism between ER and HQTD can be understood at three interrelated levels: foundational support, dynamic interaction, and cyclical reinforcement. First, ER provides the fundamental conditions for tourism development. Greater industrial diversification, fiscal and financial stability, and robust infrastructure enable regions to maintain consumption capacity and social stability under external shocks, thereby creating favorable conditions for the recovery and transformation of the tourism sector. At the same time, HQTD contributes back to ER by promoting industrial upgrading, expanding employment and consumption, and advancing green development and digital empowerment, thus enhancing the adaptability and innovation capacity of regional economies. Second, under the dynamic context of crises, ER operates through a three-stage process of “resistance–recovery–adaptation”. In the initial stage, economic stability ensures basic social functioning; in the recovery stage, fiscal policies and industrial linkages support the rapid rebound of tourism; and in the adaptation stage, tourism advances through digitalization, cultural and creative integration, and ecological protection, thereby achieving quality improvement [28,29]. Finally, the relationship between ER and HQTD is not only bidirectional but also exhibits a reinforcing cycle: stronger ER facilitates faster tourism recovery, the recovery process drives HQTD, and HQTD in turn strengthens ER through structural optimization and ecological sustainability [30]. This results in a virtuous cycle of “resilience enhancement–tourism recovery–quality improvement–further resilience enhancement”. Such a mechanism reveals the intrinsic logic of the coordinated evolution of the economy and tourism in the YREB and provides a theoretical foundation for formulating differentiated policies aimed at sustainable regional development.

4.2. Measurement Indicators for the Coupling Coordination Between ER and HQTD

Based on the dynamic nature of ER, this study deconstructs the concept into three progressive and organically integrated dimensions: “resistance and recovery capacity, adaptive and restructuring capacities, and innovative transformation capacity” [31]. First, the foundational capability of an economic system lies in its resistance and recovery capacity, which together ensure stability and a return to equilibrium following external shocks. Five indicators—including the registered urban unemployment rate and regional GDP per capita—are selected to directly reflect the economy’s stability and rebound capacity after disturbances [32]. Second, adaptive and restructuring capacities captures the system’s ability to reallocate internal resources in response to medium- and long-term challenges. This dimension is measured through five indicators such as fiscal self-sufficiency rate and total retail sales of consumer goods, reflecting the economy’s capacity to absorb shocks, maintain functioning, and reach new equilibria. Finally, innovative transformation capacity represents the system’s advanced capability to achieve structural upgrading and transformative growth. It is evaluated through four indicators—including the number of patent applications, internet penetration rate, and industrial structure upgrading index—to capture the system’s potential for breaking path dependency and fostering new growth engines through innovation [33]. This framework not only reflects the three temporal stages of ER but also comprehensively reveals its multidimensional architecture and intrinsic dynamics across the aspects of static stability, dynamic adaptation, and forward-looking innovation.
In parallel, the construction of the HQTD measurement system in this study moves beyond conventional paradigms that prioritize scale and speed. By incorporating and deeply integrating the five new development concepts—”innovation, coordination, green development, openness, and sharing”—this study establishes a multidimensional, structured, and contemporary evaluation framework. This approach translates macro-level development principles into five quantifiable and operational criterion layers, enabling an empirical deconstruction of the essence of HQTD [34]. While retaining key economic output indicators (e.g., total tourism revenue), greater emphasis is placed on evaluating development drivers (e.g., number of patents granted, activity level of digital platforms), sustainability (e.g., ecological quality indices, spatial agglomeration efficiency), inclusiveness (e.g., urban–rural income disparity, resident satisfaction), and internal–external connectivity (e.g., degree of openness). This shift reflects an evolution in developmental focus from purely quantitative expansion toward qualitative improvement [35]. The introduction of pioneering indicators—such as “online booking coverage rate for 4A-level and above scenic spots,” “activity level of tourism digital platforms,” and “tourism industry spatial agglomeration index”—accurately captures the transformative impacts of digitalization, smart technologies, and industrial convergence on HQTD [36]. Thus, the constructed indicator system is both contemporarily relevant and forward-looking. It not only enables a scientific assessment of the overall level of tourism development but also facilitates a precise diagnosis of its strengths and weaknesses, offering an advanced analytical tool for understanding and promoting high-quality tourism [37]. Details of the indicator construction are shown in Table 1 and Table 2, with the data covering the time span from 2010 to 2023.

4.3. Research Methodology

4.3.1. Comprehensive Evaluation Model

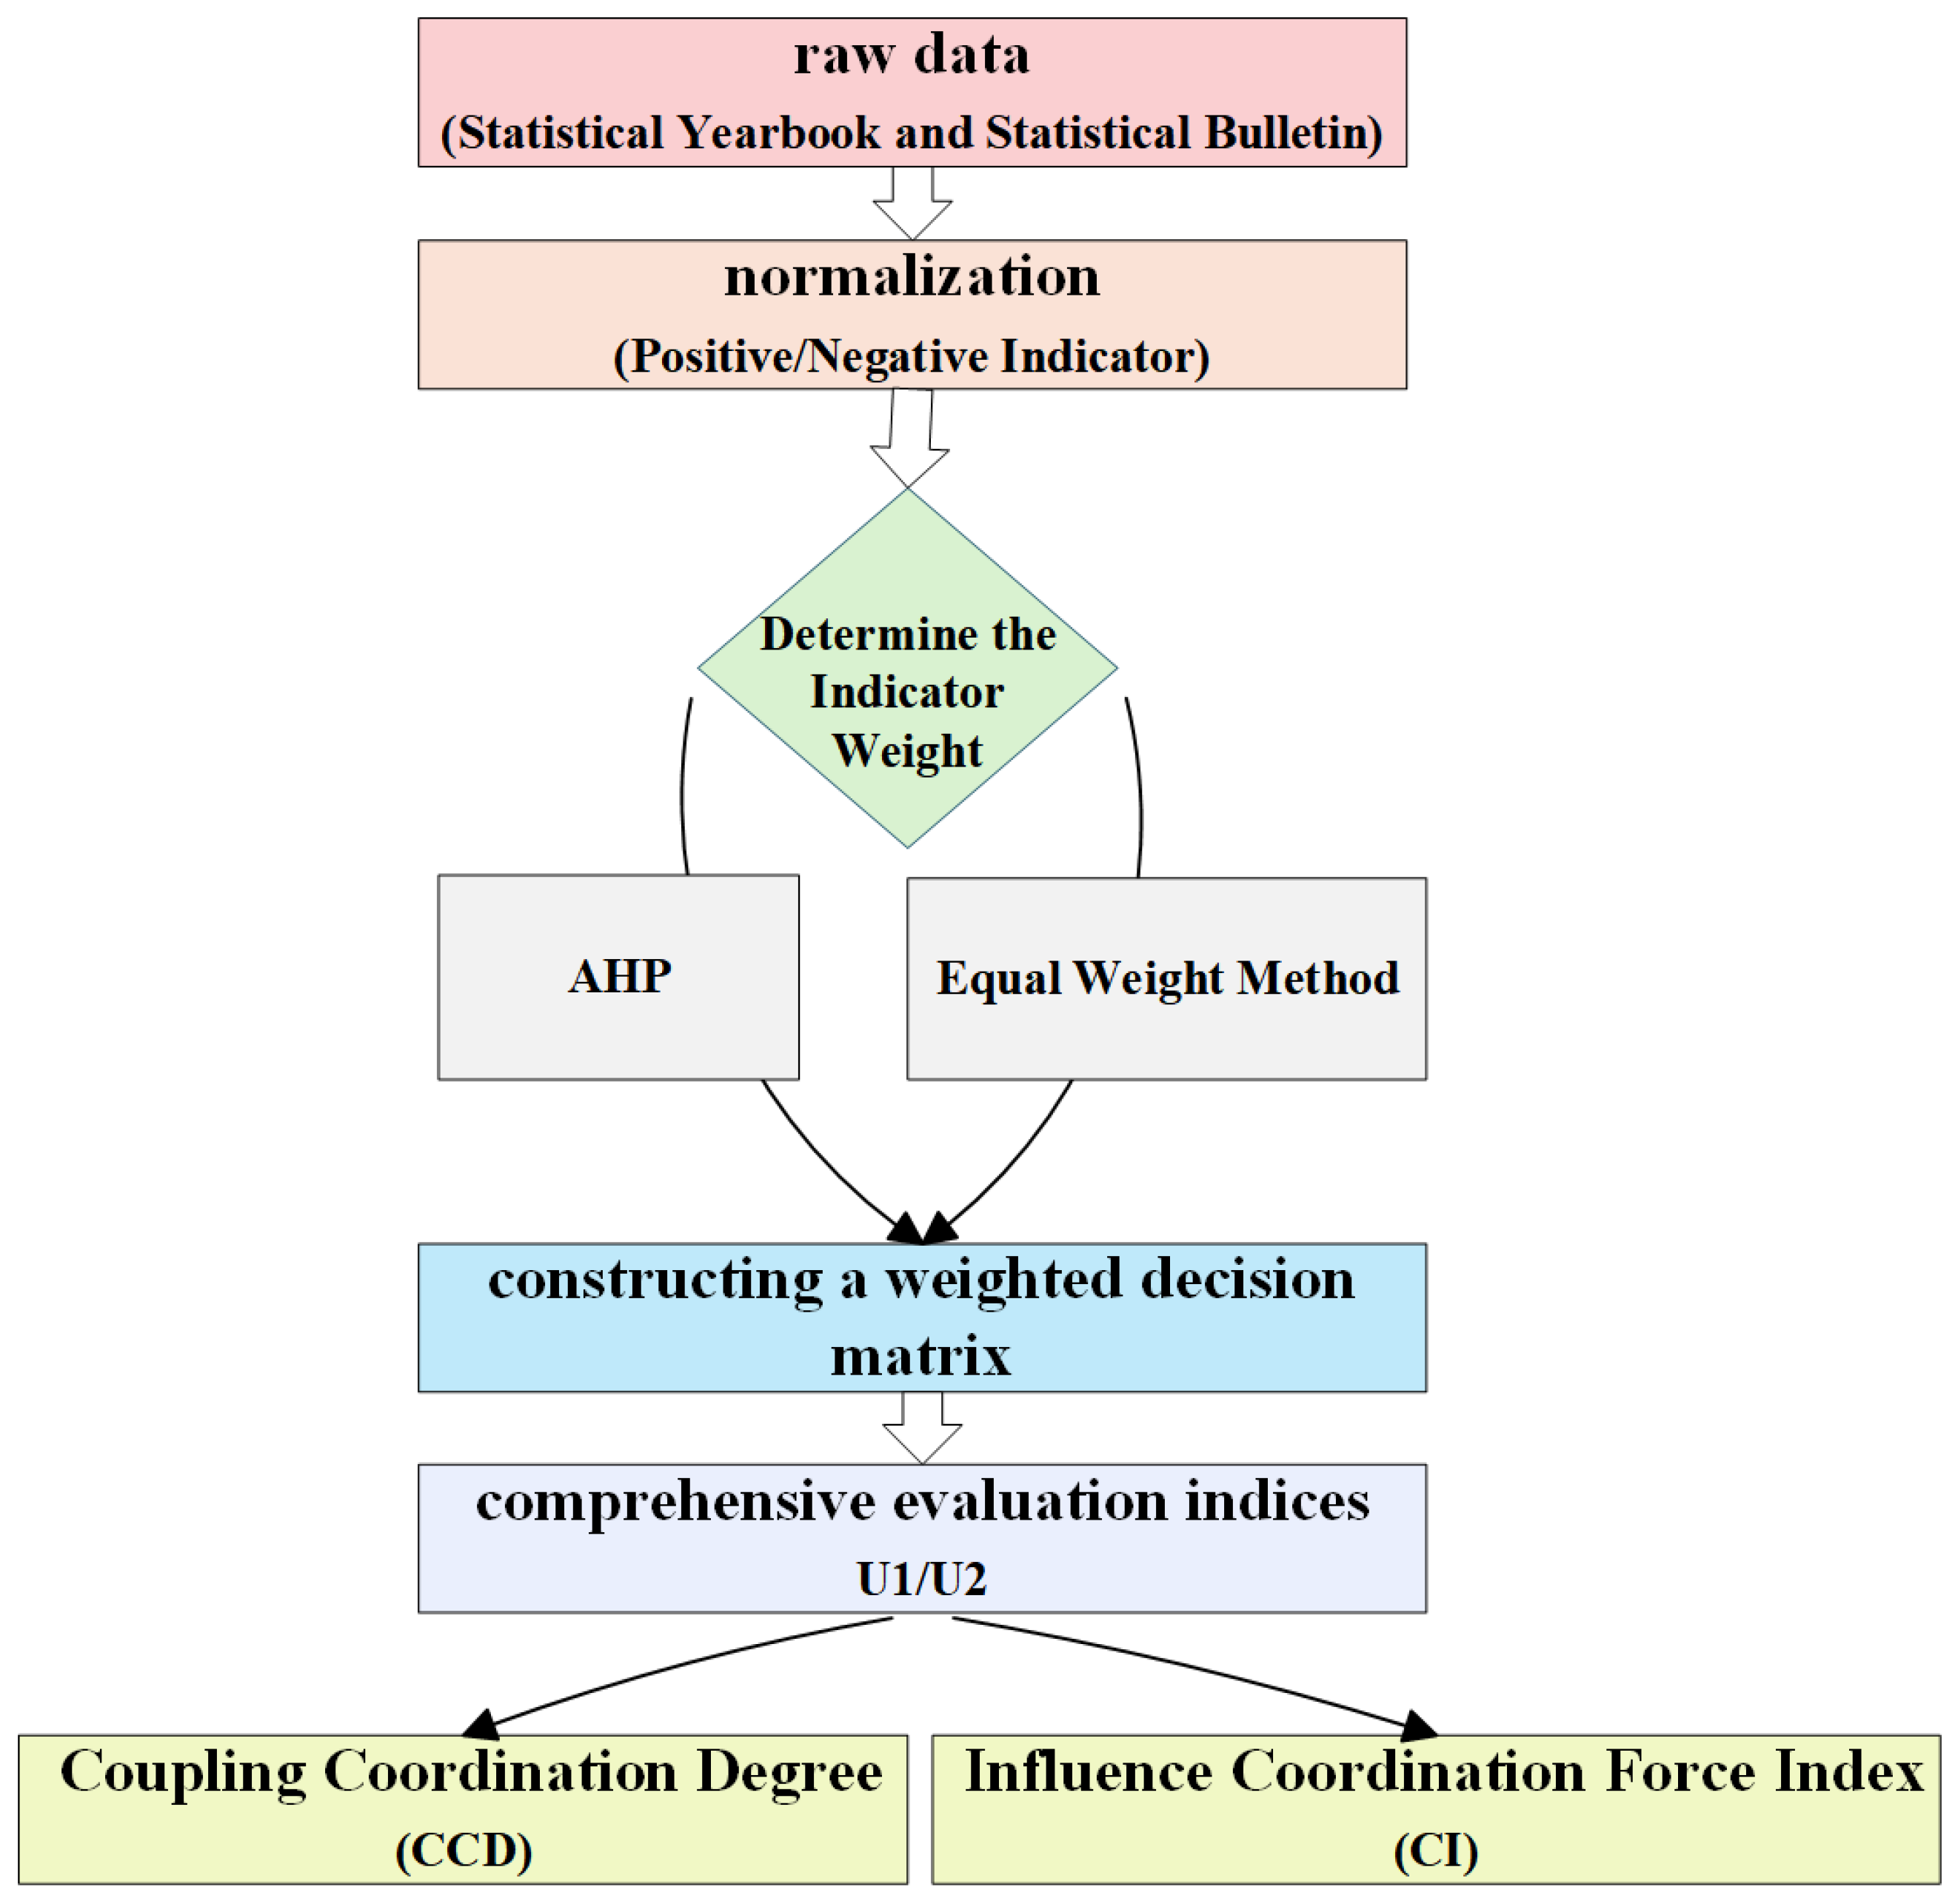
To eliminate the influences of different measurement units and dimensions across indicators, the following procedure was adopted. First, each indicator was standardized according to whether it was positive or negative in direction. Subsequently, the weights of the indicators were determined using the Analytic Hierarchy Process (AHP), implemented via the yaahp 10.0 AHP software. Finally, by constructing a weighted decision matrix and calculating the Euclidean distance, comprehensive evaluation indices ( C i ) for both ER and HQTD were derived [38].
z i j = x i j min ( x j ) max ( x j ) min ( x j )   ( p o s i t i v e   i n d i c a t o r )
z i j = max ( x j ) x i j max ( x j ) min ( x j )   ( n e g a t i v e   i n d i c a t o r )
C i = j = 1 n w j z i j m i n i w j z i j 2 j = 1 n w j z i j m i n i w j z i j 2 j = 1 n w j z i j m a x i w j z i j 2
xij refers to the original indicator values, z i j is the value of the indicator after standardisation and w j is the weight of the jth indicator calculated by entropy weighting method. Sensitivity analysis was also conducted to compare the resulting differences between the AHP and equal weighting method, and it was found that the core conclusions remained consistent.
The equal weighting method assumes that all indicators under each dimension are of equal importance and thus assigns the same weight. Specifically, each of the 3 dimensions of ER accounts for 1/3 of the weight, and each of the 5 dimensions of HQTD accounts for 1/5 of the weight. The formula for the composite score is as follows
S = k = 1 m ( 1 n k i = 1 n k z i k ) 1 m
Herein, S represents the comprehensive score of the system, m denotes the number of dimensions, nk is the number of indicators in the k-th dimension, and zik stands for the standardized value of the i-th indicator in the k-th dimension.
This study adopted the AHP, as it more effectively captures the theoretical priorities inherent in the new development philosophy. To mitigate subjectivity, 15 experts were invited to participate in two rounds of independent back-to-back scoring. The resulting matrices all passed the consistency check (CR < 0.1). The selection of 15 experts participating in the AHP scoring followed four criteria: professional relevance, rich experience, regional balance, and methodological competence. Their professional backgrounds covered three core fields—regional ER, HQTD, and quantitative research methods—with inclusion of interdisciplinary areas such as environmental science and digital economy. All experts had over 5 years of relevant research experience, having led or participated in national/provincial-level projects (e.g., the National Social Science Fund project on “Economic Resilience Assessment”), and some possessed on-site research or policy consulting experience in the YREB. Geographically, they spanned the eastern, central, and western regions of the YREB to reflect the developmental characteristics of different sub-regions. Additionally, they were familiar with the AHP and the modeling logic of coupling coordination mechanisms. The sample composition was dominated by experts from universities and research institutions (12 persons, accounting for 80%), including scholars in regional economics, tourism management, and spatial analysis. Three experts from government departments and industry associations (accounting for 20%) were also invited, forming a diverse expert structure integrating “academic theory + practical experience” to ensure the scientific validity and policy relevance of indicator weights.

4.3.2. Collinearity Test

To ensure the independence and robustness of the indicator system in the comprehensive evaluation model, after constructing the evaluation indicator systems for ER and HQTD, this study adopted the variance inflation factor (VIF) method for collinearity testing. This is to avoid the interference of high correlation between indicators on weight allocation and subsequent coupling coordination analysis. VIF measures the degree to which a given independent variable can be linearly explained by other independent variables, with the calculation formula as follows [39].
V I F i = 1 1 R i 2
R i 2 is the coefficient of determination of the regression model for the i-th indicator against all other indicators. A larger V I F i indicates a stronger collinearity between the indicator and others. Specifically, if VIF < 5, there is no significant collinearity; if 5 ≤ VIF < 10, there is moderate collinearity; and if VIF ≥ 10, there is severe collinearity.
For indicators with VIF ≥ 10, this study optimized them by means of stepwise elimination or factor analysis for dimensionality reduction. Priority was given to eliminating indicators with lower explanatory contributions to their dimensions (e.g., through AHP weight ranking). For highly correlated indicators, they were merged into a composite indicator.
After constructing the indicator systems for ER and HQTD, VIF tests were conducted separately for ER and HQTD indicators. The results showed that all indicators had a VIF value of less than 5, indicating no significant collinearity between indicators, which can be used for subsequent comprehensive evaluation and coupling coordination analysis.

4.3.3. Coupling Coordination Model

The degree of connection and influence between several systems during their evolution is measured by coupling degree. The degree of coordination between systems and their constituent parts is measured by the coordination degree [40]. The relationship between urban ER and HQTD is measured in the study using the coupling degree of the coordination model. The process is shown in Figure 2. The following is the calculating formula (Figure 3):
C = 2 × U 1 × U 2 U 1 + U 2
T = a U 1 + b U 2
D = C × T
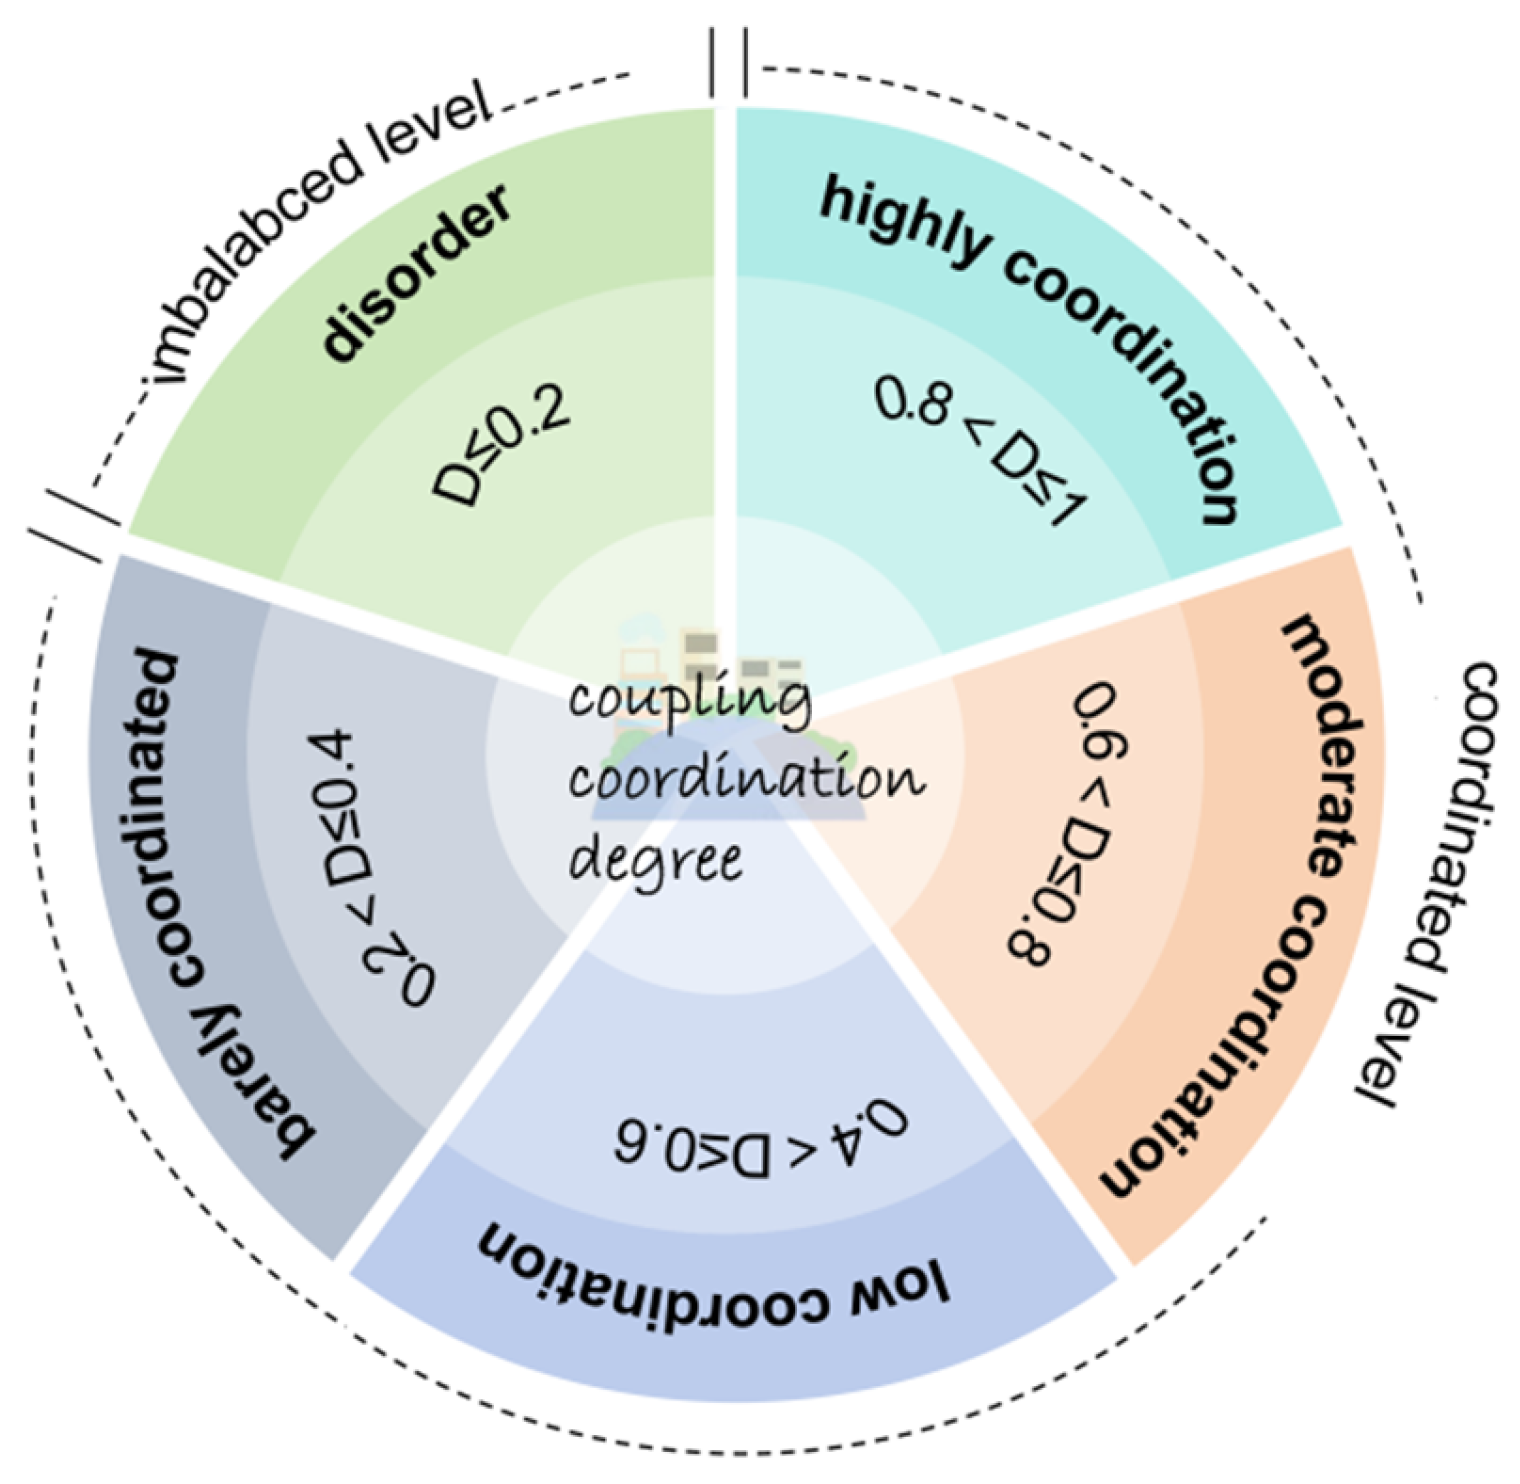
In this model, “U1” and “U2” represent the combined level of ER and HQTD, the comprehensive evaluation index calculated in Formula (3), respectively, while “C” denotes the degree of coupling between the two, that is, the strength of their interactions. “T” serves as a comprehensive development index, which measures the contribution of the overall level of development of the two systems to the degree of harmonization. “D” stands for the degree of coupling coordination, which quantifies the strength of the synergistic relationship between the systems of ER and HQTD. The influence of HQTD and ER on the total degree of coordination is represented by the coefficients “a” and “b” in this model, respectively. Weights a and b are used to quantify the relative importance of ER and HQTD in the “economy-tourism synergy system”. Considering the dominant role played by the ER system in the overall development, the study makes specific assignments to “a” and “b”, which are 0.6 and 0.4, accordingly. Such assignments demonstrate how ER has a bigger influence on the linked degree of coordination, whereas the HQTD, this indicates that ER serves as the fundamental support for coordinated development, underscoring its role in guaranteeing HQTD, although also important, has a relatively smaller impact. Through this weight allocation, the model can more accurately capture the roles and contributions of the two systems in the synergistic development, and then provide more targeted references for decision-making [41]. The classification of coupling coordination degree levels is as shown in Figure 4.

4.3.4. Gini Coefficient

The Dagum Gini coefficient, an important tool for measuring regional economic disparity, accurately analyzes the imbalance in economic development across various regions and successfully handles the problem of cross-over between samples by dissecting the overall Gini coefficient into three essential components: intra-regional disparity, inter-regional disparity, and contribution of cross terms [42]. This study reveals the geographical variability of the linked coordination degree of HQTD and ER in the YREB using the Dagum Gini coefficient and thoroughly examines the many origins of this variability and its contribution. The following is the calculating formula:
G = j = 1 k h = 1 k i = 1 n j r = 1 n h y i j y h r 2 n 2 y ¯
G is the overall Gini coefficient, “n” is the number of study regions, “k” is the number of regional divisions, “ y ¯ ” is the average value of the indicator measured for all prefecture-level cities in the region, and y i j , y h r are the number of measurement objects in regions j and h, respectively; n j , n h are the number of measurement objects in regions j, h.

4.3.5. Kernel Density Estimation

Kernel density estimation is a non-parametric estimation method that looks at the abnormalities of spatial distributions and their temporal trends. The method primarily uses continuous density curves, a model with strong robustness but weak dependency, to illustrate the distributional properties of random variables [43]. In the paper, we provide a detailed examination of the spatio-temporal development of the coupled coordination degree between ER and HQTD within the YREB using kernel density estimation. The kernel density estimation at a certain place is expressed as follows with reference to a particular dataset:
f x = 1 n h + i = 1 n K x x i h
“n” is the number of samples, refer to the “ER-HQTD coupling coordination level” value of each prefecture-level city in each year; the bandwidth, often called the window width, is the parameter “h” with the condition h > 0; the kernel function, represented by the letter “k”, conforms to + K ( u ) d u = 1 and K(u) ≥ 0.

4.3.6. Global Spatial Autocorrelation

Spatial autocorrelation analysis is a method used to explore the spatial agglomeration characteristics of things. The Global Moran’s I is generally employed to evaluate the overall spatial correlation of research objects and their significance levels [44]. The calculation formula is as follows:
I = n ( i = 1 n j = 1 n w i j ( x i x ¯ ) ( x j x ¯ ) ) ( i = 1 n ( x i x ¯ ) 2 ) ( i = 1 n j = 1 n w i j )
n refers to the number of observations (e.g., the number of cities); x i and x j refer to the i-th and j-th observations; x ¯ refers to the average value of all observations; w i j refers to the spatial weight, stand for the spatial relationship between the i-th and j-th observations.

4.3.7. Influence Coordination Force Index

A quantitative indicator used to assess the degree of coordinating ability of a system, a regional organization, or a specific subject under the combined effects of several contributing elements is commonly referred to as the influence coordination force index (CI). This study constructed an CI to diagnose the strength and direction of the correlation between each dimension of ER and the overall coordination status of the “ER-HQTD” system. It also quantitatively evaluated the intensity and direction of the role of each ER dimension in the YREB on the coordinated relationship between HQTD and ER itself.
C I x = W x ( D x D y )
C I x is the degree to which subsystem x contributes to the coordination of the entire system; the higher its value, the stronger the driving effect, and vice versa;   D x is the degree to which the HQTD and ER subsystems are coupled, and it is calculated using Formulas (6)–(8); D y is the degree between the two subsystems, it is calculated using Formulas (6)–(8); and W x is the weight coefficients of resistance and recovery capability, adaptive and restructuring capability, and innovative transformation capacity.
When C I x > 0, it indicates that the coordination level between dimension x and tourism development is higher than that of the overall system. Therefore, this dimension shows a positive correlation with a higher overall coupling coordination degree and can be regarded as a promoting dimension for the coordinated development of the system. The larger its value, the stronger the positive correlation between this dimension and the ideal coordination state.
When C I x < 0, it indicates that the coordination level between dimension x and tourism development is lower than that of the overall system. Thus, this dimension presents a negative correlation with a lower overall coupling coordination degree, marking it as a blocking dimension or a key shortcoming in the coordinated development of the system. The larger its absolute value, the stronger the negative correlation of this dimension with the coordination state.

5. Analysis of Results

5.1. Characteristics of ER Development

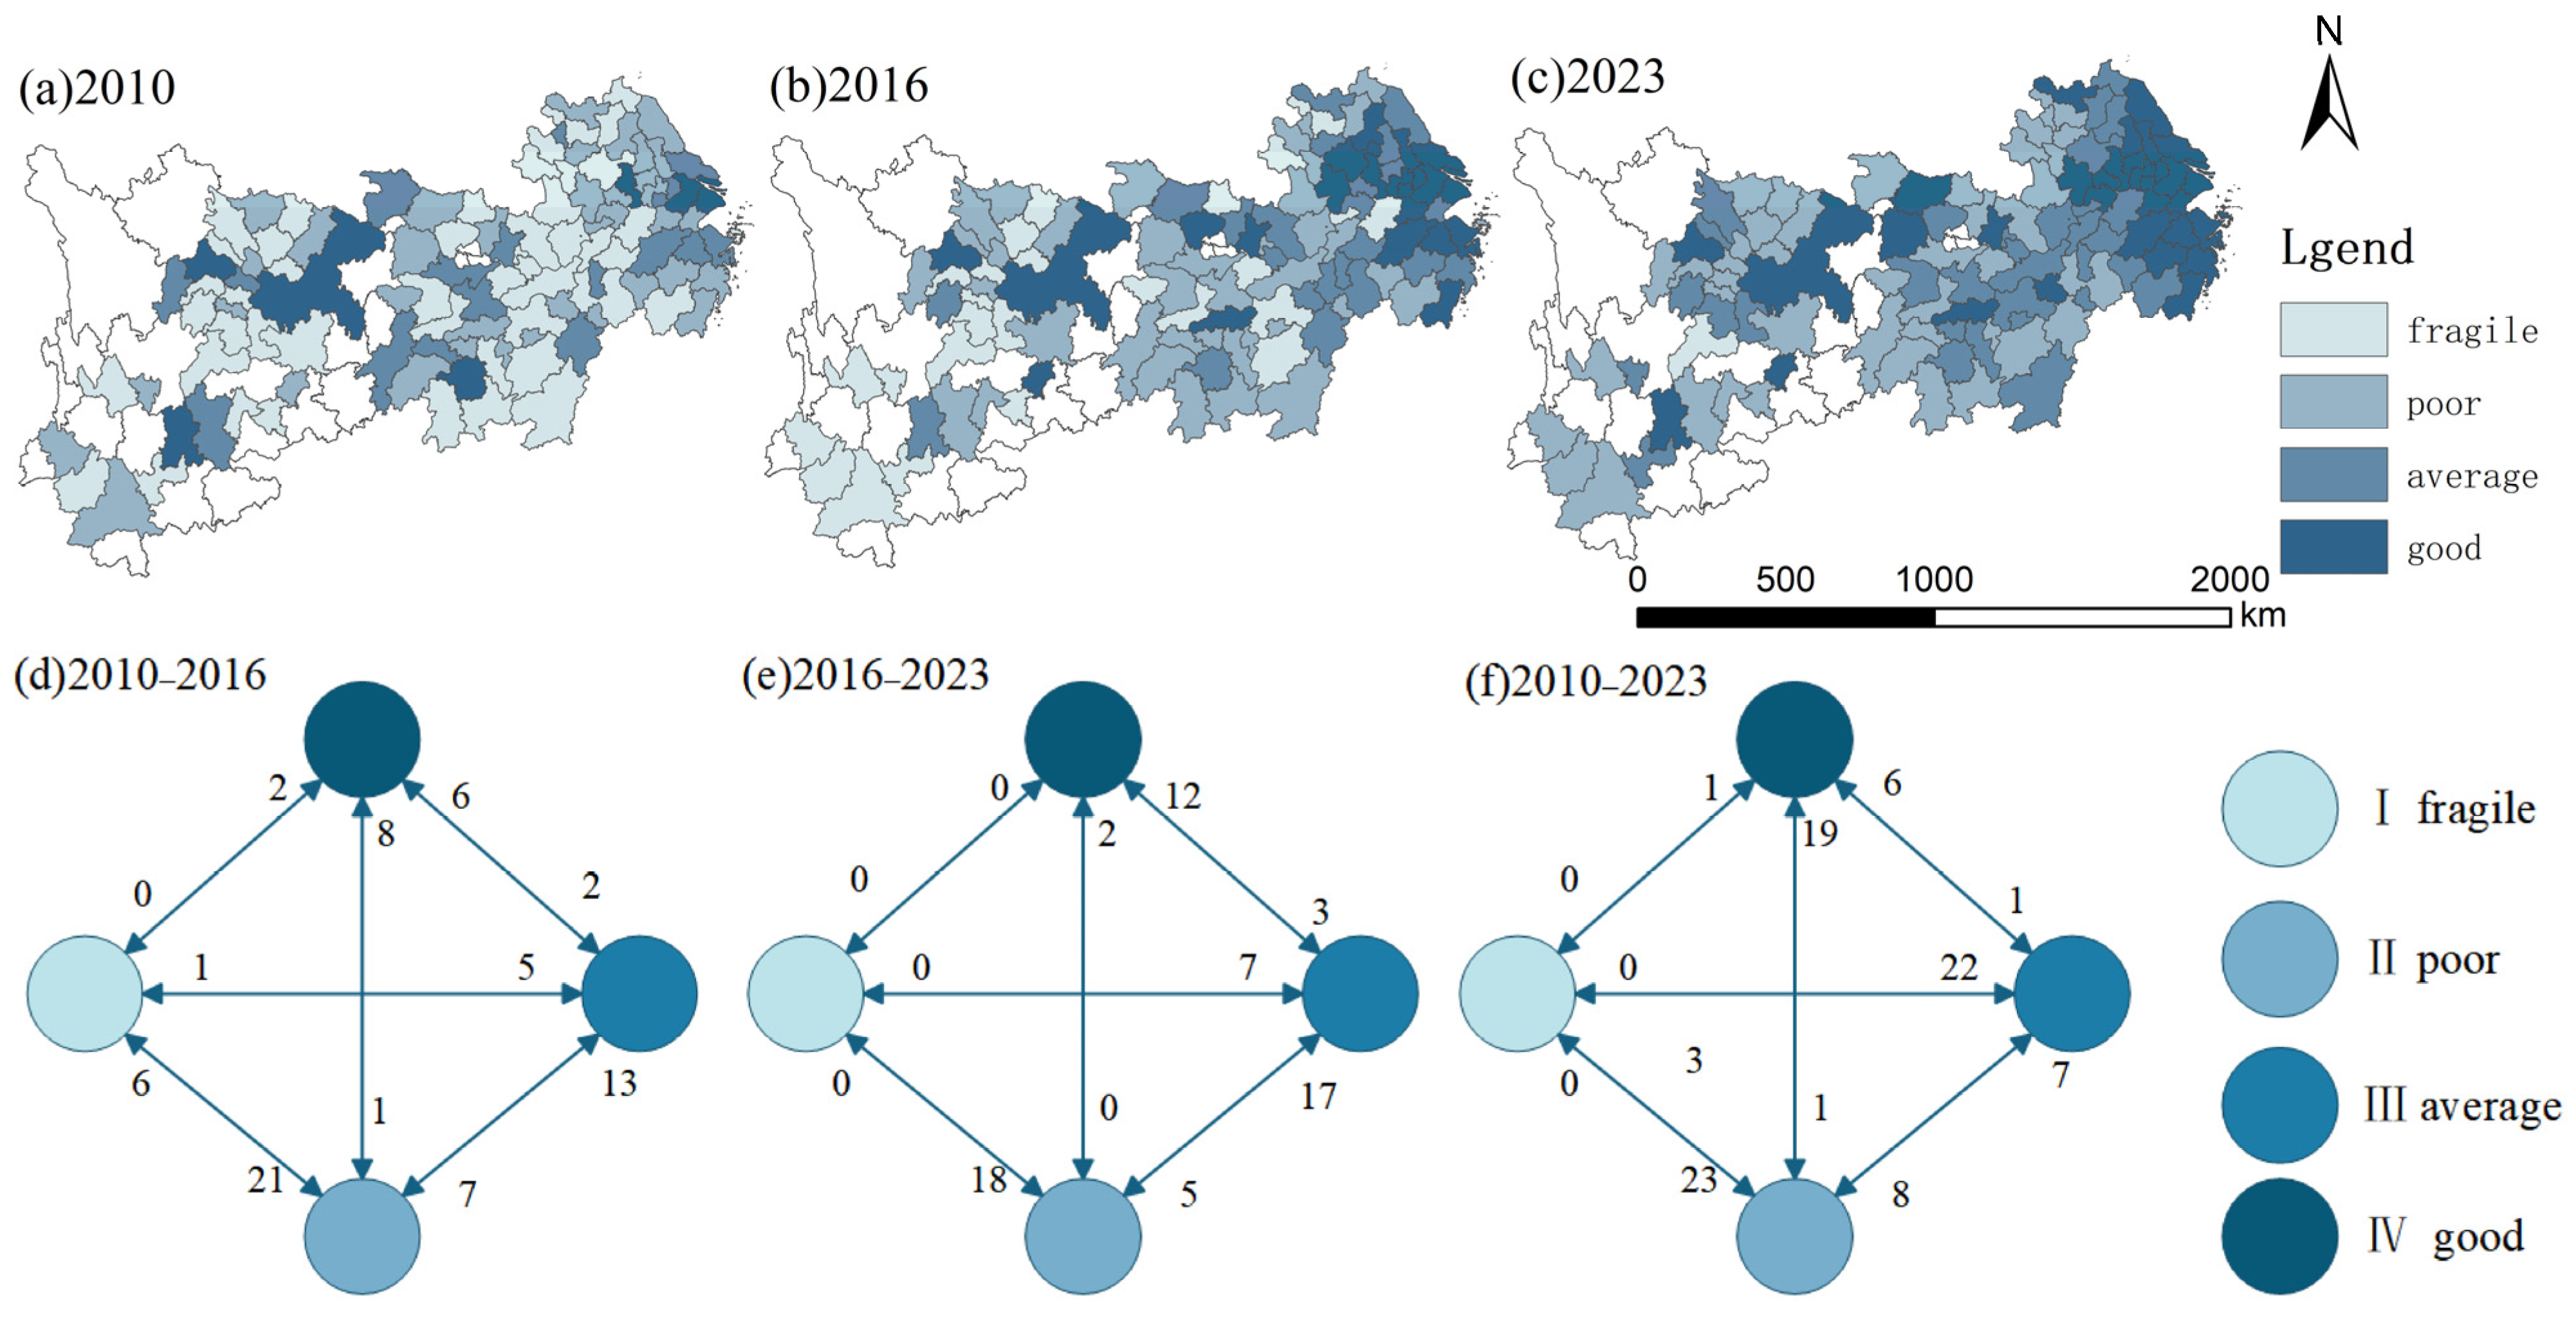
The YREB’s ER development index has been evaluated using Formula (1). Since the ER indicators exhibit a non-normal distribution among the 108 prefecture-level cities in the YREB, continuous indices can hardly intuitively reflect the spatial patterns of “high-value agglomeration” and “low-value locking”. Therefore, this study adopts the “natural breaks method” to maximize differences between categories while minimizing differences within categories. Four levels are divided based on the global data distribution to ensure consistent cross-year classification standards, which divides the ER system into four levels: I, II, III, and IV. Development statuses characterized as “fragile,” “poor”, ”general”, and “good” are reflected in this classification (Figure 5).
An analysis of the spatial pattern evolution reveals the following dynamics. In the initial stage (2010), the spatial coverage of Grade III and IV (denoting “Moderate” and “Strong” resilience, respectively) was limited, with highly resilient cities concentrated primarily in traditional economic powerhouses such as Shanghai, Nanjing, and Wuhan. In contrast, Grade I and II cities (“Fragile” and “Weak”) were widely distributed across the eastern and central regions, indicating a high proportion of cities with relatively low ER.
As development progressed, the spatial extent of Grade III and IV categories expanded significantly, while the proportion of Grade I and II cities contracted. This trend confirms the spatial diffusion of higher resilience and illustrates an overall upward trajectory in ER across the YREB. An examination of grade transition characteristics (Figure 5d–f) shows consistent and frequent cross-grade upgrades from lower (I, II) to higher (III, IV) levels, underscoring a dynamic process of urban ER enhancement within the basin. The spatial concentration of some of these transitions suggests that a cohort of cities achieved rapid resilience improvement and grade leapfrogging through pathways such as efficiency gains and structural optimization during economic development, thereby injecting vitality into regional coordinated development.

5.2. HQTD Characteristics

The YREB’s HQTD index has been calculated using Formula (1), which divides the tourism quality system into four levels: I, II, III, and IV. The natural break point approach is used in this classification, which designates the system’s development status as “fragile,” “poor,” “average,” and “good,” accordingly (Figure 6).
The spatial pattern of HQTD exhibited significant temporal variations. In 2010, the overall development level was relatively low, with Grades I and II predominating. Grades III and IV were sporadically distributed only in areas with a solid economic foundation, early-stage tourism development, or key transportation hubs, forming a pattern characterized by “extensive low-level coverage with isolated high-level points”. Over time, by 2016, Grade IV areas began to expand, extending into regions demonstrating economic-tourism synergistic development. By 2023, Grade IV areas had become deeply concentrated in core zones such as the Yangtze River Delta and the Chengdu–Chongqing economic circle—regions exemplifying strong economies, superior resources, and refined services. Meanwhile, Grade III areas filled the urban spaces of “development-ascending” cities, revealing a spatial evolutionary trend marked by consolidation and upgrading in core areas and gradual improvement in transitional zones. Despite persistent lag in certain localities, the region as a whole has achieved “a significant expansion in spatial scope and a systematic improvement in development level”.
The grade transition matrices (Figure 5f and Figure 6d) reveal a consistent pathway of “low-to-high” progression. Cross-period analysis (2010–2023) shows 57 instances of transitions from Grade II to Grade IV, highlighting the crucial role of pathways such as resource integration and service quality enhancement in driving development quality. Although the volume of transitions fluctuated across periods—for instance, Grade I to II transitions decreased from 17 (2010–2016) to 2 (2016–2023)—the stepped progression pattern (“I→II”, “II→III”, “III→IV”) remained clear, evidencing the dynamic optimization process of the HQTD system. Lower-grade units achieved advancement by addressing development shortcomings, while higher-grade units consolidated their advantages through synergistic development, collectively propelling an upward spiral in overall development quality.

5.3. Characteristics of the Spatio-Temporal Evolution Analysis of the CCD of ER and HQTD in the YREB

5.3.1. Description of the Progression over Time

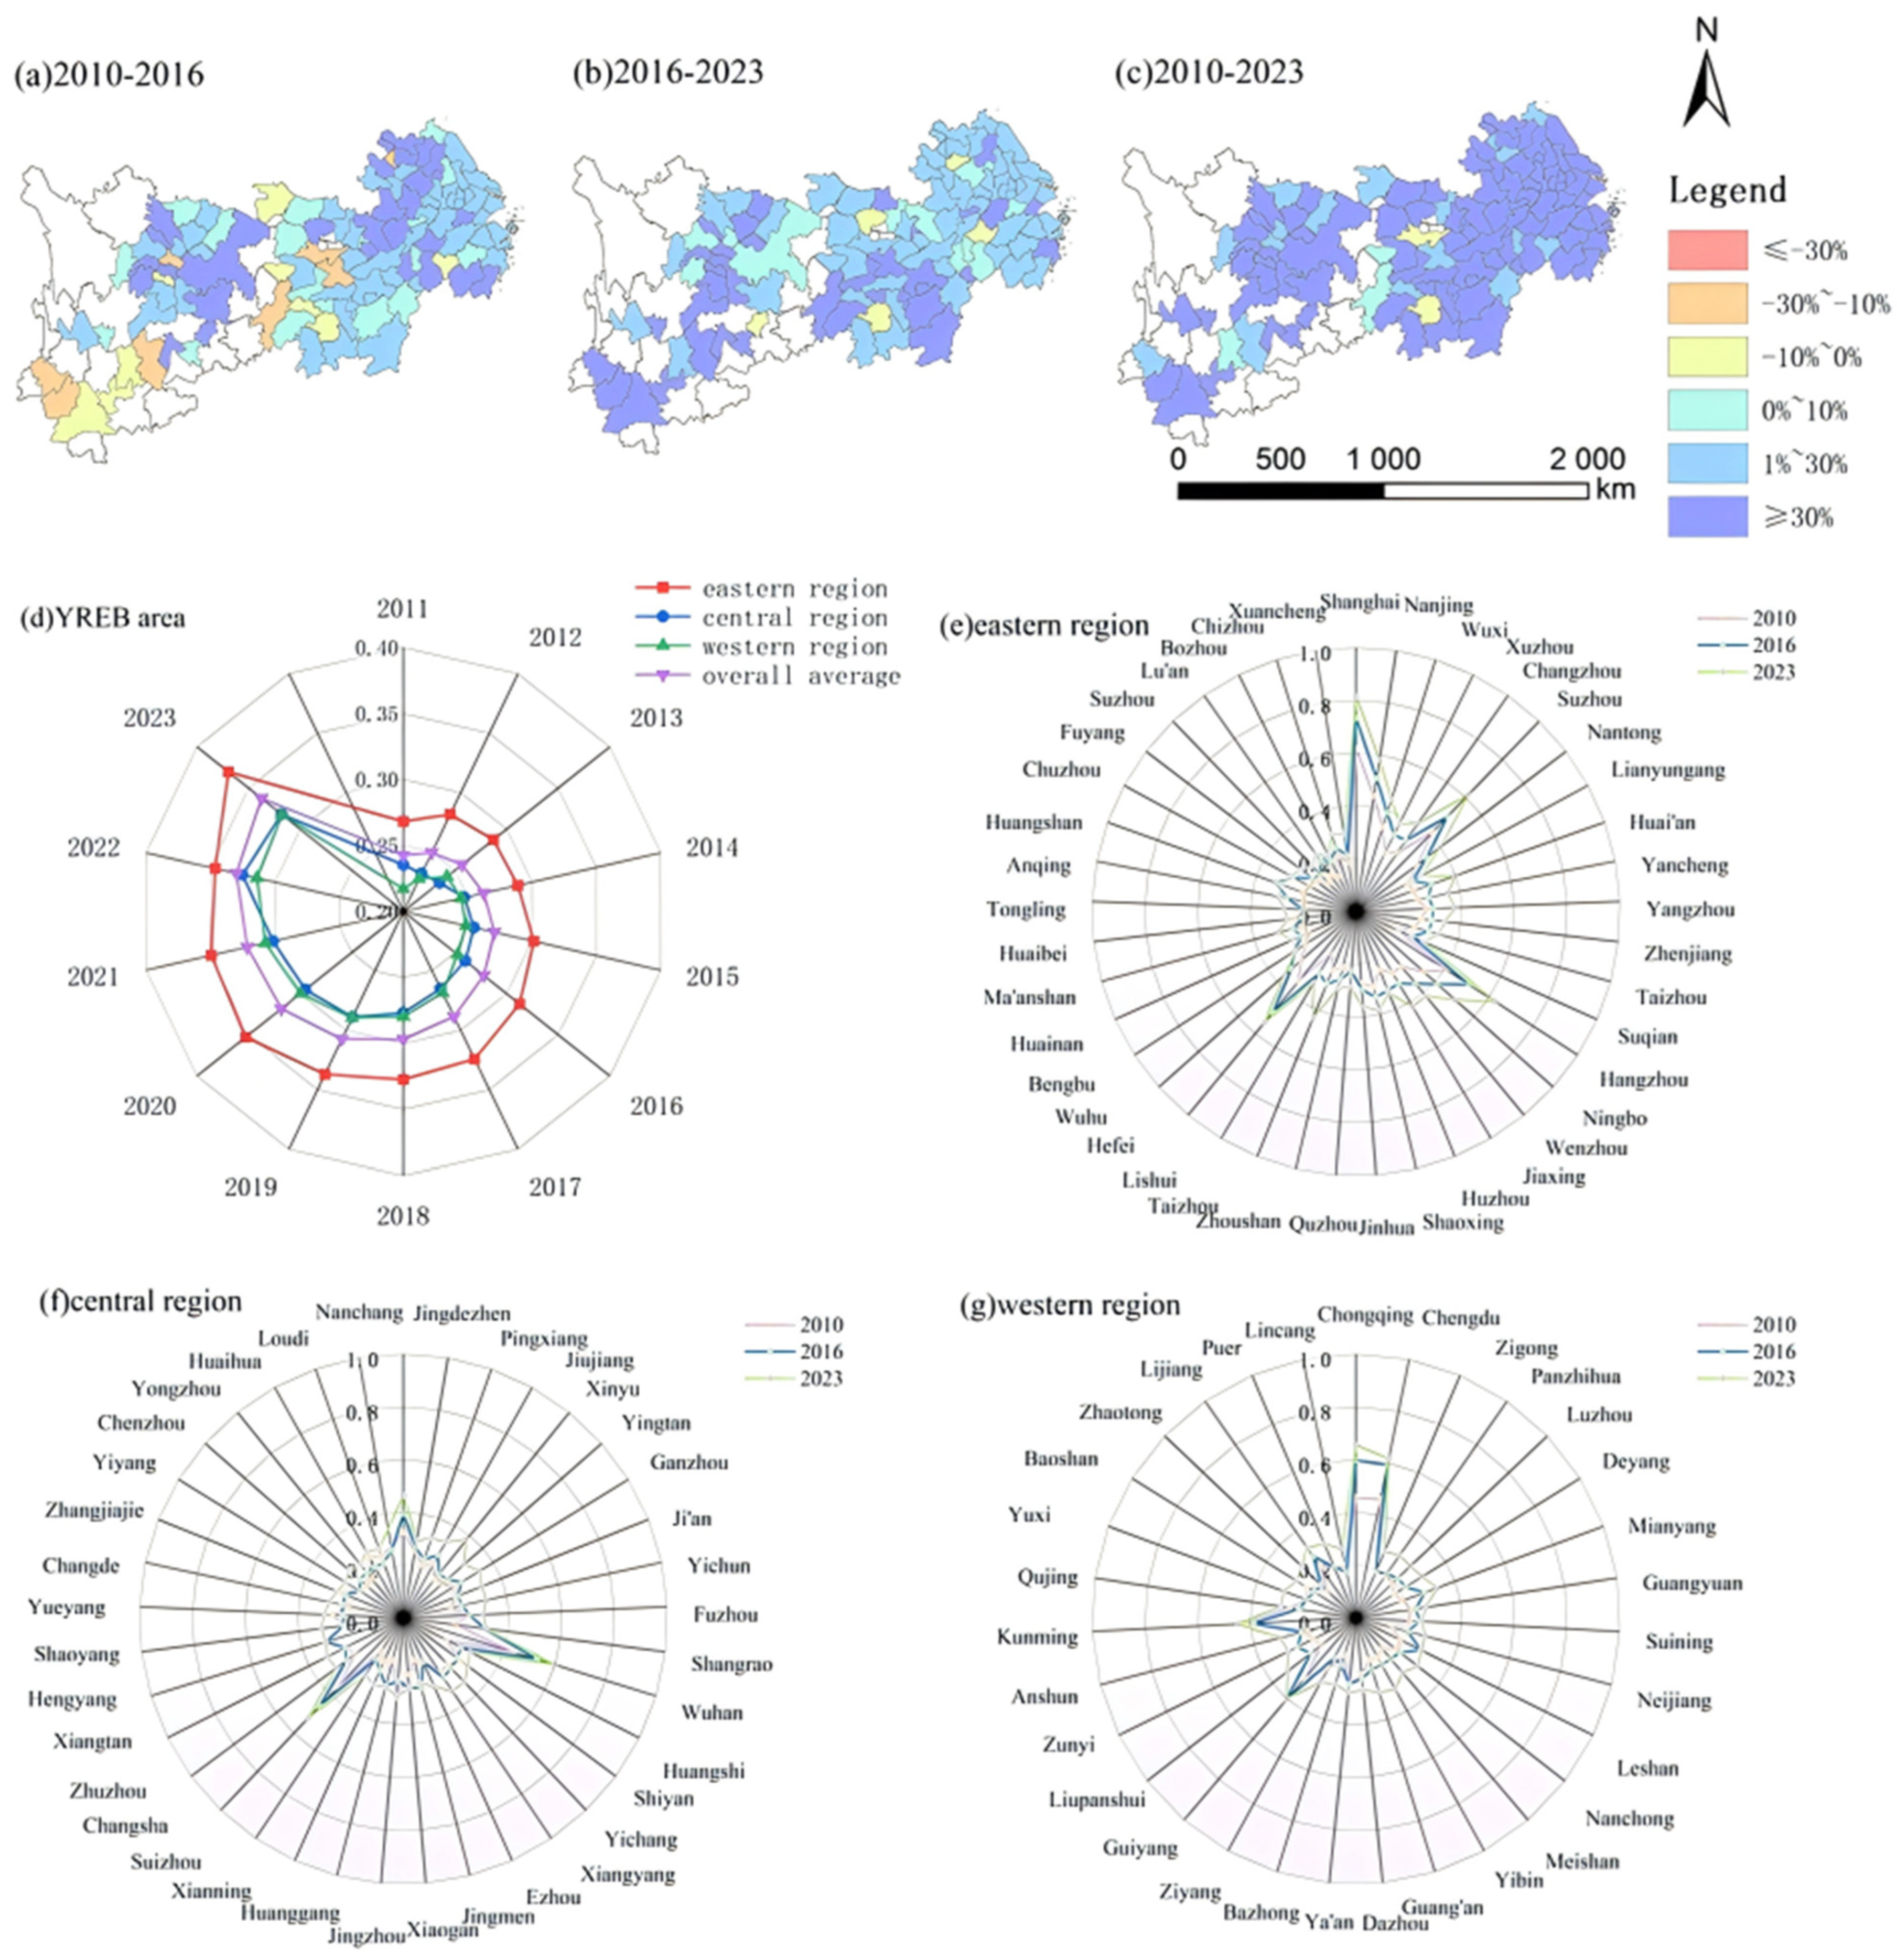
Figure 7a–c present the spatial patterns of change in the CCD within the YREB during the periods 2010–2016, 2016–2023, and 2010–2023 as a whole. Between 2010 and 2016, cities such as Shanghai and Nanjing, leveraging policy support and industrial foundations, integrated technology to extend their tourism industry chains, resulting in substantial positive increases in CCD. In contrast, resource-dependent cities showed minimal or even negative changes due to industrial monoculture and difficulties in economic transformation. From 2016 to 2023, with the advancement of the YREB strategy, cities including Wuhan and Changsha enhanced their CCD by integrating tourism resources and improving infrastructure, leading to a greater number of regions experiencing positive changes with increased magnitude.
Figure 7d–g illustrate the temporal evolution of the CCD for the entire YREB and its eastern, central, and western sub-regions. The Belt as a whole exhibited a steady upward trend, reflecting improved synergy between the economic and tourism sectors. In the eastern region, cities such as Shanghai and Hangzhou, capitalizing on their economic, technological, and talent advantages, used technological innovation to promote industrial integration, resulting in a steep rise in their CCD curves. The central region showed steady but more gradual improvement; although cities like Hefei and Nanchang promoted coordinated development, their pace was constrained by relatively weaker economic and technological capacity. The western region experienced significant fluctuations in the earlier stage, with cities such as Chongqing and Chengdu initially hampered by geographical and economic limitations. In later years, however, leveraging initiatives like the Western Development Strategy, they strengthened infrastructure and tapped into local tourism resources, leading to a stable increase in CCD.
In summary, the CCD within the YREB has demonstrated discernible phase-specific characteristics and distinct regional differentiation throughout its spatiotemporal evolution. This result supports H1. While the eastern, central, and western sub-regions exhibited distinct developmental trajectories, the Belt overall displayed a trend of synergistic optimization. It further verifies the judgment in H2 that the gap in coupling coordination degrees between regions is showing a narrowing trend. The eastern region, leveraging its comprehensive advantages, achieved rapid improvement. The central region progressed steadily yet was constrained by its comparative economic strength, while the western region experienced initial fluctuations before a policy-driven recovery in the later stage. Despite the positive developmental trajectory, regional disparities remain pronounced. Moving forward, it is imperative to enhance coordinated development, fostering a mechanism where the eastern region leads and the central/western regions collaboratively follow, thereby guiding the YREB toward a more balanced and high-quality stage of coupled and coordinated development. However, cities in the western region such as Zhaotong (Yunnan) and Bijie (Guizhou) have seen their coupling coordination degrees linger at a low level for a long time. Their development dilemmas mainly stem from changes in population structure and the loss of human capital, as well as constraints from geographical location and infrastructure.

5.3.2. Spatial Evolution Characteristics

(1) Spatial Distribution
Between 2010 and 2016, the CCD between ER and HQTD in the YREB demonstrated a consistent upward trend. Spatially (Figure 8a,b), the areal share of regions classified as discordant or low-grade coordinated shrank, while the extent of moderately and intermediate-coordinated regions expanded. During this phase, the regional development paradigm gradually shifted toward emphasizing ER and tourism synergy. Coupled with the release of growing tourism consumption demand, many localities strategically positioned their tourism industries, thereby driving integrated development and serving as a key impetus for the observed rise in CCD.
From 2016 to 2023, the rate of improvement in CCD intensified (Figure 8b,c), marked by a notable expansion of areas achieving intermediate coordination or higher. The YREB achieved a breakthrough in the synergistic development of these two systems, with the deep integration between the economy and tourism becoming increasingly pronounced. Tourism’s role in propelling the regional economy grew more significant, while enhanced ER in turn, provided sustained momentum for tourism’s sustainable progression. This period benefited not only from the deepening of earlier synergistic foundations but also from active measures such as the improvement of tourism-supporting infrastructure and optimization of industrial structures, collectively driving the coupling relationship toward a more advanced stage.
Examining the entire period from 2010 to 2023, although the overall CCD exhibited a continuous increase, regional imbalance persisted throughout, as gradient disparities are evident in Figure 8a–c. High and low coordination areas coexisted at every observed time point. Some cities, constrained by limitations in transportation infrastructure and market conditions, encountered bottlenecks in improving their coordination levels. Addressing these developmental bottlenecks necessitates strengthened policy guidance and optimized resource allocation to promote a more balanced and advanced progression of the coupling coordination relationship across the entire YREB. Among them, some cities in the “Jianghuai Ecological Economic Zone” have never been integrated into the highly coordinated regions. To safeguard the ecological security of the river basin, large-scale industrialization and urbanization development have been restricted, resulting in limited growth in their total economic output and fiscal self-sufficiency capacity. Although ecological protection has laid the foundation for “green tourism”, the mechanism to convert ecological advantages into synergistic advantages of the economy and tourism has not yet been fully established.
(2) Gini Coefficient
The application of the Gini coefficient to measure the coupling coordination level between ER and HQTD across cities in the YREB helps systematically reveal the inherent structure and spatial differentiation characteristics of regional unbalanced development. As shown in Figure 9a, from 2010 to 2023, the overall Gini coefficient followed a downward trajectory, indicating a gradual annual reduction in the inequality of the coupling coordination degree and reflecting a steady improvement in the balance between economic and tourism development. This trend can be attributed to the sustained effects of regional coordinated development policies and the progressive convergence of economic and tourism development gaps across different areas.
Although the Gini coefficient in the western region exhibited some fluctuations since 2010, it decreased overall to approximately 0.11 by 2023, indicating a movement toward greater balance and enhanced synergy between economic and tourism development in this region. This trend is consistent with H2, indicating that the gap in CCD between regions is showing a convergent trend, and the spatial spillover effect is gradually strengthening. In the central region, the Gini coefficient was relatively high in 2010, peaked in 2011, and then gradually declined, dropping to around 0.05 by 2023. This indicates that from a macro-regional perspective, the synergy degree between ER and HQTD among provinces and cities in the central region has reached a state of high homogeneity. This marks that the development gap within the region is no longer the primary contradiction, and the policy focus needs to achieve a strategic shift from “bridging the gap” to “enhancing the development level”. This evolution reflects significant achievements in balancing economic and tourism development in the central region. Early fluctuations, influenced by development policies and other factors, were later mitigated through strategic adjustments, leading to a notable narrowing of development disparities and the establishment of a more balanced state.
According to the evolution of the inter-regional Gini coefficient (Figure 9b), the disparities among the western, central, and eastern regions of China generally showed a converging trend. This implies that the economic development gaps between the western and central regions, western and eastern regions, and central and eastern regions have been gradually narrowing. As observed in Figure 9c, the contribution rate of intra-regional disparity, despite some fluctuations, remained generally stable, indicating that development within each region has reached a relatively balanced level, and that internal policies and measures have effectively curbed the emergence of inequality. In contrast, the contribution rate of inter-regional disparity showed an upward trend, suggesting that as disparities within regions diminish, differences between regions become more pronounced. This highlights an urgent need for policymakers to strengthen cross-regional coordination measures to address developmental gradients. The decline in the contribution rate of trans variation density reflects a reduction in the frequency of extreme inequality events in economic and tourism development. This is not only a positive outcome of policy interventions but also a result of the effective operation of market self-adjustment mechanisms.

5.3.3. Global Spatial Autocorrelation Analysis

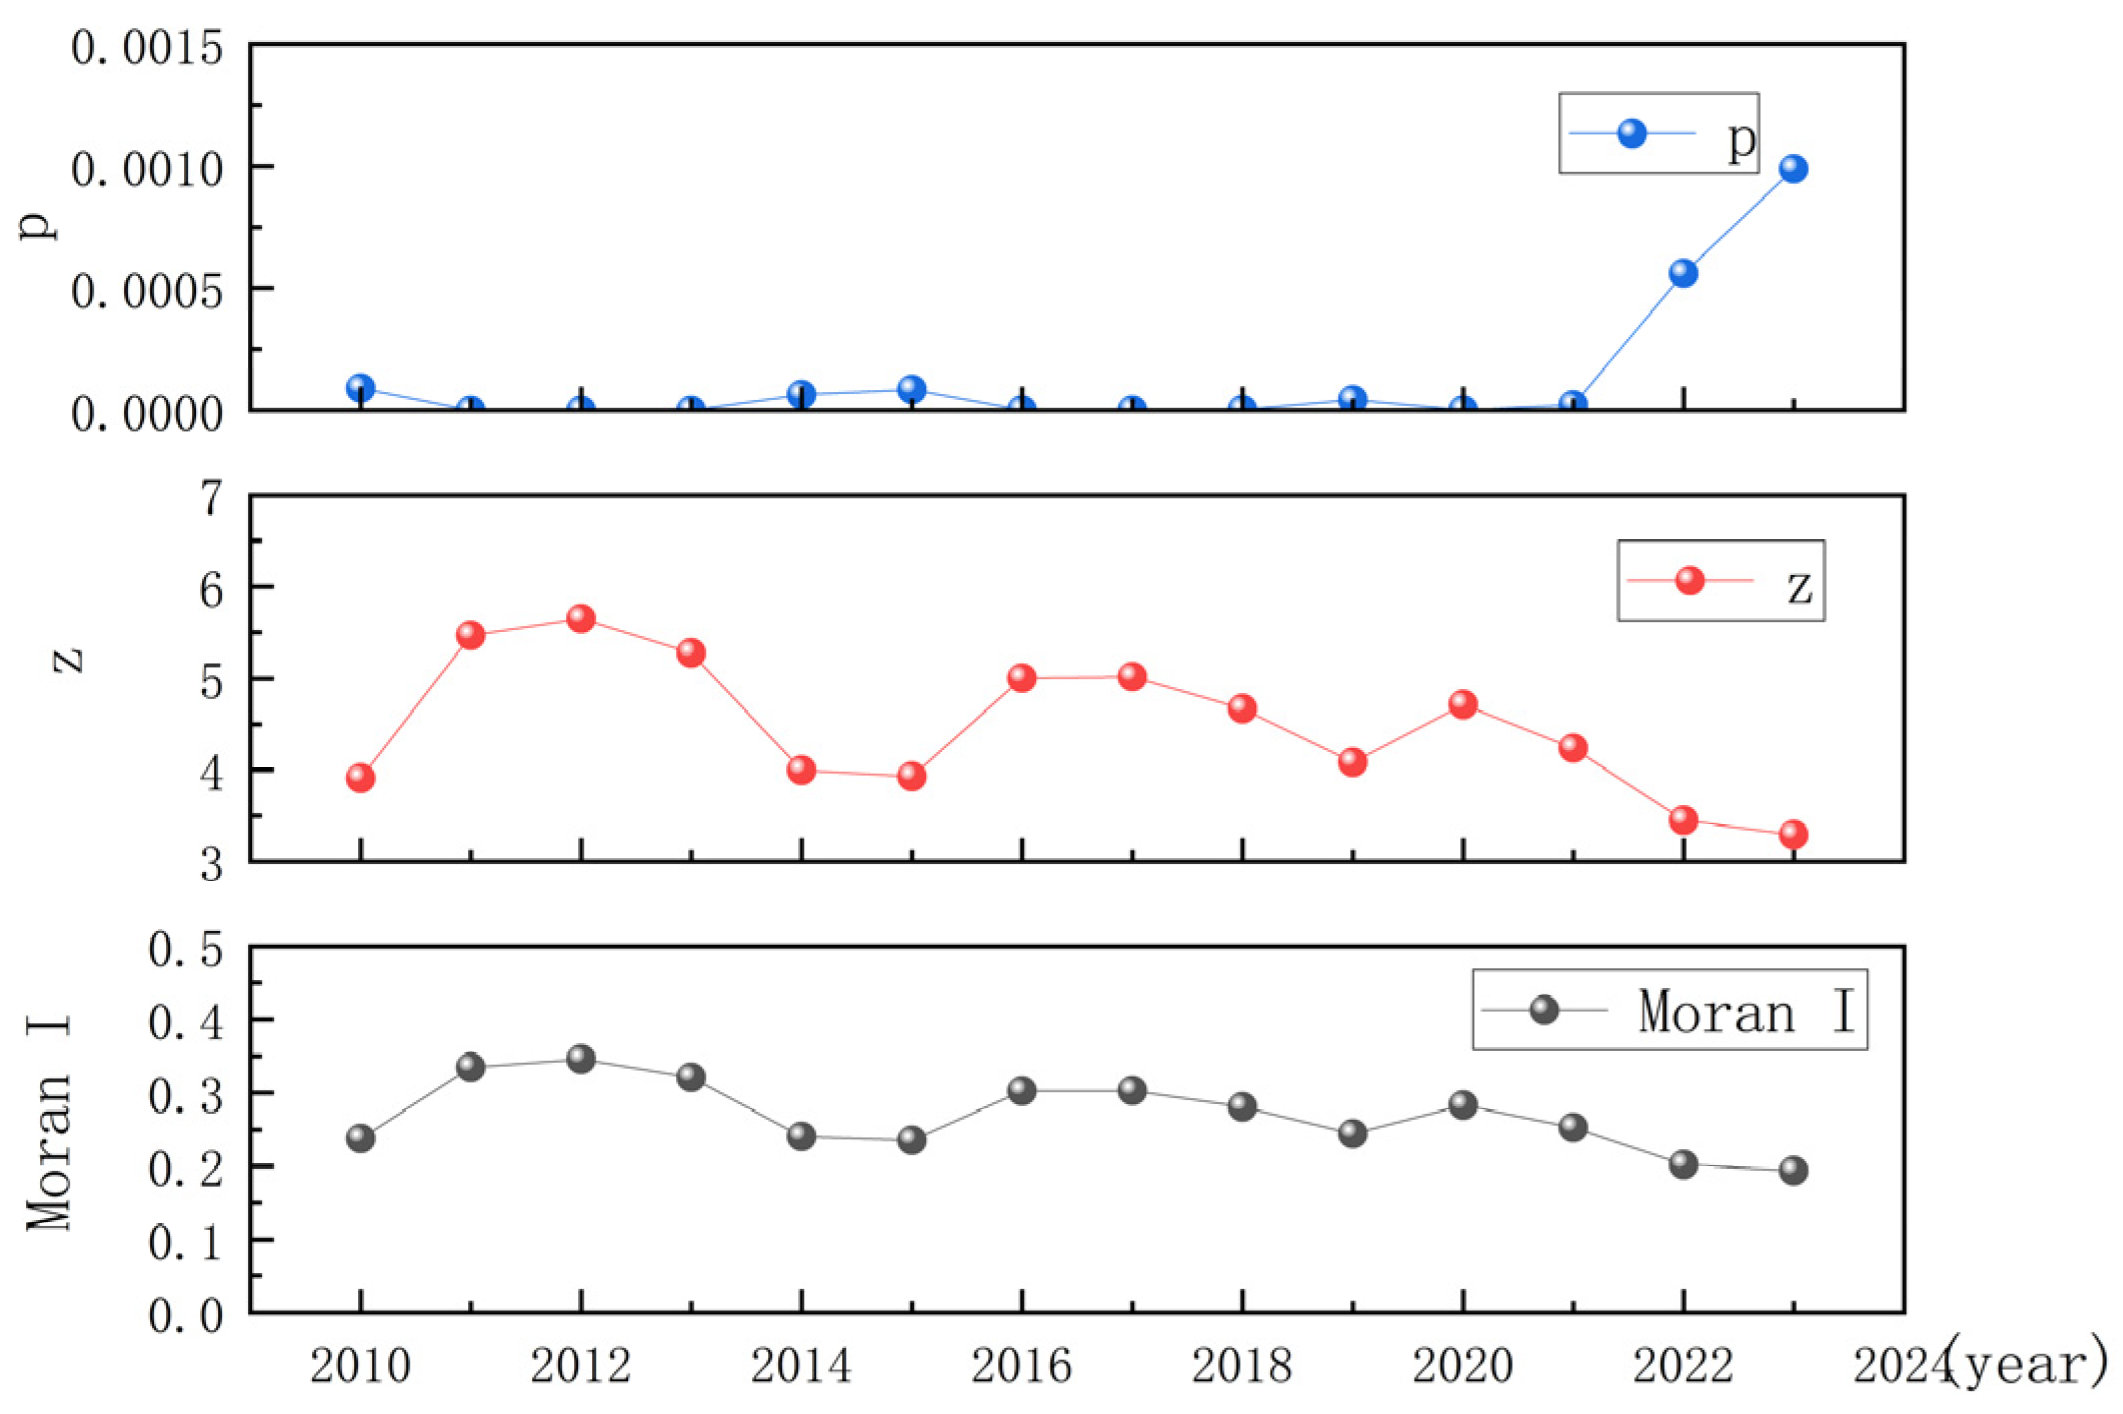
Moran’s I was employed to conduct a spatial autocorrelation analysis on the coupling coordination levels of ER and HQTD across cities in the YREB from 2010 to 2023. From the perspective of indicator correlation, the Moran’s I index and z-score showed a perfect positive correlation with a correlation coefficient of 1.00 (Figure 10), meaning their change trends and magnitudes were consistent. In contrast, they had a strong negative correlation of −0.69 with the p-value, which conformed to the expected indicator relationship: the higher the first two indicators, the lower the p-value, and the stronger the significance of spatial autocorrelation.
In terms of trends, the Moran’s I index fluctuated during this period. It remained at a relatively high level from 2011 to 2013, peaking at 0.34596 in 2012. During this phase, cities in the Yangtze River Delta region achieved coordinated development of the tourism industry by virtue of advanced transportation networks and close economic ties. Shanghai’s urban tourism complemented the water town and natural landscape tourism of neighboring cities like Suzhou and Hangzhou, resulting in a high degree of spatial agglomeration in the ER-HQTD coupling coordination level of this region. After that, the Moran’s I index declined, dropping to 0.193468 by 2023, which was associated with global economic downward pressure and intensified tourism competition in some areas.
The trend of the z-score was highly consistent with that of the Moran’s I index. It also stayed at a high level from 2011 to 2013, reaching approximately 5.6 in 2012. The z-score in all years was far greater than the significance threshold of 1.96, indicating that the spatial autocorrelation in each year was significant and not caused by random factors.
The overall trend of the p-value was opposite to that of the above two indicators. It was extremely small in most years, almost approaching 0 from 2011 to 2013, which further verified the strong significance. Although the p-value was relatively larger in 2022 and 2023, it still remained low. For instance, in 2022, repeated COVID-19 outbreaks restricted tourism in some cities; although the significance of spatial autocorrelation weakened slightly, it still existed.
In general, the YREB exhibited significant spatial autocorrelation in the ER-HQTD coupling coordination level during this period, but the intensity fluctuated. This trend should be taken into account when formulating policies to strengthen regional collaborative cooperation and improve the coupling coordination level.

5.4. Kernel Density Estimation Analysis

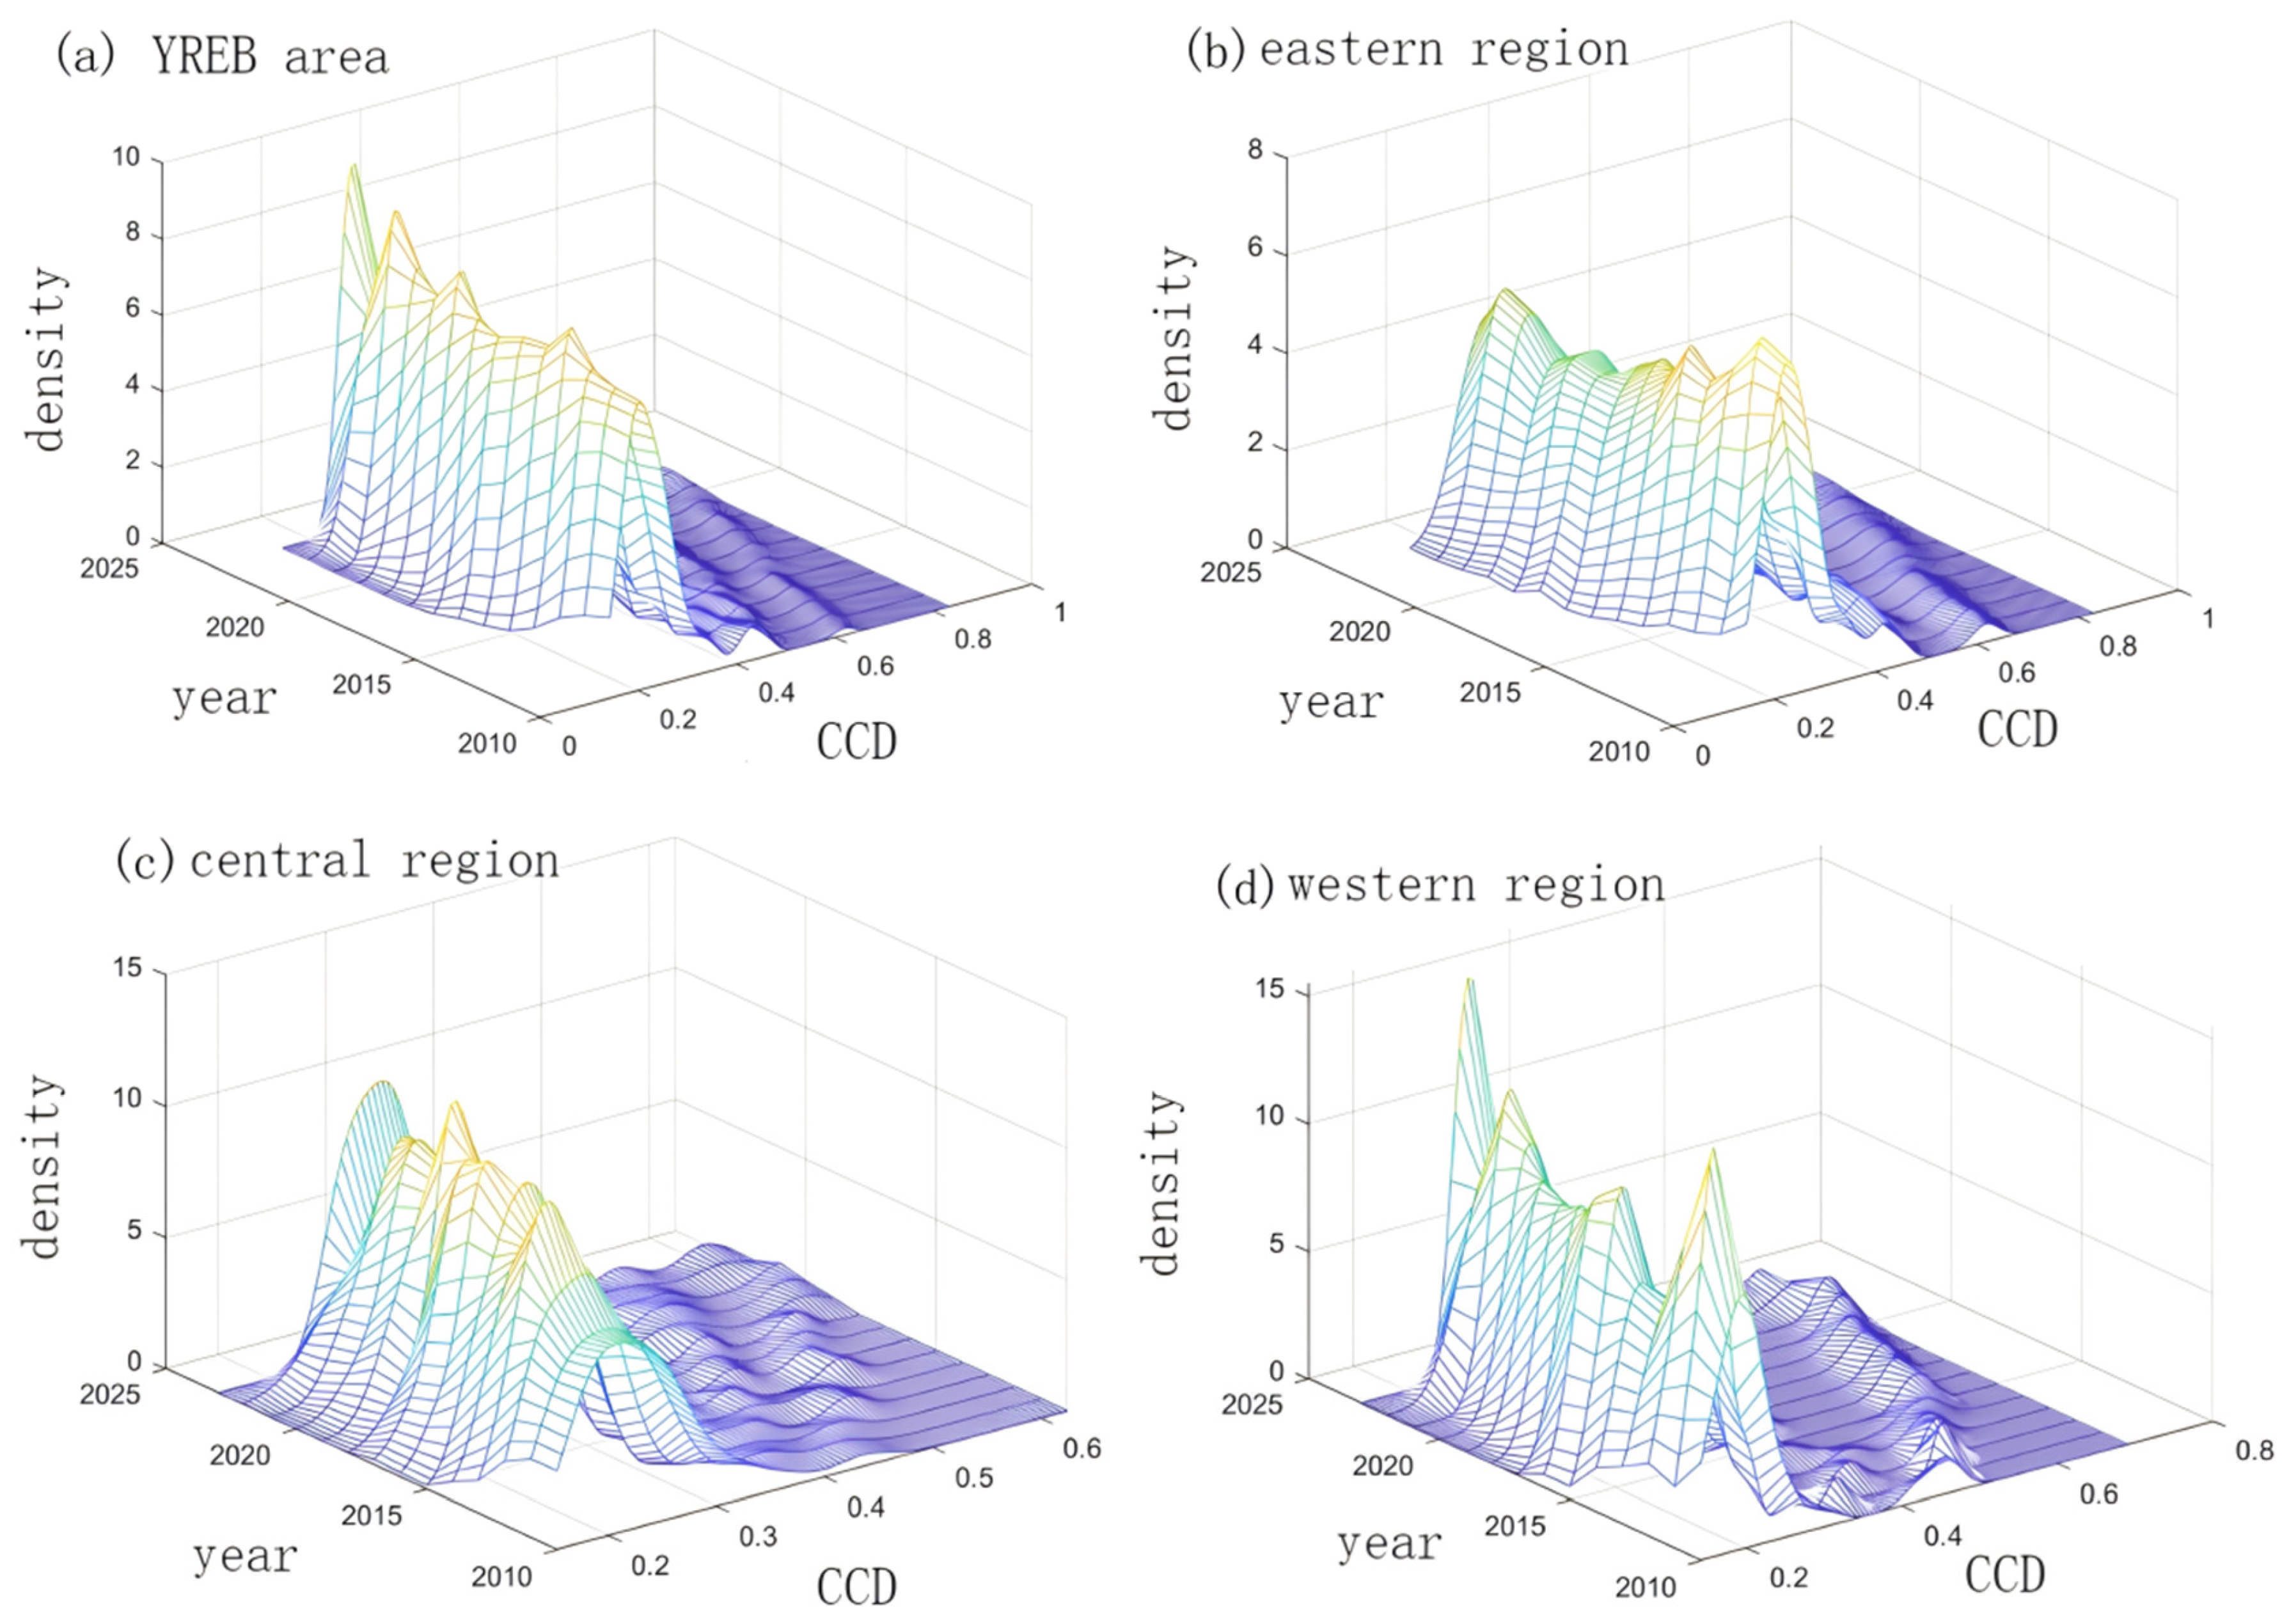
To gain an in-depth understanding of the temporal evolution characteristics of the coupling coordination between ER and HQTD in the YREB, this study employed kernel density estimation. Using CCD data from 2010, 2016, and 2023, kernel density curves were plotted to visually reflect the distribution characteristics and changing trends of the CCD across different periods (Figure 11).
Overall, during the period from 2010 to 2023, the kernel density distribution curves exhibited a clear rightward shift along with a reduction in peak height. This indicates a continuous improvement in the overall level of coupling coordination, while the internal disparities within the region widened.
From a regional perspective, the kernel density curve for the western region displayed a multimodal morphology, revealing significant internal developmental imbalances within this region, alongside dynamic fluctuations in its overall development level. In the central region, the curve’s span increased in the later period, pointing to an expansion of developmental disparities within the region. The peak of the curve became steeper towards the end of the study period, suggesting an enhanced concentration of cities around specific coordination levels. For the eastern region, the rightward shift in the peak signifies an upgrade in the overall coordination level. However, the presence of multiple peaks and variations in peak height indicates persistent internal developmental disparities, with fluctuating concentrations around different aggregation levels.

5.5. Influence Coordination Force Analysis

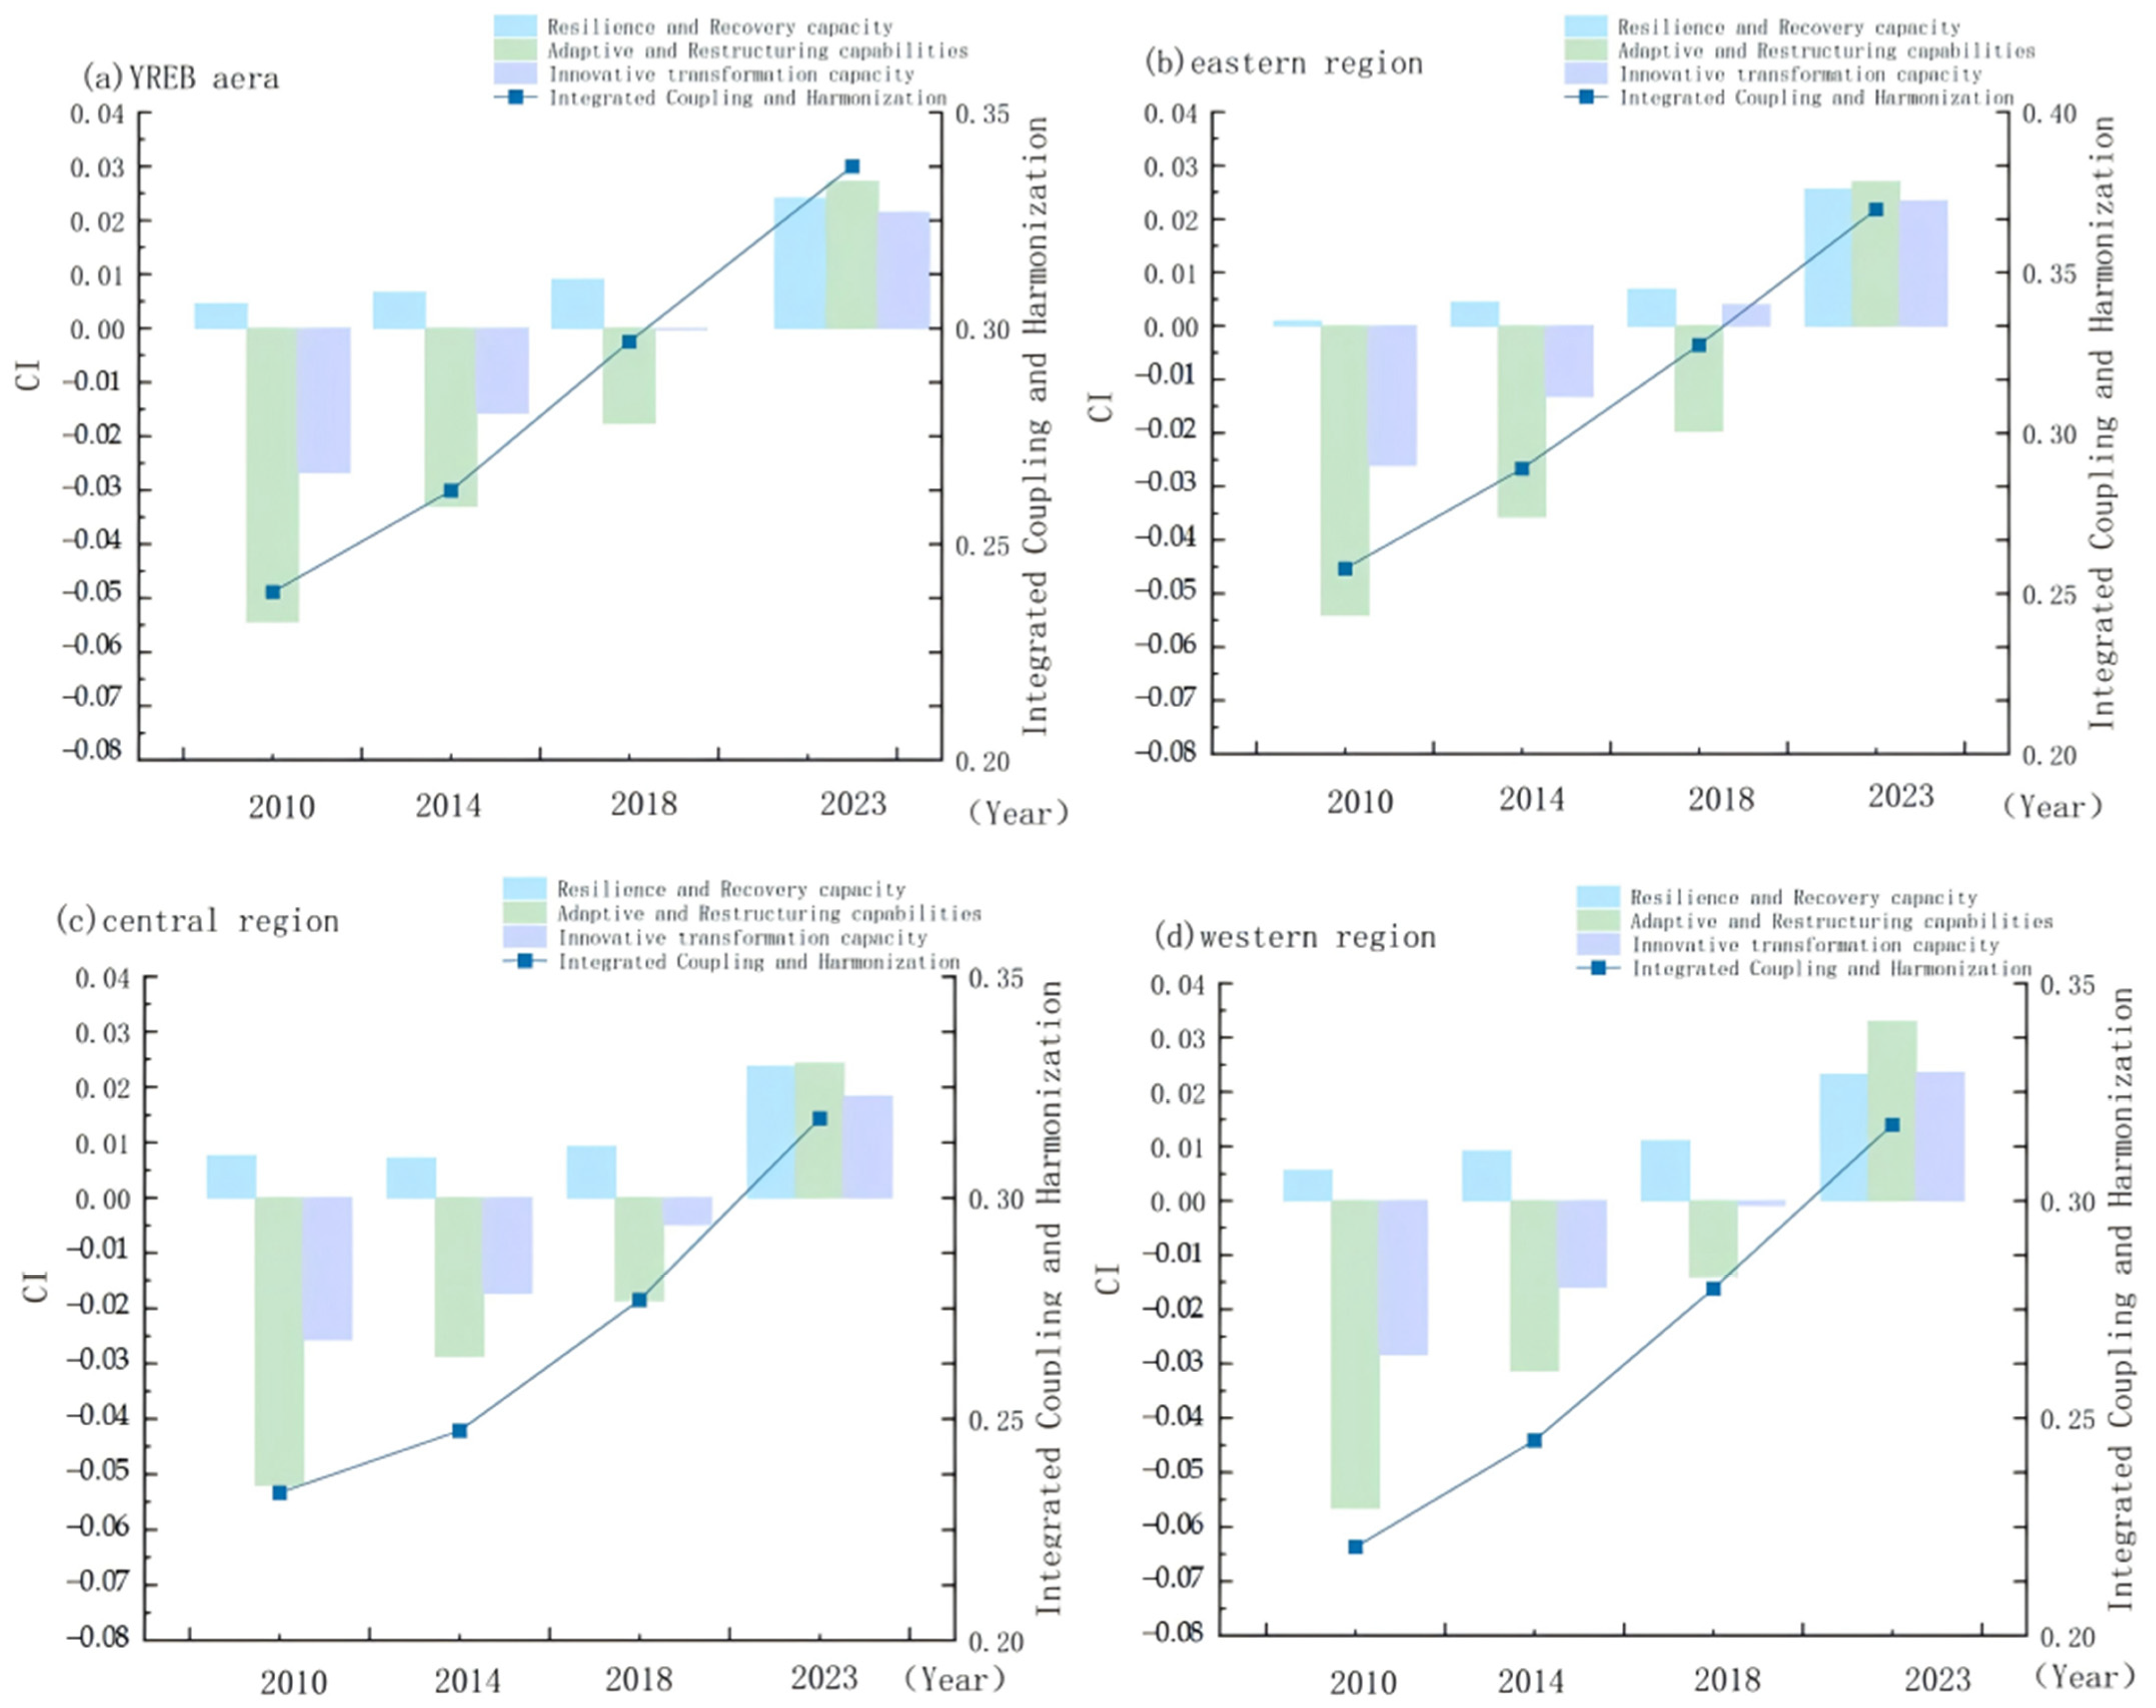
Based on the CI, this study provides an in-depth analysis of the intrinsic mechanisms through which various dimensions of urban ER affected the coupling coordination relationship with HQTD from 2010 to 2023, across the entire YREB and its eastern, central, and western sub-regions. As shown in Figure 12, the CCD improved over time in all regions. Regarding the influential dimensions, resistance and recovery capacity consistently provided positive support, while adaptation and adjustment capacity and innovation and transformation capacity initially acted as constraints before gradually shifting to positive contributions in later stages. Due to differences in foundational conditions and industrial structures, the intensity of each dimension’s effect and the resulting coupling level varied across regions.
The CI of adaptability and adjustment capacity is negative, which indicates that this dimension has a negative correlation with the coupling coordination level of the overall system. In other words, it is associated with a lower coordination state and serves as a key shortcoming in the coordinated development of the system. Economic restructuring lagged behind, making it difficult to adapt to dynamic market changes, which hindered the synergistic development of tourism and the economy. Influenced by geographical conditions and industrial foundations, the western region experienced the most pronounced constraining effect, while the eastern region was relatively less affected. Similarly, innovation and transformation capacity also constrained all regions, reflecting a lag in scientific innovation and the development of new tourism formats, which failed to effectively drive tourism industry upgrading. The central region exhibited the most notable constraining effect in this dimension, primarily due to slower economic restructuring and industrial upgrading. In contrast, the CI of resistance and recovery capacity is positive, indicating that it is significantly correlated with a higher overall coupling coordination level. This dimension can be regarded as a stable correlation factor for the coordinated development of the system. Although its contribution showed a fluctuating downward trend from 2010 to 2023, it remained positive. This was attributable to improved infrastructure, policy support, and the stabilizing effect of tourism on local economies, which laid a foundation for HQTD, albeit with room for further enhancement. Overall, the dynamic changes in the CCD across regions resulted from the complex interactions among these resilience subsystems.

6. Discussion, Policy Recommendations, and Study Limitations

6.1. Discussion

The “ER-HQTD coupling coordination framework” constructed in this study has its basic principles rooted in the integration of interdisciplinary theories: based on the dynamic evolution theory of ER is dynamically decomposed into three dimensions—basic resilience and recovery capacity, adaptive reconstruction capacity, and innovative transformation capacity—to capture the evolutionary logic of resilience from “passive resistance” to “active evolution”; with the tourism sustainable development model as the core, HQTD is focused on the coordinated improvement of quality, efficiency, and sustainability, responding to the three-dimensional balance goal of “economy–society–ecology”; finally, the two are integrated through the coupling system synergy theory to reveal the two-way interaction mechanism of “resilience supports development and development feeds back to resilience”.
The necessity is reflected in two gaps in existing research: first, most of the existing literature discusses ER or HQTD in isolation, with little attention to their dynamic coupling. For example, Lin et al. only analyzed the spatial differences of urban resilience in China [24], and Zhang et al. focused on the influencing factors of HQTD but neither revealed the internal connection of “how resilience stabilizes tourism development and how tourism forces the upgrading of resilience” [38]; second, the global tourism industry is vulnerable to external shocks, while the “ballast stone” role of ER in tourism recovery has not been systematically quantified, which is explained in this framework. In terms of applicability, the framework design balances scientific city and practicality: in terms of indicator selection, ER indicators include quantifiable indicators such as industrial diversification and fiscal self-sufficiency level, and HQTD indicators incorporate core dimensions such as green innovation, service quality, and ecological efficiency. All data are sourced from authoritative databases such as China City Statistical Yearbook and China Regional Statistical Yearbook to ensure regional comparability; in terms of application scenarios, the framework is applicable not only to spatio-temporal evolution analysis of large-scale regions but also to policy effect evaluation at the urban level, providing a standardized tool for research at different scales.
The interannual fluctuations in the ER-HQTD coupling coordination level of the YREB are the result of the combined effects of multiple factors such as the macroeconomic environment, policy intervention, and external shocks: in terms of economic cycle and policy driving, from 2010 to 2015, China’s economy grew at a high speed, and the eastern region, relying on the policy dividends of “Yangtze River Delta Integration”, promoted industrial upgrading and tourism consumption upgrading simultaneously, driving the rapid improvement of the coupling coordination level; from 2015 to 2020, the economy entered the “new normal”, coupled with the impact of the COVID-19 pandemic in 2020, tourism revenue dropped sharply, and the “recovery capacity” of ER became the core support for coupling coordination, leading to a slowdown in growth in 2020 but no reversal; from 2021 to 2023, policies such as “cultural and tourism integration” and “regional coordinated development” in the “14th Five-Year Plan” took effect, coupled with post-pandemic tourism recovery policies, promoting the coupling coordination level to return to the fast track.
In terms of external shocks and technological revolution, after the 2008 financial crisis, the eastern region accelerated industrial diversification, and the “innovative transformation capacity” of ER was significantly enhanced, while the central and western regions relied on resource-based industries with weak risk resistance, leading to the expansion of the coupling coordination gap from 2010 to 2015; after 2015, digital technology empowered the tourism industry, the eastern region took the lead in deploying smart tourism to improve the efficiency of HQTD, while the central and western regions lagged in digital infrastructure, resulting in slow release of technological dividends and persistent interannual growth differences; the 2020 pandemic forced the digital transformation of the tourism industry, and the central and western regions narrowed the gap through policy support.
From the perspective of regional differences, the eastern region has long maintained its advantage in coupling coordination, which is rooted in the “three-dimensional support system”: in terms of industrial foundation, the proportion of the tertiary industry in the eastern region exceeds 60%, with in-depth integration of cultural tourism, finance, and technology, and prominent “innovative transformation capacity” of ER; in terms of innovation resources, the proportion of R&D expenditure in GDP in the eastern region reaches 3.5%, with dense universities and research institutes, promoting the implementation of smart tourism and green tourism technologies; in terms of policy dividends, the eastern region is the core area of national strategies, with significantly leading infrastructure and degree of opening up. The central and western regions have made slow progress, which is restricted by four aspects: structural rigidity, with the secondary industry accounting for over 45%, insufficient linkage between tourism and other industries, and weak “adaptive reconstruction capacity” of ER; insufficient resource integration, lagging cross-regional tourism cooperation, leading to difficulty in releasing scale effects; ecological constraints, as most of them are ecological protection zones in the upper reaches of the Yangtze River, and tourism development is restricted by the “ecological red line”; brain drain, with the net outflow rate of tourism professionals exceeding 15%, restricting the improvement of service quality.
In terms of theoretical significance, this study deepens the dynamic evolution theory of ER by applying the three-stage theory of ER (“resistance–recovery–adaptation”) to the tourism economic scenario, and verifies the dynamic law that “basic resilience ensures short-term recovery and innovative transformation drives long-term coordination”; enriches the tourism sustainable development model, introduces ER as the “external stabilizer” of HQTD, and reveals the two-way enhancement mechanism of “resilience-tourism”; verifies the coupling system synergy theory, confirms that the coupling system has the characteristic of “dynamic unbalanced synergy”, and provides empirical support from developing countries for the regional coordinated development theory.
The empirical results of this study are mutually confirmed by a series of international experiences, providing references for the differentiated development of different regions in the YREB. Rural areas in Japan [45] have achieved synergy with HQTD by enhancing ER, and their “community development + brand agriculture” model has direct reference value for the central and western regions of the YREB. The Silesian industrial zone in Poland [46] has systematically renovated industrial and mining heritage and developed cultural tourism through the “industrial heritage route” program led by local governments, and its “heritage activation + industrial restructuring” path can provide references for the transformation of resource-based cities in the YREB (such as Huangshi in Hubei and Huainan in Anhui).

6.2. Policy Recommendations

Based on the above research results, to effectively address practical dilemmas such as unbalanced regional development and ecological constraints, and promote the synergistic evolution of ER and HQTD to a higher level, this study proposes the following policy recommendations from operational and strategic perspectives:
First, implement precise regional regulation to bridge the gap in coordinated development. Policy resources should be prioritized for the central and western regions. Through increasing fiscal transfer payments, customized tax incentives, and talent introduction subsidies, efforts will be made to accelerate the remediation of shortcomings in infrastructure and public services. At the same time, it is necessary to focus on building a normalized cross-regional cooperation platform, institutionalizing the gradient transfer of capital, technology, and management experience from the eastern region to the central and western regions, and forming a collaborative development echelon featuring “eastern leadership, central support, and western rise”. For example, promote specific city pairs such as Shanghai–Hefei–Luan, Hangzhou–Nanchang–Jingdezhen, and Nanjing–Wuhan-Enshi to sign the Memorandum of Understanding on Regional Tourism Resilience Synergistic Development, clarifying quantitative targets for capital transfer, technology sharing, and talent exchange.
Second, strengthen the input of core elements to consolidate the foundation of system resilience. Local governments should focus on enhancing the “resistance and recovery capacity” of the economic system, and continuously increase investment in and upgrading of key infrastructure such as transportation and digital information networks. Encourage the tourism industry to optimize operational efficiency through digital transformation, and promote its in-depth integration with local advantageous industries such as culture, health care, and sports, so as to enhance the diversity and stability of the industrial structure and build a solid foundation for responding to shocks. In “marginal low-lying” cities in the multi-peak structure of the western region (such as Zhaotong, Yunnan), priority should be given to planning and investing in “smart tourism highways” and full 5G signal coverage projects, aiming to reduce the network delay in scenic spots to less than 20 milliseconds, directly improving the tourism experience and operational efficiency.
Third, innovate green development mechanisms to expand sustainable paths. It is necessary to go beyond traditional environmental protection models, actively explore and establish market-oriented mechanisms for realizing the value of ecological products and horizontal ecological compensation systems, so that excellent ecology can become the core competitiveness of regional development. In tourism development, systematically promote green infrastructure and low-carbon operation models, transform ecological constraints into new drivers of development, and achieve long-term unity of economic and ecological benefits. Draw on the goal of “ecosystem restoration and sustainable livelihoods” under the “Kunming-Montreal Global Biodiversity Framework” of the United Nations Convention on Biological Diversity and the experience of natural capital accounting under the EU Green Deal, design and pilot the “wetland carbon sink enhancement and tourism value realization” model.
Fourth, build an innovation-driven paradigm to cultivate lasting growth momentum. All regions need to focus on cultivating the “innovation and transformation capacity” of the economic system. On the one hand, increase R&D investment, encourage tourism-related technological innovation and patent transformation, and develop smart tourism formats based on digital technologies. On the other hand, strive to create an institutional environment conducive to innovation and entrepreneurship, break down institutional barriers through deepening reforms, stimulate the vitality of market entities, and provide sustained endogenous impetus for the synergistic evolution of the two systems. To accelerate the application of new technologies, it is recommended to designate specific areas in cities with sound digital foundations such as Hangzhou and Chongqing as “smart tourism technology application sandboxes”, allowing enterprises to test technologies such as unmanned driving shuttles and AI-guided tours in real scenarios, and granting a two-year flexible regulatory exemption. This will effectively break down the barriers between the innovation chain and the industrial chain, injecting sustained momentum into the synergistic evolution of the two systems.

6.3. Study Limitations

This study provides empirical support for analyzing the coordination between ER and HQTD in the YREB, but it has certain limitations.
First, in terms of research perspective and data: The study mainly focuses on economic and ecological dimensions, with insufficient integration of “soft” factors such as social governance, community resilience, and cultural capital. A more diverse perspective is needed in the future to build a more comprehensive analytical framework. Although the composite indicator system aims for comprehensiveness, it may cause a “masking effect”—the overall evaluation value may obscure the heterogeneous performance and internal conflicts among different sub-dimensions. Additionally, while missing data were processed using conventional methods like linear interpolation, this may introduce potential errors.
Second, in terms of methodology: The study mainly reveals the correlation and spatio-temporal evolution characteristics between variables, but fails to deeply test their internal causal relationships. Although the CCD model and CI can effectively assess interaction intensity and direction, they cannot fully avoid potential endogeneity issues between variables. Future research could adopt more advanced empirical methods such as dynamic panel models (e.g., system GMM) and spatial econometric techniques (e.g., spatial Durbin model) to more accurately identify the direct and spillover effects of driving factors and control model endogeneity.
Third, in terms of conclusion generalizability: The study’s cases are concentrated in the YREB, and its conclusions are largely influenced by the region’s specific policy environment, development stage, and resource endowments. Thus, caution is needed when extending the conclusions to other river basins or economic regions at home and abroad, and verification and adjustment based on local contexts are required. Future research could expand to other typical regions for comparative analysis, and verify the interaction mechanism between ER and tourism development at a more detailed scale by introducing natural experiments, micro-enterprise survey data, and tracking datasets—thereby enhancing the external validity of the theoretical framework and the applicability of policy implications.

7. Conclusions

This work employs the entropy weight TOPSIS approach, CCD model, kernel density estimation, and other methods to thoroughly examine the coupling coordination state of ER and HQTD in the YREB from the 2010–2023 period. It comes to the crucial conclusions listed below: (1) The CCD of ER and HQTD has demonstrated a notable rising tendency in the time dimension. It confirms H1, namely that the synergistic effect between the two is constantly strengthening. This shows that over time, the synergy between the economy and the tourism industry in the YREB has become increasingly close, the role of mutual promotion has been increasing, the overall development of the region has gradually stepped into a virtuous circle track, and the development path has been continuously optimised. (2) At the regional level, the eastern area is significantly ahead of the central and western regions in coupling coordination due to its robust economic base, advanced industrial structure, and well-developed infrastructure. It supports the judgment of H2. The central region has maintained a steady upward trend, but the rate of growth has been relatively slow. Although the western region has achieved relatively rapid development in recent years, there is still much room for improvement due to resource endowment, geographical conditions and the relative backwardness of infrastructure construction, and the phenomenon of unbalanced inter-regional development is still relatively prominent. (3) In terms of spatial distribution, although the overall coupling coordination degree has been improved and the gap between some regions has gradually narrowed, the coordination degree of ecologically fragile areas and economically underdeveloped areas is still at a relatively low level, and the problem of unbalanced development within the region should not be ignored, which to a certain extent affects the effectiveness of the overall synergistic development of the YREB. It further verifies the inferences of H2 regarding the narrowing of regional gaps and the strengthening of spatial spillover effects.

Author Contributions

C.Z.: Conceptualization, Writing—Original Draft. X.W.: Writing—Review & Editing, Formal analysis. B.H.: Software, funding acquisition, Resources. D.M.: Methodology, Supervision, Software. J.H.: Data Curation, Validation. C.H.: Investigation, Project administration. F.Z.: Visualization. All authors have read and agreed to the published version of the manuscript.

Funding

National Social Science Fund of China “Study on the Vulnerability and Resilience Evaluation of Tourism Industry in Ethnic Areas under the Shock of Major Crisis Events and High Quality Development” (22BMZ154); Chongqing Municipal Education Commission Humanities and Social Sciences Base Project “Research on Realistic Dilemmas and Realization Paths of New Rural Elites Participating in Rural Governance in Ethnic Communities of the Wuling Mountain Area” (25SKJD150); Guizhou Provincial Science and Technology Cooperation Basic Research Project “Research on Synergetic Evolution of High-Quality Development of Tourist Cities and Tourism Comfort Based on Complex Adaptive System Theory” (QN[2025]316). This research received no external funding.

Data Availability Statement

The authors declare that they have no known competing financial interests or personal relationships that could have appeared to influence the work reported in this paper.

Conflicts of Interest

The authors declare no conflicts of interest.

References

  1. Sharifi, A.; Allam, Z.; Bibri, S.E.; Khavarian-Garmsir, A.R. Smart cities and sustainable development goals (SDGs): A systematic literature review of co-benefits and trade-offs. Cities 2024, 146, 104659. [Google Scholar] [CrossRef]
  2. Wu, D.; Liu, W.; Ren, Y.; Li, H. Exploring energy and tourism economy growth nexus with DEA-based index systems: The case of sustainable development of tourism destinations. Environ. Sci. Policy 2024, 160, 103858. [Google Scholar] [CrossRef]
  3. Zeigermann, U.; Uçaray Mangıtlı, B. Knowledge representation in global environmental assessments-Patterns among authors of the Global Environmental Outlook. Environ. Sci. Policy 2025, 164, 104004. [Google Scholar] [CrossRef]
  4. Filipović, S.; Lior, N.; Radovanović, M. The green deal–just transition and sustainable development goals Nexus. Renew. Sustain. Energy Rev. 2023, 168, 112759. [Google Scholar] [CrossRef]
  5. Hossain, M.R.; Rao, A.; Sharma, G.D.; Dev, D.; Kharbanda, A. Empowering energy transition: Green innovation, digital finance, and the path to sustainable prosperity through green finance initiatives. Energy Econ. 2024, 136, 107736. [Google Scholar] [CrossRef]
  6. Li, M.; Wang, J.; Dong, Y.; Zeng, Y.; Shen, N.; Liu, W. What combinations drive the urban green infrastructure development in China’s Yangtze River Economic Belt? An empirical study based on fs/QCA. Ecol. Indic. 2024, 166, 112190. [Google Scholar] [CrossRef]
  7. Du, Y.; Wang, Q.; Zhou, J. How does digital inclusive finance affect ER: Evidence from 285 cities in China. Int. Rev. Financ. Anal. 2023, 88, 102709. [Google Scholar] [CrossRef]
  8. Han, S.; Wang, H.; Ao, Y.; Wang, B.; Chen, B.; Martek, I. Resilient city construction efficiency and its influencing factors in China’s Chengdu-Chongqing Economic Circle: Considering both construction input and resilience level of the city. Sustain. Cities Soc. 2024, 114, 105726. [Google Scholar] [CrossRef]
  9. Cheng, X.; Ge, F.; Xu, M.; Li, Y. The heat island effect, digital technology, and urban ER: Evidence from China. Technol. Forecast. Soc. Change 2024, 209, 123802. [Google Scholar] [CrossRef]
  10. Ribeiro, P.J.G.; Gonçalves, L.A.P.J. Urban resilience: A conceptual framework. Sustain. Cities Soc. 2019, 50, 101625. [Google Scholar] [CrossRef]
  11. Li, Q.; Wang, X.; Chen, Z.; Arif, M. Assessing the conjunction of environmental sustainability and tourism development along Chinese waterways. Ecol. Indic. 2024, 166, 112281. [Google Scholar] [CrossRef]
  12. Yuan, Z.; Hu, W. Urban resilience to socioeconomic disruptions during the COVID-19 pandemic: Evidence from China. Int. J. Disaster Risk Reduct. 2023, 91, 103670. [Google Scholar] [CrossRef]
  13. Yang, T.; Yu, N.; Hong, T. How do urban socio-economic characteristics shape a city’s social recovery? An empirical study of COVID-19 shocks in China. Int. J. Disaster Risk Reduct. 2023, 90, 103643. [Google Scholar] [CrossRef]
  14. Zhang, C.; Zhao, L.; Song, X.; Zhang, Q.; Zhang, X. Spatial-temporal coupling characteristics and interaction effects of economic resilience and people’s livelihoods and well-being: An analysis of 78 cities in the Yellow River Basin. Sustain. Cities Soc. 2024, 112, 105638. [Google Scholar] [CrossRef]
  15. Tang, J.; Zhao, P.; Gong, Z.; Zhao, H.; Huang, F. Resilience patterns of human mobility in response to extreme urban floods. Natl. Sci. Rev. 2023, 10, nwad097. [Google Scholar] [CrossRef]
  16. Lv, W.; Fan, W.; Wang, Z. How to enhance the resilience of domestic tourism? J. Hosp. Tour. Manag. 2024, 61, 165–177. [Google Scholar] [CrossRef]
  17. Wang, M.; Su, M.M.; Gan, C.; Yu, Z. A coordination analysis on tourism development and resident well-being in the Yangtze River Delta Urban Agglomeration, China. J. Clean. Prod. 2023, 421, 138361. [Google Scholar] [CrossRef]
  18. Zhang, X.; Guo, W.; Bashir, M.B. Inclusive green growth and development of the high-quality tourism industry in China: The dependence on imports. Sustain. Prod. Consum. 2023, 29, 57–78. [Google Scholar] [CrossRef]
  19. Zheng, X.; Yang, Z. Coordination or contradiction? The spatiotemporal relationship between ecological environment and tourism development within the tourism ecological security framework in China. Ecol. Indic. 2023, 157, 111247. [Google Scholar] [CrossRef]
  20. Li, S.; Sun, Y. Tourism development and residents’ well-being: Analysis of top ten tourist destinations using quantile-on-quantile approach. J. Destin. Mark. Manag. 2025, 36, 100977. [Google Scholar] [CrossRef]
  21. Yang, X.; Ran, G. Factors influencing the coupled and coordinated development of cities in the Yangtze River Economic Belt: A focus on carbon reduction, pollution control, greening, and growth. J. Environ. Manag. 2024, 370, 122499. [Google Scholar] [CrossRef]
  22. Chau, N.M.; Anh, D.N.C.; Trang, N.M.; Luong, B.V. Economic resilience and sustainable tourism development: Analyzing domestic visitors’ behaviors at religious attractions in Vietnam. In Proceedings of the 12th International Conference on Emerging Challenges: Sustainable Strategies in the Data-Driven Economy (ICECH 2024), Thanh Hoa, Vietnam, 1–2 November 2024. [Google Scholar] [CrossRef]
  23. Greiner, R. Improving the Net Benefits from Tourism for People Living in Remote Northern Australia. Sustainability 2010, 2, 2197–2218. [Google Scholar] [CrossRef]
  24. Lin, Y.; Peng, C.; Chen, P.; Zhang, M. Conflict or synergy? Analysis of economic-social-infrastructure-ecological resilience and their coupling coordination in the Yangtze River economic Belt, China. Ecol. Indic. 2023, 142, 109194. [Google Scholar] [CrossRef]
  25. Liu, M.; Lu, M.; Li, Z. Coupling coordination analysis on digital economy-tourism development-ecological environment. J. Clean. Prod. 2024, 470, 143320. [Google Scholar] [CrossRef]
  26. Fan, M.; Wang, Y.; Ye, S.; Wei, C.; Xue, Z. The Spatial Network Characteristics of the Coupling Coordination Degree Between Pollution and Carbon Reduction and HQD in the Yangtze River Economic Belt. Land 2024, 13, 2102. [Google Scholar] [CrossRef]
  27. Zhang, L. Influence of cultural heritage protection on high-quality economic development. Financ. Res. Lett. 2025, 76, 106932. [Google Scholar] [CrossRef]
  28. Machado, J.T.M.; de Andrés, M. Implications of offshore wind energy developments in coastal and maritime tourism and recreation areas: An analytical overview. Environ. Impact Assess. Rev. 2023, 99, 106999. [Google Scholar] [CrossRef]
  29. Shahzad, U.; Tiwari, S.; Si Mohammed, K.; Zenchenko, S. Asymmetric nexus between renewable energy, economic progress, and ecological issues: Testing the LCC hypothesis in the context of sustainability perspective. Gondwana Res. 2024, 129, 465–475. [Google Scholar] [CrossRef]
  30. KC, B.; Dhungana, A.; Dangi, T.B. Tourism and the sustainable development goals: Stakeholders’ perspectives from Nepal. Tour. Manag. Perspect. 2021, 38, 100822. [Google Scholar] [CrossRef]
  31. Pan, S.-Y.; Gao, M.; Kim, H.; Shah, K.J.; Pei, S.-L.; Chiang, P.-C. Advances and challenges in sustainable tourism toward a green economy. Sci. Total Environ. 2018, 635, 452–469. [Google Scholar] [CrossRef]
  32. Sun, Y.; Ding, W.; Yang, G. Green innovation efficiency of China’s tourism industry from the perspective of shared inputs: Dynamic evolution and combination improvement paths. Ecol. Indic. 2023, 138, 108824. [Google Scholar] [CrossRef]
  33. Zeng, H.; Chau, K.Y.; Waqas, M. Does green finance and renewable energy promote tourism for sustainable development: Empirical evidence from China. Renew. Energy 2023, 207, 660–671. [Google Scholar] [CrossRef]
  34. Wang, H.; Li, Y.; Liu, Y.; Qing, F.; Zhou, Y.; Chen, Y.; Fang, D. Study on the Influencing factors of urban ER in post epidemic Era—A case study of Kunming City. J. Urban Manag. 2021, 10, 255–264. [Google Scholar] [CrossRef]
  35. Zhai, X.; Sun, C.; Zou, W.; Hao, S. Spatiotemporal characteristic and evolution of China’s marine ER. Ocean. Coast. Manag. 2023, 238, 106562. [Google Scholar] [CrossRef]
  36. Wang, J.; Zhou, X. Measurement and synergistic evolution analysis of ER and green economic efficiency: Evidence from five major urban agglomerations, China. Appl. Geogr. 2024, 168, 103302. [Google Scholar] [CrossRef]
  37. Jiang, N.; Jiang, W.; Wang, Y.; Zhang, J. Impact of financial reform on urban resilience: Evidence from the financial reform pilot zones in China. Socio-Econ. Plan. Sci. 2024, 94, 101962. [Google Scholar] [CrossRef]
  38. Zhang, Y.; Li, Y.; Wei, X.; Yang, Y.; Liu, L.; Murphey, Y.L. Graph matching for knowledge graph alignment using edge-coloring propagation. Pattern Recognit. 2023, 144, 109851. [Google Scholar] [CrossRef]
  39. Vu, D.H.; Muttaqi, K.M.; Agalgaonkar, A.P. A variance inflation factor and backward elimination based robust regression model for forecasting monthly electricity demand using climatic variables. Appl. Energy 2015, 140, 385–394. [Google Scholar] [CrossRef]
  40. Dong, Q.; Zhong, K.; Liao, Y.; Xiong, R.; Wang, F.; Pang, M. Coupling coordination degree of environment, energy, and economic growth in resource-based provinces of China. Resour. Policy 2023, 81, 103308. [Google Scholar] [CrossRef]
  41. Wu, B.; Quan, Q.; Yang, S.; Dong, Y. A social-ecological coupling model for evaluating the human-water relationship in basins within the Budyko framework. J. Hydrol. 2023, 619, 129361. [Google Scholar] [CrossRef]
  42. Yu, T.; Zhang, Y.; Jia, S.; Cui, X. Spatio-temporal evolution and drivers of coupling coordination between digital infrastructure and inclusive green growth: Evidence from the Yangtze River economic belt. J. Environ. Manag. 2025, 376, 124416. [Google Scholar] [CrossRef]
  43. Yang, L.; Lin, Y.; Zhu, J.; Yang, K. Dynamic coupling coordination and spatial–temporal analysis of digital economy and carbon environment governance from provinces in China. Ecol. Indic. 2023, 156, 111091. [Google Scholar] [CrossRef]
  44. Kang, Y.; He, S.; Ni, T.; Cao, Z.; Wu, G. Temporal-spatial evolution and coupling analysis of water-energy-carbon nexus for crop production: A case study of Sichuan Province, China. Energy Nexus 2025, 20, 100542. [Google Scholar] [CrossRef]
  45. Gocer, O.; Boyacioglu, D.; Karahan, E.E.; Shrestha, P. Cultural tourism and rural community resilience: A framework and its application. J. Rural. Stud. 2024, 107, 103238. [Google Scholar] [CrossRef]
  46. Szromek, A.R.; Herman, K.; Naramski, M. Sustainable development of industrial heritage tourism—A case study of the Industrial Monuments Route in Poland. Tour. Manag. 2021, 83, 104252. [Google Scholar] [CrossRef]
Figure 1. Regional overview map of the Yangtze River Economic Belt (Review No. GS(2024)0650).
Sustainability 17 09657 g001
Figure 2. Mechanism of coupling ER and HQTD.
Sustainability 17 09657 g002
Figure 3. Computational process figure.
Sustainability 17 09657 g003
Figure 4. Classification of HQTD and ER CCD level interval.
Sustainability 17 09657 g004
Figure 5. Characteristics of ER development in the YREB (Review No. GS(2024)0650). (a) Spatial Distribution of Development Characteristics of the ER System in 2010; (b) Spatial Distribution of Development Characteristics of the ER System in 2016; (c) Spatial Distribution of Development Characteristics of the ER System in 2023; (d) Change in the Number of Levels of the ER System from 2010 to 2016; (e) Change in the Number of Levels of the ER System from 2016 to 2023; (f) Change in the Number of Levels of the ER System from 2010 to 2023.
Sustainability 17 09657 g005
Figure 6. Characteristics of HQTD in the YREB (Review No. GS(2024)0650). (a) Spatial Distribution of Development Characteristics of the HQTD System in 2010; (b) Spatial Distribution of Development Characteristics of the HQTD System in 2016; (c) Spatial Distribution of Development Characteristics of the HQTD System in 2023; (d) Change in the Number of Levels of the HQTD System from 2010 to 2016; (e) Change in the Number of Levels of the HQTD System from 2016 to 2023; (f) Change in the Number of Levels of the HQTD System from 2010 to 2023.
Sustainability 17 09657 g006
Figure 7. Characteristics of changes in the coupling coordination degree of the YREB (Review No. GS(2024)0650). (a) Spatial Distribution of Change Amplitude of Coupling Coordination Degree within the YREB from 2010–2016; (b) Spatial Distribution of Change Amplitude of Coupling Coordination Degree within the YREB from 2016–2013; (c) Spatial Distribution of Change Amplitude of Coupling Coordination Degree within the YREB from 2010–2023; (d) Changes in the Coupling Coordination Degree of the Overall Yangtze River Economic Belt and Its Central, Eastern, and Western Regions; (e) Changes in the Coupling Coordination Degree of the Eastern of Yangtze River Economic Belt; (f) Changes in the Coupling Coordination Degree of the Central of Yangtze River Economic Belt; (g) Changes in the Coupling Coordination Degree of the Western of Yangtze River Economic Belt.
Sustainability 17 09657 g007
Figure 8. The spatial pattern of coupling coordination degree (Review No. GS(2024)0650). (a) The spatial pattern of coupling coordination degree in 2010; (b) The spatial pattern of coupling coordination degree in 2016; (c) The spatial pattern of coupling coordination degree in 2023.
Sustainability 17 09657 g008
Figure 9. Intra- and inter-regional differences in the YREB.
Sustainability 17 09657 g009
Figure 10. Global Spatial Autocorrelation.
Sustainability 17 09657 g010
Figure 11. Kernel density map of the coupling coordination degree of the YREB.
Sustainability 17 09657 g011
Figure 12. Degree of Impact Coordination and Integrated Coupling Coordination.
Sustainability 17 09657 g012
Table 1. Evaluation system of indicators for ER in the YREB.
Target LevelStandardized LayerWeightsFactor LayerDefinitionWeightsCausality
ERResilience and Recovery0.1162GDP per capita/billion dollarsGross Regional Product divided by the total population at the end of the year, measuring the level of economic development0.0618+
Urban registered unemployment rate/%The proportion of registered urban unemployed population to the urban employed population, measuring employment stability0.0010-
GDP growth rate/%The percentage growth of GDP in the current year compared with the previous year, measuring the driving force of economic growth0.0047+
Foreign trade dependence/%The proportion of total import and export volume to GDP, measuring the exposure degree of export-oriented economic risks0.0024-
Disposable income per capita/$Disposable income of residents divided by the population, measuring residents’ purchasing power and the foundation of economic resilience0.0406+
Adaptive and restructuring0.5939Level of financial self-sufficiency/%The proportion of local fiscal general budget revenue to expenditure, measuring fiscal autonomy0.0315+
Total sales of social retail goods/million dollarsTotal retail sales of social consumer goods, measuring market consumption vitality and economic stability0.1375+
Investment in fixed assets/million dollarsTotal fixed asset investment of the whole society, measuring economic growth potential and risk resistance capacity0.0893+
Number of health facility beds per capita/(beds per 10,000 persons)Number of beds in health institutions divided by the population, measuring public service and crisis response capacity0.1223+
RMB deposits in financial institutions/$10,000Balance of deposits in local and foreign currencies of financial institutions, measuring regional capital reserves and risk-resistant buffer capacity0.2174+
Innovative transformation0.2899Number of patent applications/pieceAnnual number of authorized patent applications, measuring regional innovation capacity and the level of technological progress0.2252+
Urbanization rate/%The proportion of urban population to the total population, measuring regional urbanization and the level of economic structure transformation0.0147+
Internet penetration rate/%The proportion of Internet users to the total population, measuring the development level of the digital economy0.0433+
Degree of advanced industrial structure/%The proportion of the output value of the tertiary industry to GDP, measuring the level of industrial structure optimization0.0084+
Table 2. Evaluation system of indicators for HQTD in the YREB.
Target LevelStandardized LayerWeightsFactor LayerDefinitionWeightsCausality
HQTDInnovative development0.2501Tourism patent authorizations/unitNumber of authorized patents in tourism-related industries (e.g., smart tourism, green tourism technology), measuring tourism innovation capacity0.0675+
Annual large-scale tourism Festivals and exhibitions/eventAnnual number of national/provincial tourism festivals and exhibition activities, measuring tourism industry vitality and brand influence0.0238+
Online booking coverage for 4A-rated and above scenic areas/%The proportion of 4A-level and above scenic spots that support online booking, measuring the level of tourism digital services0.1045+
Activity level of tourism-related digital platformsComprehensive index of tourism APP downloads and online reviews, etc., measuring the penetration level of tourism digitalization0.0543+
Coordinated development0.0800Tourism revenue as a percentage of GDP/%The proportion of total tourism revenue to the gross regional product, measuring the contribution of the tourism economy0.0155+
Tourism revenue as a percentage of tertiary industry/%The proportion of total tourism revenue to the output value of the tertiary industry, measuring the driving effect of tourism on the service industry0.0155+
Ratio of domestic to inbound tourist visitsThe ratio of domestic tourist arrivals to inbound tourist arrivals, measuring the internationalization level of the tourism market0.0057-
Rural-urban tourism revenue ratioThe ratio of urban tourism revenue to rural tourism revenue, measuring the urban-rural balance of tourism development0.0037-
Ratio of tourism beds to annual visitor volumeThe ratio of the number of hotel rooms/beds to the total annual number of tourists received, measuring the matching degree of tourism reception capacity0.009+
Spatial aggregation of tourism industryGeographic concentration index of tourism enterprises (e.g., EG index), measuring the level of tourism industry clustering0.0306+
Green development0.4198Park green space per capita/m2Total area of park green space divided by the population, measuring the quality of the tourism ecological environment0.0486+
Proportion of nature reserves and scenic areas to total land area/%The proportion of ecologically protected area to the administrative area, measuring the sustainable utilization level of tourism resources0.0445+
Ratio of days with good air quality/%The proportion of days with good air quality in a year, measuring the support capacity of the ecological environment for tourism0.1575+
Municipal wastewater treatment rate/%The proportion of urban sewage treatment volume to the total sewage discharge, measuring the environmental protection level of tourism infrastructure0.0846+
Non-hazardous treatment rate of domestic waste/%The proportion of harmless treatment of domestic waste to the total amount, measuring the environmental governance capacity of tourism destinations0.0846+
Open development0.1000Inbound tourism revenue as a percentage of total tourism revenue/%The proportion of inbound tourism revenue to total tourism revenue, measuring the internationalization level of tourism0.0274+
International tourism foreign exchange earnings/US$ millionForeign exchange income generated by inbound tourists’ consumption in the country, measuring the international market competitiveness of tourism0.0157+
Number of international air routes/routesThe number of regular international routes connecting domestic and foreign cities, measuring the convenience and openness of tourism transportation0.0467+
Number of star-rated hotels or restaurants/hotelsTotal number of hotels from five-star to one-star, measuring the quality of tourism reception services and the level of facilities0.0102+
Shared development0.1501Number of tourism industry employees/10,000 peopleNumber of direct tourism employees, measuring the driving effect of the tourism industry on employment0.0249+
Tourism revenue as a percentage of urban and rural residents’ income/%The proportion of total tourism revenue to the disposable income of urban and rural residents, measuring the contribution of tourism to residents’ income0.0402+
Investment in fixed assets in tourism/million dollarsInvestment in fixed assets related to tourism, such as scenic spots, hotels and transportation, measuring the development potential of the tourism industry0.0143+
Road mileage/kmTotal mileage of graded highways in the country, measuring the accessibility of tourism transportation0.0092+
Citizen satisfaction with local tourism environment (%)Citizens’ satisfaction score (1–5 points) with tourism infrastructure, service quality and ecological environment0.0615+
Disclaimer/Publisher’s Note: The statements, opinions and data contained in all publications are solely those of the individual author(s) and contributor(s) and not of MDPI and/or the editor(s). MDPI and/or the editor(s) disclaim responsibility for any injury to people or property resulting from any ideas, methods, instructions or products referred to in the content.