Abstract
Disaster management requires the development of effective technologies for managing both pre-and post-disaster processes. Therefore, utilizing effective tools and techniques to mitigate the disaster risks or lower the adversarial impacts is essential. Over the last decade, digital twin (DT) applications have found a wider implementation area for varying purposes, but most importantly, they are utilized for simulating disaster impacts. This study aims to develop an open-source digital twin (DT) framework for earthquake disaster management in the Cayirova district of Kocaeli, Türkiye, one of the country’s most seismically active regions. The primary objective is to enhance local resilience by integrating multi-source data into a unified digital environment that supports risk assessment, response planning, and recovery coordination. The digital model developed using QGIS (3.40.9 Bratislava), Autodesk InfraWorks 2025 software for DT modeling integrates various data types, including geospatial, environmental, transportation, utility, and demographic data. As a result, the developed model is expected to be used as a digital database for disaster management, storing both geospatial and building data in a unified structure. The developed model also aims to contribute to sustainable practices in cities, where disaster risks are particularly critical. In this respect, the developed model is expected to create sustainable logistics chains and sustainable targets aiming to reduce the number of people affected by disasters, reducing the direct economic losses caused by disasters. In this framework, the developed model is expected to further assess seismic risk and mitigate risks with DTs. These capabilities enable the project to establish an open-source district-level DT system implemented for the first time in Cayirova, provide an alternative disaster model focused on region-specific earthquakes, and integrate 2D/3D assets into an operational, ready-to-respond digital database. In terms of practical importance, the model provides a digital database (digital backup) that can be used in emergencies, helping decision-makers make faster, data-driven decisions. The significance of this study lies in bridging the gap between urban digitalization and disaster resilience by providing a scalable and transparent tool for local governments. Ultimately, the developed DT contributes to sustainable urban management, enhancing preparedness, adaptive capacity, and post-disaster recovery efficiency.
1. Introduction
Urban-industrial regions with high population density, such as Cayirova, Kocaeli, the area of interest (AoI) of this research (Figure 1), face a myriad of disaster management challenges, primarily stemming from the interplay of rapid urbanization, industrial concentration, and the inherent vulnerabilities of densely populated areas. These challenges are exacerbated by the increasing frequency and intensity of natural and human-made disasters, which threaten the safety, sustainability, and economic viability of these regions. Effective disaster management strategies must therefore prioritize not only preparedness and response but also resilience building, community engagement, and the integration of technology to enhance situational awareness and resource allocation during crises.
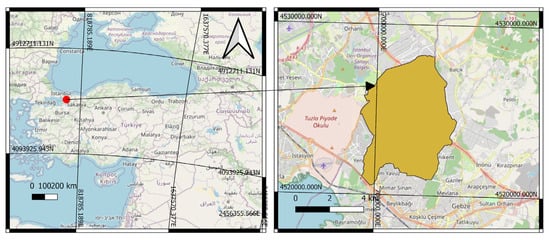
Figure 1.
The location of AoI with respect to Turkey.
The integration of sustainability principles into disaster management has become a global imperative that is interconnected with the 2015 Paris Agreement and the Sendai Framework for Disaster Risk Reduction (SFDRR). As urban areas grow and face increasing risks from natural and anthropogenic hazards, it is crucial that the tools and systems developed to manage these risks are aligned with broader global sustainability agendas [1]. Sustainable Development Goals (SDGs) are 17 global goals adopted by the United Nations (UN) in 2015 as part of the 2030 Agenda for Sustainable Development [2]. These goals aim to address major global challenges, including poverty, inequality, climate change, environmental degradation, peace, and justice. The implementation of the SDGs in disaster management is a complex endeavor that intersects with various domains, including risk reduction, recovery, resilience building, and the integration of practical solutions and theoretical frameworks.
The existing disaster management frameworks in many urban-industrial regions are often inadequate to address the scale and complexity of the challenges they face. This is evident in the shortcomings of risk assessment, resource allocation, and information sharing mechanisms, which are critical components of effective disaster management [3]. For example, the lack of integrated risk assessment frameworks in industrial cities often leads to a fragmented approach to disaster management, where individual plants or facilities are addressed in isolation, rather than considering the broader industrial ecosystem [4]. This fragmented approach not only limits the effectiveness of disaster response but also increases the potential for cascading failures and amplified impacts during a disaster event.
The effective management of disasters in urban-industrial regions also requires the integration of technological innovations and robust governance structures. Advanced geospatial data processing and hydrological simulation models offer valuable tools for risk assessment and mitigation. However, the implementation of these technologies is often hindered by inadequate institutional capacity, lack of coordination among stakeholders, and insufficient legal frameworks. The need for collaborative governance models that integrate technological innovation with cross-sectoral and multilevel approaches is critical to addressing the complexity of disaster risks in urban-industrial regions.
Industrial cities often host a variety of hazardous materials and processes, which can complicate disaster response. For instance, the release of hazardous materials (HAZMAT) in industrial areas can lead to severe consequences, including environmental contamination and health risks for the population. Research has shown that inadequate planning for HAZMAT incidents can result in prolonged evacuations and increased exposure to harmful substances [5]. Furthermore, the proximity of industrial facilities to residential areas amplifies the risk of cascading disasters, where an initial incident triggers secondary emergencies, such as fires or explosions [6].
Effective disaster management requires comprehensive risk assessment and preparedness measures. However, many industrial cities lack robust frameworks for identifying and mitigating potential risks. Studies have highlighted that inadequate risk assessment can lead to insufficient allocation of resources, poor coordination among stakeholders, and a lack of public awareness, ultimately hindering effective disaster response [3,7]. For example, in multi-hazard environments, the failure to account for interdependencies between critical infrastructures can result in unanticipated consequences during disasters.
The integration of advanced technologies, such as Geographic Information Systems (GIS), Internet of Things (IoT), and big data analytics, can significantly enhance disaster management capabilities. However, many industrial cities have not fully leveraged these technologies to improve their disaster response strategies. Research has demonstrated that the use of GIS and Mapping Technologies can simulate and visualize disaster scenarios, enabling more informed decision making [5]. Similarly, IoT and big data analytics can provide real-time insights and improve the efficiency of emergency response systems [8,9].
Community engagement and participation are critical components of effective disaster management. However, many industrial cities fail to involve local communities in disaster planning and response efforts. Studies have shown that community-based approaches can enhance transparency, communication, and trust between local governments and residents, leading to more effective disaster relief management. The absence of such engagement can result in confusion, mistrust, and inadequate preparedness among the population, further complicating disaster response efforts.
One of the primary challenges in implementing SDGs in disaster management is the prevalence of top-down approaches, which often marginalize local stakeholders. DRM frameworks, while well-intentioned, frequently overlook the critical role of community engagement, leading to a disconnect between global agendas and local realities. This disengagement can result in ineffective policies that fail to address the specific needs of vulnerable populations.
The lack of policy coherence and coordination is another significant challenge. The paper, focusing on Sri Lanka, reveals that fragmented approaches and inadequate integration of climate change adaptation (CCA), disaster risk reduction (DRR), and SDGs hinder effective implementation [10]. This fragmentation is exacerbated by limited resources, poor monitoring, and evaluation mechanisms, which further undermine the attainment of SDGs. Community involvement is crucial for the successful implementation of SDGs in disaster management. However, the paper also points out that local implementations often lack focus, leading to inadequate community participation. This limited involvement can result in policies that do not resonate with local needs, thereby reducing their effectiveness.
The accuracy and validity of data used in SDG and DRM frameworks are another concern. This challenge is further compounded by the lack of robust monitoring and evaluation frameworks.
While digital twin (DT) technologies have recently emerged as transformative tools for integrating real-time data, simulation, and decision support in urban management, their application within disaster management remains uneven and geographically concentrated [11]. Current DT research has predominantly focused on large, data-rich metropolitan regions such as London, Singapore, and Shanghai, where extensive digital infrastructures and institutional capacities facilitate comprehensive implementation [12]. However, small- and medium-sized urban-industrial areas—characterized by limited data availability, fragmented governance structures, and high exposure to cascading hazards—are significantly underrepresented in the literature [13]. Moreover, most DT studies emphasize conceptual architectures or visualization platforms rather than operational, scenario-based frameworks directly linked to disaster risk management workflows. This research addresses these gaps by developing a scalable, multi-dimensional DT framework tailored for the small-to-medium-sized industrial city of Cayirova (Kocaeli). Through the integration of City Information Modeling (CIM), seismic risk modeling, and sustainability-oriented decision support, the study demonstrates the adaptability of DT methodologies beyond megacity contexts and contributes to advancing equitable and resilient urban transformation.
The DT model, as an emerging technological innovation, offers significant potential to advance multiple SDGs, particularly in the domains of urban resilience, infrastructure development, climate adaptation, and international cooperation. By integrating real-time data, simulation capabilities, and scenario-based planning tools, DTs serve as dynamic platforms for improving disaster risk management and supporting sustainable urban development.
The proposed digital twin (DT) framework directly aligns with several United Nations Sustainable Development Goals (SDGs), particularly SDG 11 (Sustainable Cities and Communities), SDG 13 (Climate Action), SDG 9 (Industry, Innovation, and Infrastructure), and SDG 17 (Partnerships for the Goals). In relation to Target 11.5 of SDG 11, which calls for a reduction in disaster-related mortality and vulnerability, the DT enables a proactive and inclusive approach to urban risk management by integrating seismic, structural, and socio-economic data into real-time simulation and impact assessment. This functionality supports early warning, rapid response, and the prioritization of assistance for marginalized populations. Furthermore, by enabling scenario-based testing of policy alternatives in accordance with Target 11.B, the framework advances data-driven and adaptive urban governance while fostering inter-institutional collaboration and transparency.
With respect to Target 13.1 of SDG 13, which emphasizes resilience to climate-related hazards, the DT framework provides a data-informed basis for multi-hazard risk analysis. Through the incorporation of historical records and future projections, it supports the simulation of climate-induced events—such as extreme rainfall or heatwaves—thus strengthening local adaptive capacity and long-term climate resilience planning. In alignment with Target 9.1 of SDG 9, the framework contributes to the design and evaluation of resilient infrastructure systems by simulating disaster scenarios and assessing system-level interdependencies. The integration of sensor data, geospatial information, and structural performance models exemplifies the role of DTs as enabling technologies for sustainable and intelligent infrastructure.
Finally, the framework contributes to Target 17.6 of SDG 17 by promoting open science, reproducibility, and international cooperation. Its open-source design and use of interoperable data standards encourage knowledge sharing and capacity building across research institutions, municipalities, and civil organizations. This collaborative orientation reinforces the role of DTs as catalysts for global learning and policy transfer in disaster resilience.
While the framework demonstrates clear potential for operationalizing SDG targets, several contextual limitations must be acknowledged. The accuracy and reliability of model outputs depend heavily on the quality and temporal resolution of available data, which can vary substantially across municipalities. In addition, dependence on cloud-based infrastructures introduces data security, cost, and continuity challenges during large-scale emergencies. Finally, while the model facilitates scenario-based planning, the quantification of its long-term social or environmental impact remains a subject for future research. Addressing these constraints will require stronger data governance mechanisms, enhanced interoperability with international standards, and the integration of artificial intelligence to support adaptive and autonomous decision making.
Table 1 presents the contribution of the DT model to the Sustainable Development Goals.

Table 1.
Contribution of the DT Model to the Sustainable Development Goals.
In this regard, the study aims to design and present an open-source DT for earthquake-focused disaster management in the Cayirova district of Kocaeli province, Turkey; demonstrate how the DT can be used to support seismic risk assessment and risk reduction planning; and align decision making processes with relevant SDGs.
The remainder of this paper is organized as follows: Section 2 provides a review of the relevant literature on disaster management frameworks, DTs, and their hardware requirements. Section 3 presents the design of the proposed DT system, including the local workstation, cloud infrastructure, and sensor network architecture, and also outlines the operating instructions and integration workflows necessary for system reliability. Section 4 discusses the implications of the findings for sustainable disaster management and resilience planning. Finally, Section 5 concludes the paper by highlighting the contributions, limitations, and future directions of the proposed approach.
2. Materials and Methods
2.1. Research Background
In the literature, a disaster is defined as natural, technological, or human-induced event that causes physical, economic, and social losses for the whole or certain segments of the society, halts or interrupts normal life and human activities, and for which the capacity of the affected society to cope is not sufficient; in other words, it is not the event itself, but its consequence [14]. Disaster refers to a sudden incident, such as an accident or natural disaster, which leads to significant damage or loss of life [15]. A disaster is also described as an occurrence that causes major damage and loss to human property or people themselves [16]. Disasters are described as threats to life, welfare, material assets, and the environment that arise from the excessive effects of either natural processes or technology [14]. Disasters are classified as natural and human-made [17]. Natural disasters are divided into two distinct categories: (1) slow-onset disasters and (2) rapid-onset disasters [14]. Slow-onset disasters include severe cold, drought, famine, etc., while rapid-onset disasters include earthquakes, floods, landslides, avalanches, storms, tornadoes, volcanoes, fires, etc. [14,17]. Nuclear, biological, and chemical accidents, transportation accidents, industrial accidents, accidents caused by overcrowding, immigrants and displaced persons, etc., can be given as examples of man-made disasters [17].
Disaster management is a collective process undertaken by society to prevent disasters, reduce their impacts, and respond effectively when they occur, with the ultimate goal of creating safer living environments for affected communities [14]. It is an interdisciplinary field that brings together practitioners and academics, volunteers and professionals, NGOs, government agencies, and international organizations to coordinate efforts in saving lives and reducing losses under challenging conditions [18]. The primary aim is to minimize the social and physical impacts of large-scale events by reducing loss of life and damage to infrastructure and property [19,20,21]. Both natural and man-made disasters require timely assistance and mitigation measures to protect populations [22]. Key objectives include preparedness, rapid response and recovery, efficient resource allocation, timely repair of damage, and minimizing negative impacts on society [23]. Disaster management, therefore, encompasses two sets of activities: mitigation and preparedness before a disaster, and response and recovery afterward [14]. These four phases—mitigation, preparedness, response, and recovery—constitute the widely recognized disaster management cycle [22,23,24,25].
The first two phases take place before the disaster occurs, while the last two phases take place after the disaster [26]. The mitigation phase includes all actions designed to reduce, minimize, or eliminate the likelihood, impact, and consequences of future hazards, disasters, and emergencies with long-term benefits. Preparedness is a stage that gets involved when an emergency or disaster is expected or imminent, where measures are taken to mitigate the effects of disasters and include providing the necessary tools to increase the chances of survival and minimize the financial losses of those who may be affected by or assist those affected by a disaster [23,25,26]. The response phase encompasses emergency actions taken both during and after the impact of a disaster to mitigate or remove the effects of disasters that have already happened or are about to happen and to prevent further suffering and financial losses [25,26]. Recovery is a process that involves repairing damage, restoring services, rebuilding facilities, and restoring the lives of victims to a normal state to return to a normal or better level of functioning after the occurrence of a disaster and the impact of its consequences [23,25,26].
Over the recent years, digital tools have found a wide range of applications in disaster management studies. Among these tools, DTs offer various advantages. A DT is a software model representing a real-world object in its specific context [27]. DTs are intelligent and constantly developing virtual or digital copies or representations of a real-world physical object, product, or process [28,29]. DT, also recognized as digital vision and digital mapping, is an advanced digital transformation technology that combines multiple physical, scale, and disciplinary features [30,31]. A DT is a constantly changing, self-improving virtual model or simulation of a real-world subject or object that uses both real-time and historical data to represent the exact situation of its physical twin at any point in time [32].
The idea of DT technology was first articulated by David Gelernter in 1991 with the publication of his book Mirror Worlds, and the idea was called ‘Mirror Worlds’ [32]. The concept of DT was later proposed in 2002 by Professor Michael W. Grieves in his Product Lifecycle Management course at the University of Michigan, by presenting a virtual prototype of a physical product, and the concept was named ‘Mirror Spaces Model’ [32,33,34,35]. In 2006, the name ‘Mirror Spaces Model’ was changed to ‘Information Mirroring Model’ and the term ‘DT’ was first used in the draft version of NASA’s technological road map in 2010 [32].
The studies reveal that DT was first applied in the aviation and aerospace industry and the military [28,32,33,35]. Furthermore, Crespi et al. [27] stated that DT was designed for manufactured items such as airplanes, automobiles, industrial facilities, and urban environments.
DT is involved in intelligent transportation, agriculture, education, industrial production, metaverse, construction and construction of smart cities, and energy due to the ongoing development of new information technologies, including the industrial internet, internet of things, cloud computing, big data, artificial intelligence, and extended reality [28,30,32,33,36].
Some studies state that the DT model has three main components: (1) the physical entity/space, (2) the virtual entity/space, and (3) the connection mechanism/data and software [29,30,32]. Wu et al. [31] stated that the data composition of DT encompasses product design, process, production, service, and retirement and scrap data. Beyond its structure, the DT plays key roles: (1) simulating, monitoring, diagnosing, predicting, and controlling how products form and behave in the real world, (2) fostering coordination across all stages of a product’s life cycle and production innovation, and (3) creating a data foundation for digital product records, quality tracking, and ongoing product development improvement [34].
DT intends to increase competitiveness, productivity, and efficiency, as well as ensure the access of all users and stakeholders to the DT model [37,38].
The previous research revealed that DT technology has many advantages. Tao et al. [36] indicated that benefits include increased visibility, reduced energy consumption, increased user engagement, reduced time-to-market, maintenance of optimal operations, and integration of information technologies. Singh et al. [32] also stated that the benefits of DT include rapid prototyping and product redesign, cost-effectiveness, anticipation of problems and system planning, optimization of solutions and improved maintenance, accessibility, safer than its physical counterpart, reduced waste, documentation, communication, and training opportunities. Additionally, DT can connect physical and virtual worlds in real time, which enables a more accurate and comprehensive assessment of unforeseen and unpredictable situations [32].
Some of the studies mention the benefits of DT in the construction industry. Kineber et al. [28] stated that DTs can optimize design, simulate the construction process, detect potential problems, monitor real-time performance throughout the building’s life cycle, make better decisions, and make preventive predictions. The added benefits are that construction sites using DTs are more efficient, produce higher quality work, and have higher levels of health and safety performance. DT technologies improve the performance and sustainability of construction projects and the safety of construction workers [29].
In the literature, the advantages as well as the challenges of DT are mentioned. Tao et al. [36] pointed out that technology and infrastructure, standards and specifications, the cognitive and technical level of people, cost control and management, support tools, intellectual property rights, cybersecurity, and insufficient development of DT are among the challenges of DT. Singh et al. [32] also noted that the novelty of technology, problems with data, lack of standards and regulations, time and cost, and life-cycle incompatibility are among the challenges.
DT tools and platforms can be grouped into four categories: modeling, simulation, operation, and interaction [31]. The modeling includes SolidWorks, 3D Studio Max, and AutoCAD. The simulation involves Simulink, Twin Builder, Azure, 3D Experience, and Teamcenter. The operation contains Plant Simulation, Eclipse Ditto, Watson IoT, and IBM. The interaction comprises Unity 3D and Predix Platform.
Recent debates have intensified about the distinction between a Building Information Model (BIM) and DT. BIM is a digital representation of the physical and functional characteristics of a building and helps to manage the design, delivery, construction, maintenance, and operation processes [39,40]. Tomek and Matějka [41] defined BIM as a contemporary method of construction management that enables users to develop multidimensional, object-based parametric models as a tool for managing construction projects for their whole life cycle. Toprak and Demirkesen [42] aimed to summarize the fundamental concepts of BIM, provide a comparative assessment using examples from geotechnical and infrastructure projects, and develop recommendations regarding potential integrations with software. The methodology involved a literature review, software comparison, case study analysis, and a mandatory screening. The results showed that BIM provides time/cost savings, improved coordination and safety; strengthens nD lifecycle management; accelerates the adoption of BIM through regulatory requirements; and facilitates decision support, asset management, and visualization through GIS/Lean integrations and IFC-based multi-scale models.
Beyond BIM, DT, a dynamic and interactive model, entails digitizing a physical asset, like a building or infrastructure, and using analytics and real-time data to give information on its maintenance requirements, potential problems, and performance, and updating itself [43]. Deng et al. [44] introduced a five-tier ladder taxonomy that illustrates the transformation from BIM to DT. BIM has rather evolved from static BIM to autonomous DT, where this evolvement is shown on Figure 2.
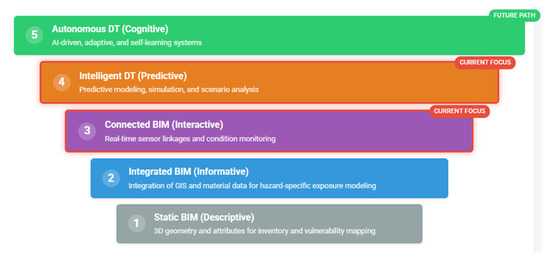
Figure 2.
The transformation from BIM to DT.
Ford and Wolf [45] proposed and tested a conceptual Smart City Model based on Digital Twins (SCDT) for disaster management. The researchers emphasized that DT should include images that reflect community characteristics and component interactions and encompass multiple computer simulation models that combine different images and data to improve disaster management decisions. Furthermore, two threats (integration and fatigue risks) were identified that could be mitigated by focusing on disaster management during the development of SCDT. Fan et al. [46] presented the Disaster City Digital Twin as a unifying paradigm for the integration of different research streams related to AI in disasters and crisis informatics. The DT paradigm consists of four main components: (1) multi-data sensing for data collection, (2) data integration and analytics, (3) multi-actor game-theoretic decision making, and (4) dynamic network analysis, which together enhance disaster response coordination and emergency management effectiveness.
Ariyachandra and Wedawatta [47] aimed to reveal the evolution of the Digital Twin–Smart City (DTSC) approach in disaster risk management, map its applications and benefit/obstacle areas in the disaster life cycle, and proposed a future research agenda. As a method, 72 articles were analyzed in a systematic search conducted in Web of Science and Scopus between 2011 and 2021 using keywords and filtering. The findings indicated that DTSC significantly improved early warning, situational awareness, resource allocation, and decision support with its core technological components; but data quality/standards and sharing, regulation-privacy/fairness, multi-stakeholder coordination, IT/communication infrastructure resilience, and institutional/social capacity deficiencies limited scalability. Therefore, real-time integration, ethical/privacy compliance, cost-effectiveness impact measurement, and field validation in different contexts were identified as priority research gaps.
Lee et al. [48] conducted a three-stage (DT application, classification of underground utility tunnel database, and algorithm application) study aimed at creating and implementing scenarios for identifying alterations in spatial entities, intending to forecast potential disasters and the growth of underground utility tunnels. Yu and He [49] presented a scientific notion that the construction of Intelligent Disaster Prevention and Mitigation for Infrastructure (IDPMI) is guided by the DT. The researchers examined how IDPMI is implemented under DT standards and analyzed the progress and challenges related to each technology. The study emphasized that DT-related technology is being developed through smart design, construction, maintenance, and disaster management, and outlined a five-layer framework (data, object, technology, connection, and service) for DT-IPDMI’s future development.
Yun et al. [50] proposed a DT software architecture that operates using similarity-based hybrid modeling for reliable disaster management systems. Using real 2016 North American forest fires and multi-channel environmental data as a case study, the context, dataset, and scenarios were defined. The physics-based, data-driven, and proposed hybrid models were run under equal conditions and compared in the same scenarios. The hybrid model was significantly more accurate than the physics-based approach across all climate/scenario classes, and produced lower error compared to the purely data-driven approach. Furthermore, similarity-based training data selection reduced error compared to random selection and provided more stable performance in data scarcity.
Kamari and Ham [51] presented a new vision-based digital twinning and threat evaluation framework for disaster (hurricane) preparedness at construction sites. The study identified potential wind-borne debris at 2D and 3D levels using visual data obtained from construction sites and assessed the risks using kinetic energy analysis and site-based heat maps. Lee et al. [52] focused on developing a methodology for implementing a DT of an underground utility tunnel, susceptible to disasters and accidents, and validating their methodology through real implementation. This study provided a step-by-step process to create the DT technology by integrating the three main layers: data acquisition (infrastructure and sensor DTs), digital modeling (BIM, CityGML, 3D grid), and service (disaster detection, prediction, and asset management).
Vuoto et al. [43] provided an overview of the DT idea in the field of architecture, engineering, construction, and management, and suggested a prototype of the DT paradigm aimed at protecting the structural integrity of heritage structures. Based on the principles of the Venice Charter, the study emphasized real-time monitoring, minimal intervention, and rapid disaster response supported by digital technologies such as IoT, 3D scanning, robotics, BIM, and AI.
In summary, the literature shows that DT applications in disaster management are becoming widespread in various fields, from smart cities to manufacturing, infrastructure, and cultural heritage preservation [27]. Common technologies such as IoT, sensors, 3D scanning, BIM, and artificial intelligence are being used; however, the real challenge lies in processing digital data through automated processes and converting it into actionable information. This emphasizes that DTs are not merely monitoring and prediction tools but also provide a strategic and holistic framework that enhances safety and resilience and improves decision making processes.
2.2. Research Method
This study adopts a case study methodology supported by a mixed-methods approach, combining spatial data analysis, simulation modeling, and qualitative assessment. The research design focuses on the development and implementation of an open-source digital twin model tailored for disaster management and sustainability evaluation in the Cayirova region of Turkey. The methodological framework is structured around three core components: data-driven modeling, disaster scenario simulation, and sustainability evaluation. This framework is operationalized through the development of a DT model that replicates the physical and social realities of the Cayirova urban environment. The study’s design allows for both qualitative and quantitative assessments of disaster risks and response strategies, providing a comprehensive basis for sustainable urban planning and policy development.
2.2.1. Hardware Selection
The hardware configuration for this study was carefully selected to balance computational performance, cost-effectiveness, energy efficiency, and scalability. Given the dual nature of the project—requiring both local development and remote accessibility—a hybrid hardware approach was adopted (Figure 3). This comprises a high-performance personal workstation for model development, simulation, and data processing, and a cloud-based server architecture to support real-time access, scalability, and public demonstrations of the DT system.
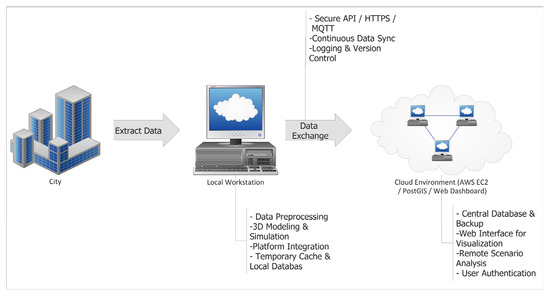
Figure 3.
Hybrid Approach of the system.
The hybrid setup enables seamless integration between local and cloud environments. IoT sensors collect seismic, structural, environmental, and energy data, which are transmitted via LoRaWAN, Wi-Fi/5G, and MQTT protocols for preprocessing and simulation on the local workstation. The processed data are then synchronized with the cloud environment, where a PostGIS-based server hosted on AWS/DigitalOcean handles data storage, scenario analysis, and visualization through web dashboards and risk maps. This configuration supports multi-user access, remote monitoring, and efficient disaster information sharing through municipal and emergency management systems.
The local workstation, equipped with an AMD Ryzen 9 7950X CPU, NVIDIA RTX 4070 Ti GPU, 64 GB DDR5 RAM, and a 2 TB NVMe SSD, provides sufficient computing capacity for large-scale 3D modeling, spatial analysis, and high-fidelity simulation tasks. The cloud server, provisioned with 8 vCPUs, 32 GB RAM, and 1 TB SSD, offers dynamic scalability, remote accessibility, and off-site redundancy. Together, these components ensure stable real-time performance for digital twin operations and provide a flexible foundation for future extensions, including live IoT data integration and AI-driven risk assessment.
The hardware and cloud configurations were selected to ensure stable and efficient real-time performance during DT operations. The local workstation enables high-fidelity simulation and rendering in Unreal Engine, while the AWS-based PostGIS architecture supports seamless spatial data storage, query processing, and synchronization between local and cloud environments. This infrastructure, therefore, meets the operational requirements of the proposed framework without necessitating external high-performance computing resources.
2.2.2. Data Integration and Processing Pipeline
The integration workflow renders heterogeneous inputs interoperable at the building level, which serves as the anchor entity for exposure and risk estimation. Five input families are ingested—vector, raster, 3D, point-cloud, and tabular/demographic—and processed through a staged PostGIS schema (staging → curated → published). All spatial data are harmonized to a common reference system (UTM Zone 35N, WGS 84), units are standardized (length in meters, area in square meters), and timestamps are retained to support temporal auditing and refresh.
Vector layers (building footprints, road centerlines, utilities, administrative boundaries, land use) undergo geometry validation to remove self-intersections and slivers, topology correction to enforce closed rings and planarity where required, and attribute enrichment from authoritative registries. Raster layers (DEM/DTM, satellite imagery, orthophotos, land-cover) are georeferenced, resampled to a project baseline resolution, and tiled for efficient retrieval. Point clouds (LiDAR and photogrammetric) are filtered, ground/non-ground classified, and surface models are derived to reconcile elevation with footprints. Three-dimensional city objects are converted to consistent formats and LoD conventions, where available (e.g., CityGML/CityJSON), semantics are preserved and mapped to the project data dictionary (Figure 4).
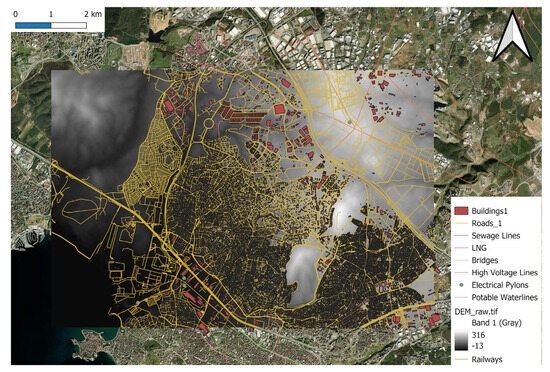
Figure 4.
Geospatial Data types employed in the DT creation.
Building inventories from municipal sources are normalized to controlled vocabularies for typology, lateral system, material, and occupancy; year-built and height attributes are range-checked and converted to canonical units. A stable identifier service issues or reconciles a Building_ID, and cross-references to parcel and address registries are maintained (Parcel_ID, Address_ID) to support multi-source joins and longitudinal updates.
Census and household statistics are aligned to a single reference year, variable definitions are harmonized, and metadata about the collection method and uncertainty are retained. To permit building-level inference while preserving official totals, areal units are pre-indexed with geometry hashes and linked to administrative hierarchies.
Integration proceeds in two steps. First, structural tables are joined to footprints by Building_ID; when absent, a spatial key is created using centroid-in-polygon with a small tolerance, falling back to nearest-neighbor along the street axis, with match confidence recorded. Many-to-one cases (e.g., multi-entrance buildings) are resolved by rules based on area and entrance counts; one-to-many cases (e.g., multi-parcel buildings) are retained via a bridge table to avoid information loss. Second, demographic variables are disaggregated from census units to buildings using population-weighted areal interpolation refined asymmetrically by floorspace and declared occupancy. Re-aggregation of building-level estimates to census boundaries reproduces official marginals within acceptable error, ensuring statistical coherence across scales.
Automated range and domain checks guard against implausible values (e.g., negative height, construction year outside plausible bounds). Referential integrity is enforced across entity tables (buildings–parcels–blocks), and cross-layer consistency tests verify spatial logic (e.g., footprints within administrative limits; floor-area totals consistent with dwelling counts). Missing attributes are imputed hierarchically: deterministic fills from municipal archives where available; otherwise, hot-deck or model-based estimates using neighborhood, typology, and era predictors. Every ETL run produces a provenance ledger (source, transformation, version hash) and a versioned snapshot of the curated schema to ensure reproducibility.
The curated database exposes materialized views optimized for analytics and visualization: building-level exposure tables; precomputed risk surfaces; and 3D tiles/feature services for the dashboard and game-engine interfaces. This decouples heavy ETL from interactive use, enabling near real-time querying while supporting periodic refresh as new sources (e.g., IoT or updated imagery) arrive.
Figure 5 shows an end-to-end integration and processing pipeline. Heterogeneous sources (vector, raster, 3D, point cloud, and tabular/demographic) are cleaned, standardized, and harmonized to a common CRS and data dictionary. Structural inventories are reconciled to footprints through stable identifiers and spatial joins; census variables are downscaled to buildings via population-weighted, asymmetrically refined interpolation. Quality control, referential integrity, and provenance logging precede publication of materialized views and 3D tiles to support analysis and visualization in the DT.
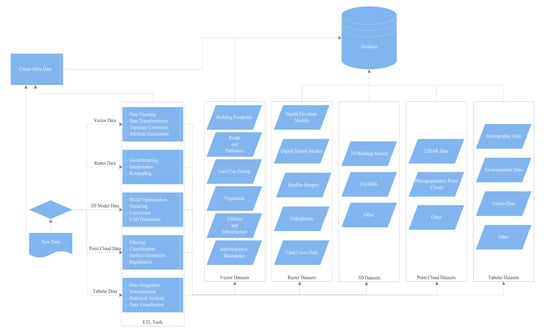
Figure 5.
Workflow of the data integration and processing pipeline, illustrating how heterogeneous geospatial, structural, and demographic datasets are cleaned, standardized, and interlinked into a unified database for DT development.
In order to enhance the capabilities of the digital twin (DT) for sustainable disaster management, this study proposes the integration of real-time data acquisition through the deployment of sensors and sensor networks. The incorporation of Internet of Things (IoT) technologies enables the DT to move beyond static simulations and dynamically adjust to evolving real-world conditions. Sensor nodes placed strategically across the Cayirova region monitor critical parameters such as ground motion, structural health, air quality, and environmental conditions. These sensors serve as primary data acquisition points, facilitating real-time monitoring of disaster indicators and contributing to a more responsive and intelligent disaster management platform.
The design of the sensor network includes diverse types of sensors tailored to specific hazards and monitoring needs. Seismic sensors (accelerometers) detect ground vibrations indicative of seismic activity; structural health monitoring sensors (strain gauges and displacement meters) measure the integrity of bridges and high-rise structures; environmental sensors capture temperature, humidity, air quality, and water levels; and energy meters track the performance of critical power infrastructure. Together, these components provide the DT with a continuous flow of physical-environmental data essential for early detection, situational awareness, and post-event assessment.
Data transmission from sensor nodes to the DT platform is facilitated through multiple communication technologies. For long-range and low-power communication, LoRaWAN (Long Range Wide Area Network) offers an energy-efficient solution, while Wi-Fi and 5G support bandwidth-intensive, high-density urban data streams. The MQTT protocol, a lightweight and efficient messaging standard, forms the backbone of real-time sensor communication, ensuring timely and reliable data delivery to the cloud infrastructure.
To optimize system performance, edge computing devices such as Raspberry Pi or NVIDIA Jetson Nano units act as IoT gateways. These devices perform preliminary data processing near the source, reducing transmission load and enabling faster local decision making. Edge-level filtering and aggregation ensure that the system remains operational even under intermittent network conditions, maintaining essential functions during disaster events.
Figure 6 illustrates the vertical sensor and IoT data pipeline that supports the digital twin framework. It shows how sensor data are collected and preprocessed at the edge, transmitted through IoT communication networks, integrated within a cloud-based PostGIS environment, and visualized in the DT platform for monitoring and decision support. Feedback loops between end users and the DT further enhance adaptability, allowing configuration updates and control actions to be transmitted back to the sensor layer.
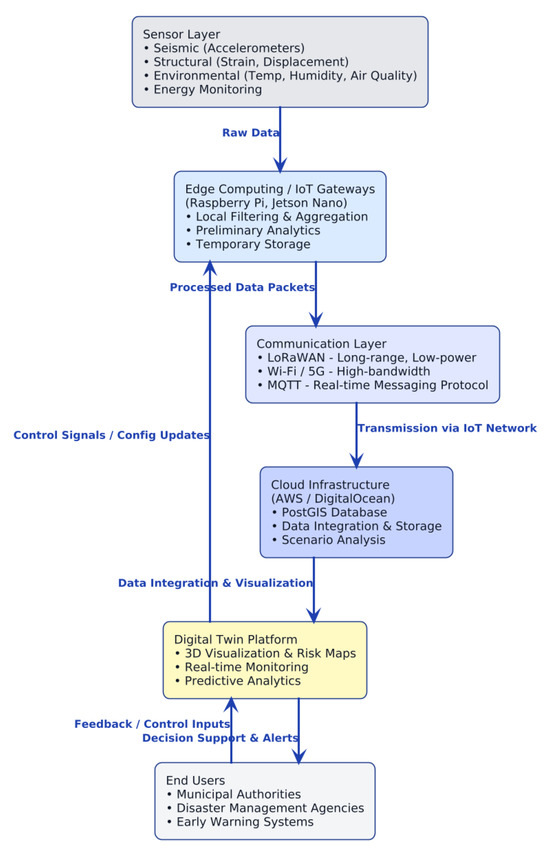
Figure 6.
Sensor and IoT Data Pipeline for DT.
The integration of sensors and sensor networks presents several advantages. It significantly enhances the situational awareness of the DT, enabling real-time assessment of disaster impacts and supporting proactive decision-making. Furthermore, it offers the opportunity to develop early warning systems that can provide critical lead time for emergency response. Continuous monitoring of key parameters contributes to long-term resilience building by identifying vulnerabilities before they lead to catastrophic failures. However, the deployment also introduces certain challenges. Initial costs for sensor procurement and installation may be substantial, and ongoing maintenance is required to ensure data quality and system reliability. Network resilience must also be considered, as communication infrastructures may be affected during disasters.
3. Results
Operating the DT Model
The developed DT model for the Cayirova region functions as an integrated cyber–physical environment that connects the local computational layer, the cloud-based infrastructure, and the sensor network described in Section 2. Once deployed, the DT synchronizes geospatial, structural, and demographic data with the 3D visualization and simulation modules, allowing for real-time updates and continuous interaction between the physical and digital domains. The system’s operation combines automated data ingestion, user-driven simulation, and sensor-based monitoring to provide a unified platform for disaster management and resilience assessment. Figure 7 presents the screenshots taken from the core model.
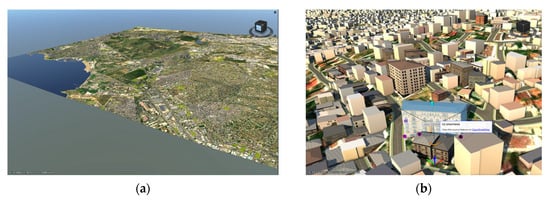
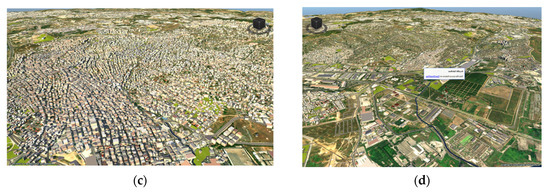
Figure 7.
Screenshots of the developed DT model. (a) Overview; (b) Buildings (focused); (c) Buildings (overview); (d) Roads and other features.
The Cayirova Seismic Risk Dashboard (Figure 8) represents the real-time operational interface of the digital twin, providing a consolidated view of ongoing seismic activity, response operations, and community impact. The dashboard integrates live earthquake detections from the regional sensor network with incident reporting modules, displaying the magnitude, depth, and epicentral location of each recorded event. Key performance indicators summarize the number of response events, damage reports, rescue teams, and assisted individuals, enabling rapid assessment of evolving conditions. The right-hand panel lists recent earthquakes and aftershocks, together with probabilistic forecasts of secondary events and resource deployment status. By coupling near-real-time hazard information with emergency-response analytics, the dashboard enables decision-makers to prioritize actions, allocate field resources efficiently, and maintain situational awareness throughout post-disaster operations.
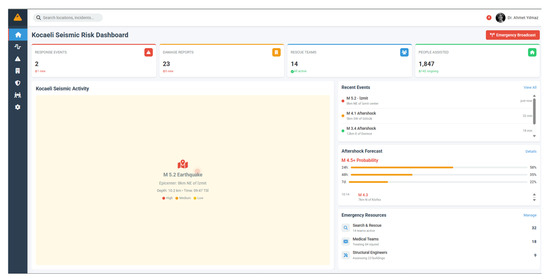
Figure 8.
Kocaeli Seismic Risk Dashboard displaying real-time earthquake detections, aftershock forecasts, and emergency-response indicators within the digital twin environment.
The proper operation of the DT hardware and IoT infrastructure requires adherence to standardized procedures to ensure system reliability, data integrity, and user safety. Before activation, all sensor nodes must be securely installed and calibrated according to the manufacturer’s specifications. Physical and electrical connections, particularly for seismic and structural health sensors, must be verified to prevent erroneous data collection. IoT gateways should be strategically positioned to maintain stable wireless communication with all sensor nodes, and their firmware should be updated to the latest stable release to ensure compatibility and cybersecurity compliance. Figure 9 shows the IoT infrastructure management dashboard showing the operational status of sensors, gateways, and system integrity parameters in the digital twin network.
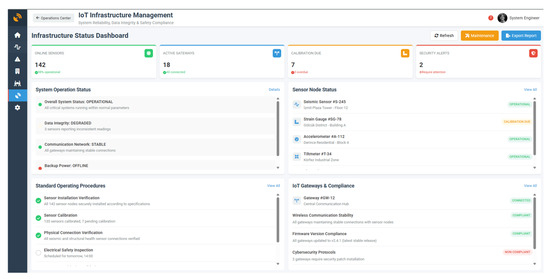
Figure 9.
Infrastructure management dashboard.
Upon system startup, users initiate a network health check through the IoT gateway console to confirm the operational status of each sensor and the integrity of the communication links. Any malfunctions—such as unresponsive nodes or signal interference—should be resolved before data acquisition. Once the network is validated, the cloud platform is launched, ensuring that all middleware services responsible for data ingestion, storage, and processing are active. The MQTT broker must be monitored for message traffic to verify that sensor data is being transmitted and received correctly.
During active operation, the DT dashboard serves as a centralized interface for monitoring live sensor data, simulation results, and system alerts. Users can access both real-time and historical data streams, track environmental and structural conditions, and visualize scenario-based outcomes. The interface also supports automated notifications when critical thresholds are exceeded—such as abnormal ground acceleration, excessive structural strain, or sudden environmental changes—enabling timely alerts to designated response personnel.
Operationally, the DT integrates sensor-derived data, simulated disaster scenarios, and real-time user interaction into a single adaptive environment. Users can perform scenario simulations—such as deterministic or probabilistic earthquake events—view predicted damage distributions, analyze potential infrastructure disruptions, and evaluate emergency response strategies. When connected to the live IoT network, the DT transitions from a static analytical model to a dynamic, data-driven system capable of continuously reflecting real-world changes. By following the established operating procedures, the system maintains accuracy, reliability, and responsiveness, offering actionable insights for proactive disaster management and sustainable urban resilience.
The DT system also includes a Disaster Scenario Simulation and Analysis dashboard, which enables operators to execute, visualize, and assess multiple hazard scenarios in real time. As shown in Figure 10, the interface integrates live IoT data with simulation outputs, allowing users to run deterministic and probabilistic earthquake scenarios, post-quake fires, and infrastructure failure analyses. The dashboard summarizes operational parameters such as the number of active sensors, scenarios executed, predicted damage ratio, and average system response time.
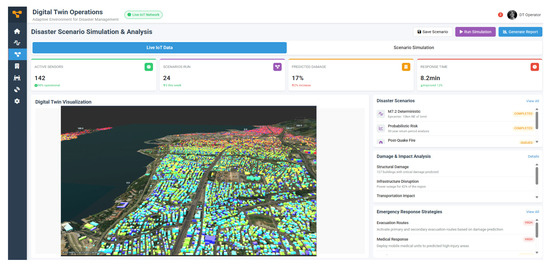
Figure 10.
Disaster Scenario Simulation and Analysis Tab of the DT with IoTs integrated.
The right-hand panel lists recent simulations and corresponding damage assessments, including predicted structural damage, power outages, and transportation disruptions. Emergency response recommendations—such as evacuation routing and medical resource allocation—are automatically generated based on modeled impacts. The interactive environment supports continuous synchronization with the live IoT network, enabling dynamic updates to predicted damage and system status as new sensor data are received. This operational integration demonstrates the DT’s ability to transition from predictive modeling to adaptive disaster management, providing actionable insights for municipal and emergency stakeholders.
Following the seismic dashboard visualization, the digital twin platform allows users to inspect building-level attributes through an interactive toggle panel (Figure 11). Each building entity in the 3D model is semantically linked to its corresponding database record, enabling users to query detailed information on structural, functional, and demographic characteristics. The toggle interface displays parameters such as building ID, typology, height, construction year, and occupancy class, along with dynamically updated vulnerability indices and predicted damage states derived from scenario simulations. This functionality supports micro-scale analysis within the larger urban model, allowing planners and emergency managers to identify high-risk structures, prioritize inspection routes, and cross-validate model predictions with field data collected through the sensor network.
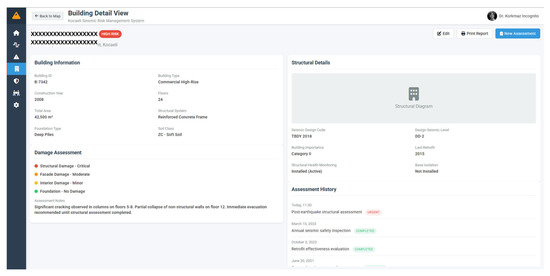
Figure 11.
Interactive building-level toggle within the digital twin model displaying structural, functional, and vulnerability attributes for micro-scale disaster analysis.
4. Discussion
The DT model developed within the scope of this study, similar to the smart city-based DT approach proposed by Ford and Wolf [45] and the model highlighting the integration of artificial intelligence in disaster management by Fan et al. [46], developed scenario-based disaster simulations, spatial data analysis, and multidimensional decision support processes. However, in this research, the aforementioned approaches were implemented with a concrete hardware and software infrastructure. The combination of a high-performance local workstation and cloud-hosted infrastructure enabled both large-scale simulations and multi-user access. Considering the hybrid modeling approach (combining physics-based and data-based models) proposed by Yun et al. [50] and the infrastructure-focused DT-IPDMI framework (multi-source data, IoT, and sensor-based monitoring) suggested by Yu and He [49], this study similarly implemented IoT sensor integration and real-time data collection capabilities in the Cayirova example. Thus, the model supports not only static scenarios but also dynamic and continuously updatable disaster management applications. Furthermore, as pointed out by Tao et al. [36] and Singh et al. [32], costs, data integration, and standard deficiencies remain valid challenges for DT application. However, the study tested the conceptual frameworks proposed in the literature at a practical level and presented an applicable model for sustainability and disaster resilience goals. Additionally, it differs from similar applications in the literature by offering a design that is integrated with the SDGs. Particularly in the context of disaster risk reduction (SDG 11.5), climate change adaptation (SDG 13.1), and the development of resilient infrastructure (SDG 9.1), the Cayirova case study stands out as a concrete and scalable model that can contribute to global sustainability goals at the local level.
The development of a hybrid hardware–cloud DT system for disaster management in Cayirova highlights the importance of integrating computational design with sustainability and resilience objectives. Korkmaz et al. [53] further developed a common operating picture for disaster management utilizing DTs, where seismic hazards are evaluated in terms of a sustainable perspective. In another study, Rindone and Russo [54] developed a framework for serious game activities for evacuation in terms of disaster management of a Manhattan-type road network. This research further highlighted the importance of sustainability challenges in the risk reduction through the evacuation context. Similarly, this research offers a wide picture of disaster management with DTs in a sustainable perspective by combining a high-performance local workstation with scalable cloud infrastructure and an IoT-enabled sensor network. The proposed architecture addresses critical gaps in existing disaster management frameworks, which often lack the capacity for real-time monitoring and multi-stakeholder accessibility. The design demonstrates that hardware-aware approaches are essential to move DT concepts beyond theoretical models and toward operationally viable systems.
The DT model developed in this study extends beyond conceptual frameworks by generating quantifiable outputs under a seismic scenario, where (Mw ≥ 7.0) is evaluated to consider both structural and socio-spatial vulnerabilities in the district. Under these seismic conditions, the model outputs indicate that approximately 18% of mid-rise reinforced concrete buildings experience minor to moderate structural damage, particularly in older residential zones constructed before 2000. The DT model indicated a high prediction accuracy between simulated and observed damage (87%), and 99.2% uptime for multi-stress user testing was observed for five concurrent scenarios. The simulation further showed that the critical transportation corridors remain largely functional, allowing for the continuity of emergency logistics. These findings imply that preparedness strategies should prioritize rapid building inspection workflows and the deployment of mobile response units to affected neighborhoods, rather than large-scale evacuations. Further, based on changing field data, the system’s damage heatmaps and real-time sensor feeds pinpoint evacuation route bottlenecks, indicating the necessity for temporary relocation zones and dynamic rerouting algorithms. Authorities can model the evolution of evacuation waves and optimize crowd dispersal time to alleviate traffic at strategic intersections by combining simulated traffic and pedestrian flow data with the DT’s live IoT sensor inputs.
As an adaptable cyber-physical system, the Cayirova DT is not like a traditional GIS or visualization database. It combines hybrid simulations with sensor-driven data collection to enable real-time feedback across the digital and physical levels. Through IoT integration, the system continuously recalibrates environmental and structural parameters, offering autonomous scenario production and predictive capabilities beyond the representational reach of GIS models.
The study contributes to ongoing debates in the literature on DTs for disaster management. Previous research has often emphasized conceptual frameworks and the integration of artificial intelligence or decision making algorithms, yet has paid less attention to the hardware foundations necessary for implementation. By foregrounding hardware design and system integration, this study offers a practical perspective that complements existing DT research. The hybrid architecture illustrates how edge computing, sensor networks, and cloud scalability can be combined to support dynamic and adaptive disaster response, thereby reinforcing the role of DTs as strategic enablers of resilience.
Another important dimension of this research is its alignment with international sustainability agendas. The integration of the DT framework with the United Nations Sustainable Development Goals demonstrates that hardware-enabled solutions can directly contribute to global objectives. In particular, the system advances SDG 9 (Industry, Innovation, and Infrastructure) by promoting resilient infrastructure design, SDG 11 (Sustainable Cities and Communities) by supporting risk-informed planning, and SDG 13 (Climate Action) by enabling proactive responses to climate-related hazards. This alignment underscores the dual role of DT systems as both technical platforms and instruments for policy and governance. Laura and Azzalin’s [55] study further demonstrated that digital transformation in the construction sector can be achieved through DTs, especially for seismic safety in the lifecycle of buildings, which in turn contributes to the reduction of energy consumption and emissions as well as enhancing the durability and service life of buildings.
Nevertheless, the study acknowledges certain challenges that remain unresolved. The large-scale deployment of sensors requires careful consideration of cost, maintenance, and network reliability. Cloud-based components, while offering scalability, introduce dependencies on external service providers and long-term operational costs. Furthermore, the integration of predictive analytics and machine learning represents an area of future research, which would further enhance the adaptability and decision-support capabilities of the DT.
While the connection between the proposed framework and the SDGs highlights its broader societal relevance, a critical reflection also reveals several limitations and contextual boundaries. The effectiveness of the model depends on the availability, accuracy, and interoperability of input data, which can vary significantly across municipalities. The reliance on cloud infrastructure introduces issues of data security, long-term operational cost, and network dependency, particularly during large-scale emergencies when communication may be disrupted. Compared with other DT frameworks that prioritize high-fidelity multi-physics simulation or large-scale urban analytics, the present study emphasizes scalability, modularity, and accessibility for small-to-medium-sized urban-industrial areas. This distinction enhances transferability but limits the level of detail achievable in real-time simulation. Furthermore, the model’s integration with SDGs remains indicative rather than exhaustive—it provides a methodological bridge between sustainability targets and operational disaster management but does not yet quantify long-term social or environmental impacts. Future work will focus on improving real-time interoperability, embedding AI-based predictive analytics, and developing evaluation metrics to measure the contribution of DT frameworks to specific SDG indicators.
5. Conclusions
The study and implementation of the Seismic Risk Digital Twin (SRDT) in the Cayirova district have demonstrated the transformative potential of DT technologies in advancing earthquake management practices. By integrating a wide range of data sources, including geospatial, structural, demographic, and real-time sensor data, the SRDT offers a comprehensive and dynamic platform for understanding and mitigating seismic risks. Its capabilities extend across all phases of disaster management, from preparedness and mitigation to emergency response and recovery, establishing it as a crucial tool for enhancing urban resilience. High-fidelity modeling and multi-user access were both successfully enabled by the hybrid hardware–cloud architecture, confirming the model’s operational durability and technical viability in real-world scenarios.
Key findings from the study emphasize the advantages of the SRDT over traditional earthquake management techniques. The system’s ability to dynamically assess building vulnerabilities, predict damage and casualties, and identify high-risk areas ensures that resources and response efforts are allocated with precision. Unlike conventional methods, which rely on static risk maps and generalized contingency plans, the SRDT provides a real-time, data-driven framework that adapts to evolving disaster scenarios. This adaptability not only reduces response times but also minimizes human and material losses during seismic events. The study further indicated that the SRDT can dynamically evaluate building vulnerabilities and forecast damage patterns with an 87% simulation-to-observation accuracy in an earthquake scenario with a magnitude ≥7.0. During multi-user stress testing, the system maintained 99.2% uptime and showed that it could maintain the performance of vital transport routes, guaranteeing emergency logistical continuity. These findings are essential for taking preventive measures in vulnerable zones in terms of earthquake risks. Therefore, these findings support the SRDT’s ability to improve evacuation plans, raise situational awareness, and facilitate better resource allocation decisions in emergency situations.
By integrating its design with several Sustainable Development Goals (SDGs) of the UN, particularly SDG 9 (Industry, Innovation, and Infrastructure), SDG 11 (Sustainable Cities and Communities), and SDG 13 (Climate Action), the SRDT promotes sustainability and resilience goals in addition to its technical performance. The concept bridges the gap between digital transformation and sustainable urban governance by bolstering climate adaptation measures, encouraging resilient infrastructure design, and supporting risk-informed urban planning.
The SRDT also excels in improving coordination and decision making during emergencies. By serving as a centralized platform for data integration, it facilitates effective communication among stakeholders, including emergency managers, government agencies, and first responders. The system’s predictive modeling capabilities further enable pre-emptive planning and scenario testing, ensuring that cities are better prepared for future seismic events. Additionally, the evaluation of critical infrastructure, such as emergency muster sites and utility networks, underscores the SRDT’s role in ensuring the safety and well-being of affected populations.
On the other hand, the study had some limitations. For example, the quality and temporal precision of input data determine the SRDT’s accuracy, and relying too much on the cloud can pose risks to cost, security, and continuity in the event of major disasters. Therefore, future studies should concentrate on (i) improving data interoperability with national and international standards, (ii) integrating artificial intelligence and predictive analytics for adaptive risk forecasting, and (iii) measuring the long-term environmental and social impacts of disaster management systems based on DT.
The DT model presented in this study is more than a technical tool—it is a strategic enabler of sustainability and resilience in urban disaster management. By aligning its design and implementation with the Sustainable Development Goals, the model demonstrates how innovative, inclusive, and open-source technologies can drive local action with global impact. The Cayirova case study offers a replicable and scalable example of how cities can harness digital transformation to achieve sustainable development outcomes.
Author Contributions
Conceptualization, M.K. and S.D.; methodology, M.K., Y.E.A. and S.D.; software, M.K. and B.C.; validation, M.K., S.T. and P.N.; formal analysis, M.K.; investigation, S.T., P.N. and Y.E.A.; resources, B.C.; data curation, M.K., Y.E.A. and S.D.; writing—original draft preparation, M.K., Y.E.A. and S.D.; writing—review and editing, S.T., P.N. and B.C.; visualization, M.K.; supervision, S.D., S.T. and P.N.; project administration, B.C.; funding acquisition, B.C. All authors have read and agreed to the published version of the manuscript.
Funding
This research was funded by Cayirova Municipality.
Institutional Review Board Statement
Not applicable.
Informed Consent Statement
Not applicable.
Data Availability Statement
The raw data supporting the conclusions of this article will be made available by the authors on request and with the consent of the Cayirova Municipality.
Acknowledgments
The authors would like to thank Cayirova Municipality for their funding and contribution to this study.
Conflicts of Interest
The authors declare no conflicts of interest.
References
- The United Nations Office for Disaster Risk Reduction (UNDRR). Sendai Framework for Disaster Risk Reduction 2015–2030. In Proceedings of the 3rd United Nations World Conference on DRR, Sendai, Japan, 14–18 March 2015. [Google Scholar]
- United Nations General Assembly. Transforming Our World: The 2030 Agenda for Sustainable Development, Resolution A/RES/70/1. 2015. Available online: https://sdgs.un.org/2030agenda (accessed on 15 August 2025).
- Wen, Z.; Li, J.; Wang, Z. Research on Urban Disaster Emergency Management Mechanisms and Rapid Response System Construction. J. Environ. Build. Eng. 2024, 1, 1–6. [Google Scholar] [CrossRef]
- Rebeeh, Y.A.M.A.; Pokharel, S.; Abdella, G.M.M.; Hammuda, A.S. Disaster management in industrial areas: Perspectives, challenges and future research. J. Ind. Eng. Manag. 2019, 12, 133–153. [Google Scholar] [CrossRef]
- Al-Jassim, M.; Frazier, T.; Wood, E. Emergency management and HAZMAT mitigation: Strategic planning for new developments. J. Emerg. Manag. 2022, 20, 39–57. [Google Scholar] [CrossRef]
- Feng, Y.; Xiang-Yang, L. Improving emergency response to cascading disasters: Applying case-based reasoning towards urban critical infrastructure. Int. J. Disaster Risk Reduct. 2018, 30, 244–256. [Google Scholar] [CrossRef]
- Geddam, S.M.; Raj Kiran, C.A. Enhancing disaster management effectiveness: An integrated analysis of key factors and practical strategies through Structural Equation Modeling (SEM) and scopus data text mining. Geohazard Mech. 2024, 2, 95–107. [Google Scholar] [CrossRef]
- Shah, S.A.; Seker, D.Z.; Rathore, M.M.; Hameed, S.; Ben Yahia, S.; Draheim, D. Towards Disaster Resilient Smart Cities: Can Internet of Things and Big Data Analytics Be the Game Changers? IEEE Access 2019, 7, 91885–91903. [Google Scholar] [CrossRef]
- Yang, C.; Su, G.; Chen, J. Using big data to enhance crisis response and disaster resilience for a smart city. In Proceedings of the 2017 IEEE 2nd International Conference on Big Data Analysis (ICBDA), Beijing, China, 10–12 March 2017. [Google Scholar]
- Swaris, N.; Halwatura, R.U.; Amaratunga, D. Policy coherence for resilience in Sri Lanka: Coherence of CCA, DRR and SDGs. Int. J. Disaster Resil. Built Environ. 2024, 15, 450–473. [Google Scholar] [CrossRef]
- Wu, D.; Zheng, A.; Yu, W.; Cao, H.; Ling, Q.; Liu, J.; Zhou, D. Digital twin technology in transportation infrastructure: A comprehensive survey of current applications, challenges, and future directions. Appl. Sci. 2025, 15, 1911. [Google Scholar] [CrossRef]
- Hassankhani, M.; Alidadi, M.; Sharifi, A.; Azhdari, A. Smart city and crisis management: Lessons for the COVID-19 pandemic. Int. J. Environ. Res. Public Health 2021, 18, 7736. [Google Scholar] [CrossRef]
- Shughrue, C.; Seto, K.C. Systemic vulnerabilities of the global urban-industrial network to hazards. Clim. Change 2018, 151, 173–187. [Google Scholar] [CrossRef]
- Doğal Afetler, T.C.; İçişleri Bakanlığı Afet ve Acil Durum Yönetimi Başkanlığı. Açıklamalı Afet Yönetimi Terimleri Sözlüğü. Available online: https://www.afad.gov.tr/aciklamali-afet-yonetimi-terimleri-sozlugu (accessed on 21 December 2023).
- Moore, T.; Lakha, R. Disaster and Emergency Management Systems (DEMS). In Tolley’s Handbook of Disaster and Emergency Management, 3rd ed.; Moore, T., Lakha, R., Eds.; Elsevier: Oxford, UK, 2006; pp. 107–144. [Google Scholar]
- Hoeppe, P. Trends in Weather Related Disasters—Consequences for Insurers and Society. Weather. Clim. Extremes 2016, 11, 70–79. [Google Scholar] [CrossRef]
- Kadıoğlu, M. Afet Yönetimi: Beklenilmeyeni Beklemek, en Kötüsünü Yönetmek, 1st ed.; Marmara Belediyeler Birliği: İstanbul, Türkiye, 2011; pp. 11–207. [Google Scholar]
- Rubin, O.; Dahlberg, R. A Dictionary of Disaster Management, 1st ed.; Oxford University Press: Oxford, UK, 2017; pp. 1–152. [Google Scholar] [CrossRef]
- Su, Y.; Jin, Z. Building Service Oriented Applications for Disaster Management—An Earthquake Assessment Example. In Proceedings of the 2009 Fourth International Conference on Cooperation and Promotion of Information Resources in Science and Technology, Beijing, China, 21–23 November 2009. [Google Scholar] [CrossRef]
- Adeel, A.; Gogate, M.; Farooq, S.; Ieracitano, C.; Dashtipour, K.; Larijani, H.; Hussain, A. A Survey on the Role of Wireless Sensor Networks and IoT in Disaster Management. In Geological Disaster Monitoring Based on Sensor Networks, 1st ed.; Durrani, T.S., Wang, W., Forbes, S.M., Eds.; Springer: New York, NY, USA, 2019; pp. 57–66. [Google Scholar] [CrossRef]
- Lin, B.-C.; Lee, C.-H. Conducting an Adaptive Evaluation Framework of Importance and Performance for Community-Based Earthquake Disaster Management. Nat. Hazards 2023, 115, 1255–1274. [Google Scholar] [CrossRef]
- Chaiir, S.; Charrad, M.; Bellamine Ben Saoud, N. Using Recommendation Systems in Disaster Management: A Systematic Literature Review. Procedia Comput. Sci. 2023, 225, 1738–1747. [Google Scholar] [CrossRef]
- Sun, W.; Bocchini, P.; Davison, B.D. Applications of Artificial Intelligence for Disaster Management. Nat. Hazards 2020, 103, 2631–2689. [Google Scholar] [CrossRef]
- Gunes, A.E.; Kovel, J.P. Using GIS in Emergency Management Operations. J. Urban Plan. Dev. 2000, 126, 136–149. [Google Scholar] [CrossRef]
- Coppola, D.P. The Management of Disasters. In Introduction to International Disaster Management, 1st ed.; Listewnik, M., Soucy, J., Chester, P., Weaver, K., Eds.; Elsevier Inc. Butterworth–Heinemann: Oxford, UK, 2007; pp. 1–29. [Google Scholar]
- Alexander, D. Aims, Purpose and Scope of Emergency Planning. In Principles of Emergency Planning and Management, 1st ed.; Terra Publishing: Oxford, UK, 2002; pp. 1–11. [Google Scholar]
- Crespi, N.; Drobot, A.T.; Minerva, R. (Eds.) The Digital Twin: What and Why? In The Digital Twin, 1st ed.; Springer International Publishing: Cham, Switzerland, 2023; pp. 3–20. [Google Scholar] [CrossRef]
- Kineber, A.F.; Singh, A.K.; Fazeli, A.; Mohandes, S.R.; Cheung, C.; Arashpour, M.; Ejohwomu, O.; Zayed, T. Modelling the Relationship between Digital Twins Implementation Barriers and Sustainability Pillars: Insights from Building and Construction Sector. Sustain. Cities Soc. 2023, 99, 104930. [Google Scholar] [CrossRef]
- Arowoiya, V.A.; Oke, A.E.; Ojo, L.D.; Adelusi, A.O. Driving Factors for the Adoption of Digital Twin Technology Implementation for Construction Project Performance in Nigeria. J. Constr. Eng. Manag. 2024, 150, 05023014. [Google Scholar] [CrossRef]
- Sun, W.; Ma, W.; Zhou, Y.; Zhang, Y. An Introduction to Digital Twin Standards. GetMobile Mob. Comput. Commun. 2022, 26, 16–22. [Google Scholar] [CrossRef]
- Zhang, R.; Wang, F.; Cai, J.; Wang, Y.; Guo, H.; Zheng, J. Digital Twin and Its Applications: A Survey. Int. J. Adv. Manuf. Technol. 2022, 123, 4123–4136. [Google Scholar] [CrossRef]
- Singh, M.; Fuenmayor, E.; Hinchy, E.P.; Qiao, Y.; Murray, N.; Devine, D. Digital Twin: Origin to Future. Appl. Syst. Innov. 2021, 4, 36. [Google Scholar] [CrossRef]
- Zhang, A.; Yang, J.; Wang, F. Application and Enabling Digital Twin Technologies in the Operation and Maintenance Stage of the AEC Industry: A Literature Review. J. Build. Eng. 2023, 80, 16–22. [Google Scholar] [CrossRef]
- Wu, J.; Yang, Y.; Cheng, X.; Zuo, H.; Cheng, Z. The Development of Digital Twin Technology Review. In Proceedings of the 2020 Chinese Automation Congress (CAC), Shanghai, China, 6–8 November 2020. [Google Scholar] [CrossRef]
- Tao, F.; Xiao, B.; Qi, Q.; Cheng, J.; Ji, P. Digital Twin Modeling. J. Manuf. Syst. 2022, 64, 372–389. [Google Scholar] [CrossRef]
- Tao, F.; Zhang, M.; Nee, A.Y.C. Digital Twin Driven Smart Manufacturing, 1st ed.; Academic Press: Cambridge, MA, USA, 2019; pp. 3–62. [Google Scholar]
- Kritzinger, W.; Karner, M.; Traar, G.; Henjes, J.; Sihn, W. Digital Twin in Manufacturing: A Categorical Literature Review and Classification. IFAC-Pap. 2018, 51, 1016–1022. [Google Scholar] [CrossRef]
- Barricelli, B.R.; Casiraghi, E.; Fogli, D. A Survey on Digital Twin: Definitions, Characteristics, Applications, and Design Implications. IEEE Access 2019, 7, 167653–167671. [Google Scholar] [CrossRef]
- Jones, S.A. How Building Information Modeling Standards Can Improve Building Performance. In Proceedings of the Joint APEC-ASEAN Workshop, Medan, Indonesia, 24–25 June 2013. [Google Scholar]
- Nawari, N.O.; Kuenstle, M. Building Information Modeling. In Building Information Modeling Framework for Structural Design, 1st ed.; Nawari, N.O., Kuenstle, M., Eds.; CRC Press: Boca Raton, FL, USA, 2015; pp. 31–52. [Google Scholar]
- Tomek, A.; Matějka, P. The Impact of BIM on Risk Management as an Argument for Its Implementation in a Construction Company. Procedia Eng. 2014, 85, 501–509. [Google Scholar] [CrossRef]
- Toprak, S.; Demirkesen, S. Building Information Modeling (BIM) in Geotechnics and Infrastructures. In Automation in Construction Toward Resilience, 1st ed.; CRC Press: Boca Raton, FL, USA, 2023; pp. 91–110. [Google Scholar] [CrossRef]
- Vuoto, A.; Funari, M.F.; Lourenço, P.B. On the Use of the Digital Twin Concept for the Structural Integrity Protection of Architectural Heritage. Infrastructures 2023, 8, 86. [Google Scholar] [CrossRef]
- Deng, M.; Menassa, C.C.; Kamat, V.R. From BIM to Digital Twins: A Systematic Review of the Evolution of Intelligent Building Representations in the AEC-FM Industry. J. Inf. Technol. Constr. 2021, 26, 58–83. [Google Scholar] [CrossRef]
- Ford, D.N.; Wolf, C.M. Smart Cities with Digital Twin Systems for Disaster Management. J. Manag. Eng. 2020, 36, 04020027. [Google Scholar] [CrossRef]
- Fan, C.; Zhang, C.; Yahja, A.; Mostafavi, A. Disaster City Digital Twin: A Vision for Integrating Artificial and Human Intelligence for Disaster Management. Int. J. Inf. Manag. 2021, 56, 102049. [Google Scholar] [CrossRef]
- Ariyachandra, M.R.M.F.; Wedawatta, G. Digital Twin Smart Cities for Disaster Risk Management: A Review of Evolving Concepts. Sustainability 2023, 15, 11910. [Google Scholar] [CrossRef]
- Lee, J.; Lee, Y.; Park, S.; Hong, C. Implementing a Digital Twin of an Underground Utility Tunnel for Geospatial Feature Extraction Using a Multimodal Image Sensor. Appl. Sci. 2023, 13, 9137. [Google Scholar] [CrossRef]
- Yu, D.; He, Z. Digital Twin-Driven Intelligence Disaster Prevention and Mitigation for Infrastructure: Advances, Challenges, and Opportunities. Nat. Hazards 2022, 112, 1–36. [Google Scholar] [CrossRef]
- Yun, S.-J.; Kwon, J.-W.; Kim, W.-T. A Novel Digital Twin Architecture with Similarity-Based Hybrid Modeling for Supporting Dependable Disaster Management Systems. Sensors 2022, 22, 4774. [Google Scholar] [CrossRef]
- Kamari, M.; Ham, Y. AI-Based Risk Assessment for Construction Site Disaster Preparedness through Deep Learning-Based Digital Twinning. Autom. Constr. 2022, 134, 104091. [Google Scholar] [CrossRef]
- Lee, J.; Lee, Y.; Hong, C. Development of Geospatial Data Acquisition, Modeling, and Service Technology for Digital Twin Implementation of Underground Utility Tunnel. Appl. Sci. 2023, 13, 4343. [Google Scholar] [CrossRef]
- Korkmaz, M.; Zulfikar, A.C.; Demirkesen, S. Leveraging Digital Twins as a Common Operating Picture for Disaster Management: Case of Seismic Hazards. ISPRS Int. J. Geo-Inf. 2024, 13, 430. [Google Scholar] [CrossRef]
- Rindone, C.; Russo, A. Disaster Risk Reduction in a Manhattan-Type Road Network: A Framework for Serious Game Activities for Evacuation. Sustainability 2025, 17, 6326. [Google Scholar] [CrossRef]
- Lauria, M.; Azzalin, M. Digital Transformation in the Construction Sector: A Digital Twin for Seismic Safety in the Lifecycle of Buildings. Sustainability 2024, 16, 8245. [Google Scholar] [CrossRef]


Disclaimer/Publisher’s Note: The statements, opinions and data contained in all publications are solely those of the individual author(s) and contributor(s) and not of MDPI and/or the editor(s). MDPI and/or the editor(s) disclaim responsibility for any injury to people or property resulting from any ideas, methods, instructions or products referred to in the content. |
© 2025 by the authors. Licensee MDPI, Basel, Switzerland. This article is an open access article distributed under the terms and conditions of the Creative Commons Attribution (CC BY) license (https://creativecommons.org/licenses/by/4.0/).