Research on Safety Evaluation Methods for Interchange Diverting Zones Based on Operating Speed
Abstract
1. Introduction
2. Data
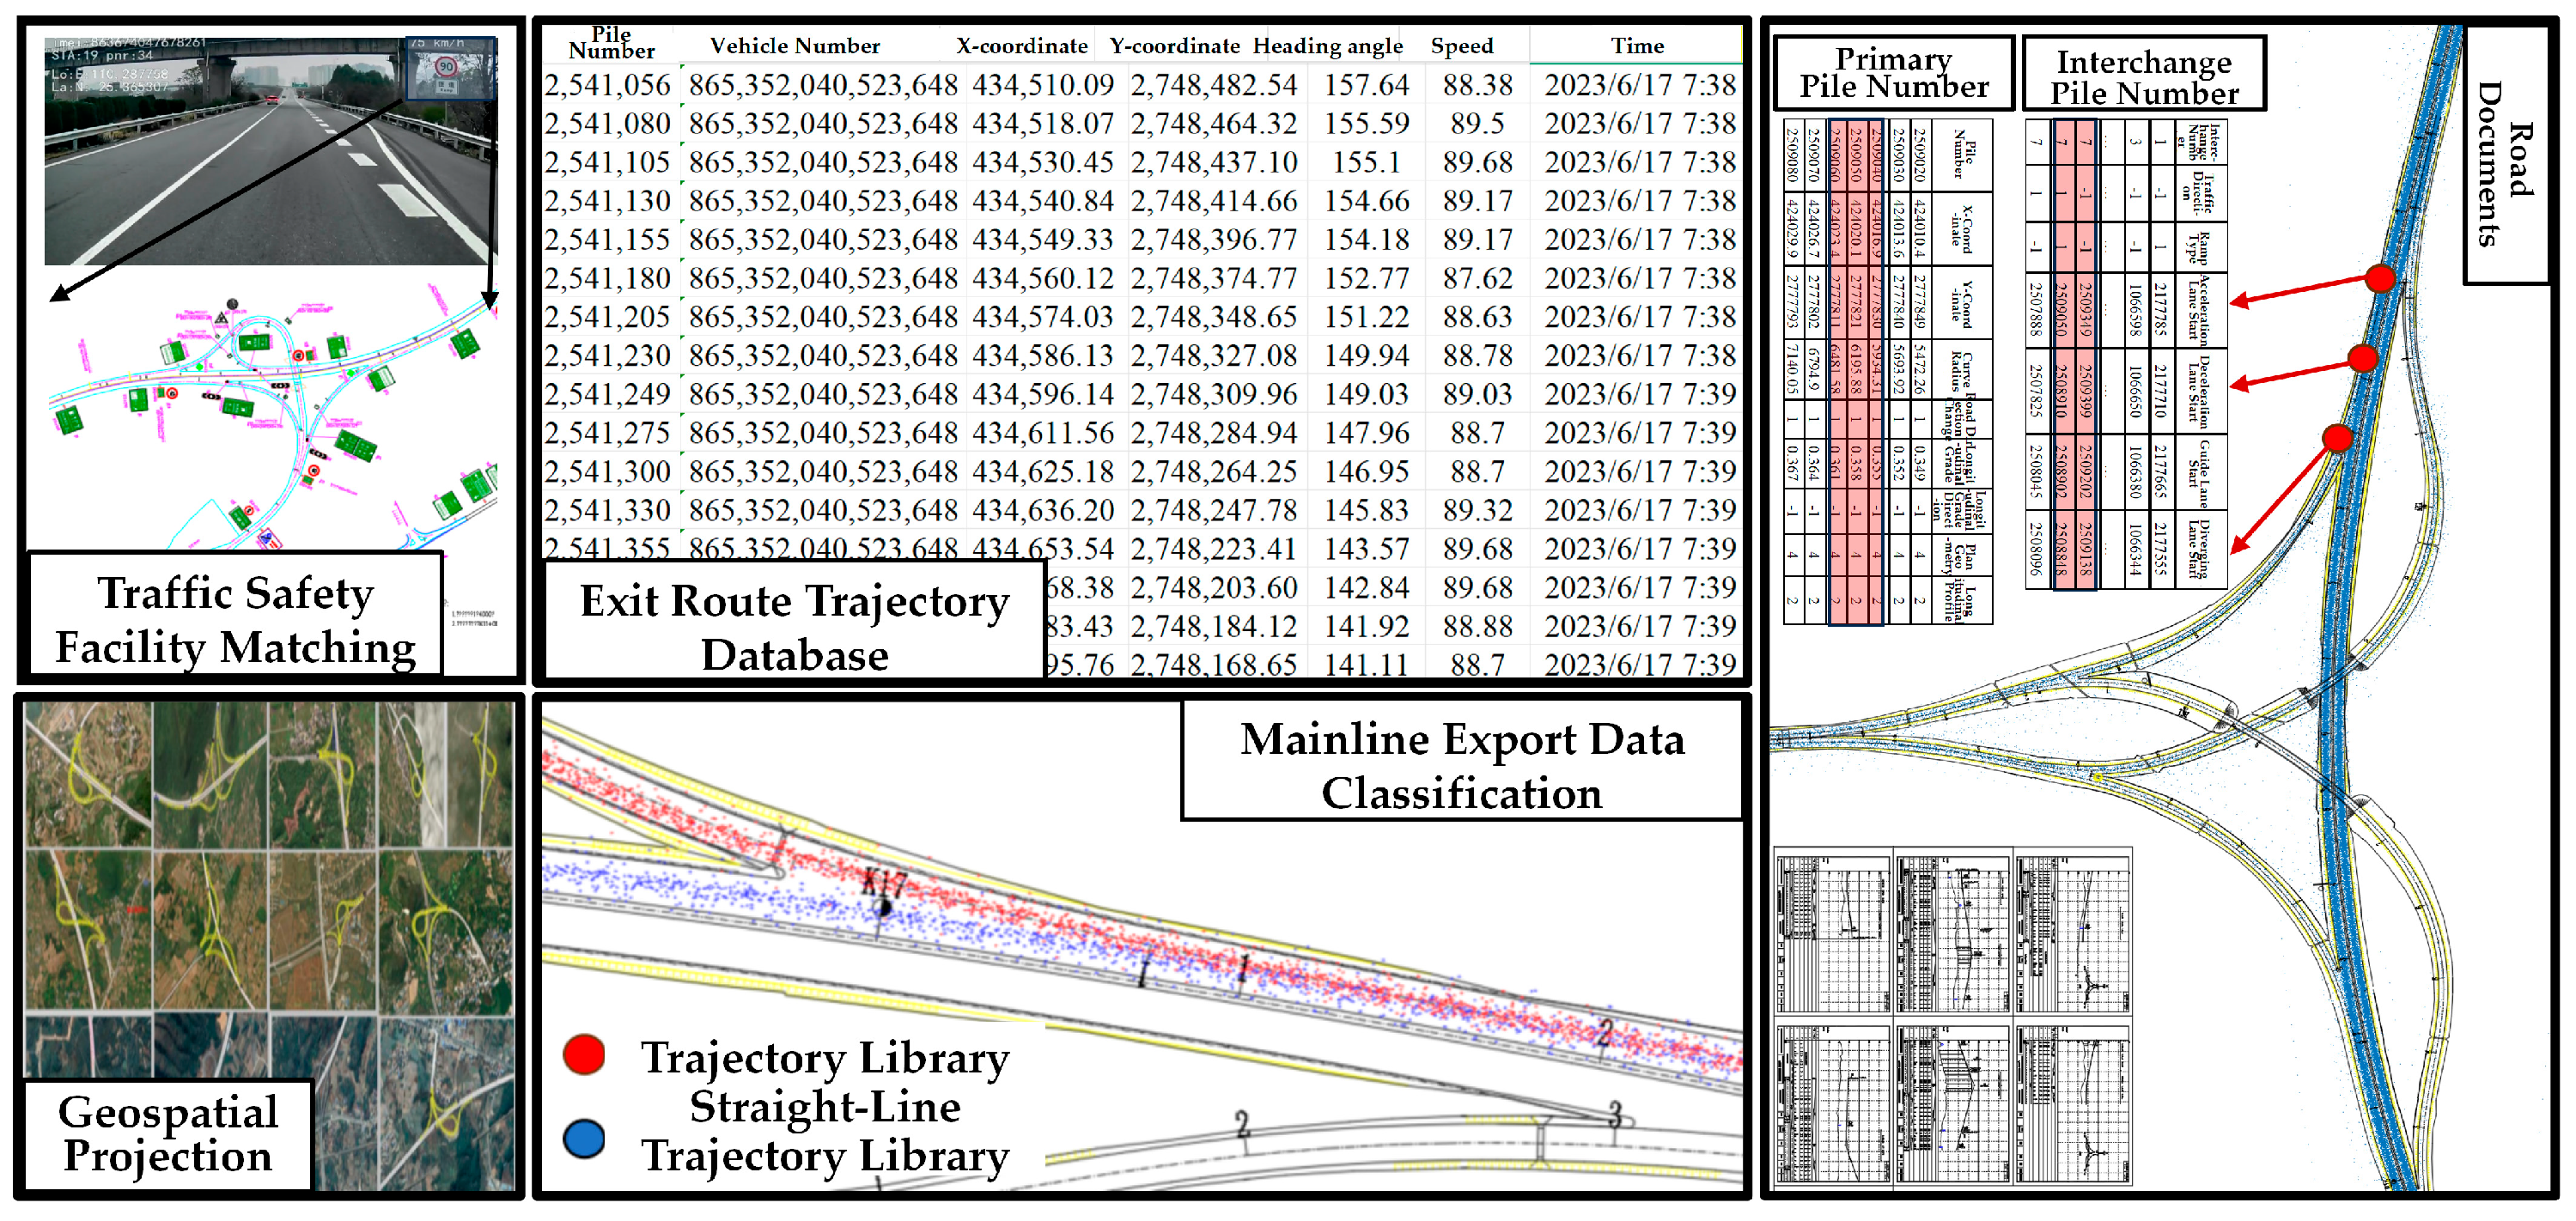
2.1. Data Source
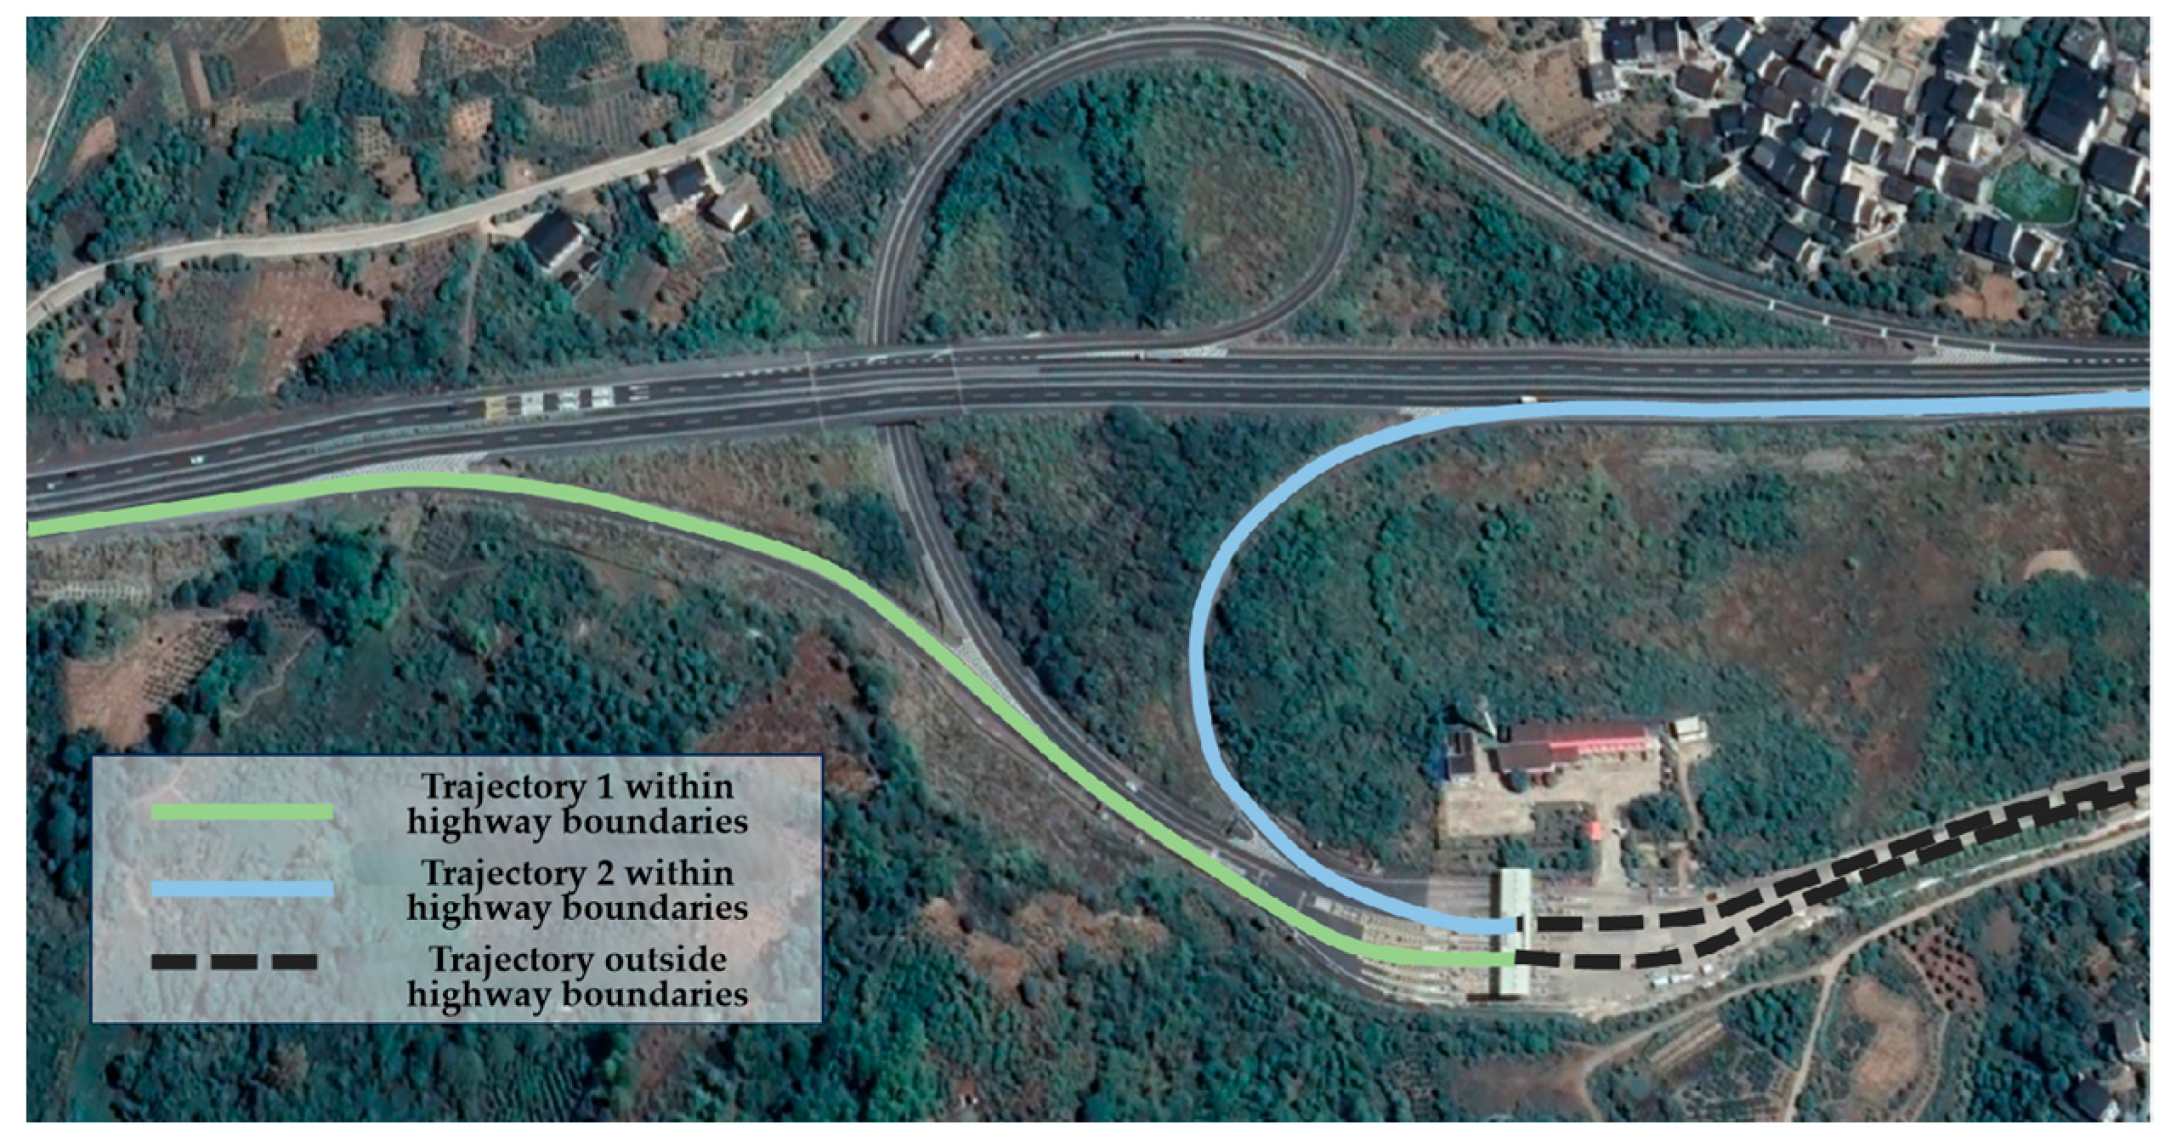
2.2. Data Processing
- Data Preprocessing
- 2.
- Data Space Slicing
- 3.
- Anomaly Data Processing
- 4.
- Database Construction
2.3. Experimental Data Explanation
3. Analysis of Truck Driving Characteristics in the Diverting Zone
3.1. Definition of the Diverting Zone Driving Section
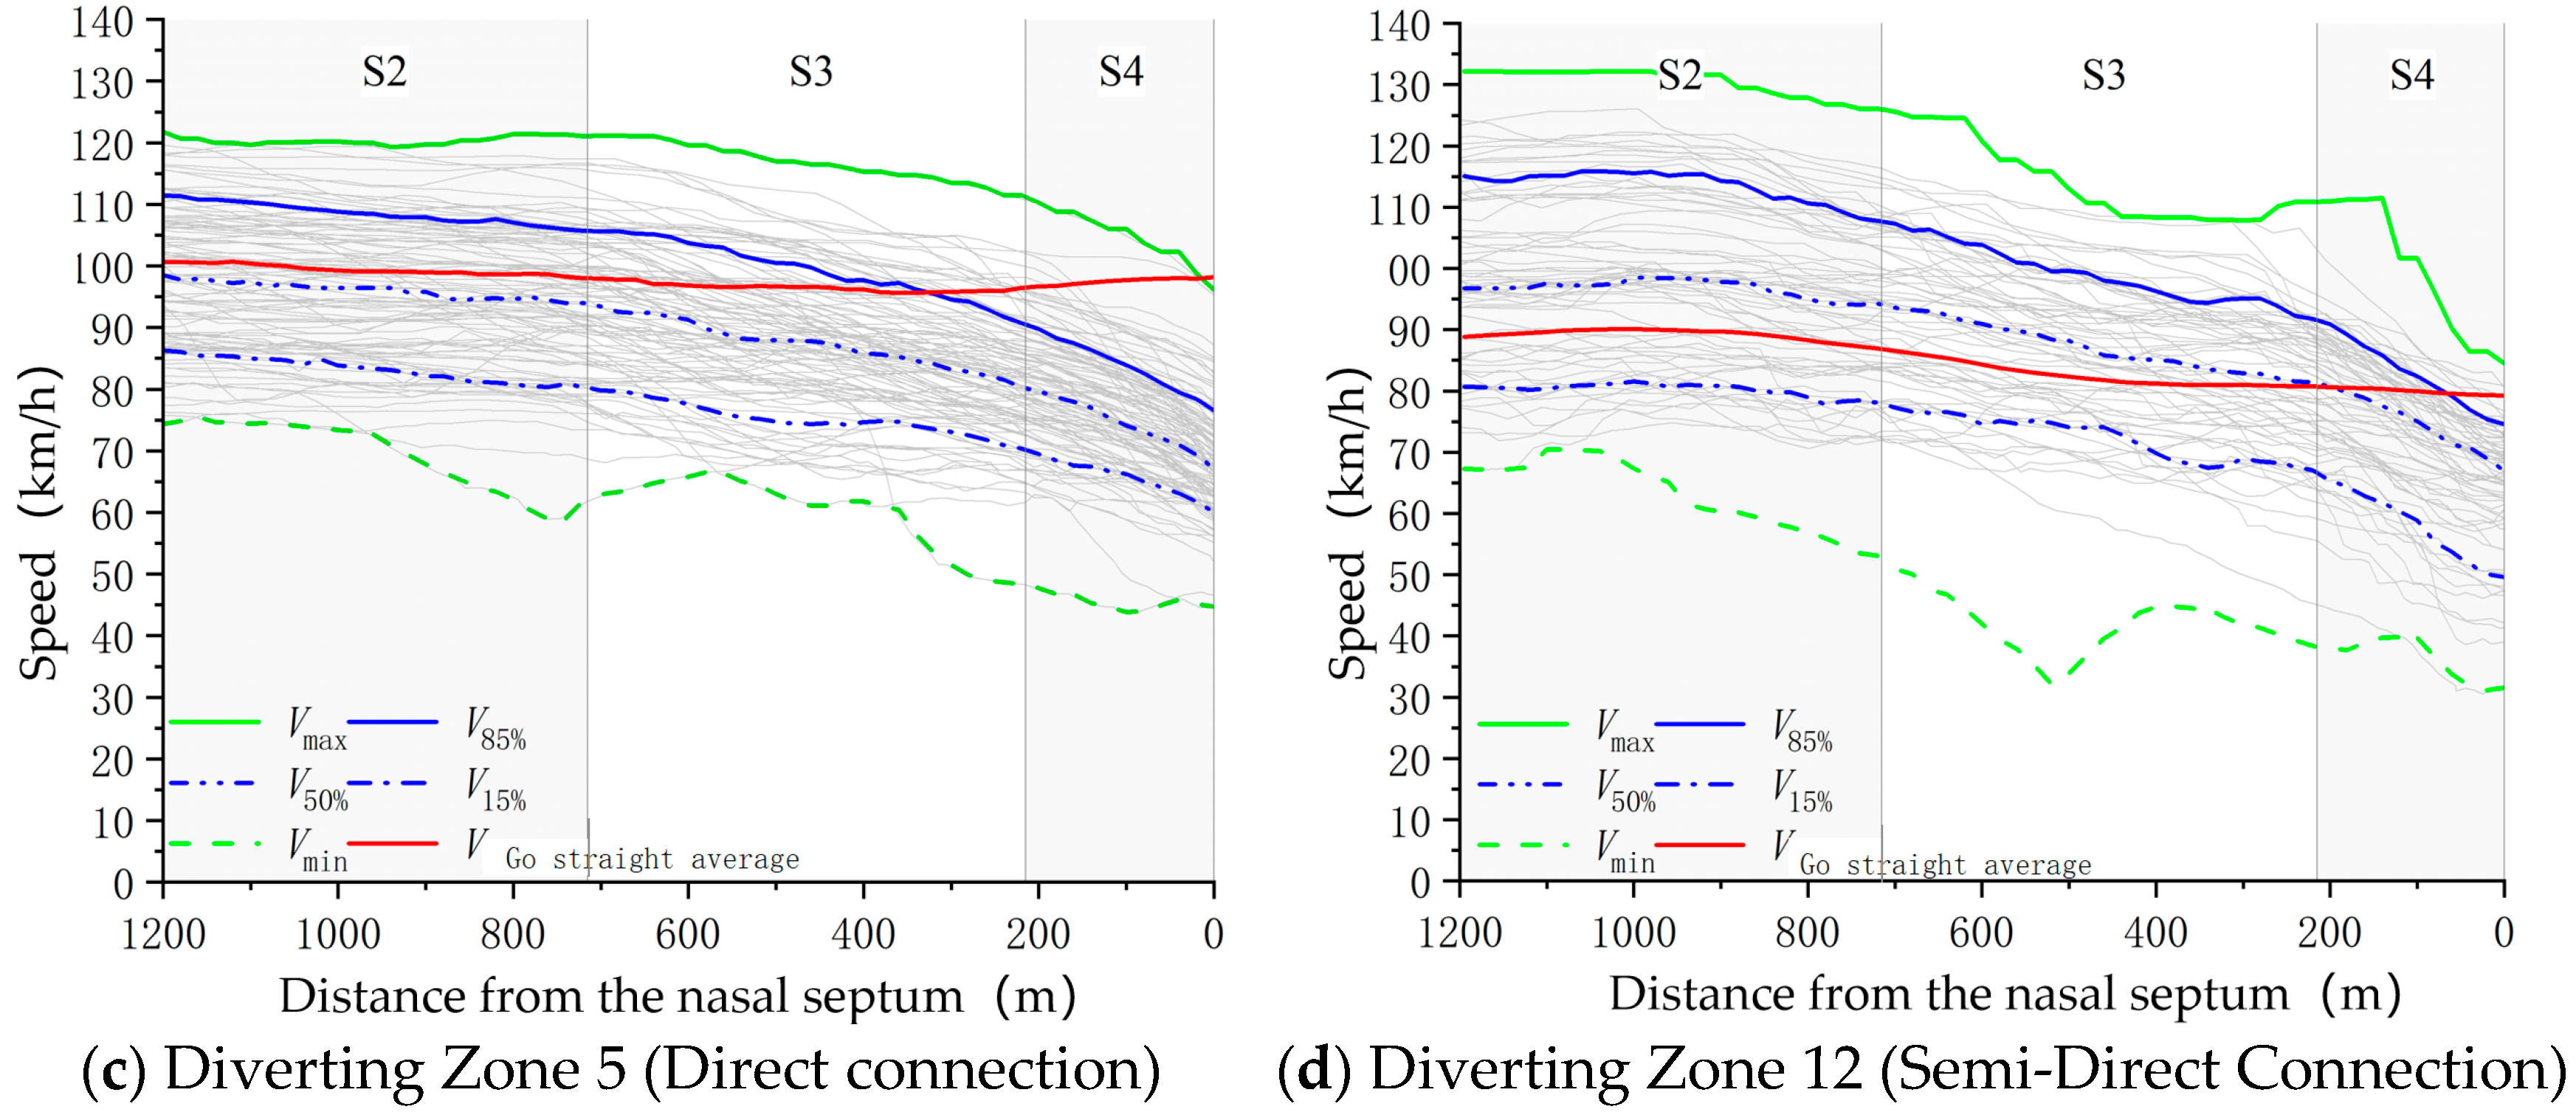
3.2. Operational Speed Analysis
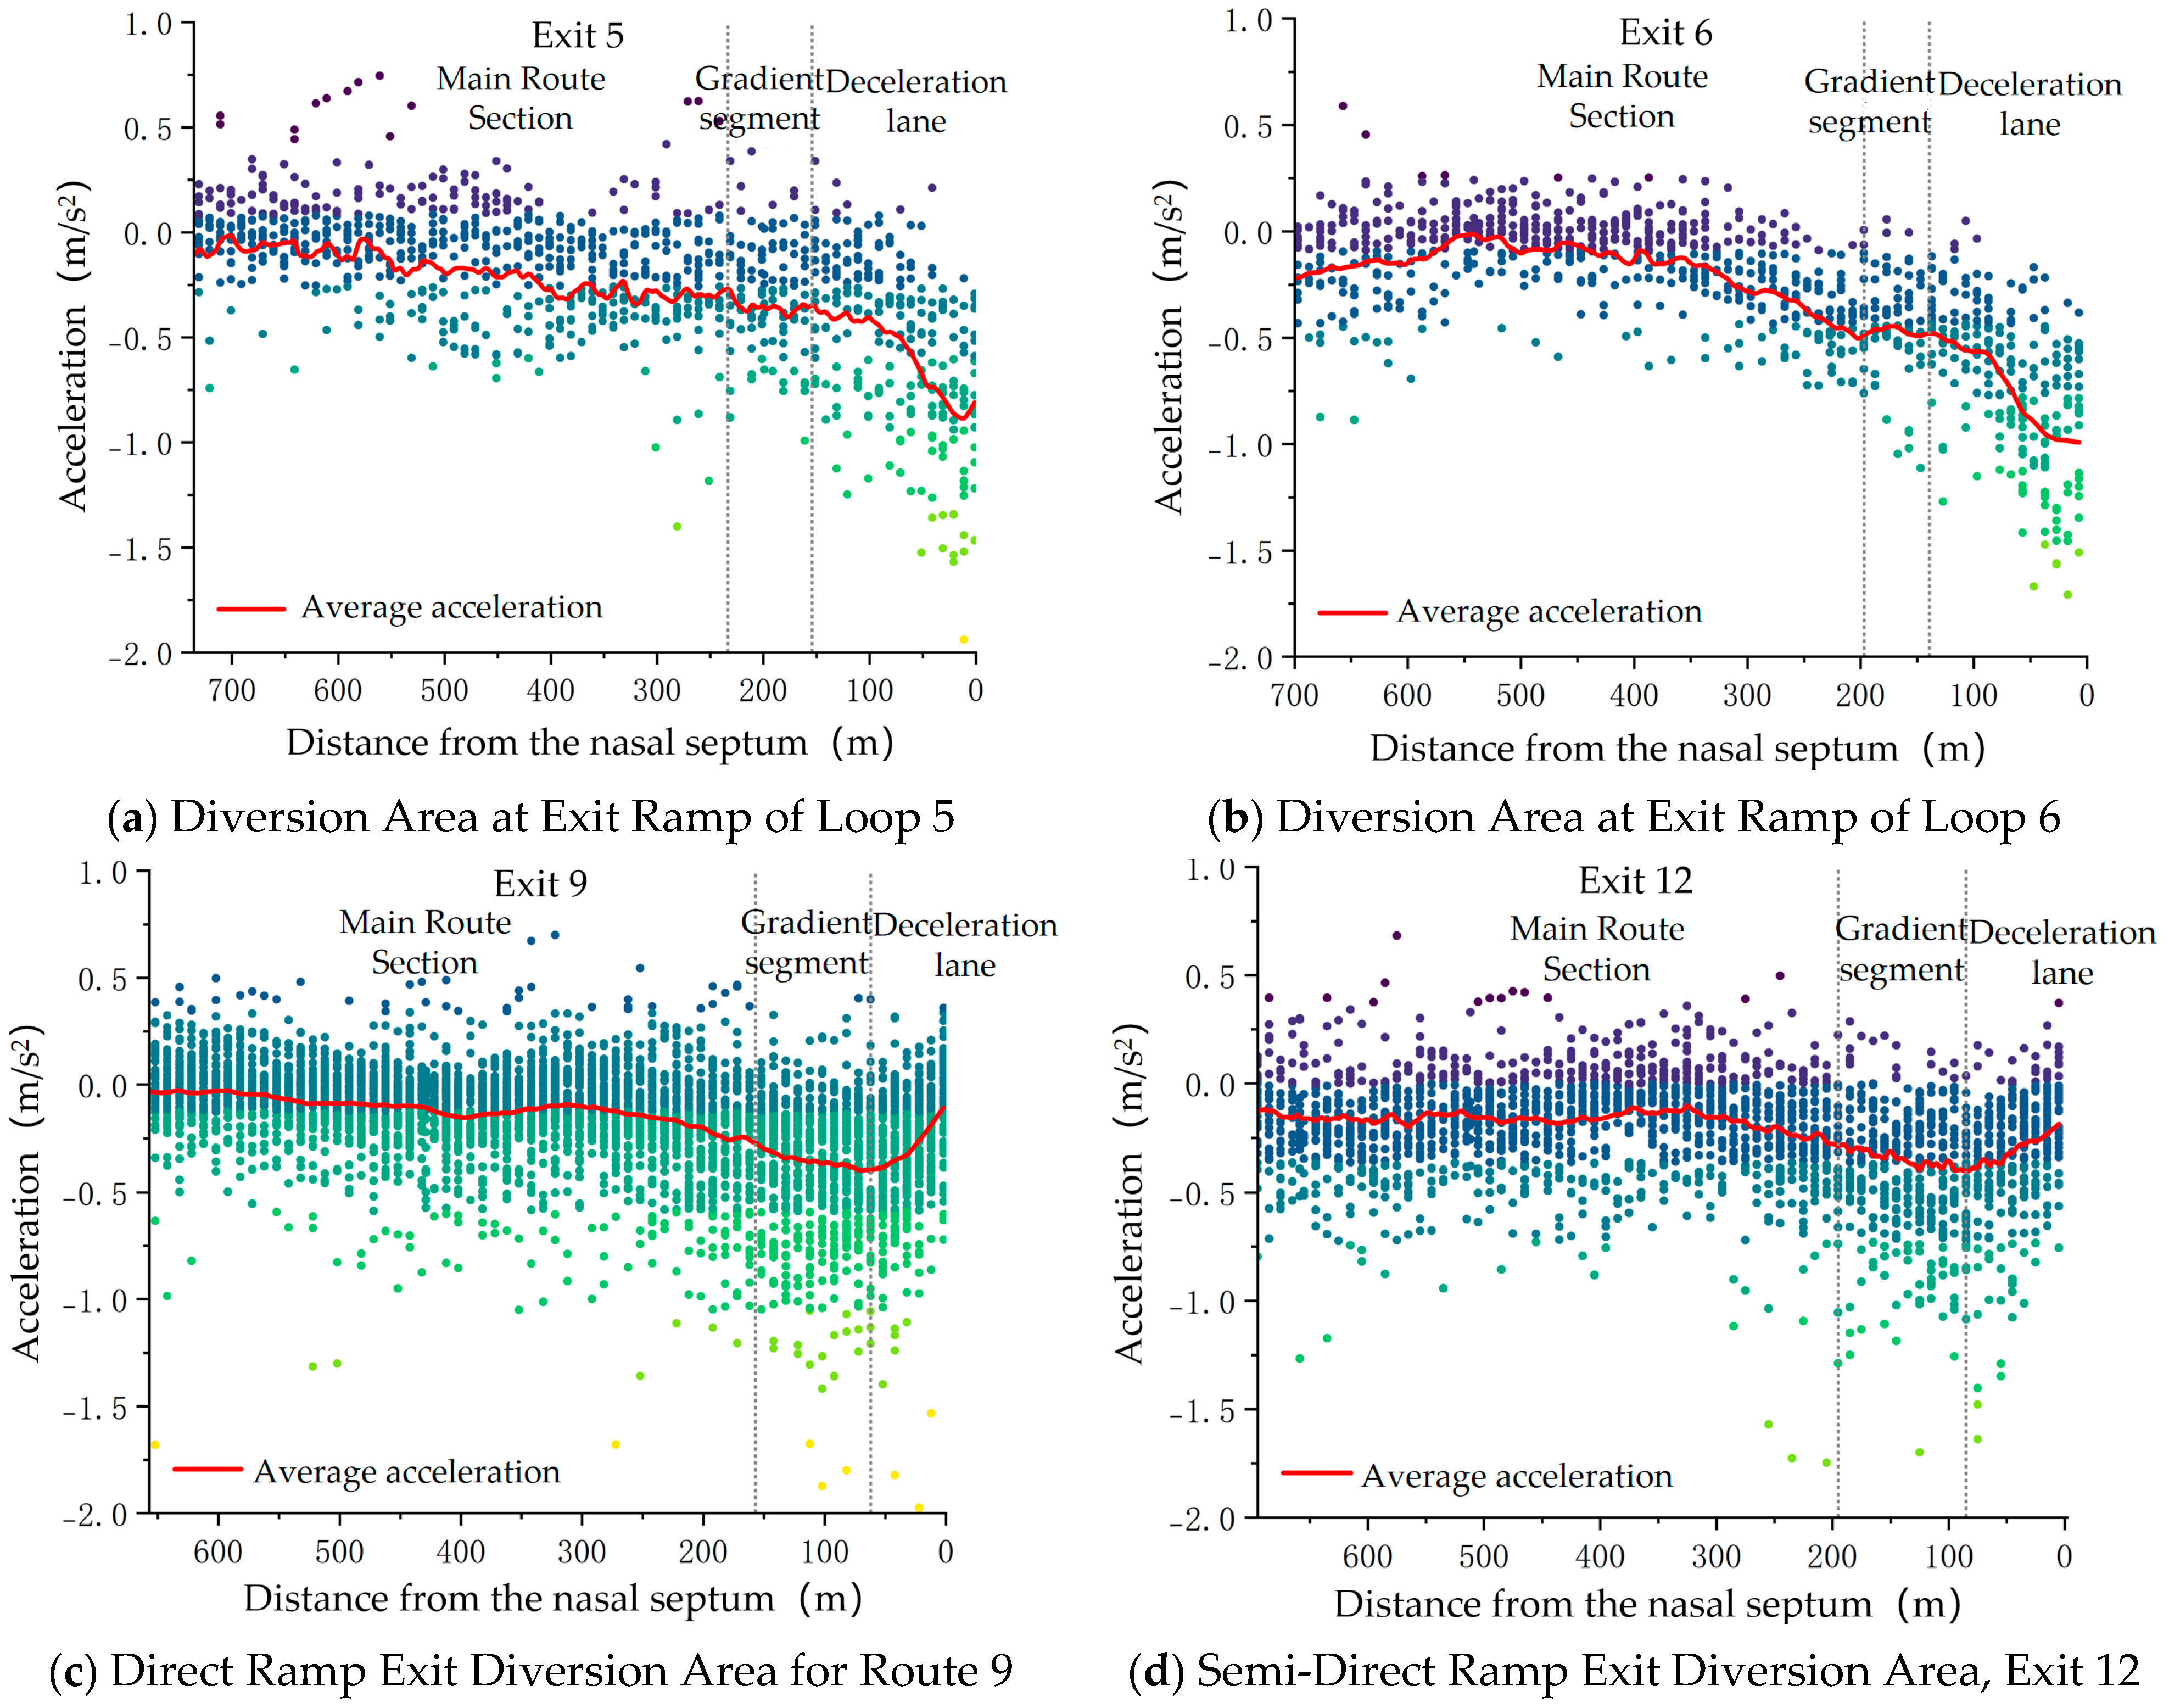
3.3. Longitudinal Acceleration Analysis
4. Traffic Safety Evaluation Method for Diverting Zones
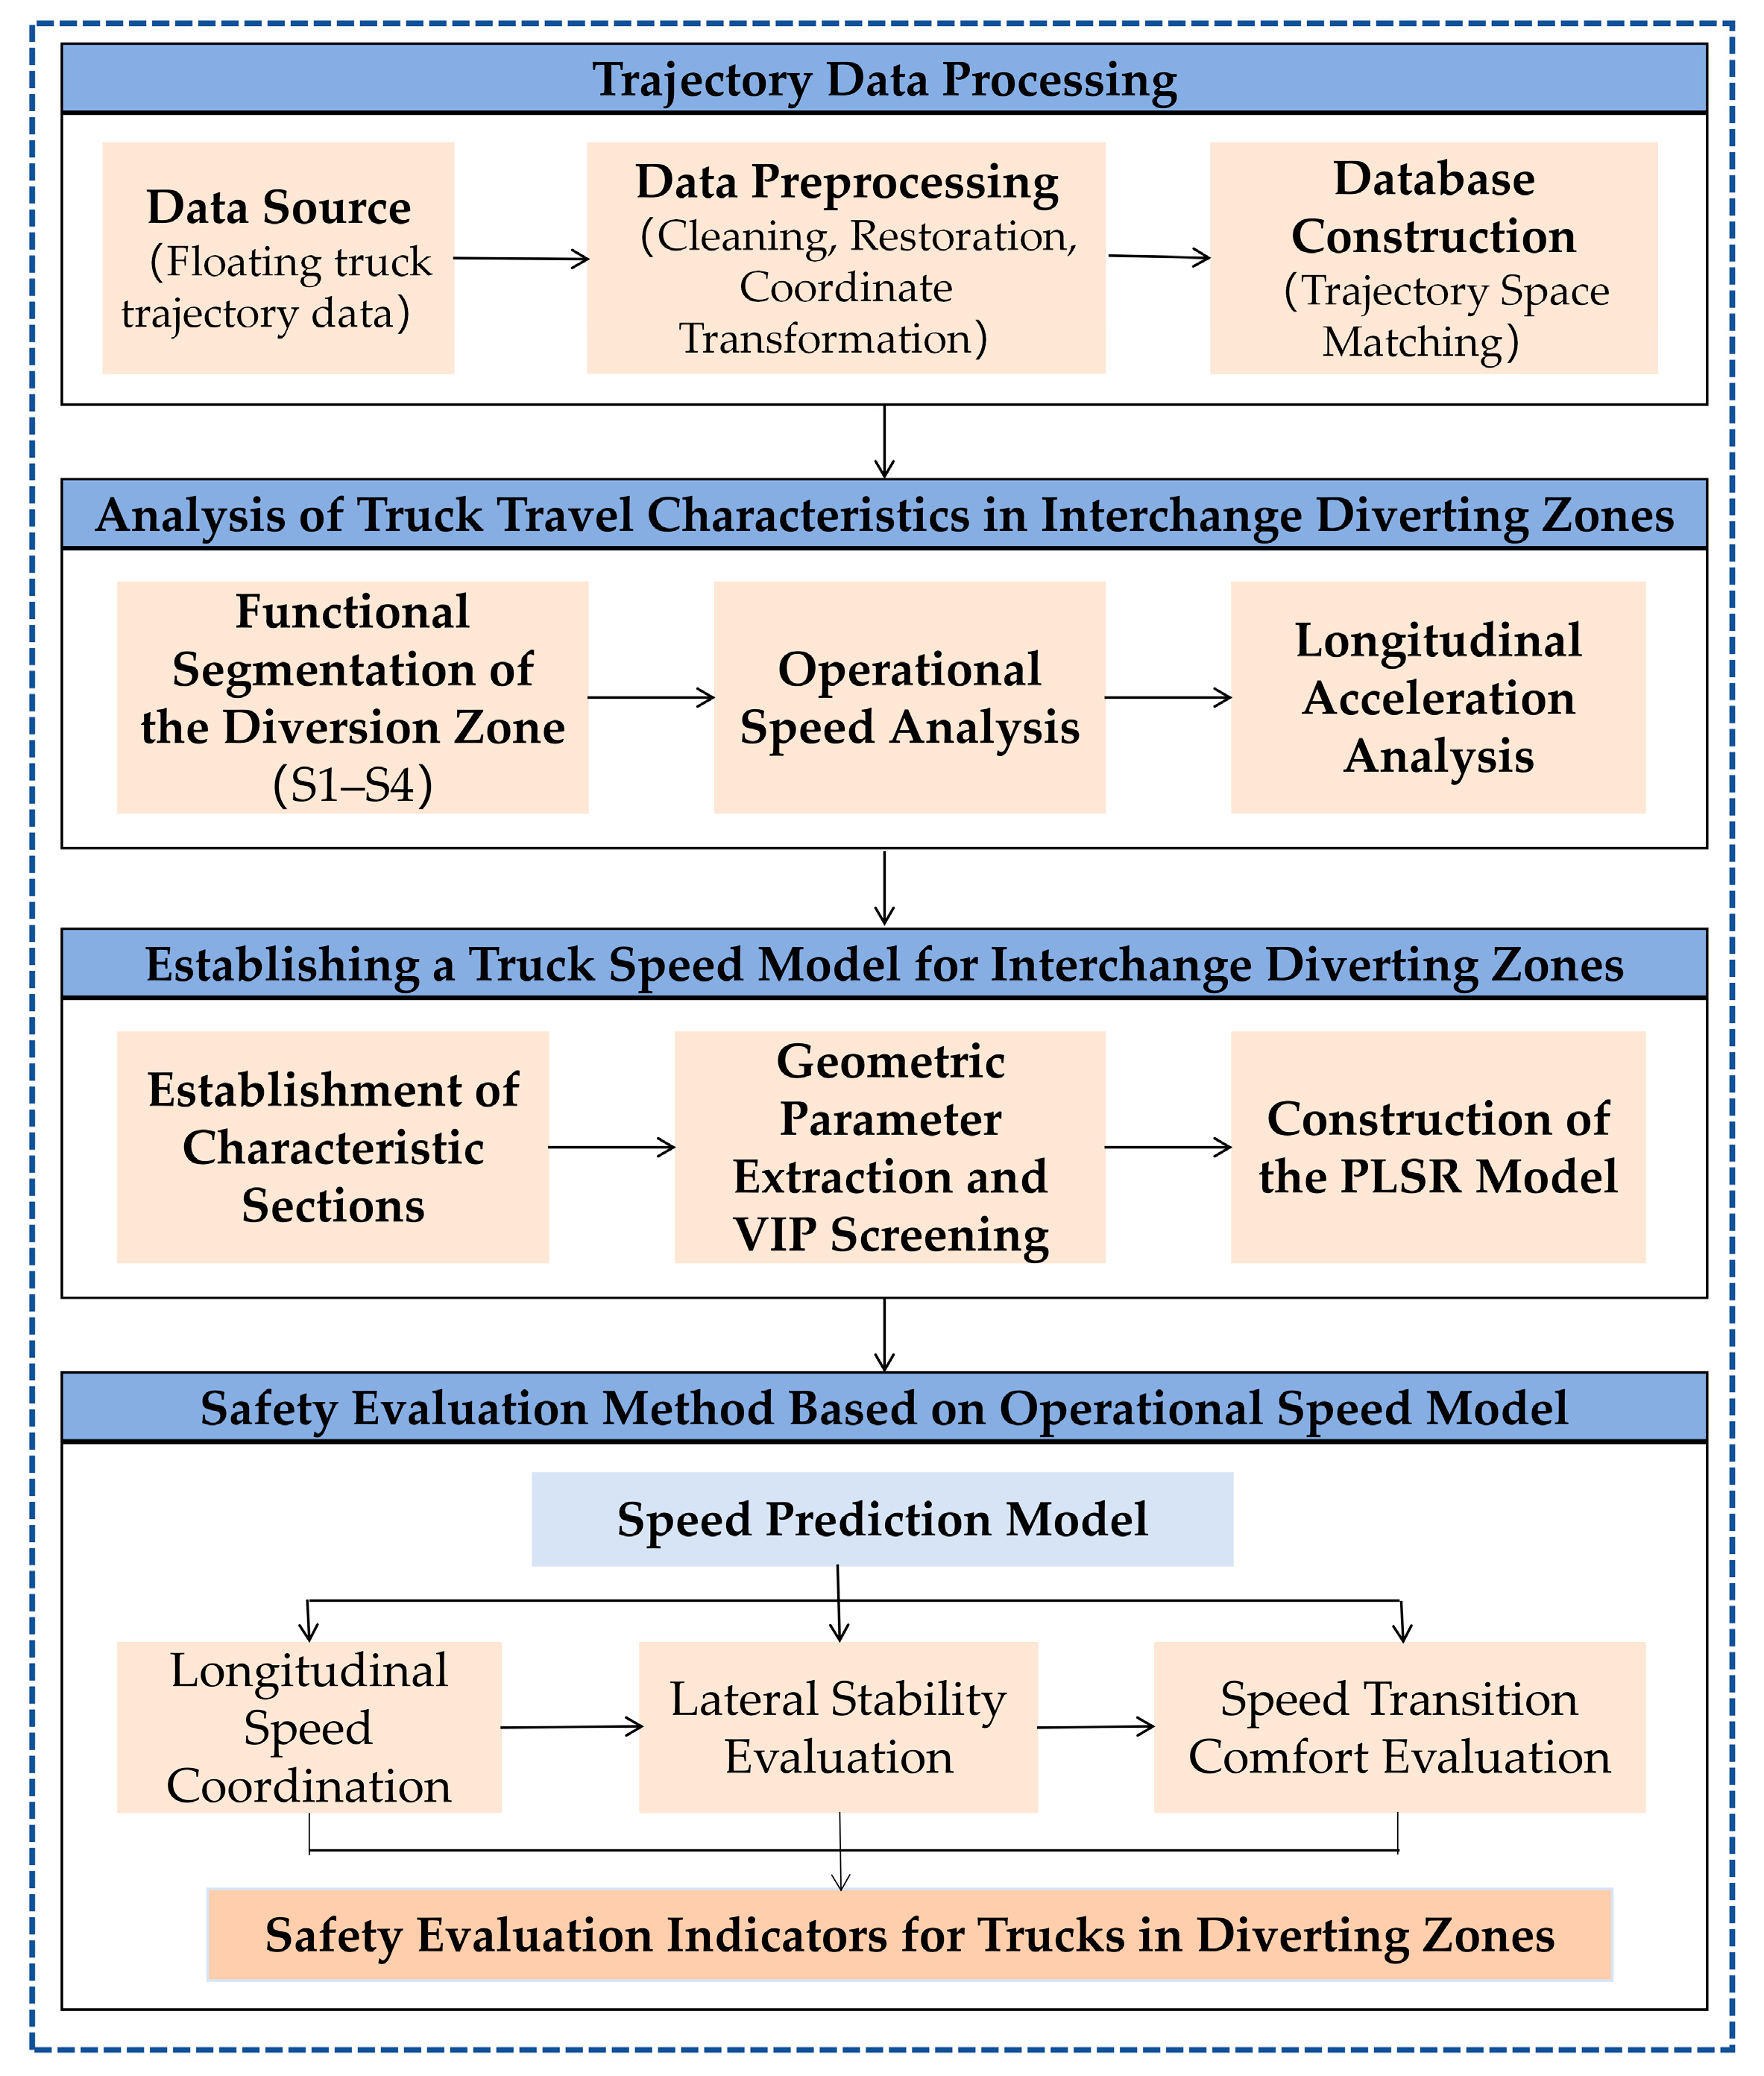
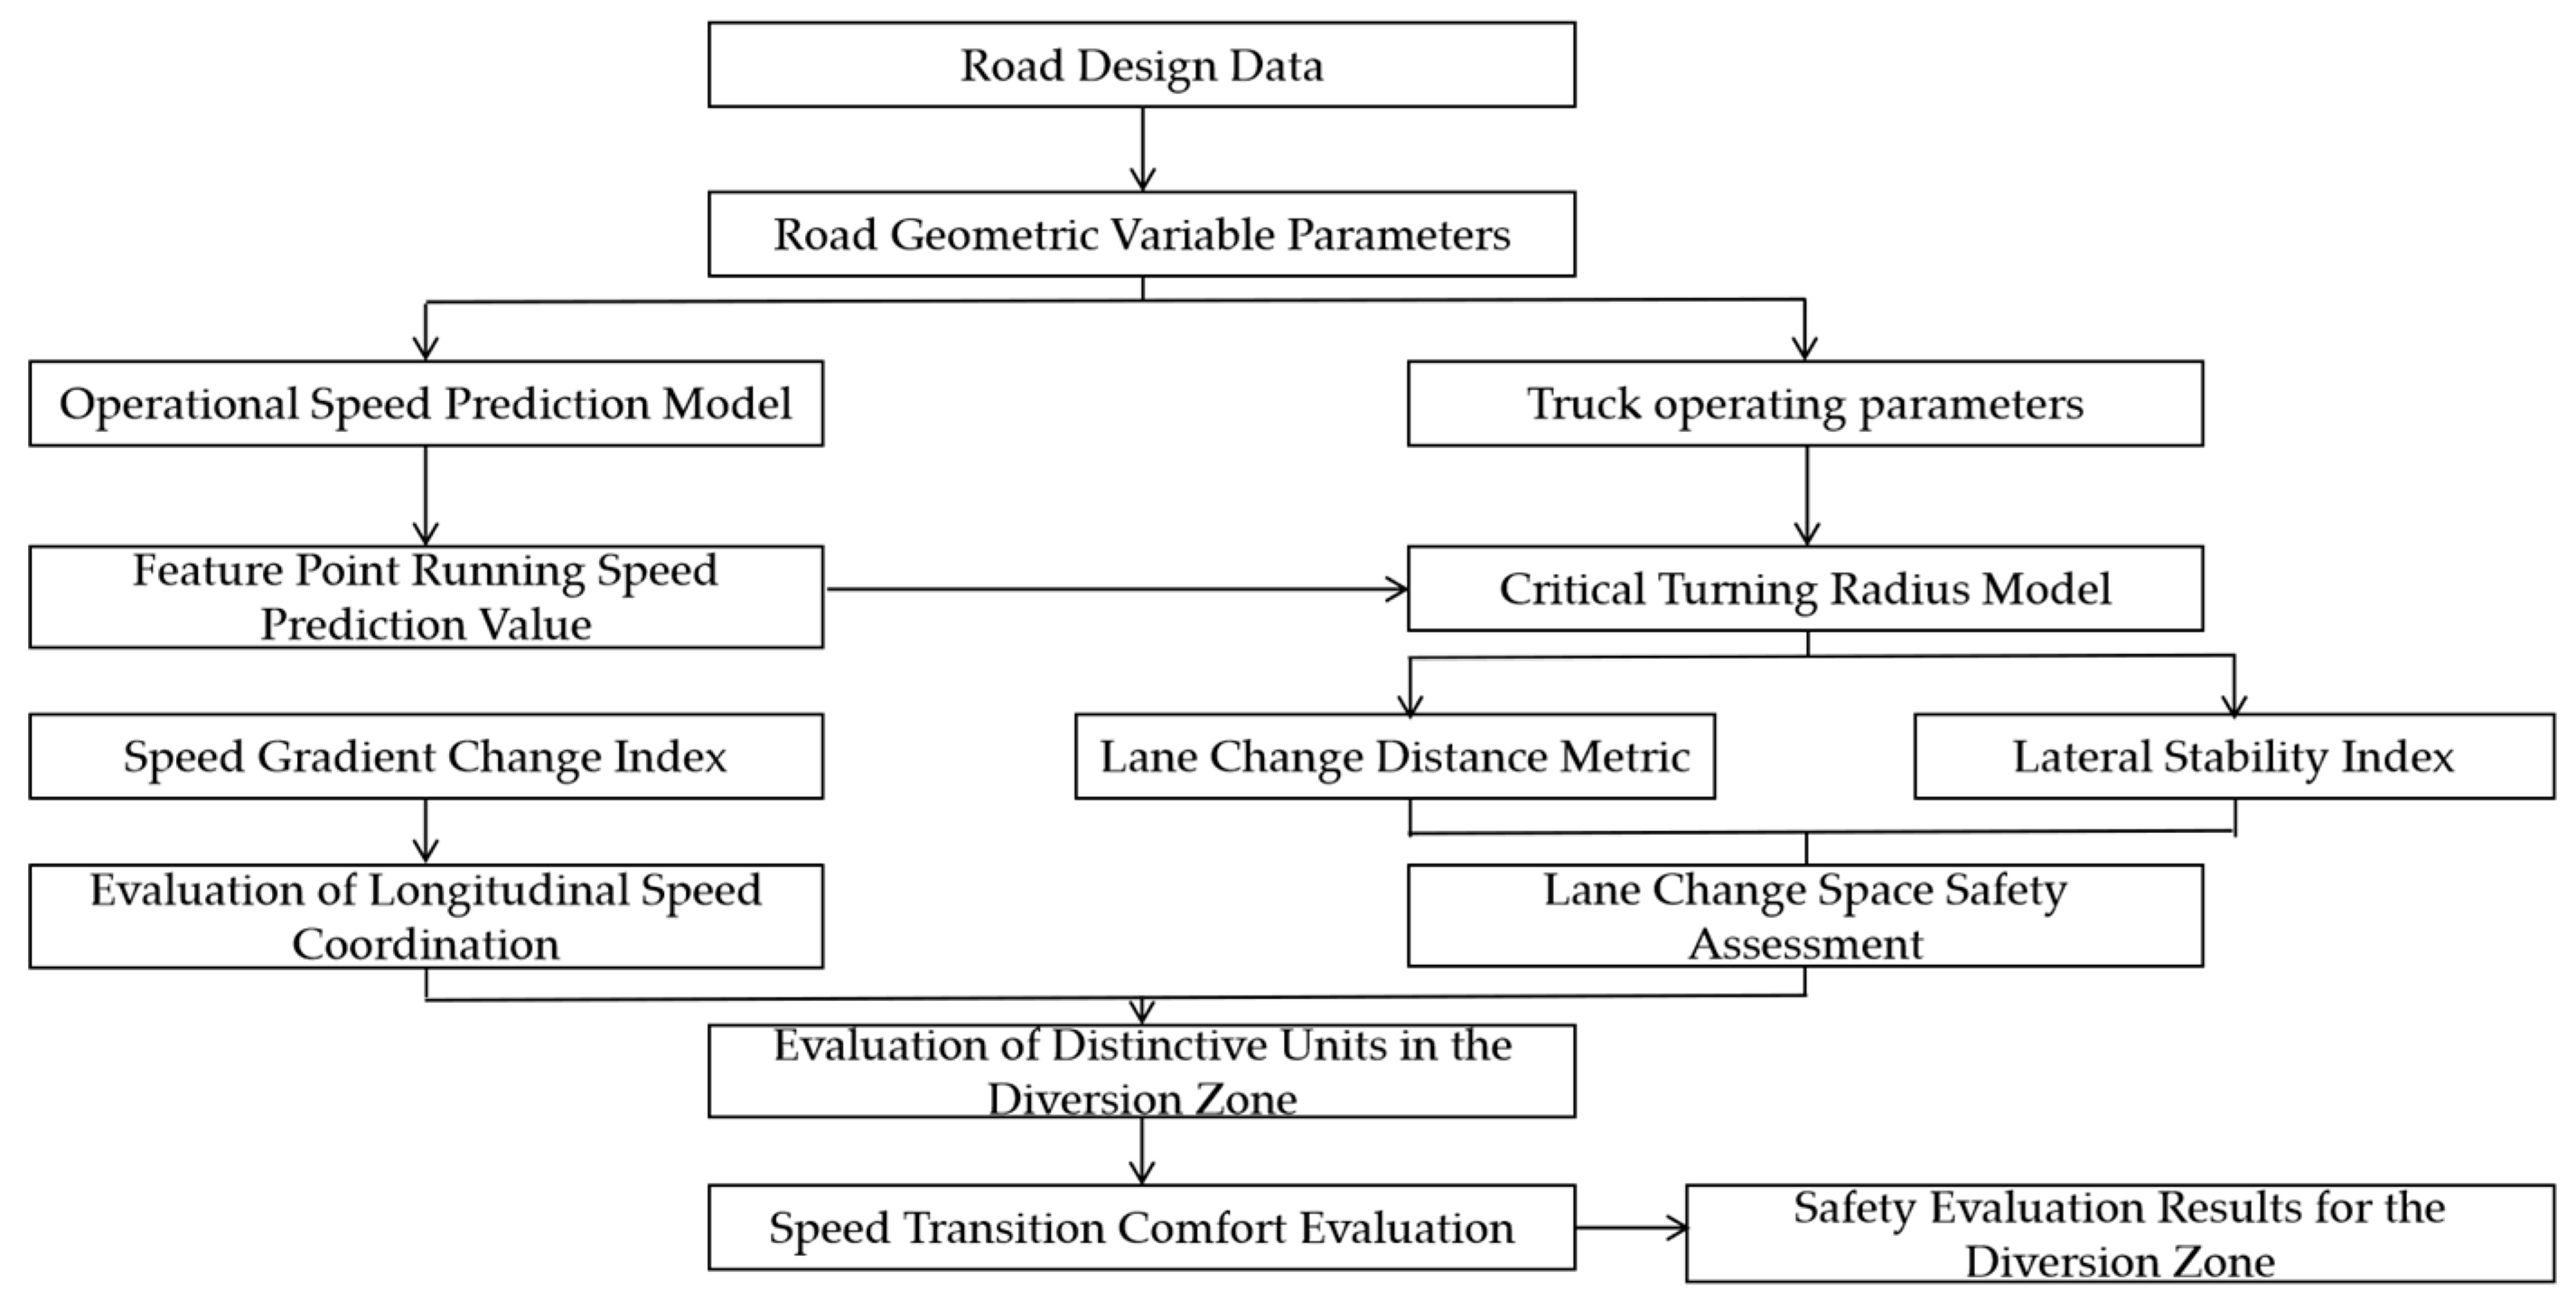
4.1. Safety Evaluation Process for Diverting Zones
4.2. Establishment of a Flow Rate Prediction Model for the Diversion Zone
4.2.1. Characteristic Section Classification
4.2.2. Determination of Parameters for Operational Speed Prediction Model
4.2.3. Method for Constructing Operational Speed Prediction Models
4.2.4. Speed Model Development
- Prediction Model for Initial Speed in the Diverting Preparation Zone
- Gradient Segment Start Speed Prediction Model
- Speed Prediction Model for Diversion Points
- Divergent Nasal Velocity Prediction Model
4.3. Safety Evaluation Criteria
- Evaluation of Longitudinal Speed Coordination
- Lateral Stability Evaluation
- Speed Transition Comfort Evaluation
5. Case Study Verification
5.1. Operational Speed Prediction and Coordination Evaluation
5.2. Lane Change Stability Evaluation
5.3. Evaluation of Comfort in Traffic Diversion and Speed Reduction
6. Conclusions
- A robust data processing pipeline was developed using floating car trajectory data from logistics trucks. The framework incorporates trajectory preprocessing, anomaly detection and cleaning, data quality assessment, and road information matching. Through integration with road design parameters and traffic facility information, a multi-dimensional “vehicle-road” database was established, providing a solid foundation for subsequent analysis.
- Based on the trajectory database and road characteristics, the diverging area was divided into functional sections for detailed analysis. The study revealed that: most trucks begin deceleration approximately 200 m before entering taper sections; operating speeds at divergence noses consistently exceed design speeds, with significant variations among different ramp types; deceleration rates at loop ramps are substantially higher than other ramp configurations; and over 85% of trucks initiate lane-changing within 20 m after entering taper sections.
- The diverging area was segmented into four characteristic sections based on truck behavior patterns. Using Variable Importance in Projection analysis and Partial Least Squares Regression, operating speed prediction models were developed for key locations including the divergence preparation area, taper section beginning, divergence point, and divergence nose. The models effectively address multicollinearity among variables and demonstrate strong explanatory power for speed variation patterns.
- A comprehensive safety assessment framework was established, evaluating operational safety from three perspectives: speed consistency between consecutive sections, vehicle stability during lane-changing maneuvers, and driver comfort during deceleration. The models were validated using four case studies, showing prediction errors below 10% MAPE. The safety evaluation results align well with actual field conditions, demonstrating practical applicability for engineering design and safety management.
- The current research primarily focuses on truck speed characteristics under free-flow conditions and does not fully capture operational patterns under non-free-flow traffic volumes. Future studies should expand the range of observation samples by incorporating variables such as different interchange types and traffic volumes to enhance the model’s applicability.
- Although the high-frequency floating car data used in this study offer extensive spatial and temporal coverage, they insufficiently account for truck-specific characteristics and the influence of diverse geographical environments on vehicle speeds in exit areas, leading to certain biases in speed prediction for specific vehicle types.
- This study concentrates solely on diverging areas of interchanges and does not thoroughly investigate truck driving behavior in merging areas and on ramps. Subsequent research may extend the scope to include these segments to provide a more comprehensive understanding.
Author Contributions
Funding
Institutional Review Board Statement
Informed Consent Statement
Data Availability Statement
Conflicts of Interest
Appendix A
Derivation of the Lateral Stability Evaluation Formula
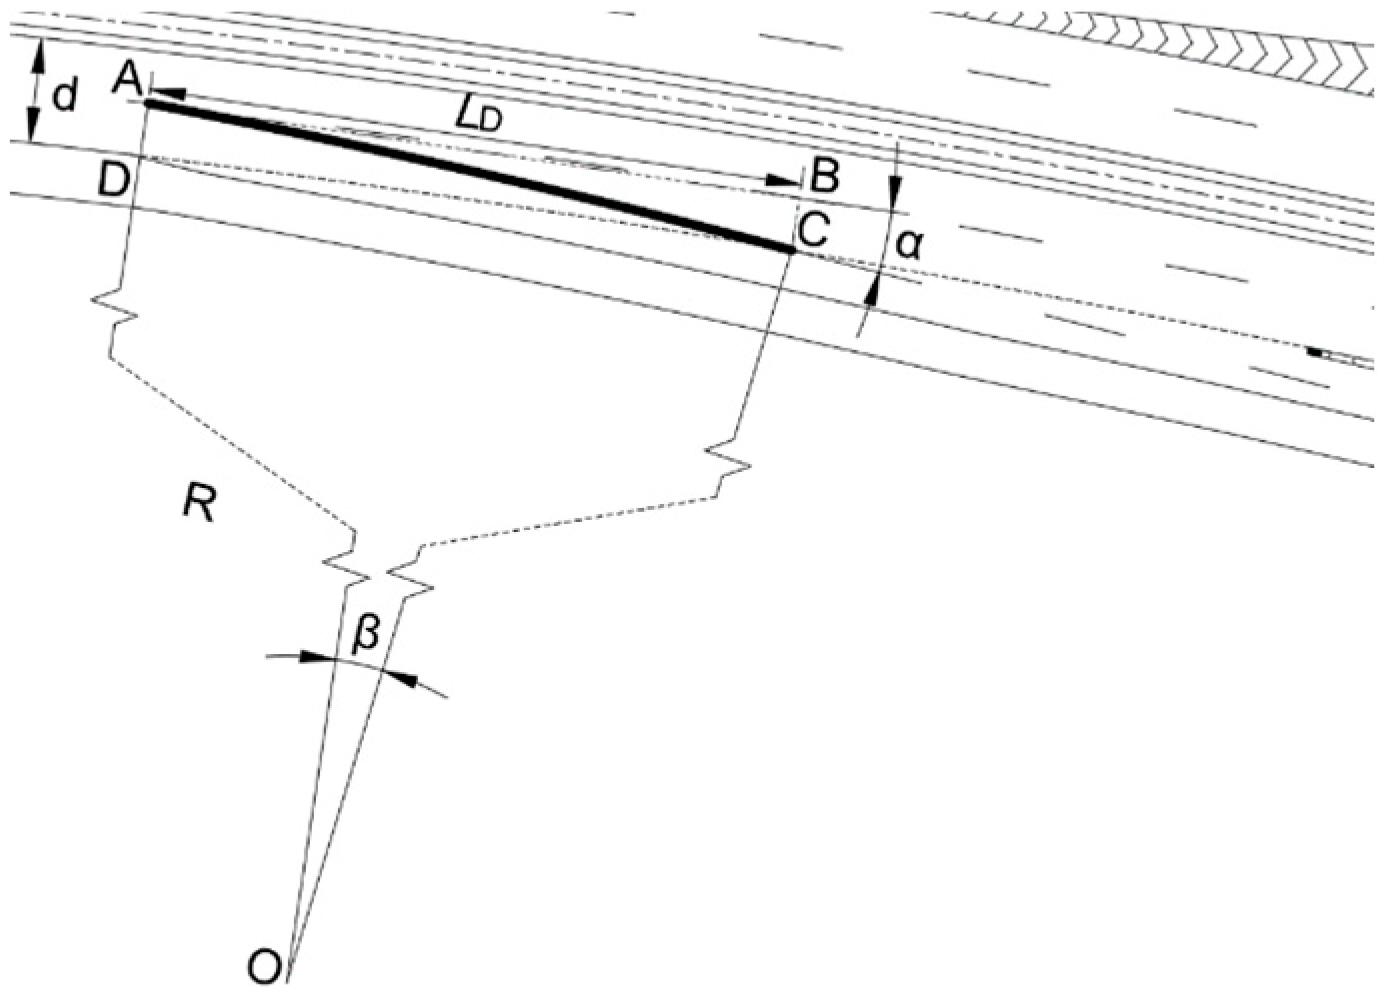
| Road Surface Conditions | Generally Dry | Wet | Icy and Snowy | Slippery Ice |
|---|---|---|---|---|
| Lateral Attachment Coefficient φ | 0.4~0.8 | 0.25~0.4 | 0.1~0.2 | 0.06 |
References
- Ministry of Transport of the People’s Republic of China. 2024 Statistical Bulletin on the Development of the Transport Industry [EB/OL]. Available online: https://xxgk.mot.gov.cn/2020/jigou/zhghs/202506/t20250610_4170228.html (accessed on 15 June 2025).
- Lin, P.Q.; Gong, M.P.; Zhou, C.H. Highway Truck User Profile Method for Transportation Risk Identification. J. South China Univ. Technol. (Nat. Sci. Ed.) 2023, 51, 1–9. [Google Scholar]
- Zhang, C.; Liu, K.; Wang, S.F.; Xie, Z.L.; Wang, X. A Review of Research on Safety of Entrance and Exit of Highway Interchanges. J. Traffic Inf. Saf. 2023, 41, 1–17. [Google Scholar]
- Zhang, C.; Hu, T.; Lin, X.C.; Bai, H.C.; Wu, S.G. Research on Exclusive Retarder Lanes for Large Trucks on Expressway Continuous Long Downgrade Sections. J. South China Univ. Technol. (Nat. Sci. Ed.) 2020, 48, 104–113. [Google Scholar]
- Zhang, G. Research on the Influence Effect of Trucks in the Highway Ramp Diverging Area. Master’s Thesis, Chang’an University, Xi’an, China, 2019. [Google Scholar]
- Wang, B.; Zhang, C.; Ren, S.P.; Liu, C.H.; Xie, Z.L. Identification Method of Driving Risk on Expressway Based on Velocity Risk Potential Field. J. Zhejiang Univ. (Eng. Sci.) 2023, 57, 997–1008. [Google Scholar]
- She, M.X. Research on Vehicle Operating Speed Prediction Model for Continuous Downgrade Sections Based on Cross-Section Observation Method. J. Highw. Transp. Res. Dev. (Appl. Technol. Ed.) 2019, 15, 310–315. [Google Scholar]
- Liu, Q.; Yang, Z.C.; Cai, L. Short-Term Traffic Flow Forecasting on Expressways Based on ETC Gantry Data. J. Highw. Transp. Res. Dev. 2022, 39, 123–130. [Google Scholar]
- Wu, L.; Liu, J.B.; Ma, X.L.; Liu, W.W.; Wang, Y.Q. Lane-Level Speed Characteristics and Short-Term Prediction Model for Diverging and Merging Areas of Expressway Interchanges. J. Highw. 2023, 68, 182–191. [Google Scholar]
- Zhang, C.; Gao, Y.Y.; Yang, R.W.; Liu, C.H.; Xie, Z.L.; Jin, Y.L. Operating Speed Model for Small Clear Distance Sections of Interchange Tunnels Based on Aerial Data. J. Chang’an Univ. (Nat. Sci. Ed.) 2024, 44, 136–150. [Google Scholar]
- Xu, J.; Wang, Y.P.; Chen, H.Y.; Zhang, X.B.; Pan, C.S. Longitudinal Driving Characteristics and Operating Speed Model of Passenger Cars on Hairpin Curves of Mountain Highways. J. Jilin Univ. (Eng. Technol. Ed.) 2023, 53, 3432–3445. [Google Scholar]
- Guo, Q.M.; Wang, X.S.; Chen, Z.G. Operating Speed Modeling for Mountain Expressways Based on Driving Simulation Experiments. J. Tongji Univ. (Nat. Sci.) 2019, 47, 1004–1010. [Google Scholar]
- Lyu, M.; Ji, Y.; Kuai, C.; Zhang, S. Short-Term Prediction of On-Street Parking Occupancy Using Multivariate Variable Based on Deep Learning. J. Traffic Transp. Eng. (Engl. Ed.) 2024, 11, 28–40. [Google Scholar] [CrossRef]
- Gao, C.; Xu, J.L.; Jia, M.; Sun, Z.H. Correlation Between Carbon Emissions, Fuel Consumption of Vehicles and Speed Limit on Expressway. J. Traffic Transp. Eng. (Engl. Ed.) 2024, 11, 631–642. [Google Scholar] [CrossRef]
- Zhang, M.; Chen, J.L.; Zhang, C.; Wang, S.F.; Xiao, F. Aerial Photography Data-Based Method for Evaluating Traffic Safety of Highway Exit Loop Ramps. J. Chang’an Univ. (Nat. Sci. Ed.) 2024, 44, 108–118. [Google Scholar]
- Xin, F.F.; Chen, X.H.; Lin, H.F. Research on Road Network Coverage Capability of Floating Car Data Based on Sample Size. J. Highw. Transp. Res. Dev. 2009, 26, 140–144. [Google Scholar]
- Yan, X.D.; Liu, X.B.; Liu, Y.; Ma, S.X. Urban Traffic Congestion Identification and Evaluation Based on Floating Car Big Data and Grid Model. J. Beijing Jiaotong Univ. 2019, 43, 104–113. [Google Scholar]
- Ding, T.J.; Shi, D.X.; Li, Y.M. Road Average Speed Estimation Method Based on Taxi GPS Data. J. Comput. Technol. Dev. 2015, 25, 15–19. [Google Scholar]
- Hu, J.B.; Ma, W.Q. Study on Length of Speed Change Lane for Trumpet Interchange of Expressway. Proc. 8th China Intell. Transp. Annu. Meet. 2013, 2592, 779–780. [Google Scholar]
- Lyu, N.C.; Du, Z.J.; Wu, C.Z.; Wang, Y.G. Safety Characteristics Analysis of Multi-Lane Expressway Exit Opening Section. J. Transp. Syst. Eng. Inf. Technol. 2021, 21, 120–130. [Google Scholar]
- Gu, X. Research on Traffic Conflict Prediction Model for Merging Areas of Expressway Interchanges. Master’s Thesis, Southeast University, Nanjing, China, 2020. [Google Scholar]
- Zhao, J.; Guo, Y.; Liu, P. Safety Impacts of Geometric Design on Freeway Segments with Closely Spaced Entrance and Exit Ramps. Accid. Anal. Prev. 2021, 163, 106461. [Google Scholar] [CrossRef] [PubMed]
- Yan, Y.; Zhang, Y.; Li, G.P.; Zhang, P.; Wang, X.F. Comprehensive Evaluation of Highway Alignment Consistency Based on Speed Characteristic Indicators. J. Saf. Environ. 2017, 17, 835–839. [Google Scholar]
- Xu, J.; Cui, Q.; Lin, W.; Wang, C.Q.; Wu, G.X. Passenger Car Speed Characteristics on Spiral Ramps and Spiral Bridges. China J. Highw. Transp. 2019, 32, 158–171. [Google Scholar]
- Shen, Q.R.; Zhao, Y.F.; Chen, Z.Y.; Cao, H. Sight Distance Analysis for Identifying Constrained Exits of Expressway Interchanges. J. China Foreign Highw. 2012, 32, 305–307. [Google Scholar]
- Wu, Y. Study on Sight Distance for Exit Recognition of Expressway Interchanges. Highw. Automot. Appl. 2014, 3, 109–112. [Google Scholar]
- Zhang, C.; Qi, C.; Hua, G.L.; Liu, Y.Y. Driving Risk Simulation Analysis of Lorries at Interchange Exit Section. J. Railw. Sci. Eng. 2016, 13, 2522–2532. [Google Scholar]
- Lamm, R.; Choueiri, E.M.; Hayward, J.C.; et al. Possible Design Procedure to Promote Design Consistency in Highway Geometric Design on Two-Lane Rural Roads. Transp. Res. Rec. 1988, 1195, 111–122. [Google Scholar]
- Wang, X.; Dong, X.; Zhang, Z.; Wang, Y. Transportation Carbon Reduction Technologies: A Review of Fundamentals, Application, and Performance. J. Traffic Transp. Eng. (Engl. Ed.) 2024, 11, 1340–1377. [Google Scholar] [CrossRef]
- Bucchi, A.; Biasuzzi, K.; Simone, A. Evaluation of Design Consistency: A New Operating Speed Model for Rural Roads on Grades. Transp. Res. Rec. 2005, 1701, 76–85. [Google Scholar]
- Papadopoulos, E.; Nikolaidou, A.; Lilis, E.; Politis, I.; Papaioannou, P. Extending the Decision-Making Process During Yellow Phase from Human Drivers to Autonomous Vehicles: A Microsimulation Study with Safety Considerations. J. Traffic Transp. Eng. (Engl. Ed.) 2024, 11, 362–379. [Google Scholar] [CrossRef]
- Guo, T.Y.; Deng, W.; Lu, J. Safety Evaluation of Expressway Exits Based on Speed Consistency. J. Transp. Syst. Eng. Inf. Technol. 2010, 10, 76–81. [Google Scholar]
- Gao, J.; Guo, Z. Evaluation of Highway Alignment Design Quality Based on Operating Speed. J. Tongji Univ. (Nat. Sci.) 2004, 32, 906–911. [Google Scholar]
- Chen, X.G. Comprehensive Safety Evaluation of Highway Alignment Based on Operating Speed. Master’s Thesis, Chongqing Jiaotong University, Chongqing, China, 2015. [Google Scholar]
- Římalová, V.; Elgner, J.; Ambros, J.; Fišerová, E. Modelling the Driving Speed on Expressway Ramps Based on Floating Car Data. Measurement 2022, 195, 110995. [Google Scholar] [CrossRef]
- Xu, J.; Cui, Q.; Chang, X.; Fu, J.H.; Wu, G.X. Longitudinal Driving Behavior Characteristics at Entrances/Exits of Cloverleaf Interchanges. J. Southeast Univ. (Nat. Sci. Ed.) 2019, 49, 1205–1214. [Google Scholar]
- Lee, H.E.; Lee, E. Congestion Boundary Approach for Phase Transitions in Traffic Flow. Transpmetrica B Transp. Dyn. 2024, 12, 1–20. [Google Scholar] [CrossRef]
- Van de Waterbeemd, H. (Ed.) PLS for multivariate linear modeling. In Chemometric Methods in Molecular Design; Verlag-Chemie: Weinheim, Germany, 1995; pp. 195–218. [Google Scholar]
- Zeng, T.; Ju, C.Y.; Cai, T.J.; Liu, W.B.; Yao, Y.F. Selection of Canopy Density Estimation Parameters Using Variable Projection Importance Criterion. J. Beijing For. Univ. 2010, 32, 37–41. [Google Scholar]
- JTG B05-2015; Specifications for Highway Safety Audit. China Communications Press: Beijing, China, 2015.
- Laval, J.A. Traffic Flow as a Simple Fluid: Toward a Scaling Theory of Urban Congestion. Transp. Res. Rec. 2024, 2678, 376–386. [Google Scholar] [CrossRef]
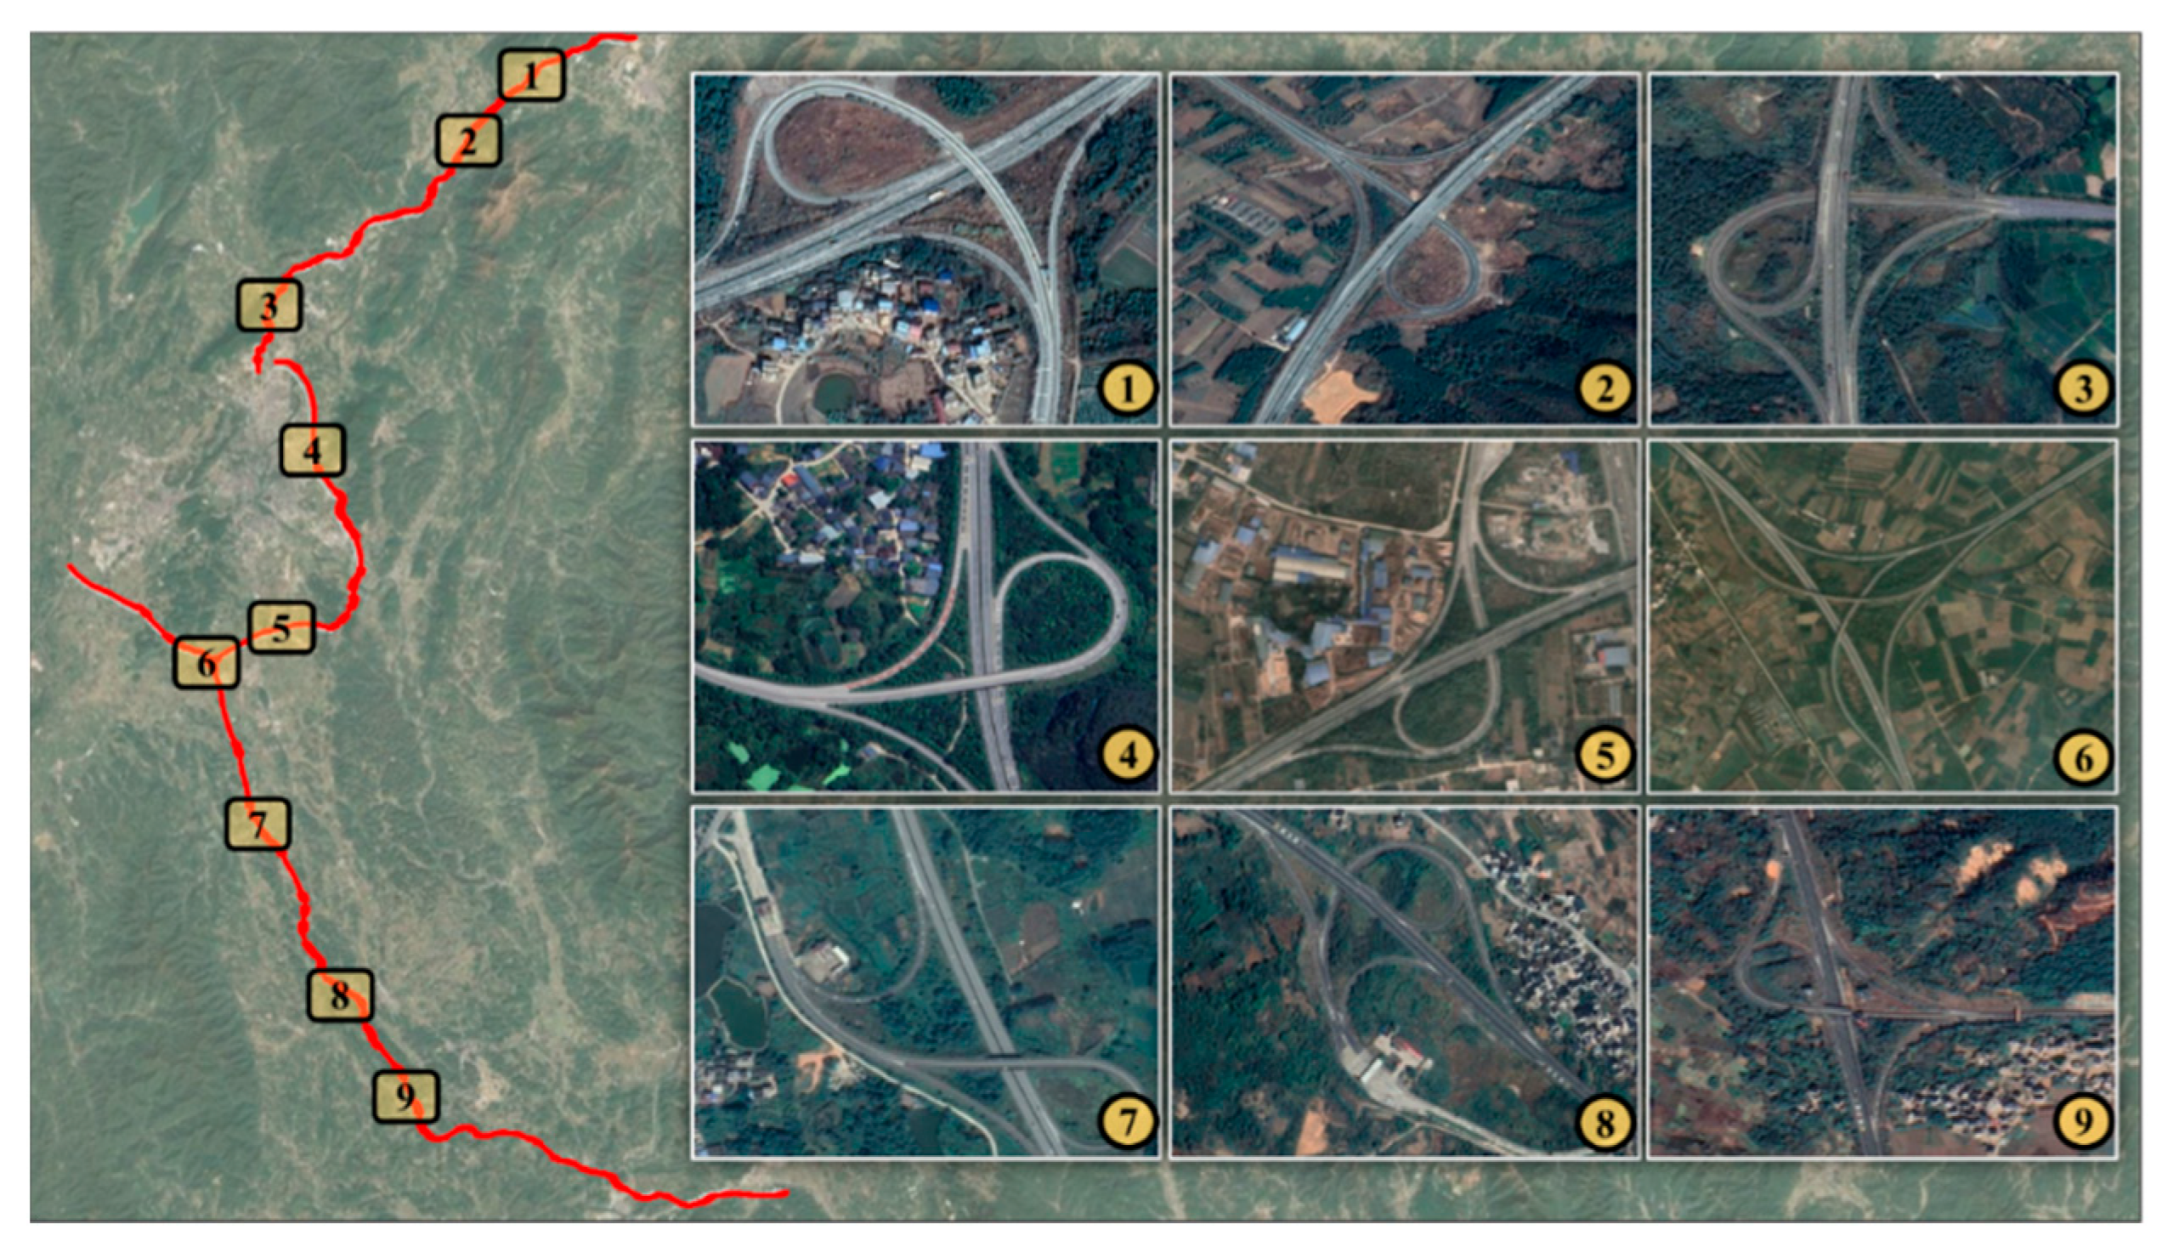



| Export Number | Interchange Type | Mainline Hard Shoulder Width w (m) | Design Speed of Ramp VL (m) | Variable Speed Lane Length LVSL (m) | Exit Ramp Type | Sample Size (Vehicles) |
|---|---|---|---|---|---|---|
| 1 | B Horn | 2.5 | 40 | 236 | Direct-connect | 257 |
| 2 | B Horn | 2.5 | 40 | 233 | Circular ring | 45 |
| 3 | B Horn | 3.0 | 40 | 197 | Circular ring | 40 |
| 4 | B Horn | 3.0 | 40 | 215 | Direct-connect | 85 |
| 5 | A Horn | 3.5 | 40 | 140 | Semi-direct connection | 46 |
| 6 | B Horn | 2.5 | 40 | 220 | Direct-connect | 42 |
| 7 | A Horn | 2.5 | 40 | 227 | Semi-direct connection | 180 |
| 8 | A Horn | 2.5 | 40 | 230 | Direct-connect | 40 |
| 9 | Y-type | 3.0 | 40 | 213 | Semi-direct connection | 156 |
| 10 | A Horn | 3.0 | 60 | 157 | Direct-connect | 346 |
| 11 | A Horn | 3.0 | 40 | 195 | Direct-connect | 41 |
| 12 | A Horn | 3.0 | 40 | 195 | Direct-connect | 82 |
| 13 | B Horn | 2.5 | 40 | 230 | Circular ring | 51 |
| 14 | A Horn | 3.0 | 40 | 158 | Semi-direct connection | 49 |
| 15 | Y-type | 3.0 | 60 | 142 | Direct-connect | 46 |
| 16 | A Horn | 3.0 | 40 | 136 | Direct-connect | 39 |
| Interval Section | Average Speed Reduction (km/h) | SD | Average Cumulative Decrease (%) |
|---|---|---|---|
| Section S1 | 0.01 | 6.87 | 0.2 |
| Section S2 | 2.60 | 6.23 | 2.1 |
| Section S3 | 9.58 | 7.17 | 12.7 |
| S4 Diverting Zone | 4.40 | 3.86 | 18.2 |
| S4 Deceleration Lane | 8.30 | 6.00 | 28.7 |
| Variable | Export Number | |||||||||||
|---|---|---|---|---|---|---|---|---|---|---|---|---|
| 1 | 2 | 3 | 4 | 5 | 6 | 7 | 8 | 9 | 10 | 11 | 12 | |
| Lt/m | 80 | 77 | 80 | 58 | 79 | 58 | 73 | 78 | 95 | 85 | 90 | 110 |
| Ld/m | 140 | 150 | 150 | 178 | 154 | 139 | 142 | 135 | 62 | 110 | 50 | 85 |
| L1/m | 130 | 162 | 165 | 131 | 133 | 74 | 116 | 98 | 100 | 100 | 100 | 130 |
| L2/m | 90 | 65 | 65 | 105 | 100 | 123 | 99 | 115 | 57 | 95 | 40 | 65 |
| R1/m | 2400 | 9999 | 2000 | 2000 | 2000 | 1200 | 1200 | 4000 | 2200 | 2500 | 2000 | 9999 |
| R2/m | 1000 | 2000 | 1500 | 900 | 1000 | 200 | 989 | 300 | 600 | 450 | 400 | 600 |
| R3/m | 120 | 160 | 140 | 180 | 60 | 55 | 135 | 250 | 540 | 300 | 140 | 400 |
| C1 | 2.29 | 1 | 2.75 | 2.75 | 2.75 | 4.58 | 4.58 | 1.38 | 2.5 | 2.2 | 2.75 | 1 |
| C2 | 1.00 | 1.00 | 1.00 | 1.11 | 1.00 | 5.00 | 1.01 | 3.33 | 1.67 | 2.22 | 2.50 | 1.67 |
| C3 | 8.33 | 6.25 | 1.00 | 5.56 | 16.67 | 18.18 | 7.41 | 4.00 | 1.85 | 3.33 | 7.14 | 2.50 |
| Cw | 1.00 | 1.00 | 1.00 | 1.00 | 1.17 | 1.27 | 1.00 | 1.00 | 1.00 | 1.00 | 1.00 | 1.00 |
| i1/% | −1.57 | −1.50 | 0.50 | 0.50 | 2.50 | −0.31 | 1.00 | 0.30 | 0.44 | 1.30 | 0.30 | −1.16 |
| i2/% | 1.25 | −0.44 | −2.00 | 0.30 | −1.73 | 1.46 | −1.46 | 0.30 | 0.44 | −1.45 | 0.30 | −0.30 |
| a1/° | 20 | 0 | 27 | 45 | 45 | 25 | 25 | 24 | 55 | 18 | 18 | 0 |
| K | 0.05 | 0.05 | 0.05 | 0.07 | 0.05 | 0.07 | 0.05 | 0.05 | 0.04 | 0.05 | 0.04 | 0.04 |
| Ls/m | 70 | 75 | 250 | 75 | 70 | 30 | 60 | 30 | 30 | 70 | 75 | 40 |
| Variable | Export Number | |||
|---|---|---|---|---|
| 13 | 14 | 15 | 16 | |
| K | 0.053 | 0.059 | 0.047 | 0.050 |
| L1/m | 120.00 | 100.00 | 100.00 | 82.00 |
| Ld/m | 155.00 | 90.00 | 57.00 | 54.00 |
| L2/m | 110.00 | 58.00 | 42.00 | 52.00 |
| w/m | 2.50 | 3.50 | 3.50 | 3.50 |
| C2 | 5.00 | 2.44 | 2.08 | 1.25 |
| C3 | 7.14 | 2.44 | 2.08 | 11.11 |
| Cw | 1.17 | 1.00 | 1.00 | 1.00 |
| R2/m | 200.00 | 410.00 | 480.00 | 800.00 |
| R3/m | 60 | 120.00 | 320 | 90.00 |
| Ls/m | 120 | 331 | 250 | 75 |
| Export Number | V1 | Vt | Vd | Vr | V1 | Vt | Vd | Vr | V1 | Vt | Vd | Vr |
|---|---|---|---|---|---|---|---|---|---|---|---|---|
| MAPE (%) | MAE (km/h) | MPE (%) | ||||||||||
| 13 | 0.7 | 3.6 | 3.1 | 2.6 | 0.6 | 2.9 | 2.5 | 1.8 | −0.7 | 3.6 | 3.1 | −2.6 |
| 14 | 1.8 | 4.3 | 2.0 | 6.3 | 1.6 | 3.5 | 1.5 | 4.5 | 1.8 | 4.3 | 2.0 | 6.3 |
| 15 | 1.5 | 5.9 | 5.3 | 4.1 | 1.5 | 5.6 | 4.5 | 3.4 | −1.5 | −5.9 | −5.3 | −4.1 |
| 16 | 1.4 | 1.1 | 0.4 | 4.3 | 1.3 | 0.9 | 0.3 | 2.9 | 1.4 | 1.1 | −0.4 | 4.3 |
| Export Number | Prediction | Actual Measurement | |||||
|---|---|---|---|---|---|---|---|
| |v85| | |Iv| | Evaluation Results | |v85| | |Iv| | Evaluation Results | ||
| 13 | Diverting Impact Zone | 3.02 | 1.01 | Low risk | 2.43 | 0.81 | Low risk |
| Diverting Preparation Zone | 4.55 | 2.28 | Low risk | 8.08 | 4.04 | Low risk | |
| Transition Section | 2.23 | 2.97 | Low risk | 1.76 | 2.34 | Low risk | |
| Deceleration Lane | 15.32 | 9.88 | Moderate risk | 10.86 | 7.00 | Moderate risk | |
| 14 | Diverting Impact Zone | 4.72 | 1.57 | Low risk | 6.37 | 2.12 | Low risk |
| Diverting Preparation Zone | 6.69 | 3.34 | Low risk | 8.56 | 4.28 | Low risk | |
| Transition Section | 5.86 | 8.62 | Low risk | 3.90 | 5.73 | Low risk | |
| Deceleration Lane | 4.54 | 5.04 | Low risk | 7.45 | 8.28 | Low risk | |
| 15 | Diverting Impact Zone | 8.42 | 2.81 | Low risk | 6.88 | 2.29 | Low risk |
| Diverting Preparation Zone | 11.88 | 5.94 | Moderate risk | 7.81 | 3.91 | Low risk | |
| Transition Section | 8.60 | 10.12 | High risk | 9.76 | 11.48 | High risk | |
| Deceleration Lane | 1.86 | 3.26 | Low risk | 2.93 | 5.14 | Low risk | |
| 16 | Diverting Impact Zone | 5.03 | 1.68 | Low risk | 6.31 | 2.10 | Low risk |
| Diverting Preparation Zone | 9.54 | 4.77 | Low risk | 9.16 | 5.08 | Low risk | |
| Transition Section | 6.94 | 9.64 | Low risk | 4.73 | 6.57 | Low risk | |
| Deceleration Lane | 6.06 | 11.23 | High risk | 8.29 | 15.35 | High risk | |
| Export Number | Prediction | Actual Measurement | ||
|---|---|---|---|---|
| Wet Runoff Angle Coefficient | Snowmelt Runoff Angle Coefficient | Wet Runoff Angle Coefficient | Snowmelt Runoff Angle Coefficient | |
| 13 | 0.54 | 0.82 | 0.54 | 0.82 |
| 14 | 0.60 | 0.91 | 0.60 | 0.91 |
| 15 | 0.55 | 0.83 | 0.55 | 0.83 |
| 16 | 0.52 | 0.77 | 0.52 | 0.77 |
| Export Number | Prediction | Actual Measurement | ||
|---|---|---|---|---|
| Wet Condition | Snow Accumulation Condition | Wet Condition | Snow Accumulation Condition | |
| 13 | 0.35 | 0.59 | 0.34 | 0.56 |
| 14 | 0.45 | 0.77 | 0.43 | 0.73 |
| 15 | 0.42 | 0.69 | 0.45 | 0.75 |
| 16 | 0.49 | 0.81 | 0.49 | 0.79 |
| Export Number | Prediction | Actual Measurement | ||||
|---|---|---|---|---|---|---|
| Maximum Deceleration on Mainline (m/s2) | Maximum Deceleration on Wet Ramp Deceleration Section (m/s2) | Maximum Deceleration on Post-Snowfall Ramp Deceleration Section (m/s2) | Maximum Deceleration on Mainline (m/s2) | Maximum Deceleration on Wet Ramp Deceleration Section (m/s2) | Maximum Deceleration on Post-Snowfall Ramp Deceleration Section (m/s2) | |
| 13 | 0.57 | 0.79 | 1.15 | 0.41 | 0.71 | 1.07 |
| 14 | 0.55 | 0.08 | 0.34 | 0.48 | 0.15 | 0.42 |
| 15 | 0.66 | 0.00 | 0.28 | 0.79 | 0 | 0.20 |
| 16 | 0.64 | 0.68 | 1.56 | 0.87 | 0.81 | 1.70 |
Disclaimer/Publisher’s Note: The statements, opinions and data contained in all publications are solely those of the individual author(s) and contributor(s) and not of MDPI and/or the editor(s). MDPI and/or the editor(s) disclaim responsibility for any injury to people or property resulting from any ideas, methods, instructions or products referred to in the content. |
© 2025 by the authors. Licensee MDPI, Basel, Switzerland. This article is an open access article distributed under the terms and conditions of the Creative Commons Attribution (CC BY) license (https://creativecommons.org/licenses/by/4.0/).
Share and Cite
Bai, H.; Xi, S.; Zhang, C.; Wang, B.; Cai, Z.; Lin, Y.; Guo, T. Research on Safety Evaluation Methods for Interchange Diverting Zones Based on Operating Speed. Sustainability 2025, 17, 9194. https://doi.org/10.3390/su17209194
Bai H, Xi S, Zhang C, Wang B, Cai Z, Lin Y, Guo T. Research on Safety Evaluation Methods for Interchange Diverting Zones Based on Operating Speed. Sustainability. 2025; 17(20):9194. https://doi.org/10.3390/su17209194
Chicago/Turabian StyleBai, Haochen, Shengyu Xi, Chi Zhang, Bo Wang, Zhuxuan Cai, Yi Lin, and Tingyu Guo. 2025. "Research on Safety Evaluation Methods for Interchange Diverting Zones Based on Operating Speed" Sustainability 17, no. 20: 9194. https://doi.org/10.3390/su17209194
APA StyleBai, H., Xi, S., Zhang, C., Wang, B., Cai, Z., Lin, Y., & Guo, T. (2025). Research on Safety Evaluation Methods for Interchange Diverting Zones Based on Operating Speed. Sustainability, 17(20), 9194. https://doi.org/10.3390/su17209194


