Article

Research on Safety Evaluation Methods for Interchange Diverting Zones Based on Operating Speed

1
School of Highway, Chang’An University, Xi’an 710064, China
2
CCCC First Highway Consultants Co., Ltd., Xi’an 710075, China
3
Shanghai Municipal Engineering Design Institute (Group) Co., Ltd., Shanghai 200092, China
4
College of Transportation Engineering, Chang’An University, Xi’an 710064, China
*
Author to whom correspondence should be addressed.
Sustainability 2025, 17(20), 9194; https://doi.org/10.3390/su17209194
Submission received: 1 September 2025 / Revised: 20 September 2025 / Accepted: 14 October 2025 / Published: 16 October 2025

Abstract

In response to the growing safety challenges posed by large-scale and specialized freight transportation on China’s rapidly expanding highway network, this study investigates the operational characteristics of trucks in interchange diverging areas—a critical segment with elevated accident risks. Leveraging high-frequency trajectory data collected from 16 interchanges, we analyze speed profiles and acceleration behavior of heavy trucks across key sections: the diversion influence zone, preparation zone, transition segment, and deceleration lane. A key contribution of this work is the development of a continuous speed prediction model based on Partial Least Squares Regression, which integrates road geometric parameters and driving behavior features to estimate speeds at four critical cross-sections of the diverging process. Furthermore, we propose a comprehensive safety evaluation framework incorporating three novel indicators: longitudinal speed consistency, lateral stability, and deceleration comfort. The model demonstrates strong performance, with all mean absolute percentage errors below 10% during validation using data from four independent interchanges. Comparative analysis with existing safety standards confirms the practical applicability and accuracy of the proposed methodology. This research offers three major contributions: (1) a systematic approach for processing large-scale trajectory data and predicting truck speeds in diverging areas; (2) a safety assessment framework tailored for geometric design consistency evaluation; and (3) empirical support for optimizing traffic safety facilities in interchange design and operation. The findings address a significant gap in current highway design guidelines and provide actionable insights for enhancing safety in truck-dominated transportation environments.

1. Introduction

As a cornerstone of China’s integrated transportation system, road freight accounted for 41.88 billion tons—approximately 80.7% of the total freight volume—in 2024 [1]. The safety of truck operations is critical to the stability of supply and industrial chains yet remains a serious concern, especially in interchange areas [2,3]. Notably, 43.81% of all truck accidents occur in these zones, with one injury per four accidents and one fatality per twenty [4]. Statistical data show that 70% of interchange accidents occur in entrance/exit zones. Each 1% increase in highway mileage raises merging/diverging area accidents by 3.5% and 2.23%, respectively [3]. In diverging areas, rear-end collisions caused by sudden deceleration account for 40% of all accidents [5], where trucks—due to their size and performance—often cause mobile bottlenecks and barrier effects [5]. Accidents here can trigger regional congestion and secondary collisions, often resulting from the dysfunctional interaction of driver behavior, road geometry, vehicle traits, and traffic conditions. Speed, in particular, serves as a key indicator of driver response to risk and can reveal underlying safety issues [6]. Thus, studying the speed characteristics of trucks during expressway exits is essential to clarify the impact of geometric design, optimize deceleration-zone strategies, and improve safety standards.
Current research is limited by vehicle type and spatial coverage, failing to capture continuous speed profiles of trucks at mainline-ramp transitions. Some scholars have enhanced data collection quality through methods such as cross-sectional speed measurement [7,8], video data [9,10], real-vehicle experiments [11], and simulation experiments [12], establishing operational speed models based on diverse data sources [13]. However, these traditional approaches exhibit certain limitations. For instance, cross-sectional speed data collected via ETC gantries, aerial video, or radar speed guns typically provide limited information for specific sections, failing to comprehensively reflect speed variation characteristics across large-scale interchange sections in complex terrain [14,15]. While real-vehicle experiments and simulations can yield continuous, wide-range speed data, they are costly and significantly influenced by driver behavior and experimental vehicle conditions, thus failing to fully capture natural driving patterns. In contrast, floating car data leverages satellite navigation and wireless information transmission technologies to continuously monitor vehicle movement across extensive areas. It is widely applied in studies such as road network coverage analysis [16], traffic state recognition [17], and vehicle speed prediction [18], thereby partially addressing the limitations of the aforementioned data collection methods.
To effectively quantify road traffic safety performance, researchers have achieved safety evaluations for various areas of interchange structures through different theoretical approaches and model analyses. Evaluation methods based on human factors engineering theory [19,20], traffic conflict theory [21,22], travel speed coordination theory [23,24], and safety sight distance [25,26] represent the most mature categories of interchange safety assessment methodologies currently available. Among these, operating speed-based consistency evaluation is most common in design practice [27]. Speed not only reflects driver risk response but also informs sight distance, comfort, conflict risk, and alignment design. [6]. Lamm et al. [28] first proposed a linear consistency evaluation standard based on operating speed. Building upon this, researchers have developed typical consistency evaluation metrics such as the speed reduction factor method, speed gradient method, and speed distribution method [29,30,31]. Recent studies have incorporated metrics such as the 85th percentile single-vehicle speed deviation [32], acceleration variation [33], and comprehensive visual comfort indices [34] into evaluation systems, while also considering the coupled effects of curvature and longitudinal gradient on speed [35,36].
Based on speed consistency, current safety evaluation systems are widely used but face challenges such as unclear indicator locations and limitations in truck speed analysis due to vehicle types, geometric design, and data collection methods. To address these issues, this study develops a comprehensive safety evaluation framework for interchange diverging areas. Using high-frequency truck trajectory data from 16 interchanges, we analyze truck operational characteristics and establish a continuous speed prediction model via partial least squares regression to estimate speeds at four key cross-sections. A novel safety evaluation framework integrating longitudinal speed consistency, lateral stability, and deceleration comfort is proposed and validated with field data. This study provides a practical tool for assessing and optimizing geometric design and safety in truck-dominated diverge areas.
The structure of this manuscript is organized as follows: Section 2 details the data sources and preprocessing methods for truck trajectory data; Section 3 analyzes the operational characteristics of trucks in interchange diversion zones; Section 4 proposes a safety evaluation framework incorporating speed prediction, lateral stability, and comfort metrics; Section 5 validates the model and method through case studies; and Section 6 summarizes the conclusions and suggests future research directions. The overall research workflow is illustrated in Figure 1.

2. Data

2.1. Data Source

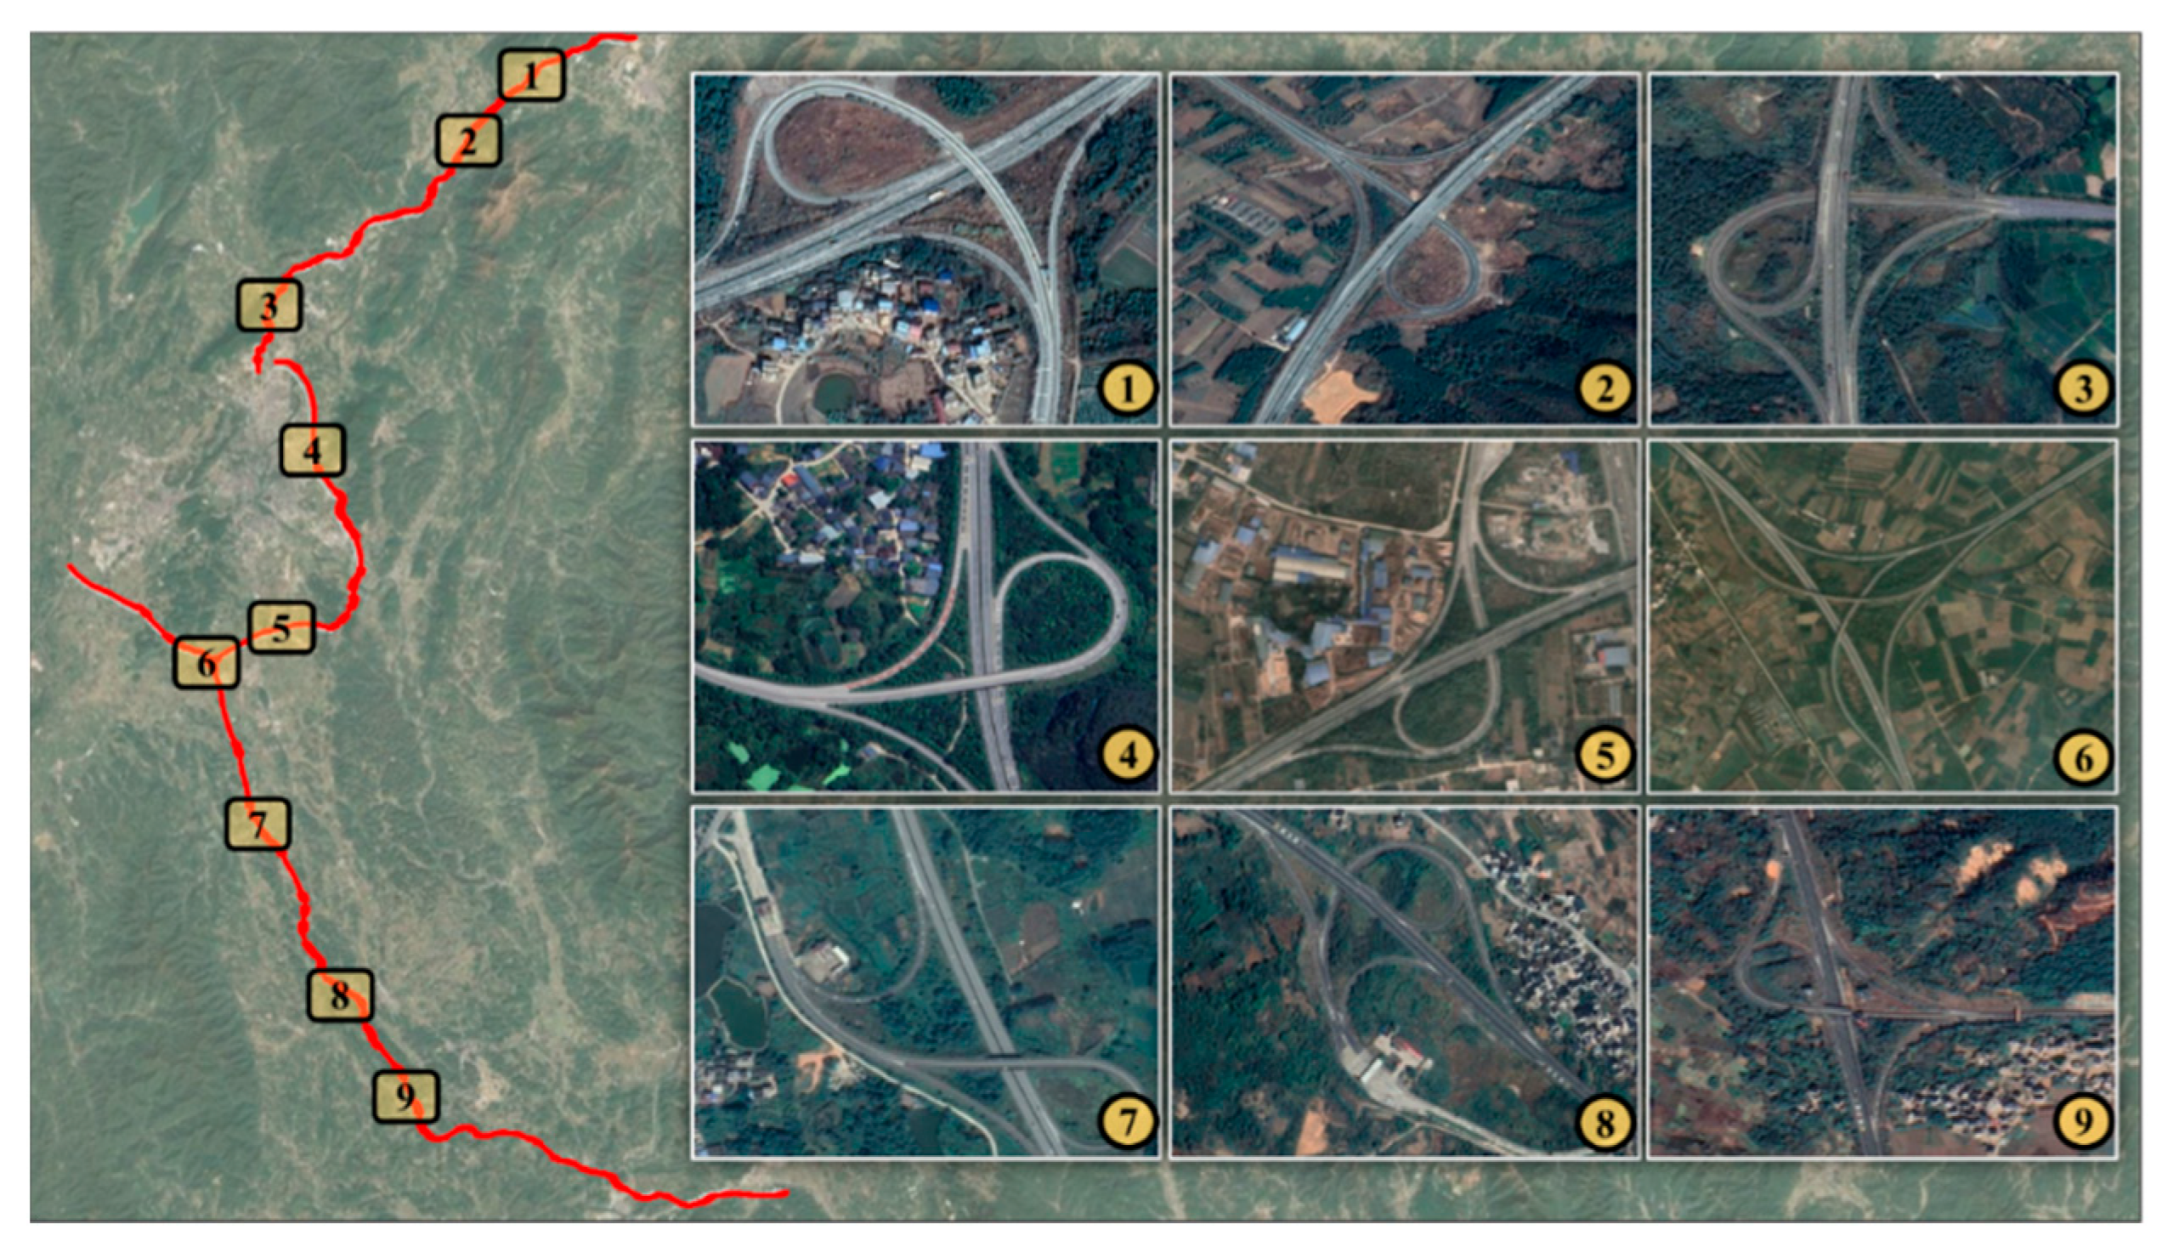
This study leveraged the “One Road, Three Parties” platform across three expressways in a region of western China, collecting anonymized floating truck trajectory data under natural driving conditions. Data collection occurred from June to September 2023, primarily during daytime hours with dry road surfaces under free-flow traffic conditions. Data was captured at a frequency of 1 Hz, encompassing vehicle ID, time, longitude, latitude, instantaneous speed per second, travel direction, and the clockwise angle between the travel direction and true north. Raw data was stored in CSV format. The collection route involved 16 deceleration zones across 9 interchanges on three expressways in the region. The mainline consists of a dual-lane, four-lane expressway with a design speed of 120 km/h and a speed limit of 100 km/h for large vehicles. Each lane is 3.75 m wide, and all deceleration lanes are single-lane direct deceleration lanes. To eliminate interference factors such as weaving zones, the selected interchange sections featured well-maintained upstream and downstream alignment conditions. Data collection periods avoided holiday peak times to ensure traffic primarily maintained a free-flow state of 400 pcu/h. The collection routes are illustrated in Figure 2.

2.2. Data Processing

  • Data Preprocessing
The original data for this study utilized GCJ-02 coordinates (Mars coordinate system). After densification conversion processing, corresponding real-world trajectory data was obtained. Velocity data units were converted to km/h, and the original data was reordered by vehicle ID and chronological sequence. Three expressway trajectories involving 10,204 freight vehicles were preliminarily screened. Following data conversion, splitting, and sorting, partial trajectory data for individual freight vehicles was derived.
2.
Data Space Slicing
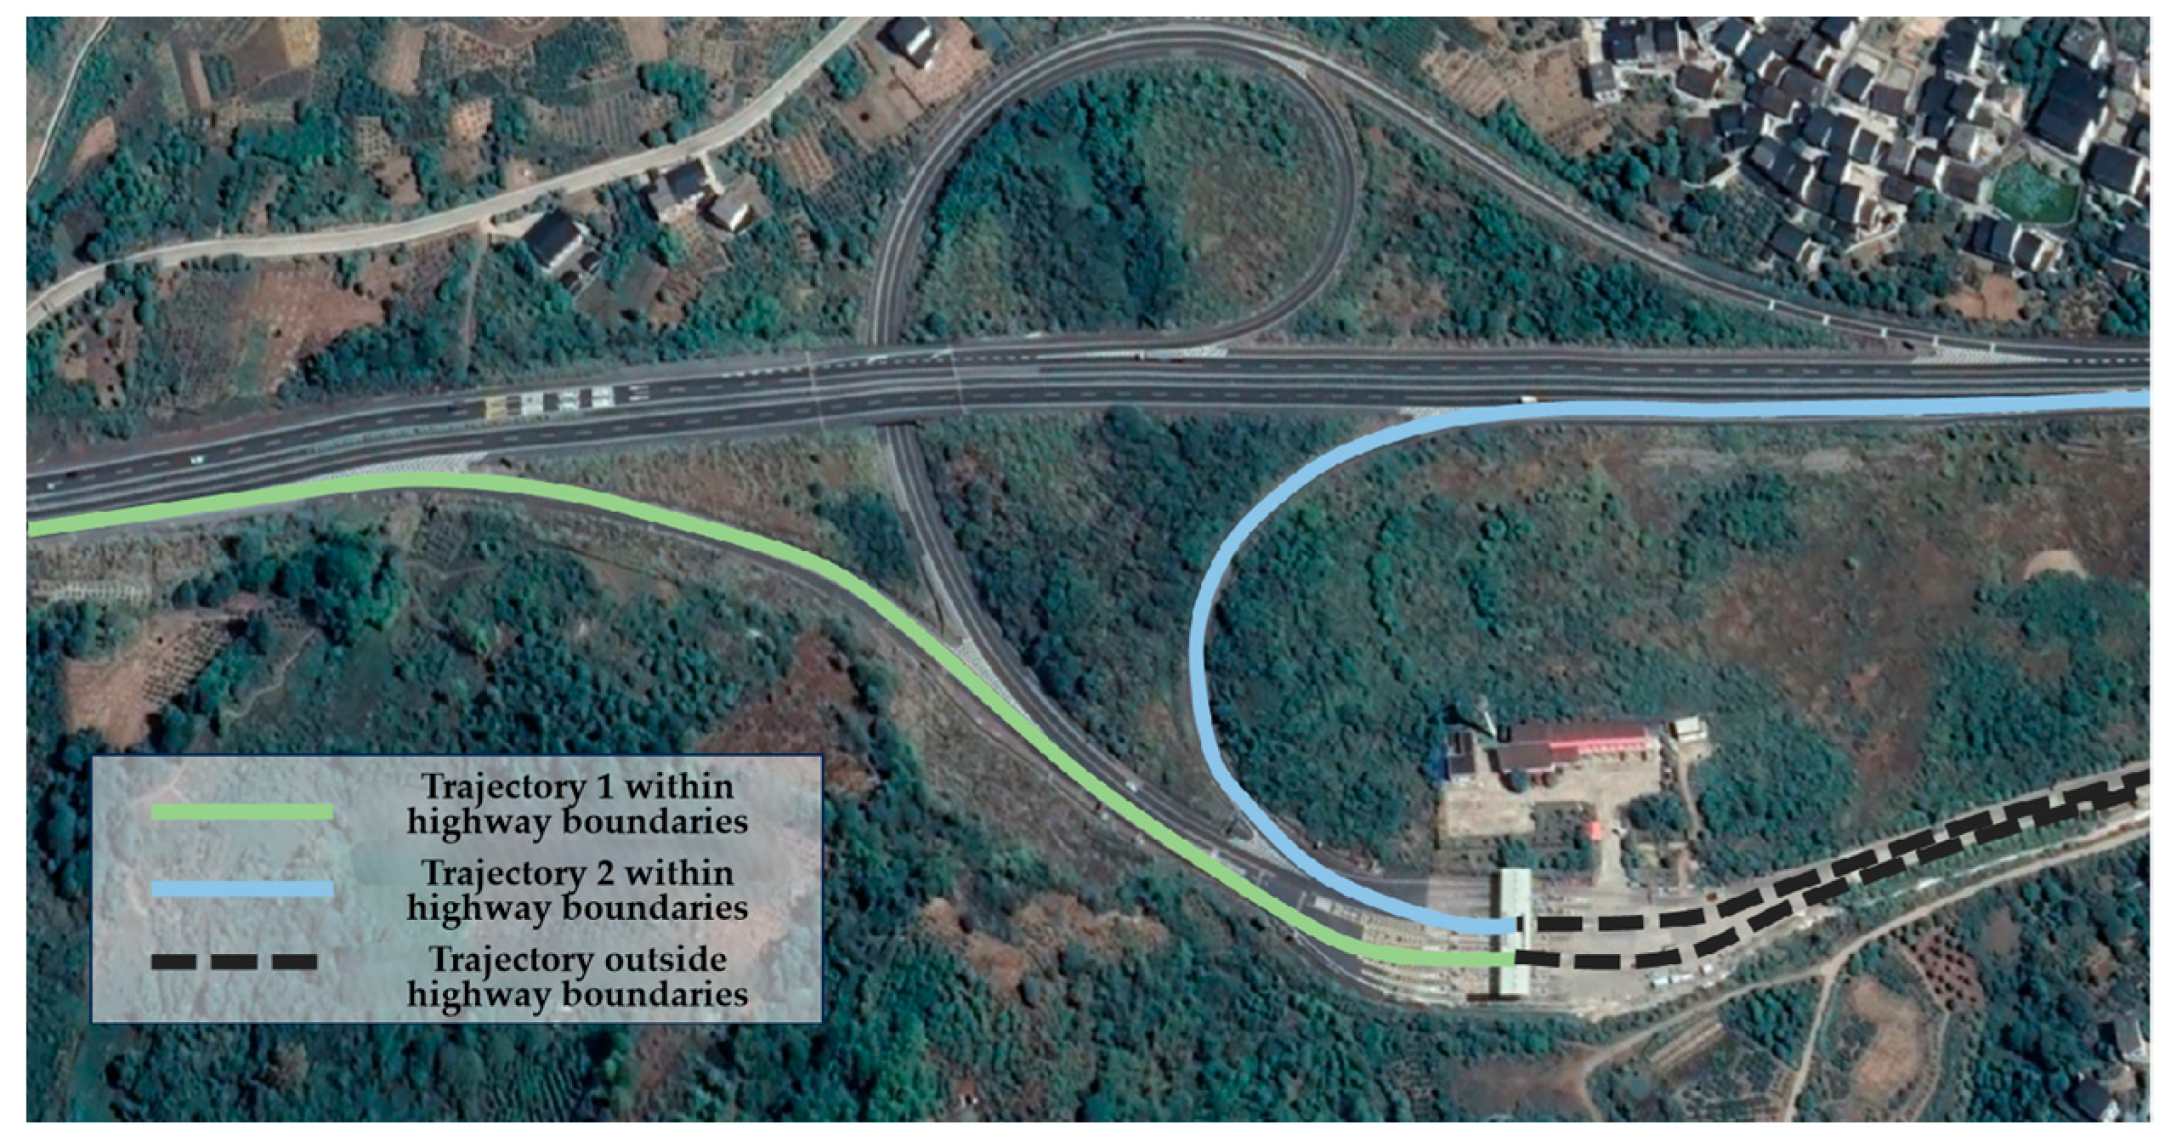
Given that the data space was confined within the boundaries of the expressway, to enhance processing efficiency and reduce redundancy for the limited number of trajectories entering and exiting the highway, spatiotemporal tags were applied to vehicle trajectories at toll stations and service areas. These trajectories were segmented into two categories, entering and exiting the expressway, as shown in Figure 3, and were stored in spatial sequence.
3.
Anomaly Data Processing
Due to weather conditions and equipment aging, truck trajectories often contain anomalies. This study leveraged Python (PyCharm Community Edition 2023.2.1) to process and clean floating vehicle data based on its characteristics, specifically including: removing records with missing fields or insufficient character lengths; removing duplicate time and coordinate entries within single-vehicle trajectories and reordering them chronologically; discarding entire segments with three or more consecutive missing rows, while interpolating and filling gaps for segments with two or fewer missing rows; directly deleting sporadic records where coordinate anomalies caused distorted velocity, acceleration, or jerk values.
4.
Database Construction
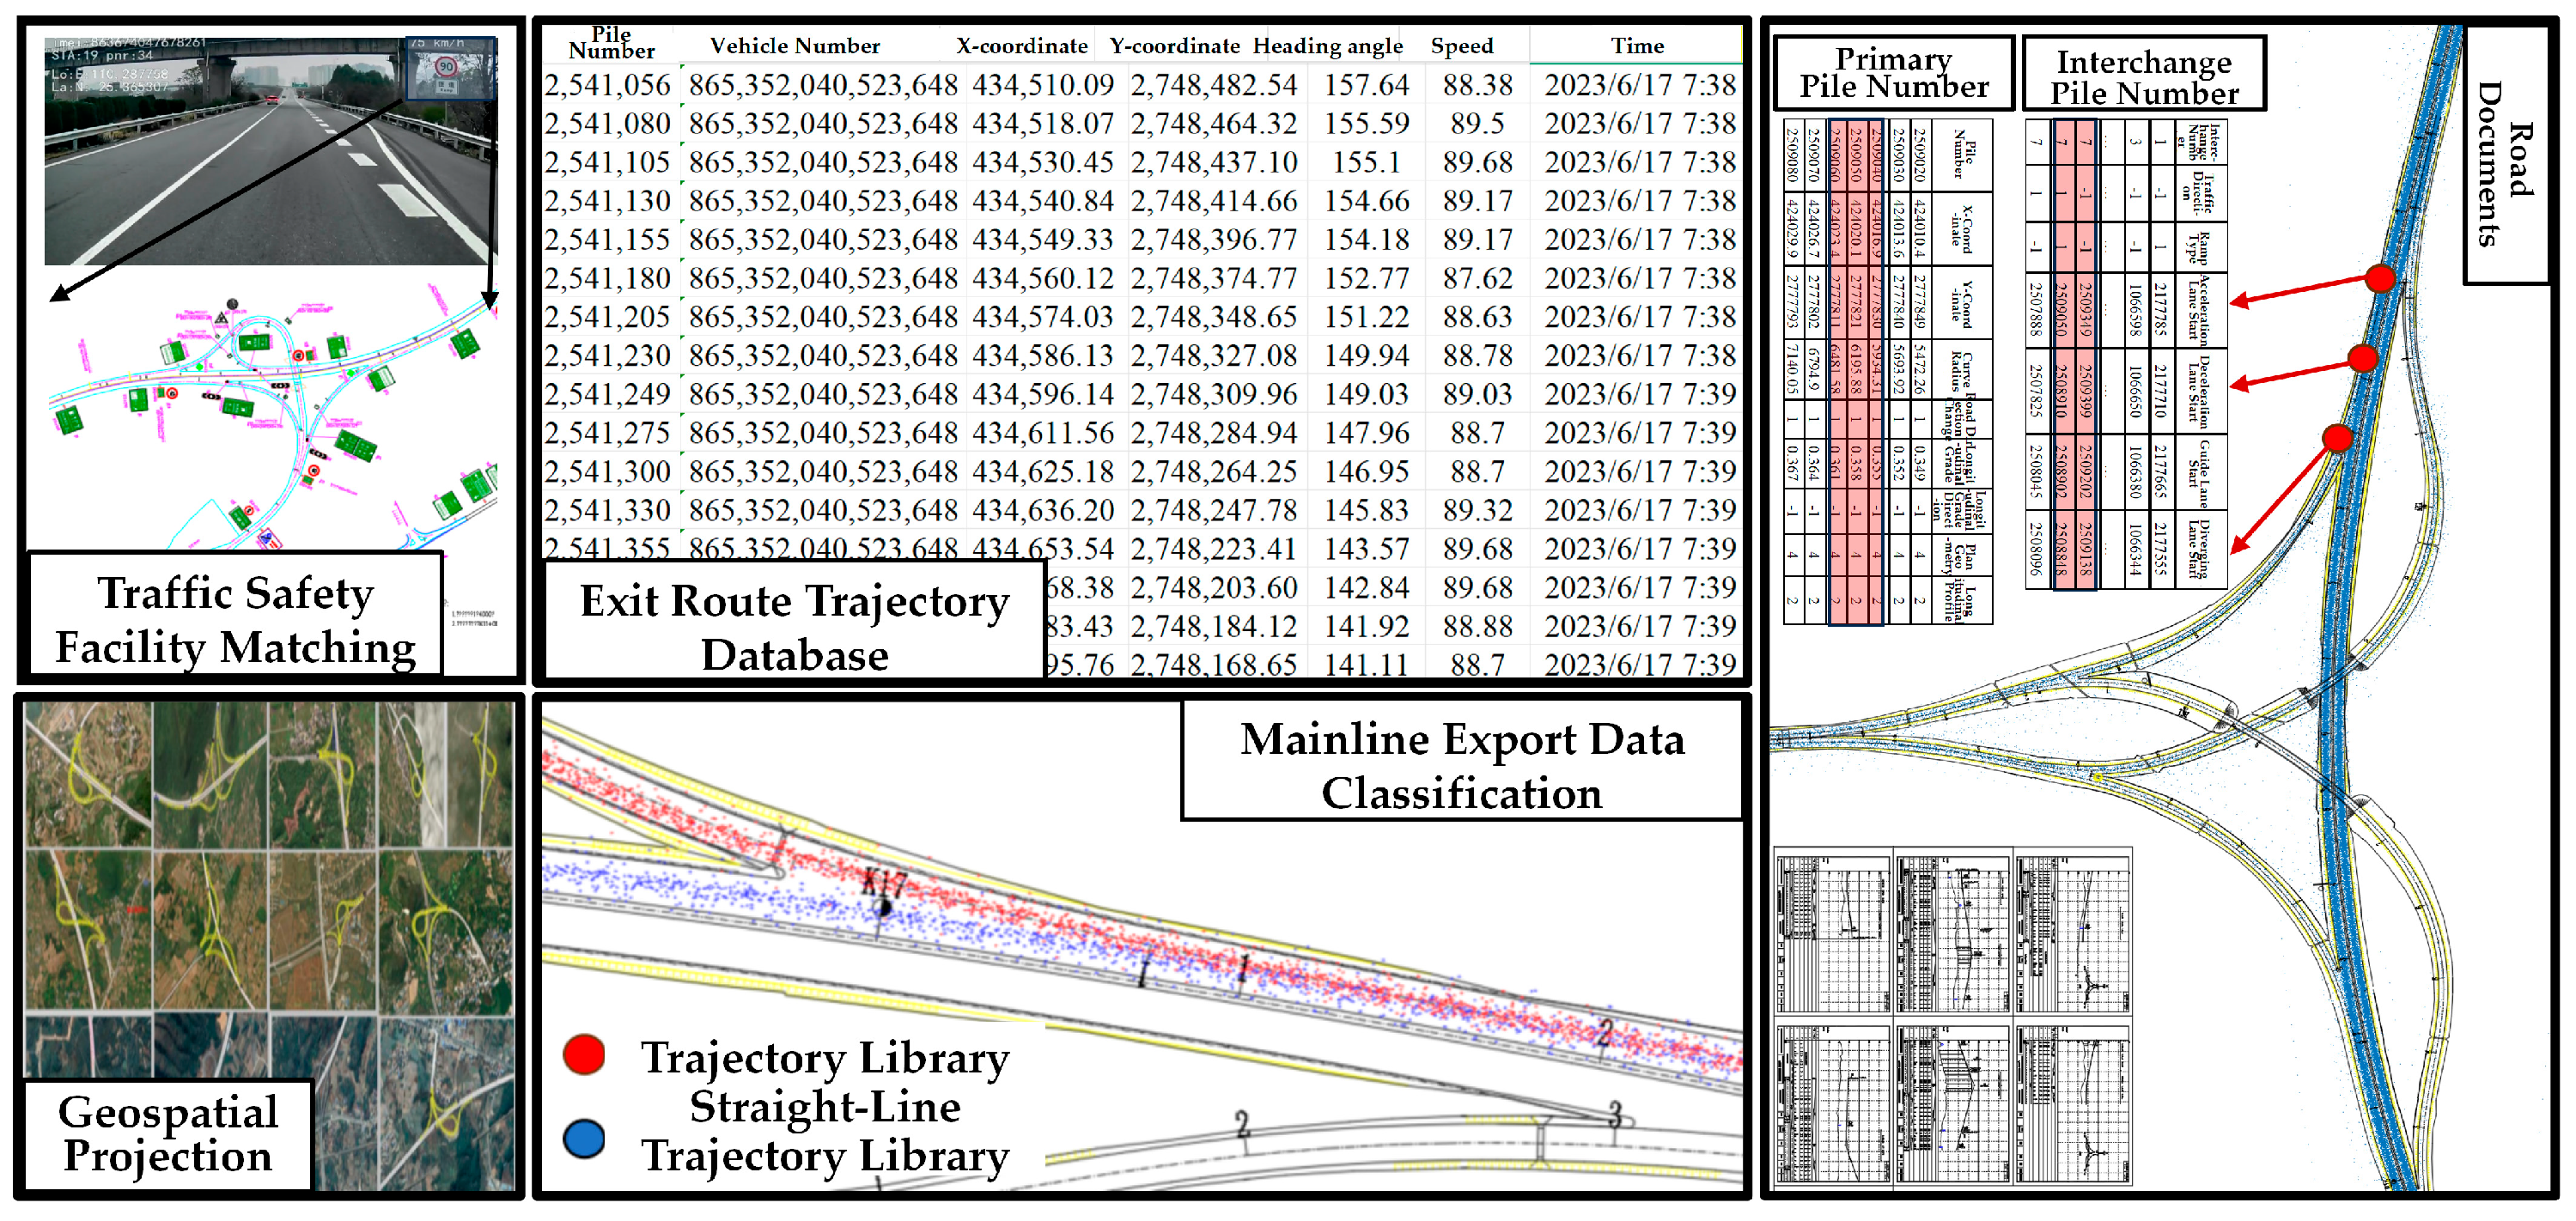
Based on vehicle ID, interchange ID, driving direction, and interchange exit/entry type, data is standardized and stored in modules across two main categories: exit segment trajectory modules and auxiliary information modules. Trajectory modules incorporate driving data for both straight-through and diverging freight vehicles on exit segments, covering dimensions such as road station numbers, fundamental motion attributes, and spatio-temporal positions. The auxiliary module primarily contains traffic safety facilities, road document libraries, and trajectory visualization files within the GIS system, enabling optimized simplification and standardized management of the data structure. The specific matching results are shown in Figure 4.

2.3. Experimental Data Explanation

Using Python to traverse the trajectory database and road database, each trajectory point undergoes milestone matching through the road milestone system to identify and mark vehicles passing through the center milestones of each interchange entrance/exit road. When a truck trajectory passes the start of a transition section and its projected distance from the main road continues to increase beyond the main road width boundary, the truck is classified as an exit truck. Following this principle, three trucks exiting the main highway and entering the ramp are extracted. These exit trucks are then categorized based on interchange exit numbers, ultimately yielding approximately 1500 valid truck trajectories exiting the main road. Basic road information and sample collection volumes are detailed in Table 1.

3. Analysis of Truck Driving Characteristics in the Diverting Zone

3.1. Definition of the Diverting Zone Driving Section

The traffic diversion section of a highway interchange includes the exit ramp diverting zone and the upstream influence zone on the mainline. The exit ramp diverting zone consists of a transition section and deceleration lanes, designed based on secondary deceleration theories from the American AASHTO and Japanese Highway Design Manuals. The AASHTO model assumes vehicles enter the transition zone at mainline average speed and decelerate in stages, while the Japanese approach recommends engine deceleration upon entering the transition zone, followed by braking in the deceleration lane. The upstream influence zone undergoes traffic flow transition from steady to turbulent due to lane-changing and deceleration of exiting vehicles. Although both China’s Highway Capacity Manual and the U.S. HCM define this zone, considering the dense traffic signs in interchange areas, this study defines the upstream zone as the 2000 m section before the exit. The truck departure process is divided into sections S1–S4 (Figure 5), each with distinct features: S1 involves initial observation of traffic conditions with stable speeds; S2 includes target lane observation and gradual speed control; S3 shows further deceleration due to concentrated exit information; S4 involves significant deceleration influenced by ramp geometry to achieve a safe exit speed.

3.2. Operational Speed Analysis

To clarify the impact of truck speed variations on the capacity of diverting zones, this study statistically analyzed the magnitude and standard deviation of truck speed changes across the first 12 interchange sections (S1–S4) listed in Table 1. This approach accounted for truck drivers’ elevated vantage point and expansive field of view, while acknowledging constraints imposed by vehicle power and dimensions. By analyzing the gradual deceleration and lane-changing speed control processes influenced by exit advance warning signs across different sections, the dynamic characteristics of truck driving states were quantified. Specific statistical results are presented in Table 2.
As shown in Table 2, the largest cumulative deceleration occurs within the 0–500 m pre-ramp zone and the deceleration lane of the ramp, with reductions exceeding 10% in both sections. This indicates that when trucks exit the mainline onto the ramp at high speeds, drivers tend to decelerate early to better control the vehicle and further reduce speed within the deceleration lane based on the road geometry ahead.
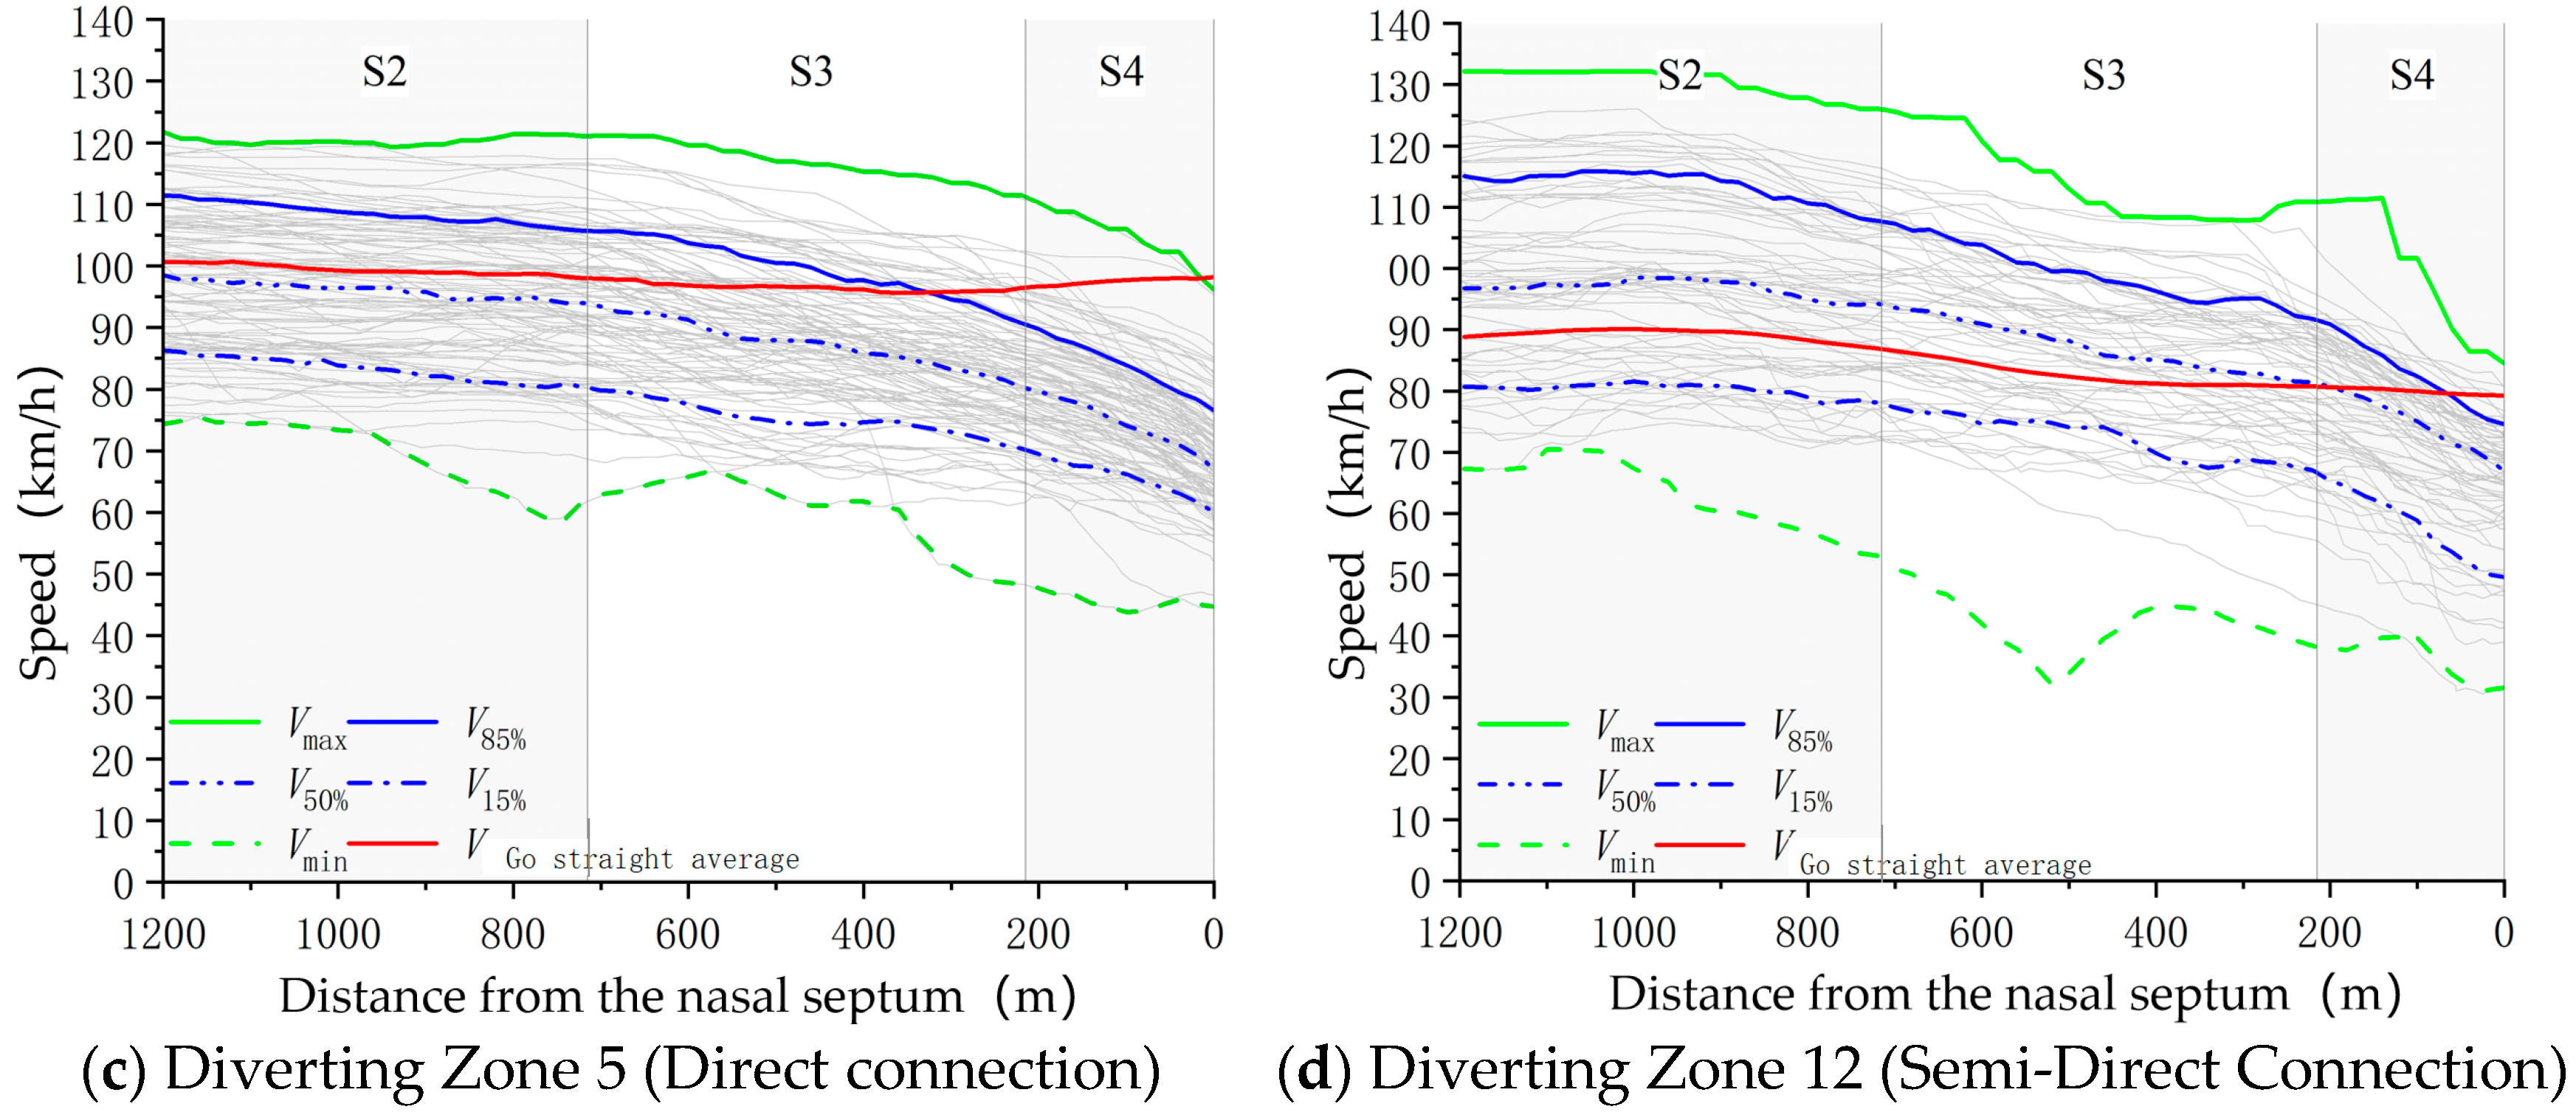
Four sets of interchange diverting zones were selected, encompassing three types: loop ramps, direct ramps, and semi-direct ramps. Speed data for sections S2 to S4 underwent smoothing processing, and the speed trend changes for mainline trucks and diverted trucks are illustrated in Figure 6.
From the overall speed variation characteristics, truck speeds in the Diverting zone exhibit a convergent decrease as the distance to the diversion nose diminishes. This indicates that the mainline traffic environment exerts weaker constraints on trucks. Upon entering the exit ramp, however, the approaching alignment changes cause drivers’ speed choices to converge, demonstrating that the ramp alignment at the diversion nose exerts stronger constraints on truck speed behavior. Regarding deceleration trends, some high-speed trucks on Section S2 begin slowing down, while most trucks on Section S3 decelerate significantly. Furthermore, the majority of trucks reach the start of the transition section at speeds lower than the average speed of trucks proceeding straight on the mainline, reflecting that diverted trucks generally decelerate in advance. Under free-flow conditions, trucks proceeding straight on the mainline are minimally affected by the diversion, with speed fluctuations within a 5 km/h range. At some exits with low diversion volumes, straight-through trucks even exhibit a slight increase in speed. Additionally, truck speed distributions vary by ramp type. Loop ramps exhibit more pronounced speed changes than non-loop ramps, with diversion nose-end speeds ranging from 50 to 70 km/h. while non-loop ramps record 60–80 km/h. Differences between direct-connect and non-direct-connect ramps are minor. However, the ramp nose passage speeds across all ramp types significantly exceeded design speeds. Under conditions such as slippery surfaces and poor visibility, trucks’ poor braking performance increases the risk of rollovers, scrapes, and rear-end collisions. Tolerant design approaches are necessary to mitigate these safety hazards. The significant speed drop observed in sections S3 and S4 (as shown in Table 2 and Figure 5), coupled with the concentration of deceleration events, indicates a potential shift from free-flow to congested or synchronized flow conditions near the divergence nose. This localized breakdown acts as a mobile bottleneck, which aligns with the capacity-drop phenomenon described in fundamental diagram studies [37].

3.3. Longitudinal Acceleration Analysis

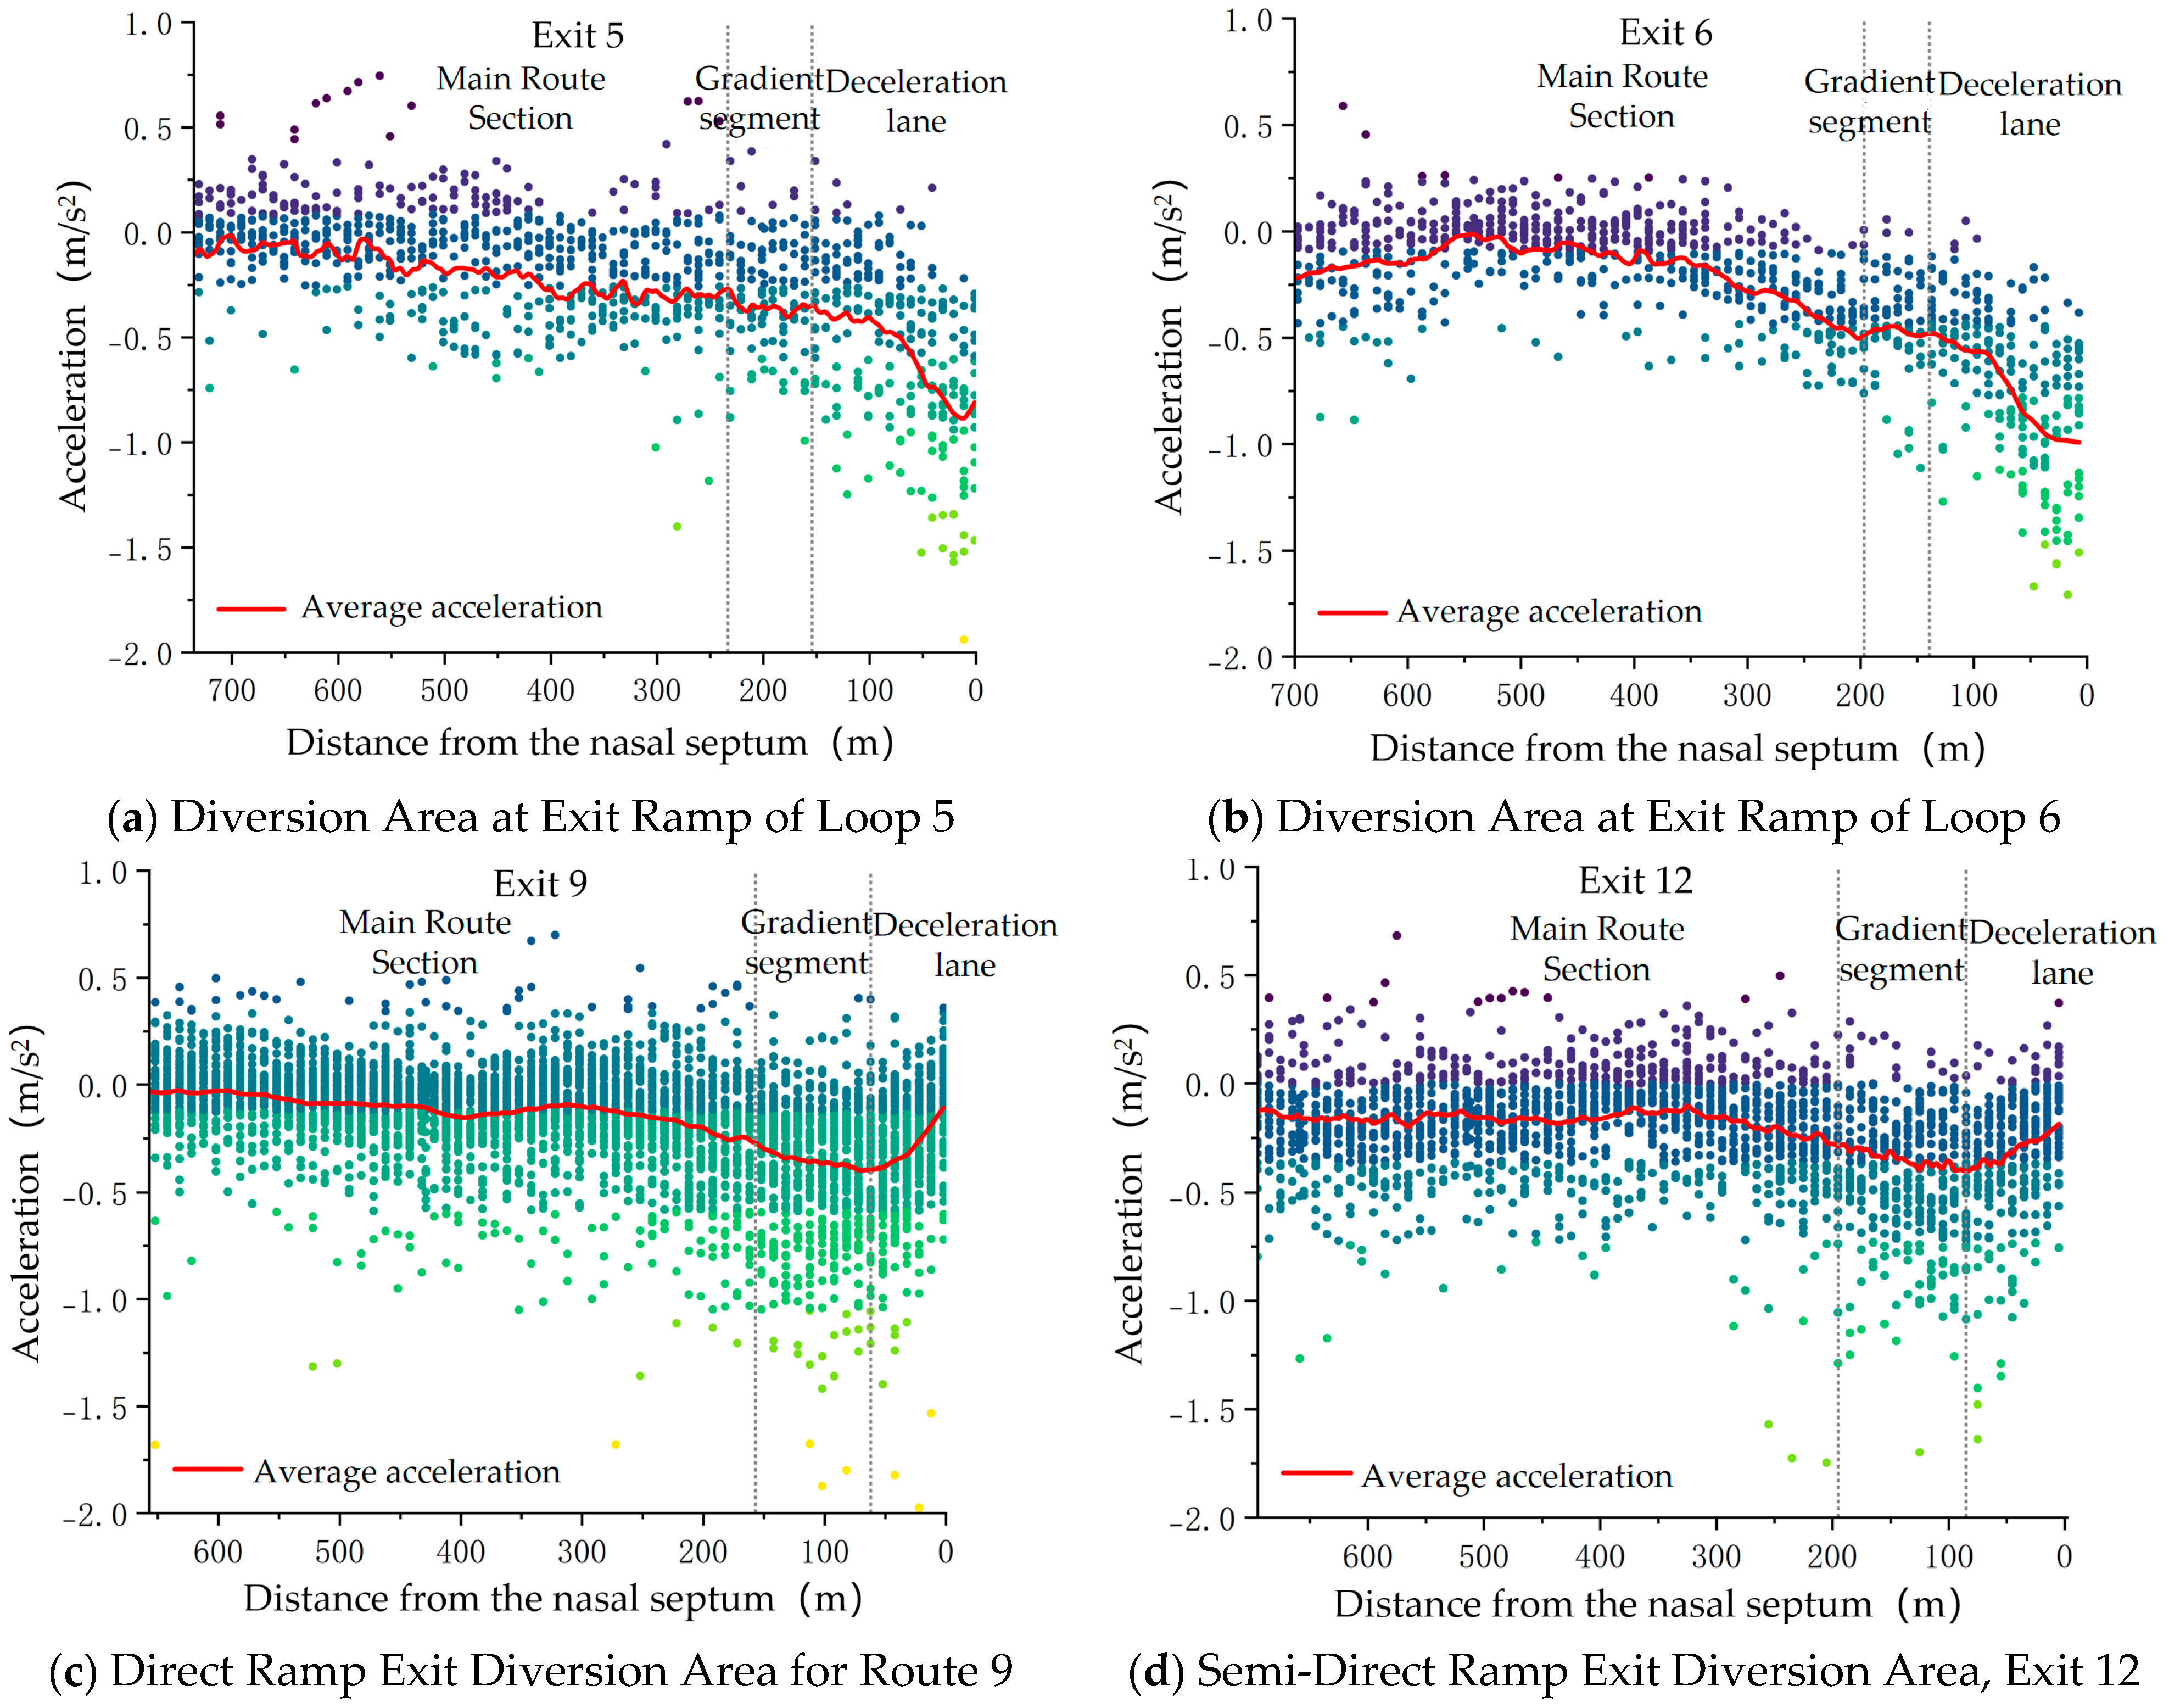
Previous analysis indicates that regardless of initial speed, most trucks exhibit a degree of deceleration upon entering the 500-m warning zone before an exit. This phenomenon suggests that as vehicles approach the diverging lanes, drivers typically slow down to better adapt to the impending traffic conditions and road characteristics. To clarify the operational pattern differences among trucks on various interchange exit sections, longitudinal acceleration variation diagrams were plotted for three interchange diverting zones: loop exits, direct-connect ramp exits, and semi-direct-connect ramp exits. These diagrams use the diversion nose tip as the origin, vehicle position as the horizontal axis, and vehicle acceleration value as the vertical axis. The longitudinal acceleration variations are shown in Figure 7.
As shown in Figure 6, vehicle acceleration generally decreases as the distance to the diverging ramp nose diminishes. Near the ramp exit, the average acceleration rapidly turns negative, indicating that vehicles begin to decelerate. Acceleration in the mainline exit section fluctuates between −0.2 and 0.2 m/s2. Within 350–460 m before the diverging nose tip, vehicles enter the exit recognition sight distance range, where the average acceleration falls below −0.2 m/s2, indicating noticeable braking. Upon entering the transition zone, rapid speed control is required, manifested as small speed changes but large acceleration variations. Upon entering deceleration lanes, two deceleration strategies emerge based on interchange exit configurations. At loop ramps, where high curvature and short sight distance prevail, trucks achieve average decelerations around −1 m/s2. In contrast, direct and semi-direct interchange exits feature smooth alignments, resulting in gradual deceleration changes. Once speeds reach safe expectations, acceleration approaches zero.

4. Traffic Safety Evaluation Method for Diverting Zones

4.1. Safety Evaluation Process for Diverting Zones

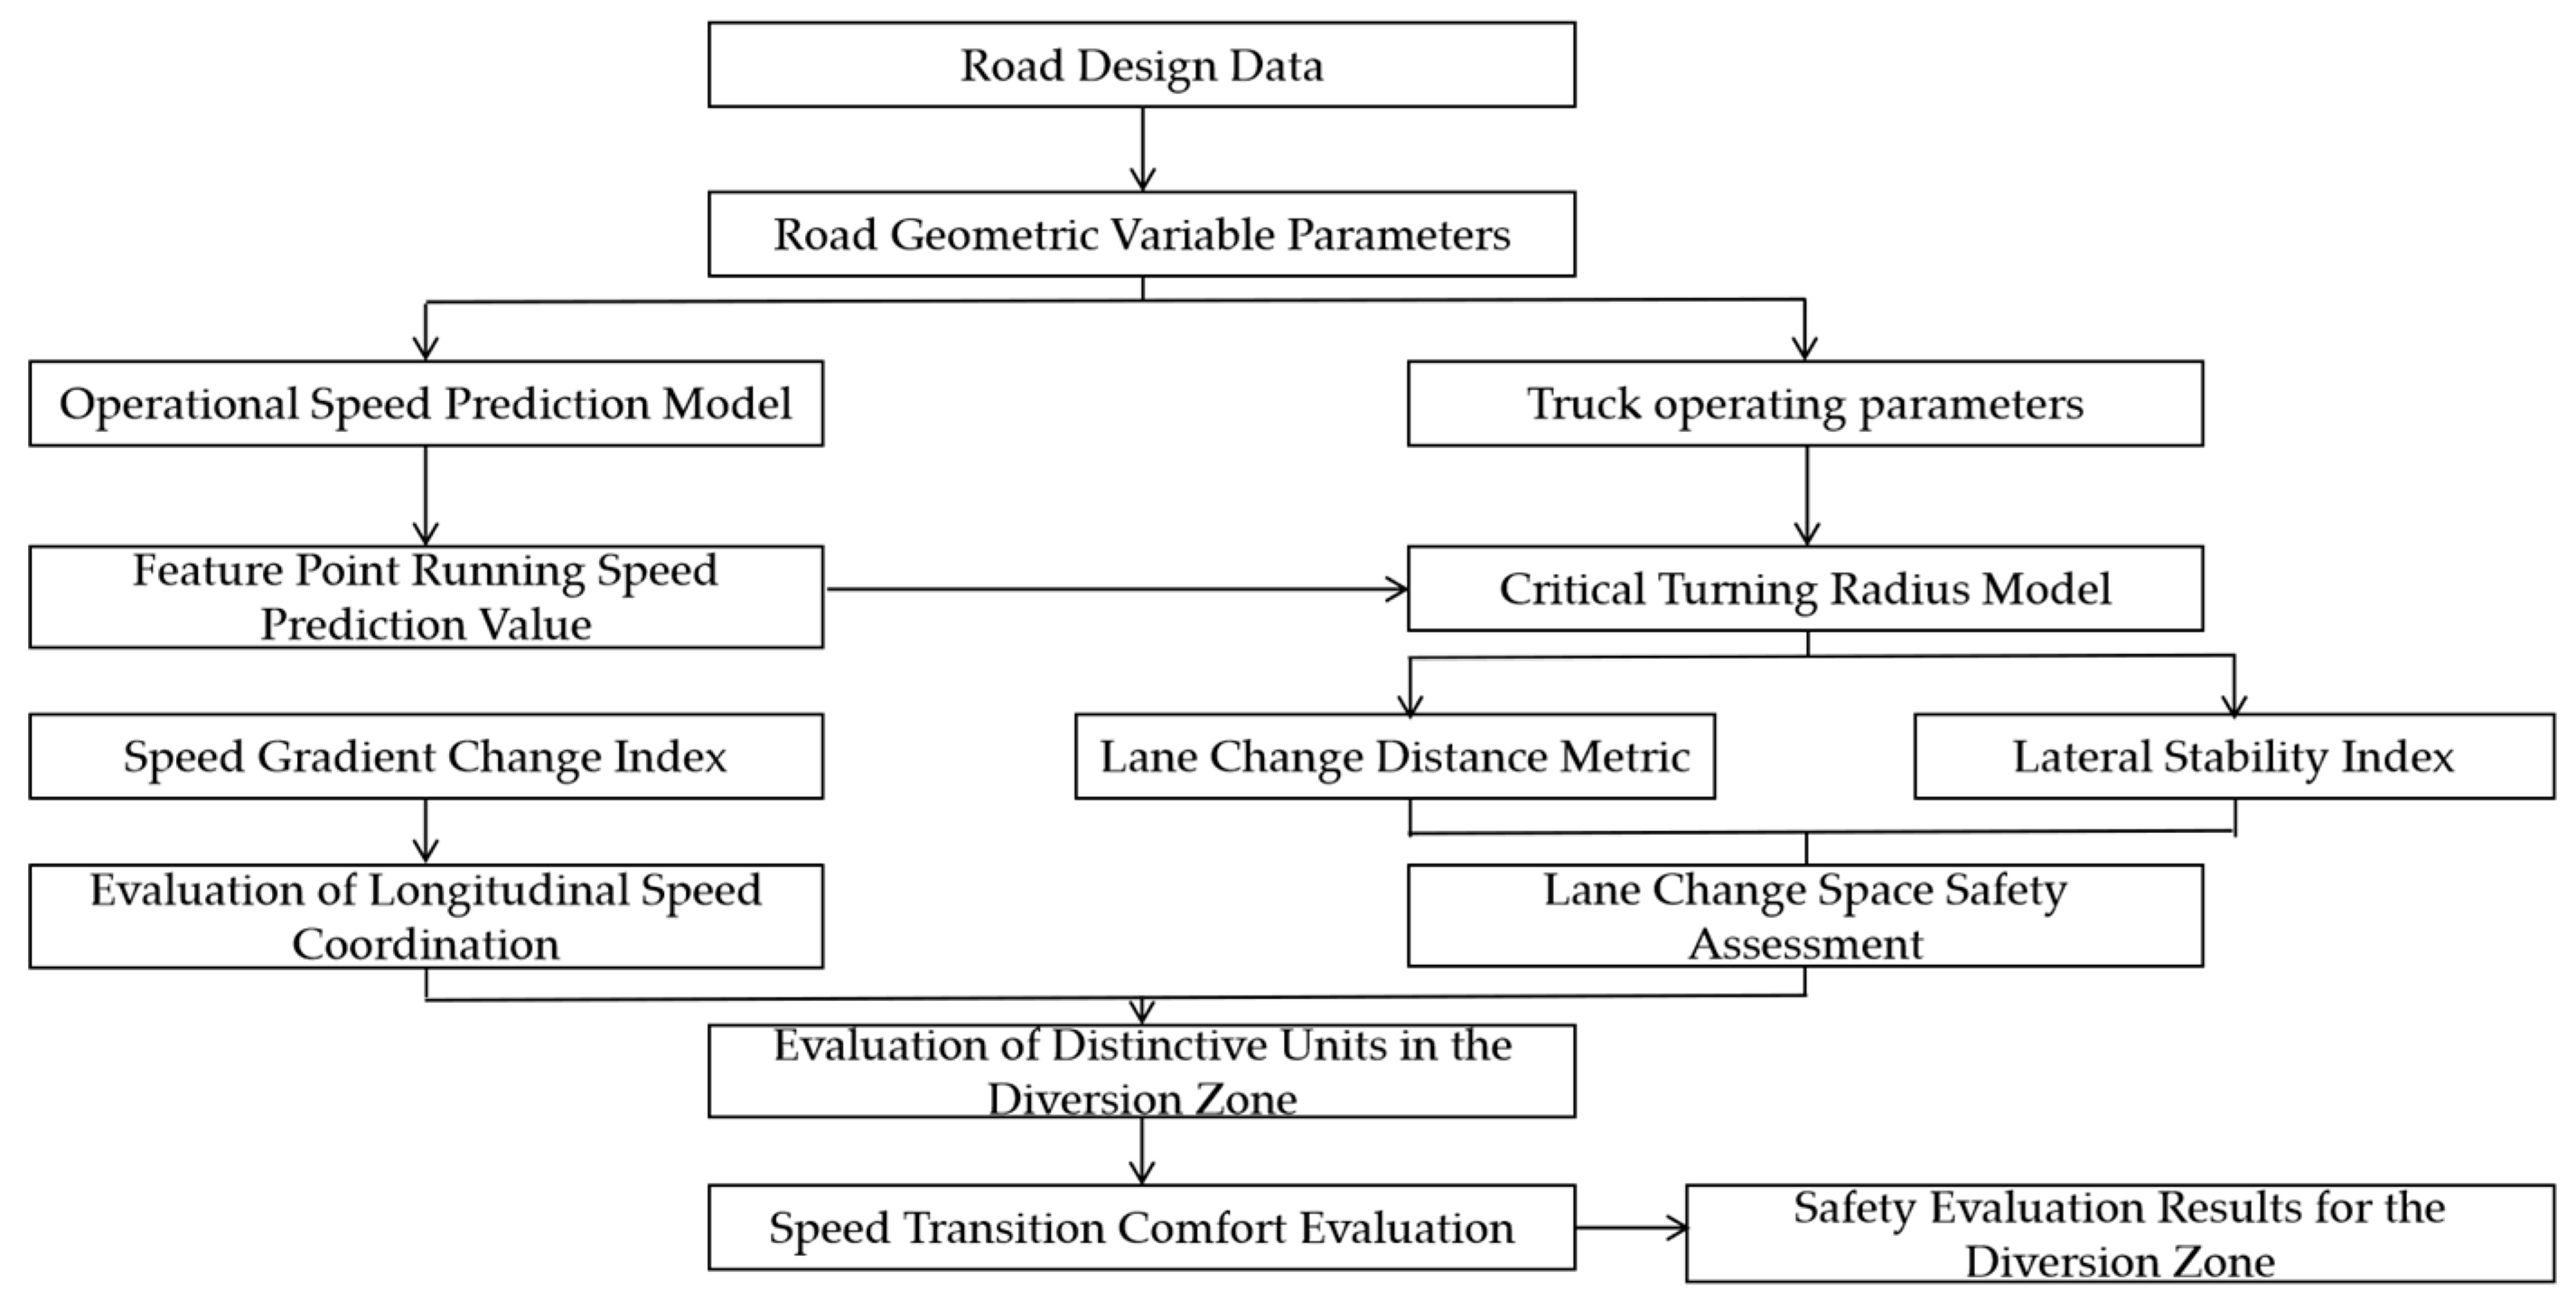
At interchange exit sections, truck driving conditions are influenced by multiple factors. Operating speed and longitudinal acceleration can to some extent characterize vehicle safety and comfort. For operational interchanges, on-site measurements can collect vehicle speed and acceleration data, enabling driving safety assessments through data analysis. For interchange exit sections in the design phase, however, where route delineation is unclear and actual vehicle data cannot be obtained, safety evaluations remain limited to assessing alignment parameters and their combinations. An operating speed model can predict characteristic cross-section speeds based on design parameters, while a vehicle turning radius model relies on speed data. Integrating these two approaches enables the development of a safety evaluation methodology and a process for assessing truck driving safety during the design stage.
When conducting safety evaluations, the operational speed model for the diverting zone established earlier is first used to calculate the speeds of trucks passing through each characteristic section. This enables an assessment of speed coordination on the road segments adjacent to the interchange exit. Subsequently, based on the predicted operating speeds and incorporating truck driving parameters, the critical turning radius model is applied. Starting from the vehicle’s critical slip index and critical overturning index, the critical lateral exit angle required for trucks to safely exit the mainline is derived. By comparing this value with the existing design value, the safety assessment of the interchange exit section is achieved. Additionally, by integrating the truck operating speed model at the diversion nose end with longitudinal acceleration comfort indicators, the comfort level of the truck deceleration process throughout the entire diversion phase is evaluated. The evaluation process is illustrated in Figure 8.

4.2. Establishment of a Flow Rate Prediction Model for the Diversion Zone

4.2.1. Characteristic Section Classification

Given that lane segmentation aims to achieve precise speed and safety statistical analysis, this paper segments the road characteristic units within the interchange diversion zone based on the principle of alignment design consistency. This approach integrates objective truck travel patterns, driver anticipation characteristics, and road structural changes. In the upstream influence zone of the mainline, truck speed and acceleration exhibit a continuous decreasing trend, transitioning from the initial coasting deceleration phase to the braking deceleration phase after identifying the upcoming exit. At interchange exit sections, trucks complete lane changes during transition zones before entering deceleration lanes for further slowing. Based on these characteristics, the interchange diverting zone is divided into four segments: the diverting influence zone, diverting preparation zone, transition zone, and deceleration lane, as illustrated in Figure 9.

4.2.2. Determination of Parameters for Operational Speed Prediction Model

Based on existing scholarly research findings and empirical models, this paper considers the location of characteristic points and the design criteria for road combinations before and after them. It identifies potential independent variable parameters for the characteristic point operating speed model and statistically analyzes the geometric design parameters and trajectory data of 12 highway interchange deceleration zones for modeling purposes. The geometric design parameters and variable definitions for each interchange deceleration zone are presented in Table 3.
Given the strong interdependence among design parameters at interchange exit sections, traditional correlation analysis methods can only serve as preliminary exploratory tools, struggling to overcome multicollinearity issues and comprehensively extract effective variables. Therefore, this paper employs the Variable Importance Projection (VIP) method to screen suitable variables. Based on partial least squares regression principles, this method characterizes the explanatory power of independent variables toward the dependent variable through composite principal components when strong correlations exist among independent variables. It then selects independent variables for model construction based on their explanatory power, represented by the VIP value, as detailed in Equation (1). Researchers indicate that variables with VIP values below 0.8 contribute minimally to the dependent variable [38], while those above 1 exhibit significant explanatory power and effectively account for the dependent variable [39]. Values between 0.8 and 1 demonstrate limited explanatory capability. From a model simplification perspective, this paper adopts a VIP value of 1 as the primary screening threshold. Variables below 0.8 are excluded, while those between 0.8 and 1 are retained or excluded based on relevant empirical judgments.
V I P j = k h = 1 m r 2 ( y , c h ) h = 1 m r 2 ( y , c h ) w h j 2
In the formula, VIPj represents the VIP value of the jth feature, and k denotes the number of independent variables. ch denotes the principal component extracted from the relevant independent variables, r(y, ch) is the correlation coefficient between the dependent variable and the principal component, and whj is the weight of the independent variable on the principal component.
Through screening and analysis of relevant variables at four characteristic cross-sections—the starting point of the diverting preparation zone, the starting point of the transition section, the diversion point, and the diversion nose tip—the final variables were determined as shown in Equation (2). The meanings of each variable are detailed in Table 3.
V 1 = f ( V 0 ) V t = f ( V 1 , K , L 1 ) V d = f ( V t , K , L d , w ) V r = f ( V d , C 2 , C w × C 3 , L 2 )

4.2.3. Method for Constructing Operational Speed Prediction Models

In existing studies, multiple linear regression is commonly employed for predicting vehicle speeds. However, within interchange diverting zones, speed variation exhibits complex dynamics characterized by distinct phased and continuous transitions. Additionally, significant correlations exist among road geometric parameters within these zones. Using ordinary least squares regression in such scenarios often induces multicollinearity, leading to unstable regression coefficients and diminished model predictive performance. To accurately predict truck speeds at key sections within interchange deceleration zones, this study employs Partial Least Squares Regression (PLSR) to construct a predictive model. The PLSR method simultaneously accounts for the covariance structures of both independent and dependent variables. By reducing dimensionality to extract representative latent factors for regression modeling, it effectively overcomes multicollinearity issues.
To ensure the predictive performance and practical applicability of the model, the following metrics are employed to evaluate its fitting quality and predictive capability: the coefficient of determination R2, the independent variable goodness-of-fit index R X 2 , the dependent variable goodness-of-fit index R Y 2 , and the predictive capability Q2.

4.2.4. Speed Model Development

For the four characteristic cross-sections—the starting point of the diverting preparation zone, the starting point of the transition section, the diversion point, and the diversion nose—this paper constructs prediction models, respectively. Variable selection is based on the results of variable importance in projection (VIP) analysis, load analysis, and correlation assessment.
  • Prediction Model for Initial Speed in the Diverting Preparation Zone
Selecting the starting velocity V0 of the mainline diverting impact zone as the primary explanatory variable, the relationship is fitted using an exponential model, expressed as follows:
V 1 = 46.422 e ( 0.0071 V 0 ) ; V 1 V 0
The model exhibits an R2 value of 0.91, indicating that the independent variables account for 91% of the variance in the dependent variable. This demonstrates excellent model fit. Furthermore, the parameters passed statistical significance tests, confirming that mainline speed significantly influences the starting speed in the diverting preparation zone. Following coefficient testing, the t-values for each variable were 9.906 and 14.451, respectively, with a significance level of p < 0.05. At a 95% confidence level, all variables in the model were deemed statistically significant, indicating that the model passed statistical testing.
  • Gradient Segment Start Speed Prediction Model
Select the starting velocity V1, gradient rate K, and length L1 of the diversion guide line in the diverting preparation zone as primary independent variables. By extracting two latent components for PLSR modeling, a regression equation was constructed. After inverse normalization, the velocity prediction expression was obtained:
V t = 0.56 V 1 + 138.478 K + 0.076 L 1 + 18.368 ; V t V 1
The operational speed model for trucks at the start of the gradient section yielded F = 8.69 and p = 0.008 (p < 0.01), indicating that the regression equation passed the F-test and that the regression relationship exists within a 95% confidence interval. The model’s independent variable fit index R X 2 = 0.82 and dependent variable fit index R Y 2 = 0.94 , with the model prediction index Q 2 = 0.86 , all exceed 0.5. This indicates acceptable model fit results and demonstrates the model possesses good predictive capability.
  • Speed Prediction Model for Diversion Points
The variables selected for model construction include: acceleration lane start velocity Vt, deceleration lane length Ld, right-hand hard shoulder width w, and deceleration gradient rate K. After extracting three latent components, the regression model was fitted and inverted to yield the following prediction expression:
V d = 0.722 V t + 100.081 K + 0.023 L d 2.413 w + 18.549
The operational speed model for trucks at the start of the gradient section yielded F = 17.17 and p = 0.001 (p < 0.05), indicating that the regression equation passed the F-test and that the regression relationship exists within a 95% confidence interval. The model’s independent variable fit index R X 2 = 0.855 and dependent variable fit index R Y 2 = 0.95 , with the model prediction index Q 2 = 0.916 , all exceed 0.5. This indicates acceptable model fit results and demonstrates the model possesses good predictive capability.
  • Divergent Nasal Velocity Prediction Model
The following variables were selected as independent variables: truck operating speed at the diversion point Vd, curvature radius parameter at the diversion nose C2, minimum curvature radius parameter within the ramp visibility zone under the influence of the circular curve widening coefficient C3, and guide line length L2. After extracting three latent components from the regression model, fitting was performed. Following inverse normalization, the following prediction expression was obtained:
V r = 0.915 V d 0.368 C 2 0.364 C w C 3 0.152 L 2 + 12.878
The operational speed model for trucks at the start of the gradient section yielded F = 5.39 and p = 0.031 (p < 0.05), indicating that the regression equation passed the F-test and that the regression relationship exists within a 95% confidence interval. The model’s independent variable fit index R X 2 = 0.89 and dependent variable fit index R Y 2 = 0.963 , with the model prediction index Q 2 = 0.84 , all exceed 0.5. This indicates acceptable model fit results and demonstrates the model possesses good predictive capability.
Based on the results of parametric characterization of operating speeds at the start of the interchange diverting zone, the start of the transition section, the diversion point, and the diversion nose, a model was established using the PLSR method to achieve continuous prediction of speed changes for trucks in the diverting zone. The specific prediction formula is shown in Equation (7).
V 1 = 46.422 e ( 0.0071 V 0 ) ; V 1 V 0 ; V t = 0.56 V 1 + 138.478 K + 0.076 L 1 + 18.368 ; V t V 1 ; V d = 0.722 V t + 100.081 K + 0.023 L d 2.413 w + 18.549 ; V d V t ; V r = 0.915 V d 0.368 C 2 0.364 C w C 3 0.152 L 2 + 12.878 ; V r V d .
The model established in this paper utilizes data collected from a highway with a design speed of 120 km/h and a speed limit of 100 km/h for large vehicles. Vehicle speeds primarily range between 60 km/h and 110 km/h. The primary subject of study is the deceleration lane diverting zone with a width of 3.5 m on a variable-speed lane.
Notably, the continuous speed prediction model (Equation (7)) integrates the geometric and behavioral features across all four characteristic sections, ensuring a smooth and physically consistent speed profile throughout the diverting zone. This approach effectively eliminates potential derivative discontinuities at section boundaries, thereby enhancing the realism and applicability of the model for safety evaluations.

4.3. Safety Evaluation Criteria

  • Evaluation of Longitudinal Speed Coordination
Based on the predicted operating speeds at the start and end points of characteristic road segments, the absolute value of the speed difference Δ v 85 between adjacent segments can be obtained. This serves as one of the fundamental indicators for evaluating road speed coordination. Building upon this, the operating speed gradient indicator Δ I v is proposed. This metric represents the change in operating speed within a 100 m segment, reflecting the intensity of speed variation over a given length. It serves as a complementary evaluation indicator to Δ v 85 for assessing speed coordination between adjacent segments. The calculation method for the operating speed gradient is shown in Equation (8).
Δ I v = Δ v 85 L × 100
In the formula, L represents the length of the analysis unit section, m.
The risk evaluation in this study adopts the threshold criteria from the Chinese national standard [40], which classifies safety risk based on the absolute speed difference between adjacent sections ( Δ v 85 ) and the operating speed gradient ( Δ I v ). These empirically derived thresholds, widely implemented in Chinese design practice, categorize risk into three levels: low risk (|v85| < 10 km/h and |Iv| ≤ 10 km/(h·m)), medium risk (10 km/h ≤ |v85| < 20 km/h and |Iv| ≤ 10 km/(h·m)), and high risk (|v85| ≥ 20 km/h or |Iv| > 10 km/(h·m)).
  • Lateral Stability Evaluation
Compared to passenger cars, trucks have a higher center of gravity and longer wheelbase. When traveling at high speeds, they experience smaller changes in curvature and require a larger turning radius to safely and smoothly exit the main roadway. The stable exit angle at critical slip conditions can be determined using vehicle speed, lateral coefficient of adhesion, and road superelevation. To prevent rollover, the exit angle must satisfy the critical slip condition for the vehicle under wet road surface conditions. Therefore, this paper proposes a safety evaluation index for exit ramp departure angles at interchange exit section based on truck lateral lane-change safety, derived from vehicle dynamics, as shown in Equation (9). The detailed derivation process is provided in Appendix A.
ϕ cr , w = α α w ϕ cr , i = α α i
In the formula, ϕ cr , w represents the lateral stability departure angle coefficient for trucks on wet road surfaces; α w denotes the lateral stability departure angle on wet road surfaces, calculated from the most unfavorable angle with a lateral adhesion coefficient φ set at 0.25; ϕ cr , i is the lateral stability departure angle coefficient for trucks on snow-covered or icy road surfaces; α i is the lateral stability departure angle on snow-covered or icy road surfaces, calculated based on the most unfavorable angle, with the lateral adhesion coefficient φ set to 0.1 during calculation.
The actual longitudinal length traveled during vehicle diversion is related to vehicle speed, body length, and steering capability. Trucks, with their longer bodies and poorer steering ability, require greater diversion lengths at high speeds. If acceleration lanes or gradually fading dashed lines are too short, leaving insufficient space for lane changes, vehicles may intrude into guide lanes, collide, or scrape against guardrails. Therefore, a safety evaluation index for lane change space at interchange exit sections based on truck diversion length is proposed, as shown in Equation (10).
ε cr , w = L D w L 1 ε cr , i = L D i L 1
In the formula, ε cr , w represents the space allowance coefficient for truck lane changes under wet road conditions; L Dw denotes the lane change distance for trucks to satisfy the minimum lateral stability radius under wet road conditions, calculated using a lateral adhesion coefficient φ of 0.25; ε cr , i is the space allowance coefficient for truck lane changes under snowy or icy road conditions; L Di is the lane change distance for trucks to satisfy the minimum lateral stability radius under snowy or icy road conditions, with the lateral adhesion coefficient φ set to 0.1.
By evaluating the safety of truck lateral lane changes at interchange exit sections using the exit angle and deceleration space safety indicators, and based on predicted truck speeds at key cross-sections, the design rationality and safety of interchange exit sections can be assessed from both longitudinal and lateral perspectives. The stability evaluation criteria for the deceleration zone are as follows: When ϕ cr , w 1 and ε cr , w 1 , it is classified as low risk; When ϕ cr , w 1 , ϕ cr , i 1 and ε cr , w 1 or ϕ cr , w 1 and ε cr , w 1 , ε cr , i 1 , it is classified as medium risk; All other cases are classified as high risk. The “barrier effect” caused by trucks decelerating and changing lanes not only creates a safety hazard but also reduces the effective capacity of the mainline lanes in the influence zone. This observation resonates with the fluid-dynamic analogy proposed by [41], where traffic is treated as a continuum fluid and bottlenecks are akin to hydraulic shocks. Our proposed safety metrics (longitudinal speed gradient Δ I v and lateral stability indices) could thus serve as practical proxies for identifying the onset of flow breakdown and capacity constraints in interchange areas, bridging the gap between microscopic safety analysis and macroscopic flow theory.
  • Speed Transition Comfort Evaluation
At interchange exit sections, vehicles predominantly decelerate through braking. Changes in longitudinal deceleration reflect drivers’ speed control behaviors. Excessively low or high deceleration rates pose issues of inefficiency and compromised safety and comfort, respectively. Ramp profiles with significant geometric changes exert strong constraints on vehicle speeds. The merging nose speed, as the initial speed entering the ramp, is constrained by the control curve and influences both driving risks and strategies. This study calculates the minimum ramp control curve speed vs. for different control curve radii and pavement conditions from a vehicle stability perspective, referencing relevant methodologies. It then determines the average deceleration for each characteristic section based on predicted operating speeds using the following formula.
a = V r 2 V s 2 25.92 L s
In the formula, V s denotes the safe passing speed at the starting point of the ramp control curve in km/h. When the calculated pavement condition is wet, its value is V s , w ; when the calculated pavement condition is snow-covered or icy, its value is V s , I .
The complete deceleration process for diverted vehicles includes both the mainline deceleration section and the ramp deceleration section. The terminal speed at the end of the ramp deceleration section is closely related to the radius of the ramp control curve. Using the design speed as the terminal speed for the transition curve may underestimate ramp safety. Therefore, the maximum terminal speed for the ramp must be determined from a safety perspective, calculated using the following formula.
V s = 127 R ( φ + i h )
In the formula, the lateral adhesion coefficient φ is set to 0.25 for wet pavement during rainfall and 0.1 for icy or snow-covered pavement after snowfall.
The Chinese Driver’s Manual recommends a deceleration value of 1.0–1.5 m/s2 for comfortable deceleration and 1.5–2.0 m/s2 for basic comfort. Therefore, based on deceleration comfort during the traffic diversion deceleration phase and using the deceleration value at adjacent cross-sections as the standard, the comfort level of road section deceleration can be classified into three categories: comfortable, basic comfort, and uncomfortable.

5. Case Study Verification

This study collected and processed floating vehicle data for heavy trucks in 16 interchange diverting zones. Interchange zones 1–12 were used for analysis and modeling, while zones 13–16 served as case studies for application and validation. The four selected interchange mainlines for case validation have a design speed of 120 km/h, with a speed limit of 100 km/h for large vehicles. The interchange exit configurations include direct deceleration lanes for single-lane traffic at both trumpet and Y-type interchanges. Ramp types encompass direct ramps, semi-direct ramps, and loop ramps. The parameters required for safety evaluation of the deceleration zones are listed in Table 4.

5.1. Operational Speed Prediction and Coordination Evaluation

Since the safety evaluation results depend on the effective prediction of operating speeds, the Mean Absolute Percentage Error (MAPE), Mean Absolute Error (MAE), and Mean Percentage Error (MPE) were selected to measure the accuracy of the model established in this paper. Substituting the variable parameters for each diverting zone from Table 5 into the operational speed prediction model equation yields the predicted operational speeds for heavy trucks in the diverting zones. The error values between the measured and predicted values were calculated using the above equation, as shown in Table 5.
Calculations show that the mean absolute percentage errors MAPE for the freight train speed prediction models at the gradient point, diversion point, and diversion nose are 1.3%, 3.7%, 2.7%, and 4.3%, respectively. with MAPE values below 10% for all characteristic sections. The maximum absolute error was 5.6 km/h, indicating that the difference between the model-calculated and actual operating speeds remained under 10 km/h. This demonstrates that the established operating speed prediction model is applicable for forecasting truck speeds at interchange exits on mainline highways with a 100 km/h speed limit for large vehicles, specifically those featuring single-lane direct deceleration lanes.
Based on operational speed prediction results, the speed coordination of each characteristic section was evaluated. As shown in Table 6, operational speed predictions identified 2 medium-risk and 2 high-risk sections, while actual measurements revealed 1 medium-risk and 2 high-risk sections. Comparing the evaluation results from predicted and measured values reveals that actual risk was overestimated only at the Y-interchange exit. This primarily stems from the high-quality alignment at the Y-interchange exit, where the ramp design speed is 60 km/h. Drivers tend to maintain higher expected speeds and show little willingness to decelerate. The evaluation results for other road sections were largely consistent, suggesting that the method can, to a certain extent, adequately represent the actual coordination of truck operating speeds in these segments.

5.2. Lane Change Stability Evaluation

To safely exit the main roadway, vehicles must complete deceleration and lane changes within the transition zone. Considering the most unfavorable scenario—where vehicles travel at a constant speed from the transition zone’s starting point—and incorporating the two most adverse lateral friction coefficients for wet and icy/snow-covered road surfaces, the evaluation results for the transition zone exit angle are shown in Table 7.
Analysis reveals that the departure angle coefficients derived from predicted versus actual running speeds under slippery and snow-covered/icy road conditions are all less than 1. This indicates that trucks can safely navigate circular curves at normal speeds using the minimum circular curve trajectory even during adverse weather conditions.
When trucks complete lane changes at high speeds, they require a larger turning radius. To ensure vehicles can execute normal lane changes under adverse weather conditions, it is necessary to design appropriate lengths for the gradual dashed lines, providing sufficient longitudinal space for vehicles to merge onto the ramp. Based on the preceding analysis, vehicles must traverse the holding area and undergo steering and steering-maintenance phases before fully entering the ramp. Integrating relevant scholarly research with this paper’s observations on truck diversion initiation points, it is determined that over 85% of trucks begin lane changes approximately 20 m after the transition zone’s starting point. Therefore, from a safety perspective, the holding area length is set at 20 m. The minimum turning radius for trucks under worst-case conditions can be calculated using Equation (A2). The evaluation results for the lane-change reservation length are presented in Table 8.
Analysis reveals that the lateral separation coefficients derived from predicted versus actual running speeds under wet and snow-covered/icy road conditions are all less than 1. This indicates that trucks can still maintain sufficient longitudinal clearance to navigate curved sections at normal speeds with minimal turning radius during adverse weather conditions.

5.3. Evaluation of Comfort in Traffic Diversion and Speed Reduction

Vehicles exiting the mainline from high speeds primarily rely on braking for deceleration control. Excessive deceleration causes tire-to-road surface wear and increases driver tension and discomfort, thereby heightening the risk of operational errors and accidents. Considering truck deceleration states across different road sections, the deceleration evaluation for the diversion process is presented in Table 9, covering both mainline deceleration and ramp deceleration aspects.
Calculations of maximum average deceleration across key sections of the mainline and ramp deceleration zones reveal that deceleration levels on all key sections fall below the comfort requirement of 1.5 m/s2 under normal conditions. Only the transition ramp at Interchange 16 achieves deceleration within the basic comfort range of 1.5–2 m/s2 for vehicles traveling after snowfall. Post-snowfall deceleration rates are relatively high. Therefore, under adverse weather conditions, drivers should be alerted to slow down promptly at mainline exit sections to ensure sufficient safety deceleration distance is maintained.

6. Conclusions

This study utilizes high-frequency trajectory data from floating vehicles to conduct an in-depth investigation into the speed characteristics and safety issues of heavy trucks operating in interchange deceleration zones. A predictive model for deceleration zone speeds was developed, and a speed-based safety evaluation method for deceleration zone driving was proposed. Key findings include:
  • A robust data processing pipeline was developed using floating car trajectory data from logistics trucks. The framework incorporates trajectory preprocessing, anomaly detection and cleaning, data quality assessment, and road information matching. Through integration with road design parameters and traffic facility information, a multi-dimensional “vehicle-road” database was established, providing a solid foundation for subsequent analysis.
  • Based on the trajectory database and road characteristics, the diverging area was divided into functional sections for detailed analysis. The study revealed that: most trucks begin deceleration approximately 200 m before entering taper sections; operating speeds at divergence noses consistently exceed design speeds, with significant variations among different ramp types; deceleration rates at loop ramps are substantially higher than other ramp configurations; and over 85% of trucks initiate lane-changing within 20 m after entering taper sections.
  • The diverging area was segmented into four characteristic sections based on truck behavior patterns. Using Variable Importance in Projection analysis and Partial Least Squares Regression, operating speed prediction models were developed for key locations including the divergence preparation area, taper section beginning, divergence point, and divergence nose. The models effectively address multicollinearity among variables and demonstrate strong explanatory power for speed variation patterns.
  • A comprehensive safety assessment framework was established, evaluating operational safety from three perspectives: speed consistency between consecutive sections, vehicle stability during lane-changing maneuvers, and driver comfort during deceleration. The models were validated using four case studies, showing prediction errors below 10% MAPE. The safety evaluation results align well with actual field conditions, demonstrating practical applicability for engineering design and safety management.
This study developed a prediction model for truck operating speeds in freeway interchange diverging areas, yet several limitations remain that warrant further investigation:
  • The current research primarily focuses on truck speed characteristics under free-flow conditions and does not fully capture operational patterns under non-free-flow traffic volumes. Future studies should expand the range of observation samples by incorporating variables such as different interchange types and traffic volumes to enhance the model’s applicability.
  • Although the high-frequency floating car data used in this study offer extensive spatial and temporal coverage, they insufficiently account for truck-specific characteristics and the influence of diverse geographical environments on vehicle speeds in exit areas, leading to certain biases in speed prediction for specific vehicle types.
  • This study concentrates solely on diverging areas of interchanges and does not thoroughly investigate truck driving behavior in merging areas and on ramps. Subsequent research may extend the scope to include these segments to provide a more comprehensive understanding.

Author Contributions

Conceptualization, H.B. and S.X.; methodology, C.Z.; software, S.X.; validation, H.B., C.Z. and B.W.; formal analysis, H.B.; investigation, C.Z.; resources, H.B.; data curation, T.G.; writing—original draft preparation, B.W.; writing—review and editing, B.W.; visualization, Z.C.; supervision, Y.L.; project administration, C.Z.; funding acquisition, C.Z. All authors have read and agreed to the published version of the manuscript.

Funding

This research was funded by Key Research and Development Program of Shanxi Province (grant number: No. 202102020101014), Fundamental Research Funds for the Central Universities (CHD grant number: No. 300102215206), Science and Technology Project of Sichuan Transportation Department (2023-A-04) and National Natural Science Foundation of China (72371036).

Institutional Review Board Statement

Not applicable.

Informed Consent Statement

Not applicable.

Data Availability Statement

The data presented in this study are available on request from the corresponding author.

Conflicts of Interest

Author Haochen Bai was employed by the CCCC First Highway Consultants Co., Ltd. Author Shengyu Xi was employed by the Shanghai Municipal Engineering Design Institute (Group) Co., Ltd. The remaining authors declare that the research was conducted in the absence of any commercial or financial relationships that could be construed as a potential conflict of interest.

Appendix A

Derivation of the Lateral Stability Evaluation Formula
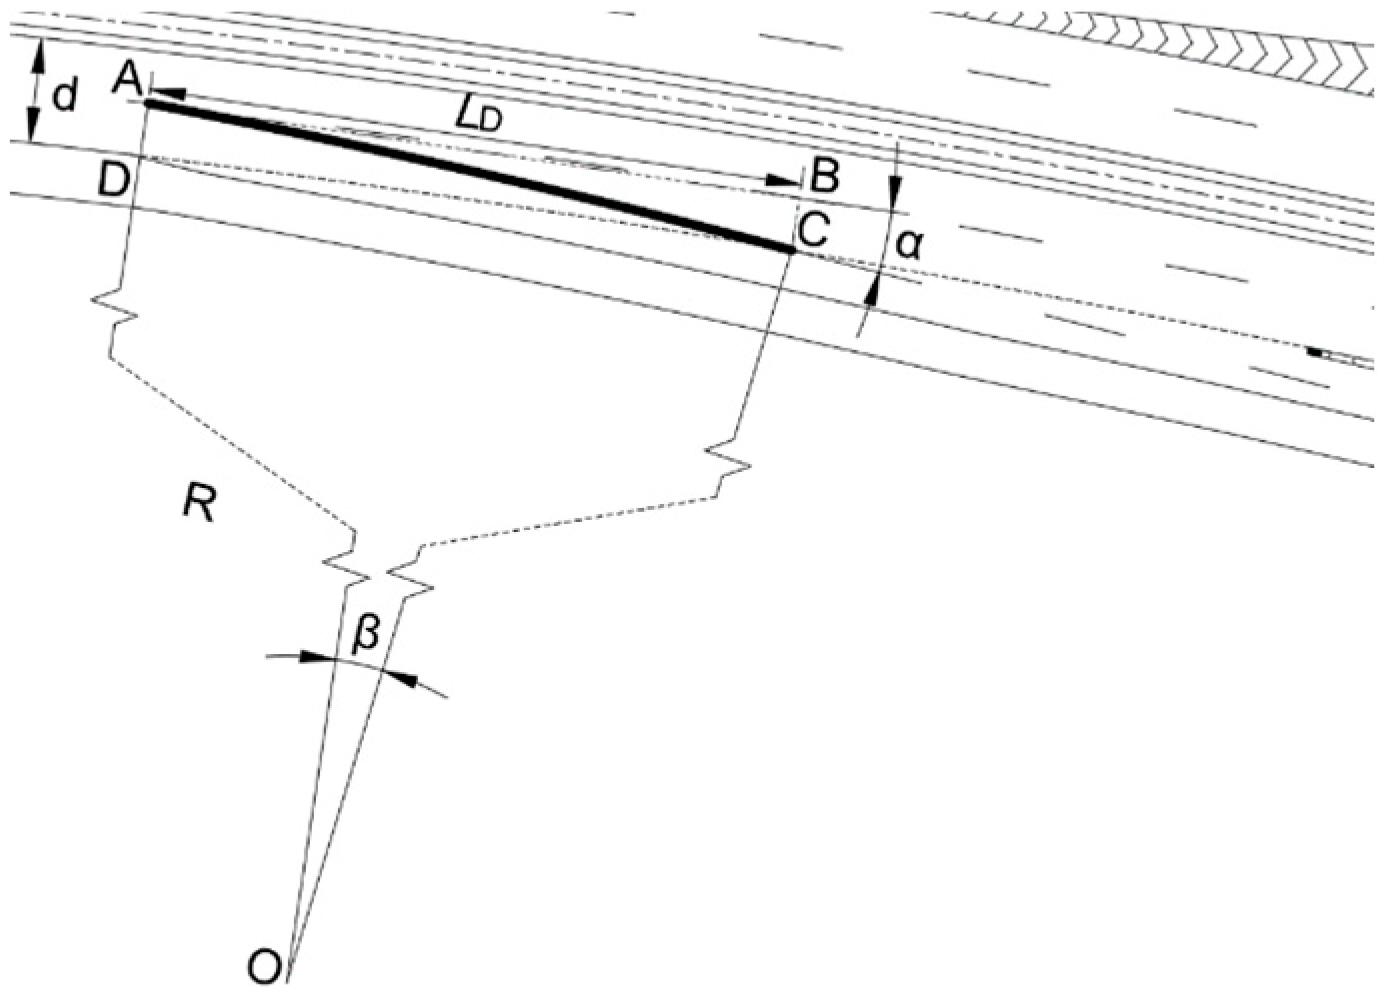
At the transition section of a highway interchange exit, as shown in Figure A1, the vehicle’s original direction of travel is AB. If the vehicle needs to depart the main roadway, the driver must turn the steering wheel to alter the vehicle’s turning angle α, changing the direction of travel from AB to AC in order to safely and efficiently enter the deceleration lane. AC represents the vehicle’s actual trajectory, which approximates a spiral curve. For simplified calculations, since the length of AC is relatively short and meets both engineering precision requirements and vehicle maneuverability needs, it can be treated as a circular curve with constant radius. This curve has its center at point O, radius R, and central angle β.
Figure A1. Vehicle Turning Radius Diagram.
Sustainability 17 09194 g0a1
Based on the geometric relationship of the vehicle’s trajectory during steering, Equation (A1) can be derived.
R = d 2 ( 1 cos β ) β = 2 α
In the formula, α denotes the outlet angle; β denotes the central angle.
When a vehicle travels along a circular curve, it experiences centrifugal force. Excessive centrifugal force can cause the vehicle to slide laterally. To ensure driving safety, the lateral force must not exceed the lateral friction force between the tires and the road surface. This yields the minimum circular curve radius Formula (A2) for preventing vehicle skidding. Based on force analysis, when the critical slip angle for heavy trucks on wet roads is satisfied, most trucks will not overturn.
R V 2 127 ( φ + i h )
In the formula, φ represents the lateral adhesion coefficient, typically taken as φ = ( 0.6 ~ 0.7 ) φ max ; i h denotes the pavement superelevation, set at 2%.
The minimum radius required to prevent lateral slip at a given speed can be calculated using the following equation R. By solving the simultaneous equations, the required slip angle range for maintaining vehicle slip stability can be determined, as shown in Equation (A3).
α 1 2 arccos [ 1 127 ( φ + i h ) d 2 V 2 ]
The lateral adhesion coefficient φ is determined by the adhesion capacity between the road surface and the tire, with its value most significantly influenced by weather conditions. The range of lateral adhesion coefficients under various weather conditions is shown in Table A1.
Table A1. Range of values for the lateral adhesion coefficient.
Road Surface ConditionsGenerally DryWetIcy and SnowySlippery Ice
Lateral Attachment Coefficient φ0.4~0.80.25~0.40.1~0.20.06
By determining the chord angle and the radius of the circular curve, the length of chord AC can be calculated. Using trigonometric functions, the longitudinal travel distance L D 2 of the truck during the lane change along arc length AC is obtained, as shown in Equation (A4).
L D 2 = R sin ( 2 α )
After entering the transition zone, trucks must pass through the waiting area, turning phase, and turn-holding phase before fully exiting the main roadway. Therefore, the distance required for truck lane changes is as per Equation (A5).
L D = L D 1 + L D 2 = L D 1 + V 2 sin ( 2 α ) 127 ( φ + i h )
In the formula, L D represents the minimum trajectory length for vehicle stability, m; L D 1 denotes the length of the vehicle’s pre-steering zone, m; L D 2 indicates the length of the vehicle’s steering phase, m.
Based on the above derivation, safety evaluation indicators for the exit ramp section of interchange overpasses have been established to assess the safety of lateral lane changes by trucks.

References

  1. Ministry of Transport of the People’s Republic of China. 2024 Statistical Bulletin on the Development of the Transport Industry [EB/OL]. Available online: https://xxgk.mot.gov.cn/2020/jigou/zhghs/202506/t20250610_4170228.html (accessed on 15 June 2025).
  2. Lin, P.Q.; Gong, M.P.; Zhou, C.H. Highway Truck User Profile Method for Transportation Risk Identification. J. South China Univ. Technol. (Nat. Sci. Ed.) 2023, 51, 1–9. [Google Scholar]
  3. Zhang, C.; Liu, K.; Wang, S.F.; Xie, Z.L.; Wang, X. A Review of Research on Safety of Entrance and Exit of Highway Interchanges. J. Traffic Inf. Saf. 2023, 41, 1–17. [Google Scholar]
  4. Zhang, C.; Hu, T.; Lin, X.C.; Bai, H.C.; Wu, S.G. Research on Exclusive Retarder Lanes for Large Trucks on Expressway Continuous Long Downgrade Sections. J. South China Univ. Technol. (Nat. Sci. Ed.) 2020, 48, 104–113. [Google Scholar]
  5. Zhang, G. Research on the Influence Effect of Trucks in the Highway Ramp Diverging Area. Master’s Thesis, Chang’an University, Xi’an, China, 2019. [Google Scholar]
  6. Wang, B.; Zhang, C.; Ren, S.P.; Liu, C.H.; Xie, Z.L. Identification Method of Driving Risk on Expressway Based on Velocity Risk Potential Field. J. Zhejiang Univ. (Eng. Sci.) 2023, 57, 997–1008. [Google Scholar]
  7. She, M.X. Research on Vehicle Operating Speed Prediction Model for Continuous Downgrade Sections Based on Cross-Section Observation Method. J. Highw. Transp. Res. Dev. (Appl. Technol. Ed.) 2019, 15, 310–315. [Google Scholar]
  8. Liu, Q.; Yang, Z.C.; Cai, L. Short-Term Traffic Flow Forecasting on Expressways Based on ETC Gantry Data. J. Highw. Transp. Res. Dev. 2022, 39, 123–130. [Google Scholar]
  9. Wu, L.; Liu, J.B.; Ma, X.L.; Liu, W.W.; Wang, Y.Q. Lane-Level Speed Characteristics and Short-Term Prediction Model for Diverging and Merging Areas of Expressway Interchanges. J. Highw. 2023, 68, 182–191. [Google Scholar]
  10. Zhang, C.; Gao, Y.Y.; Yang, R.W.; Liu, C.H.; Xie, Z.L.; Jin, Y.L. Operating Speed Model for Small Clear Distance Sections of Interchange Tunnels Based on Aerial Data. J. Chang’an Univ. (Nat. Sci. Ed.) 2024, 44, 136–150. [Google Scholar]
  11. Xu, J.; Wang, Y.P.; Chen, H.Y.; Zhang, X.B.; Pan, C.S. Longitudinal Driving Characteristics and Operating Speed Model of Passenger Cars on Hairpin Curves of Mountain Highways. J. Jilin Univ. (Eng. Technol. Ed.) 2023, 53, 3432–3445. [Google Scholar]
  12. Guo, Q.M.; Wang, X.S.; Chen, Z.G. Operating Speed Modeling for Mountain Expressways Based on Driving Simulation Experiments. J. Tongji Univ. (Nat. Sci.) 2019, 47, 1004–1010. [Google Scholar]
  13. Lyu, M.; Ji, Y.; Kuai, C.; Zhang, S. Short-Term Prediction of On-Street Parking Occupancy Using Multivariate Variable Based on Deep Learning. J. Traffic Transp. Eng. (Engl. Ed.) 2024, 11, 28–40. [Google Scholar] [CrossRef]
  14. Gao, C.; Xu, J.L.; Jia, M.; Sun, Z.H. Correlation Between Carbon Emissions, Fuel Consumption of Vehicles and Speed Limit on Expressway. J. Traffic Transp. Eng. (Engl. Ed.) 2024, 11, 631–642. [Google Scholar] [CrossRef]
  15. Zhang, M.; Chen, J.L.; Zhang, C.; Wang, S.F.; Xiao, F. Aerial Photography Data-Based Method for Evaluating Traffic Safety of Highway Exit Loop Ramps. J. Chang’an Univ. (Nat. Sci. Ed.) 2024, 44, 108–118. [Google Scholar]
  16. Xin, F.F.; Chen, X.H.; Lin, H.F. Research on Road Network Coverage Capability of Floating Car Data Based on Sample Size. J. Highw. Transp. Res. Dev. 2009, 26, 140–144. [Google Scholar]
  17. Yan, X.D.; Liu, X.B.; Liu, Y.; Ma, S.X. Urban Traffic Congestion Identification and Evaluation Based on Floating Car Big Data and Grid Model. J. Beijing Jiaotong Univ. 2019, 43, 104–113. [Google Scholar]
  18. Ding, T.J.; Shi, D.X.; Li, Y.M. Road Average Speed Estimation Method Based on Taxi GPS Data. J. Comput. Technol. Dev. 2015, 25, 15–19. [Google Scholar]
  19. Hu, J.B.; Ma, W.Q. Study on Length of Speed Change Lane for Trumpet Interchange of Expressway. Proc. 8th China Intell. Transp. Annu. Meet. 2013, 2592, 779–780. [Google Scholar]
  20. Lyu, N.C.; Du, Z.J.; Wu, C.Z.; Wang, Y.G. Safety Characteristics Analysis of Multi-Lane Expressway Exit Opening Section. J. Transp. Syst. Eng. Inf. Technol. 2021, 21, 120–130. [Google Scholar]
  21. Gu, X. Research on Traffic Conflict Prediction Model for Merging Areas of Expressway Interchanges. Master’s Thesis, Southeast University, Nanjing, China, 2020. [Google Scholar]
  22. Zhao, J.; Guo, Y.; Liu, P. Safety Impacts of Geometric Design on Freeway Segments with Closely Spaced Entrance and Exit Ramps. Accid. Anal. Prev. 2021, 163, 106461. [Google Scholar] [CrossRef] [PubMed]
  23. Yan, Y.; Zhang, Y.; Li, G.P.; Zhang, P.; Wang, X.F. Comprehensive Evaluation of Highway Alignment Consistency Based on Speed Characteristic Indicators. J. Saf. Environ. 2017, 17, 835–839. [Google Scholar]
  24. Xu, J.; Cui, Q.; Lin, W.; Wang, C.Q.; Wu, G.X. Passenger Car Speed Characteristics on Spiral Ramps and Spiral Bridges. China J. Highw. Transp. 2019, 32, 158–171. [Google Scholar]
  25. Shen, Q.R.; Zhao, Y.F.; Chen, Z.Y.; Cao, H. Sight Distance Analysis for Identifying Constrained Exits of Expressway Interchanges. J. China Foreign Highw. 2012, 32, 305–307. [Google Scholar]
  26. Wu, Y. Study on Sight Distance for Exit Recognition of Expressway Interchanges. Highw. Automot. Appl. 2014, 3, 109–112. [Google Scholar]
  27. Zhang, C.; Qi, C.; Hua, G.L.; Liu, Y.Y. Driving Risk Simulation Analysis of Lorries at Interchange Exit Section. J. Railw. Sci. Eng. 2016, 13, 2522–2532. [Google Scholar]
  28. Lamm, R.; Choueiri, E.M.; Hayward, J.C.; et al. Possible Design Procedure to Promote Design Consistency in Highway Geometric Design on Two-Lane Rural Roads. Transp. Res. Rec. 1988, 1195, 111–122. [Google Scholar]
  29. Wang, X.; Dong, X.; Zhang, Z.; Wang, Y. Transportation Carbon Reduction Technologies: A Review of Fundamentals, Application, and Performance. J. Traffic Transp. Eng. (Engl. Ed.) 2024, 11, 1340–1377. [Google Scholar] [CrossRef]
  30. Bucchi, A.; Biasuzzi, K.; Simone, A. Evaluation of Design Consistency: A New Operating Speed Model for Rural Roads on Grades. Transp. Res. Rec. 2005, 1701, 76–85. [Google Scholar]
  31. Papadopoulos, E.; Nikolaidou, A.; Lilis, E.; Politis, I.; Papaioannou, P. Extending the Decision-Making Process During Yellow Phase from Human Drivers to Autonomous Vehicles: A Microsimulation Study with Safety Considerations. J. Traffic Transp. Eng. (Engl. Ed.) 2024, 11, 362–379. [Google Scholar] [CrossRef]
  32. Guo, T.Y.; Deng, W.; Lu, J. Safety Evaluation of Expressway Exits Based on Speed Consistency. J. Transp. Syst. Eng. Inf. Technol. 2010, 10, 76–81. [Google Scholar]
  33. Gao, J.; Guo, Z. Evaluation of Highway Alignment Design Quality Based on Operating Speed. J. Tongji Univ. (Nat. Sci.) 2004, 32, 906–911. [Google Scholar]
  34. Chen, X.G. Comprehensive Safety Evaluation of Highway Alignment Based on Operating Speed. Master’s Thesis, Chongqing Jiaotong University, Chongqing, China, 2015. [Google Scholar]
  35. Římalová, V.; Elgner, J.; Ambros, J.; Fišerová, E. Modelling the Driving Speed on Expressway Ramps Based on Floating Car Data. Measurement 2022, 195, 110995. [Google Scholar] [CrossRef]
  36. Xu, J.; Cui, Q.; Chang, X.; Fu, J.H.; Wu, G.X. Longitudinal Driving Behavior Characteristics at Entrances/Exits of Cloverleaf Interchanges. J. Southeast Univ. (Nat. Sci. Ed.) 2019, 49, 1205–1214. [Google Scholar]
  37. Lee, H.E.; Lee, E. Congestion Boundary Approach for Phase Transitions in Traffic Flow. Transpmetrica B Transp. Dyn. 2024, 12, 1–20. [Google Scholar] [CrossRef]
  38. Van de Waterbeemd, H. (Ed.) PLS for multivariate linear modeling. In Chemometric Methods in Molecular Design; Verlag-Chemie: Weinheim, Germany, 1995; pp. 195–218. [Google Scholar]
  39. Zeng, T.; Ju, C.Y.; Cai, T.J.; Liu, W.B.; Yao, Y.F. Selection of Canopy Density Estimation Parameters Using Variable Projection Importance Criterion. J. Beijing For. Univ. 2010, 32, 37–41. [Google Scholar]
  40. JTG B05-2015; Specifications for Highway Safety Audit. China Communications Press: Beijing, China, 2015.
  41. Laval, J.A. Traffic Flow as a Simple Fluid: Toward a Scaling Theory of Urban Congestion. Transp. Res. Rec. 2024, 2678, 376–386. [Google Scholar] [CrossRef]
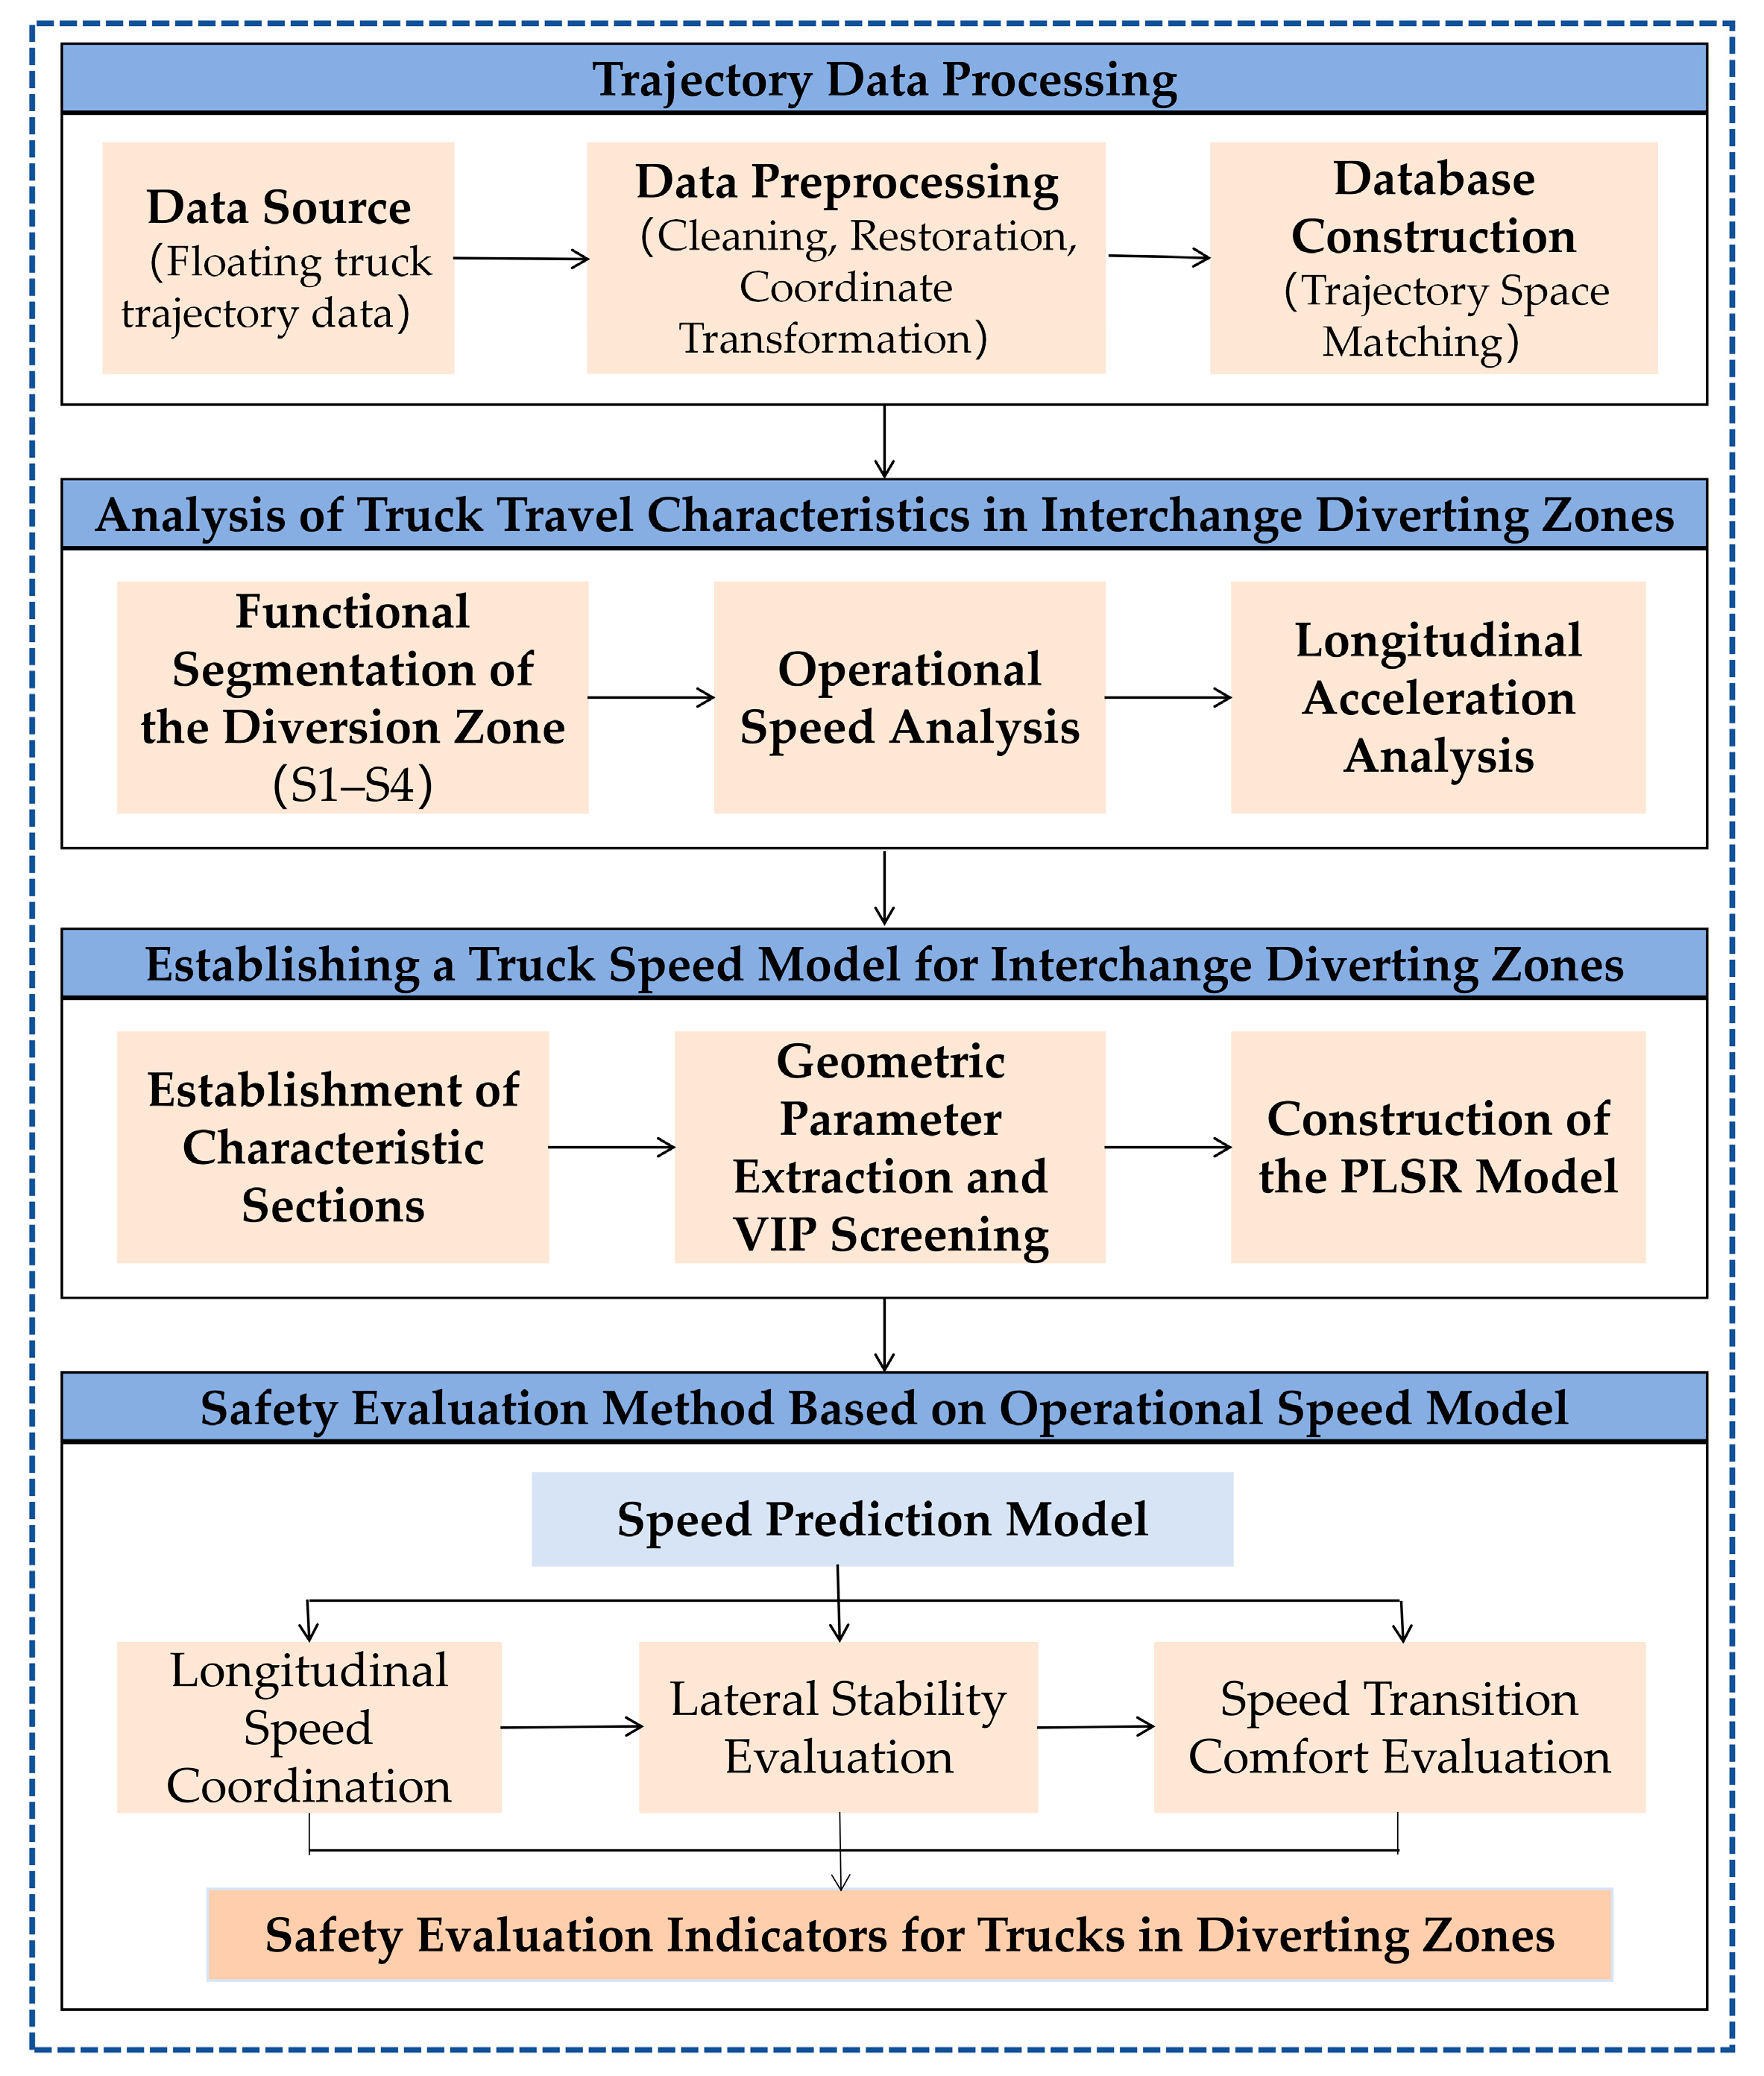
Figure 1. Technology Roadmap.
Sustainability 17 09194 g001
Figure 2. Schematic Diagram of the Study Section.
Sustainability 17 09194 g002
Figure 3. Bicycle Trajectory Data Spatial Slicing.
Sustainability 17 09194 g003
Figure 4. Construction of a Truck Trajectory Database for Interchange Ramp Exit Sections.
Sustainability 17 09194 g004
Figure 5. Schematic of the Study Area for Interchange Diversion Sections.
Sustainability 17 09194 g005
Figure 6. Overall Speed Trend of Vehicles in the Diverting Zone.
Sustainability 17 09194 g006aSustainability 17 09194 g006b
Figure 7. Overall Trend Chart of Longitudinal Acceleration.
Sustainability 17 09194 g007
Figure 8. Safety Evaluation Process for Trucks in Interchange Diverting Zones.
Sustainability 17 09194 g008
Figure 9. Schematic Diagram of Interchange Diverting Zones.
Sustainability 17 09194 g009
Table 1. Collect basic information and quantity of samples.
Export
Number
Interchange TypeMainline Hard Shoulder Width
w (m)
Design Speed of Ramp
VL (m)
Variable Speed Lane Length
LVSL (m)
Exit Ramp TypeSample Size
(Vehicles)
1B Horn2.540236Direct-connect257
2B Horn2.540233Circular ring45
3B Horn3.040197Circular ring40
4B Horn3.040215Direct-connect85
5A Horn3.540140Semi-direct connection46
6B Horn2.540220Direct-connect42
7A Horn2.540227Semi-direct connection180
8A Horn2.540230Direct-connect40
9Y-type3.040213Semi-direct connection156
10A Horn3.060157Direct-connect346
11A Horn3.040195Direct-connect41
12A Horn3.040195Direct-connect82
13B Horn2.540230Circular ring51
14A Horn3.040158Semi-direct connection49
15Y-type3.060142Direct-connect46
16A Horn3.040136Direct-connect39
Table 2. Statistics on Speed Variations in Diversion Vehicle Sections.
Interval SectionAverage Speed Reduction (km/h)SDAverage Cumulative Decrease (%)
Section S10.016.870.2
Section S22.606.232.1
Section S39.587.1712.7
S4 Diverting Zone4.403.8618.2
S4 Deceleration Lane8.306.0028.7
Table 3. Geometric Design Parameters Statistics Table.
VariableExport Number
123456789101112
Lt/m8077805879587378958590110
Ld/m140150150178154139142135621105085
L1/m1301621651311337411698100100100130
L2/m9065651051001239911557954065
R1/m240099992000200020001200120040002200250020009999
R2/m1000200015009001000200989300600450400600
R3/m1201601401806055135250540300140400
C12.2912.752.752.754.584.581.382.52.22.751
C21.00 1.00 1.00 1.11 1.00 5.00 1.01 3.33 1.67 2.22 2.50 1.67
C38.33 6.25 1.00 5.56 16.67 18.18 7.41 4.00 1.85 3.33 7.14 2.50
Cw1.00 1.00 1.00 1.00 1.17 1.27 1.00 1.00 1.00 1.00 1.00 1.00
i1/%−1.57 −1.50 0.50 0.50 2.50 −0.31 1.00 0.30 0.44 1.30 0.30 −1.16
i2/%1.25 −0.44 −2.00 0.30 −1.73 1.46 −1.46 0.30 0.44 −1.45 0.30 −0.30
a12002745452525245518180
K0.05 0.05 0.05 0.07 0.05 0.07 0.05 0.05 0.04 0.05 0.04 0.04
Ls/m7075250757030603030707540
Lt denotes the transition segment length; Ld denotes the deceleration lane length; L1 denotes the dashed transition line length; L2 denotes the guide line length; R1 denotes the mainline circular curve radius at the interchange exit; R2 denotes the diverging nose circular curve radius; R3 denotes the ramp control curve radius; C1 denotes the mainline curvature radius parameter at the interchange exit; C2 is the curvature radius parameter at the diversion nose tip; C3 is the minimum curve radius parameter for the ramp within 1.25 times the stopping sight distance behind the diverging nose; Cw is the widening circular curve radius influence coefficient; i1 is the longitudinal gradient of the mainline before the transition point; i2 is the longitudinal gradient of the mainline after the transition point; a1 is the transition angle of the mainline circular curve at the interchange exit; K is the transition rate; Ls is the transition curve length.
Table 4. Interchange Ramp Exit Design and Evaluation Parameters.
VariableExport Number
13141516
K0.053 0.059 0.047 0.050
L1/m120.00 100.00 100.00 82.00
Ld/m155.00 90.00 57.00 54.00
L2/m110.00 58.00 42.00 52.00
w/m2.50 3.50 3.50 3.50
C25.00 2.44 2.08 1.25
C37.142.442.08 11.11
Cw1.17 1.00 1.00 1.00
R2/m200.00 410.00 480.00 800.00
R3/m60120.00 32090.00
Ls/m12033125075
Table 5. Calculation Results for Speed Deviation.
Export NumberV1VtVdVrV1VtVdVrV1VtVdVr
MAPE (%)MAE (km/h)MPE (%)
130.73.63.12.60.62.92.51.8−0.73.63.1−2.6
141.84.32.06.31.63.51.54.51.84.32.06.3
151.55.95.34.11.55.64.53.4−1.5−5.9−5.3−4.1
161.41.10.44.31.30.90.32.91.41.1−0.44.3
Table 6. Featured Section Speed Coordination Evaluation Table.
Export NumberPredictionActual Measurement
|v85||Iv|Evaluation Results|v85||Iv|Evaluation Results
13Diverting Impact Zone3.021.01Low risk2.430.81Low risk
Diverting Preparation Zone4.552.28Low risk8.084.04Low risk
Transition Section2.232.97Low risk1.762.34Low risk
Deceleration Lane15.329.88Moderate risk10.867.00Moderate risk
14Diverting Impact Zone4.721.57Low risk6.372.12Low risk
Diverting Preparation Zone6.693.34Low risk8.564.28Low risk
Transition Section5.868.62Low risk3.905.73Low risk
Deceleration Lane4.545.04Low risk7.458.28Low risk
15Diverting Impact Zone8.422.81Low risk6.882.29Low risk
Diverting Preparation Zone11.885.94Moderate risk7.813.91Low risk
Transition Section8.6010.12High risk9.7611.48High risk
Deceleration Lane1.863.26Low risk2.935.14Low risk
16Diverting Impact Zone5.031.68Low risk6.312.10Low risk
Diverting Preparation Zone9.544.77Low risk9.165.08Low risk
Transition Section6.949.64Low risk4.736.57Low risk
Deceleration Lane6.0611.23High risk8.2915.35High risk
Table 7. Critical Flow Angle Coefficient Table.
Export
Number
PredictionActual Measurement
Wet Runoff Angle CoefficientSnowmelt Runoff Angle CoefficientWet Runoff Angle CoefficientSnowmelt Runoff Angle Coefficient
130.54 0.82 0.54 0.82
140.60 0.91 0.60 0.91
150.55 0.83 0.55 0.83
160.52 0.77 0.52 0.77
Table 8. Flow Distribution Coefficient Table.
Export
Number
PredictionActual Measurement
Wet ConditionSnow Accumulation ConditionWet ConditionSnow Accumulation Condition
130.35 0.59 0.34 0.56
140.45 0.77 0.43 0.73
150.42 0.69 0.45 0.75
160.49 0.81 0.49 0.79
Table 9. Statistical Table of Average Maximum Deceleration by Road Segment.
Export
Number
PredictionActual Measurement
Maximum Deceleration on Mainline (m/s2)Maximum Deceleration on Wet Ramp Deceleration Section (m/s2)Maximum Deceleration on Post-Snowfall Ramp Deceleration Section (m/s2)Maximum Deceleration on Mainline (m/s2)Maximum Deceleration on Wet Ramp Deceleration Section (m/s2)Maximum Deceleration on Post-Snowfall Ramp Deceleration Section (m/s2)
130.570.791.150.410.711.07
140.550.080.340.480.150.42
150.660.000.280.7900.20
160.640.681.560.870.811.70
Disclaimer/Publisher’s Note: The statements, opinions and data contained in all publications are solely those of the individual author(s) and contributor(s) and not of MDPI and/or the editor(s). MDPI and/or the editor(s) disclaim responsibility for any injury to people or property resulting from any ideas, methods, instructions or products referred to in the content.