Article

Research on the Spatiotemporal Effects of Water Temperature in the Construction of Cascade Dams on the Yangtze River Main Stream Based on Optimized CNN-LSTM Attention Model

School of Water Resources and Hydropower Engineering, North China Electric Power University, Beijing 102206, China
*
Author to whom correspondence should be addressed.
Sustainability 2025, 17(20), 9046; https://doi.org/10.3390/su17209046 (registering DOI)
Submission received: 30 August 2025 / Revised: 24 September 2025 / Accepted: 10 October 2025 / Published: 13 October 2025

Abstract

Hydrothermal conditions are a key indicator influencing the evolution of aquatic ecosystems, closely affecting the physical, chemical, and biological properties of water bodies. The construction of cascaded dams on the main stem of the Yangtze River has altered the natural water temperature regime, impacting the hydrothermal status of the water. Utilizing multi-source remote sensing data from Google Earth Engine to invert river surface water temperatures, a parameter-optimized CNN-LSTM-Attention hybrid interpretable water temperature prediction model was constructed. The model demonstrated credible accuracy. Based on the inversion results, the study revealed the spatiotemporal evolution characteristics of water temperature in the main stem of the Yangtze River before and after cascaded dam construction in the lower Jinsha River region and the Three Gorges Reservoir area. The results found that after the construction of the Three Gorges Dam, the annual average water temperature increased significantly by 0.813 °C. The “cold water stagnation effect” induced by cascaded development caused the water temperature amplitude to increase from 8.96 °C to 10.6 °C. Furthermore, the regulating effect of tributary confluence exhibited significant differences. For instance, colder tributaries like the Yalong River reduced the main stem water temperature, while warmer tributaries like the Jialing River, conversely, increased the main stem temperature. The construction of cascaded dams led to distinct variation characteristics in the areas downstream of the dams within the reservoir regions, where tributary inflows caused corresponding changes in the main stem water temperature. This study elucidates the long-term spatiotemporal variation characteristics of water temperature in the main stem of the Yangtze River. The model prediction results can assist in constructing an early warning indicator system for water temperature changes, providing reliable data support for promoting water environment sustainability and ecological civilization construction in the river basin.

1. Introduction

Water temperature is a core physical parameter in aquatic environmental systems, profoundly influencing the survival and reproduction of aquatic organisms, the rates of chemical reactions in water bodies, the migration and transformation processes of pollutants, and characteristics such as dissolved oxygen content [1,2]. The construction of cascaded dams, while characterized by efficient hydropower utilization, leads to reduced hydrological connectivity due to multiple barriers, affecting the natural water temperature regime [3]. However, water temperature data based on station observations exhibit significant limitations in spatial coverage, monitoring frequency, and long-term continuity, making it difficult to capture the spatiotemporal characteristics of water temperature evolution before and after the construction of cascaded dams [4].
Remote sensing, as a means of capturing Earth’s surface and obtaining critical ground information, has been widely applied in the inversion of various water environment elements. For instance, GAO et al. [5] utilized UAV-mounted visible-light cameras and thermal infrared sensors to invert land surface temperatures, demonstrating that the nighttime brightness temperature (the brightness temperature) exhibits a strong correlation with soil moisture content. LU et al. [6] combined remote sensing inversion and ENVI-met 4.4.2 numerical simulation to study the long-term changes in the urban green space cool island effect and discovered the temporal patterns of the phenomenon. However, inversion methods based on ENVI remote sensing software and similar approaches suffer from slow data processing and large data volumes, while the GEE platform, with its massive data storage and powerful cloud computing capabilities, can quickly invert environmental elements. Consequently, using platforms like GEE for remote sensing inversion to simulate water temperatures in rivers or lakes is a common approach. For example, PAN et al. [7] utilized the GEE platform to batch process MODIS data, enabling the RS-DHM to provide reliable hydrological process simulations more rapidly and conveniently for integrated water resource management. WANG et al. [8] processed data from datasets such as LANDSAT/LT08/C02/T1_L2 via the GEE platform and constructed an effective high-precision empirical regression model for water quality inversion (RPD > 1.4). CHEN et al. [9] utilized multi-source remote sensing data provided by the GEE platform to invert water temperatures near hydropower stations. However, remote sensing inversion methods using platforms like GEE sometimes deliver suboptimal performance under complex weather conditions or cloud cover, and differences between various sensors and inversion algorithms may introduce systematic errors.
In recent years, machine learning and deep learning have seen broader application, offering new solutions for time series prediction. For instance, LIU et al. [10] proposed an innovative Generative Adversarial Network framework (VXWGAN-GP), which can be applied to daily-scale runoff prediction. Long Short-Term Memory (LSTM) models demonstrate relatively strong performance in predicting nonlinear time series and can effectively extract features of long-term sequential changes, making them widely favored [11]. For example, CUI et al. [12] combined the Transformer–LSTM neural network algorithm with SVM to achieve more precise temperature inversion in radiation thermometry. LSTM-RNNs have proven highly effective in handling large datasets and are extensively applied [13]. WAN [14] achieved promising results in building a water clarity retrieval model by utilizing LSTM and GRU network architectures. Convolutional Neural Networks (CNNs) excel at extracting image features and possess superior computational efficiency, leading to their widespread use in computer vision fields like image processing [15]. Coupling CNN with other models is a common research approach. For example, Geetha T.S. et al. [16] merged CNN with GRU, enhancing the system’s capability for accurate analysis and prediction of water quality parameters and developing an early warning model for the Vaigai River. XU et al. [17] fused CNN with BiLSTM and a self-attention mechanism (SA), enhancing the performance of total water hardness prediction. Chellaswamy Chellaiah et al. [18] presented a method coupling LSTM and CNN for more precise water quality monitoring. Thus, machine learning methods have been extensively applied in the field of water quality, and it has also been noted that coupling deep learning with GEE may help address the limitations of GEE when dealing with complex weather conditions.
This study selected the hotspot area for dam construction on the main stream of the Yangtze River as the research region. A hybrid approach was introduced to more accurately invert water surface temperature, considering the influence of remote sensing-derived water temperature, land surface temperature, air temperature, and solar radiation. This study collected data from hydrological stations located in the main stream and tributaries of the Yangtze River to ensure the accuracy and relevance of the data used for analysis. The research objectives were to reduce the interference caused by factors such as air temperature and solar radiation on GEE-based retrieval through a deep learning model, improve the accuracy of water temperature simulation, and analyze the impacts of cascade dam construction and tributary inflow on water temperature in the study area based on the research methodology. By inverting the evolutionary characteristics of water temperature in the Yangtze River’s main channel, this work provides foundational data and scientific support for sustainability-oriented ecological scheduling.

2. Materials and Methods

2.1. Study Area

2.1.1. Overview of the Study Area

The length of rivers in the lower reaches of the Jinsha River and the Three Gorges Reservoir area exceeds 1600 km, located in the upper Yangtze River basin of China, spanning western Hubei Province and central Chongqing Municipality. Situated in the transition zone between the Sichuan Basin and the middle–lower Yangtze Plain, this region features complex topography with significant elevation variations. The landscape is predominantly mountainous and hilly, traversed by the Yangtze River and its tributaries, forming an intricate river network. Vegetation is primarily composed of subtropical evergreen broad-leaved forests, supporting significant ecological diversity. The upper Yangtze River reach is rich in hydropower resources, serving as a vital hydropower base in China. Large-scale hydropower stations such as Wudongde, Baihetan, Xiluodu, and Xiangjiaba have been successively completed and put into operation, forming the world’s largest cascaded reservoir system [19]. The Three Gorges Hydropower Station, the world’s largest water conservancy project, plays a crucially important role not only in meeting regional electricity demands but also exerts profound implications in multiple aspects, including water resource management, flood control regulation, and ecological protection [20]. Figure 1 shows the study area map of this research.

2.1.2. Section Selection Features

Six hydrological stations in the lower reaches of the Jinsha River and the Three Gorges Reservoir area were selected for model calibration and validation. Analysis was conducted on partial cross-sections located within the thermal hotspot areas associated with six major dams to capture the spatiotemporal evolution characteristics of water temperature in the Three Gorges Reservoir area. Table 1 shows the selected section names and naming conventions.
Cross-sections were selected based on the pre-dam channel centerline width to avoid interference from terrestrial areas outside the river channel, thereby enhancing data inversion accuracy. Cross-sections were deployed at 40 km intervals, ensuring uniform distance from the dams to guarantee data uniformity. Additionally, cross-sections were established within ±1 km reaches upstream and downstream of each dam (specifically, within 5 km upstream and 3 km downstream for the Three Gorges Dam itself).

2.2. Research Data Sources

Water temperature data originated from the Thematic Mapper (TM) sensor aboard the Landsat 5 satellite, jointly operated by the U.S. Geological Survey (USGS) and NASA. To address gaps in these data, interpolated water temperature data were primarily derived from the MODIS-Aqua satellite sensor operated by NASA. MODIS-Aqua utilizes mid-infrared and thermal infrared channels, combined with the split-window algorithm to correct for atmospheric effects, making it suitable for monitoring water surface temperatures in the main streams and major tributaries of the Three Gorges Reservoir area. Refer to Table 2 for specific data. The measured water temperature data were obtained from the Hydrological Yearbooks compiled by national and local hydrological departments, specifically including monitoring records from hydrological stations within the Three Gorges Reservoir area, such as Panzhihua, Longjie, Huatan, Zhutuo, Cuntan, and Badong. The measured air temperature and solar radiation data, provided at a monthly scale, were sourced from the National Meteorological Data Center and the China Meteorological Data Network (http://www.nmic.cn/, accessed on 12 July 2023). The dataset covers the period from January 2000 to December 2020, and the measurements were conducted using a thermoelectric type (wound constantan copper-plated) automatic remote sensing radiometer with a sensing surface coated with specialized optical black paint, developed in China.

2.3. Research Methodology

2.3.1. Remote Sensing Water Temperature Inversion

Before conducting remote sensing inversion, preprocessing operations are required. Within the GEE platform, the Landsat 5 dataset was called to filter images covering the Three Gorges Reservoir area between 2000 and 2020. Images with cloud cover <5% were prioritized for selection. The analysis was constrained by the study period (e.g., 2000–2020) and the vector boundary of the Three Gorges Reservoir area. Cloud masking was applied using quality bands to remove interference from clouds and cloud shadows, retaining high-quality water pixels.
Atmospheric effects (such as water vapor and aerosols) can interfere with thermal infrared radiation, requiring correction to obtain surface radiance. To improve the inversion accuracy of water surface temperature, this study adopts the radiative transfer model (RTM) method. The RTM method accounts for the absorption and scattering of thermal infrared radiation by the atmosphere and yields a more accurate water surface temperature by solving the radiative transfer equation. The correction formula is as follows:
L λ = τ ε L s + L u + τ 1 ε L d
In the formula, L s represents the water surface radiance; τ represents the atmospheric transmittance; L u represents the upward atmospheric radiance; L d represents the downward atmospheric radiance; and ε represents the water surface emissivity. Parameters such as τ , L u , and L d can be acquired through atmospheric radiative transfer models like MODTRAN.
Utilizing Planck’s Law, water temperature is retrieved based on the corrected at-sensor brightness temperature T. The defining formula is as follows:
T = K 2 ln K 1 L s T s + 1
The formula for calculating the surface temperature of a water body is as follows:
W S T = T 1 + 10.895 T 14380 ln ε 273.15
T s represents the brightness temperature; K 1 and K 2 are constants in Planck’s formula; W S T represents water surface temperature. The coefficient 10.895 is specific to the calculation process for Landsat 8. For Landsat 5 and 7, the corresponding coefficient is 11.45, based on atmospheric correction calculations [21].

2.3.2. Water Temperature Prediction Model

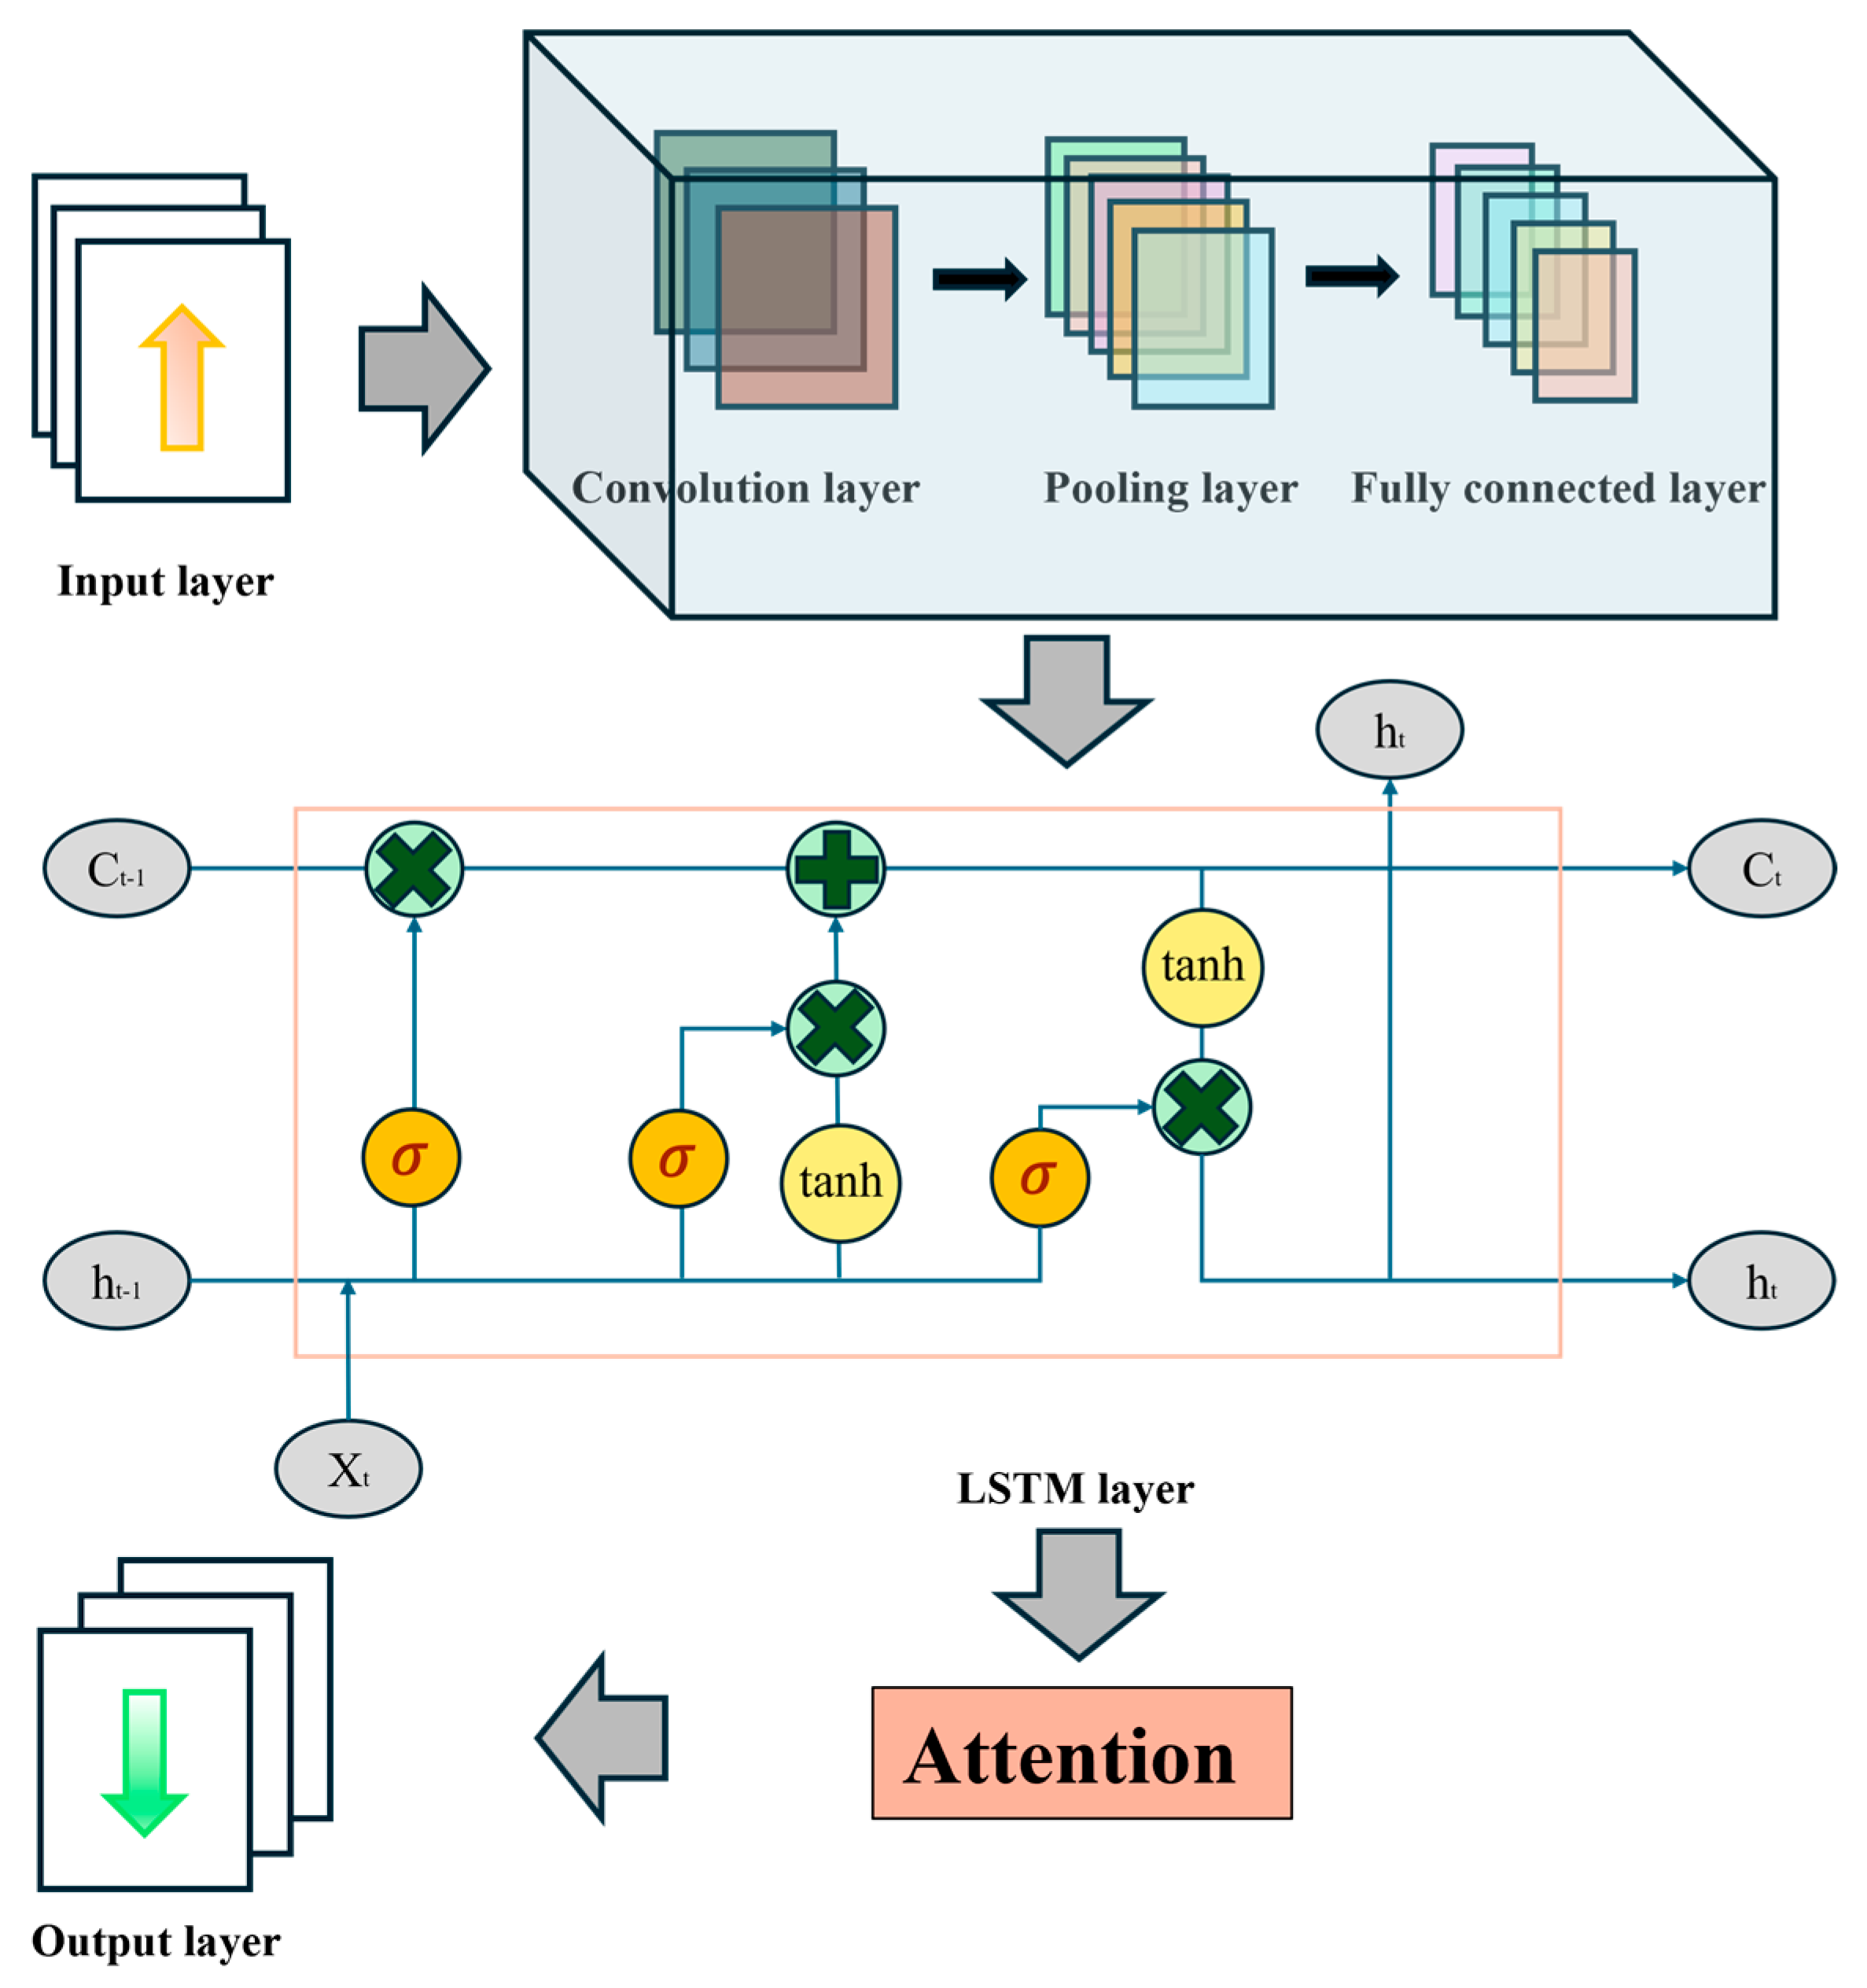
Figure 2 shows the model architecture. In constructing the water temperature prediction model, the target variable is the actual water temperature, with remote sensing-derived water temperature data, land surface temperature data, air temperature data, and solar radiation as the independent variables. The CNN-LSTM-Attention model is employed for fitting to establish the mathematical relationship between the target variable and the feature variables. Its superiority is demonstrated by comparing it with traditional water temperature inversion methods, and it can be applied to the field of water temperature prediction.
The CNN-LSTM-Attention model integrates spatial, temporal, and feature enhancement functionalities through a hierarchical design. The specific architecture is as follows:
CNN: When dealing with problems involving large amounts of raw data, CNN can perform dimensionality reduction on it, thereby decreasing the number of parameters and streamlining the learning process to be more precise and efficient. Each convolutional module consists of a convolutional layer, a batch normalization layer, a ReLU activation layer, and a pooling layer. The model contains two convolutional layers, using ReLU as the activation function to enhance the model’s expressive power for complex spatial patterns through nonlinear transformations. Following the two convolutional layers, a max-pooling layer is applied to reduce computational complexity and enhance feature robustness. The CNN module captures water body boundaries, radiance distribution, and textural features using multi-scale convolutional kernels, providing high-dimensional spatial representations for subsequent temporal modeling.
LSTM: This is used to process the temporal sequences of imagery and model the long-term and short-term dependencies of water temperature. It receives the feature vector flattened by the CNN. Through its input gate, forget gate, and output gate, the LSTM retains crucial temporal information (such as inter-annual water temperature trends, seasonal fluctuations) and returns the complete temporal output, providing continuous temporal encodings for the attention mechanism. The LSTM module is particularly well-suited for the periodic variations in water temperature in the Three Gorges Reservoir area (e.g., high temperatures during flood season, low temperatures during dry season), effectively capturing long-term temporal dependencies.
Attention Mechanism: A self-attention layer is introduced to enhance the model’s ability to focus on key temporal features. Within each attention head, the Query, Key, and Value matrices are computed to generate a weighted feature representation. This dynamically assigns weights to each timestep, highlighting important water temperature change points (such as sudden changes during flood season or high-temperature periods in summer). The multi-head design allows for parallel processing of multi-dimensional features, improving the model’s sensitivity to complex hydrological dynamics and its generalization capability. The output dimension of the attention layer is consistent with the LSTM, preserving the temporal information.
CNN layers primarily handle local features and perform poorly with long-range dependencies (such as long-period climate change). They cannot directly capture the long-term dependencies in sequential data. LSTM layers suffer from high computational costs, longer training times, and can be susceptible to vanishing or exploding gradients, especially in very long sequences. Furthermore, LSTM layers exhibit weaker performance in multi-channel feature fusion. Although the attention mechanism improves the capture of long-distance dependencies, its computational complexity is high. Particularly for long sequences, this can lead to performance issues. By integrating convolutional layers with LSTM, the model can simultaneously learn both the local features (CNN) and long-term dependencies (LSTM) of the time series data. Additionally, the attention mechanism enables the model to dynamically focus on important timesteps, thereby enhancing prediction accuracy and robustness [22].

2.3.3. Model Optimization Methods

The Particle Swarm Optimization (PSO) algorithm was proposed by James Kennedy and Russell Eberhart in 1995 [23], initially designed to solve multi-variable optimization problems. During the iterative process of the algorithm, each particle represents a candidate solution. Each particle in the swarm adjusts its position based on its own historical experience (personal best) and information exchange with other particles (neighborhood best), continuously converging towards the optimal solution of the problem. The PSO algorithm is well-suited for solving problems with continuous feasible domains but can also be applied to discrete optimization problems. It effectively handles multimodal and nonlinear problems and exhibits a degree of adaptability, enabling it to autonomously adjust its search strategy. The PSO algorithm offers several advantages, which are mainly reflected in the following three aspects:
  • It possesses strong global optimization capabilities, enabling it to locate the global optimum.
  • The algorithm exhibits high computational efficiency, particularly for high-dimensional optimization problems, effectively reducing computation time.
  • It can be applied to a wide range of optimization problems.
Although the PSO algorithm offers advantages such as fast convergence speed, few parameters, and simple implementation (for high-dimensional optimization problems, it converges to the optimal solution more quickly than genetic algorithms), it also suffers from the issue of being prone to becoming trapped in local optima, thus relying on good initialization.
The advantage of the CNN-LSTM-Attention model optimized using the PSO algorithm is its ability to efficiently search for the optimal solution within large-scale, complex solution spaces. The specific process is as follows: Initialize a population of particles. Each particle represents a set of parameters for the CNN-LSTM-Attention model. For each particle, construct the corresponding CNN-LSTM-Attention model and train it. Evaluate its prediction performance on the validation set, using this as the fitness function. Update the position and velocity of each particle according to the PSO algorithm, continually searching for better model parameter configurations. Iterate this process until a stopping condition is met (e.g., reaching the maximum number of iterations or finding a sufficiently good solution). Table 3 shows the main parameter settings.

2.3.4. Model Evaluation Indicators

The regression model’s performance was evaluated using the following metrics: Root Mean Square Error (RMSE), Mean Absolute Error (MAE), Coefficient of Determination (R2), and Nash–Sutcliffe Efficiency Coefficient (NSE). These metrics were used to validate the consistency between the model predictions and the measured values. R2 ranges from 0 to 1 and describes the degree to which the model simulates the output. NSE indicates the accuracy of water temperature simulation, ranging from −∞ (no fit) to 1 (perfect fit). The accuracy assessment metrics RMSE and MAE quantify the distribution of prediction bias. Lower values indicate higher model accuracy.
R M S E = 1 n i = 1 n y i y ^ i 2
M A E = 1 n i = 1 n y i y ^ i
R 2 = 1 i = 1 n y i y ^ i 2 i = 1 n y i y ¯ i 2
N S E = 1 i = 1 n ( O i P i ) 2 i = 1 n ( O i O ¯ ) 2
To further evaluate the model’s stability, this study employed a five-fold cross-validation method for verification. Specifically, the dataset was divided into five equal parts. In each iteration, four parts were used for training and one part for testing. This ensured the model’s robustness. Through multiple training–testing cycles, the model’s stability across different data subsets was guaranteed, enabling it to adapt to the spatiotemporal heterogeneity of water temperature in the upper Yangtze River.

3. Results

3.1. Model Validation Results

Figure 3 and Table 4 present the validation results of the evaluation metrics for the CNN-LSTM-Attention model adopted in this study on the validation dataset. The results indicate that the model can accurately capture the spatiotemporal variations in water temperature in the study area.
To compare the improvements in fitting effect and prediction accuracy of the enhanced model, a comparison of actual values versus fitted values for each model on the validation dataset is plotted in Figure 4. The horizontal axis represents the actual water temperature data from the validation dataset at eight stations. The vertical axis represents the fitted values calculated by the following models: the enhanced CNN-LSTM-Attention model proposed in this study, the remote sensing inversion technique, LSTM, LSTM-Attention, CNN, and CNN-LSTM. The line y = x (where the horizontal and vertical coordinates are equal) serves as the reference line. Scatter points closer to the reference line indicate a higher degree of fit. Scatter points more tightly clustered on both sides of the reference line indicate a better model-fitting effect.
Through a comparative analysis of the fitting performance of six models, the CNN-LSTM-Attention model proposed in this study demonstrates that most fitted data points are closely distributed around the reference line, indicating minimal discrepancies between predicted and actual values. This model exhibits the most superior fitting performance, with higher accuracy and stability. It shows significant advantages in capturing peak and trough values in water temperature data, tracking short-term fluctuations, and accurately reflecting overall variation trends. The CNN-LSTM-Attention model effectively captures extreme highs and lows in water temperature, particularly during abrupt and intense fluctuations. Here, the attention mechanism plays a critical role by enabling the model to focus on crucial time points, thereby accurately reflecting sharp changes in the actual data.
By integrating the data optimization capability of CNN, the time series learning ability of LSTM, and the dynamic weighting of the attention mechanism—combined with four feature factors: remote sensing-derived water temperature, land surface temperature, air temperature, and solar radiation—the CNN-LSTM-Attention model overcomes the limitations of single-feature approaches. Although minor errors persist, the model successfully addresses shortcomings observed in other models regarding short-term fluctuations, sudden changes, and detailed fitting. It demonstrates notable advantages in capturing abrupt fluctuations and variation trends in water temperature.

3.2. Characteristics of Water Temperature Evolution Along the Yangtze River Mainstream

Using the improved CNN-LSTM-Attention model developed in this study, water temperature data for the lower Jinsha River and the Three Gorges Reservoir area from 2000 to 2020 were calculated. Considering that 2006 to 2014 marked the peak period of dam construction in the middle–lower Jinsha River basin, this study screened data from two distinct time periods: 2000–2005 (pre-dam construction) and 2015–2020 (post-dam construction). This temporal segmentation aims to analyze the characteristics of water temperature changes before and after dam construction and investigate the impact patterns of cascaded hydropower development on water temperature variations.
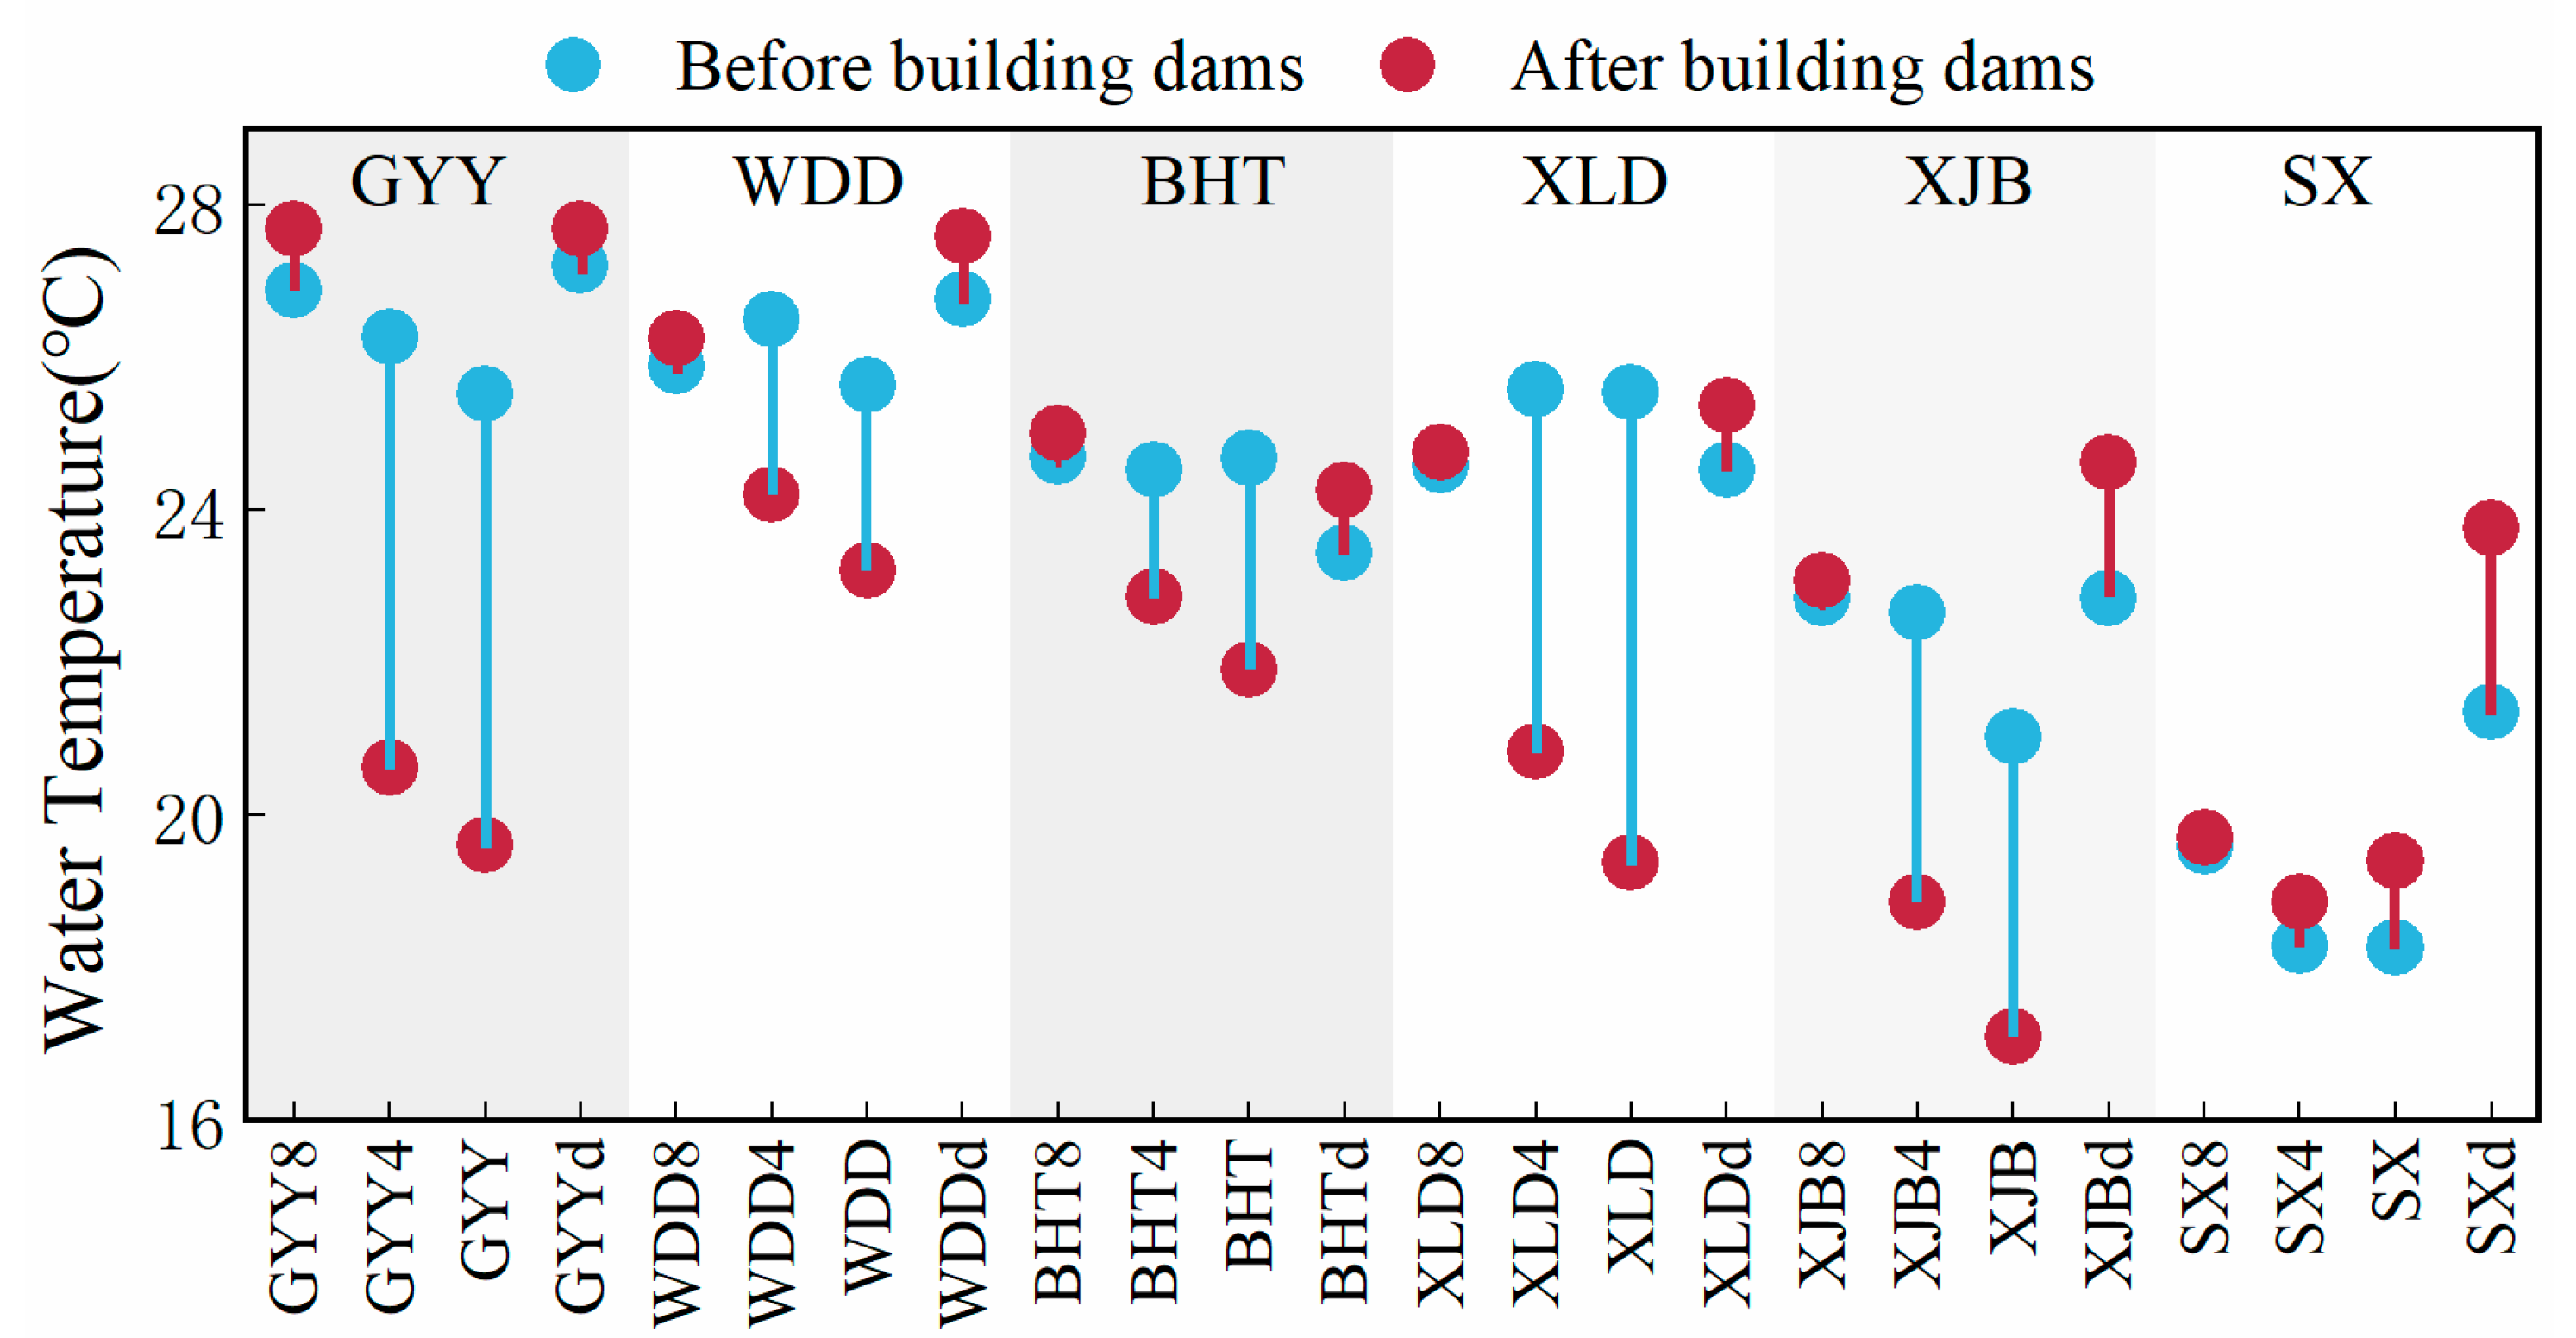
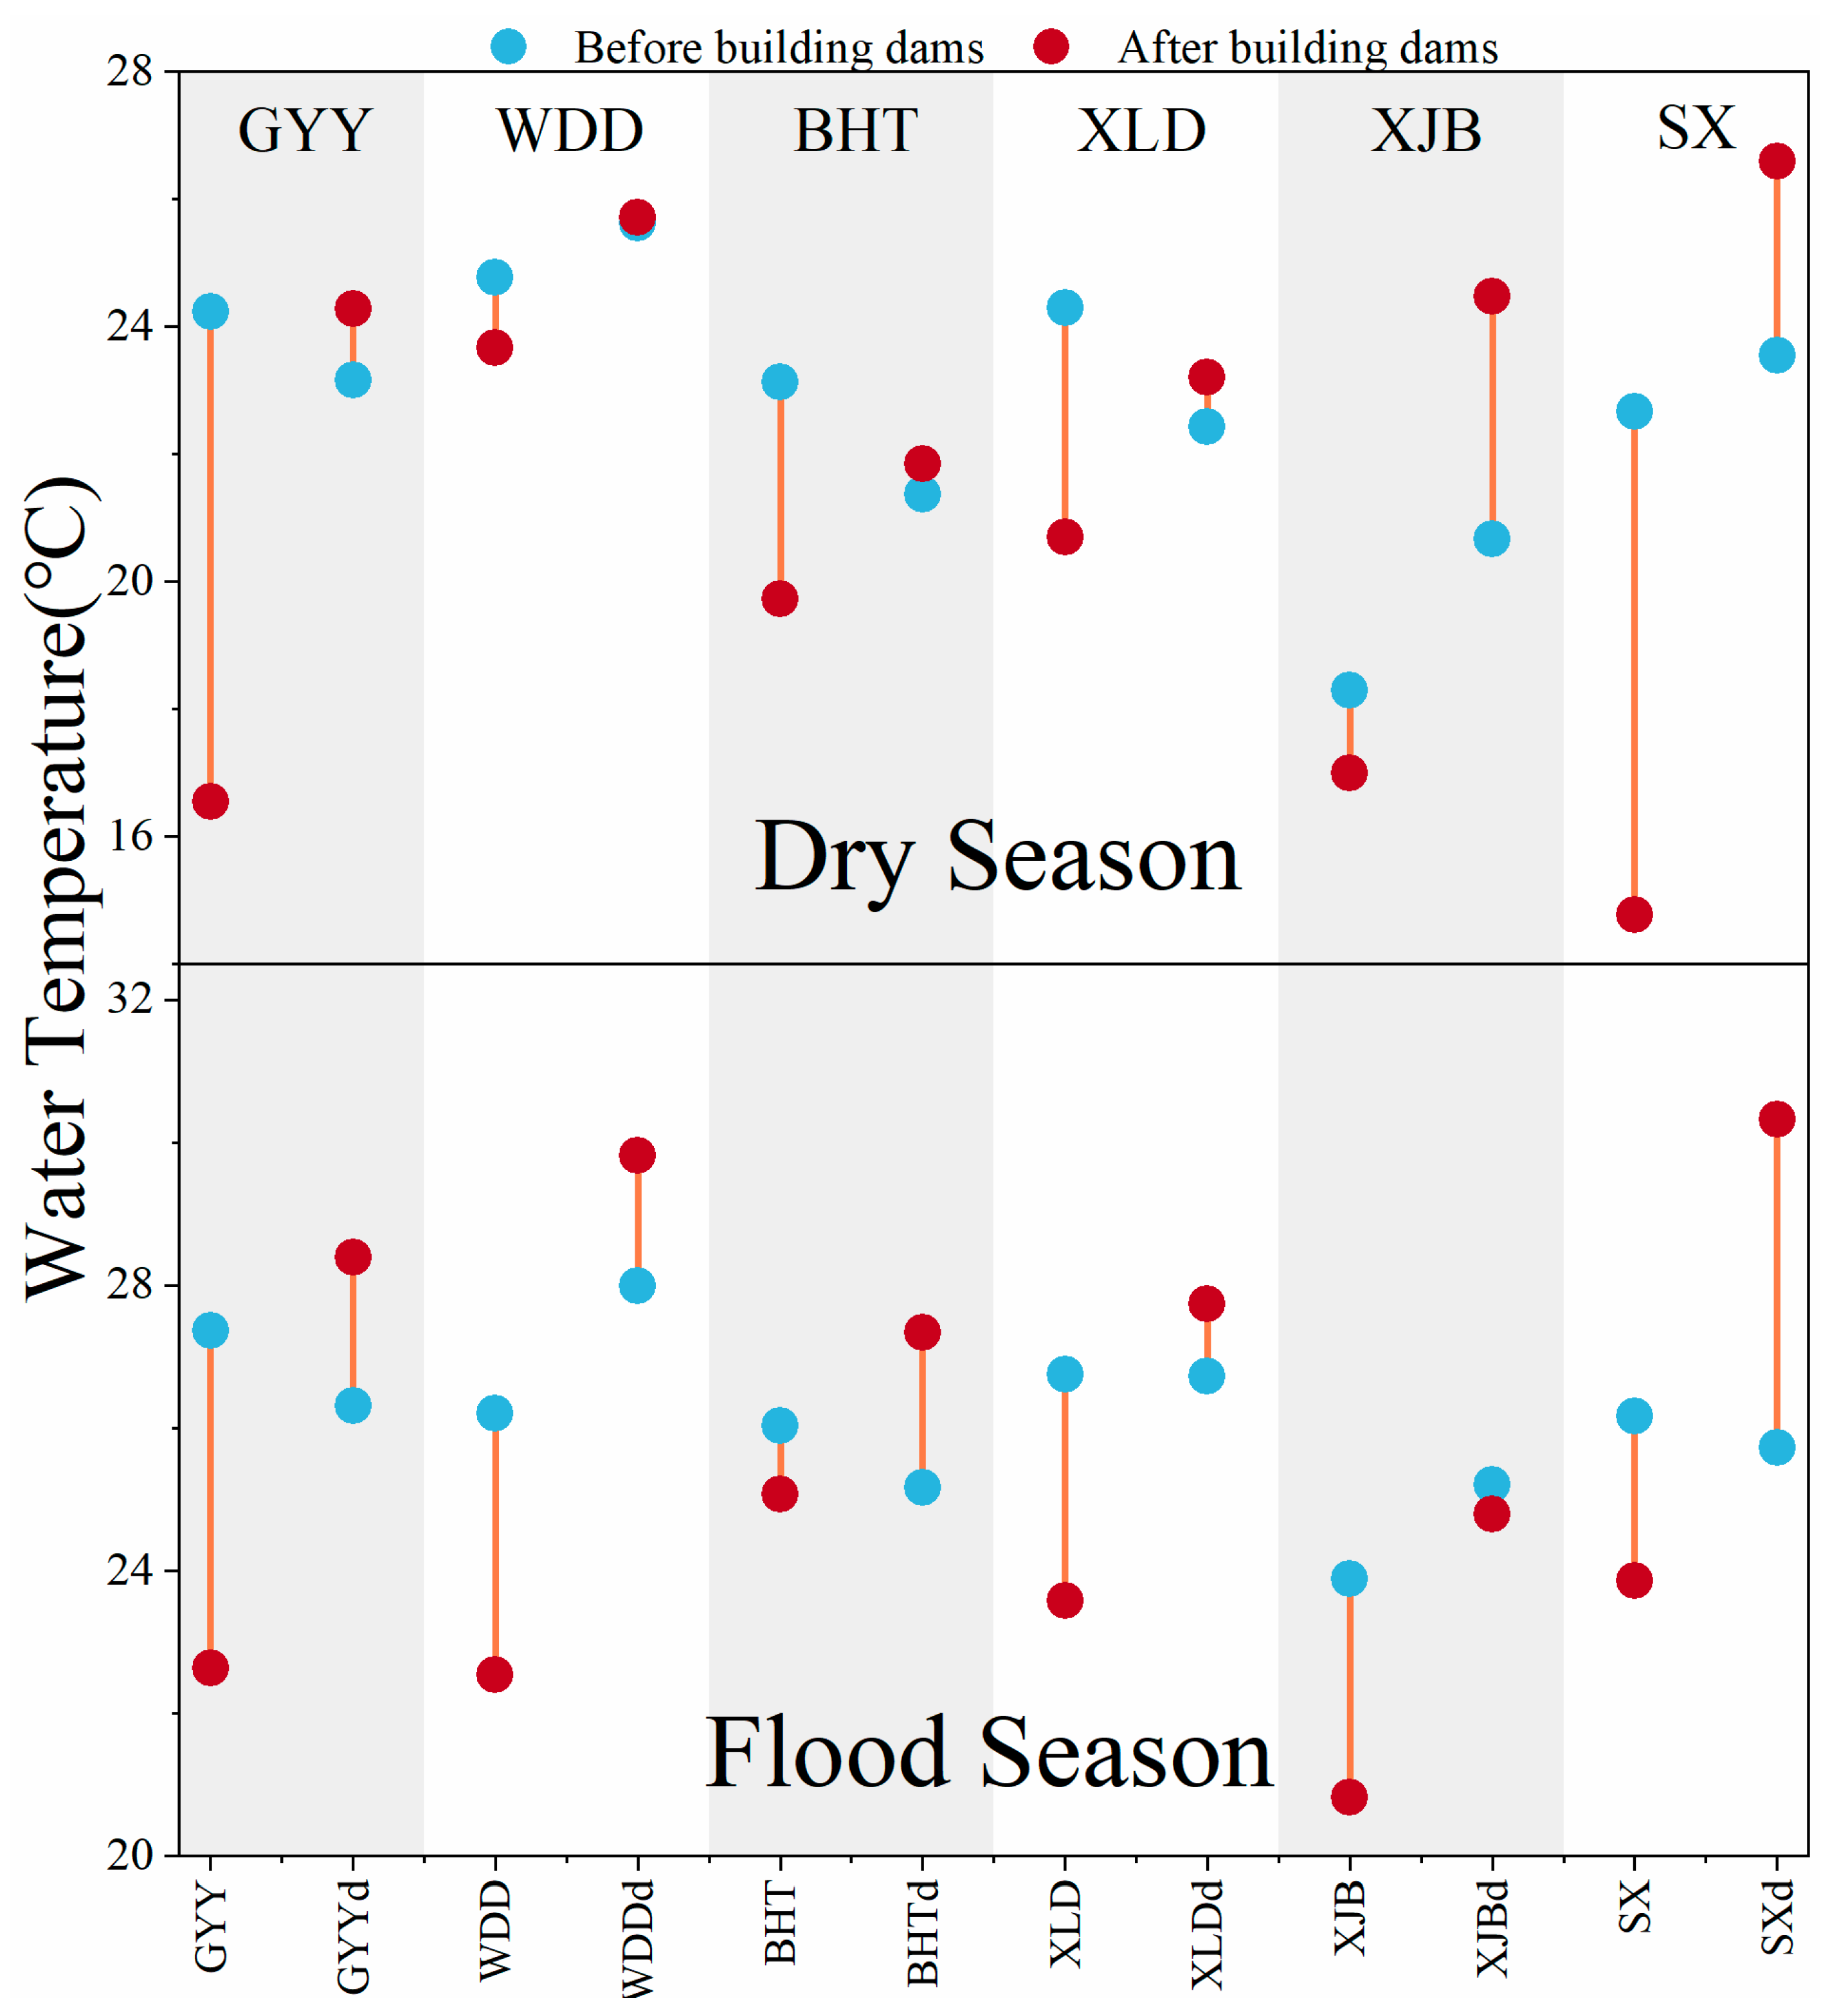
Figure 5 shows the longitudinal variation in the average water temperature along the main stream of the Yangtze River during the pre-dam and post-dam periods, while Figure 6 provides a more detailed depiction of water temperature changes during the flood season and dry season.
As shown in the figure, the construction of cascaded dams has a significant impact on water temperature. Significant differences exist in water temperature changes between the periods 2000–2005 (pre-dam) and 2015–2020 (post-dam).
Sections exhibiting water temperature increases include GYY8, GYYd, WDDd, BHTd, XLDd, XJBd, SX, and SXd.
Sections exhibiting water temperature decreases include GYY4, GYY, WDD4, WDD, BHT4, BHT, XLD4, XLD, XJB4, and XJB.
Sections with larger water temperature change amplitudes: XLD (decreased by 6.17 °C), XLD4 (decreased by 4.76 °C), and GYY (decreased by 5.92 °C).
It can be observed that the annual average water temperature in areas immediately upstream of the dams is higher than in areas downstream. Taking GYY as an example: Within 1 km upstream of the dam, the pre-dam annual average water temperature was significantly higher than the post-dam temperature, with a difference of 3.641 °C. Within 1 km downstream of the dam, the pre-dam annual average water temperature was lower than the post-dam temperature, with a difference of 1.507 °C.
Regarding the longitudinal profile along the river channel: Pre-dam average water temperatures at the six major dams were Guanyinyan (GYY): 26.475 °C, Wudongde (WDD): 26.208 °C, Baihetan (BHT): 24.343 °C, Xiluodu (XLD): 25.502 °C, Xiangjiaba (XJB): 22.343 °C, and TGD (SX): 19.343 °C.
It can be seen that water temperatures were higher in the Guanyinyan reach. Pre-dam, the longitudinal water temperature profile from the Guanyinyan Dam section to the Three Gorges Dam section showed a fluctuating decline. Post-dam, the longitudinal water temperature profile exhibited significantly greater fluctuations. The difference between the highest and lowest temperatures reached 10.6 °C, far exceeding the pre-dam range of 8.96 °C.

3.3. Characteristics of Water Temperature Changes near the Confluence of Tributaries of the Yangtze River

A comprehensive analysis of longitudinal water temperature changes along the Panzhihua–Badong reach reveals sudden temperature shifts in certain segments. This phenomenon is associated with tributary confluences. For instance, at cross-section YJLJ2 (23.576 °C), the temperature decreased by 0.4 °C compared to the section immediately upstream of the Yalong River confluence. At cross-section MJ2 (22.067 °C), influenced by the high-flow, low-temperature confluence of the Minjiang River, the temperature significantly decreased by 0.5 °C. At cross-section WJ2 (22.151 °C), subjected to the low-temperature confluence influence of the Wujiang River, the temperature slightly decreased by 0.17 °C.
To further elucidate the patterns of longitudinal water temperature change along the main stem of the Yangtze River, this study analyzed the impact of major tributary confluences (Yalong River, Minjiang River, Jialing River, and Wujiang River) within the Panzhihua–Badong reach. Selecting water temperature monitoring cross-sections upstream of the confluences of the four major tributaries (Yalong River, Minjiang River, Jialing River, and Wujiang River) to represent tributary water temperature data. We compared cross-sections 1 km upstream and 1 km downstream of each main stem-tributary confluence point to capture the change induced by the confluence. Multi-year average water temperature data were used at these sections. These data were simulated and analyzed using the improved CNN-LSTM-Attention model developed in this study. Figure 7 presents the water temperature variation data for the Yangtze River main stem and its tributaries, spatially referenced according to their geographical relationships.
The influence of the Yangtze River’s major tributaries (Yalong River, Minjiang River, Jialing River, and Wujiang River) on the main stem water temperature exhibits significant differences. The confluence of the Yalong River, Minjiang River, and Wujiang River leads to a decrease in main stem water temperature. The Minjiang River produces the most pronounced cooling effect, reducing water temperature by 0.63 °C. Due to their lower water temperatures, the confluence of the Yalong River and Wujiang River also decreases the main stem temperature by 0.23 °C and 0.26 °C, respectively. Conversely, the Jialing River, with a higher water temperature than the main stem, causes an increase of 0.68 °C in the main stem water temperature. These variations demonstrate the considerable differences in the temperature-regulating effect of the various tributaries on the main stem, reflecting the temperature transfer mechanism between the tributaries and the main channel.

4. Discussion

4.1. The Impact of Cascade Dam Construction on Water Temperature Evolution

The construction of cascade dams and the confluence of major tributaries both exert influence on the water temperature variations along the mainstream of the Yangtze River. According to the model simulation results, the water temperature in the reservoir area and the downstream region exhibited different trends before and after dam construction. In the reservoir area, the average single-section water temperature before dam construction was higher than that after dam construction. The primary reasons for this phenomenon are as follows: after dam construction, the flow velocity decreases, and the water retention time increases. The prolonged stability of the water body facilitates the storage and gradual release of thermal energy [24]. The impoundment of reservoirs typically submerges large areas of vegetation and soil, altering the natural heat exchange process. This results in less efficient heat exchange compared to pre-dam conditions, leading to reduced heat accumulation and consequently a decline in water temperature. Under cascade development, the release of cold water from upstream reservoirs into the subsequent reservoir exacerbates this cooling effect. The serial operation of multiple reservoirs intensifies the persistent decreasing trend in water temperature within the reservoir areas [25]. Before dam construction, the natural river channel was relatively shallow, allowing solar radiation to heat the entire water column rapidly. After dam construction, the deep-water zones formed in the reservoir increase the thermal capacity of the massive water body, delaying warming.
In contrast, the annual average water temperature in the river channel near the downstream area after dam construction is slightly higher than before. An analysis of the water temperature changes in the reservoir area and the longitudinal variation patterns along the river reveals that reservoirs often employ selective withdrawal facilities during flood discharge and power generation operations, prioritizing the use of warmer surface water. This leads to an increase in the temperature of the discharged water. Additionally, hydrodynamic and heat exchange processes are factors influencing water temperature changes. The discharged water typically exhibits higher flow velocity, which enhances the thermal and kinetic energy of the water body [26,27]. Although downstream water temperature experiences a localized and short-term increase after reservoir discharge, longitudinal water temperature profiles indicate that, through prolonged river flow and heat dilution, the river water temperature tends to return to pre-dam levels and eventually reaches a relative equilibrium. As the distance from the dam increases, the river water temperature, to some extent, follows the patterns analyzed earlier, forming a cyclical trend [28]. Overall, dam construction alters flow velocity, increases water storage capacity, and modifies the thermal capacity of water bodies. To some extent, while dams play a positive role in regulating water temperature, they may also cause localized increases or decreases in water temperature, which could have implications for ecological environments and the adaptability of aquatic species.

4.2. The Impact of Tributary Confluence on Water Temperature Changes Along the River Channel

A comparison of water temperature data at cross-sections before and after the confluence points of the four major tributaries reveals distinct variations caused by each tributary. The Yalong River originates from high-altitude areas in Sichuan, particularly its upper reaches, which are influenced by glacial meltwater and alpine precipitation—sources characterized by relatively low temperatures. During summer, glacial and snowmelt waters significantly reduce water temperatures. Furthermore, the Yalong River basin experiences a temperate mountainous climate with generally low air temperatures, resulting in correspondingly low water temperatures. The topography, dominated by mountains and gorges, contributes to turbulent and rapid flow, which typically leads to lower water temperatures in high-velocity sections. As the Yalong River’s water temperature is lower than that of the Yangtze mainstream, its confluence introduces cooler water that mixes with the warmer mainstream, causing a slight decrease in the mainstream temperature and thus exerting a cooling effect.
In contrast, the Jialing River has a warming effect on the Yangtze’s water temperature. Its water temperature is significantly higher than that of the mainstream, leading to an increase of 0.68 °C after confluence [29].
To investigate the magnitude of the temperature change induced by the confluences of the other three tributaries, multi-year average discharge data (2000–2020) for hydrological stations on the Yangtze main stem and its tributaries were obtained from the Water Resources Bulletin, China Hydrological Yearbook, and Hydrological Situation Bulletin, as shown in Table 5.
The Minjiang River, originating from high mountainous regions in the Sichuan Basin, has a lower water temperature than the Yangtze mainstream, particularly due to the significant influence of snow and ice melt in its upper reaches. In terms of average water temperature and flow volume, the Minjiang River contributes nearly 60% of the mainstream flow at its confluence. This combination of low temperature and high flow allows the Minjiang River to effectively reduce the mainstream temperature, resulting in a notable decrease of 0.63 °C. As previously noted, the Jialing River, flowing through the warm climate of the Sichuan Basin, has a higher water temperature and increases the mainstream temperature by 0.68 °C. The Wujiang River, originating from the Guizhou Plateau, has a lower water temperature than the Yangtze mainstream, particularly during the flood season when its cooler water further reduces the mainstream temperature. However, according to the data, the flow rate at the Wulong Hydrological Station on the Wujiang River accounts for only 13.78% of that at the Cuntan Station on the Yangtze. Consequently, the Wujiang River’s impact on mainstream temperature is relatively minor, causing a slight decrease of 0.26 °C [30]. Although there are numerous smaller tributaries along the Yangtze, their influence on mainstream water temperature is negligible. This indicates that the impact of tributaries on mainstream water temperature is strongly correlated with their flow volume.
Overall, the water temperature in the upper reaches of the Yangtze is affected by both cascade dams and tributary confluences. Some cross-sections are more influenced by dams, often exhibiting fluctuations before and after reservoir impoundment. Additionally, water temperature generally decreases with increasing distance from dams. For example, the ZT section (18.342 °C), which is affected by the confluence of the Minjiang River and is located far from dams, has a lower water temperature. In contrast, the MJ0 section (22.535 °C), situated close to the Xiangjiaba Reservoir, experiences elevated water temperatures due to the influence of cascade reservoirs.

4.3. The Impact of Water Temperature Changes on Ecosystems

Changes in water temperature can impact aquatic ecosystems, potentially altering existing aquatic populations and species composition [31]. Zhang et al. [32] demonstrated that the diversity and structural succession of phytoplankton communities are closely linked to historical global temperature oscillation events. For instance, the community structure dominated by Chlorophyta during the Medieval Warm Period shifted to one dominated by Bacillariophyta in the subsequent Little Ice Age. Additionally, LIAO [33] investigated the dynamics of a deterministic algae–zooplankton model with water temperature, as well as its corresponding stochastic version, revealing that temperature influences the stability and persistence of algae–zooplankton interactions. Furthermore, water temperature affects not only plankton and algae but also fish, which exhibit corresponding changes in response to alterations in water temperature. After dam construction, the competitive balance between warm-water and cold-water fish species may be altered, ultimately transforming fish community structure [34]. In the Yangtze River, these thermal changes have particularly affected the spawning behaviors of four major Chinese carp species and Chinese sturgeon [35]. Altered thermal conditions due to dam operations have led to reduced adult populations of Chinese sturgeon and diminished reproductive activities [36]. Water temperature changes may have profound implications for the aquatic ecosystem of the Yangtze River, which has attracted growing concern. Therefore, it is imperative to conduct higher-precision simulations of water temperature. The methodology presented in this study can be applied to further investigate the impact of water temperature on river aquatic ecosystems, with the aim of minimizing the negative effects of dam-induced temperature changes on the aquatic environment.

5. Conclusions

This study established a CNN-LSTM-Attention model by integrating CNN, LSTM, and attention algorithms, and evaluated its applicability in the dam construction hotspot areas of the upper Yangtze River mainstream. Compared with other deep learning models, the CNN-LSTM-Attention model significantly optimized remote sensing inversion results, demonstrating distinct advantages, particularly in fitting peak and trough values in water temperature data, capturing short-term fluctuations, and accurately reflecting overall variation trends. This method provides a robust technical framework for precise water temperature monitoring and supports advanced watershed management strategies. Based on the model simulation results, changes in river water temperature were observed before and after dam construction, primarily resulting from the combined effects of increased water depth, selective withdrawal facilities, and the coordinated operation of cascade reservoirs. Dam construction has altered flow velocity, increased water storage capacity, and changed the thermal capacity of water bodies, which may have certain impacts on ecological environments and the adaptability of aquatic species. Furthermore, water temperature changes were noted in river sections where tributaries converge. Influenced by geographical conditions and climate factors, water temperatures differ among tributaries, but their impact on the mainstream temperature is mainly related to discharge volume. The water temperature changes in the upper Yangtze River mainstream are primarily influenced by four major tributaries with larger flow rates: the Yalong River, Minjiang River, Jialing River, and Wujiang River. These results can assist in constructing an early warning indicator system for water temperature changes and provide optimized suggestions for sustainability-oriented ecological regulation windows, forming a decision support tool for the operation department of the Three Gorges Project and demonstrating strong systematicity and application orientation.

Author Contributions

Conceptualization, R.Z. and Y.Z.; methodology, S.Z.; software, H.W.; validation, H.W., R.Z. and Y.Z.; formal analysis, H.Z.; investigation, H.W.; resources, S.Z.; data curation, S.Z.; writing—original draft preparation, H.W.; writing—review and editing, H.Z.; visualization, R.Z.; supervision, Y.Z.; project administration, S.Z.; funding acquisition, S.Z. All authors have read and agreed to the published version of the manuscript.

Funding

The project was supported by the National Natural Science Foundation of China (Grant Nos. 52379065, 52209087), and Fundamental Research Funds for the Central Universities (2024MS068, 2025JC009).

Institutional Review Board Statement

Not applicable.

Informed Consent Statement

Not applicable.

Data Availability Statement

The original contributions presented in the study are included in the article. Further inquiries can be directed to the corresponding author.

Conflicts of Interest

The authors declare no conflicts of interest.

References

  1. Wang, J.; Song, Y.; Huang, J. Effects of Increasing Water Temperature on Water Properties and Aquatic Organisms: A Critical Review. J. Hydroecology 2020, 41, 100–109. [Google Scholar]
  2. Dai, H.; Mao, J.; Jiang, D. Research progress of water-sediment and ecological environment control of large hydropower projects. Water Resour. Hydropower Eng. 2023, 54, 118–125. [Google Scholar]
  3. Zhang, W.; Shen, X. Remote Sensing Analysis of Spatiotemporal Evolution of Typical Ecological Elements in the Three Gorges Reservoir Area (TGRA). Geomat. Spat. Inf. Technol. 2023, 46, 76–80. [Google Scholar]
  4. Martí-Cardona, B.; Prats, J.; Niclòs, R. Enhancing the retrieval of stream surface temperature from Landsat data. Remote Sens. Environ. 2019, 224, 182–191. [Google Scholar] [CrossRef]
  5. Gao, Y.; Lian, X.; Ge, L. Inversion model of surface bare soil temperature and water content based on UAV thermal infrared remote sensing. Infrared Phys. Technol. 2022, 125, 104289. [Google Scholar] [CrossRef]
  6. Lu, Z.; Li, J. Annual cyclical variations of urban green space cold island(GSCI) effect by combining remote sensing inversion and ENVI-met simulation. Sci. Total Environ. 2024, 951, 175662. [Google Scholar] [CrossRef]
  7. Pan, Z.; Yang, S.; Ren, X.; Lou, H.; Zhou, B.; Wang, H.; Zhang, Y.; Li, H.; Li, J.; Dai, Y. GEE can prominently reduce uncertainties from input data and parameters of the remote sensing-driven distributed hydrological model. Sci. Total Environ. 2023, 870, 161852. [Google Scholar] [CrossRef]
  8. Wang, X.; Wu, Y.; Cushman, S.A.; Tie, C.; Lawson, G.; Kollányi, L.; Wang, G.; Ma, J.; Zhang, J.; Bai, T. Spatio-temporal dynamics of water quality and land use in the Lake Dianchi (China) system: A multi-source data-driven approach. J. Hydrol. Reg. Stud. 2025, 59, 102341. [Google Scholar] [CrossRef]
  9. Chen, D.; Peng, Q.; Lu, J.; Huang, P.; Liu, Y.; Peng, F. Assessing effect of water photovoltaics on nearby water surface temperature using remote sensing techniques. Adv. Space Res. 2025, 75, 138–147. [Google Scholar] [CrossRef]
  10. Liu, T.; Cui, X.; Mo, L. A Daily Runoff Prediction Model for the Yangtze River Basin Based on an Improved Generative Adversarial Network. Sustainability 2025, 17, 2990. [Google Scholar] [CrossRef]
  11. Man, Y.; Yang, Q.; Shao, J.; Wang, G.; Bai, L.; Xue, Y. Enhanced LSTM Model for Daily Runoff Prediction in the Upper Huai River Basin, China. Engineering 2023, 24, 229–238. [Google Scholar]
  12. Cui, Y.; Qiu, K.; Gao, S.; Liu, H.; Gao, R.; Chen, L.; Zhang, Z.; Jiang, J.; Niu, Y.; Wang, C. Multispectral radiation temperature inversion based on Transformer-LSTM-SVM. Opt. Commun. 2025, 590, 132024. [Google Scholar] [CrossRef]
  13. Belavadi, S.V.; Rajagopal, S.; Ranjani, R.; Mohan, R. Air Quality Forecasting using LSTM RNN and Wireless Sensor Networks. Procedia Comput. Sci. 2020, 170, 241–248. [Google Scholar] [CrossRef]
  14. Wan, J. Inversion of lake transparency using remote sensing and deep hybrid recurrent models. Ecotoxicol. Environ. Saf. 2025, 297, 118236. [Google Scholar] [CrossRef]
  15. Zhang, H.; Liu, H.; Shi, Z.; Mao, S.; Chen, N. ConvMamba: Combining Mamba with CNN for Hyperspectral Image Classification. Neurocomputing 2025, 652, 131016. [Google Scholar] [CrossRef]
  16. Geetha, T.S.; Gandhimathi, G.; Chellaswamy, C.; Thiruvalar Selvan, P. Comprehensive river water quality monitoring using convolutional neural networks and gated recurrent units: A case study along the Vaigai River. J. Environ. Manag. 2024, 365, 121567. [Google Scholar] [CrossRef]
  17. Xu, H.; Zhang, H.; Wang, Y.; Lu, L.; Wu, A.; Chen, Y.; Li, Y.; Dong, C.; Wang, X. Study on short-term total hardness prediction of water quality based on CNN-BiLSTM-SA model: A case study of Henan Province. J. Water Process Eng. 2025, 75, 107973. [Google Scholar] [CrossRef]
  18. Chellaiah, C.; Anbalagan, S.; Swaminathan, D.; Chowdhury, S.; Kadhila, T.; Shopati, A.K.; Shangdiar, S.; Sharma, B.; Amesho, K.T.T. Integrating deep learning techniques for effective river water quality monitoring and management. J. Environ. Manag. 2024, 370, 122477. [Google Scholar] [CrossRef]
  19. Hu, G.; Yang, Z.; Bai, F.; Ren, Y.; Ma, Y.; Li, W. Water temperature’s cumulative effect induced by the construction of cascade reservoirs in the lower reaches of Jinsha River. J. Lake Sci. 2025, 37, 293–303. [Google Scholar]
  20. Zhang, Y. Twenty years of reservoir impoundment in the Three Gorges: A retrospective and outlook. China Water Resources. 2023, 19, 5–9. [Google Scholar]
  21. Xu, H. A remote sensing urban ecological index and its application. Acta Ecol. Sin. 2013, 33, 7853–7862. [Google Scholar]
  22. Zhang, C.; Zhou, Y.; Lu, F.; Liu, J.; Zhang, J.; Yin, Z.; Ji, M.; Li, B. Assessing the performance and interpretability of the CNN-LSTM-Attention model for daily streamflow forecasting in typical basins of the eastern Qinghai-Tibet Plateau. Sci. Rep. 2025, 15, 82. [Google Scholar]
  23. Shi, L.; Gong, J.; Zhai, C. Application of a hybrid PSO-GA optimization algorithm in determining pyrolysis kinetics of biomass. Fuel 2022, 323, 124344. [Google Scholar] [CrossRef]
  24. Dong, L.; Niu, Q.; Sun, X.; Cao, W.; Kou, D.; Bai, Z.; Yang, S. Analysis of Impact of Shield Tunneling Parameters on Ground Settlement Based on Pearson Correlation Coefficient Method. Constr. Technol. 2024, 53, 116–123. [Google Scholar]
  25. He, T.; Deng, Y.; Tuo, Y.; Yang, Y.; Liang, N. Impact of the Dam Construction on the Downstream Thermal Conditions of the Yangtze River. Int. J. Environ. Res. Public Health 2020, 17, 2973. [Google Scholar] [CrossRef] [PubMed]
  26. Bonacci, O.; Đurin, B.; Bonacci, T.R.; Bonacci, D. The Influence of Reservoirs on Water Temperature in the Downstream Part of an Open Watercourse: A Case Study at Botovo Station on the Drava River. Water 2022, 14, 3534. [Google Scholar] [CrossRef]
  27. Zaidel, P.A.; Roy, A.H.; Houle, K.M.; Lambert, B.; Letcher, B.H.; Nislow, K.H.; Smith, C. Impacts of small dams on stream temperature. Ecol. Indic. 2021, 120, 106878. [Google Scholar] [CrossRef]
  28. Yu, Y.; Yang, Z.; Xu, Y.; Cheng, B.; Liu, D.; Ma, J. Influence of Cascade Reservoirs on Water Temperature Change along the Mainstream of Lancang River. J. Yangtze River Sci. Res. Inst. 2019, 36, 18–22. [Google Scholar]
  29. Zou, S.; Li, Y.; Chen, J.; Zhang, G.; Zhou, X. Temporal and Spatial Variation of Water Temperature in Panzhihua-Yichang Segment of Changjiang River. J. Yangtze River Sci. Res. Inst. 2020, 37, 35–41. [Google Scholar]
  30. Liu, Z.; Lv, P.; Yu, Y.; Chen, Y. Variation in water temperature of the mainstream of the Jinsha River over last 50 years. Freshw. Fish. 2014, 44, 49–54. [Google Scholar]
  31. Carron, J.C.; Rajaram, H. Impact of variable reservoir releases on management of downstream water temperatures. Water Resour. Res. 2001, 37, 1733–1743. [Google Scholar] [CrossRef]
  32. Zhang, H.; Jianan, Z.; Wang, R.; Liu, Y.; Gao, Y.; Wu, F.; Huo, S. Response of lake phytoplankton to climate oscillation on the northeastern Tibetan Plateau: Evidence from a 1400-year-old sedimentary archive. Sci. Bull. 2024, 69, 1208–1211. [Google Scholar] [CrossRef]
  33. Liao, T. The impact of temperature variation on the algae–zooplankton dynamics with size-selective disturbance. Chaos Solitons Fractals 2024, 181, 114615. [Google Scholar] [CrossRef]
  34. Lessard, J.L.; Hayes, D.B. Effects of elevated water temperature on fish and macroinvertebrate communities below small dams. River Res. Appl. 2003, 19, 721–732. [Google Scholar] [CrossRef]
  35. Zhang, H.; Wu, J.M.; Wang, C.Y.; Du, H.; Liu, Z.G.; Shen, L.; Chen, D.; Wei, Q.W. River temperature variations and potential effects on fish in a typical Yangtze River reach: Implications for management. Appl. Ecol. Environ. Res. 2016, 14, 553–567. [Google Scholar] [CrossRef]
  36. Huang, Z.; Wang, L. Yangtze Dams Increasingly Threaten the Survival of the Chinese Sturgeon. Curr. Biol. 2018, 28, 3640–3647. [Google Scholar] [CrossRef]
Figure 1. Study area map. The numbers below the dam site indicate the dam height on the left and the water storage level upstream of the dam on the right.
Sustainability 17 09046 g001
Figure 2. Model architecture.
Sustainability 17 09046 g002
Figure 3. Model validation results.
Sustainability 17 09046 g003
Figure 4. Comparison between true values and fitted values of each model.
Sustainability 17 09046 g004
Figure 5. Changes in water temperature along the dam before and after construction.
Sustainability 17 09046 g005
Figure 6. Changes in water temperature during flood and dry seasons before and after dam construction.
Sustainability 17 09046 g006
Figure 7. Changes in water temperature of the main stream before and after the confluence of the four major tributaries (water temperature unit: °C).
Sustainability 17 09046 g007
Table 1. Section naming rules.
NameMeaningNameMeaningNameMeaning
GYY880 km in front of Guanyinyan DamXLD1 km in front of Xiluodu DamZTZhutuo Hydrological Station
GYY440 km in front of Guanyinyan DamXLDd1 km behind Xiluodu DamBDBadong Hydrological Station
GYY1 km in front of Guanyinyan DamXJB880 km in front of Xiangjiaba DamYLJ01 km upstream of the confluence of Yalong River
GYYd1 km behind Guanyinyan DamXJB440 km in front of Xiangjiaba DamYLJ1The confluence of Yalong River
WDD880 km in front of Wudongde DamXJB1 km in front of Xiangjiaba DamYJL21 km downstream of the confluence of Yalong River
WDD440 km in front of Wudongde DamXJBd1 km behind Xiangjiaba DamMJ01 km upstream of the confluence of Minjiang River
WDD1 km in front of Wudongde DamSX880 km in front of the TGDMJ1The confluence of Minjiang River
WDDd1 km behind Wudongde DamSX440 km in front of the TGDMJ21 km downstream of the confluence of Minjiang River
BHT880 km in front of Baihetan DamSX5 km in front of the TGDJLJ01 km upstream of the confluence of Jialing River
BHT440 km in front of Baihetan DamSXd3 km behind the TGDJLJ1The confluence of Jialing River
BHT1 km in front of Baihetan DamCTCuntan Hydrological StationJLJ21 km downstream of the confluence of Jialing River
BHTd1 km behind Baihetan DamPZHPanzhihua Hydrological StationWJ01 km upstream of the confluence of the Wujiang River
XLD880 km in front of Xiluodu DamHTHuatan Hydrological StationWJ1The confluence of the Wujiang River
XLD44 km in front of Xiluodu DamLJLongjie Hydrological StationWJ21 km downstream of the confluence of Wujiang River
Table 2. The remote sensing data information applied in this study.
Satellite SourceBandWavelength/μmData TypeResolution/m
Landsat 5 (TM)Red: B30.63~0.69C01/T1_SR30
NIR: B40.76~0.90C01/T1_SR30
Landsat 7 (ETM+)Red: B30.63~0.69C01/T1_SR30
NIR: B40.77~0.90C01/T1_SR30
Landsat 8 (OLI; TIRS)Red: B40.64~0.67C01/T1_SR30
NIR: B50.85~0.88C01/T1_SR30
Table 3. Optimal hyperparameter table.
HyperparameterValueDescription
Number of CNN Filters512Number of filters used in the CNN layers
Kernel Size3Size of the convolutional kernel(s) in the CNN layers
Pooling Size2Size of the Max Pooling layers
BiLSTM Hidden Units512Number of hidden units in the Bidirectional LSTM layers
Multi-head Attention Heads6Number of heads in the multi-head self-attention mechanism
Key Dimension (key_dim)128Dimensionality of the key vectors in the self-attention mechanism
Dense Layer Output Units1Number of output units in the final fully connected layer
Initial Learning Rate0.0005Initial learning rate for the optimizer
Weight Decay1 × 10−6Weight decay coefficient for the AdamW optimizer
Dropout Rate0.4, 0.6Dropout rates applied in the model (applied to different layers, respectively)
Batch Size64Number of samples per training batch
Max Epochs500Maximum number of training epochs
Table 4. Model indicator results.
IndicatorRMSEMAENSER2
value1.380.90.900.92
Table 5. The average annual flow of the Yangtze River main and branch hydrological stations from 2000 to 2020.
Yangtze Hydrological StationMulti-Year Average Discharge (m3/s)Tributary Confluence Hydrological StationMulti-Year Average Discharge (m3/s)Percentage
Pingshan Station4330Gaochang Station247557.16%
Zhutuo Station7990Beibei Station194024.28%
Cuntan Station10,265Wulong Station141513.78%
Disclaimer/Publisher’s Note: The statements, opinions and data contained in all publications are solely those of the individual author(s) and contributor(s) and not of MDPI and/or the editor(s). MDPI and/or the editor(s) disclaim responsibility for any injury to people or property resulting from any ideas, methods, instructions or products referred to in the content.