Abstract
Existing studies have established reliable methods for estimating carbon emissions from food consumption, yet there remains a lack of quantitative analysis on the decarbonization effects of energy transition and resource recycling. This study integrates lifecycle analysis and scenario analysis, based on data from 2006 to 2020, to conduct an empirical investigation of four provincial capital cities (Zhengzhou, Xi’an, Jinan, and Taiyuan) in the lower and middle reaches of the Yellow River, exploring the potential for reducing carbon emissions from food consumption and examining the driving effects of energy transition and resource recycling. The results indicate the following: (1) Per capita carbon emissions from food consumption decreased after 2016. (2) Incineration for power generation has a significantly higher carbon reduction effect than landfilling. The proportion of carbon emissions from food waste disposal decreased from 20% to around 6%, with the decarbonization potential of recycling transformation being 8.8%, 8.3%, 11.5%, and 14.4% in Zhengzhou, Xi’an, Jinan, and Taiyuan, respectively. Our findings suggest that promoting the widespread adoption of new-energy vehicles, increasing the share of renewable energy in power generation, optimizing food recycling technologies, and reducing food waste are crucial for achieving future reductions in carbon emissions from urban food consumption. The proposed methodology for assessing carbon emissions and reduction potential in food consumption can also be applied to other regions with varying geographical, economic, and policy contexts.
1. Introduction
Energy transition and resource recycling are key measures listed in the United Nations’ Sustainable Development Agenda for combating climate change. Two-thirds of greenhouse gases originate from carbon emissions due to energy use [1,2]. By transitioning to cleaner, renewable energy, we can reduce our dependence on fossil fuels and lower the risks of climate change [3]. According to the International Energy Agency, thanks to the rapid advancement of the transition to technologies such as solar, wind, and nuclear energy, as well as electric vehicles, the increase in global energy-related carbon dioxide emissions in 2023 was lower than in 2022 [4]. Resource recycling is also crucial for reducing greenhouse gas emissions [5]. It is estimated that global waste generation will double by 2050 and triple by 2100 [6,7]. Enhancing recycling capabilities and improving waste management systems can reduce global carbon dioxide emissions by up to 15% [7].
Food consumption is a major contributor to global greenhouse gas emissions. Research indicates that emissions associated with food consumption account for more than 25% of global human-related greenhouse gas emissions [8]. The constant demand for food exacerbates the challenges of climate governance due to the carbon emissions linked to its production, transportation, and consumption [9,10]. The rapid pace of urbanization has further intensified this issue, with urban CO2 emissions now representing over 80% of total emissions. Studies across multiple countries have shown that food consumption encompasses a wide range of sectors, offering substantial potential for emission reductions [11,12,13].
A key example of energy transition within the food consumption sector is the electrification of vehicles. The ongoing shift toward new energy sources in vehicle fleets can significantly contribute to low-carbon development in the food transportation sector [14,15]. As the scale of renewable energy generation increases, the average carbon emission factor of the grid gradually decreases, which further reduces carbon emissions from food transportation and storage [16,17,18]. Additionally, improving the recycling and reuse of kitchen waste can enhance the overall recycling rate of food consumption and help reduce the associated carbon emissions [19]. Current methods for treating kitchen waste include landfilling, incineration for power generation, anaerobic digestion, and composting [20,21]. Compared to traditional landfilling, utilizing incineration for power generation and anaerobic digestion not only converts waste materials into usable energy but also offer stronger recycling capabilities, contributing positively to reducing carbon emissions from kitchen waste disposal [22,23].
The four selected cities—Xi’an, Taiyuan, Zhengzhou, and Jinan—are located in the middle and lower reaches of the Yellow River, a region with the highest carbon emissions within the basin and a significant contributor to China’s overall emissions [24,25]. Shaanxi and Shanxi are major energy-producing provinces, while Henan and Shandong are key agricultural hubs [26,27]. These provinces also represent China’s regional diversity, with Xi’an reflecting the west, Taiyuan and Zhengzhou representing the central region, and Jinan illustrating the east. The selection of these provincial capitals allows for an in-depth exploration of food consumption-related carbon emissions across different geographical, economic, and resource contexts, making the findings more representative and applicable to a broader national scale.
This study makes three key academic contributions: First, it investigates the impact of energy transition on carbon emissions from food consumption. Existing studies on food transportation emissions primarily focus on traditional transportation modes, such as those powered by diesel and gasoline, which often lead to an overestimation of transportation-related emissions. With the rapid electrification of food transportation, it has become necessary to update carbon emission estimates by incorporating the growing adoption of new-energy vehicles. Second, this study examines the role of resource recycling in reducing carbon emissions from food consumption. Effective and environmentally friendly food waste disposal remains a critical goal for urban sustainability, as different recycling methods result in varying carbon emissions. This study identifies significant opportunities for the low-carbon management of food waste to reduce overall emissions from food consumption. Third, this study emphasizes urban-level analysis of food consumption carbon emissions. Compared to provincial- or regional-level research, urban-level studies provide higher resolution, offering a more detailed understanding of how variations in resource endowments and emission reduction policies influence carbon emissions. Finally, by conducting an empirical analysis of the Yellow River Basin, a region characterized by diverse energy transition dynamics and resource recycling practices, this study not only contributes to the understanding of food consumption carbon emissions in this area but also lays the groundwork for comparative studies across different regions of China.
2. Literature Review
The carbon emissions associated with the food lifecycle have been extensively studied using lifecycle assessment (LCA), with research typically focusing on the transportation, storage and processing, and waste disposal stages. During the transportation stage, studies indicate that emissions from food transportation account for a relatively small portion of total emissions: approximately 1% [28]. However, this share is expected to grow as urbanization intensifies and living standards improve [29,30,31]. Transportation-related emissions are influenced by factors such as food type, consumption patterns, and transportation mode. For example, emissions resulting from transporting nut products by truck account for as much as 19% of their total emissions, which is notably higher than for other food categories [32]. Similarly, for frozen retail products such as dumplings, the transportation phase contributes the largest share of emissions [33]. The mode of transportation also significantly impacts carbon intensity [34,35,36], with road-based transportation being more carbon-intensive than rail or maritime options [37]. Moreover, research suggests that electrifying transportation could significantly reduce emissions, with electric vehicles (EVs) generating up to 62.95% fewer emissions compared to conventional fuel vehicles [38,39]. However, the carbon reduction potential of EVs depends heavily on the energy mix of the electricity grid, and few studies have examined the integration of electrification in food transportation under regional energy transitions. This study addresses this gap by evaluating the carbon reduction potential of electrified food transportation within the broader energy transition context.
Storage and processing are among the most energy-intensive stages in the food lifecycle, contributing significantly to overall carbon emissions [40,41,42]. Key activities, such as refrigeration, freezing, and cooking, dominate energy consumption within the food system [43,44,45]. Factors such as energy mix, dietary patterns, and household behaviors influence emissions from these stages. For example, a transition from traditional cooking fuels, such as coal and wood, to cleaner alternatives, such as natural gas and electricity, has led to significant reductions in cooking-related emissions in many regions [46,47]. Additionally, vegetarian diets have been associated with lower greenhouse gas emissions compared to meat-based diets [48]. Household size also plays a critical role, as smaller households typically exhibit higher per capita emissions due to the inefficient use of energy-intensive appliances such as refrigerators [49,50]. Despite these insights, existing research often overlooks regional variations in energy use and emission intensities, such as the differing impacts of cold-chain storage in regions with varying energy infrastructures. This study addresses this gap by analyzing the carbon emissions from storage and reprocessing across four cities in the middle and lower reaches of the Yellow River, considering regional variations in energy use and infrastructure.
Food waste disposal, as the final stage of the food lifecycle, serves as both a carbon source and a carbon sink [51,52,53]. Research has primarily focused on comparing the carbon emissions of different disposal methods, such as anaerobic digestion, incineration, and composting. Among these, anaerobic digestion offers the highest recycling efficiency and carbon reduction potential, although it requires advanced and stable operational facilities [20,54,55]. In contrast, incineration achieves greater carbon reductions when integrated with cogeneration systems, despite its lower recycling efficiency [54,55]. The effectiveness of these methods varies across cities. For instance, anaerobic digestion has demonstrated significant environmental benefits in Beijing by maximizing resource recovery, whereas incineration has proven more effective in Hefei, reducing greenhouse gas emissions by 38.93% compared to landfill disposal [56,57]. Given the differing conditions across countries and regions, it is essential to tailor waste management strategies to specific types of kitchen waste and the development status of each area in order to effectively reduce greenhouse gas emissions [58,59]. Proper waste sorting plays a pivotal role in improving recycling efficiency and reducing emissions during waste treatment [60,61]. However, current research often isolates waste disposal methods rather than analyzing them within the broader context of food consumption. This study addresses this limitation by incorporating multiple disposal methods into the food consumption lifecycle analysis, providing a comprehensive evaluation of their collective carbon reduction potential across different cities.
Despite significant advancements in the understanding of carbon emissions across the food lifecycle, several gaps remain. Research on transportation has inadequately addressed the role of electrification in reducing emissions, particularly in relation to regional energy transitions. Studies on storage and processing have rarely examined regional variations in energy use and their impact on emission intensities. Furthermore, the integration of food waste disposal into comprehensive lifecycle assessments is still limited, with most studies focusing on standalone analyses. This study first defines the scope of carbon emissions accounting for the lifecycle of food consumption, and then it establishes a carbon emissions inventory for residential food consumption in four provincial capital cities located in the middle and lower reaches of the Yellow River from 2006 to 2020. Based on this inventory, scenario simulations are conducted to assess the potential impacts of energy structure transformation and resource recycling on carbon emissions. These simulations analyze the development prospects and carbon reduction potential of food consumption in the four cities. The goal is to examine how energy transition and resource recycling affect the food consumption lifecycle and to propose targeted strategies for emission reduction.
3. Methods and Data
3.1. Definition of the Scope of the Food Consumption Lifecycle
This research focuses on carbon emissions from food consumption by residents in the provincial capitals along the middle and lower reaches of the Yellow River. The spatial scope includes urban residents within the municipal districts of Xi’an, Taiyuan, Zhengzhou, and Jinan.
Lifecycle assessment (LCA), a bottom–up analytical method that begins with individual processes, is commonly used to evaluate the environmental impacts of products throughout their lifecycles and is a key tool for carbon footprint analysis. When calculating carbon emissions, it is crucial to first define the system boundaries, which determine the specific process units to be included in the study. The full lifecycle of food should encompass all stages, including primary production, processing, packaging, transportation, storage, cooking, and final waste disposal. However, in the context of food consumption, lifecycle analysis typically excludes the production and packaging of raw materials, focusing instead on transportation and subsequent stages. Ideally, the upstream industrial chain for each phase could be traced indefinitely. In practice, however, it is necessary to limit the scope of the model in order to avoid excessive complexity and uncertainty in the evaluation results, as including distant upstream and downstream activities can complicate the analysis [62,63]. In this study, residential food consumption is divided into four stages: transportation, storage, reprocessing, and final waste disposal (Figure 1). It is important to note that each stage excludes its upstream activities, such as the manufacturing of trucks, refrigerators, and kitchen utensils, as well as the processing and transportation of fossil fuels.

Figure 1.
Four stages of food consumption.
3.2. Carbon Emission Inventory of Food Consumption
3.2.1. Carbon Emission Estimation of Food Transportation Considering Energy Transition
Carbon emissions from food transportation primarily refer to the emissions generated by energy consumption during the movement of food from its place of origin to the destination market. By consulting relevant statistical data, the main supply sources for various types of food can be identified, with road transportation being the dominant mode within cities. For intercity transportation, rail and road are the primary modes of transport. According to the statistical yearbooks for each city, air and waterway transport comprise a relatively small proportion of food transportation and can be disregarded in this study. Thus, food transportation is assumed to exclude shipping and water transport. Rail transport consumes approximately 25 L of diesel per 10,000 ton-kilometers (tkm), while road transport trucks consume ~4.72 L of diesel per 100 tkm. Fully loaded electric logistics vehicles consume around 40 kWh per 100 km, or approximately 10 kWh per 100 tkm.
With strong national support and promotion of clean energy, electric vehicles, particularly those powered by electricity, have gained significant attention and seeing increasing adoption in the transportation industry. In cities actively promoting new energy, such as Xi’an, Taiyuan, Zhengzhou, and Jinan, the use of new-energy freight vehicles has been growing steadily year by year. According to the “New Energy Commercial Vehicle White Paper” and reports from Electric Vehicle Industry Research, urban distribution of new-energy logistics vehicles is primarily composed of microvans, microtrucks, and light trucks. The distribution of energy types used in logistics vehicles across different cities can be derived from research data published in the “Southeast, Northwest, and Central Regional Market Registration Observation” by Truck Home. By combining the carbon emission factors of the energy consumed with the food transportation conditions specific to each city, the carbon emissions during the transportation phase can be calculated. The carbon emission factors used in this study were derived from the Provincial Greenhouse Gas Inventory Guidelines, which follow the methodology outlined in the 2006 IPCC Guidelines for National Greenhouse Gas Inventories. These factors are standardized coefficients for calculating the carbon emissions associated with various energy sources. Table 1 presents the energy carbon emission factors. As shown, the emission factors for diesel and gasoline are relatively high, indicating their significant contribution to carbon emissions, while electricity is comparatively cleaner, depending on the energy mix used for its generation.

Table 1.
Carbon emission factors for various energy sources.
The calculation formula for carbon emissions during the food transportation stage is as follows:
where Dtj represents the carbon emissions from food transportation in region j, Mji represents the transportation mileage of food by mode i in region j, Nji represents the tonnage of food transported by mode i in region j, Hi represents the fuel/electricity consumption per 10,000 ton-kilometers for transportation mode i, and Ci represents the carbon emission factor of the energy consumed by transportation mode i.
3.2.2. Carbon Emission Estimation of the Food Storage Stage
The carbon emissions from food storage primarily refer to those generated during the refrigeration process as a result of energy consumption. The calculation formula for carbon emissions during the food storage stage is as follows:
where Dsj represents the carbon emissions from food storage in region j; according to the relevant regulations in the “Refrigerator Energy Consumption Limits and Energy Efficiency Grades”, the annual power consumption of each refrigerator is approximately 507.36 kW·h. Based on a carbon emission factor of 0.80, this corresponds to 405.88 kg of CO2. Pj represents the urban population in region j, Nj represents the number of refrigerators per hundred households in region j, and nj represents the average household size in region j.
3.2.3. Carbon Emission Estimation of the Food Processing Stage
The carbon emissions from food reprocessing primarily refer to those generated during the cooking process when residents prepare food. According to the relevant statistical yearbooks, most households in the four cities examined here consist of three members. Therefore, this study calculates reprocessing emissions based on the standard of a typical three-person household. Data on the carbon emissions per unit of food during cooking can be obtained from relevant online food publications and statistical yearbooks, as summarized in Table 2.
Table 2.
Energy consumption and carbon emissions per unit mass of food reprocessed.
The calculation formula for carbon emissions during the food reprocessing stage is as follows:
where Dcj represents the carbon emissions from the food reprocessing stage in region j, Sjk represents the consumption of food type k in region j, and Qk represents the carbon emissions produced per unit of food type k during cooking.
3.2.4. Carbon Emission Estimation of the Food Waste Disposal Stage
The carbon emissions from food waste management consist of two main components. The first component arises from the transportation of organic waste, which generates emissions due to energy consumption. Based on the proportions of food waste from residential areas, commercial areas, and farmers’ markets—60%, 20%, and 20%, respectively [64,65]—the average distance from municipal transfer stations to waste treatment facilities can be calculated using a weighted approach. By correlating this average distance with the fuel consumption per ton per kilometer, the fuel required to transport one ton of organic waste can be determined. This value can then be multiplied by the carbon emission coefficients of the relevant energy sources and the weight of the organic waste to calculate the total carbon emissions produced during the transportation process. The second component involves carbon emissions from various disposal methods, such as incineration and landfilling. These emissions result from the consumption of energy sources and reagents during the treatment process, as well as from potential leaks due to differences in equipment or treatment methods. To derive the net carbon emissions from waste disposal, emissions savings from energy generation (e.g., power or heat recovery) or the reuse of raw materials in the process are subtracted from the total emissions [66,67,68].
The calculation formula for carbon emissions during the food waste disposal stage is as follows:
where Dhj represents the carbon emissions generated during the food waste disposal stage in region j, Ej represents the fuel consumption for transporting one ton of kitchen waste in region j, r represents the carbon emission factor of the energy, Rj represents the mass of kitchen waste in region j, Jsj represents the carbon emissions generated from the consumption of related energy reagents by disposal method s in region j, Ksj represents the carbon emissions generated from leaks due to different equipment or treatment methods in disposal method s in region j, and Lsj represents the carbon emissions saved by generating electricity or producing raw materials from the final products in disposal method s in region j.
3.2.5. Total Carbon Emissions from Food Consumption
Carbon emissions from food consumption are aggregated over the four stages:
where Dtj represents the carbon emissions from food transportation in region j, Dsj represents the carbon emissions from food storage in region j, Dcj represents the carbon emissions from food reprocessing in region j, and Dhj represents the carbon emissions from food waste disposal in region j.
Dj = Dtj + Dsj + Dcj + Dhj
3.3. Scenario Analysis
The lifecycle of food consumption typically includes four key stages: transportation, storage, reprocessing, and waste disposal. This study develops scenarios for each stage, drawing on relevant policies related to energy transformation and resource recycling in various cities.
The transportation stage defines four scenarios: the baseline scenario (BS), energy structure optimization scenario (ESO), energy efficiency improvement scenario (EEI), and integrated scenario (IS), as outlined in Table 3.
Table 3.
Scenario setting for the transport stage.
The baseline scenario assumes no intervention, with each city progressing according to its current policy framework and technological pathways.
The energy structure optimization scenario takes into account the increased adoption of new-energy trucks and the reduction in carbon emission factors for electricity. In 2021, the State Council issued the “14th Five-Year Plan for the Development of a Modern Comprehensive Transportation System”, which explicitly promotes the sustainable development of green transportation. This plan sets a target for 2025, aiming for 100% of urban distribution to be powered by clean and new energy, with green travel accounting for 75% of total transportation. By 2030, it is expected that the use of new and clean energy will significantly increase, with new energy in urban freight transport exceeding 80%. Additionally, in 2023, the Ministry of Ecology and Environment’s Environmental Planning Institute published the “Research on Carbon Emission Factors of Regional Power Grids in China (2023)”, which forecasts that future power generation will become increasingly reliant on clean energy. The share of non-fossil energy sources, particularly wind and solar power, is expected to grow substantially in the new energy system, leading to a marked reduction in the carbon emission factors of electricity across cities by 2030.
The energy efficiency improvement scenario focuses on enhancing transportation energy efficiency. The International Energy Agency’s “2023 Energy Efficiency Report” emphasizes that sustained, widespread improvements in energy efficiency are essential for achieving global emission reductions, particularly in light of the expected increase in global electricity demand. To meet these goals, the average annual improvement in energy efficiency must accelerate from 2% in 2022 to over 4% per year between now and 2030.
The integrated scenario combines both energy structure optimization and energy efficiency improvements, evaluating their combined potential for reducing emissions.
The waste disposal stage defines four scenarios: the baseline scenario (BS), food waste reduction scenario (FWR), disposal method upgrade scenario (DMU), and integrated scenario (IS), based on resource recycling policies, as outlined in Table 4.
Table 4.
Scenario setting for the waste disposal stage.
The baseline scenario represents a no-intervention approach, where each city progresses according to its current policy framework and technological pathways.
The food waste reduction scenario takes into account the increased awareness of food conservation among urban residents. The State Council’s “Food Conservation Action Plan” emphasizes the need to strengthen efforts to promote savings and combat food waste. By 2030, a comprehensive framework for food conservation and loss reduction, including a standardized system and monitoring mechanisms, is expected to be largely established. A long-term governance structure will be in place, the “Clean Plate Campaign” will be widely implemented, and food waste will be effectively reduced, fostering a social environment that promotes food saving and discourages waste.
The disposal method upgrade scenario considers improvements in incineration power generation efficiency and the promotion of anaerobic digestion. The “14th Five-Year Plan for the Development of Urban Household Waste Classification and Treatment Facilities” emphasizes enhancing the end-of-life treatment system for household waste, accelerating the construction of incineration power plants, and achieving zero landfill use for household waste. Additionally, Greenpeace’s latest report, “Overview of Low-Carbon Management for Food Waste Throughout its Lifecycle”, assesses the environmental impact of food waste (or municipal solid waste) using LCA; the report finds that greenhouse gas emissions from anaerobic digestion are lower than those from incineration and landfill. The treatment hierarchy for food waste should prioritize “anaerobic digestion > aerobic composting > incineration > landfill”, highlighting the need to promote the more environmentally friendly anaerobic digestion treatment model.
The integrated scenario combines both food waste reduction and the upgrading of disposal methods, evaluating their combined potential for emission reduction.
The storage stage includes two scenarios: the baseline scenario (BS) and the energy structure optimization scenario (ESO). The primary energy consumed during this stage is electricity, with the carbon emission factor for electricity remaining unchanged in the baseline scenario. The energy structure optimization scenario takes into account a reduction in the carbon emission coefficient for electricity. This scenario not only reduces carbon emissions from refrigerators during the storage stage but also has a positive impact on emission reduction from new-energy freight transport during the transportation stage.
The reprocessing stage is represented by a single baseline scenario (BS). The consumption of various food types is projected based on current trends. The primary energy source used in cooking is natural gas. Since natural gas is considered to be a clean energy source and further reductions in carbon emissions through process improvements are relatively challenging, no additional scenarios are established for this stage.
In summary, this study defines eight scenarios for food consumption to predict future carbon emission trends, based on the scenario settings for each stage, as outlined in Table 5.
Table 5.
Scenario setting for food consumption process.
3.4. Data Sources
This study categorizes food consumption by urban residents into 11 main types: grains, vegetables, eggs, fresh fruits, beef and mutton, pork, poultry, dairy products, vegetable oil, aquatic products, and alcohol. The data used to calculate the carbon emissions from food consumption were primarily sourced from the statistical yearbooks of various cities, covering the period from 2006 to 2020. Specific data and indicators are provided in Table 6.
Table 6.
Data sources for indicators.
4. Results
4.1. Analysis of Food Consumption Carbon Emissions at Different Stages in Each City
4.1.1. Analysis of Total and Per Capita Food Consumption Carbon Emissions
Based on the calculation of total carbon emissions from food consumption, the total and per capita carbon emissions of food consumption in the four cities were determined, as shown in Figure 2. From 2006 to 2020, the total carbon emissions in three of the cities, excluding Xi’an, generally exhibited an upward trend. In Xi’an, the total carbon emissions increased year by year until 2018, after which they began to decline. Overall, the total carbon emissions followed the order Xi’an > Zhengzhou > Jinan > Taiyuan.

Figure 2.
Trends in total and per capita carbon emissions from food consumption, 2006–2020.
Regarding per capita carbon emissions, from 2006 to 2016, Xi’an experienced rapid growth, with an average annual growth rate of 2.14%. The other three cities showed minor fluctuations, with annual growth rates of 0.67% for Zhengzhou, −0.33% for Jinan, and 0.31% for Taiyuan. In 2016, per capita carbon emissions were highest in Xi’an (389.00 kg), followed by Taiyuan (361.84 kg), Zhengzhou (349.17 kg), and Jinan (341.81 kg). From 2017 to 2020, per capita carbon emissions in all four cities generally declined. Xi’an exhibited the largest fluctuation, with an average annual decline rate of ~5.82%, followed by Zhengzhou (2.24%), Taiyuan (1.97%), and Jinan (1.75%). By 2020, per capita carbon emissions were lowest in Xi’an (310.15 kg), followed by Zhengzhou (319.50 kg), Jinan (318.86 kg), and Taiyuan (334.69 kg).
4.1.2. Analysis of Total and Per Capita Carbon Emissions at Different Stages
Based on the calculation method for carbon emissions at each stage, the total and per capita carbon emissions at each stage in the four cities were calculated, as shown in Figure 3.
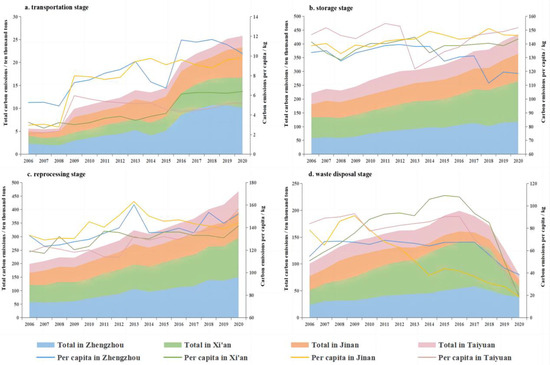
Figure 3.
Trends in total and per capita carbon emissions by stage, 2006–2020.
Total carbon emissions during the transportation stage initially increased before gradually leveling off. Zhengzhou had the highest total carbon emissions, while Taiyuan had the lowest (Figure 3a). In terms of per capita carbon emissions, Zhengzhou and Jinan had higher values, followed by Xi’an and Taiyuan. This trend was primarily due to differences in transportation mileage. Zhengzhou and Jinan had longer transportation distances for goods, leading to higher emissions, while Xi’an and Taiyuan, with shorter transportation distances, experienced relatively lower emissions for similar food consumption volumes. Per capita carbon emissions in Xi’an began to increase after 2013, primarily due to the reliance on intercity transportation for beef and mutton from Hengshan and Ningxia starting in 2014, which generated additional emissions from railway transportation. Before 2016, although Taiyuan’s food consumption was lower than Xi’an’s, its per capita carbon emissions were higher due to the transportation of fresh fruits from Datong, resulting in additional emissions. In 2016, Xi’an saw a significant surge in per capita carbon emissions, mainly due to the expansion of urban areas, which increased transportation distances and pushed emissions above those of Taiyuan. Similarly, Zhengzhou experienced a sharp increase in per capita carbon emissions in 2016, following the expansion of its built-up urban area. From 2017 onward, per capita carbon emissions in all four cities began to level off. Despite annual increases in food consumption, the transportation distances stabilized, and in some cases even decreased, due to the impact of the pandemic in 2019–2020. Furthermore, the gradual adoption of new-energy trucks helped mitigate some emissions, leading to no significant increase in per capita carbon emissions overall.
Total carbon emissions during the storage stage showed an annual upward trend, generally following the order Xi’an > Zhengzhou > Jinan > Taiyuan, which closely correlates with the population sizes of the four cities (Figure 3b). Therefore, the primary focus was on per capita storage carbon emissions. From 2006 to 2012, Taiyuan had the highest per capita carbon emissions, primarily because it had the highest number of refrigerators per hundred households during this period. The per capita carbon emissions in the other three cities did not differ significantly and increased at a similar rate. From 2013 to 2020, Jinan experienced the highest per capita carbon emissions, driven by a rapid increase in the number of refrigerators per hundred households, which led to higher energy consumption and, consequently, greater carbon emissions. In contrast, Taiyuan saw fluctuations in the number of refrigerators per hundred households, starting in 2013, resulting in a decrease followed by an increase in its per capita carbon emissions. After 2013, the average number of residents and refrigerators per household in Xi’an gradually stabilized, leading to relatively stable per capita carbon emissions. Conversely, per capita carbon emissions in Zhengzhou showed an overall downward trend. This decline is likely attributable to the gradual relaxation of China’s family planning policy in 2014–2015 and the eventual end of the policy, which led to a yearly increase in the average number of residents per household. However, the number of refrigerators per hundred households remained stable, which contributed to a reduction in per capita carbon emissions.
Total carbon emissions during the reprocessing stage showed an annual upward trend, with the order of emissions being Xi’an > Zhengzhou > Jinan > Taiyuan from 2006 to 2012 (Figure 3c). However, from 2013 to 2020, Zhengzhou surpassed Xi’an, and the order shifted to Zhengzhou > Xi’an > Jinan > Taiyuan. The main reason for this change was that, although Xi’an had a larger urban population, Zhengzhou had higher per capita food consumption, resulting in greater total carbon emissions. Before 2018, Jinan had the highest per capita carbon emissions, primarily due to the higher consumption of foods with high carbon emissions from cooking, such as pork, beef, mutton, and eggs. From 2006 to 2020, per capita carbon emissions in the four cities generally increased, although the rate of increase slowed after 2013. This shift was largely due to the continued improvement in living standards, which led to adjustments toward a more balanced diet. Grain consumption peaked around 2013, while the consumption of lower-emission foods, such as fresh fruits and dairy products, continued to rise. Xi’an’s dietary structure transitioned relatively smoothly, so the overall change in per capita carbon emissions was not very significant. Taiyuan, which had the lowest per capita carbon emissions in the earlier years due to lower per capita food consumption, has seen an increase in emissions in recent years as food consumption has continued to rise.
Total carbon emissions during the waste disposal stage initially increased before decreasing, with the overall order being Xi’an > Zhengzhou > Taiyuan > Jinan (Figure 3d). The focus here is on per capita waste disposal carbon emissions. From 2006 to 2009, Taiyuan had the highest per capita carbon emissions, primarily due to the high proportion of kitchen waste and the greater distance between its waste treatment stations and the city center, resulting in higher transportation emissions. From 2010 to 2019, the order generally shifted to Xi’an > Taiyuan > Zhengzhou > Jinan. Jinan’s per capita carbon emissions peaked in 2009 and then steadily declined each year. This was largely because, from 2010 to 2015, the growth of kitchen waste in Jinan slowed, and the city began implementing waste-to-energy incineration technology in 2011, which helped reduce carbon emissions. After 2016, while the amount of kitchen waste produced in Jinan began to grow rapidly, the city’s waste-to-energy incineration technology had already matured, leading to a continued decrease in overall carbon emissions. In contrast, Xi’an’s kitchen waste increased rapidly, reaching the highest volume, and its waste-to-energy incineration began later. As a result, per capita carbon emissions increased year by year until 2017. However, after adopting more advanced combined heat and power incineration technology in 2017, Xi’an saw a significant reduction in emissions, with a steeper decline compared to the other cities. Taiyuan, which began experimenting with waste-to-energy incineration in 2008, was one of the first cities to use this technology. However, due to outdated early technology and a high proportion of kitchen waste, per capita carbon emissions continued to rise until 2017. After power generation technology improved, emissions began to decline. Zhengzhou, which started waste-to-energy incineration later and lacked robust technical support, saw its per capita carbon emissions surpass those of the other cities by 2020.
4.2. Analysis of the Carbon Emission Structure of Food Consumption in Each City
Based on the ratio of each stage to the total carbon emissions, the structural proportion of carbon emissions from food consumption was determined for each city, as shown in Figure 4.

Figure 4.
Structure of carbon emissions from food consumption by city. The blue section (Transportation Stage) represents a very small proportion of emissions, making it less visible in the chart.
In Zhengzhou, transportation carbon emissions accounted for the smallest share of total food consumption emissions, ranging from 1% to 3%. While this share gradually increased over time, the growth rate slowed after 2019 (Figure 4a). The largest contributions to carbon emissions came from the storage and reprocessing stages, with each accounting for approximately 40% from 2006 to 2013. After 2013, the share of emissions from storage initially declined and then stabilized, reaching ~37% by 2020. In contrast, emissions from the reprocessing stage showed a clear upward trend, increasing to 47% by 2020. The proportion of emissions from waste disposal fluctuated between 10% and 20%, following a trapezoidal pattern: first increasing, then gradually leveling off, and finally decreasing.
In Xi’an, transportation carbon emissions accounted for the smallest share of total food consumption emissions, ranging from 1% to 2% (Figure 4b). The largest contributions came from storage and reprocessing. The proportion of carbon emissions resulting from storage was 44% in 2006, which gradually decreased to around 35% by 2016. However, it increased again from 2017 onwards, reaching 46% in 2020, exhibiting a U-shaped pattern with a decline followed by an increase. The share of carbon emissions resulting from reprocessing remained relatively stable at ~35% until 2017, after which it began to rise, reaching 45% in 2020, reflecting a trend of stability followed by an increase. The proportion of emissions from waste disposal was 16% in 2006, steadily rising to 28% by 2017. From 2018 onward, however, it sharply declined, dropping to 6% in 2020, forming an inverted U-shaped curve with an initial increase followed by a steep decrease.
In Jinan, transportation carbon emissions accounted for the smallest share of total food consumption emissions, ranging from 1% to 3% (Figure 4c). The majority of carbon emissions originated from the storage and reprocessing stages. The proportion of carbon emissions from storage remained relatively stable at around 37% until 2013, after which it began to rise gradually, reaching 45% by 2020, reflecting a pattern of stability followed by an increase. In contrast, emissions from the reprocessing stage increased consistently from 2006, peaking at approximately 44% in 2013, before stabilizing in subsequent years, showing a pattern of rising followed by stabilization. The proportion of carbon emissions from waste disposal remained stable at ~22% between 2006 and 2011 and then declined steadily after 2011, dropping to 6% by 2020, following an overall trend of stabilization followed by a decline.
In Taiyuan, transportation carbon emissions accounted for the smallest share of total food consumption emissions, ranging from 0.5% to 1.8% (Figure 4d). The most significant contributors to consumption-related carbon emissions were storage and reprocessing. Storage carbon emissions remained relatively stable at around 42% from 2006 to 2012, before dropping sharply in 2013 and subsequently rebounding. This pattern reflects an overall structure of stability, followed by a decline and then an increase. Carbon emissions from the reprocessing category were also stable until 2012, at approximately 33%, and then rose to 38% in 2013 before stabilizing again until 2019, when they began to increase once more. This resulted in a structure of stability followed by growth, then stabilization, and then renewed growth. The proportion of carbon emissions from waste disposal remained relatively constant at ~24% from 2006 to 2016, but it began to decline steadily after 2017, dropping to 6% by 2020, following an overall trend of stability followed by decline.
Carbon emissions from food consumption in the four cities were primarily driven by the storage and processing stages. In all cities except Zhengzhou, where the proportion of emissions from storage has been decreasing, the share of emissions from both storage and processing has been increasing. The proportion of carbon emissions from the transportation stage also rose in all four cities but remained relatively low (under 5%). With the gradual adoption of new-energy trucks, this growth trend is expected to slow further. The waste disposal stage exhibited the most pronounced fluctuations among the four stages, with carbon emissions from waste disposal in all cities showing an initial increase followed by a decrease. Notably, Xi’an and Taiyuan, which developed larger-scale and more advanced incineration systems, experienced a more significant decline in their carbon emissions from waste disposal, with their share dropping from around 25% to 6%.
4.3. Scenario Analysis of Food Consumption Carbon Emissions
4.3.1. Forecast of Food Consumption Carbon Emissions in Each City
This study employs scenario analysis to predict urban food consumption carbon emissions for four provincial capital cities in the middle and lower reaches of the Yellow River from 2021 to 2030, as illustrated in Figure 5. In the baseline scenario (S1), confidence intervals are not included, as this scenario represents a stable projection derived from current trends, with relatively minimal uncertainties due to the absence of major assumptions or interventions. S1 serves as a reference scenario against which the effects of other interventions can be compared. For other scenarios (S2–S8), confidence intervals (±5%) are applied to account for uncertainties arising from variations in energy transitions, recycling transformations, and changes in food consumption behaviors. The shaded areas around the curves in Figure 5 provide visual representations of these confidence intervals, providing an estimate of the variability and reliability of the predictions under the given assumptions.
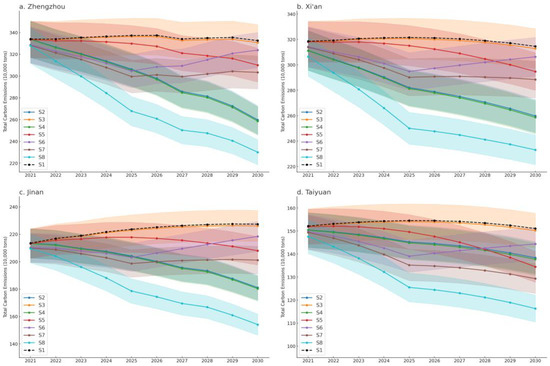
Figure 5.
Prediction of carbon emissions from food consumption by city. The shaded areas represent the confidence intervals (±5%) for scenarios S2–S8.
Under the baseline scenario, food consumption carbon emissions in the cities remain relatively stable, peaking around 2025–2026 before decreasing slightly. By 2030, it is expected that emissions will largely mirror the current levels. Jinan experiences a prolonged increase in carbon emissions, primarily due to the faster growth in the consumption of reprocessed foods. S3 addresses energy efficiency in the transport sector, which has a relatively small impact on overall food consumption carbon emissions, with limited potential for reduction. S2 focuses on optimizing the energy mix, including the adoption of new-energy trucks and improvements in food storage, resulting in significant emission reductions. In particular, Zhengzhou benefits from relatively clean electricity, and by 2030, food consumption carbon emissions in the city are expected to decrease by 22.6% compared to the current levels, yielding a reduction potential of 22.2% relative to the baseline scenario. Conversely, Taiyuan, with a higher carbon emission factor for electricity, experiences a smaller reduction, with food consumption carbon emissions falling by only 10%, representing an 8.8% reduction potential. S4 combines energy transition measures, with carbon reduction potentials of 22.2%, 17.8%, 20.7%, and 8.9% in Zhengzhou, Xi’an, Jinan, and Taiyuan, respectively. S5 introduces a reduction in food waste through the “Clean Plate” campaign, which is particularly effective in Taiyuan, where carbon emissions from food consumption are reduced by 12% by 2030. S6 addresses the upgrading of food waste disposal methods. Initially, carbon emissions decrease until 2025, and then they rise after that period. This trend occurs because incineration for power generation has a significant emission reduction effect compared to landfilling, while the transition from incineration to anaerobic digestion offers further (though limited) reductions. In the period from 2021 to 2025, S6 is more effective than S5, whereas S5 becomes more effective from 2026 to 2030. S7 is a comprehensive recycling transformation scenario, with carbon reduction potentials of 8.8%, 8.3%, 11.5%, and 14.4% for Zhengzhou, Xi’an, Jinan, and Taiyuan, respectively. For Zhengzhou, Xi’an, and Jinan, energy transition has a more significant carbon reduction effect than recycling, whereas the opposite is true for Taiyuan, mainly due to its higher share of food waste and greater potential for emission reductions from resource recycling. Finally, S8 combines both energy transition and recycling, yielding substantial emission reductions. Under this scenario, the carbon reduction potentials for Zhengzhou, Xi’an, Jinan, and Taiyuan are 30.8%, 26.8%, 27.8%, and 23.0%, respectively.
4.3.2. Differences in Carbon Reduction Potential and Policy Implications Across Cities
The four cities demonstrate significant differences in carbon reduction potential under various scenarios, primarily due to the heterogeneity in their foundational conditions and variations in policy-planning intensity. In the energy transition scenario, Zhengzhou and Jinan exhibit higher reduction potentials, reaching 22.2% and 20.7%, respectively. This can be attributed to their rapid integration of renewable energy sources, such as wind and solar power, into their energy systems, coupled with aggressive policy measures aimed at reducing fossil fuel dependency. These cities have also modernized their energy infrastructure, creating a robust foundation for significant emission reductions. In contrast, Xi’an and Taiyuan show lower reduction potentials, at 17.8% and 8.9%, respectively, due to their reliance on coal-dominated energy structures. As resource-dependent urban centers, both cities face economic and structural challenges in transitioning to clean energy, leading to more conservative energy policies and limiting their short-term emission reduction capacity.
In the resource recycling scenario, Taiyuan and Zhengzhou demonstrate higher reduction potentials, reaching 14.4% and 11.5%, respectively. This is largely due to effective policy guidance that offsets their relatively basic food waste treatment technologies, facilitating improvements in resource recovery and utilization. Taiyuan, in particular, benefits from a higher proportion of kitchen waste, which creates greater opportunities for recycling under supportive policies. In contrast, Xi’an and Zhengzhou show lower reduction potentials: 8.3% and 8.8%, respectively. Xi’an’s advanced incineration technology has reached a mature stage, leaving limited room for further optimization. Meanwhile, Zhengzhou struggles with underdeveloped incineration infrastructure and insufficient policy support, which constrain its efficiency in resource recycling and limit its overall emission reduction potential.
4.3.3. Forecast of the Carbon Emission Structure of Food Consumption
Figure 6 illustrates the carbon emission structure of urban food consumption in four provincial capital cities along the middle and lower reaches of the Yellow River, comparing the baseline scenario (S1) with the comprehensive scenario (S8) from 2021 to 2030.
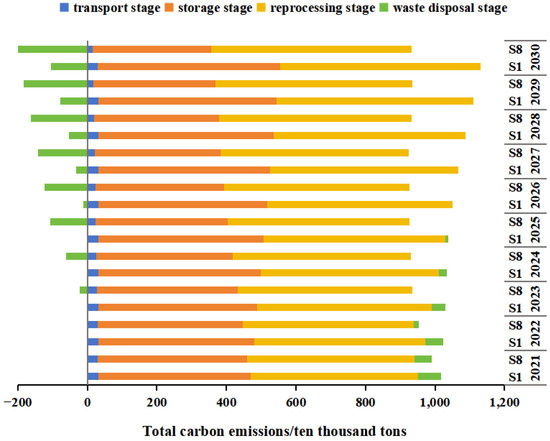
Figure 6.
Prediction of carbon emission structure in four provincial capital cities.
Under the baseline scenario, carbon emissions from the storage and reprocessing stages grow at a faster rate, reaching 5.23 Mt in the storage stage and 5.76 Mt in the reprocessing stage by 2030, accounting for 51.1% and 56.2% of the total carbon emissions from food consumption, respectively. Carbon emissions from transportation remain relatively stable, estimated to reach 306,000 t by 2030, representing 3.0% of total food consumption emissions. The waste disposal stage, influenced by the increased use of incineration, shows a more noticeable decline in carbon emissions, even achieving negative emissions. By 2030, carbon emissions from waste disposal are projected to decrease to −1,05 Mt, accounting for approximately −10.2% of the total.
In the comprehensive scenario, which integrates energy transition and recycling efforts, the adoption of new-energy trucks and reductions in electricity emission factors will lead to a nearly 50% reduction in carbon emissions from transportation compared to the baseline scenario. By 2030, transportation carbon emissions will be reduced to 161,000 t, or 2.2% of the total food consumption emissions. The reduction in the carbon intensity of electricity also significantly impacts the storage stage. Given the substantial carbon emissions produced during storage, this stage shows a higher potential for emission reductions than transportation. By 2030, the amount of carbon emissions produced during storage will decrease to 3.41 million tons (Mt), representing 47.0% of the total. Meanwhile, the reprocessing stage, benefiting from reductions in other areas, will account for 79.5% of total emissions by 2030. In the waste disposal stage, improvements in disposal methods and reductions in food waste contribute to a significant decrease in environmental impact, with carbon emissions dropping to −2.08 Mt, or −28.7% of the total, by 2030.
5. Discussion
5.1. The Decarbonization Effect of Energy Transition and Resource Recycling on Food Consumption Carbon Emissions Is Confirmed
From the perspective of total lifecycle emissions, per capita food consumption carbon emissions in Jinan have been declining since 2013. In contrast, carbon emissions in the other three cities peaked around 2016 and have shown a downward trend since 2017. This finding contrasts with the majority of previous studies, which suggest that, as economic development continues, both total carbon emissions from food consumption and per capita carbon emissions in urban areas continue to rise [69,70]. The primary reason for this discrepancy is that this study expands the boundaries of lifecycle analysis to include the recycling stage. As the carbon sink capacity of waste-to-energy incineration has improved over time, carbon emissions from urban waste disposal have been decreasing, contributing to the overall decline in food consumption emissions. Jinan, which began implementing waste-to-energy incineration earlier, experienced a decline in carbon emissions first. Meanwhile, Xi’an, which has the most advanced incineration technology, shows the most pronounced downward trend in its food consumption carbon emissions.
The impact of energy transition on food transportation emissions is evident from the results. Carbon emissions from the food transportation stage account for a relatively small share—less than 5%—and the growth trend in emissions has been effectively controlled. This finding contrasts with those of previous studies, which have argued that food transportation is a stage in the lifecycle characterized by a rapid increase in carbon emissions, with some cities even witnessing a shift in emissions from storage and processing to transportation [71,72]. The primary reason for this discrepancy is that the present study incorporates the use of new-energy vehicles (NEVs) in food transportation. While the volume of freight transport continues to rise, the gradual adoption of NEVs has significantly mitigated the associated increase in carbon emissions. Carbon emissions from the transportation stage are primarily influenced by freight volume, transportation distance, and mode. A shift from fuel-powered vehicles to electric vehicles is expected to be a key factor in emission reductions. For instance, under the same freight volume, new-energy trucks can reduce carbon emissions by approximately 36% per 100 ton-kilometers compared to diesel trucks. Among the four cities analyzed, Xi’an was the first to adopt new-energy trucks, effectively controlling the growth of transportation-related carbon emissions. While the other three cities have lagged behind in this regard, they have made significant progress in recent years. Transportation distance is largely influenced by the need for intercity transport and the size of the urban area [73,74]. Cities with higher dependence on external food sources generally experience higher transportation-related carbon emissions. For example, Beijing, which produces relatively little food and relies heavily on imports, faces higher transportation emissions. Additionally, the size of urban areas also affects transportation distances. Taiyuan, with the smallest urban area among the four cities, has the shortest intracity food transportation distances. In contrast, Xi’an and Zhengzhou experienced significant increases in transportation distances corresponding to urban expansion in certain years.
The impact of resource recycling is most evident during the food waste disposal stage, where carbon emissions fluctuate significantly, primarily due to continuous updates in waste disposal methods. Key factors influencing emissions in this stage include the proportion of food waste, the transportation distance to waste treatment facilities, and the waste disposal method employed. In Taiyuan, the proportion of food waste is relatively high, at 50%, while the other three cities average around 45%. The transportation distance refers to the intracity route from the city center to the waste treatment facility, which typically does not exceed 100 km, resulting in a relatively minor impact on carbon emissions. In contrast, changes in waste disposal methods have a substantial effect on reducing carbon emissions. The predominant method has gradually shifted from landfill to waste incineration for power generation [75,76]. Traditional sanitary landfill disposal has a carbon emission factor of 612.64 kg CO2e/t, whereas waste incineration for power generation can result in negative emissions, with factors ranging from −100 to −150 kg CO2e/t. This shift significantly mitigates greenhouse gas emissions. For example, Xi’an’s Lantian incineration power generation project and Taiyuan’s Kangheng and Huanjin waste-to-energy plants each process over 2000 t of waste daily, generating up to 400 million kWh of electricity annually. Although Jinan and Zhengzhou are lagging in terms of technology, individual projects in these cities still produce around 250 million kWh annually, and a series of additional projects are currently under rapid development. As waste disposal methods continue to be optimized and improved, carbon emissions in these four cities are steadily decreasing in this stage.
5.2. Future Impacts of Energy Transition and Resource Recycling
This study predicts the carbon emissions from urban food consumption in four provincial capitals along the middle and lower reaches of the Yellow River, considering relevant policies and plans for energy transition and recycling. Scenario analysis was employed to assess the potential future impacts.
In terms of energy transition, optimizing the energy structure was identified as the most effective strategy for carbon reduction. By 2030, the potential for emission reductions in Zhengzhou, Xi’an, Jinan, and Taiyuan under this scenario is estimated to be 21.9%, 17.4%, 20.3%, and 8.4%, respectively. Reducing the carbon emission factor of electricity proves to be more effective for carbon mitigation than promoting new-energy trucks. This is because, while new-energy trucks significantly reduce emissions in the transportation stage, they have a limited effect on the other stages of food consumption, constraining their overall emission reduction potential. In contrast, electricity is involved in both transportation and food storage, offering greater overall potential for carbon reduction. Zhengzhou and Jinan, with cleaner electricity sources than Taiyuan, demonstrate more pronounced emission reduction effects.
Regarding resource recycling, upgrading food waste disposal methods is expected to yield a reduction potential of 2.6%, 2.6%, 3.9%, and 4.4% by 2030 for the four cities, respectively. The reduction potential from food waste reduction is projected to be 6.8%, 6.3%, 8.5%, and 11.0%, respectively. In the short term, upgrading food waste disposal methods, particularly the transition from landfill to waste incineration for power generation, provides significant carbon reductions. This transition can reduce carbon emissions by 741.2–762.8 kg per ton of waste, representing a substantial mitigation potential. However, in the long term, the shift from incineration to anaerobic digestion offers limited carbon reduction benefits, with reductions of only 46.5–69.7 kg per ton of waste, suggesting diminishing returns. Conversely, reducing food waste offers greater long-term carbon reduction benefits. Less food waste leads to fewer emissions from unnecessary transportation, storage, and reprocessing. Therefore, minimizing food waste should be a long-term strategy for achieving substantial and sustained reductions in carbon emissions from food consumption.
6. Conclusions
This study employed LCA to estimate the carbon emissions associated with food consumption in four provincial capital cities along the middle and lower reaches of the Yellow River (Xi’an, Zhengzhou, Jinan, and Taiyuan) from 2006 to 2020. The research identified and examined the key factors influencing carbon emissions at different stages of the food consumption process, quantifying their relative impacts. Additionally, scenario simulations were conducted to evaluate the potential effects of energy structure transformation and resource recycling on future food consumption carbon emissions in these cities. The key findings are as follows.
Following the energy transition and recycling initiatives, carbon emissions from food consumption began to decline after 2016, primarily driven by an increased share of resource recovery in waste incineration. Xi’an, with its more advanced waste-to-energy technology, achieved a 77.5% reduction in carbon emissions from waste disposal between 2016 and 2020. Conversely, Zhengzhou, with its relatively less-developed recycling infrastructure, saw a smaller reduction of only 30.4%.
The growing adoption of new-energy vehicles in the food transportation sector has contributed to a reduction in transportation-related carbon emissions. While urban expansion and increased food consumption initially led to higher emissions in all four cities, the gradual transition to electric freight vehicles since 2018 has helped curb the growth in transportation emissions. By 2030, food transportation emissions in Zhengzhou, Xi’an, Jinan, and Taiyuan are projected to decrease by 39.4%, 34.5%, 39.4%, and 24.0%, respectively. Moreover, the shift toward cleaner electricity sources is expected to further reduce carbon emissions in the food storage stage. In regions such as Taiyuan and Xi’an, where coal is the dominant energy source, higher-carbon-emission factors for electricity contribute to elevated food storage emissions. In contrast, Jinan and Zhengzhou, which are transitioning to renewable energy, are projected to experience lower food storage emissions. By 2030, food storage emissions in these cities are expected to decline by 42.5%, 31.3%, 42.5%, and 15%, respectively.
Waste incineration for power generation offers a significant advantage over traditional landfilling when it comes to reducing carbon emissions from food waste disposal. Between 2021 and 2025, it is anticipated that all four cities will achieve zero landfill use for municipal solid waste, with 100% of waste processed through waste-to-energy technologies. From 2026 to 2030, some waste will be diverted to cleaner anaerobic digestion methods. By 2030, carbon emissions from food waste disposal in Zhengzhou, Xi’an, Jinan, and Taiyuan are expected to be 33.5%, 27.7%, 31.7%, and 31.7% lower, respectively. Furthermore, reducing food waste will lower carbon emissions throughout the entire food consumption process, including during transportation, storage, and waste disposal. By 2030, the reduction in food waste is expected to decrease carbon emissions from food consumption by 6.8%, 6.3%, 8.5%, and 11.0% in Zhengzhou, Xi’an, Jinan, and Taiyuan, respectively.
This study focuses on analyzing the carbon emissions of food consumption as an integrated system, examining key stages such as transportation, storage, cooking, and waste disposal. While this approach provides valuable insights into the downstream processes of food consumption, there are certain limitations that warrant further exploration.
First, this study places less emphasis on the detailed comparison of carbon emissions across different food types. While transportation and cooking emissions were calculated based on food-specific characteristics, storage and waste disposal emissions were estimated using general coefficients unrelated to specific food categories. Future research could address this limitation by integrating food-specific characteristics across all lifecycle stages to provide a more comprehensive understanding of the carbon footprints of different food types. Second, emissions from food processing activities, such as the post-harvest handling of fruits and vegetables, were not included in this study. These processes are more closely associated with the production phase and were therefore beyond the defined scope of this analysis. Future studies could explore the integration of production-related processes with consumption stages to create a more holistic framework for assessing carbon emissions across the entire food supply chain. Such an approach would provide deeper insights into the synergies and differences between the production and consumption phases, thereby improving the comprehensiveness and accuracy of lifecycle assessments. Finally, this study highlights the importance of decarbonization and resource recycling in achieving sustainable food systems. Future research could focus on integrating advanced technologies, such as renewable energy (e.g., solar and wind power) and circular resource management (e.g., anaerobic digestion and composting for food waste), to further reduce emissions across all stages of the food lifecycle. Such efforts could provide targeted strategies to optimize carbon reduction while enhancing resource efficiency.
Author Contributions
Conceptualization, G.L. and H.F.; methodology, H.F.; software, H.F.; validation, S.T. and Y.W.; formal analysis, H.F.; investigation, G.L.; resources, C.Z.; data curation, W.X.; writing—original draft preparation, H.F; writing—review and editing, G.L.; visualization, S.T.; supervision, Y.W.; funding acquisition, W.L. and G.L. All authors have read and agreed to the published version of the manuscript.
Funding
G.L. is supported by the National Youth Science Fund Project of China (Grant No. 72104172) and W.L. is supported by the National Natural Science Foundation of China (Grant No. 72174137).
Institutional Review Board Statement
Not applicable.
Informed Consent Statement
Not applicable.
Data Availability Statement
Data will be made available on request.
Conflicts of Interest
The authors declare no conflicts of interest.
References
- Kabeyi, M.J.B.; Olanrewaju, O.A. Sustainable Energy Transition for Renewable and Low Carbon Grid Electricity Generation and Supply. Front. Energy Res. 2022, 9, 743114. [Google Scholar] [CrossRef]
- Quitzow, R. Energy Transitions and Societal Change. Berliner Strasse, Germany: Institute of Advanced Sustainability Studies. Available online: https://www.iass-potsdam.de/en/research-area/energy-systems-and-societal-change (accessed on 10 November 2021).
- Bashir, M.A.; Zhang, D.F.; Amin, F.; Mentel, G.; Raza, S.A.; Bashir, M.F. Transition to greener electricity and resource use impact on environmental quality: Policy based study from OECD countries. Util. Policy 2023, 81, 101518. [Google Scholar] [CrossRef]
- International Energy Agency (IEA). Major Growth of Clean Energy Limited The rise in Global Emissions in 2023. Available online: https://www.iea.org/news/major-growth-of-clean-energy-limited-the-rise-in-global-emissions-in-2023 (accessed on 15 April 2024).
- He, M.Y.; Sun, Y.H.; Han, B.X. Green Carbon Science: Efficient Carbon Resource Processing, Utilization, and Recycling towards Carbon Neutrality. Angew. Chem. Int. Ed. 2022, 61, e202112835. [Google Scholar] [CrossRef]
- Ferdous, W.; Manalo, A.; Siddique, R.; Mendis, P.; Yan, Z.G.; Wong, H.S.; Lokuge, W.; Aravinthan, T.; Schubel, P. Recycling of landfill wastes (tyres, plastics and glass) in construction—A review on global waste generation, performance, application and future opportunities. Resour. Conserv. Recycl. 2021, 173, 105745. [Google Scholar] [CrossRef]
- The World Counts. The Amount of Household Waste. Available online: https://www.theworldcounts.com/challenges/planet-earth/state-of-the-planet/solid-waste (accessed on 21 November 2021).
- Niles, M.T.; Ahuja, R.; Barker, T.; Esquivel, J.; Gutterman, S.; Heller, M.C.; Mango, N.; Portner, D.; Raimond, R.; Tirado, C.; et al. Climate change mitigation beyond agriculture: A review of food system opportunities and implications. Renew. Agric. Food Syst. 2018, 33, 297–308. [Google Scholar] [CrossRef]
- Qu, J.S.; Liu, L.N.; Zeng, J.J.; Zhang, Z.Q.; Wang, J.P.; Pei, H.J.; Dong, L.P.; Liao, Q.; Maraseni, T. The impact of income on household CO2 emissions in China based on a large sample survey. Sci. Bull. 2019, 64, 351–353. [Google Scholar] [CrossRef]
- Song, L.; Cai, H.; Zhu, T. Large-Scale Microanalysis of US Household Food Carbon Footprints and Reduction Potentials. Environ. Sci. Technol. 2021, 55, 15323–15332. [Google Scholar] [CrossRef] [PubMed]
- Batlle-Bayer, L.; Bala, A.; Albertí, J.; Xifré, R.; Aldaco, R.; Fullana-i-Palmer, P. Food affordability and nutritional values within the functional unit of a food LCA. An application on regional diets in Spain. Resour. Conserv. Recycl. 2020, 160, 104856. [Google Scholar] [CrossRef]
- Stylianou, K.S.; Fulgoni, V.L.; Jolliet, O. Small targeted changes can yield substantial gains for human health and the environment. Nat. Food 2021, 2, 743. [Google Scholar] [CrossRef]
- Sundin, N.; Rosell, M.; Eriksson, M.; Jensen, C.; Bianchi, M. The climate impact of excess food intake—An avoidable environmental burden. Resour. Conserv. Recycl. 2021, 174, 105777. [Google Scholar] [CrossRef]
- Teixeira, A.C.R.; Sodré, J.R. Impacts of replacement of engine powered vehicles by electric vehicles on energy consumption and CO2 emissions. Transp. Res. Part D Transp. Environ. 2018, 59, 375–384. [Google Scholar] [CrossRef]
- Xu, B.J.; Sharif, A.; Shahbaz, M.; Dong, K.Y. Have electric vehicles effectively addressed CO2 emissions? Analysis of eight leading countries using quantile-on-quantile regression approach. Sustain. Prod. Consum. 2021, 27, 1205–1214. [Google Scholar] [CrossRef]
- Ang, B.W.; Su, B. Carbon emission intensity in electricity production: A global analysis. Energy Policy 2016, 94, 56–63. [Google Scholar] [CrossRef]
- Chen, A.Q.; You, S.B. The Fuel Cycle Carbon Reduction Effects of New Energy Vehicles: Empirical Evidence Based on Regional Data in China. Sustainability 2022, 14, 16003. [Google Scholar] [CrossRef]
- Lin, B.Q.; Qiao, Q. Exploring the participation willingness and potential carbon emission reduction of Chinese residential green electricity market. Energy Policy 2023, 174, 113452. [Google Scholar] [CrossRef]
- Chien, F.; Sadiq, M.; Li, L.; Sharif, A. The role of sustainable energy utility, natural resource utilization and waste management in reducing energy poverty: Evidence from South Asian countries. Util. Policy 2023, 82, 101581. [Google Scholar] [CrossRef]
- Iqbal, A.; Zan, F.X.; Liu, X.M.; Chen, G.H. Net zero greenhouse emissions and energy recovery from food waste: Manifestation from modelling a city-wide food waste management plan. Water Res. 2023, 244, 120481. [Google Scholar] [CrossRef] [PubMed]
- Tian, H.L.; Ee, A.W.L.; Yan, M.; Tiong, Y.W.; Tan, W.X.; Tan, Q.; Lam, H.T.; Zhang, J.X.; Tong, Y.W. Life cycle assessment and cost-benefit analysis of small-scale anaerobic digestion system treating food waste onsite under different operational conditions. Bioresour. Technol. 2023, 390, 129902. [Google Scholar] [CrossRef]
- Brunner, P.H.; Rechberger, H. Waste to energy—Key element for sustainable waste management. Waste Manag. 2015, 37, 3–12. [Google Scholar] [CrossRef] [PubMed]
- Dutta, S.; He, M.J.; Xiong, X.N.; Tsang, D.C.W. Sustainable management and recycling of food waste anaerobic digestate: A review. Bioresour. Technol. 2021, 341, 125915. [Google Scholar] [CrossRef]
- Tian, M.J.; Chen, Z.; Wang, W.; Chen, T.Z.; Cui, H.Y. Land-Use Carbon Emissions in the Yellow River Basin from 2000 to 2020: Spatio-Temporal Patterns and Driving Mechanisms. Int. J. Environ. Res. Public Health 2022, 19, 16507. [Google Scholar] [CrossRef] [PubMed]
- Wang, D.; Liu, Y.; Cheng, Y. Effects and Spatial Spillover of Manufacturing Agglomeration on Carbon Emissions in the Yellow River Basin, China. Sustainability 2023, 15, 9386. [Google Scholar] [CrossRef]
- Wang, Q.; Chen, S.W.; Qu, T.T. Differences in Carbon Intensity of Energy Consumption and Influential Factors between Yangtze River Economic Belt and Yellow River Basin. Sustainability 2024, 16, 2363. [Google Scholar] [CrossRef]
- Liu, C.J.; Zhai, X.W.; Ai, K.Y. Ecological Safety Assessment and Convergence of Resource-Based Cities in the Yellow River Basin. Sustainability 2024, 16, 2983. [Google Scholar] [CrossRef]
- Li, X.; Ouyang, Z.G.; Zhang, Q.; Shang, W.L.; Huang, L.Q.; Wu, Y.; Gao, Y.N. Evaluating food supply chain emissions from Japanese household consumption. Appl. Energy 2022, 306, 118080. [Google Scholar] [CrossRef]
- Li, M.Y.; Jia, N.F.; Lenzen, M.; Malik, A.; Wei, L.Y.; Jin, Y.T.; Raubenheimer, D. Global food-miles account for nearly 20% of total food-systems emissions. Nat. Food 2022, 3, 445–453. [Google Scholar] [CrossRef]
- Lin, D.S.; Zhang, Z.Y.; Wang, J.X.; Yang, L.; Shi, Y.Q.; Soar, E. Optimizing Urban Distribution Routes for Perishable Foods Considering Carbon Emission Reduction. Sustainability 2019, 11, 4387. [Google Scholar] [CrossRef]
- Lin, B.Q.; Guan, C.X. Assessing consumption-based carbon footprint of China’s food industry in global supply chain. Sustain. Prod. Consum. 2023, 35, 365–375. [Google Scholar] [CrossRef]
- Boehm, R.; Wilde, P.E.; Ver Ploeg, M.; Costello, C.; Cash, S.B. A Comprehensive Life Cycle Assessment of Greenhouse Gas Emissions from US Household Food Choices. Food Policy 2018, 79, 67–76. [Google Scholar] [CrossRef]
- Jiang, L.; Wang, R.; Liu, B. Differences in carbon footprint of food consumption patterns. China Environ. Sci. 2023, 43, 6755–6762. [Google Scholar] [CrossRef]
- Bell, E.M.; Horvath, A. Modeling the carbon footprint of fresh produce: Effects of transportation, localness, and seasonality on US orange markets. Environ. Res. Lett. 2020, 15, 034040. [Google Scholar] [CrossRef]
- Liu, B.; Li, J.W.; Chen, A.Q.; Theodorakis, P.E.; Zhu, Z.S.; Yu, J.Z. Selection of the cold logistics model based on the carbon footprint of fruits and vegetables in China. J. Clean. Prod. 2022, 334, 130251. [Google Scholar] [CrossRef]
- Zuo, C.C.; Wen, C.; Clarke, G.; Turner, A.; Ke, X.L.; You, L.Z.; Tang, L.P. Cropland displacement contributed 60% of the increase in carbon emissions of grain transport in China over 1990–2015. Nat. Food 2023, 4, 223–235. [Google Scholar] [CrossRef] [PubMed]
- Dong, J.S.; Li, Y.M.; Li, W.X.; Liu, S.Z. CO2 Emission Reduction Potential of Road Transport to Achieve Carbon Neutrality in China. Sustainability 2022, 14, 5454. [Google Scholar] [CrossRef]
- Ercan, T.; Onat, N.C.; Keya, N.; Tatari, O.; Eluru, N.; Kucukvar, M. Autonomous electric vehicles can reduce carbon emissions and air pollution in cities. Transp. Res. Part D Transp. Environ. 2022, 112, 103472. [Google Scholar] [CrossRef]
- Guo, X.; Sun, Y.; Ren, D. Life cycle carbon emission and cost-effectiveness analysis of electric vehicles in China. Energy Sustain. Dev. 2023, 72, 1–10. [Google Scholar] [CrossRef]
- Arrieta, E.M.; González, A.D. Energy and carbon footprints of food: Investigating the effect of cooking. Sustain. Prod. Consum. 2019, 19, 44–52. [Google Scholar] [CrossRef]
- Du, S.; Liu, G.Y.; Li, H.; Zhang, W.; Santagata, R. System dynamic analysis of urban household food-energy-water nexus in Melbourne (Australia). J. Clean. Prod. 2022, 379, 134675. [Google Scholar] [CrossRef]
- Zhao, Z.; Lv, X.Y.; Wang, Y.H.; Lv, G.F.; Miao, B.; Hu, Q.; Ouyang, C.; Liu, Y.K.; Yan, L.H. Research on carbon emissions of urban residents’ three types of dining based on the whole life cycle. Int. J. Low-Carbon Technol. 2022, 17, 1036–1045. [Google Scholar] [CrossRef]
- Esteve-Llorens, X.; Darriba, C.; Moreira, M.T.; Feijoo, G.; González-García, S. Towards an environmentally sustainable and healthy Atlantic dietary pattern: Life cycle carbon footprint and nutritional quality. Sci. Total Environ. 2019, 646, 704–715. [Google Scholar] [CrossRef] [PubMed]
- Frankowska, A.; Rivera, X.S.; Bridle, S.; Kluczkovski, A.M.R.G.; da Silva, J.T.; Martins, C.A.; Rauber, F.; Levy, R.B.; Cook, J.; Reynolds, C. Impacts of home cooking methods and appliances on the GHG emissions of food. Nat. Food 2020, 1, 787–791. [Google Scholar] [CrossRef] [PubMed]
- Pelletier, N.; Audsley, E.; Brodt, S.; Garnett, T.; Henriksson, P.; Kendall, A.; Kramer, K.J.; Murphy, D.; Nemecek, T.; Troell, M. Energy Intensity of Agriculture and Food Systems. Annu. Rev. Environ. Resour. 2011, 36, 223–246. [Google Scholar] [CrossRef]
- Chen, Y.; Li, S.Z.; Zhou, T.T.; Lei, X.Y.; Liu, X.Y.; Wang, Y.H. Household cooking energy transition in rural mountainous areas of China: Characteristics, drivers, and effects. J. Clean. Prod. 2023, 385, 135728. [Google Scholar] [CrossRef]
- Xing, R.; Luo, Z.H.; Zhang, W.X.; Xiong, R.; Jiang, K.; Meng, W.J.; Meng, J.; Dai, H.C.; Xue, B.; Shen, H.Z.; et al. Household fuel and direct carbon emission disparity in rural China. Environ. Int. 2024, 185, 108549. [Google Scholar] [CrossRef]
- Corrado, S.; Luzzani, G.; Trevisan, M.; Lamastra, L. Contribution of different life cycle stages to the greenhouse gas emissions associated with three balanced dietary patterns. Sci. Total Environ. 2019, 660, 622–630. [Google Scholar] [CrossRef] [PubMed]
- Guo, X.P.; Yang, X.Y. The economic and environmental benefits analysis for food waste anaerobic treatment: A case study in Beijing. Environ. Sci. Pollut. Res. 2019, 26, 10374–10386. [Google Scholar] [CrossRef]
- Zhang, H.; Zhao, F.Q.; Hao, H.; Liu, Z.W. Comparative analysis of life cycle greenhouse gas emission of passenger cars: A case study in China. Energy 2023, 265, 126282. [Google Scholar] [CrossRef]
- Avató, J.L.; Mannheim, V. Life Cycle Assessment Model of a Catering Product: Comparing Environmental Impacts for Different End-of-Life Scenarios. Energies 2022, 15, 5423. [Google Scholar] [CrossRef]
- Djekic, I.; Pojic, M.; Tonda, A.; Putnik, P.; Kovacevic, D.B.; Rezek-Jambrak, A.; Tomasevic, I. Scientific Challenges in Performing Life-Cycle Assessment in the Food Supply Chain. Foods 2019, 8, 301. [Google Scholar] [CrossRef] [PubMed]
- Vidergar, P.; Perc, M.; Lukman, R.K. A survey of the life cycle assessment of food supply chains. J. Clean. Prod. 2021, 286, 125506. [Google Scholar] [CrossRef]
- Vázquez-Rowe, I.; Ziegler-Rodriguez, K.; Margallo, M.; Kahhat, R.; Aldaco, R. Climate action and food security: Strategies to reduce GHG emissions from food loss and waste in emerging economies. Resour. Conserv. Recycl. 2021, 170, 105562. [Google Scholar] [CrossRef]
- Zeng, Q.; Zhen, S.L.; Liu, J.G.; Ni, Z.; Chen, J.; Liu, Z.J.; Qi, C.Q. Impact of solid digestate processing on carbon emission of an industrial-scale food waste co-digestion plant. Bioresour. Technol. 2022, 360, 127639. [Google Scholar] [CrossRef]
- Yan, Z.; Cui, S.; Li, G.; Ren, Y.; Xu, L. Dynamics and Environmental Load of Food Carbon Consumption During Urbanization: A Case Study of Xiamen City, China. Environ. Sci. 2013, 34, 1636–1644. [Google Scholar] [CrossRef]
- Du, J.; Zhou, C.C.; Zhang, Y.L.; Shen, H.X.; Wu, W.T.; Liu, G.J. Physical-Chemical Properties of Municipal Solid Waste and the Implication for Urban Management on Greenhouse Gas Emissions: A Case Study in Hefei, China. ACS Sustain. Chem. Eng. 2022, 10, 11692–11701. [Google Scholar] [CrossRef]
- Maalouf, A.; El-Fadel, M. Carbon footprint of integrated waste management systems with implications of food waste diversion into the wastewater stream. Resour. Conserv. Recycl. 2018, 133, 263–277. [Google Scholar] [CrossRef]
- Zhu, J.Y.; Liu, Y.R.; Luo, Z.Y.; Ling, C.; Yin, K.; Tong, H.H. Methane mitigation strategy for food waste management: Balancing socio-economic acceptance and environmental impacts. Sustain. Prod. Consum. 2023, 37, 389–397. [Google Scholar] [CrossRef]
- Bian, R.X.; Chen, J.H.; Zhang, T.X.; Gao, C.Q.; Niu, Y.T.; Sun, Y.J.; Zhan, M.L.; Zhao, F.B.; Zhang, G.D. Influence of the classification of municipal solid wastes on the reduction of greenhouse gas emissions: A case study of Qingdao City, China. J. Clean. Prod. 2022, 376, 134275. [Google Scholar] [CrossRef]
- Chen, S.S.; Huang, J.L.; Xiao, T.T.; Gao, J.; Bai, J.F.; Luo, W.; Dong, B. Carbon emissions under different domestic waste treatment modes induced by garbage classification: Case study in pilot communities in Shanghai, China. Sci. Total Environ. 2020, 717, 137193. [Google Scholar] [CrossRef]
- Cucurachi, S.; Scherer, L.; Guinée, J.; Tukker, A. Life Cycle Assessment of Food Systems. One Earth 2019, 1, 292–297. [Google Scholar] [CrossRef]
- Notarnicola, B.; Sala, S.; Anton, A.; McLaren, S.J.; Saouter, E.; Sonesson, U. The role of life cycle assessment in supporting sustainable agri-food systems: A review of the challenges. J. Clean. Prod. 2017, 140, 399–409. [Google Scholar] [CrossRef]
- He, J.; Liu, Y.; Li, Z.; Qiu, Z. Energy Consumption Analysis of Municipal Solid Waste Classified Transportation. Environ. Eng. 2021, 39, 136–142. [Google Scholar] [CrossRef]
- Zhang, L.; Li, G.; Luo, W.; Yuan, J. Study on the Composition Characteristics and Classification of MSW in Different Functional Zones in Beijing Urban and Rural. Environ. Sanit. Eng. 2020, 28, 15–21. [Google Scholar] [CrossRef]
- Chen, L.; He, Z.W.; Yang, L.X.; Wang, L.; Li, Y.Y.; Chen, T.; Li, H. Optimal utilization of solid residue from phase-separation pretreatment before food waste anaerobic digestion. J. Clean. Prod. 2022, 372, 133795. [Google Scholar] [CrossRef]
- Guo, H.W.; Xu, H.Y.; Liu, J.G.; Nie, X.Q.; Li, X.; Shu, T.C.; Bai, B.J.; Ma, X.Y.; Yao, Y. Greenhouse Gas Emissions in the Process of Landfill Disposal in China. Energies 2022, 15, 6711. [Google Scholar] [CrossRef]
- Wang, Y.; Yan, Y.Y.; Chen, G.Y.; Zuo, J.; Du, H.B. Effective approaches to reduce greenhouse gas emissions from waste to energy process: A China study. Resour. Conserv. Recycl. 2015, 104, 103–108. [Google Scholar] [CrossRef]
- Crippa, M.; Solazzo, E.; Guizzardi, D.; Monforti-Ferrario, F.; Tubiello, F.N.; Leip, A. Food systems are responsible for a third of global anthropogenic GHG emissions. Nat. Food 2021, 2, 198–209. [Google Scholar] [CrossRef]
- Mohareb, E.A.; Heller, M.C.; Guthrie, P.M. Cities’ Role in Mitigating United States Food System Greenhouse Gas Emissions. Environ. Sci. Technol. 2018, 52, 5545–5554. [Google Scholar] [CrossRef]
- Pradhan, P. Food transport emissions matter. Nat. Food 2022, 3, 406–407. [Google Scholar] [CrossRef]
- Tubiello, F.N.; Rosenzweig, C.; Conchedda, G.; Karl, K.; Gütschow, J.; Pan, X.Y.; Obli-Laryea, G.; Wanner, N.; Qiu, S.Y.; De Barros, J.; et al. Greenhouse gas emissions from food systems: Building the evidence base. Environ. Res. Lett. 2021, 16, 065007. [Google Scholar] [CrossRef]
- Mosammam, H.M.; Sarrafi, M.; Nia, J.T.; Mosammam, A.M. Analyzing the international trade-related food miles in Iran. Outlook Agric. 2018, 47, 36–43. [Google Scholar] [CrossRef]
- Yu, Q.Y.; Wu, W.B.; Tang, H.J. Increased food-miles and transport emissions. Nat. Food 2023, 4, 207–208. [Google Scholar] [CrossRef]
- Kumar, A.; Samadder, S.R. Assessment of energy recovery potential and analysis of environmental impacts of waste to energy options using life cycle assessment. J. Clean. Prod. 2022, 365, 132854. [Google Scholar] [CrossRef]
- Zhao, Y.; Chang, H.M.; Liu, X.; Bisinella, V.; Christensen, T.H. Climate Change Impact of the Development in Household Waste Management in China. Environ. Sci. Technol. 2022, 56, 8993–9002. [Google Scholar] [CrossRef] [PubMed]
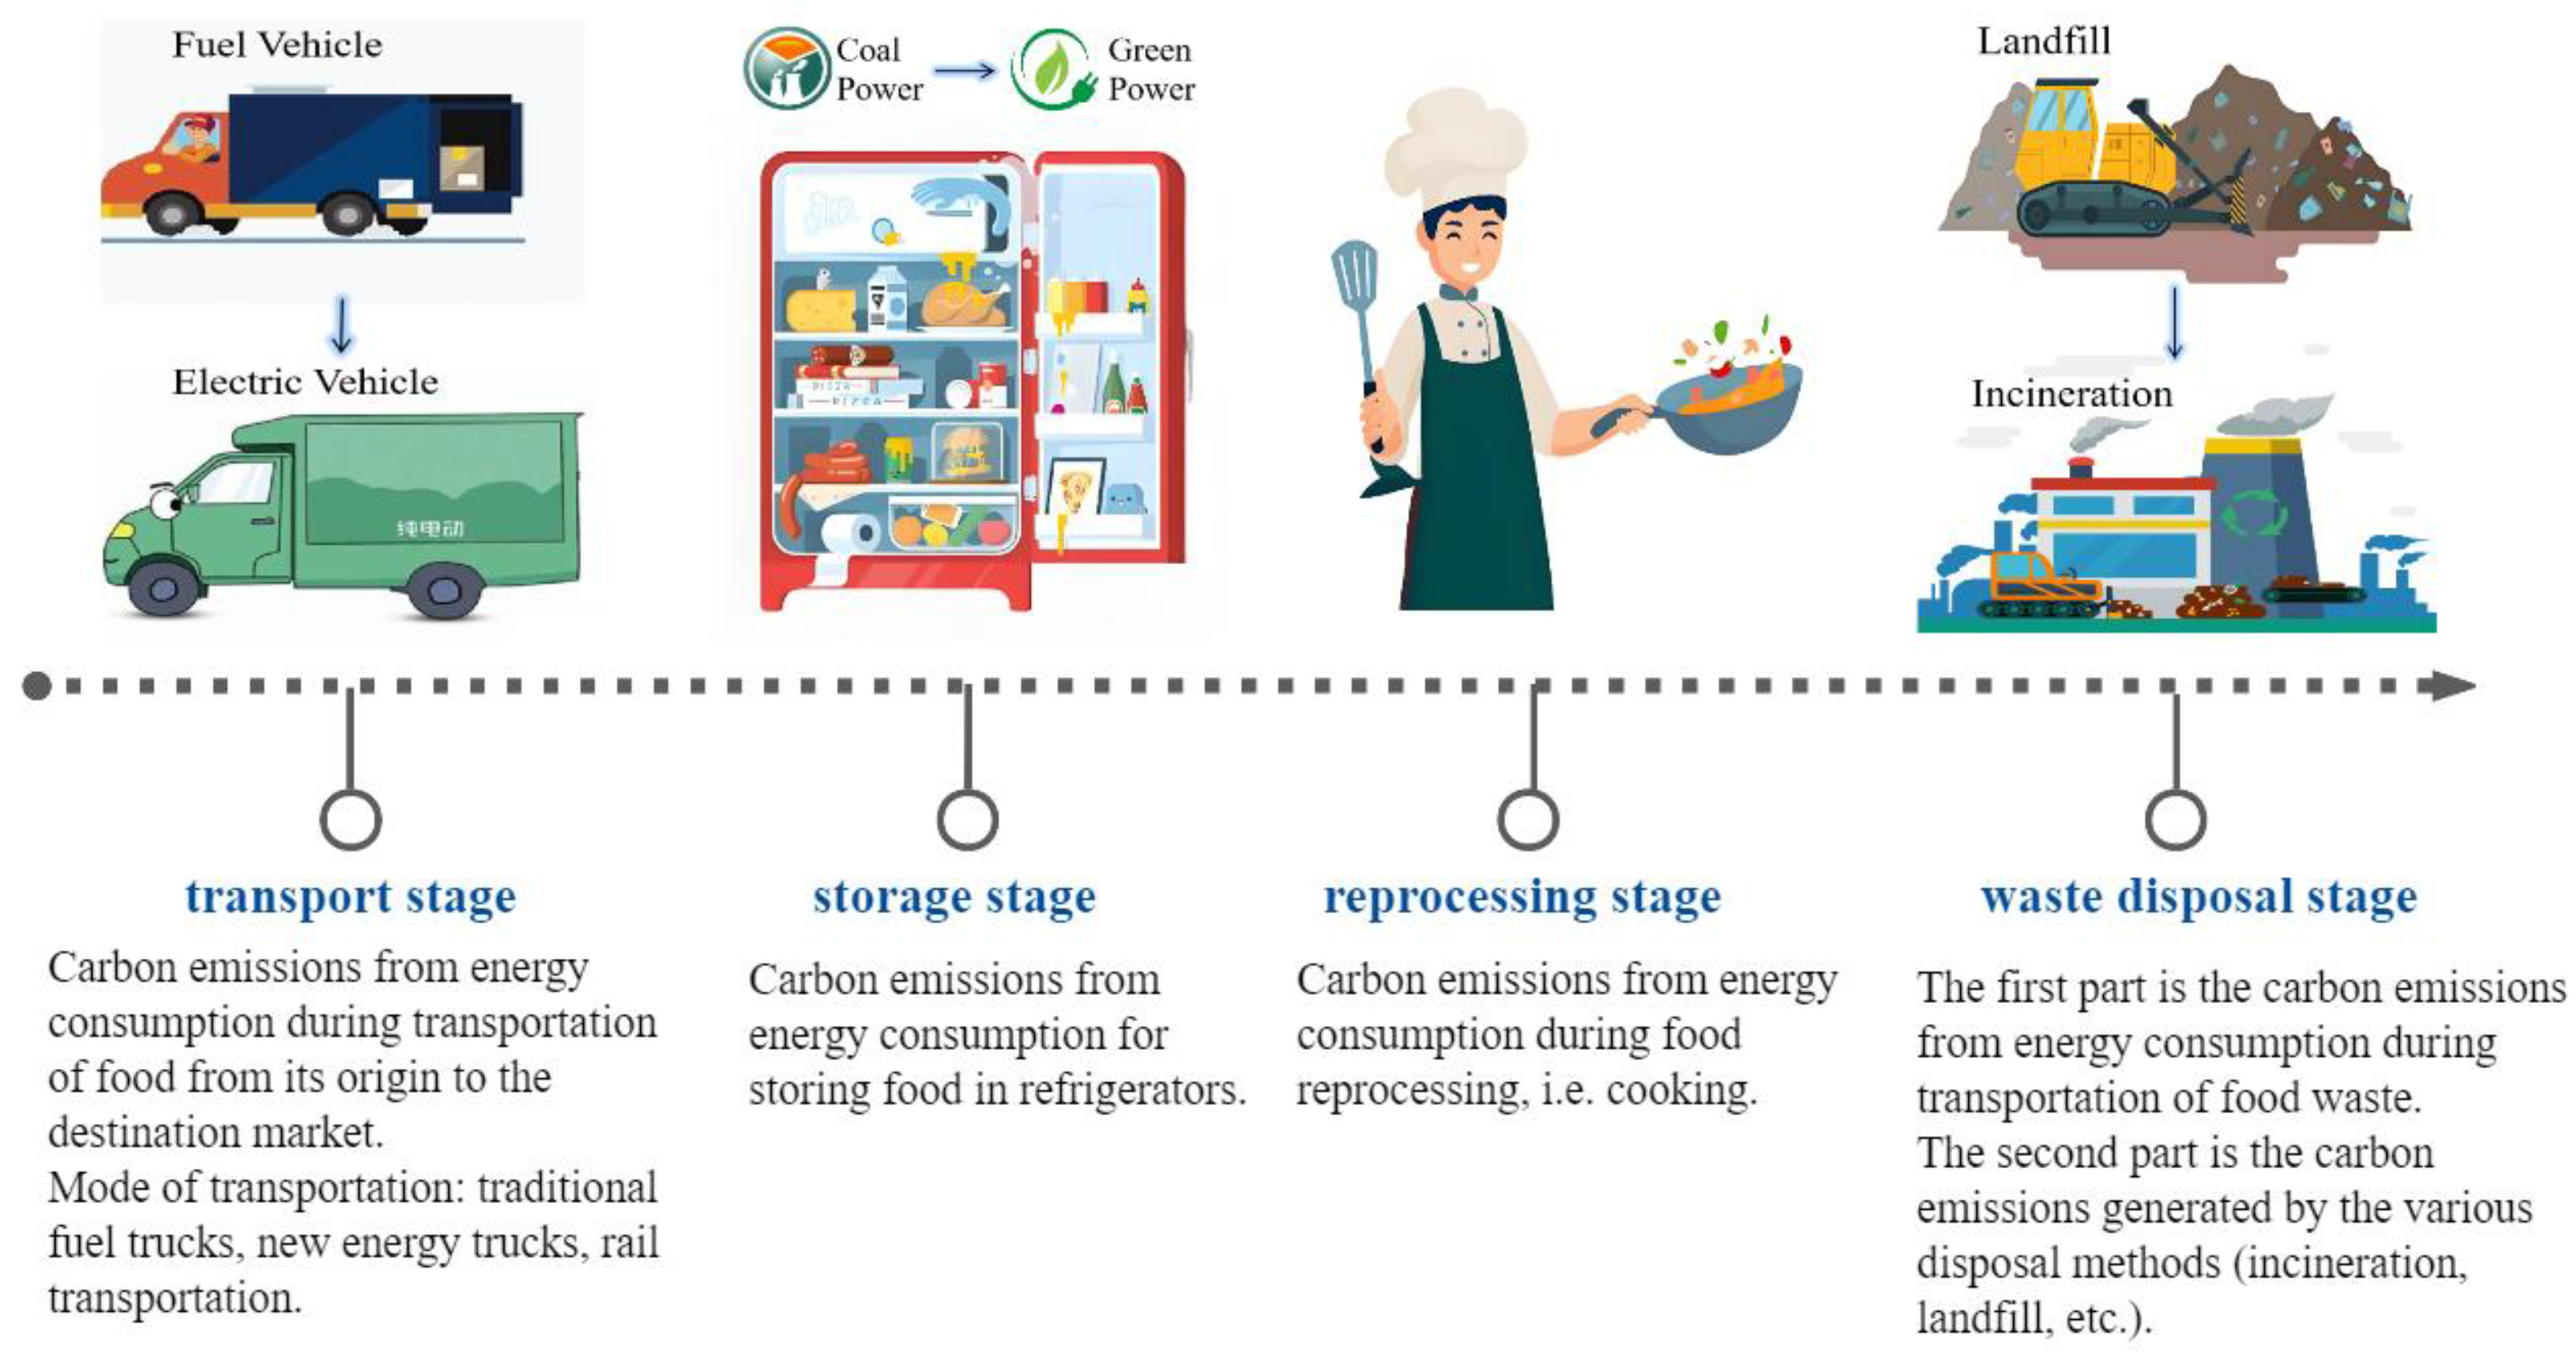
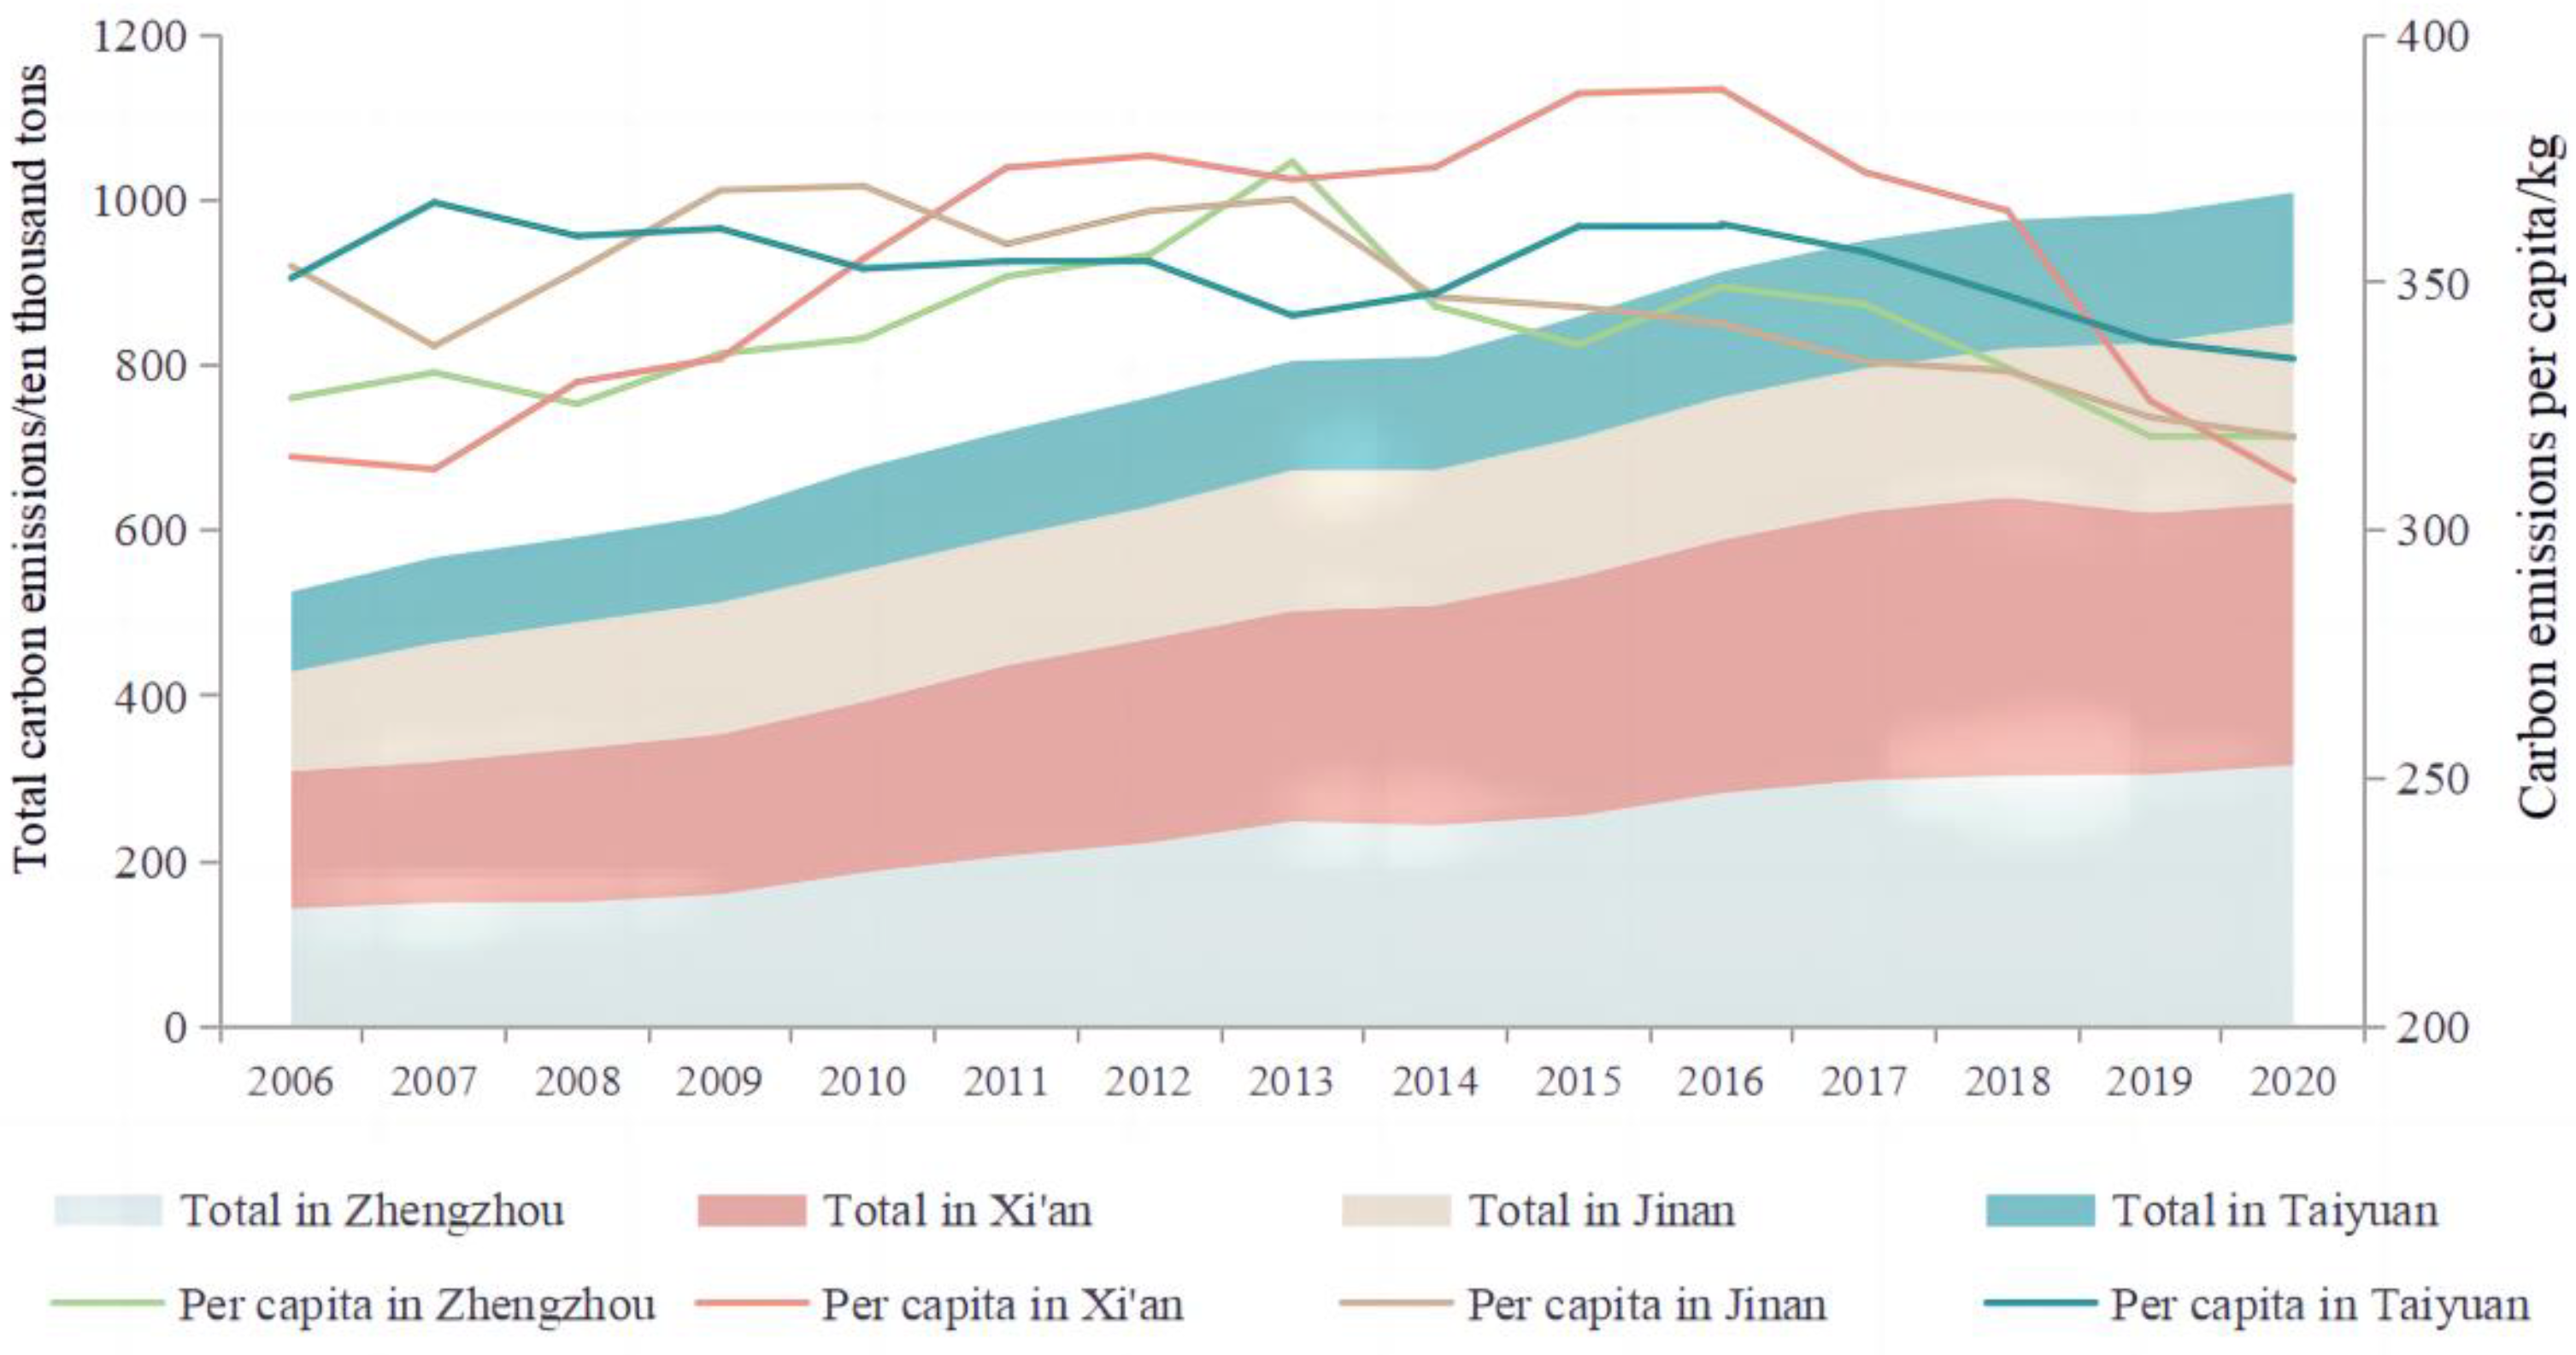
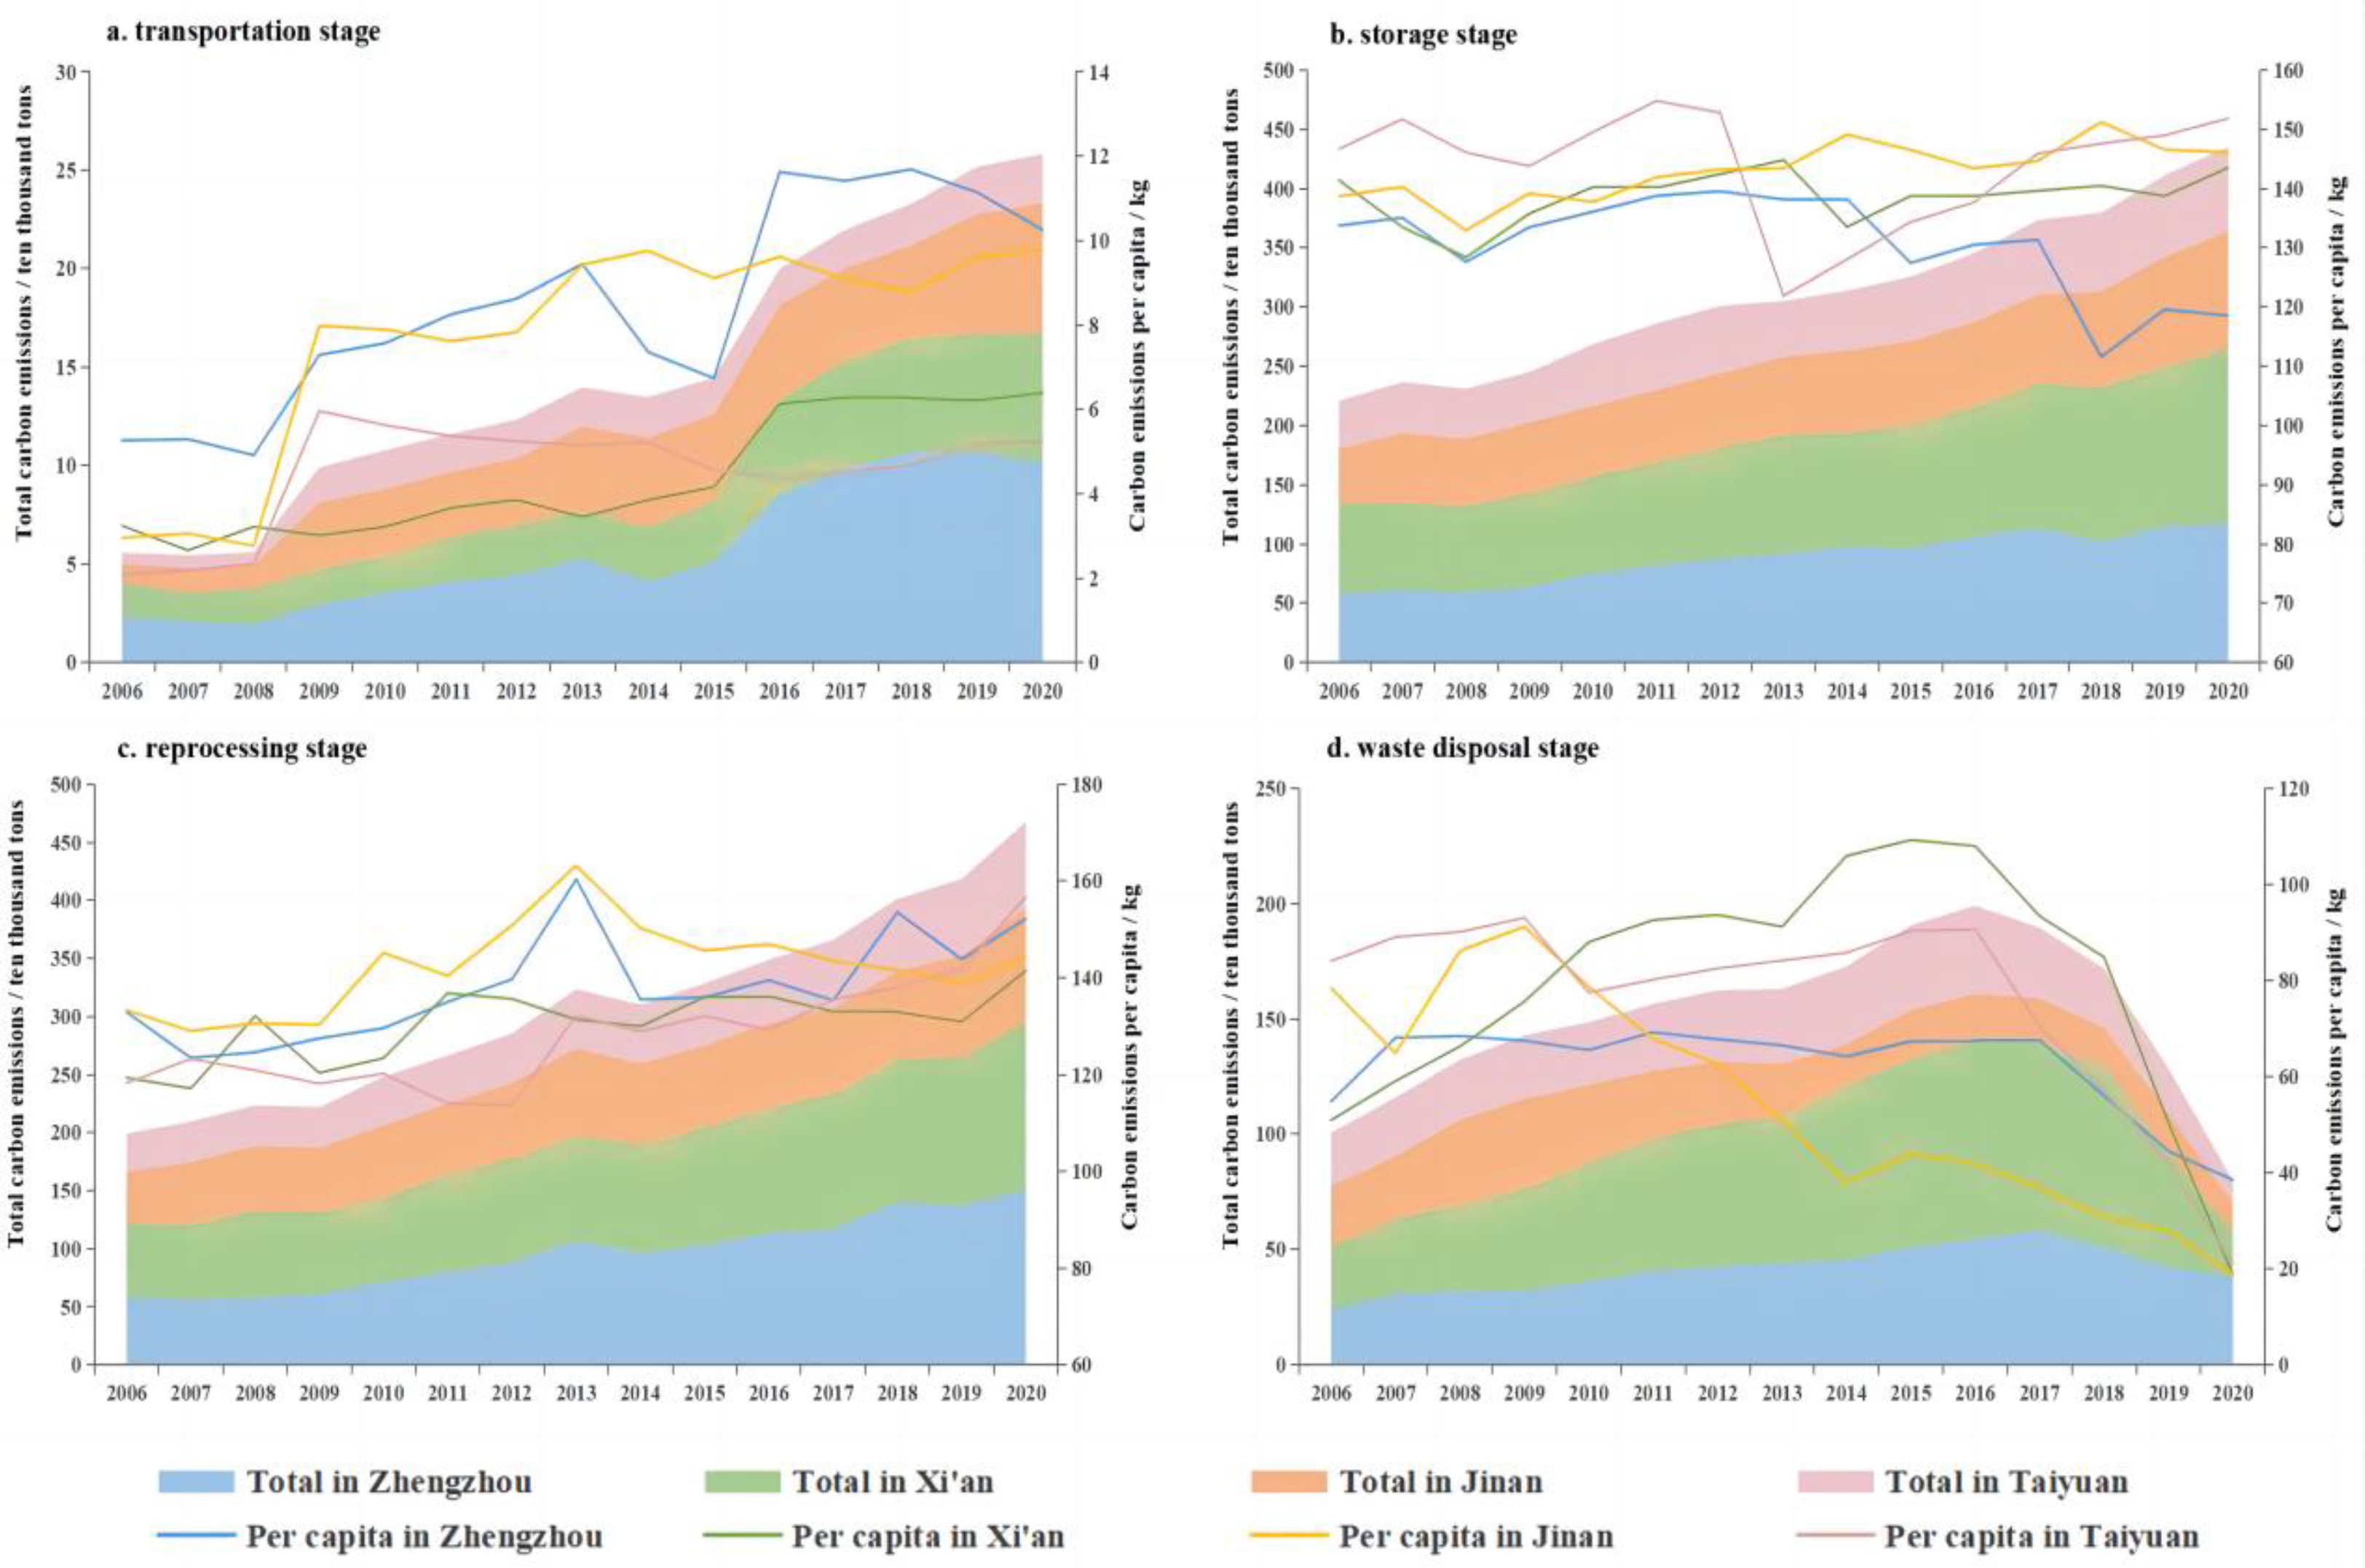
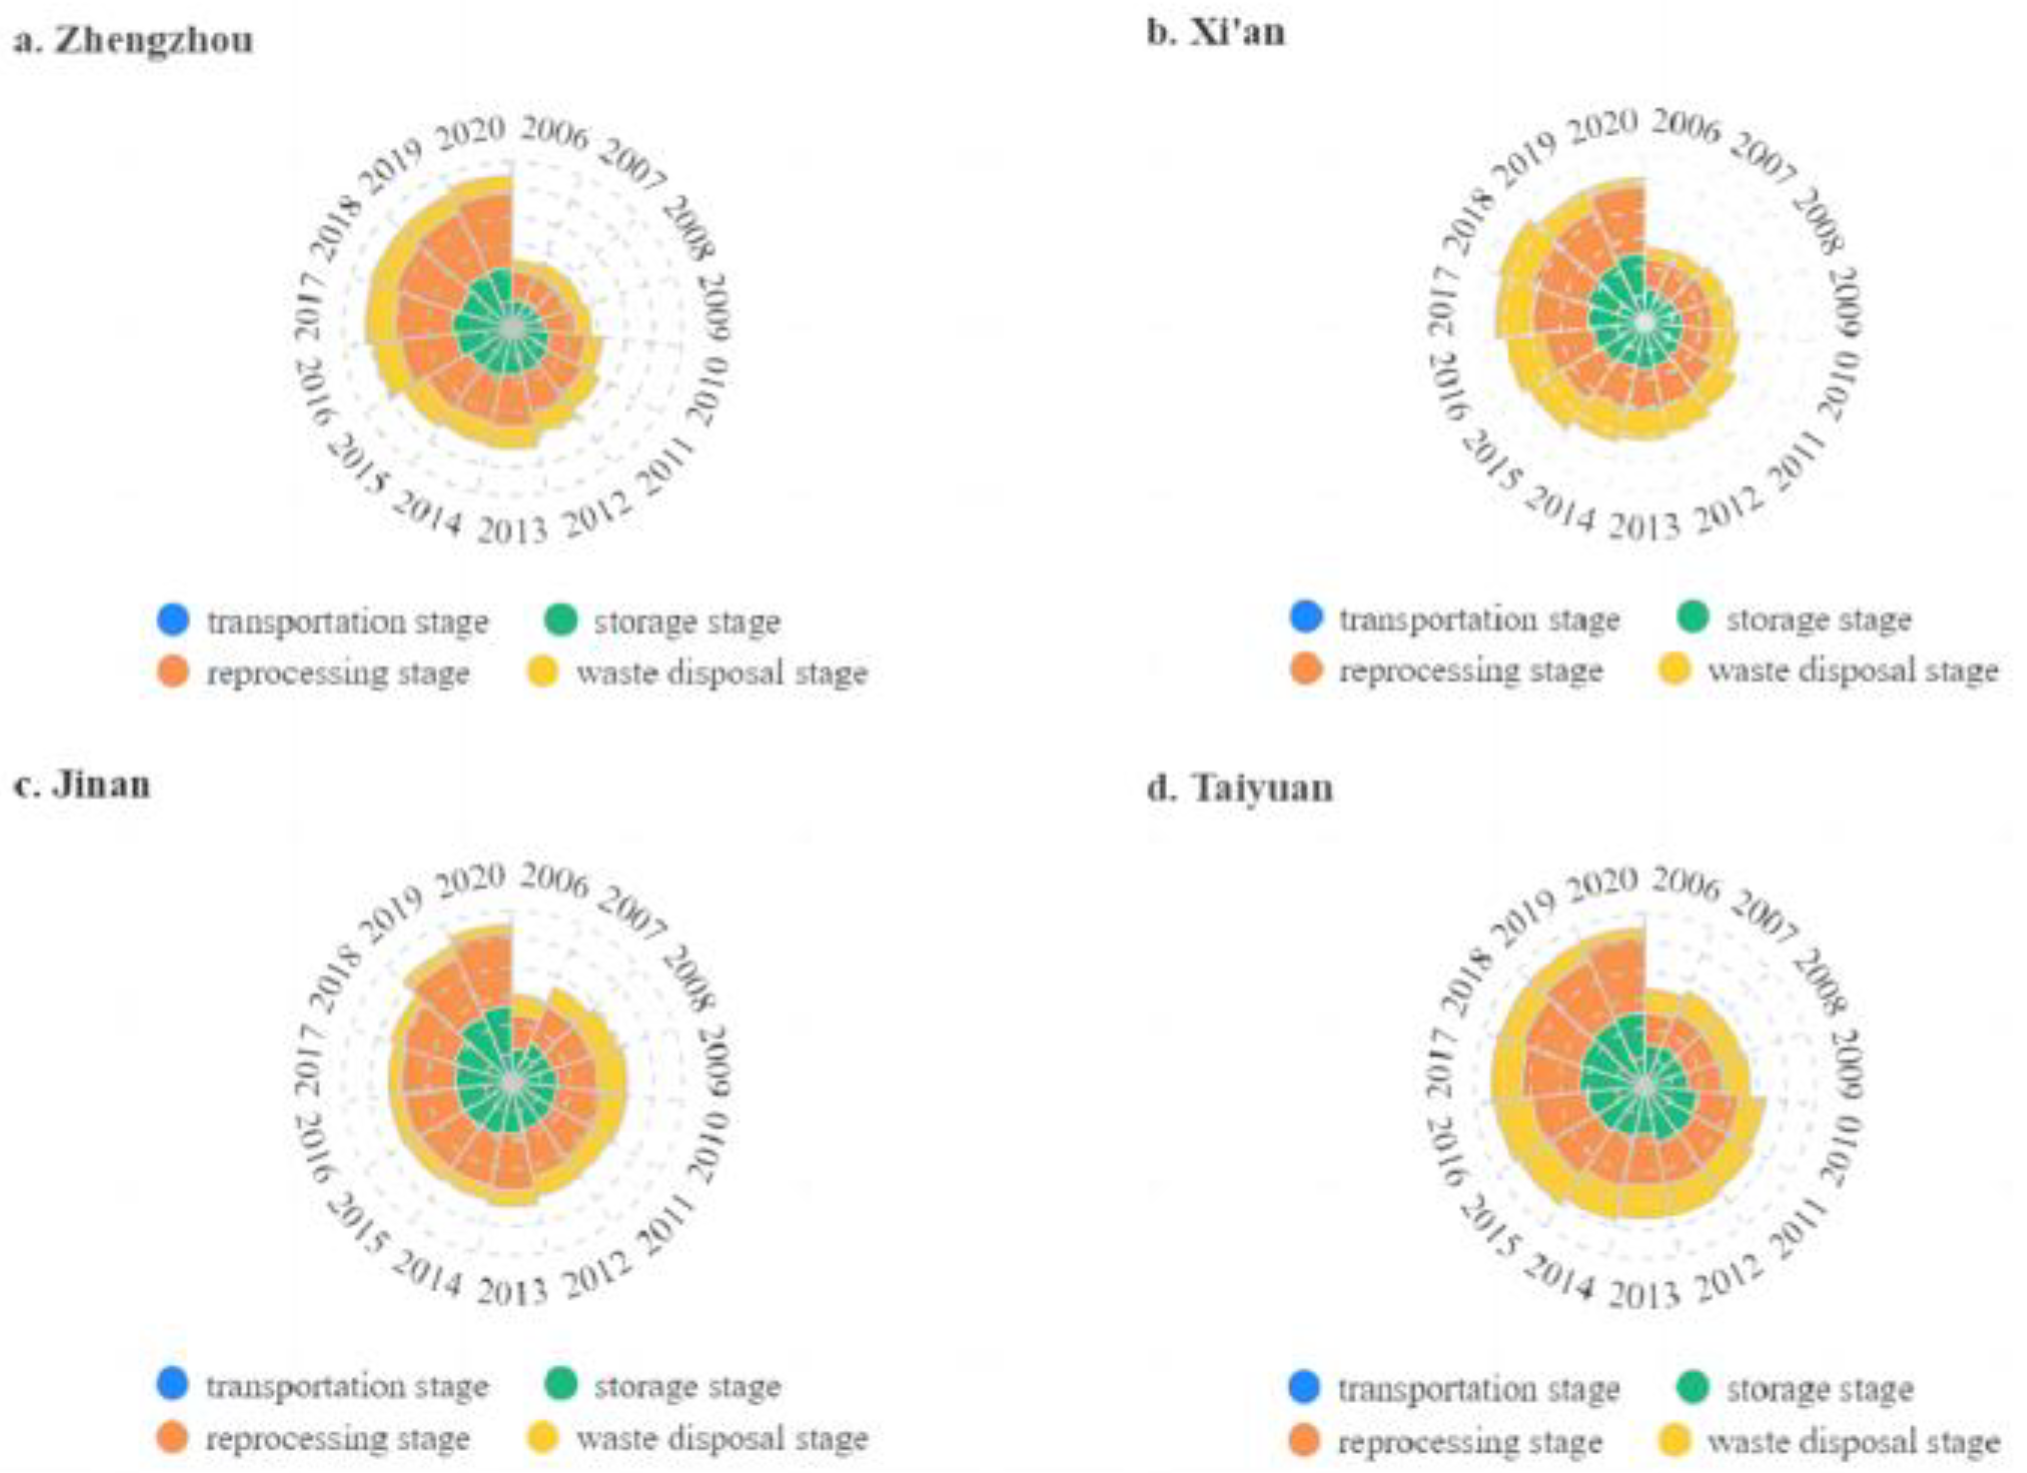

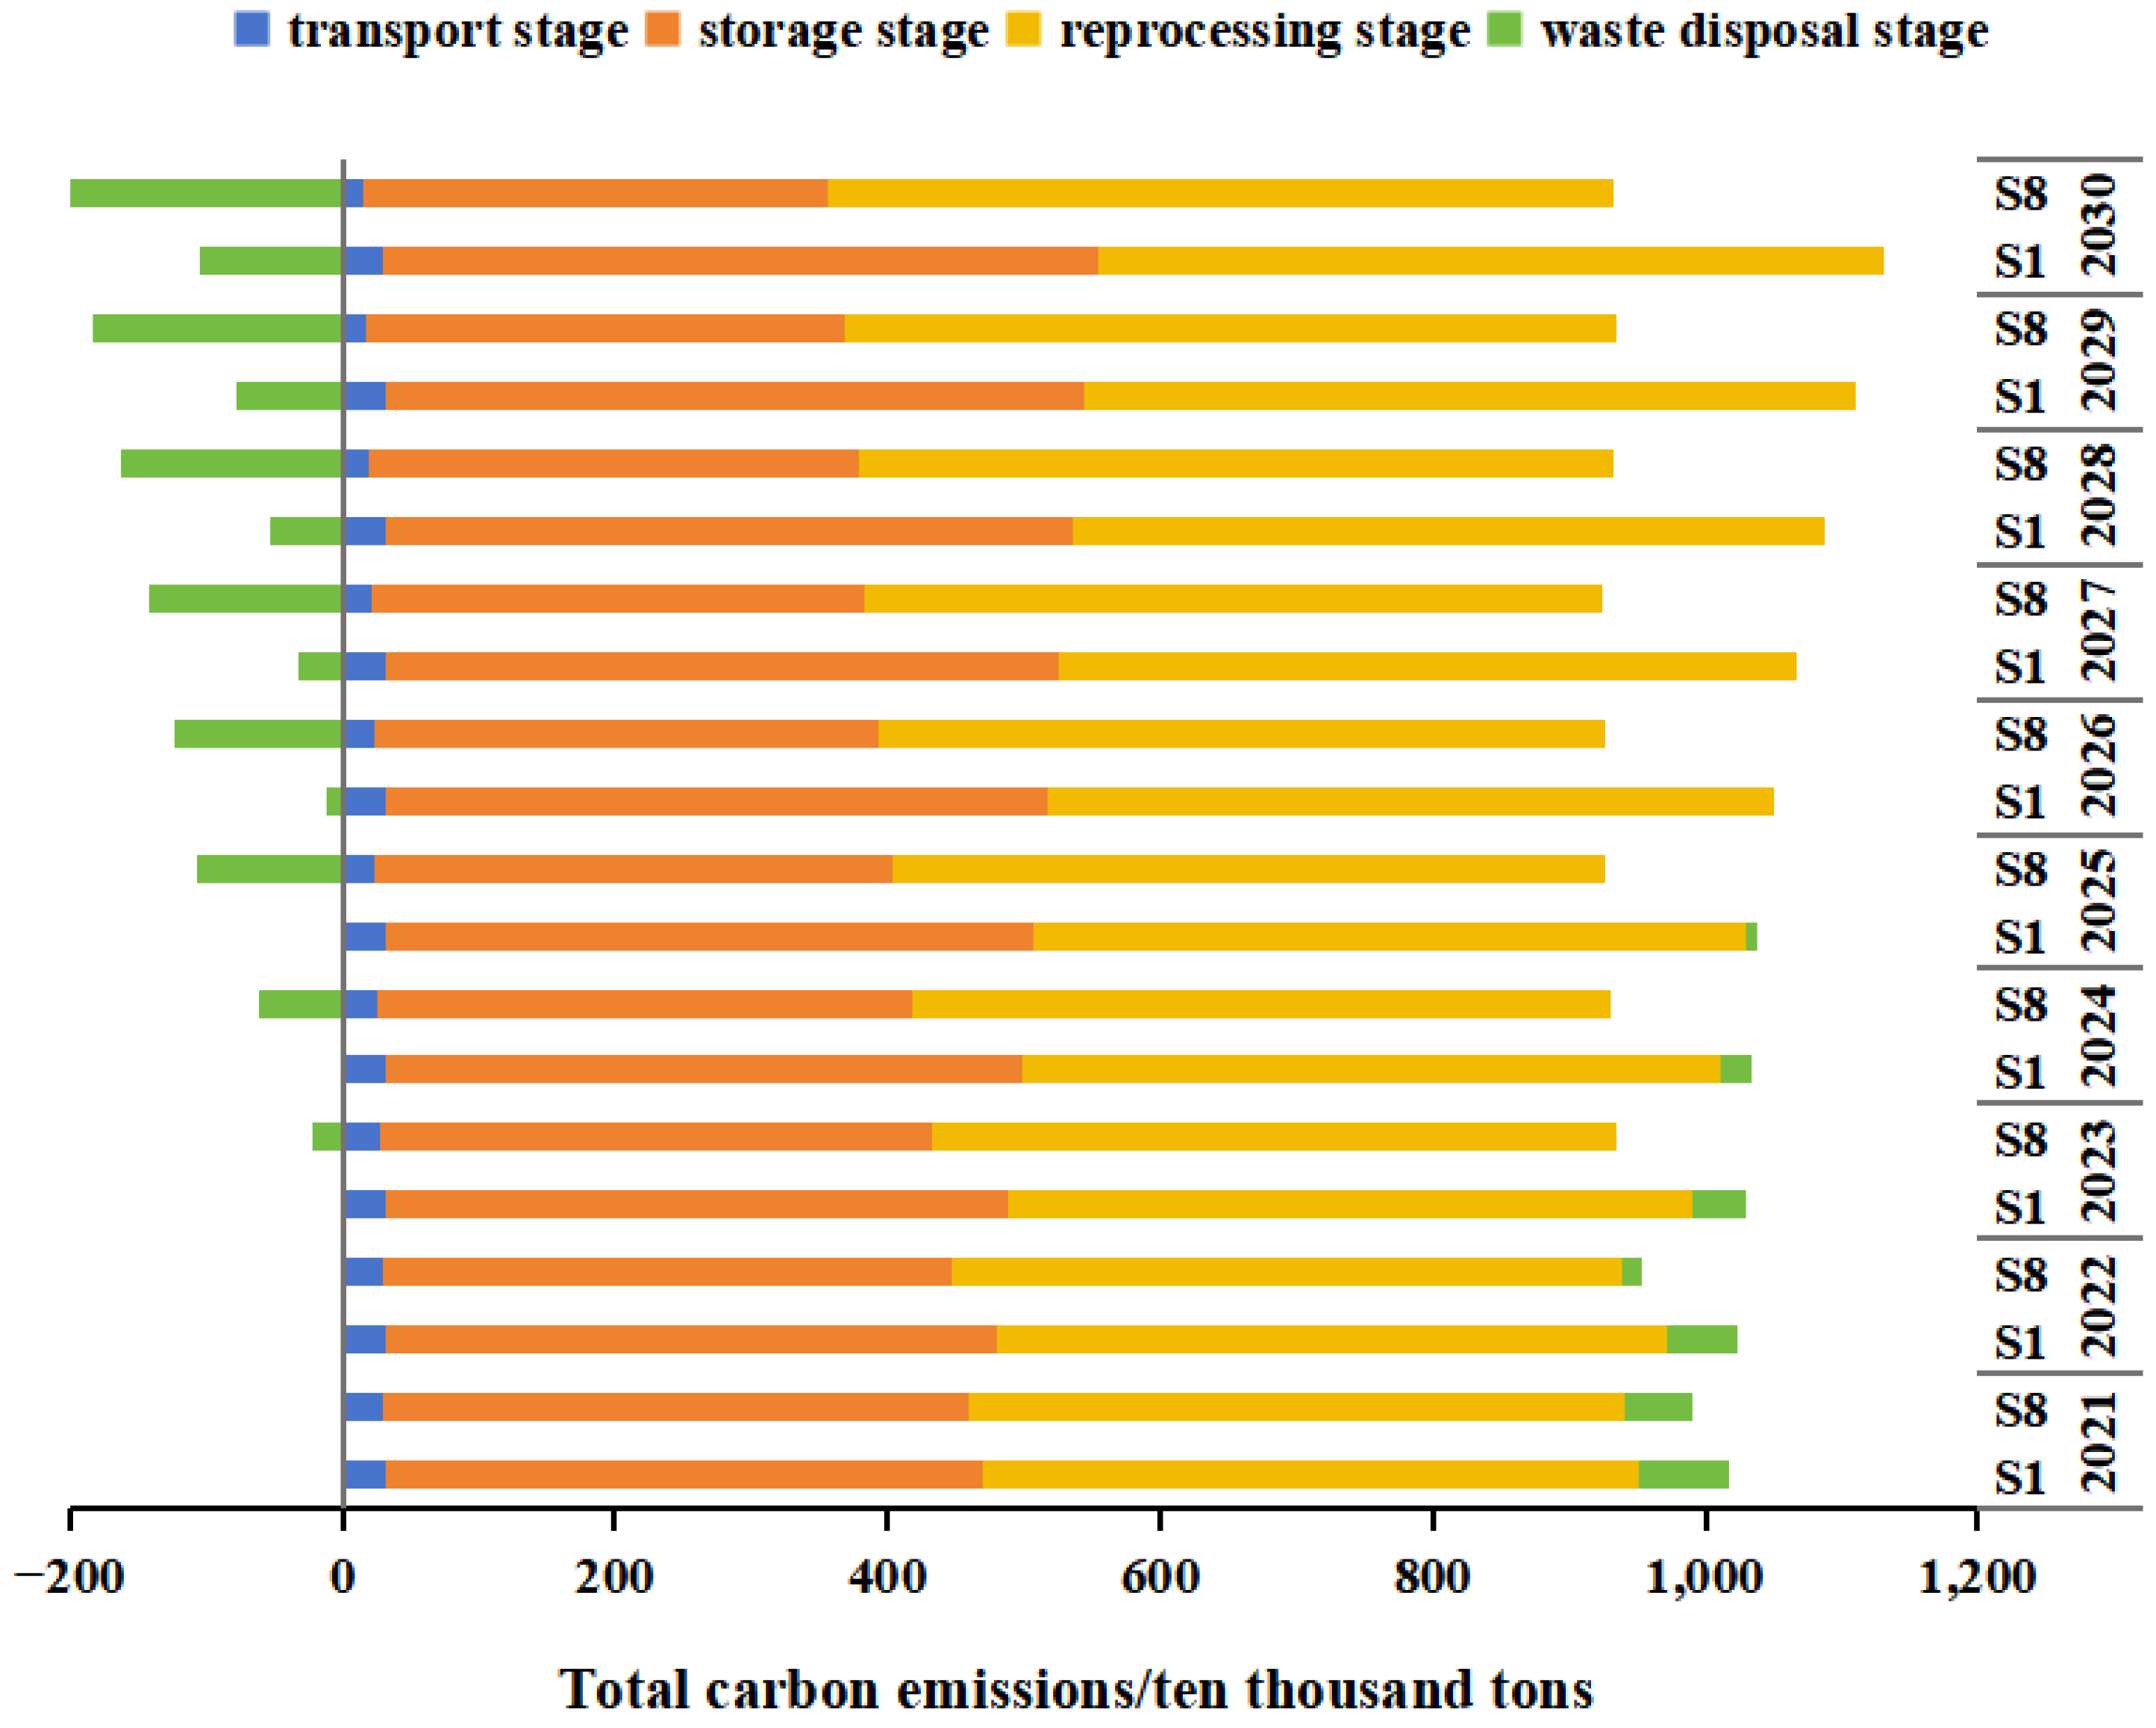
Disclaimer/Publisher’s Note: The statements, opinions and data contained in all publications are solely those of the individual author(s) and contributor(s) and not of MDPI and/or the editor(s). MDPI and/or the editor(s) disclaim responsibility for any injury to people or property resulting from any ideas, methods, instructions or products referred to in the content. |
© 2025 by the authors. Licensee MDPI, Basel, Switzerland. This article is an open access article distributed under the terms and conditions of the Creative Commons Attribution (CC BY) license (https://creativecommons.org/licenses/by/4.0/).