Article

Assessing Radiological Risks of Natural Radionuclides on Sustainable Campus Environment

1
Department of Environmental Science and Engineering, National Pingtung University of Science and Technology, Pingtung 91201, Taiwan
2
Disaster Prevention and Mitigation Technology Research Center, General Research Service Center, National Pingtung University of Science and Technology, Pingtung 91201, Taiwan
3
Department of Civil Engineering, National Pingtung University of Science and Technology, Pingtung 91201, Taiwan
*
Author to whom correspondence should be addressed.
Sustainability 2025, 17(2), 691; https://doi.org/10.3390/su17020691
Submission received: 25 October 2024 / Revised: 3 January 2025 / Accepted: 15 January 2025 / Published: 16 January 2025

Abstract

:
Soil samples were collected from a college campus in Taiwan to measure the levels of radionuclides, contributing to the sustainable management of campus environments. A high-resolution HPGe gamma spectrometry system was utilized to measure the activity concentrations of natural radionuclides (226Ra, 232Th, and 40K) and artificial radionuclide (137Cs). The activity concentrations of 137Cs were not detected in the campus soils, suggesting that artificial radionuclides did not contaminate the soil, supporting sustainable soil quality. However, the average concentrations of 232Th and 40K with mean values of 53.4 ± 5.1 and 504.5 ± 75.4 Bq/kg dw were higher than the global soil average of 45 and 420 Bq/kg dw, respectively. Meanwhile, the average concentration of 226Ra with a mean value of 30.1 ± 3.0 Bq/kg dw was similar to the global soil average of 32 Bq/kg. The average outdoor absorbed gamma dose rate (Dex) and annual effective doses (AEDex), with a mean of 67.2 nGy/h and 82.4 μSv/y, were found to be higher than the average world levels of 57 nGy/h and 70 μSv/y, respectively. Despite these findings, the radium equivalent activity Raeq and external hazard index Hex, with average values of 145.2 Bq/kg and 0.39, respectively, were below the recommended limit values of 370 Bq/kg and 1.0, respectively. This study provides useful information on the background radioactivity of the study campus, which is crucial for developing sustainable strategies to ensure a safe and healthy environment, indicating that there are no radiological hazards in the soil.

1. Introduction

Researchers worldwide are interested in measuring the levels of natural radioactivity in soil [1,2,3,4]. Soil, as a crucial natural resource, consists of the top layer of the Earth’s crust, containing mineral particles, organic matter, water, air, and living organisms [2,5,6,7]. Primordial radionuclides are embedded in the soil through the processes of erosion and deposition. These radionuclides, including 238U, 232Th, and their decay series, as well as the radioactive 40K, are present in various geological materials such as rocks, granites, and sand [2,5,8,9]. Additionally, artificial radionuclides may be present due to nuclear accidents and weapons testing [10,11,12,13]. The concentration of these radioactive elements in the soil depends on the type of rock in the region [14]. Igneous rocks such as granite tend to have higher radiation levels, while sedimentary rocks exhibit lower levels [1,2,9,15,16]. Additionally, the physical and chemical characteristics of soils significantly impact the concentration, distribution, and behavior of these radionuclides [2,3,5,6,17,18]. These naturally occurring radioactive elements continue to emit radiation as their half-lives are comparable to the age of the Earth [3,19,20]. Living organisms are constantly exposed to ionizing radiation from Naturally Occurring Radioactive Materials (NORMs) in the Earth’s crust, contributing to terrestrial background radiation [4,11,21]. This type of radiation is an inevitable part of life on Earth [5,20]. Natural radiation sources account for a significant portion of the population’s exposure to ionizing radiation, with terrestrial sources being the major contributor [15,22].
Understanding the levels and distribution of radionuclides is essential for assessing radiation exposure from terrestrial sources [16,23]. Natural radioactivity levels and associated gamma radiation exposure depend on a region’s geological and geographical conditions [23,24]. This results in different levels of radionuclides in the soil of each region in the world [6,17,25].
Certain radionuclides pose health risks through gamma ray exposure and lung tissue irradiation upon inhalation [3,26,27]. Therefore, it is crucial to evaluate the amount of gamma radiation dose from natural sources. This is because natural radiation is the primary contributor to the external dose of the world population [28]. It is important to continuously measure natural radioactivity due to gamma rays to monitor any changes in radioactivity levels resulting from geological processes and artificial influences [17,18]. Doing so helps identify precautionary measures that must be taken when the dose exceeds the recommended limits.
Numerous research studies have been conducted on soil radiation, including studies on urban soils [7,14,20,24,29,30,31], agricultural lands [10,17,32,33], and residential areas [30,34]. However, there have only been a few studies on campus soils, which were limited to a few samples [13,35,36]. Assessing natural radioactivity in school environments is crucial to implement safety measures and protect students, staff, and faculty when radiation levels exceed the recommended limits.
This study utilizes gamma ray spectrometry to measure the primordial radionuclide levels in soil samples from the National Pingtung University of Science and Technology campus in Taiwan. Understanding these levels is essential for the sustainable development of the campus environment as it informs strategies to maintain soil health and safety. This research also assesses the radiological risks associated with the soil samples, specifically the radium equivalent activity (Raeq), the external hazard index (Hex), the outdoor gamma dose rate (Dex), and the outdoor annual effective dose equivalent (AEDex) [11,13,37,38]. These assessments are vital for ensuring that the campus remains a safe and healthy environment for all its inhabitants, aligning with the Sustainable Development Goals. Additionally, this study evaluates the frequency distribution and activity ratios of 232Th/226Ra in the soil samples, which further supports the development of informed and sustainable environmental management practices.

2. Materials and Methods

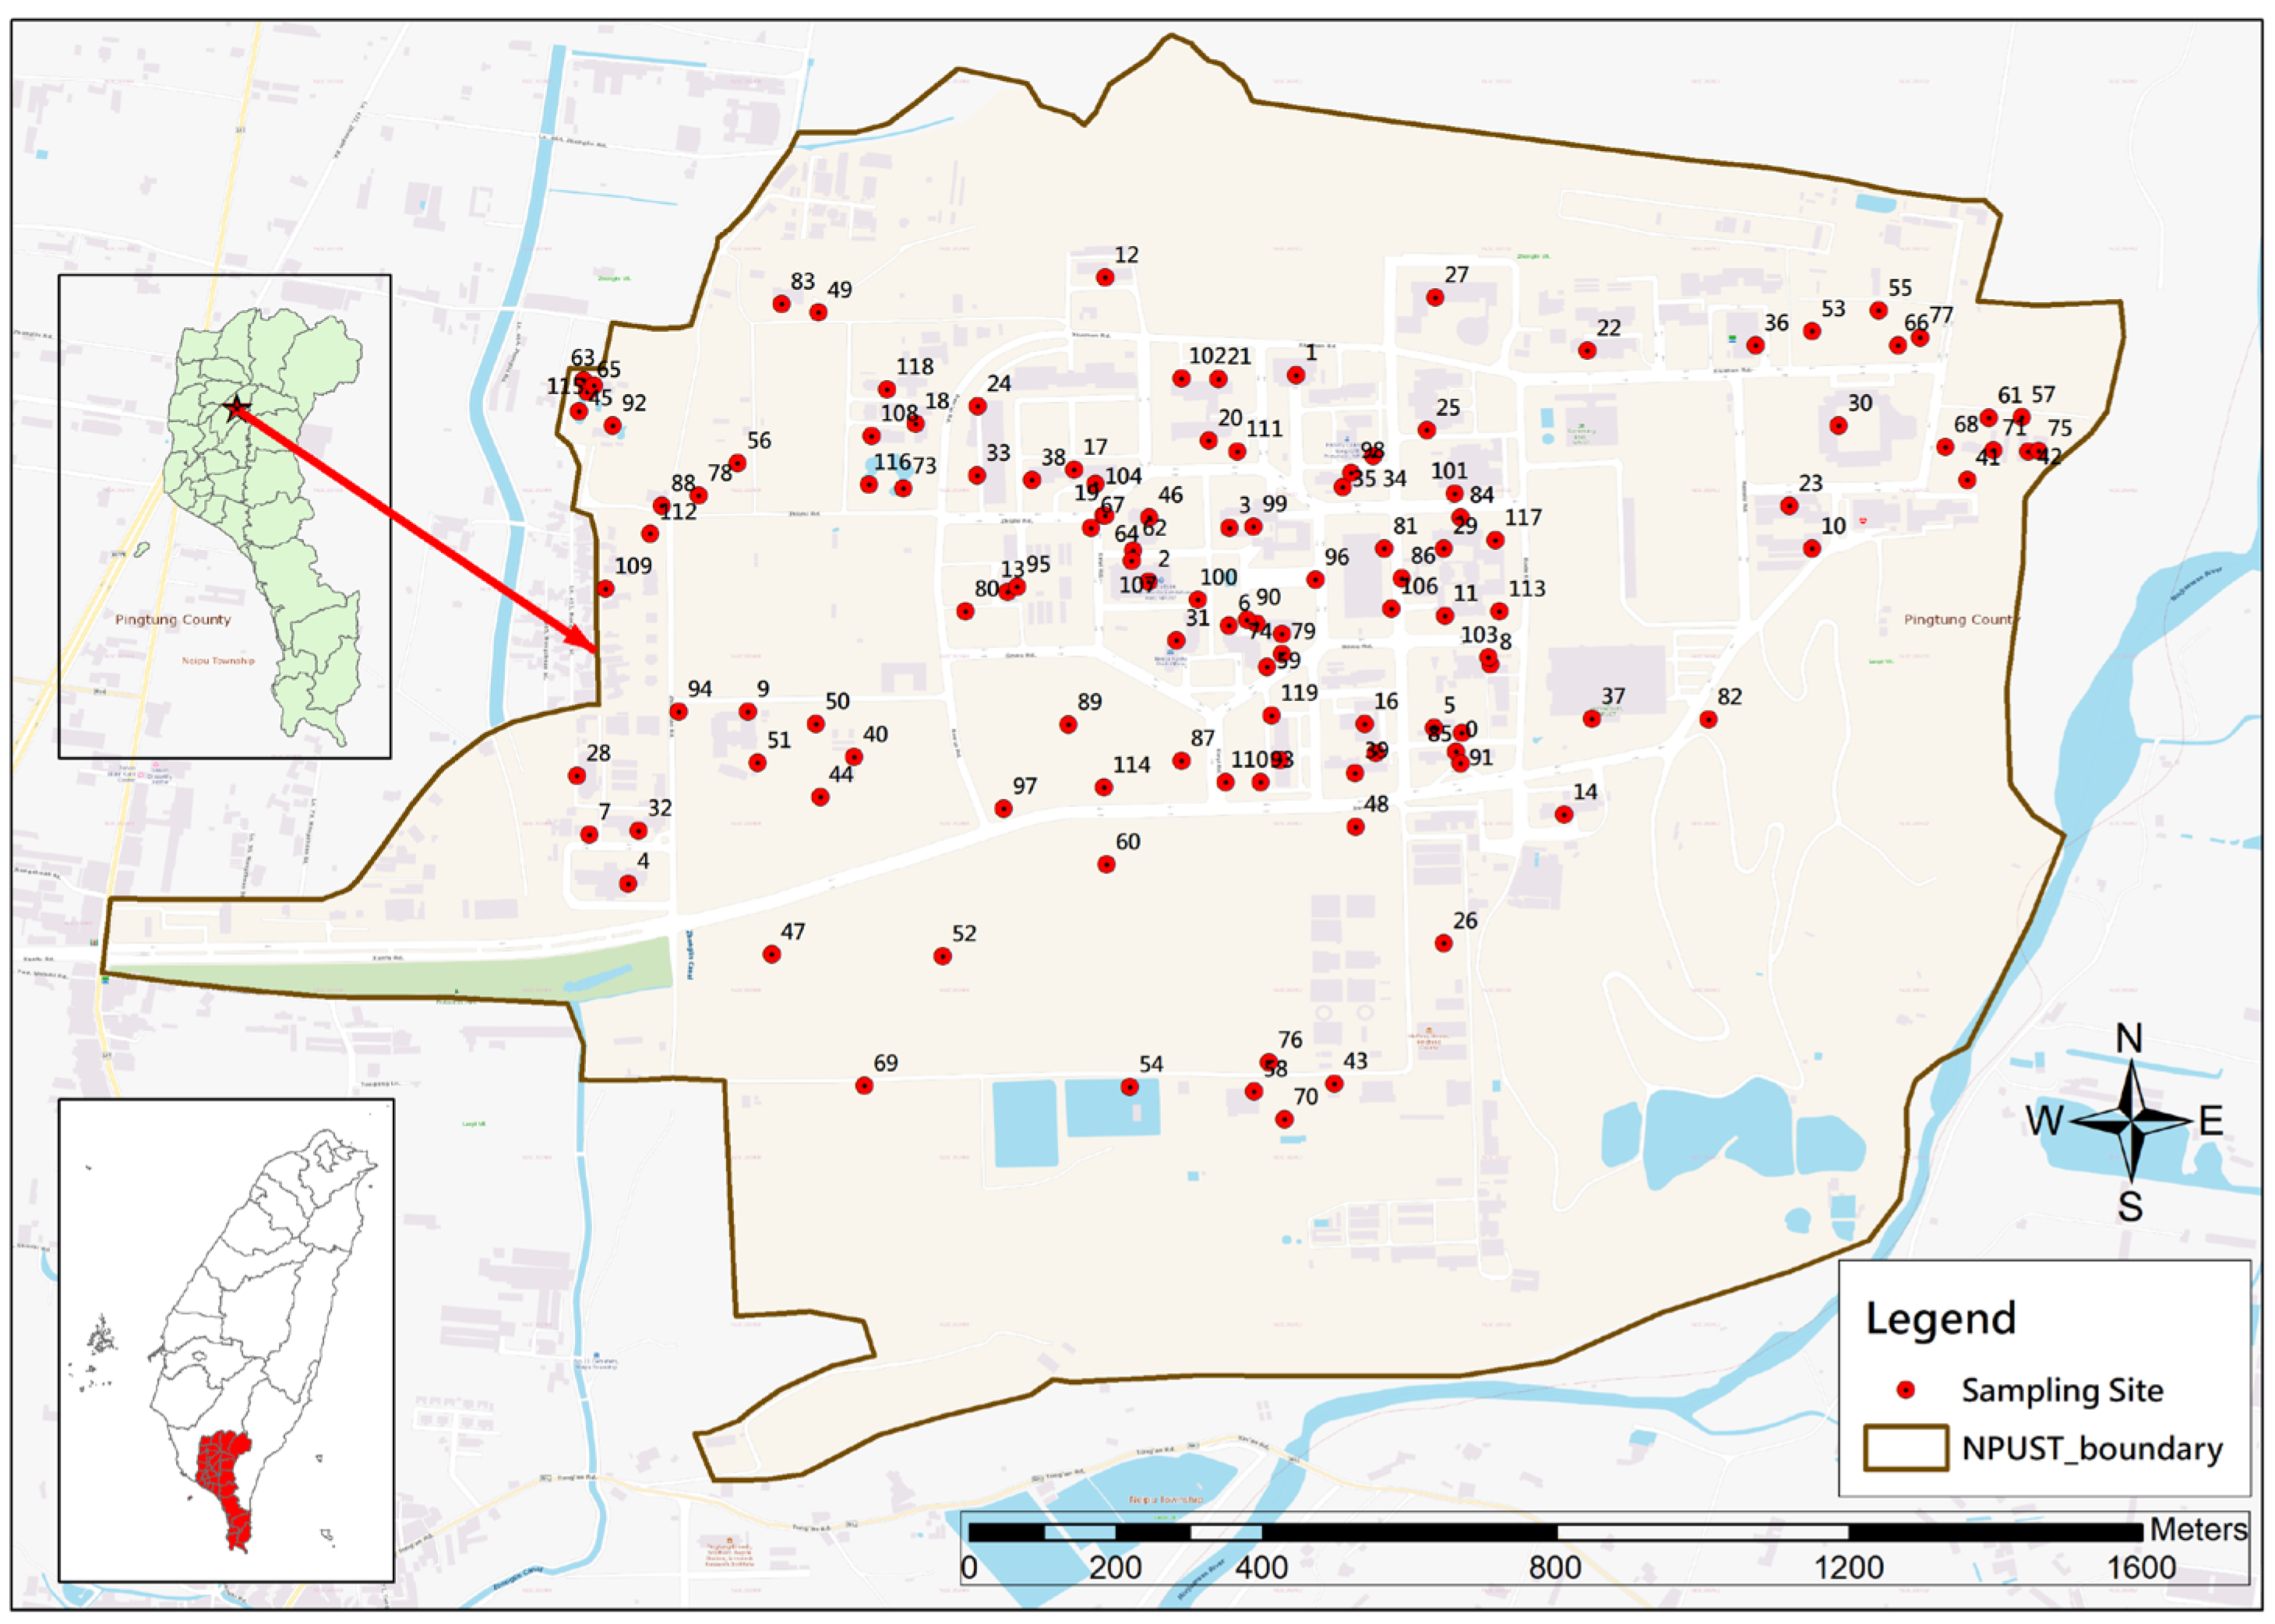
2.1. Geological and Geographical Conditions of the Sampling Area

Figure 1 displays the campus’ geological location, as well as the soil sampling locations. The sampling area is the campus of the National Pingtung University of Science and Technology located on Neipu Township, Pingtung County, southern Taiwan, specifically on Laopi Terrace. Its altitude is approximately 100 m. The campus area is the largest single area of a college in Taiwan, and the area is about 298 hectares. The area has a tropical climate with an average temperature of 25.5 °C and an annual rainfall of around 2600 mm. It belongs to the fourth-generation Pleistocene foothill platform accumulation layer above the modern alluvial layer. This Terrace is situated in the depression of the structure below the Chaozhou fault and has developed into an alluvial fan. The soil composition is predominantly made up of gravel layers with sandy, sandy shale, and siliceous shale mixed in small quantities. The soil profile texture is mainly sandy clay loam and loam, with a reddish-brown color and a strong acid reaction [6,39].

2.2. Sampling and Samples’ Pretreatment

The soil samples were taken from different locations at the campus, as shown in Figure 1. Each soil sample weighing approximately 1.5 kg was first cleared of impurities such as grass, twigs, and small stones before being placed into labeled plastic bags. The soil samples were collected from February to April 2019. A total of 120 soil samples were collected. The collected soil samples were taken back to the laboratory and spread evenly on plastic trays to air dry for at least seven days at room temperature (about 25–30 °C). Following this, the samples were further purified to remove any dried grass and small stones and then sieved through a 0.2 mm sieve to ensure consistency. The dried and sieved samples were placed in air-tight containers with a capacity of about 150 g. They were stored for a month to achieve secular equilibrium between 238U, 232Th, and their progenies. Additionally, the dried soil samples were tested for their pH level, electric conductivity (EC) following the standard method [40], and total organic carbon by following the standard method [40]. The results showed that the average values and standard deviations of the soil properties were 4.99 ± 1.01 for pH, 98.4 ± 61.9 μS/cm for EC, and 21.4 ± 12.6 g/kg for total organic carbon. These soil properties indicated that the soil environment was acidic, had low EC, and low organic carbon levels [6,39].

2.3. Analyses of 226Ra, 228Ra, 232Th, and 40K in the Soil Samples

The experiment involved counting each sample and the background using a high-purity germanium detector (ORTEC, GEM40P4-79-SMP, Oak Ridge, TN, USA). The HPGe detector is known for its high stability, attributed to the exceptional purity of its germanium crystal (99.999% or higher). This purity significantly reduces dark current and noise levels, enhancing the precision of the measurements. This detector was surrounded by a cylindrical lead shield with a 10 cm thickness, 28 cm inner diameter, and 40 cm height. To ensure the accuracy of the measurement results in our study, efficiency calibration was performed using certified standard sources. This calibration process minimizes potential measurement errors and guarantees reliable data. The counting system was connected to a multi-channel analyzer and had a 1.85 keV FWHM energy resolution at the 1.33 MeV 60Co photopeak and a 40% relative efficiency.
In order to ensure accurate and reliable measurements, the detector underwent a rigorous calibration process. Specifically, a series of standard gamma sources (Eckert & Ziegler, Berlin, Germany) were utilized, including 109Cd, 57Co, 203Hg, 51Cr, 113Sn, 85Sr, 137Cs, 60Co, and 88Y, for energy calibration. Efficiency calibration was conducted over the energy range of 88–2000 keV using these sources. The calibration sources are traceable to the National Institute of Standards and Technology (NIST) through Eckert & Ziegler’s participation in the NIST measurement assurance program. This program establishes and maintains traceability for various nuclides based on blind assays and subsequent NIST certification. This rigorous calibration ensures the detector’s capability to accurately measure radiation across a broad energy spectrum.
The samples were counted for 30,000 s, and a background count was conducted using an empty container under the same conditions. The Gamma Vision software (Gamma Vision-32 V6) was used to analyze the spectrum, focusing on the photopeaks at 609.3, 1120.3, and 1764.5 keV for 226Ra, 911.07, 968.90, and 338.40 keV for 228Ra, 583.0 keV for 232Th, and 1460.8 keV for 40K. The 661.66 keV emission line was also used to determine the 137Cs concentration. The MDA were 10.2 ± 1.8, 2.7 ± 0.7, 3.8 ± 0.8, 3.7 ± 0.8, and 1.3 ± 0.2 Bq/kg for 40K, 226Ra, 232Th, 228Ra, and 137Cs, respectively.

2.4. Radiological Risk Calculation

This study examined the potential radiological risks in the soil samples by analyzing the activity concentrations of three radioactive isotopes: 40K, 226Ra, and 232Th. The researchers measured four radiological hazard indices, including radium equivalent activity (Raeq), external hazard index (Hex), external absorbed dose rate in the air (Dex), and external annual effective dose equivalents (AEDex) [11,13,37,38]. Equations (1)–(4) were used to calculate the four indices, respectively.
R a e q B q k g = 0.077 A k + A R a + 1.43 A T h
H e x = A k 4810 + A R a 370 + A T h 259
D e x n G y y = 0.0417 A k + 0.462 A R a + 0.604 A T h
A E D e x n S v y = D e x n G y y × 8760 h y × 0.2 × 0.7 S v G y × 10 3
where AK, ARa, and ATh are the activity concentrations (Bq/kg) of 40K, 226Ra, and 232Th, respectively, measured in the samples.

2.5. Statistics

Data analysis was conducted using two software programs: statistical software S-plus (V6.2) and Microsoft Excel. The significance level was set at 0.05. The descriptive statistics were generated in Excel, while the activity ratio of 232Th/226Ra was calculated using the same software. For the graphical representation of the data, the plot, linear regression, and normality were measured by the Kolmogorov–Smirnov (K-S) [41,42] test in S-plus.

3. Results

3.1. Activity Concentration and Correlation of Nuclides

The activity concentrations of 226Ra, 228Ra, 232Th, and 40K in the soil samples were measured and are listed in Table 1 with their associated uncertainties (1 σ). The activity concentrations of 226Ra, 228Ra, 232Th, and 40K in the soil samples varied between 21.1 and 38.2, 41.2 and 65.9, 39.1 and 66.1, and 312.6 and 950.9 Bq/kg dw (dry weight), respectively. The average and standard deviation of the activity concentrations were 30.1 ± 3.0, 55.9 ± 5.3, 53.4 ± 5.1, and 504.5 ± 75.4 Bq/kg dw, respectively. The relative uncertainties of the measurements showed good analytical precision, with average relative standard deviations of 2.83% for 40K, 4.04% for 232Th, 5.79% for 226Ra, and 3.78% for 228Ra. The observed variation in uncertainties primarily reflects counting statistics and sample matrix effects. The relatively lower uncertainties for 40K measurements 2.83% indicate the particularly robust analytical quality for this radionuclide.
It is worth noting that 228Ra is the decay progeny of the thorium series. The activity concentrations of 228Ra and 232Th had a significantly positive correlation (r = 0.88, p < 0.001, as shown in Figure 2a), and the activity ratios of 228Ra/232Th ranged from 0.93 to 1.16 with a mean of 1.05 ± 0.05. When the activity ratios of 232Th and 228Ra are close to 1.0, it is identified that the decay series involving the radioactive element thorium are in a state of secure equilibrium [2,21]. Similarly, other studies have also reported secure equilibrium in the uranium decay series due to the activity ratios of 238U and 226Ra being close to 1.0. This finding has been reported in various studies [4,6,18,20,43]. In the present study, radionuclide 232Th was represented for the radionuclide thorium.
Linear correlation studies were performed to find the strength and relationships between pairs of nuclide activities in soil samples [1,3,44,45]. The studies were conducted between radionuclides concentrations of 232Th/226Ra, 40K/232Th, and 40K/226Ra. The results indicate that there is a significantly positive correlation between 232Th and 226Ra (r = 0.70, p < 0.001, as shown in Figure 2a). However, the relationship between the 40K activity concentrations with the 232Th and 226Ra concentrations shows a weak linear correlation (r = 0.28, p = 0.002 for 232Th; r = 0.003, p = 0.98 for 226Ra), as shown in Figure 2b.
The relationship of the nuclide concentrations obtained in the present study was similar to that observed by Alazemi et al. [46]. They found a significantly positive correlation between 238U (226Ra) and 232Th, and between 40K and 232Th. However, there is a weak correlation between 40K and 238U. It was concluded that these nuclides have similar responses to soil chemical behavior and other environmental processes [1,3,9]. Several studies also reported that 226Ra and 232Th had strong positive correlation coefficients because the uranium and thorium decay series commonly occur together in nature [1,3,6,9,11,25,47]. However, a weak correlation was observed for 40K with 226Ra and 232Th because 40K origins are in a different decay series [1,17,22,31,48].

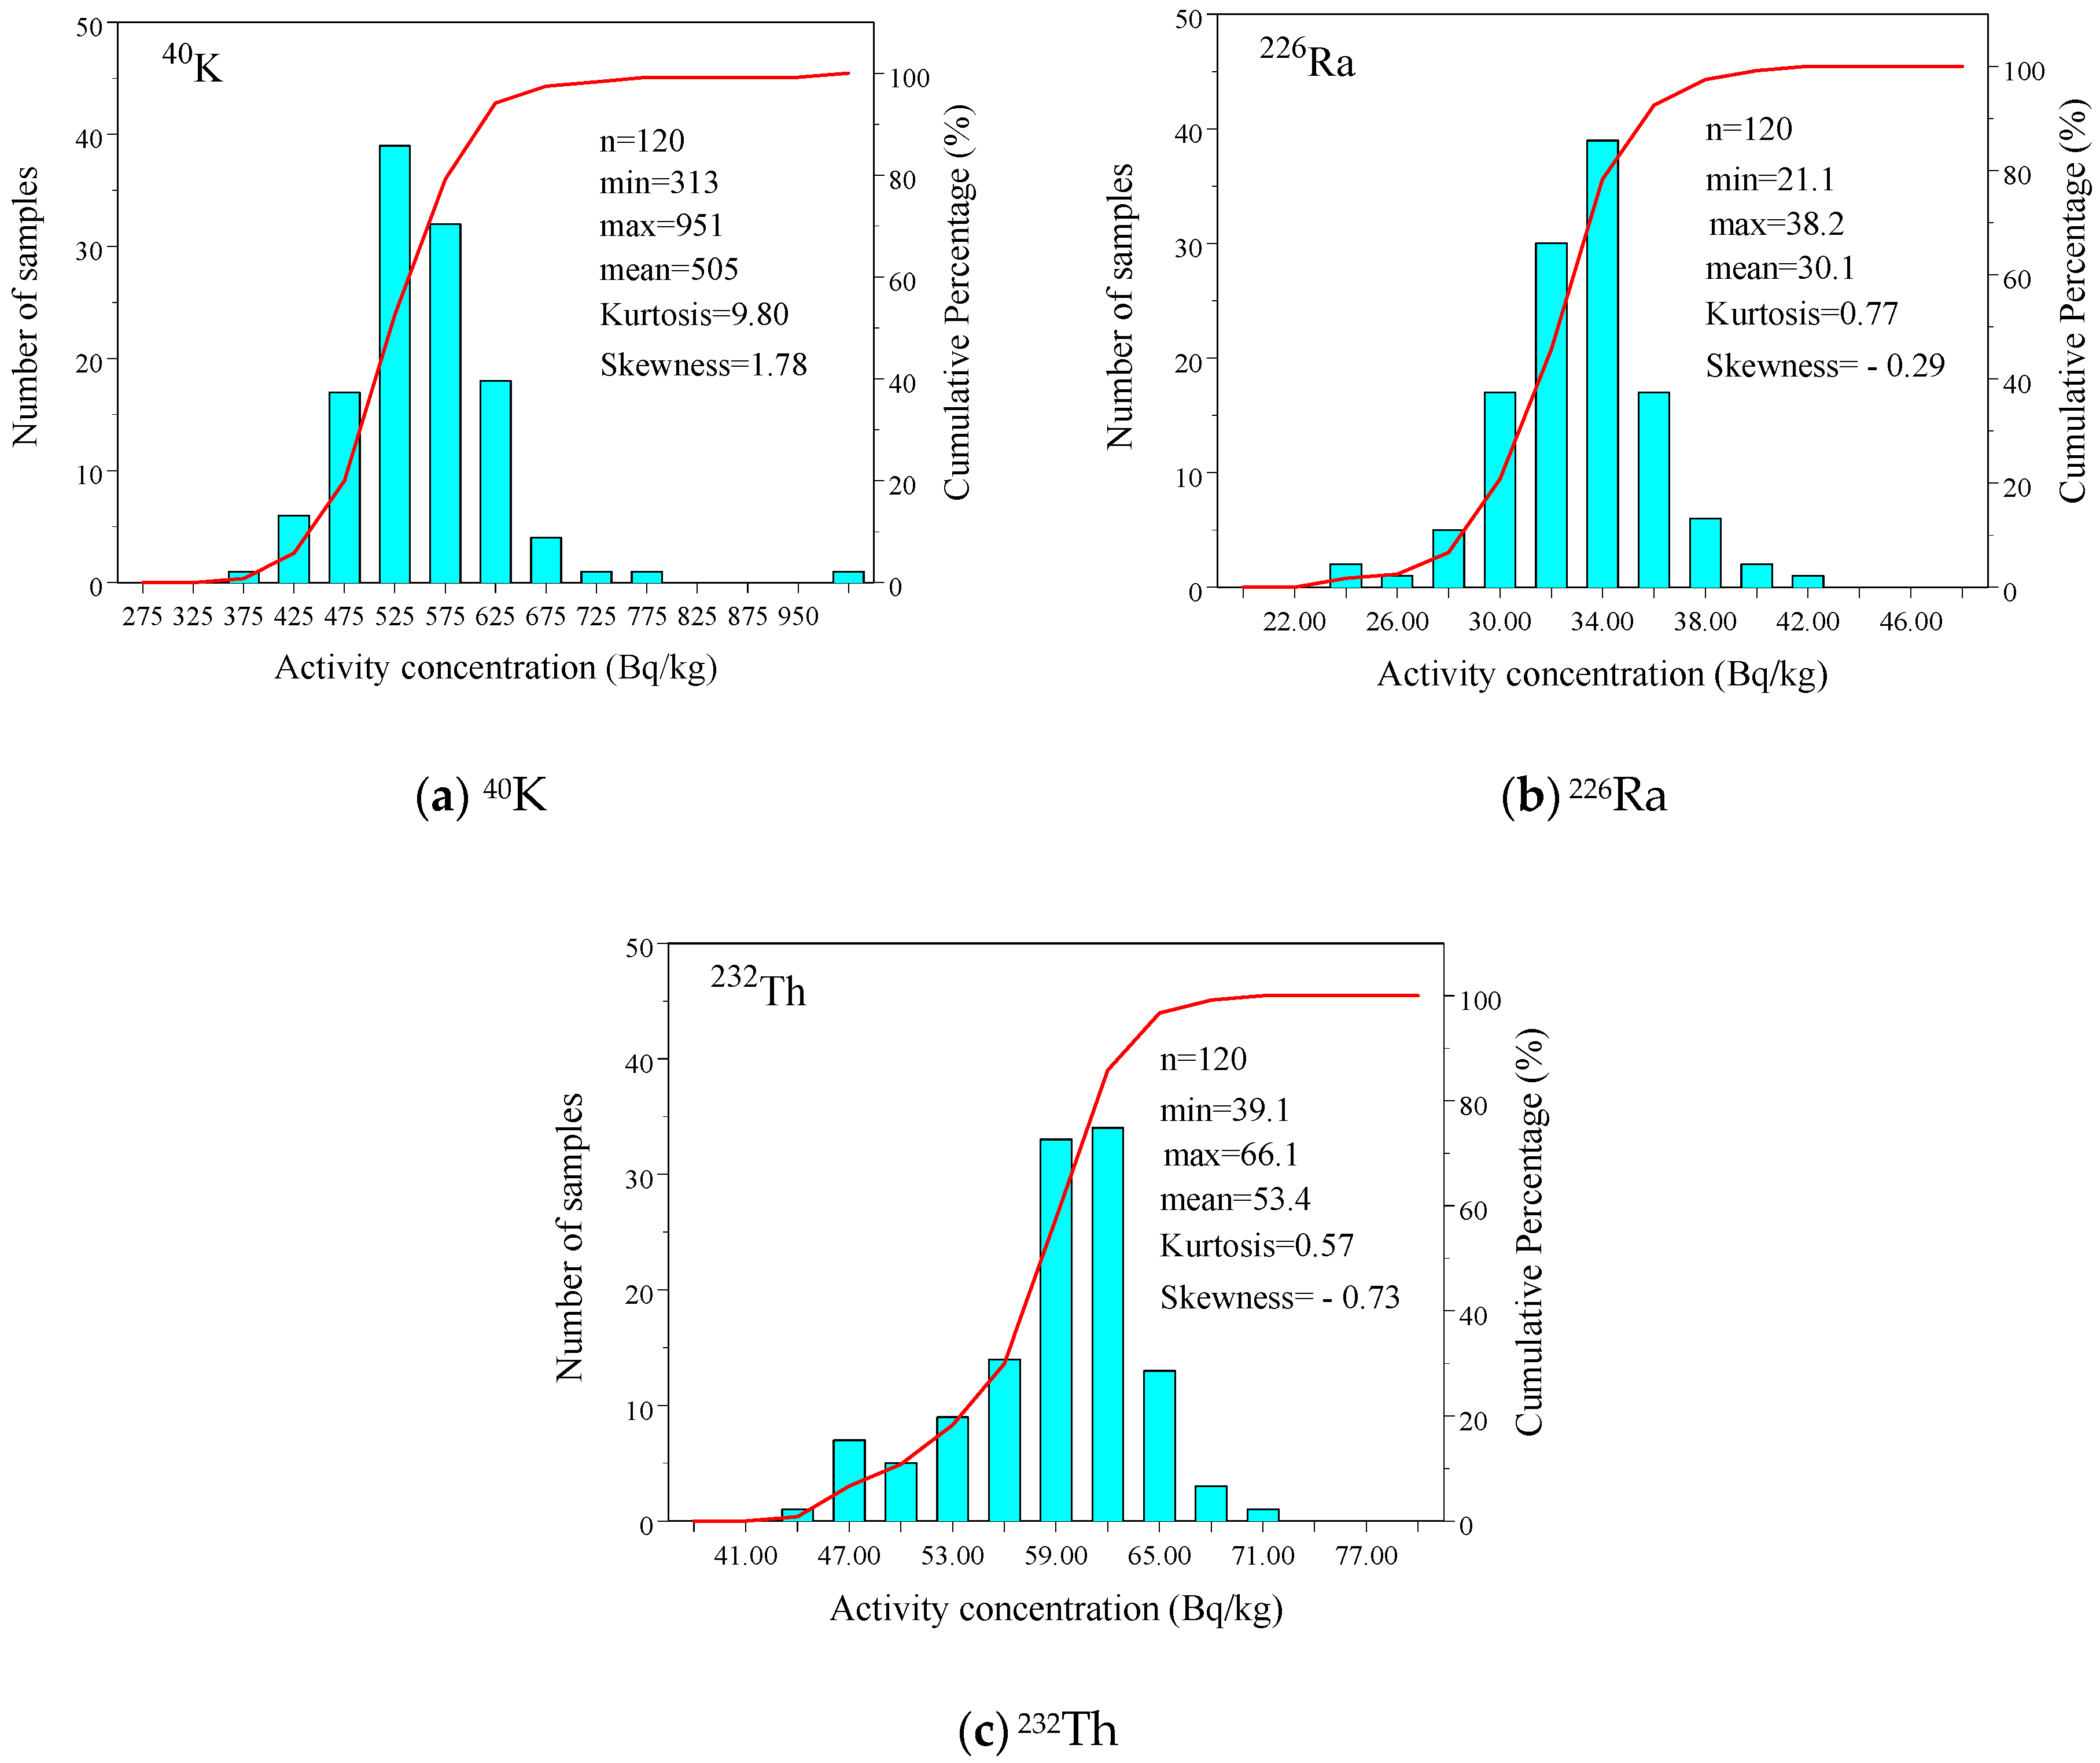
3.2. Descript Statistic and Frequency Distribution of Activity Concentration

The descriptive statistic was used to determine the frequency distributions of the radionuclide activity concentrations [11,19,24,44,45,49]. Table 2 presents the statistical data and analyses using various measures such as skewness, kurtosis, coefficients of variation (CV), and p-values obtained from a normality test. Additionally, Figure 3a–c illustrate the frequency distribution and frequency cumulated percentage plots of the concentration of radionuclides 40K, 226Ra, and 232Th, respectively.
Skewness is a statistical parameter that measures the asymmetry in the probability distribution of activity concentrations [19,44,49]. If skewness is less than 0, the frequency distribution graph is left-biased. If skewness is 0, data are evenly distributed on both sides of the average value. If skewness exceeds 0, the frequency distribution graph is biased to the right [44,49]. In this particular study, the skewness value for 40K was found to be 1.78. This value indicates an asymmetrical and right-biased distribution, as shown in Figure 3a. However, the parameters of the 226Ra and 232Th activity concentrations were negative values of −0.29 and −0.73, respectively, and were close to zero. These values suggest a left-biased near-symmetric distribution, as shown in Figure 3b,c.
Kurtosis is a statistical measure that indicates the peak in the probability distribution of activity concentrations [44,49], with higher values indicating a more peaked (leptokurtic) distribution. The measurement of kurtosis for 40K was found to be 9.80, which suggests a more peaked distribution than a normal distribution, as shown in Figure 3a. However, the kurtosis values for 226Ra and 232Th were close to zero, indicating a normal (mesokurtic) distribution [19,24,44], as shown in Figure 3b,c.
The coefficient of variation (CV) is a measure used to determine the level of spread of activity concentrations. In the current study, the CV value was about 15.0% for 40K concentrations, while for 226Ra and 232Th concentrations, it was less than 10%. This indicates that there was low variation in the concentrations, as most activity concentrations were within a small range. Specifically, the activity concentration of 226Ra ranged between 26.0 and 34.0 Bq/kg at 86%, while the activity concentration of 232Th was between 49.0 and 61.0 Bq/kg at 78%. The activity concentration of 40K was between 400 and 600 Bq/kg at 88%.
To check the normality of the activity concentrations, the Kolmogorov–Smirnov (K-S) test was conducted, and the significant values are listed in Table 2. The test results showed that each nuclide concentration was normally distributed on the studied campus (p > 0.05). The results clearly demonstrate that the geological conditions on the campus were consistently homogeneous [45].

3.3. Comparison with Reported Activity Concentrations

Table 3 presents the average activity concentrations of radionuclides and the activity ratios of 232Th/226Ra from this study compared with other studies, including soil type classifications. The surface soil (SS) samples analyzed in our study showed activity concentrations of 505, 53.4, and 30.1 Bq/kg for 40K, 232Th, and 226Ra, respectively. These values are comparable to previous studies conducted across Taiwan, where surface soils showed ranges of 407–609 Bq/kg for 40K, 31–45 Bq/kg for 232Th, and 21.1–31.1 Bq/g for 226Ra [47,50,51].
The variation in radionuclide concentrations can be attributed to differences in soil types and local geological conditions. For instance, paddy field soils (PFSs) in Taiwan [50,52] showed generally higher 40K concentrations (609–670 Bq/kg) compared to our surface soil measurements. This difference might be related to agricultural practices and soil management in paddy fields.
Globally, soil type appears to significantly influence radionuclide distributions. Higher activity concentrations of 232Th and 226Ra were observed in granite soils (GSs) of Guangdong, China [18], and Bangladesh [53] and in alluvial soils (ALSs) of Bangladesh [1]. In contrast, agricultural soils (ASs) from Egypt [33] and urban soils (USs) from Jordan [29] showed lower concentrations. The 232Th/226Ra activity ratios in our study (1.78) were comparable to those found in surface soils across Taiwan [47,51] but higher than those typically found in agricultural and urban soils worldwide.
The presence of 137Cs, with an activity concentration of 5.6 Bq/kg in Taiwan’s paddy field soils [50] and 7.1 Bq/kg near NPP IV [36], reflects the historical fallout from nuclear weapons testing and the Chernobyl accident, providing an important temporal marker for soil studies.
Table 3. The means activity concentrations of 40K, 232Th, 226Ra, and 137Cs and activity ratios of 232Th/226Ra for soil in this study compared to reported activity concentrations and activity ratios from soils in Taiwan and other countries.
Area/Country (Soil Type) **40K232Th226Ra137Cs232Th/226RaReferences
Neipu/TW (SS)50553.430.1-1.78PS *
Whole Island/TW (PFSs)60945.031.15.61.45[50]
Whole Island/TW (SS)4073323-1.50[47]
Whole Island/TW (SS)5394123-1.78[51]
Near NPP IV/TW (SS)43626247.11.08[36]
Whole Island/TW (PFSs)670-21.16.7 [52]
Pingtung/TW (TFS)70255.136.3-1.52[54]
Global average4204532 1.41[28]
Guangdong/China (SS)536101.075.1-1.34[4]
Shangrao/China (SS)7425963-1.30[7]
Bangladesh (ALSs)7626447-1.36[1]
India (SS)79277.433.8-2.31[3]
Tamil Nadu/India (HS)8404852-0.92[17]
Guangdong/China (GSs)680187134-1.40[18]
Dhanbad/India (SLSs)57044.361.7-1.40[55]
Bangladesh (GSs)94783.265.9-1.30[53]
Pernambuco/Brazil (TSSs)5483820-2.1[2]
Alagoas/Brazil (SS)63054 *28-1.93[21]
Pakistan (Sand)50943.224.5-1.76[27]
Bulgaria/Turkey (SS)61742.424.0-1.77[9]
Spain (FSs)335–56224–4819–33-1.29–1.48[6]
HCMC/Vietnam (SS)27936.621.1-1.73[20]
Tamil Nadu/India (IEDSs)25339.922.8-1.75[31]
Jeju Island/Korea (VS)31435.632.420.81.10[5]
Chittagong/Bangladesh (RDSs)3214618-2.56[30]
Yerevan/Armenia42437.345.78.02.26[11]
Saudi Arabia (Sand)38029.723.4-0.77[56]
Qassim/Saudi Arabia (RS)67–946–1910–19-0.86–1.18[25]
Abu Qurqas/Egypt (ASs)15812.222.3-0.85[33]
India (SS)56751.636.9-1.40[22]
Bartin/Turkey (SS)1367821.14[57]
Nigeria (TESs)70.417.711.9-1.53[8]
Ptolemais/Greece (SS)4963627-1.33[14]
Saudi Arabia (SS)79024.323.8-1.02[37]
Canary Island/Spain (VS)38428.925.2-1.15[16]
Amman City/Jordan (USs)26635.529.0-1.22[29]
* PS: present study. ** Abbreviations for different soil types: (PFSs) paddy field soils, (SS) surface soil, (US) urban soil, (RS) red soil, (VS) volcanic soil, (ASs) agricultural soils, (HS) hill soils, (TESs) tailing-enriched soils, (RDSs) residential soils, (IEDSs) industrial effluent-disposed soils, (TSSs) tropical and semiarid soils, (FSs) Flysch soils, (SLSs) sandy-loam soils, (ALSs) alluvial soils, and (TFSs) tobacco field soils. - undetected or unmentioned.

3.4. Activity Ratio of 232Th/226Ra

In nature, two series of radioactive isotopes, uranium and thorium, are commonly found [58]. The activity ratios (ARs) of 232Th/226Ra can indicate the relative presence of these isotopes and their origin in natural systems [43,58,59]. Moreover, the AR value can detect changes in its content and measure various environmental geochemical processes [2,3,6,58,60].
Figure 4a shows a line and scatter plot of 232Th/226Ra ARs, while Figure 4b displays a histogram of frequency distribution and a frequency cumulated percentage plot of 232Th/226Ra ARs. Table 2 shows the descriptive statistical data of 232Th/226Ra ARs. The ARs ranged from 1.44 to 2.10, with a mean and standard deviation of 1.78 ± 0.13. The skewness, kurtosis, and CV values were −0.21, −0.13, and 7.2%, respectively. The normality test resulted in a significant p-value of 0.81. The kurtosis and skewness values were close to 0, indicating that the 232Th/226Ra ARs were normally distributed. The low CV value and the significance of the normality test further confirmed this. The median value was 1.779, which is similar to the mean value of 1.780, thus providing further evidence of the normality of the 232Th/226Ra ARs.
The global data collected indicate that the average activity concentration of 226Ra and 232Th in the soils was 32 Bq/kg and 45 Bq/kg, respectively [28]. The average 232Th/226Ra activity ratio was found to be 1.78 in this study, which is higher than the global soil average of 1.41. The 232Th/226Ra ratios in Table 3 varied from 0.77 to 2.56, with most values exceeding 1.0, indicating higher thorium levels in the soil compared to uranium. This study revealed that the soil contained 1.78 times more thorium than uranium minerals. The recorded 232Th/226Ra activity ratios in this study were similar to those observed in the soil of Pernambuco State, Brazil. Additionally, the median activity ratios of 228Ra (232Th)/226Ra ranged from 1.6 to 2.2, with red-yellow Acrisols and red-yellow Ferrosols having ratios of 1.8 and 1.9, respectively [2]. This study also found that the acidic soil condition increased radium solubility, resulting in a higher 232Th/226Ra activity ratio [2,28].

3.5. Radiological Hazard Indices

Four radiological hazard indices were utilized to assess the radiological risk in the soils. Figure 5a–d show the line and scatter plots, alongside the mean value plots, for these indices. Table 4 lists the descriptive statistics of the radiological hazard indices obtained from soil samples.
The radium equivalent activity (Raeq, Bq/kg) is a single index that calculates the gamma radiation emitted by three types of radionuclides (40K, 226Ra, and 232Th) from the soil sample. In this study, the Raeq values of the soil samples ranged from 117.0 to 199.3 Bq/kg, with an average of 145.2 Bq/kg. These values are well below the maximum permissible limit of 370 Bq/kg [3,18,61]. According to the statistical analysis of Raeq, the values for kurtosis, skewness, and coefficient of variation (CV) were 2.51, 0.36, and 8.4%, respectively. The normality test significance was 0.54, as shown in Table 4, indicating that the Raeq values were distributed normally. Additionally, the median value of 146.2 Bq/kg is close to the mean value of 145.2 Bq/kg, further supporting the normal distribution of the Raeq values.
The external hazard index (Hex) is a measure used to assess the level of external gamma radiation from soils to determine if they are safe for use as construction materials. The maximum permissible limit for Hex is 1.0, which corresponds to the highest acceptable limit of Raeq of 370 Bq/kg [17,28,61,62]. This ensures that these materials are safe to use in building construction. In this study, the Hex values ranged from 0.32 to 0.54, with an average value of 0.39 and a standard deviation of 0.03. All Hex values in the study area were less than 1.0, indicating that the soil is safe for use in construction. The Hex values had a kurtosis of 2.51, a skewness of 0.36, and a CV value of 8.2%. The normality test significance was 0.13, confirming the normal distribution. The median value of Hex was 0.395, which is similar to the mean value of 0.392 (Table 4).
To estimate the outdoor absorbed gamma dose rate (Dex) 1 m above the ground surface, the concentration of radionuclides (40K, 226Ra, and 232Th) in the samples is taken into consideration. It is assumed that the radionuclides are evenly distributed, and the contribution of other naturally occurring radionuclides is insignificant [11,37]. The Dex values in this study ranged from 53.4 to 94.2 nGy/h, with an average of 67.2 nGy/h. This is 13.9% higher than the population-weighted world average of 59 nGy/h [11,28,45].
The external annual effective dose equivalent (AEDex) is a measure of the annual dose people receive when outdoors [11,37]. It is estimated using a conversion factor of 0.7 Sv/Gy, and the outdoor occupancy factor is 0.2 (Equation (4)). The calculated AEDex values ranged from 65.5 to 115.5 μSv/y, with a mean value of 82.4 μSv/y. This value is 17.7% higher than the world average of 70 μSv/y [11,28,45]. However, it is important to note that the average AEDex recorded in this study is still below the maximum recommended worldwide level of 1 mSv/y of doses received from natural radiation sources [13,28,37].
The gamma ray activity released by natural radionuclides in campus soils was converted into an annual effective dose and compared with the annual exposure dose of the Taiwanese population (external terrestrial radiation: 0.58 mSv/y; total dose: 1.56 mSv/y) [63]. The calculated annual effective dose from gamma rays in this study is 0.082 mSv/y, accounting for 5.3% of the total dose, which is within the reasonable background radiation range.
The kurtosis, skewness, and CV values for Dex and AEDex were identical and were 3.43, 0.61, and 8.5%, respectively. The significance of the normality test was 0.58 and 0.54 for Dex and AEDex, respectively. The low skewness and CV values confirmed the normal distribution and median value of 67.5 nGy/h and 82.7 μSv/y, which were similar to the corresponding mean values. The CV for the annual external effective dose is 8.5%, indicating low variability in the external dose generated by campus soils. Therefore, it can be inferred that the effective dose from gamma ray activity in campus soils is within the reasonable range of background radiation.
The soil samples in the area under investigation do not pose any significant health risks from radiation, and exposure to natural radionuclides is harmless to the public.

4. Conclusions

This study conducted a measurement of gamma-emitted radionuclide levels in soil samples from the NPUST in Taiwan. The results indicated that there was no contamination from man-made radionuclides, as the activity concentrations of 137Cs were below the detected limit. However, the average activity concentrations of 232Th and 40K were higher, while the average 226Ra activity concentration was similar to the world soil average concentration. The average 232Th/226Ra activity ratio of 1.78 was higher than the global average of 1.41 due to the solubility of 226Ra in the acidic soil. The average radiological hazard indices Raeq and Hex were 145.2 Bq/kg and 0.39, which were lower than the recommended limit values of 370 Bq/kg and 1.0, respectively. Similarly, the average Dex and AEDex were 67.2 nGy/h and 82.4 μSv/y, and the AEDex was less than the maximum recommended value of 1000 μSv/y. These index values indicate that there is no significant radiological risk to the public in the campus soils. Although this study primarily focused on soil, we recognize the importance of evaluating the distribution and persistence of radionuclides in other environmental media, such as water and air. Future research efforts should aim to investigate these media to provide a more comprehensive understanding of the campus radiation environment. The results of this study can serve as a baseline for such future investigations and for developing strategies to ensure a safe and sustainable campus environment. This not only helps protect the local ecosystem but also provides a scientific basis for future environmental planning and management.

Author Contributions

Conceptualization, Y.-L.Y. and T.-C.C.; methodology, W.-H.H. and T.-C.C.; software, Z.-M.C. and W.-H.H.; formal analysis, W.-H.H. and Z.-M.C.; investigation, W.-H.H.; writing—original draft preparation, W.-H.H. and T.-C.C.; writing—review and editing, Y.-L.Y. and T.-C.C.; visualization, Z.-M.C.; supervision, Y.-L.Y. All authors have read and agreed to the published version of the manuscript.

Funding

This research received no external funding.

Institutional Review Board Statement

Not applicable.

Informed Consent Statement

Not applicable.

Data Availability Statement

Data are available through request to the corresponding author.

Acknowledgments

The authors appreciate the technical assistance from Radiation Monitoring Center, Nuclear Safety Commission.

Conflicts of Interest

The authors declare no conflicts of interest.

References

  1. Dina, N.T.; Das, S.C.; Kabir, M.Z.; Rasul, M.G.; Deeba, F.; Rajib, M.; Islam, M.S.; Hayder, M.A.; Ali, M.I. Natural radioactivity and its radiological implications from soils and rocks in Jaintiapur area, North-east Bangladesh. J. Radioanal. Nucl. Chem. 2022, 331, 4457–4468. [Google Scholar] [CrossRef]
  2. do Carmo Leal, A.L.; da Costa Lauria, D.; Ribeiro, F.C.; Viglio, E.P.; Franzen, M.; Lima, E.d.A.M. Spatial distributions of natural radionuclides in soils of the state of Pernambuco, Brazil: Influence of bedrocks, soils types and climates. J Environ. Radioact. 2020, 211, 106046. [Google Scholar] [CrossRef] [PubMed]
  3. Srilatha, M.; Rangaswamy, D.; Sannappa, J. Measurement of natural radioactivity and radiation hazard assessment in the soil samples of Ramanagara and Tumkur districts, Karnataka, India. J. Radioanal. Nucl. Chem. 2015, 303, 993–1003. [Google Scholar] [CrossRef]
  4. Yang, J.; Sun, Y. Natural radioactivity and dose assessment in surface soil from Guangdong, a high background radiation province in China. J. Radiat. Res. Appl. Sci. 2022, 15, 145–151. [Google Scholar] [CrossRef]
  5. Kang, T.-W.; Park, W.-P.; Han, Y.-U.; Bong, K.M.; Kim, K. Natural and artificial radioactivity in volcanic ash soils of Jeju Island, Republic of Korea, and assessment of the radiation hazards: Importance of soil properties. J. Radioanal. Nucl. Chem. 2020, 323, 1113–1124. [Google Scholar] [CrossRef]
  6. Navas, A.; Soto, J.; Machın, J. 238U, 226Ra, 210Pb, 232Th and 40K activities in soil profiles of the Flysch sector (Central Spanish Pyrenees). Appl. Radiat. Isot. 2002, 57, 579–589. [Google Scholar] [CrossRef]
  7. Yang, B.; Zhou, Q.; Zhang, J.; Li, Z.; Li, W.; Tuo, F. Assessment of radioactivity level and associated radiation exposure in topsoil from eastern region of Shangrao Prefecture, China. J. Radioanal. Nucl. Chem. 2019, 319, 297–302. [Google Scholar] [CrossRef]
  8. Kolo, M.; Amin, Y.; Khandaker, M.; Abdullah, W. Radionuclide concentrations and excess lifetime cancer risk due to gamma radioactivity in tailing enriched soil around Maiganga coal mine, Northeast Nigeria. Int. J. Radiat. Res. 2017, 15, 71. [Google Scholar]
  9. Özden, S. Assessment of natural radioactivity levels and radiological hazard parameters of soils collected from Bulgaria–Turkey border region. Eur. Phys. J. Plus 2022, 137, 1368. [Google Scholar] [CrossRef]
  10. Aközcan, S. Natural and artificial radioactivity levels and hazards of soils in the Kücük Menderes Basin, Turkey. Environ. Earth Sci. 2014, 71, 4611–4614. [Google Scholar] [CrossRef]
  11. Belyaeva, O.; Movsisyan, N.; Pyuskyulyan, K.; Sahakyan, L.; Tepanosyan, G.; Saghatelyan, A. Yerevan soil radioactivity: Radiological and geochemical assessment. Chemosphere 2021, 265, 129173. [Google Scholar] [CrossRef] [PubMed]
  12. Elsaman, R.; Ali, G.; Uosif, M.; El-Taher, A.; Chong, K. Transfer factor of natural radionuclides from clay loam soil to sesame and Cowpea: Radiological hazards. Int. J. Radiat. Res. 2020, 18, 157–166. [Google Scholar]
  13. Lee, J.; Kim, H.; Kye, Y.U.; Lee, D.Y.; Jo, W.S.; Lee, C.G.; Kim, J.K.; Baek, J.-H.; Kang, Y.-R. Activity concentrations and radiological hazard assessments of 226Ra, 232Th, 40K, and 137Cs in soil samples obtained from the Dongnam Institute of Radiological & Medical Science, Korea. Nucl. Eng. Technol. 2023, 55, 2388–2394. [Google Scholar]
  14. Psichoudaki, M.; Papaefthymiou, H. Natural radioactivity measurements in the city of Ptolemais (Northern Greece). J. Environ. Radioact. 2008, 99, 1011–1017. [Google Scholar] [CrossRef]
  15. Amini Birami, F.; Moore, F.; Faghihi, R.; Keshavarzi, B. Distribution of natural radionuclides and assessment of the associated radiological hazards in the rock and soil samples from a high-level natural radiation area, Northern Iran. J. Radioanal. Nucl. Chem. 2019, 322, 2091–2103. [Google Scholar] [CrossRef]
  16. Arnedo, M.; Rubiano, J.; Alonso, H.; Tejera, A.; González, A.; González, J.; Gil, J.; Rodríguez, R.; Martel, P.; Bolivar, J. Mapping natural radioactivity of soils in the eastern Canary Islands. J. Environm. Radioact. 2017, 166, 242–258. [Google Scholar] [CrossRef]
  17. Jananee, B.; Rajalakshmi, A.; Thangam, V.; Bharath, K.M.; Sathish, V. Natural radioactivity in soils of Elephant hills, Tamilnadu, India. J. Radioanal. Nucl. Chem. 2021, 329, 1261–1268. [Google Scholar] [CrossRef]
  18. Song, G.; Chen, D.; Tang, Z.; Zhang, Z.; Xie, W. Natural radioactivity levels in topsoil from the Pearl river delta zone, Guangdong, China. J. Environ. Radioact. 2012, 103, 48–53. [Google Scholar] [CrossRef]
  19. Tabar, E.; Yakut, H.; Saç, M.M.; Taşköprü, C.; İçhedef, M.; Kuş, A. Natural radioactivity levels and related risk assessment in soil samples from Sakarya, Turkey. J. Radioanal. Nucl. Chem. 2017, 313, 249–259. [Google Scholar] [CrossRef]
  20. Tran, D.-K.; Truong, Y.; Le, N.-S.; Nguyen, V.-P.; Tran, H.-N. Environmental radioactivity and associated radiological hazards in surface soils in Ho Chi Minh City, Vietnam. J. Radioanal. Nucl. Chem. 2020, 326, 1773–1783. [Google Scholar] [CrossRef]
  21. Filgueiras, R.A.; Silva, A.X.; Ribeiro, F.C.A.; Lauria, D.C.; Viglio, E.P. Baseline, mapping and dose estimation of natural radioactivity in soils of the Brazilian state of Alagoas. Radiat. Phys. Chem. 2020, 167, 108332. [Google Scholar] [CrossRef]
  22. Srinivasa, E.; Rangaswamy, D.; Suresh, S.; Sannappa, J. Natural radioactivity levels and associated radiation hazards in soil samples of Chikkamagaluru district, Karnataka, India. J. Radioanal. Nucl. Chem. 2022, 331, 1899–1906. [Google Scholar] [CrossRef]
  23. Kurnaz, A.; Kucukomeroglu, B.; Damla, N.; Çevik, U. Radiological maps for Trabzon, Turkey. J. Environ. Radioact. 2011, 102, 393–399. [Google Scholar] [CrossRef] [PubMed]
  24. Isinkaye, M.O.; Ajiboye, Y. Natural radioactivity in surface soil of urban settlements in Ekiti State, Nigeria: Baseline mapping and the estimation of radiological risks. Arab. J. Geosci. 2022, 15, 557. [Google Scholar] [CrossRef]
  25. Alashrah, S. Radiation properties for red soil in Qassim province, Saudi Arabia. J. Radiat. Res. Appl. Sci. 2016, 9, 363–369. [Google Scholar] [CrossRef]
  26. Darwish, D.; Abul-Nasr, K.; El-Khayatt, A. The assessment of natural radioactivity and its associated radiological hazards and dose parameters in granite samples from South Sinai, Egypt. J. Radiat. Res. Appl. Sci. 2015, 8, 17–25. [Google Scholar] [CrossRef]
  27. Khan, K.; Akhter, P.; Orfi, S. Estimation of radiation doses associated with natural radioactivity in sand samples of the north western areas of Pakistan using Monte Carlo simulation. J. Radioanal. Nucl. Chem. 2005, 265, 371–375. [Google Scholar] [CrossRef]
  28. UNSCEAR. Sources and Effects of Ionizing Radiation; Report to General Assembly, with Scientific Annexes; United Nations: New York, NY, USA, 2000; Volume II. [Google Scholar]
  29. Hamideen, M.S. Correlations study between environmental radioactivity concentrations and some health risk indicators of soil samples in Amman city, Jordan. Int. J. Environ. Anal. Chem. 2022, 102, 380–390. [Google Scholar] [CrossRef]
  30. Rashed-Nizam, Q.M.; Rahman, M.M.; Kamal, M.; Chowdhury, M.I. Assessment of radionuclides in the soil of residential areas of the Chittagong metropolitan city, Bangladesh and evaluation of associated radiological risk. J. Radiat. Res. 2015, 56, 22–29. [Google Scholar] [CrossRef] [PubMed]
  31. Senthilkumar, R.; Narayanaswamy, R. Assessment of radiological hazards in the industrial effluent disposed soil with statistical analyses. J. Radiat. Res. Appl. Sci. 2016, 9, 449–456. [Google Scholar] [CrossRef]
  32. Adjirackor, T.; Darko, E.O.; Sam, F. Naturally occurring radionuclide transfer from soil to vegetables in some farmlands in Ghana and statistical analysis. Radiat. Prot. Environ. 2017, 40, 34. [Google Scholar] [CrossRef]
  33. Elsaman, R.; Seleem, E.-M.; Salman, S.; Ella, E.E.; El-Taher, A. Evaluation of Natural Radioactivity Levels and Associated Radiological Risk in Soil from Siwa Oasis, Egypt. Radiochemistry 2022, 64, 409–415. [Google Scholar] [CrossRef]
  34. Isinkaye, O.M.; Adeleke, S.; Isah, D.A. Background radiation measurement and the assessment of radiological impacts due to natural radioactivity around Itakpe iron-ore mines. Mapan 2018, 33, 271–280. [Google Scholar] [CrossRef]
  35. Dosh, R.; Hasan, A.K.; Abojassim, A.A. Estimation of Natural Radioactivity in Soil of Primary Schools at Old City in Najaf. Arab. J. Nucl. Sci. Appl. 2023, 56, 117–125. [Google Scholar] [CrossRef]
  36. Tsai, T.-L.; Lin, C.-C.; Wang, T.-W.; Chu, T.-C. Radioactivity concentrations and dose assessment for soil samples around nuclear power plant IV in Taiwan. J. Radiol. Prot. 2008, 28, 347. [Google Scholar] [CrossRef] [PubMed]
  37. Alharbi, T. Establishment of natural radioactivity baseline, mapping, and radiological hazard assessment in soils of Al-Qassim, Al-Ghat, Al-Zulfi, and Al-Majmaah. Arab. J. Geosci. 2020, 13, 415. [Google Scholar] [CrossRef]
  38. Monged, M.H.; Abu Khatita, A.M.; El-Hemamy, S.T.; Sabet, H.S.; Al-Azhary, M.A. Environmental assessment of radioactivity levels and radiation hazards in soil at North Western-Mediterranean Sea coast, Egypt. Environ. Earth Sci. 2020, 79, 386. [Google Scholar] [CrossRef]
  39. Huang, K.C.; Chiang, J.L.; Huang, Y.K.; Chiu, H.P.; Huang, C.Y. A study on soil pore space characteristic under different vegetation in Laopi terrace. J. Taiwan Agric. Eng. 2009, 55, 81–94. [Google Scholar]
  40. McLean, E. Soil pH and lime requirement. In Methods of Soil Analysis: Part 2 Chemical and Microbiological Properties; American Society of Agronomy, Soil Science Society of America: Madison, WI, USA, 1983; Volume 9, pp. 199–224. [Google Scholar]
  41. Kolomogorov, A. Sulla Determinazione Empirica Di Una Legge Di Distribuzione. Giorn. Dell’Istit. Ital. Degli Att. 1933, 4, 83–91. [Google Scholar]
  42. Smirnov, N. Table for Estimating the Goodness of Fit of Empirical Distributions. Ann. Math. Stat. 1948, 19, 279–281. [Google Scholar] [CrossRef]
  43. Janković, M.; Jelić, I.; Rajačić, M.; Krneta Nikolić, J.; Vukanac, I.; Dimović, S.; Sarap, N.; Šljivić-Ivanović, M. Distribution of Natural Radionuclides and 137Cs in Urban Soil Samples from the City of Novi Sad, Serbia-Radiological Risk Assessment. Toxics 2023, 11, 345. [Google Scholar] [CrossRef] [PubMed]
  44. Abbasi, A.; Kurnaz, A.; Turhan, Ş.; Mirekhtiary, F. Radiation hazards and natural radioactivity levels in surface soil samples from dwelling areas of North Cyprus. J. Radioanal. Nucl. Chem. 2020, 324, 203–210. [Google Scholar] [CrossRef]
  45. Akkurt, İ.; Gunoglu, K.; Gunay, O.; Sarıhan, M. Natural radioactivity and radiological damage parameters for soil samples from Cekmekoy-İstanbul. Arab. J. Geosci. 2022, 15, 53. [Google Scholar] [CrossRef]
  46. Alazemi, N.; Bajoga, A.; Bradley, D.; Regan, P.; Shams, H. Soil radioactivity levels, radiological maps and risk assessment for the state of Kuwait. Chemosphere 2016, 154, 55–62. [Google Scholar] [CrossRef]
  47. Tsai, T.-L.; Liu, C.-C.; Chuang, C.-Y.; Wei, H.-J.; Men, L.-C. The effects of physico-chemical properties on natural radioactivity levels, associated dose rate and evaluation of radiation hazard in the soil of Taiwan using statistical analysis. J. Radioanal. Nucl. Chem. 2011, 288, 927–936. [Google Scholar] [CrossRef]
  48. Haribala; Hu, B.; Wang, C.; Xu, X.; Zhang, S.; Bao, S.; Li, Y. Assessment of radioactive materials and heavy metals in the surface soil around uranium mining area of Tongliao, China. Ecotox. Environ. Saf. 2016, 130, 185–192. [Google Scholar] [CrossRef]
  49. Ravisankar, R.; Chandrasekaran, A.; Vijayagopal, P.; Venkatraman, B.; Senthilkumar, G.; Eswaran, P.; Rajalakshmi, A. Natural radioactivity in soil samples of Yelagiri Hills, Tamil Nadu, India and the associated radiation hazards. Radiat. Phys. Chem. 2012, 81, 1789–1795. [Google Scholar] [CrossRef]
  50. Huang, W.-H.; Chen, T.-C.; Lin, S.-C.; Chen, Z.-M.; Yeh, Y.-L. Assessment Activity Concentrations of Rice Components (Root, Stem, Leaf, and Grain) and Transfer Factors (TF) from Paddy Soil to Rice Grain of Radionuclides 40K, 226Ra, 232Th, and 137Cs Investigation in Taiwan. Agronomy 2024, 15, 23. [Google Scholar] [CrossRef]
  51. Saito, K.; Inoue, K.; Ishita, Y.; Shimizu, H.; Fukushi, M. Distribution of gamma radiation dose rate and activity concentration in soil related with natural radionuclides on Taiwan main island. Radiat. Prot. Dosim. 2022, 198, 998–1003. [Google Scholar] [CrossRef] [PubMed]
  52. Wang, J.-J.; Wang, C.-J.; Huang, C.-C.; Lin, Y.-M. Transfer factors of 90Sr and 137Cs from paddy soil to the rice plant in Taiwan. J. Environ. Radioact. 1998, 39, 23–34. [Google Scholar] [CrossRef]
  53. Yasmin, S.; Barua, B.S.; Kamal, M.; Rashid, M.A. An analysis for distribution of natural radionuclides in soil, sand and sediment of Potenga Sea beach area of Chittagong, Bangladesh. J. Environ. Prot. 2014, 5, 1553. [Google Scholar] [CrossRef]
  54. Huang, W.-H.; Huang, C.-M.; Chen, T.-C.; Liu, Y.-Y.; Lin, C.-C.; Yeh, Y.-L. Soil to tobacco component transfer factors for natural radionuclides 40K, 226Ra, and 232Th and the risk assessment of tobacco leaf in smoking. J. Environ. Sci. Health Part A 2022, 57, 737–745. [Google Scholar] [CrossRef] [PubMed]
  55. Zubair, M. Measurement of natural radioactivity in several sandy-loamy soil samples from Sijua, Dhanbad, India. Heliyon 2020, 6, e03430. [Google Scholar] [CrossRef] [PubMed]
  56. Alaamer, A. Assessment of human exposures to natural sources of radiation in soil of Riyadh, Saudi Arabia. Turkish J. Eng. Environ. Sci. 2008, 32, 229–234. [Google Scholar]
  57. Özdemir Öge, T.; Özdemir, F.B.; Öge, M. Assessment of environmental radioactivity in soil samples from Bartın Province, Turkey. J. Radioanal. Nucl. Chem. 2021, 328, 149–162. [Google Scholar] [CrossRef]
  58. Veerasamy, N.; Sahoo, S.K.; Inoue, K.; Arae, H.; Fukushi, M. Geochemical behavior of uranium and thorium in sand and sandy soil samples from a natural high background radiation area of the Odisha coast, India. Environ. Sci. Pollut. Res. 2020, 27, 31339–31349. [Google Scholar] [CrossRef] [PubMed]
  59. Duong, N.T.; Van Hao, D.; Duong, D.T.; Phan, T.T.; Le Xuan, H. Natural radionuclides and assessment of radiological hazards in MuongHum, Lao Cai, Vietnam. Chemosphere 2021, 270, 128671. [Google Scholar] [CrossRef] [PubMed]
  60. Tufail, M.; Asghar, M.; Akram, M.; Javied, S.; Khan, K.; Mujahid, S. Measurement of natural radioactivity in soil from Peshawar basin of Pakistan. J. Radioanal. Nucl. Chem. 2013, 298, 1085–1096. [Google Scholar] [CrossRef]
  61. Beretka, J.; Mathew, P. Natural radioactivity of Australian building materials, industrial wastes and by-products. Health Phys. 1985, 48, 87–95. [Google Scholar] [CrossRef] [PubMed]
  62. EC-European Commission. Radiological protection principles concerning the natural radioactivity of building materials. Radiat. Prot. 1999, 112, 1–16. [Google Scholar]
  63. Lin, Y.-M.; Chen, C.-J.; Lin, P.-H. Natural background radiation dose assessment in Taiwan. Environ. Int. 1996, 22, 45–48. [Google Scholar] [CrossRef]
Figure 1. The geographical location of the campus, the sample location, and the corresponding codes for the collected soil samples.
Sustainability 17 00691 g001
Figure 2. (a) The linear correlation of 232Th activity concentration with 228Ra and 226Ra activity concentration in soils. (b) The linear correlation of 40K activity concentration with 232Th and 226Ra activity concentration in soils.
Sustainability 17 00691 g002
Figure 3. The frequency distribution and frequency cumulated percentage of concentration plots of the three radionuclides 40K (a), 226Ra (b), and 232Th (c) in soil samples.
Sustainability 17 00691 g003
Figure 4. (a) The line and scatter plot of activity ratios of 232Th/226Ra along with their global soil averages. (b) Histogram frequency distribution of activity ratios 232Th/226Ra and cumulated percentage of frequency.
Sustainability 17 00691 g004
Figure 5. The line and scatter plots of radiological hazard index along with the mean value plots Raeq (a), Hex (b), Dex (c), and AEDex (d).
Sustainability 17 00691 g005
Table 1. The soil samples’ GPS coordinates and activity concentrations of 40K, 232Th, 226Ra, and 228Ra (Bq/kg dw) along with their associated uncertainties (1 σ).
Sample No40K232Th226Ra228Ra
Bq/kg
1557.2 ± 2.655.3 ± 3.632.2 ± 5.563.4 ± 3.7
2454.6 ± 2.858.6 ± 4.030.6 ± 6.460.1 ± 3.9
3488.5 ± 2.648.9 ± 3.826.1 ± 5.451.2 ± 3.3
4492.7 ± 2.855.6 ± 4.230.9 ± 5.757.2 ± 3.4
5518.3 ± 2.656.5 ± 3.929.6 ± 5.358.4 ± 2.9
6509.6 ± 2.955.3 ± 4.130.2 ± 5.959.2 ± 3.5
7494.7 ± 2.655.7 ± 3.530.9 ± 5.361.6 ± 3.0
8579.9 ± 2.756.8 ± 4.632.0 ± 5.560.0 ± 4.1
9520.4 ± 3.058.0 ± 3.933.8 ± 6.361.3 ± 4.5
10531.3 ± 2.539.1 ± 3.824.6 ± 5.044.1 ± 3.4
11453.0 ± 2.853.6 ± 3.732.6 ± 5.554.8 ± 3.9
12534.8 ± 2.749.7 ± 3.828.3 ± 5.754.5 ± 3.7
13594.8 ± 2.760.3 ± 3.933.7 ± 5.963.6 ± 4.0
14532.1 ± 2.540.5 ± 4.221.8 ± 6.544.7 ± 3.7
15532.6 ± 2.553.9 ± 3.530.0 ± 5.260.7 ± 3.0
16471.4 ± 2.951.2 ± 4.129.8 ± 5.651.0 ± 3.7
17604.7 ± 2.543.0 ± 4.423.0 ± 6.742.5 ± 4.2
18393.6 ± 3.552.3 ± 4.634.6 ± 6.057.8 ± 4.5
19570.5 ± 2.857.0 ± 3.631.1 ± 6.565.9 ± 4.1
20493.3 ± 2.954.5 ± 4.330.5 ± 6.556.0 ± 4.7
21595.9 ± 2.455.5 ± 3.330.9 ± 5.257.5 ± 3.8
22614.8 ± 2.458.6 ± 3.533.4 ± 5.460.6 ± 3.8
23507.4 ± 2.948.8 ± 4.428.7 ± 5.755.9 ± 3.8
24447.0 ± 3.053.7 ± 4.135.0 ± 5.560.4 ± 4.2
25585.9 ± 2.456.3 ± 3.532.4 ± 5.263.1 ± 3.5
26663.1 ± 2.560.5 ± 4.135.1 ± 6.262.0 ± 4.9
27467.3 ± 2.642.8 ± 4.024.6 ± 5.844.5 ± 3.4
28578.7 ± 2.758.6 ± 4.530.8 ± 5.958.2 ± 3.5
29531.2 ± 2.749.7 ± 4.031.9 ± 6.555.4 ± 4.4
30488.8 ± 2.653.9 ± 3.528.8 ± 5.356.9 ± 3.2
31396.1 ± 2.946.0 ± 4.026.6 ± 5.551.4 ± 3.3
32534.9 ± 2.857.0 ± 3.929.7 ± 5.754.8 ± 3.6
33570.3 ± 2.541.2 ± 3.921.1 ± 6.841.8 ± 3.9
34553.8 ± 2.860.4 ± 4.032.4 ± 5.661.9 ± 3.1
35489.0 ± 2.641.9 ± 4.324.0 ± 5.645.7 ± 3.6
36474.7 ± 3.055.7 ± 3.829.3 ± 5.756.6 ± 3.5
37528.7 ± 3.054.0 ± 4.431.0 ± 5.758.3 ± 4.9
38508.2 ± 2.641.5 ± 4.226.2 ± 5.542.0 ± 3.8
39457.7 ± 2.741.2 ± 4.324.2 ± 5.541.2 ± 4.2
40457.1 ± 3.352.5 ± 4.428.1 ± 6.554.7 ± 4.7
41474.5 ± 2.853.4 ± 3.527.2 ± 5.352.0 ± 3.9
42499.4 ± 2.755.9 ± 3.630.5 ± 5.758.3 ± 3.3
43498.2 ± 2.755.4 ± 3.730.8 ± 5.555.7 ± 3.9
44497.4 ± 2.958.8 ± 4.532.8 ± 5.757.0 ± 4.3
45447.5 ± 3.258.1 ± 3.936.4 ± 6.058.8 ± 3.7
46457.1 ± 2.652.4 ± 3.729.6 ± 5.555.4 ± 2.9
47610.9 ± 2.658.9 ± 3.629.2 ± 5.759.7 ± 3.3
48418.7 ± 3.348.6 ± 4.830.0 ± 6.349.7 ± 5.6
49420.3 ± 3.251.2 ± 4.031.0 ± 5.953.3 ± 3.9
50514.1 ± 2.646.7 ± 4.124.7 ± 5.649.9 ± 3.6
51474.6 ± 2.954.3 ± 4.332.5 ± 6.159.7 ± 4.5
52474.6 ± 3.254.8 ± 4.430.7 ± 5.657.4 ± 3.7
53443.6 ± 2.952.4 ± 3.831.3 ± 5.455.0 ± 3.3
54539.4 ± 2.653.5 ± 3.933.8 ± 5.158.4 ± 3.4
55537.3 ± 3.052.9 ± 4.331.0 ± 5.851.3 ± 4.0
56434.8 ± 2.957.1 ± 3.833.7 ± 5.358.9 ± 3.2
57538.2 ± 2.850.9 ± 4.332.5 ± 6.055.8 ± 3.6
58378.4 ± 3.245.5 ± 4.430.0 ± 5.948.7 ± 3.7
59950.9 ± 2.266.1 ± 3.931.5 ± 6.161.3 ± 3.4
60593.7 ± 2.655.9 ± 3.233.5 ± 5.663.4 ± 3.7
61446.1 ± 3.054.8 ± 4.528.7 ± 6.751.4 ± 4.1
62495.1 ± 2.851.7 ± 3.931.1 ± 5.456.3 ± 4.2
63511.3 ± 2.555.3 ± 3.728.2 ± 5.557.0 ± 3.1
64491.3 ± 2.754.9 ± 4.032.0 ± 5.559.4 ± 3.2
65589.3 ± 2.758.3 ± 3.830.4 ± 5.758.3 ± 3.6
66465.7 ± 2.952.8 ± 4.229.3 ± 5.756.6 ± 3.3
67567.5 ± 2.952.0 ± 4.535.6 ± 5.451.0 ± 4.1
68569.5 ± 2.558.8 ± 3.531.4 ± 5.658.0 ± 3.8
69375.9 ± 3.457.5 ± 4.132.5 ± 5.657.7 ± 4.9
70432.2 ± 3.251.5 ± 4.329.5 ± 6.250.2 ± 3.7
71576.3 ± 2.759.9 ± 4.034.6 ± 5.561.9 ± 4.3
72487.4 ± 3.261.7 ± 4.332.5 ± 6.059.9 ± 3.7
73527.8 ± 3.050.1 ± 4.328.4 ± 6.450.7 ± 3.7
74551.0 ± 2.657.2 ± 3.830.9 ± 5.762.7 ± 3.3
75506.4 ± 2.952.1 ± 4.430.3 ± 5.558.3 ± 4.5
76425.3 ± 3.055.0 ± 4.134.7 ± 5.357.9 ± 3.3
77460.7 ± 3.047.4 ± 4.226.7 ± 6.448.3 ± 4.0
78381.6 ± 3.255.1 ± 4.338.2 ± 5.657.2 ± 3.5
79496.8 ± 2.751.5 ± 4.126.3 ± 5.750.7 ± 3.6
80514.4 ± 2.654.3 ± 4.031.0 ± 5.456.8 ± 3.2
81418.2 ± 3.048.4 ± 3.928.2 ± 5.652.7 ± 3.2
82463.5 ± 3.051.4 ± 4.026.6 ± 5.851.6 ± 3.5
83359.2 ± 3.446.8 ± 4.629.6 ± 6.349.2 ± 3.9
84449.6 ± 3.052.7 ± 4.427.5 ± 6.152.3 ± 3.6
85478.1 ± 2.750.5 ± 3.729.6 ± 5.255.1 ± 3.7
86505.6 ± 3.157.0 ± 5.031.1 ± 6.156.3 ± 4.9
87479.4 ± 2.849.9 ± 3.730.6 ± 5.456.1 ± 3.4
88428.0 ± 3.253.5 ± 4.027.9 ± 6.155.5 ± 4.1
89621.3 ± 2.454.4 ± 3.831.6 ± 5.062.2 ± 3.0
90481.5 ± 3.061.3 ± 3.936.9 ± 5.463.0 ± 3.2
91496.6 ± 2.956.3 ± 3.729.9 ± 6.660.5 ± 4.6
92531.9 ± 3.057.0 ± 5.330.5 ± 6.160.5 ± 4.5
93490.6 ± 2.856.4 ± 3.830.7 ± 5.557.5 ± 3.4
94419.8 ± 3.355.9 ± 3.730.3 ± 5.958.3 ± 3.5
95513.5 ± 2.756.7 ± 3.831.6 ± 6.060.4 ± 3.3
96540.6 ± 2.759.0 ± 3.631.0 ± 5.461.1 ± 3.4
97312.6 ± 3.344.9 ± 4.228.7 ± 5.447.6 ± 3.6
98520.4 ± 3.062.7 ± 4.130.3 ± 5.865.4 ± 3.5
99517.7 ± 2.754.2 ± 4.029.5 ± 5.660.7 ± 3.1
100527.9 ± 2.754.0 ± 4.028.9 ± 5.958.1 ± 3.3
101479.6 ± 3.256.5 ± 4.329.9 ± 5.859.1 ± 3.7
102557.3 ± 2.957.4 ± 4.029.4 ± 5.861.8 ± 4.3
103522.3 ± 3.154.3 ± 5.228.1 ± 7.056.7 ± 5.3
104569.5 ± 2.954.7 ± 4.329.6 ± 6.555.1 ± 4.1
105544.5 ± 2.644.8 ± 4.026.1 ± 5.949.3 ± 3.7
106723.8 ± 2.144.4 ± 3.726.6 ± 5.349.7 ± 3.9
107417.6 ± 3.557.6 ± 4.733.1 ± 6.659.3 ± 3.7
108485.9 ± 2.955.4 ± 4.329.8 ± 5.854.7 ± 3.5
109482.4 ± 3.054.9 ± 4.132.9 ± 6.557.0 ± 5.3
110463.6 ± 2.849.3 ± 3.826.4 ± 5.851.0 ± 3.5
111422.0 ± 3.456.7 ± 4.431.9 ± 6.160.1 ± 3.8
112565.0 ± 2.656.3 ± 3.627.8 ± 5.855.7 ± 3.4
113514.2 ± 2.553.3 ± 3.627.6 ± 5.353.9 ± 3.2
114457.8 ± 2.953.4 ± 4.426.8 ± 6.356.3 ± 4.1
115432.4 ± 3.055.4 ± 3.731.2 ± 5.962.0 ± 3.9
116485.4 ± 2.948.2 ± 4.427.6 ± 6.653.8 ± 4.5
117475.3 ± 2.651.7 ± 3.627.8 ± 5.553.3 ± 3.2
118497.2 ± 2.847.5 ± 4.928.0 ± 5.948.5 ± 4.6
119504.4 ± 3.056.6 ± 4.230.4 ± 6.756.2 ± 4.8
120432.1 ± 3.153.6 ± 3.831.8 ± 5.460.0 ± 3.3
Table 2. Descriptive statistics of activity concentrations of 40K, 226Ra, and 232Th in soils.
Parameters40K232Th226Ra232Th/226Ra
Mean, Bq/kg504.553.430.11.78
SD a, Bq/kg75.45.13.00.13
Minimum, Bq/kg312.639.121.11.44
Maximum, Bq/kg950.766.138.22.10
Median, Bq/kg497.354.330.41.78
Kurtosis9.800.570.77−0.13
Skewness1.78−0.73−0.29−0.21
CV, %15.09.510.07.3
p-value b0.270.090.440.68
Global average, Bq/kg42045321.41
a standard deviation; b normality test by K-S method.
Table 4. Descriptive statistics of investigated radiological hazard indices in the studied soils.
ParameterRaeq (Bq/kg)Dex (nGy/h)HexAEDex (μSv/y)
Mean145.267.20.3982.4
SD a12.25.70.037.0
Minimum117.053.40.3265.5
Maximum199.394.20.54115.5
Median146.467.50.4082.8
Kurtosis2.513.432.513.43
Skewness0.360.610.360.61
CV8.48.58.48.5
p-value b0.540.580.130.54
a standard deviation; b normality test by K-S method.
Disclaimer/Publisher’s Note: The statements, opinions and data contained in all publications are solely those of the individual author(s) and contributor(s) and not of MDPI and/or the editor(s). MDPI and/or the editor(s) disclaim responsibility for any injury to people or property resulting from any ideas, methods, instructions or products referred to in the content.

