Article

Spatial Association and Quantitative Attribution of Regional Ecological Risk: A Case Study of Guangxi, China

College of Geography and Planning, Nanning Normal University, Nanning 530001, China
Sustainability 2025, 17(19), 8739; https://doi.org/10.3390/su17198739
Submission received: 22 August 2025 / Revised: 25 September 2025 / Accepted: 26 September 2025 / Published: 29 September 2025
(This article belongs to the Special Issue Sustainable and Resilient Regional Development: A Spatial Perspective)

Abstract

Regional ecological risk assessment (RERA) is a valuable tool for analyzing ecological risks at a broad-scale whose potential needs to be further exploited, especially when it comes to the in-depth mining of the final risk. Thus, in this research, based on RERA results acquired through land use function valuation and the ecological risk source-receptor-vulnerability framework, spatial autocorrelation analysis and geographical detector methods were employed to explore the spatial association features of regional ecological risk and its significant influencing factors in Guangxi, China. Next, a bivariate local spatial autocorrelation analysis tool was used to manifest the spatial impact directions of the important affecting factors on the final risk. The results of the study indicate that: (1) the north and west parts of Guangxi had a higher final ecological risk than that of the southeast; (2) from a percentage viewpoint, the low, medium, high, and very high levels of ecological risk accounted for 41.85%, 28.31%, 21.86%, and 7.98% of the total area, respectively; (3) the final regional ecological risk exhibited significant positive spatial correlation (Moran’s I = 0.466, p = 0.000) and the high-high association type was concentrated in the north and west parts of Guangxi while there was a low-low type in the southeast; (4) the most significant influencing factors for final risk consisted of lithology, land use ecology and production functions, slope, and soil; (5) compared with ecology and production functions, lithology, slope, and soil exhibited stronger positive influences on the final risk. Spatial association and quantitative attribution studies can increase the deepness of RERA and undoubtedly advance this field in the future. Moreover, based on the findings from the spatial quantitative attribution analysis, more explicit sustainable development countermeasures could be determined for the region.

1. Introduction

With the focus on the possible damage of ecosystems, ecological risk research has gained a lot of concerns and has become more popular in the eco-environmental protection fields since the 1980s [1,2,3,4]. The assessment scale has shifted step by step from a single point where a simple cause–effect link is considered [5] to regional/landscape scales where the nonlinear complex relationship between risk sources and receptors needs to be taken into account [3,6,7,8,9]. Among them, regional ecological risk assessment (RERA) is an important comprehensive characterization method for ecological risk on the broad-scale [5,10,11,12]. As it can deal simultaneously with a series of ecological risk sources and receptors through the indicator normalization procedure [10,13], this method has been applied successfully for the comprehensive assessment of environmental issues and management purposes all over the world [9,13,14,15,16,17,18].
However, within the previous pertinent studies, the depiction and explanation of the RERA results were almost all based on qualitative approaches [3,4,19], and the in-depth mining of results with quantitative approaches has rarely been carried out. Specifically, apart from area proportion analysis, almost no other methods have been adopted for the quantitative expression of RERA results [3,12,19]. Thus, the combination of RERA with potential spatial quantitative analysis tools for the further exploration of results is urgently needed. In this aspect, spatial autocorrelation analysis and geographical detector tools are promising research methods. For example, spatial autocorrelation analysis can exhibit the spatial association features of landscape ecological risk [7,8,20,21], whereas a geographical detector can manifest its dominant influencing factors quantitatively [22,23,24]. However, as another important broad-scale ecological risk assessment framework, the RERA has not achieved the same incorporation level of these two quantitative analysis tools for the depiction and explanation of its results [3,4,9,11,12,19]. Up to now, these two kinds of methods have been widely used in a series of eco-environmental evaluation research fields [7,21,22,23,24,25,26,27] and achieved great success on the whole. Therefore, these two helpful spatial analysis tools are needed for RERA study to deepen the quantitative exploration levels of the final regional ecological risk.
In order to resolve this problem, spatial autocorrelation analysis and geographical detector tools were employed in this RERA study to characterize the spatial association features of final regional ecological risk and ascertain the significant affecting factors. To realize the intended purpose, the final regional ecological risk needed to be acquired first. Therefore, a karst concentrated area (i.e., the Guangxi Zhuang Autonomous Region [28,29,30,31], China) was first selected as the case study area for the proposed research. Then, the final ecological risk of Guangxi was obtained by using the production-living-ecology land use function valuation method [32,33,34,35] and the ecological risk source-receptor-vulnerability framework [9], an extensively adopted framework for RERA research. Finally, based on the RERA results, the spatial association features and significant influencing factors of final regional ecological risk were analyzed quantitatively with the help of the two kinds of methods. This study can enhance the depth of RERA research and hopefully advance this field in the future. Furthermore, this study can also help promote sustainable development of the region by explicitly linking management strategies with the findings of the spatial quantitative attribution analysis.

2. Materials and Methods

2.1. Study Area

The Guangxi Zhuang Autonomous Region (104°29′–112°04′ E, 20°54′–26°23′ N) is located in the southwestern of China. It has a total area of 23.8 × 10⁴ km2 consisting of 14 prefectures (Figure 1) and a total population of about 5.6 × 10⁷ persons comprising Han and other nationalities (e.g., the Zhuang minority) [36]. In terms of terrain, from north and northwest to the southeast, this region has been transformed step by step from the extension of the Yunnan-Guizhou Plateau into a series of basins and plains and hills. In particular, the highest point of Guangxi, Maoer Hill, is located in Guilin City with an elevation of 2141 m above sea level [37]. Moreover, because of the frequent appearance of karst stratum, a series of peak-cluster depressions are widely distributed in the southwest and northwest parts of Guangxi [38]. With regard to climate, a sub-tropical monsoon climate is the main climate type of the region with an annual average temperature of 22.3 °C and annual average precipitation of 1500 mm [36]. Due to the fragile eco-environment and irrational human disturbances, soil erosion, and subsequent karst rocky desertification (KRD) hazards, referring to land degradation featured by serious soil erosion, extensive bedrock exposure and the appearance of a desert-like landscape [28,29,30,31] are severe sustainable development issues faced by the region [28,39].

2.2. Data Source

There were mainly six categories of data used in this study, referring to land use/land cover (2020) with second-level classification information, slope, annual normalized difference vegetation index (NDVI) (2020), soil type, annual aridity (2020), and karst distribution rectification (lithology) datasets. Specifically, the land use/land cover, NDVI, soil, aridity, and karst distribution datasets were obtained from the Resource and Environment Data Cloud Platform, Institute of Geographic Sciences and Natural Resources Research, Chinese Academy of Sciences (https://www.resdc.cn/). In contrast, the slope dataset was acquired from China’s Geospatial Data Cloud platform (http://www.gscloud.cn/). Because the land use/land cover, NDVI, and aridity data were all from the same year (2020), the temporal consistency of datasets within this work is guaranteed. Moreover, the basic geographical information data used in this research were mostly obtained from the 1:1,000,000 basic geographical information database of the National Catalog Service for Geographic Information Systems (https://www.webmap.cn). Using the datasets, all the maps were produced in the ArcGIS and GeoDa platforms (the Albers Conic Equal Area Projection System was selected in the mapping process) whereas bar graphs and the heatmap were produced with the help of Origin 2024. All the raw data were transferred to 1 × 1 km grids before using them for RERA calculation and further spatial autocorrelation and geographical detection analyses.

2.3. RERA Indicator System Establishment

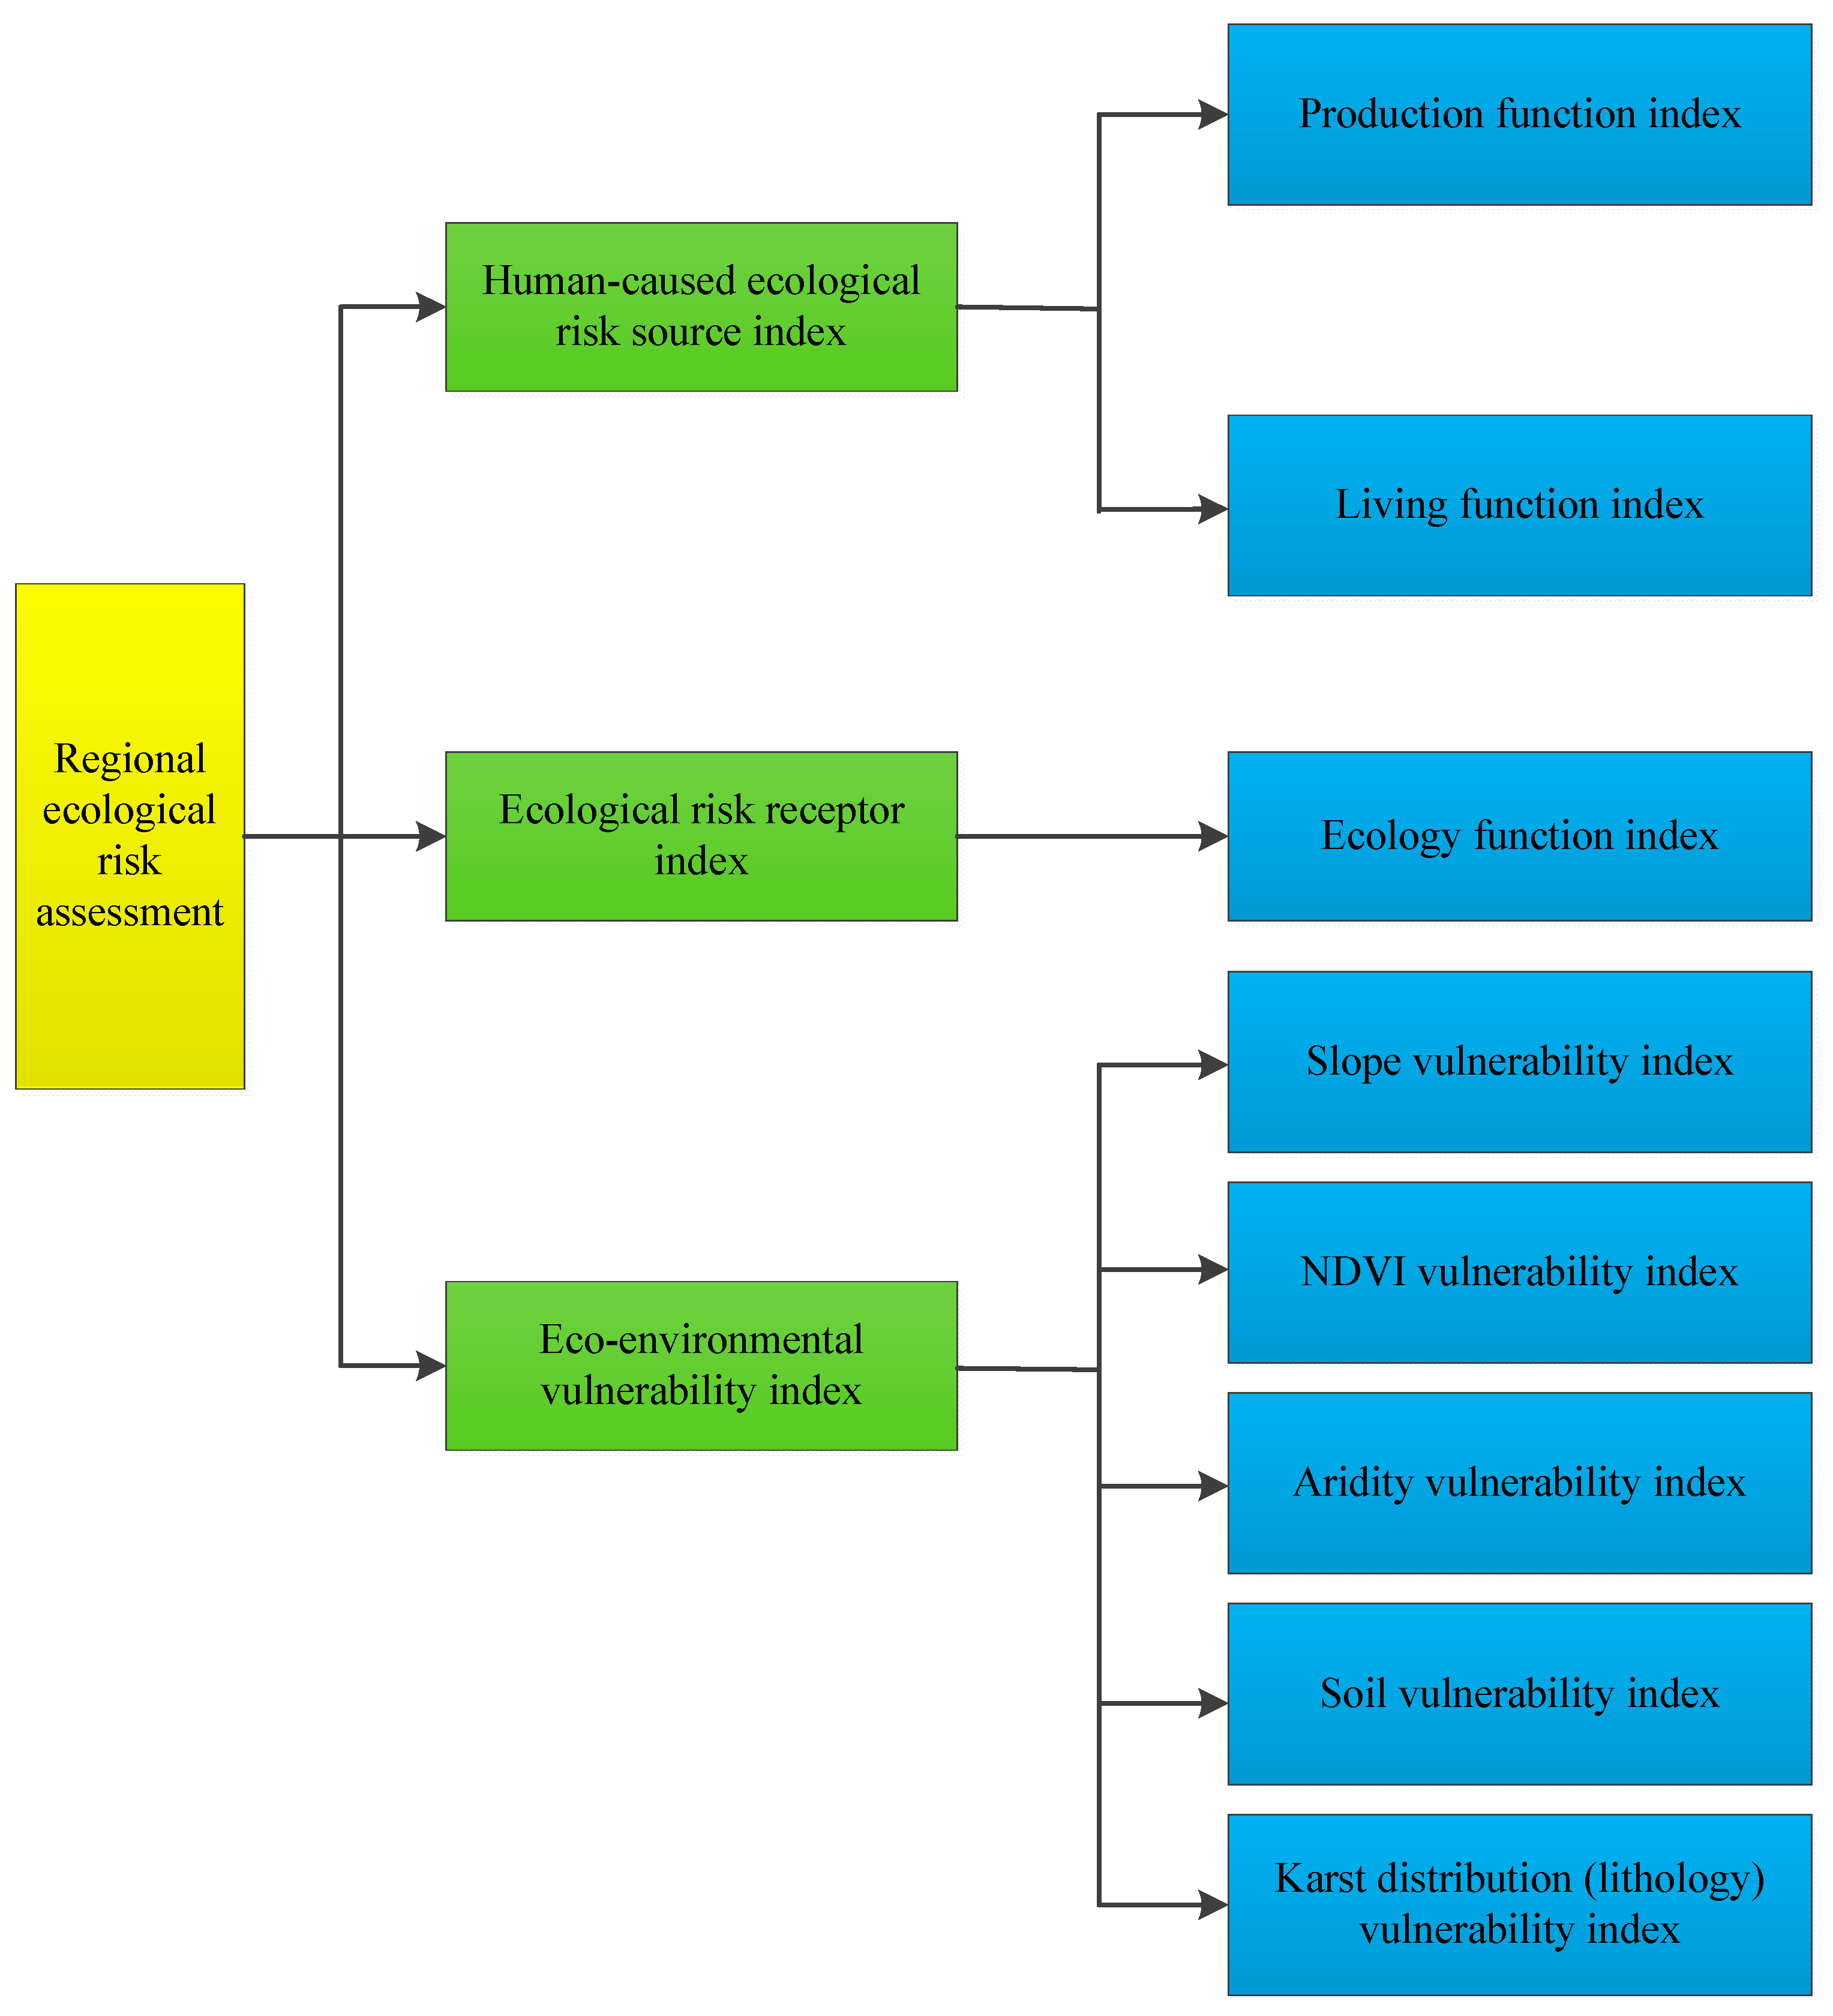
Through employing the production-living-ecology land use function manifestation scheme [32,33,34,35] and ecological risk source-receptor-vulnerability RERA framework [3,9], the RERA index system of Guangxi, China was finally established. Among them, the production function indicates material supplies for human society (i.e., provision function of products from the agricultural and secondary and tertiary industries); living function includes residing, employing, educating, transporting, security maintaining, and leisure provision for human beings; and the ecology function constructs the support foundation for humans, referring to a series of natural ecosystem services (e.g., soil protection, waste treatment, biodiversity conservation and climate regulation) [12,19,32,33,34,35]. Correspondingly, land use production and living functions constituted regional human-related ecological risk sources whereas ecology function was used as the ecological risk receptor within the RERA context [12,19]. Furthermore, the integrated eco-environmental vulnerability of the region was acquired by weighted stacking of the slope, soil, NDVI, aridity, and lithology vulnerability traits of the study area.
The whole RERA index system for this research is shown in Figure 2.

2.4. Regional Ecological Risk Calculation

2.4.1. Production-Living-Ecology Land Use Function Valuation

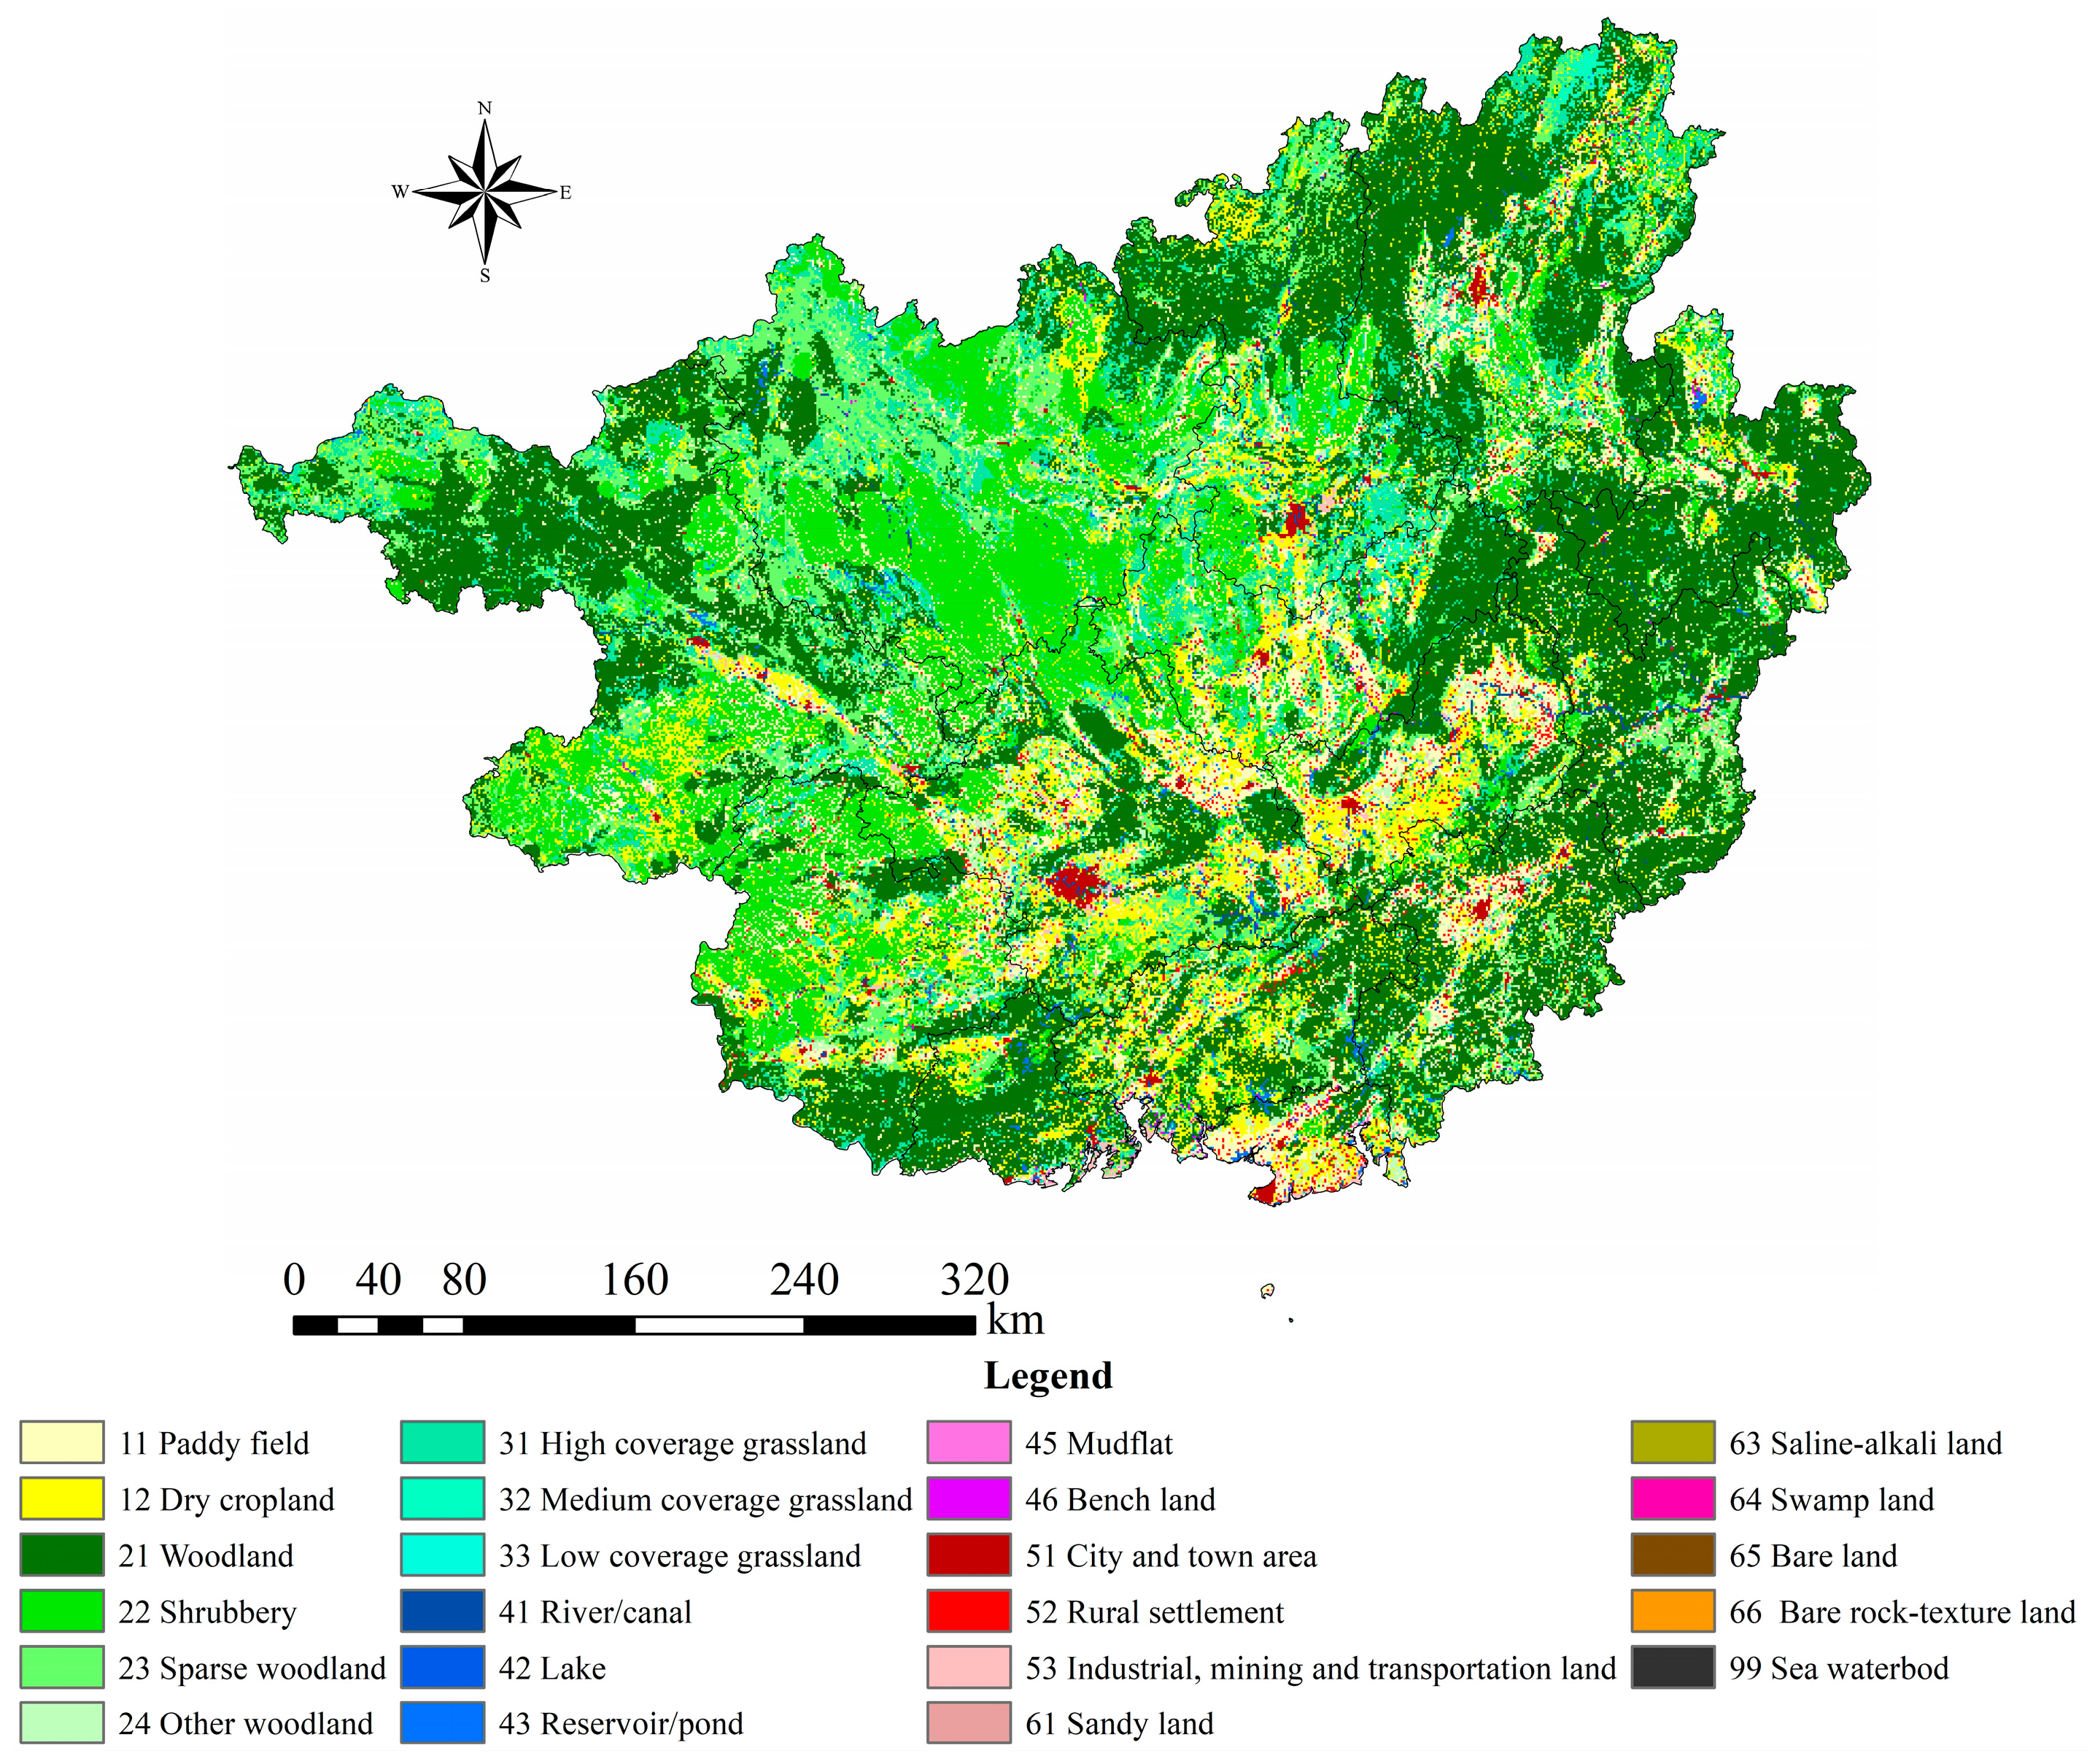
The land use data in 2020 with a second-level classification system (Figure 3) were used for the valuation purpose of regional production-living-ecology land use functions. Using the artificial valuation method and the references’ expertise [32,33,34,35], the adapted land use functions with values 1–4 [12] were derived as follows (Table 1).

2.4.2. Risk Source Intensity Calculation

The formula employed for calculating human-related ecological risk source intensity is as follows:
H = F p r o d u c t i o n × w 1 + F l i v i n g × w 2
where H is the final human-related ecological risk source intensity, F p r o d u c t i o n and F l i v i n g are the final ranking values of production and living function indices of the region, respectively, whereas w 1 and w 2 are the weights of the two indicators. In this study, the value 0.5 was assigned to both w 1 and w 2 [12,19] which means that the importance of the two indicators was considered equal for the expression of human-caused ecological risk source intensity. Likewise, the final value of H was then partitioned into four grades (namely values 1, 2, 3 and 4) for the subsequent calculation procedure.

2.4.3. Eco-Environmental Vulnerability Calculation

First, the comprehensive eco-environmental vulnerability of Guangxi was acquired by the following formula [9,12,19]:
V = k = 1 s w k f k
where V refers to the comprehensive eco-environmental vulnerability of Guangxi, wk refers to the weight of the kth specific vulnerability index, fk refers to the normalized grading value (i.e., 1, 2, 3, and 4) of the concrete vulnerability index, s refers to the number of eco-environmental vulnerability factors used in this formula, and 0 < k < s + 1.
Based on pertinent karst studies [28,29,40] and previous RERA research [3,41], four eco-environmental vulnerability indices were taken into account in Formula (2) (i.e., slope, NDVI, soil, and aridity indices). The normalized value of fk (slope, NDVI and aridity) was mainly acquired through ArcGIS’s “natural breaking point” algorithm [3,7,8,9,11,12], a widely used ranking method in related studies that helps minimize within-class variance and maximize between-class variance, thus revealing inherent breakpoints as well as classification boundaries for continuous datasets [42]. On the contrary, the wk value was obtained with the help of the artificial valuation method [3,12]. Furthermore, the soil vulnerability grading values were produced according to every soil type’s capacity in terms of carbon sequestration, organic matter maintaining, and anti-erosion [43,44,45]. In this procedure, because the soil erosion degree normally decreases with the severity rising of KRD hazard where the outcropping bedrocks’ interception and gathering effect for rainwater can reduce the actual soil erosion within karst fissures and pores [25,46,47,48], the bare rocks of Guangxi were assigned the soil vulnerability grade value of 1 in this study. As for wk, the weights assigned for slope, NDVI, soil, and aridity were 0.3, 0.3, 0.2, and 0.2, respectively, in line with their significance for the comprehensive eco-environmental vulnerability manifestation purpose [3,41] of a region. In other words, theoretically, the slope and NDVI factors have stronger impacts on the regional comprehensive eco-environmental vulnerability than those of soil and aridity. Empirically, this weighting scheme was derived from a series of previous related RERA studies [3,9,41]. Then, considering the natural condition of Guangxi [28,29,30,40], the karst distribution rectification factor referring to the bedrocks’ lithological trait (containing carbonate strata or not) was employed for the final integrated eco-environmental vulnerability expression of the study area. Based on a previous eco-environmental vulnerability rectification scheme for RERA [3,41], the final vulnerability of karst distribution areas was added as a value of 1, whereas the non-karst area’s value remained unchanged. Finally, the final integrated eco-environmental vulnerability of the region was obtained and then grouped into four grades before further processing using the natural breaking point method of ArcGIS 10.2. The integrated eco-environmental vulnerability manifestation scheme of Guangxi is shown in Table 2.

2.4.4. Final Regional Ecological Risk Calculation

The final ecological risk levels of the region were acquired through the following formula [3,9]:
R = f(H) × g(V) × h(E)
where f, g, h are the employed calculation functions for H, V, and E, respectively. As above-mentioned, H, V, and E are the human-related ecological risk source intensity, risk receptor capital (i.e., ecology function in this research), and integrated eco-environmental vulnerability, respectively, and all three indicators were first normalized into ranks 1, 2, 3, and 4 before calculating the final regional ecological risk index R. Then, after the calculation, the R value was partitioned into four levels (1, 2, 3 and 4) with the help of the natural breaking point method, and the RERA purpose was realized eventually.

2.5. Spatial Autocorrelation Analysis

Spatial association feature of the final ecological risk of the region was analyzed through the spatial autocorrelation analysis method [7,20,21,49] including global and local Moran’s I indices employed within this research.
The global Moran’s I index was calculated based on the following formula [7,8,22,50]:
G l o b a l   M o r a n s   I = n i = 1 n j = 1 n w i j ( x i x ¯ ) ( x j x ¯ ) i = 1 n j = 1 n w i j i = 1 n ( x i x ¯ ) 2
where n refers to the number of final ecological risk grid cells, xi and xj refer to the calculated values of ecological risk in adjacent paired spatial grid cells unit i and unit j (ij), x ¯ refers to the average value of xi, wij refers to the adjacent relationship between grid cells i and j [7,8]. If grid cells i and j are adjacent, wij equals 1, but if grid cells i and j are not adjacent, wij equals 0 [7]. Moreover, the range of global Moran’s I value is [−1, 1]: I < 0 means a negative correlation and that dissimilar risk values cluster together; likewise, I = 0 means no correlation, and I > 0 means a positive correlation and that similar risk values cluster together in the study area [7,8,50].
On the other hand, the local Moran’s I index was calculated based on the following formula [22,50,51]:
L o c a l   M o r a n s   I = n ( x i x ¯ ) j = 1 n w i j ( x j x ¯ ) i = 1 n ( x i x ¯ ) 2
where n is the number of samples, xi and xj are the attribute values of grid cells i and j, respectively, x ¯ is the mean attribute value of all data, and wij is the spatial weight matrix [22,51]. The local Moran’s I index can identify the local spatial association types of high and low ecological risk values [8]. In this regard, a high positive value means that a unit area has a similar high or low value as its neighbors, whereas a high negative value indicates that the corresponding spatial location is different compared with its surrounding areas [7]. A high-high (H-H) association represents a significant spatial cluster of high ecological risk values, and the low-low (L-L) association represents a significant cluster of low ecological risk values; on the contrary, high-low (H-L) and low-high (L-H) cluster types show that the high ecological risk unit is surrounded by low ecological risk values and the low ecological risk unit is surrounded by high ecological risk values, respectively [7,8].
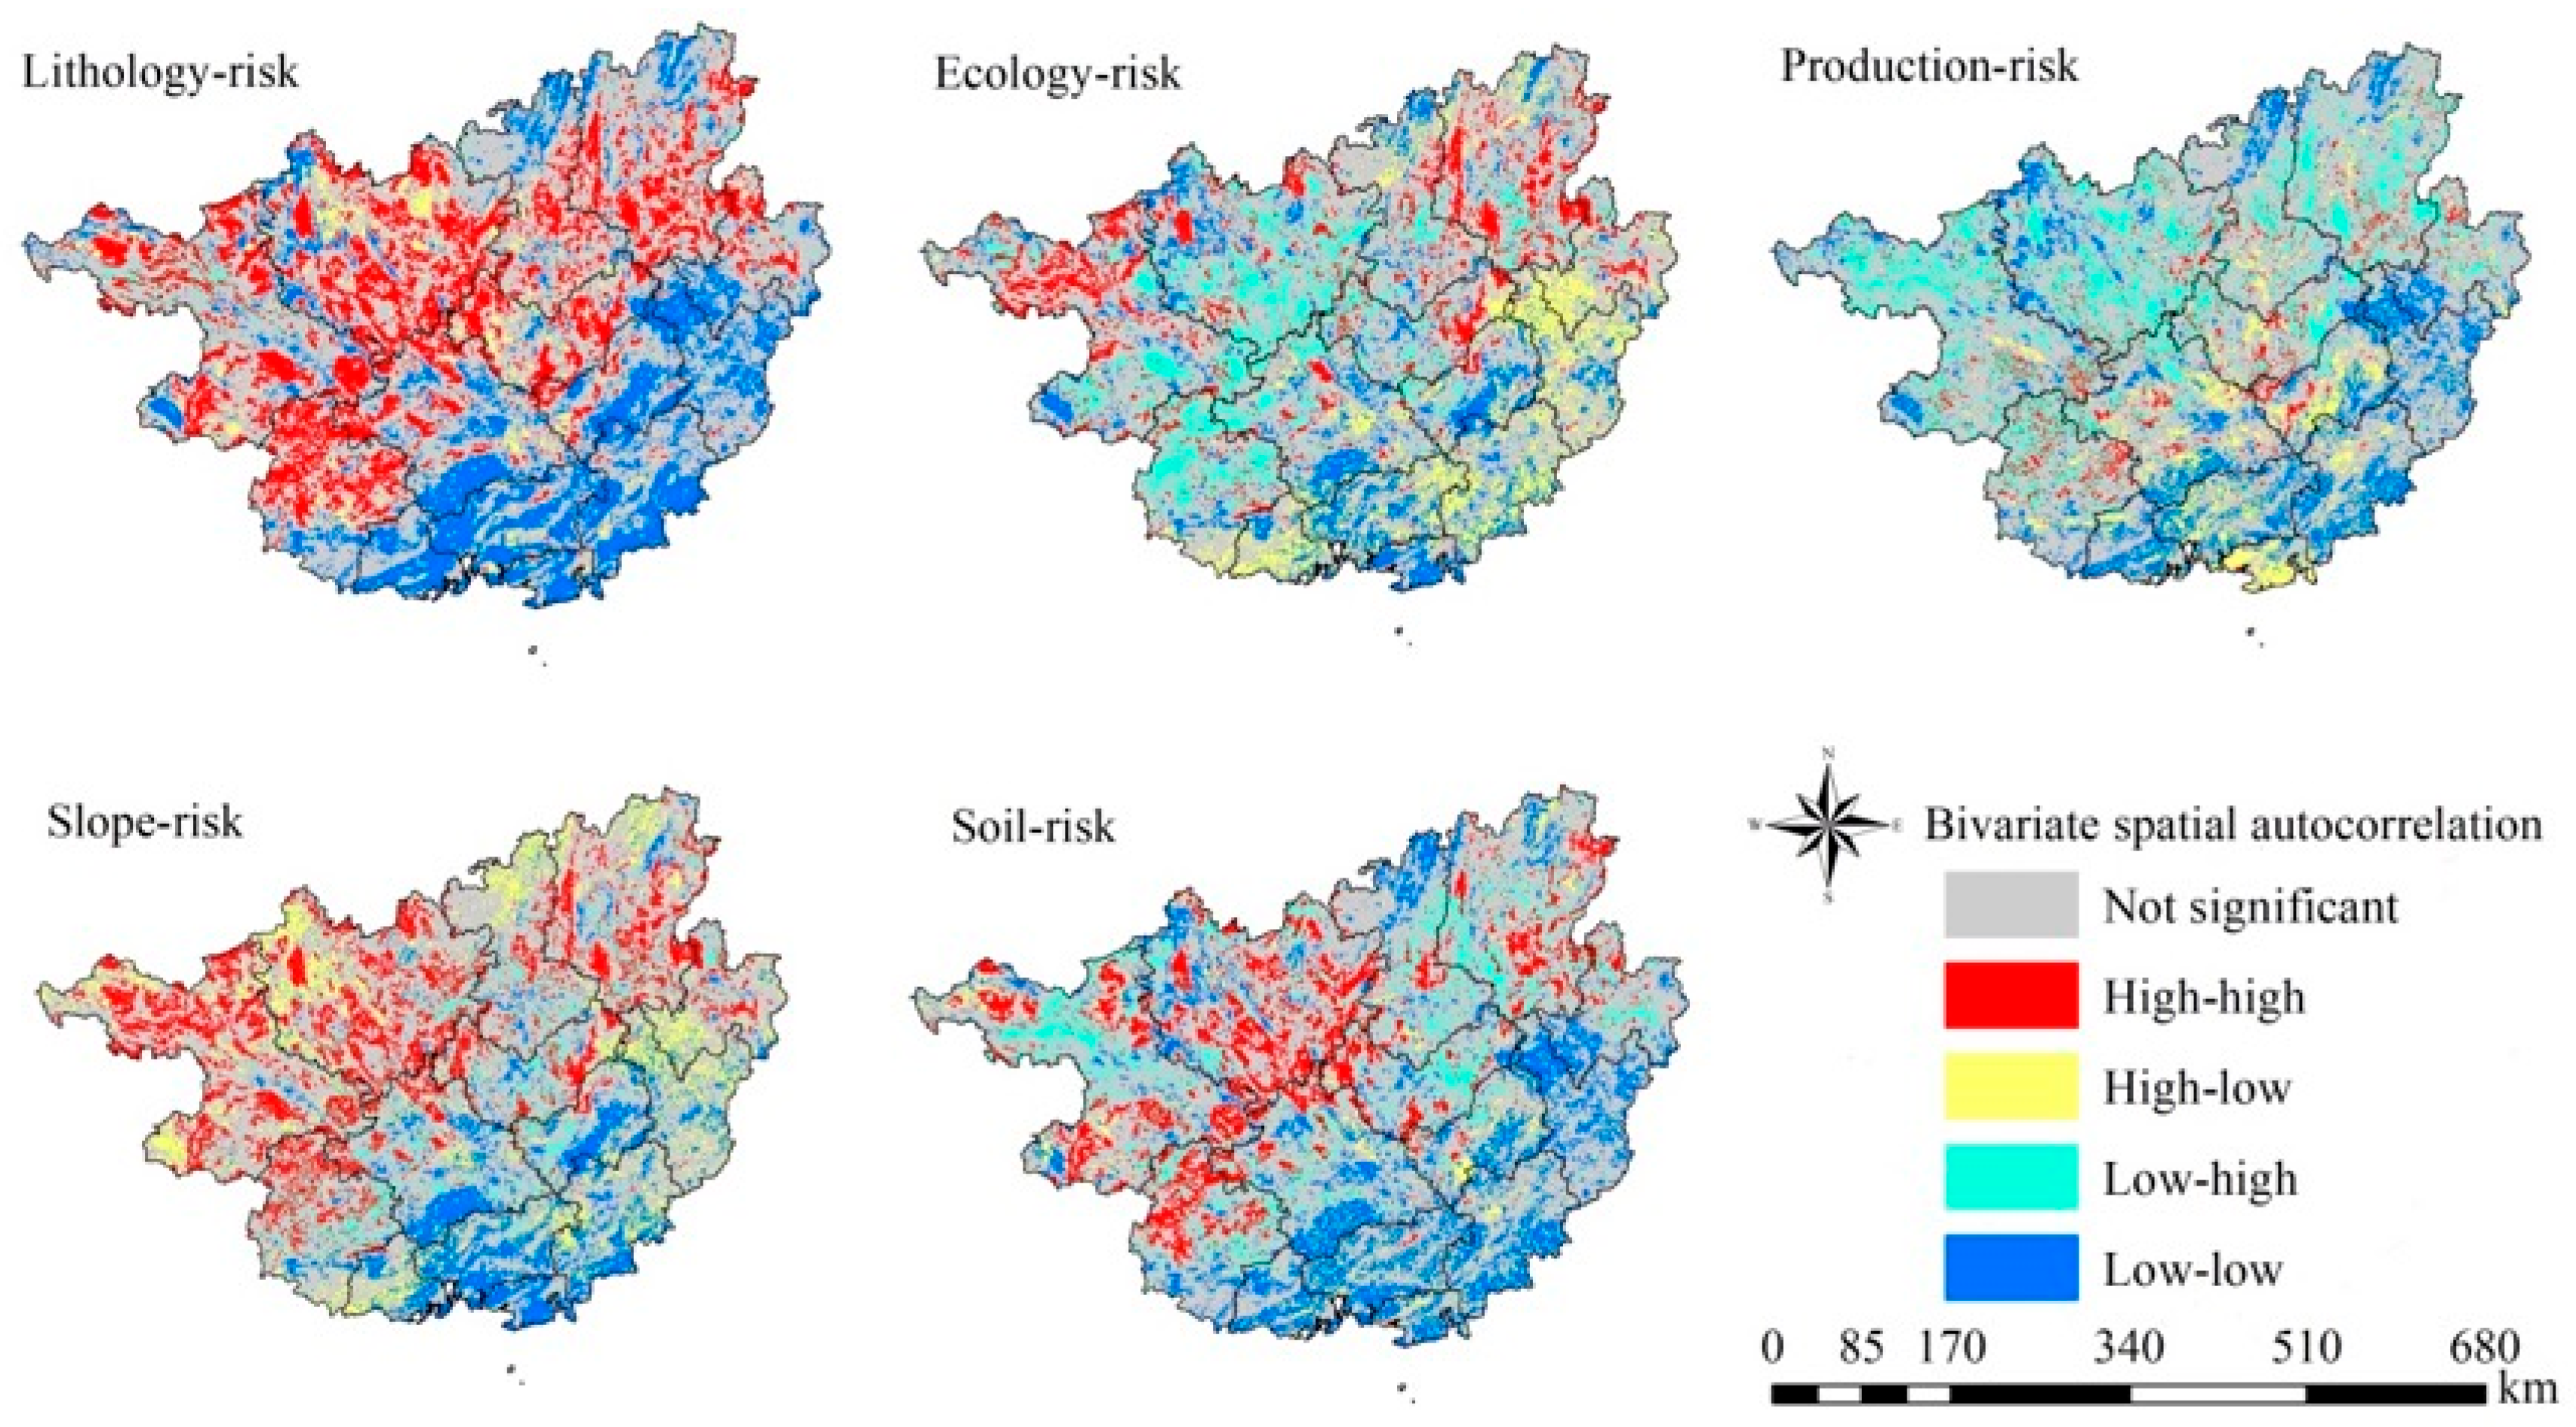
Moreover, to further explore the spatial affecting directions (positive, negative, or not significant) between the influencing factors and final regional ecological risk and clustering patterns [27], the bivariate local spatial autocorrelation analysis tool [27,52,53,54,55] was also employed in this research. Using this tool, the H-H, L-L, H-L, and L-H spatial association features [26,55] between the final risk and a number of significant influencing factors chosen by geographical detector were analyzed. Within this process, the final risk index was selected as the dependent variable y whereas those significant affecting factors were chosen as the independent variable x [27].
The formula for the bivariate local spatial autocorrelation analysis [53,54,56] is as follows:
B i v a r i a t e   L o c a l   M o r a n s   I = x i k x k ¯ σ k j = 1 n ( w i j x j I x I ¯ σ I )
where x i k and x j I are the k risk factor index’s value of the i-th unit and the I final risk index’s value of the j-th unit, respectively, x k ¯ is the average value of the risk factor index k, x I ¯ is the average value of the final risk index I, σ k and σ I are variances of the risk factor index k and final risk index I, respectively, n is the number of analysis units, and w i j is the spatial weight between units i and j [53,54,55,56].
In particular, all of the above-mentioned spatial autocorrelation analyses were completed within the GeoDa and ArcGIS platforms.

2.6. Geographical Detection Analysis

Geographical detector is a useful tool for the quantitative detection of significant influencing factors within landscape ecological risk assessment research [22,23,24]. Therefore, it was adopted in this quantitative attribution analysis study for RERA, another important broad-scale ecological risk assessment framework. In this regard, the factor detector calculation formula [25,57] is as follows:
q = 1 h = 1 L N h σ h 2 N σ 2
where q represents the explanatory power of independent variable X for the dependent variable Y, namely the explanatory power of a number of risk source-receptor-vulnerability indicators for the final regional ecological risk within this study, h is the stratification of variable Y or variable X, Nh and N are the total number of grid units in strata h and the whole region, and σ h 2 and σ2 are the variances of the Y factors for layer h and the whole region, respectively [58]. The range of the q value is [0, 1] [25,57]. The greater the q value, the larger the explanatory power of the independent variable X for the dependent variable Y, also meaning that the explanatory power of the certain risk source-receptor-vulnerability factor for spatial differences in regional ecological risk is greater [25,26,57].
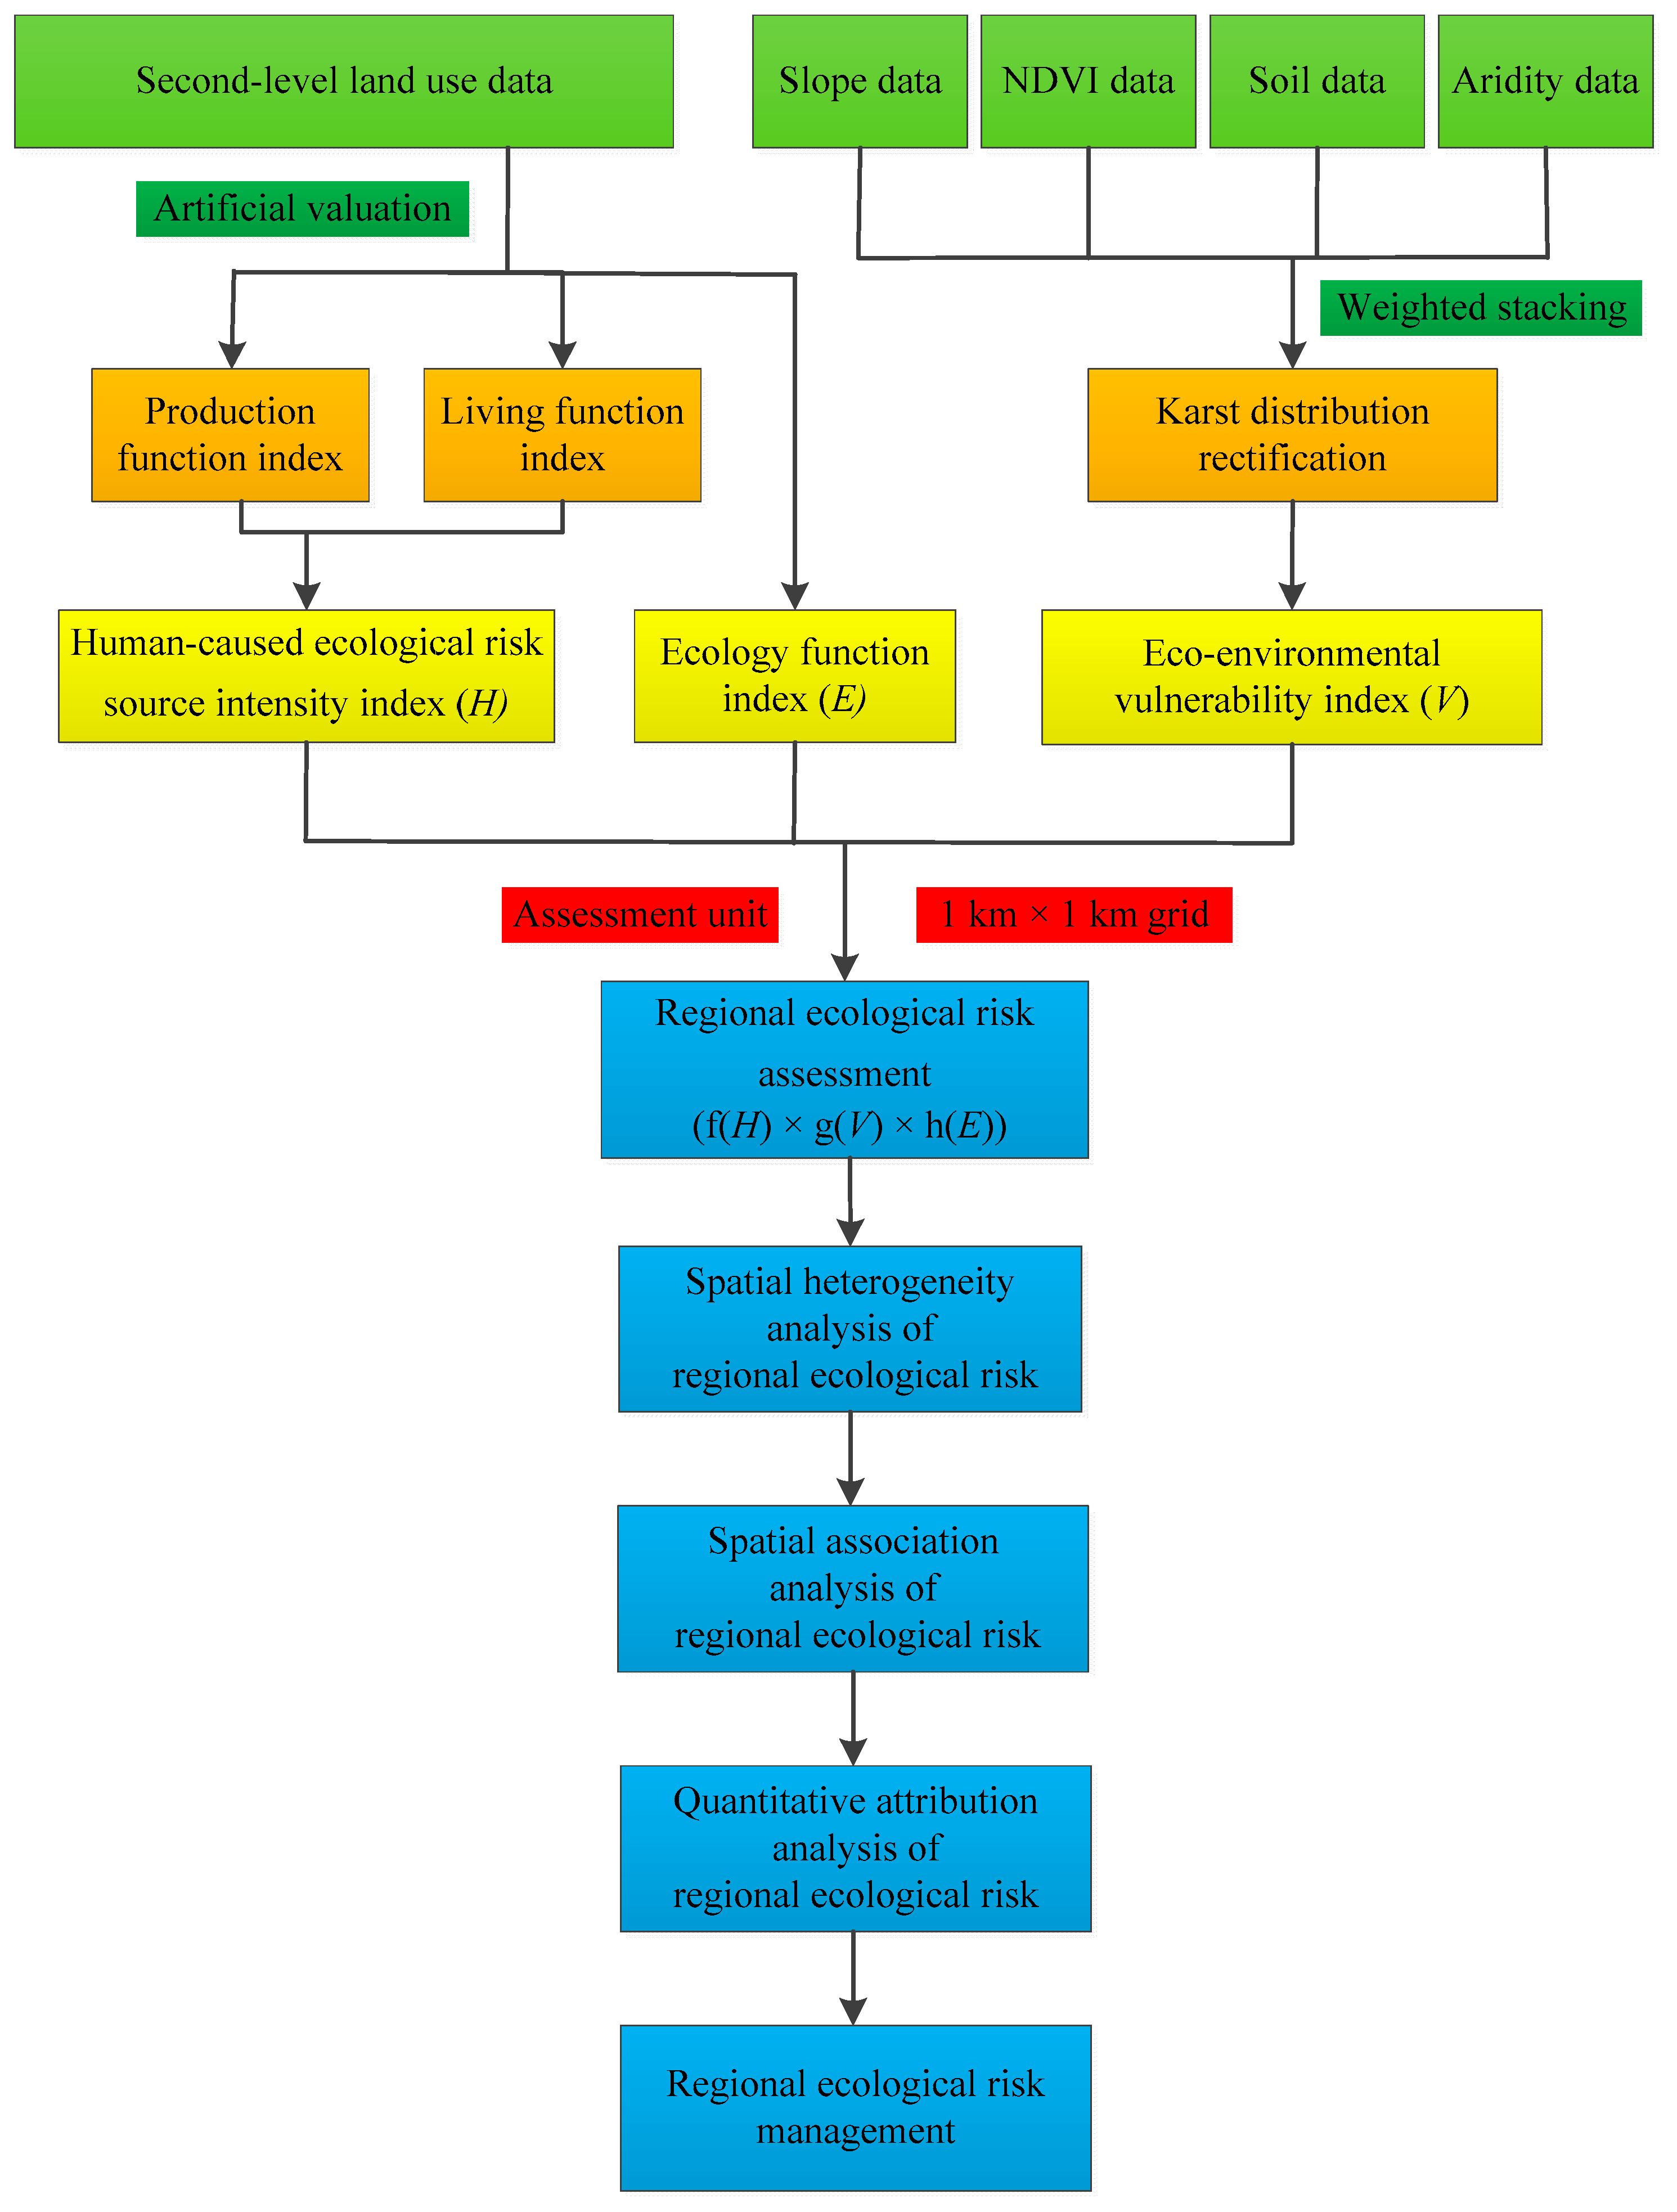
The whole flowchart of this research is shown in Figure 4.

3. Results

3.1. Regional Ecological Risk Calculation Result

3.1.1. Ecological Risk Source Intensity

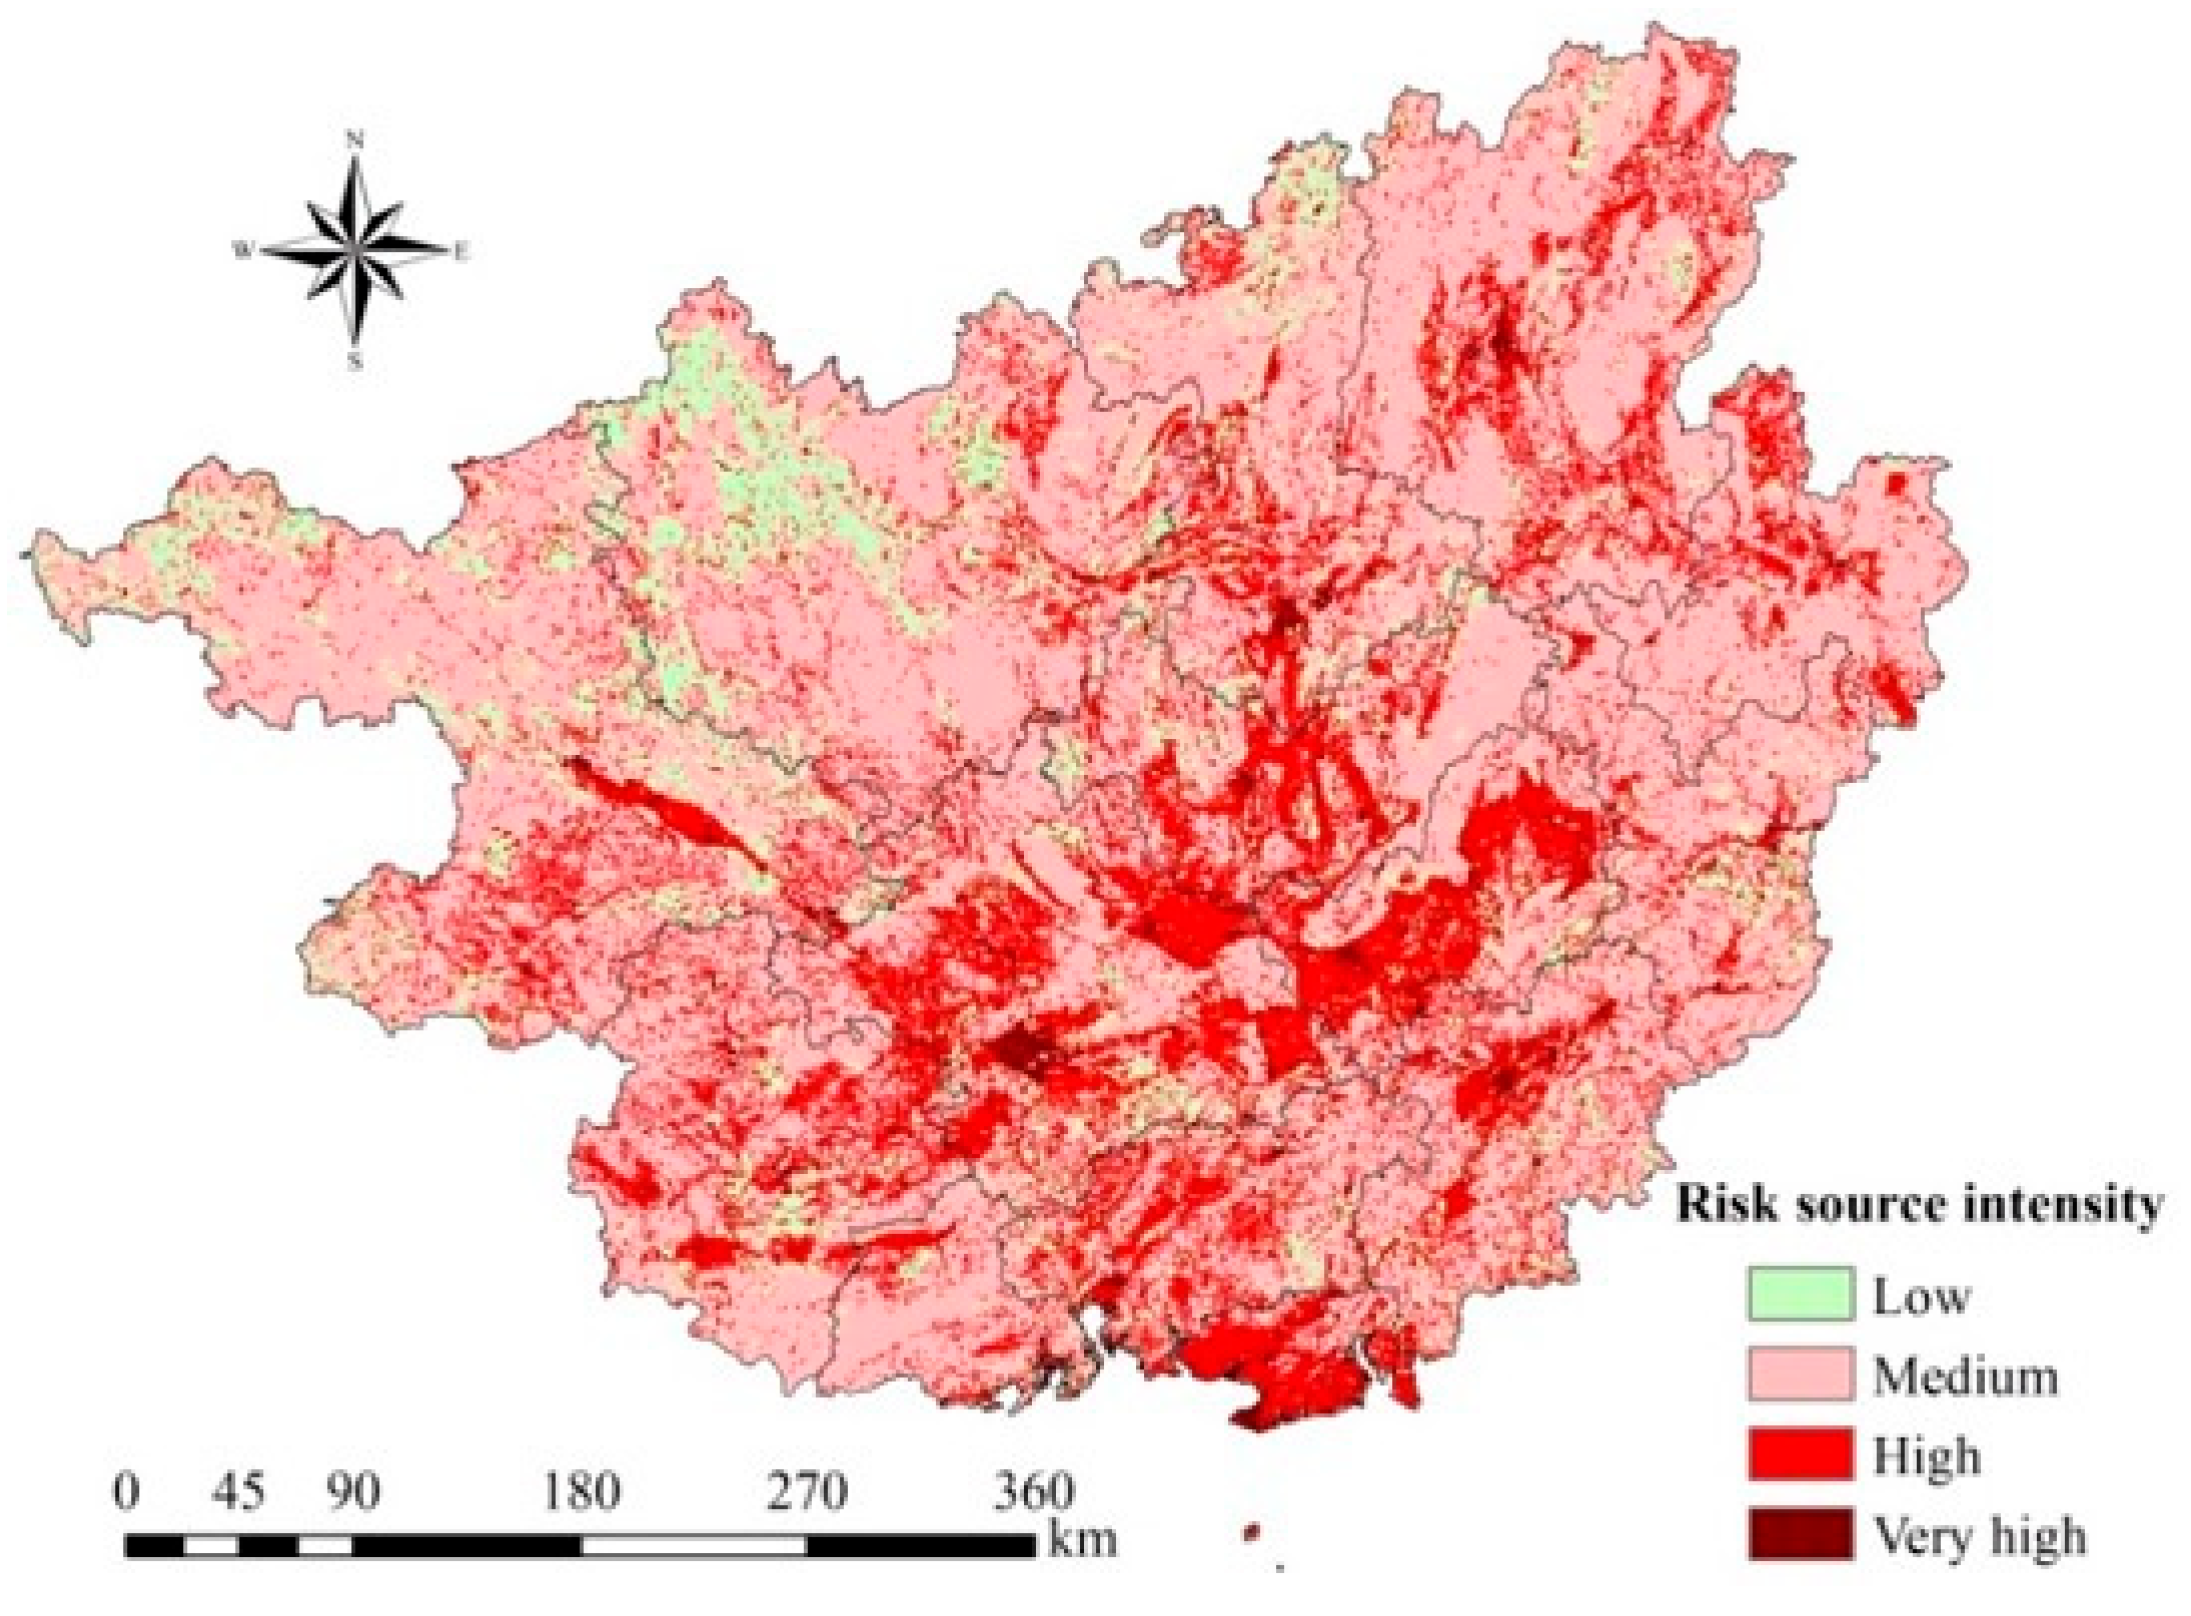
The regional human-caused ecological risk source intensities are shown in Figure 5. Basically, the very high-degree risk source intensity mainly denotes the scope of the construction lands and the high degree indicates the distribution of croplands, waterbodies, and other types of economic forests (e.g., tea/fruit gardens). Furthermore, the low and medium levels as shown in Figure 5 mainly manifested the scopes of natural forestlands, grasslands, and unused lands. From a proportion point, the low, medium, high, and very high levels of human-caused ecological risk source intensity accounted for 12.21%, 60.47%, 24.63%, and 2.69%, respectively, of the whole region.

3.1.2. Ecological Risk Receptor Capital

The ecological risk receptor capitals of Guangxi are shown in Figure 6. From Figure 6, the high-level ecological capital was mainly distributed in the four corners’ marginal areas of Guangxi whereas low/medium levels were distributed in the central part. In particular, the low ecological capital level included most of the concentrated areas of human activity in Guangxi such as urban/town/village construction lands, dry croplands, and tea/fruit gardens. From a proportion point, the low, medium, high, and very high levels of ecological capital accounted for 27.47%, 26.94%, 43.99%, and 1.61% of Guangxi, respectively.

3.1.3. Eco-Environmental Vulnerability

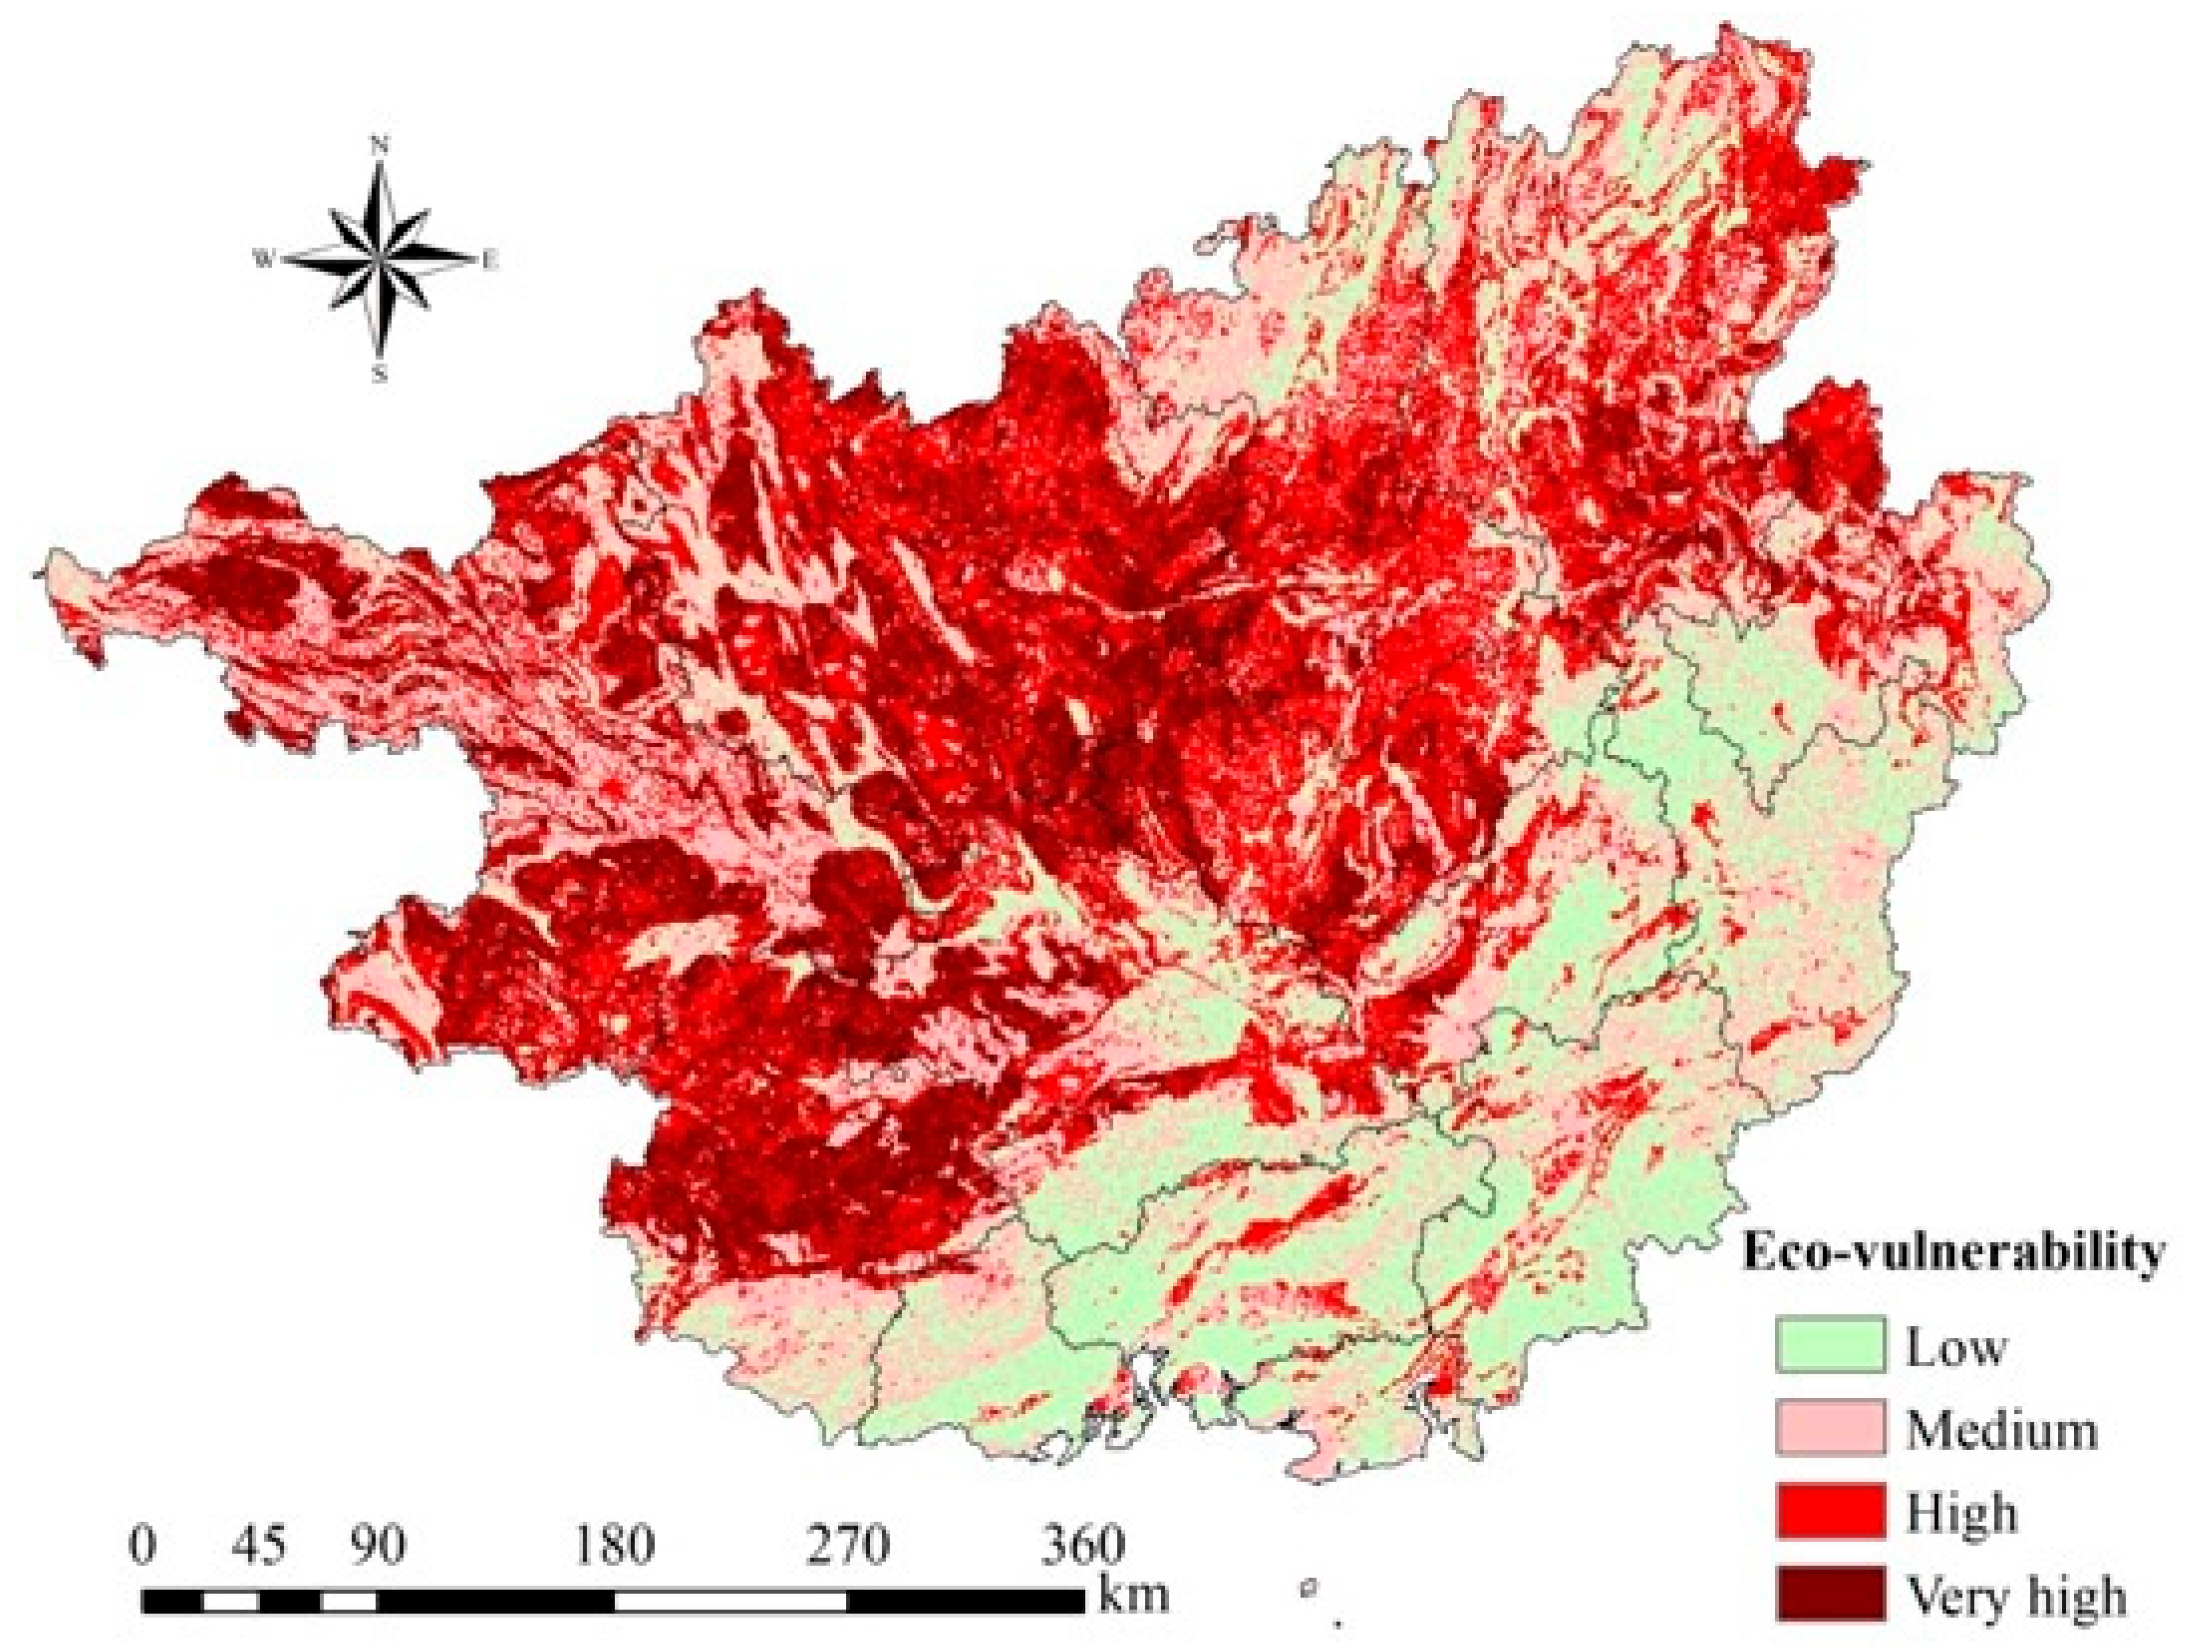
The comprehensive karst eco-environmental vulnerabilities of Guangxi are shown in Figure 7. From Figure 7, in general, the north and west parts of Guangxi had high and very high degrees of final integrated eco-environmental vulnerability whereas the non-karst areas within the southeast part had lower levels of final vulnerability. This result was in line with the higher slope and aridity degrees and vast distributions of karst carbonate rocks and limestone soil within north and southwest Guangxi. From a proportion point, the low, medium, high, and very high integrated eco-environmental vulnerability grades accounted for 22.12%, 30.29%, 28.48%, and 19.11% of the whole region, respectively.

3.1.4. Final Regional Ecological Risk

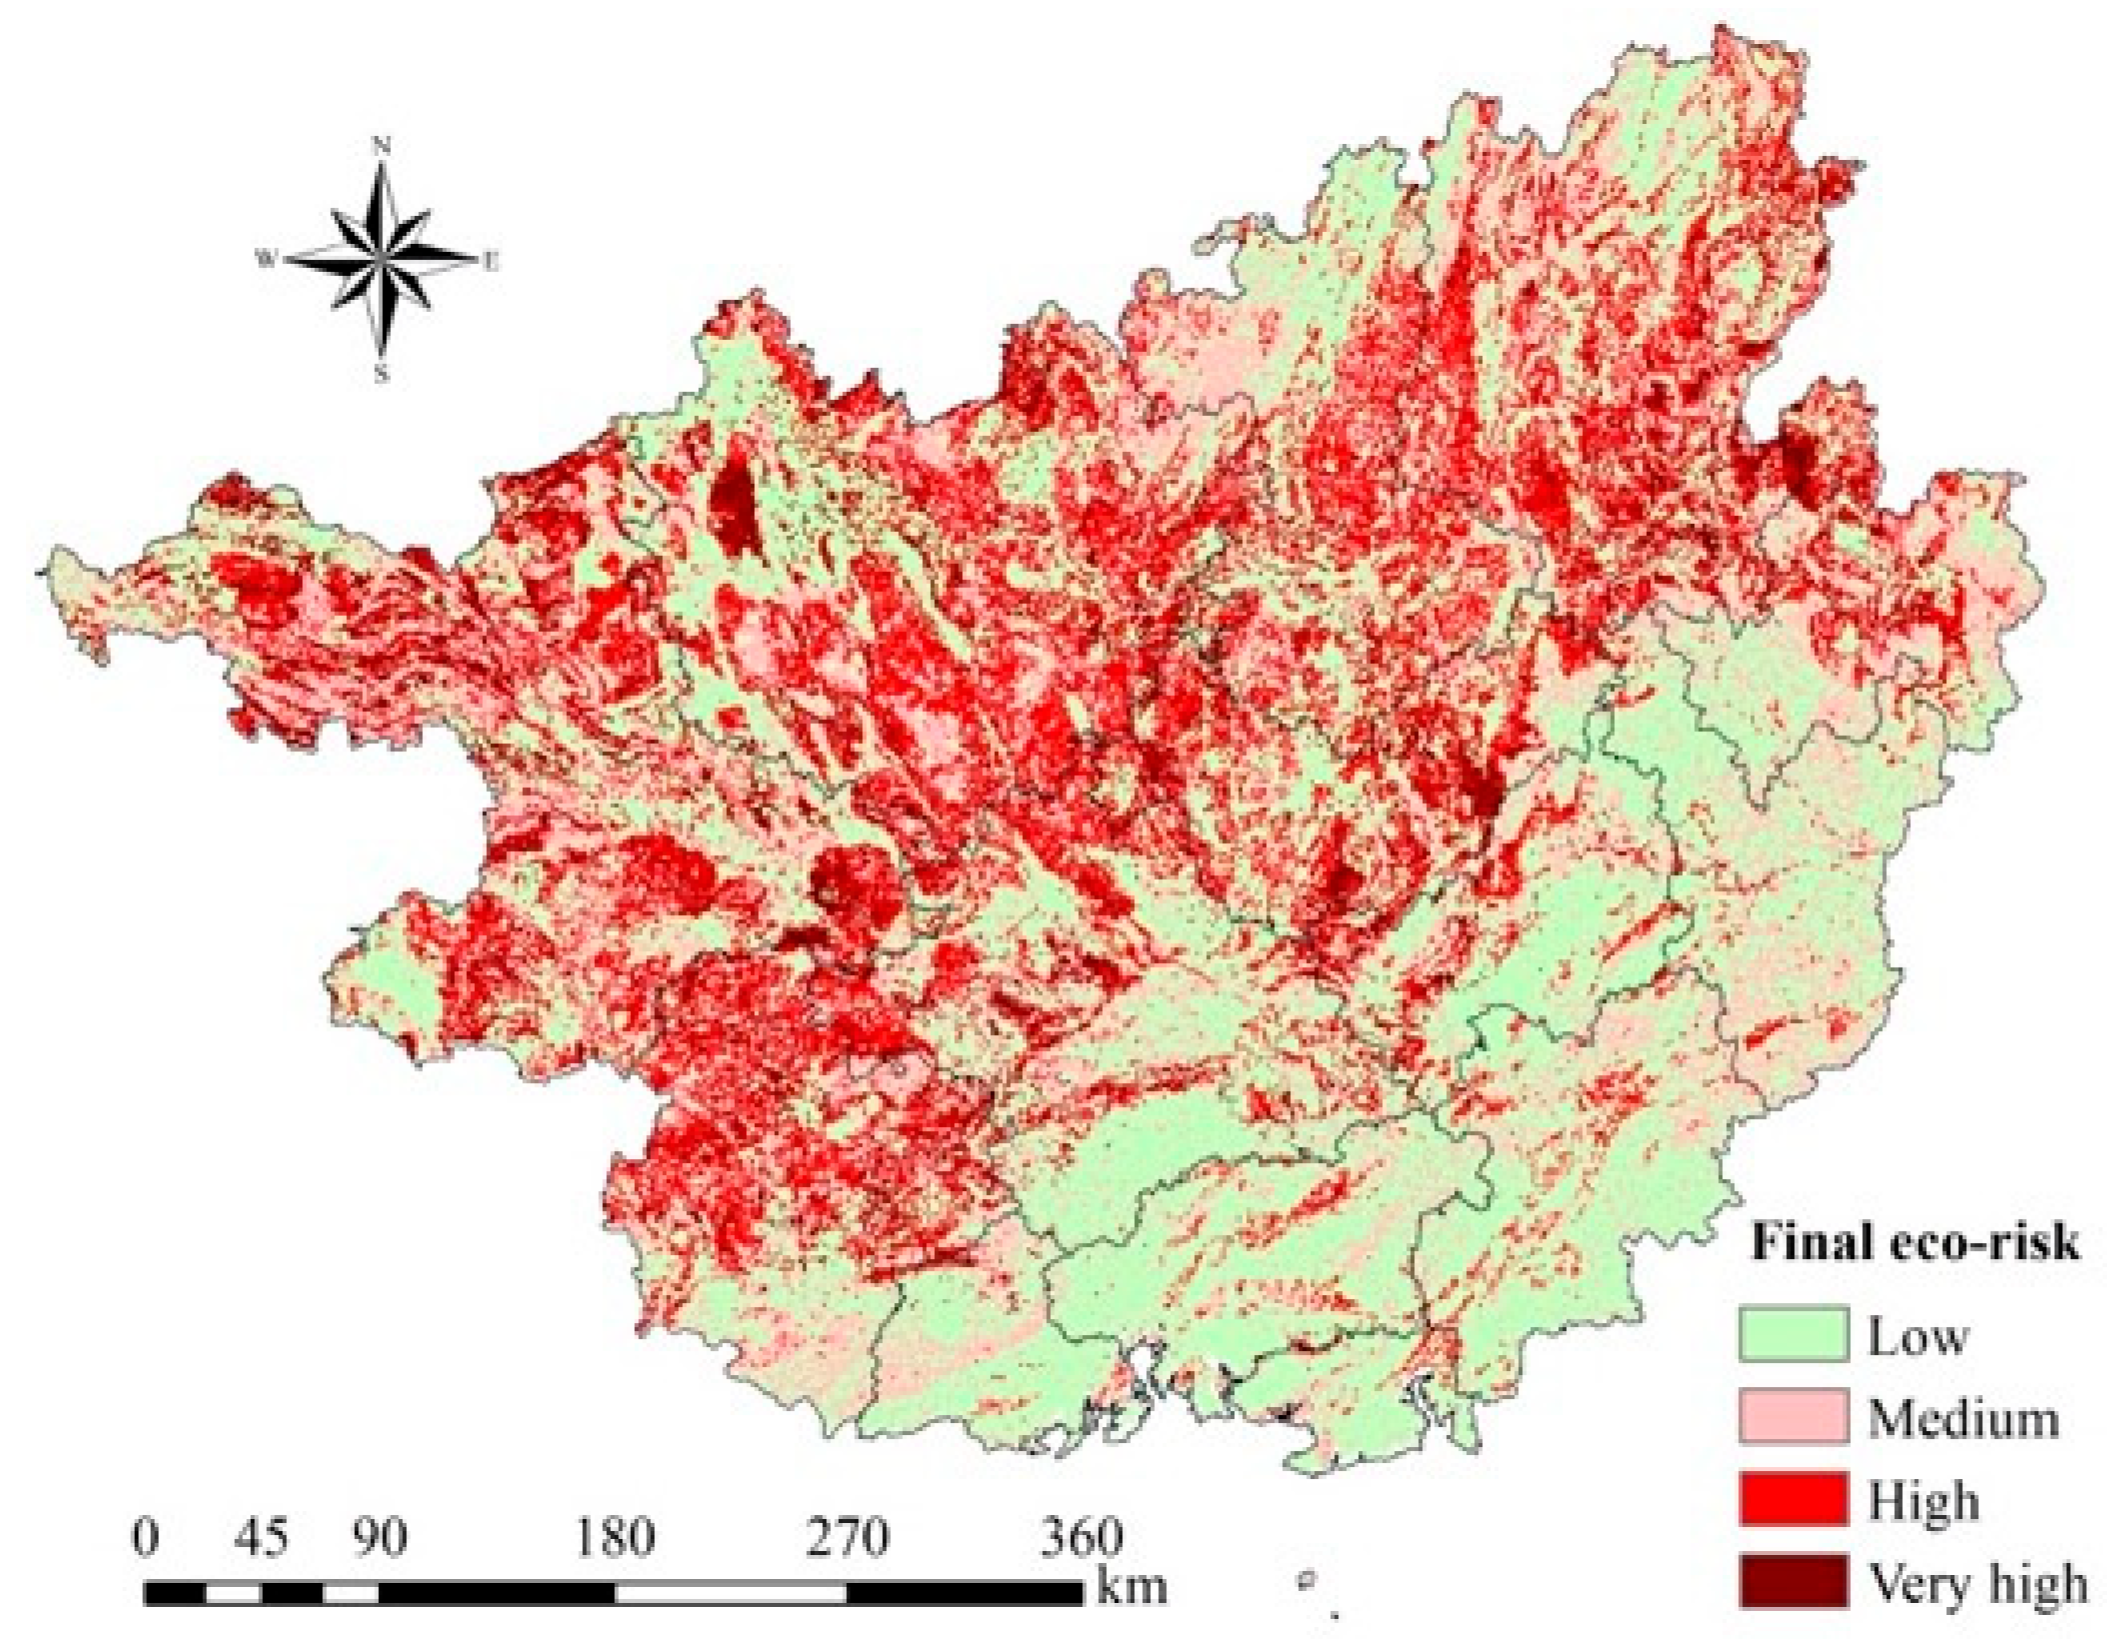
The final regional ecological risk distributions of Guangxi are shown in Figure 8. From Figure 8, it can be seen that the high and very high risk levels were concentrated in the north and west parts of Guangxi, whereas the southeast part was mainly covered by low/medium risk ranks. From a proportion point, the low, medium, high, and very high risk grades accounted for 41.85%, 28.31, 21.86, and 7.98% of the whole region, respectively.
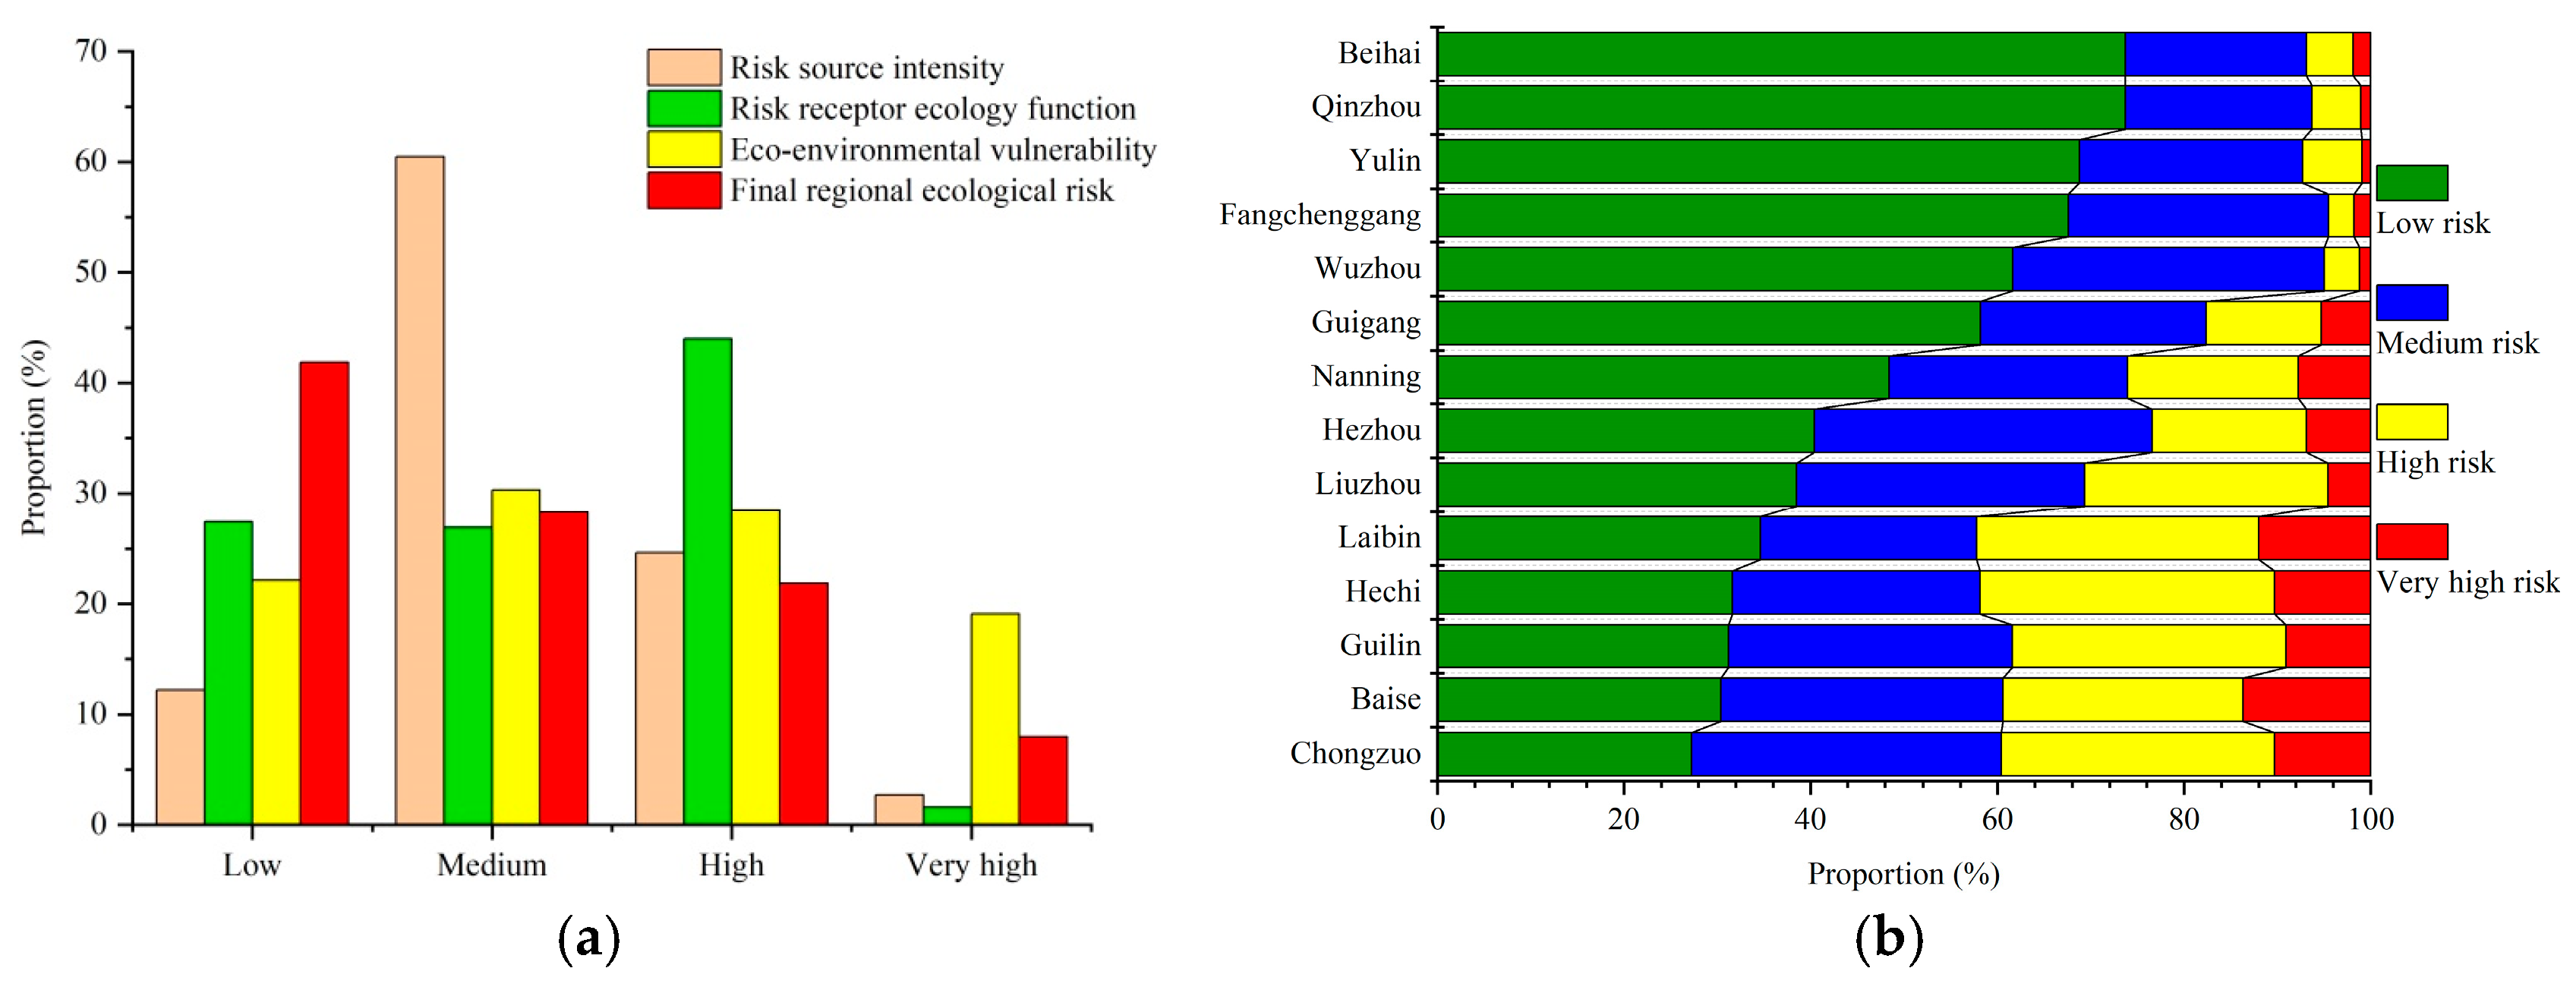
The area proportions of the final regional ecological risk for Guangxi and its 14 prefectures are shown in Figure 9a,b. From Figure 9a, the ecological risk source and final risk had larger area proportions within low and medium grades whereas eco-environmental vulnerability had almost the same area percentages within the four ranks. After integrating the calculations, the area proportions of final risk declined gradually from low to medium and then to high/very high grades, meaning that the severe very high-level risk occupied only a limited percentage of the region. From Figure 9b, the north and west parts of Guangxi (e.g., Chongzuo, Baise, Guilin, Hechi, and Liuzhou) had higher final risk levels than that of southeast part (e.g., Beihai, Qinzhou, Yulin, Fangchenggang, and Wuzhou). Furthermore, the central part of Guangxi (e.g., Nanning and Guigang) had middle-level area proportions of high and very high final risk grades.

3.2. Spatial Autocorrelation Feature

After calculation, the value of the global Moran’s I index of the final regional ecological risk was 0.466 (I > 0, p = 0.000), and thus there was a significant positive spatial correlation for the final risk. In other words, similar risk values (high-high or low-low values) clustered together significantly in the study area. In order to further explore the spatial association features of the clustering, the local Moran’s I index was then calculated, and the results are shown in Figure 10 and Table 3.
From Figure 10, the H-H association of final risk was concentrated in the north and west parts of Guangxi, while the L-L association was in the southeast. From the area proportion viewpoint (Table 3), the H-H association type occupied 18.09% of the total area of Guangxi whereas the L-L type occupied 19.55%. In contrast, the H-L (0.91%) and L-H (1.46%) association types had very small occupations in the final risk distribution, also indicating an obvious positive spatial correlation for the final risk.

3.3. Geographical Detection Result

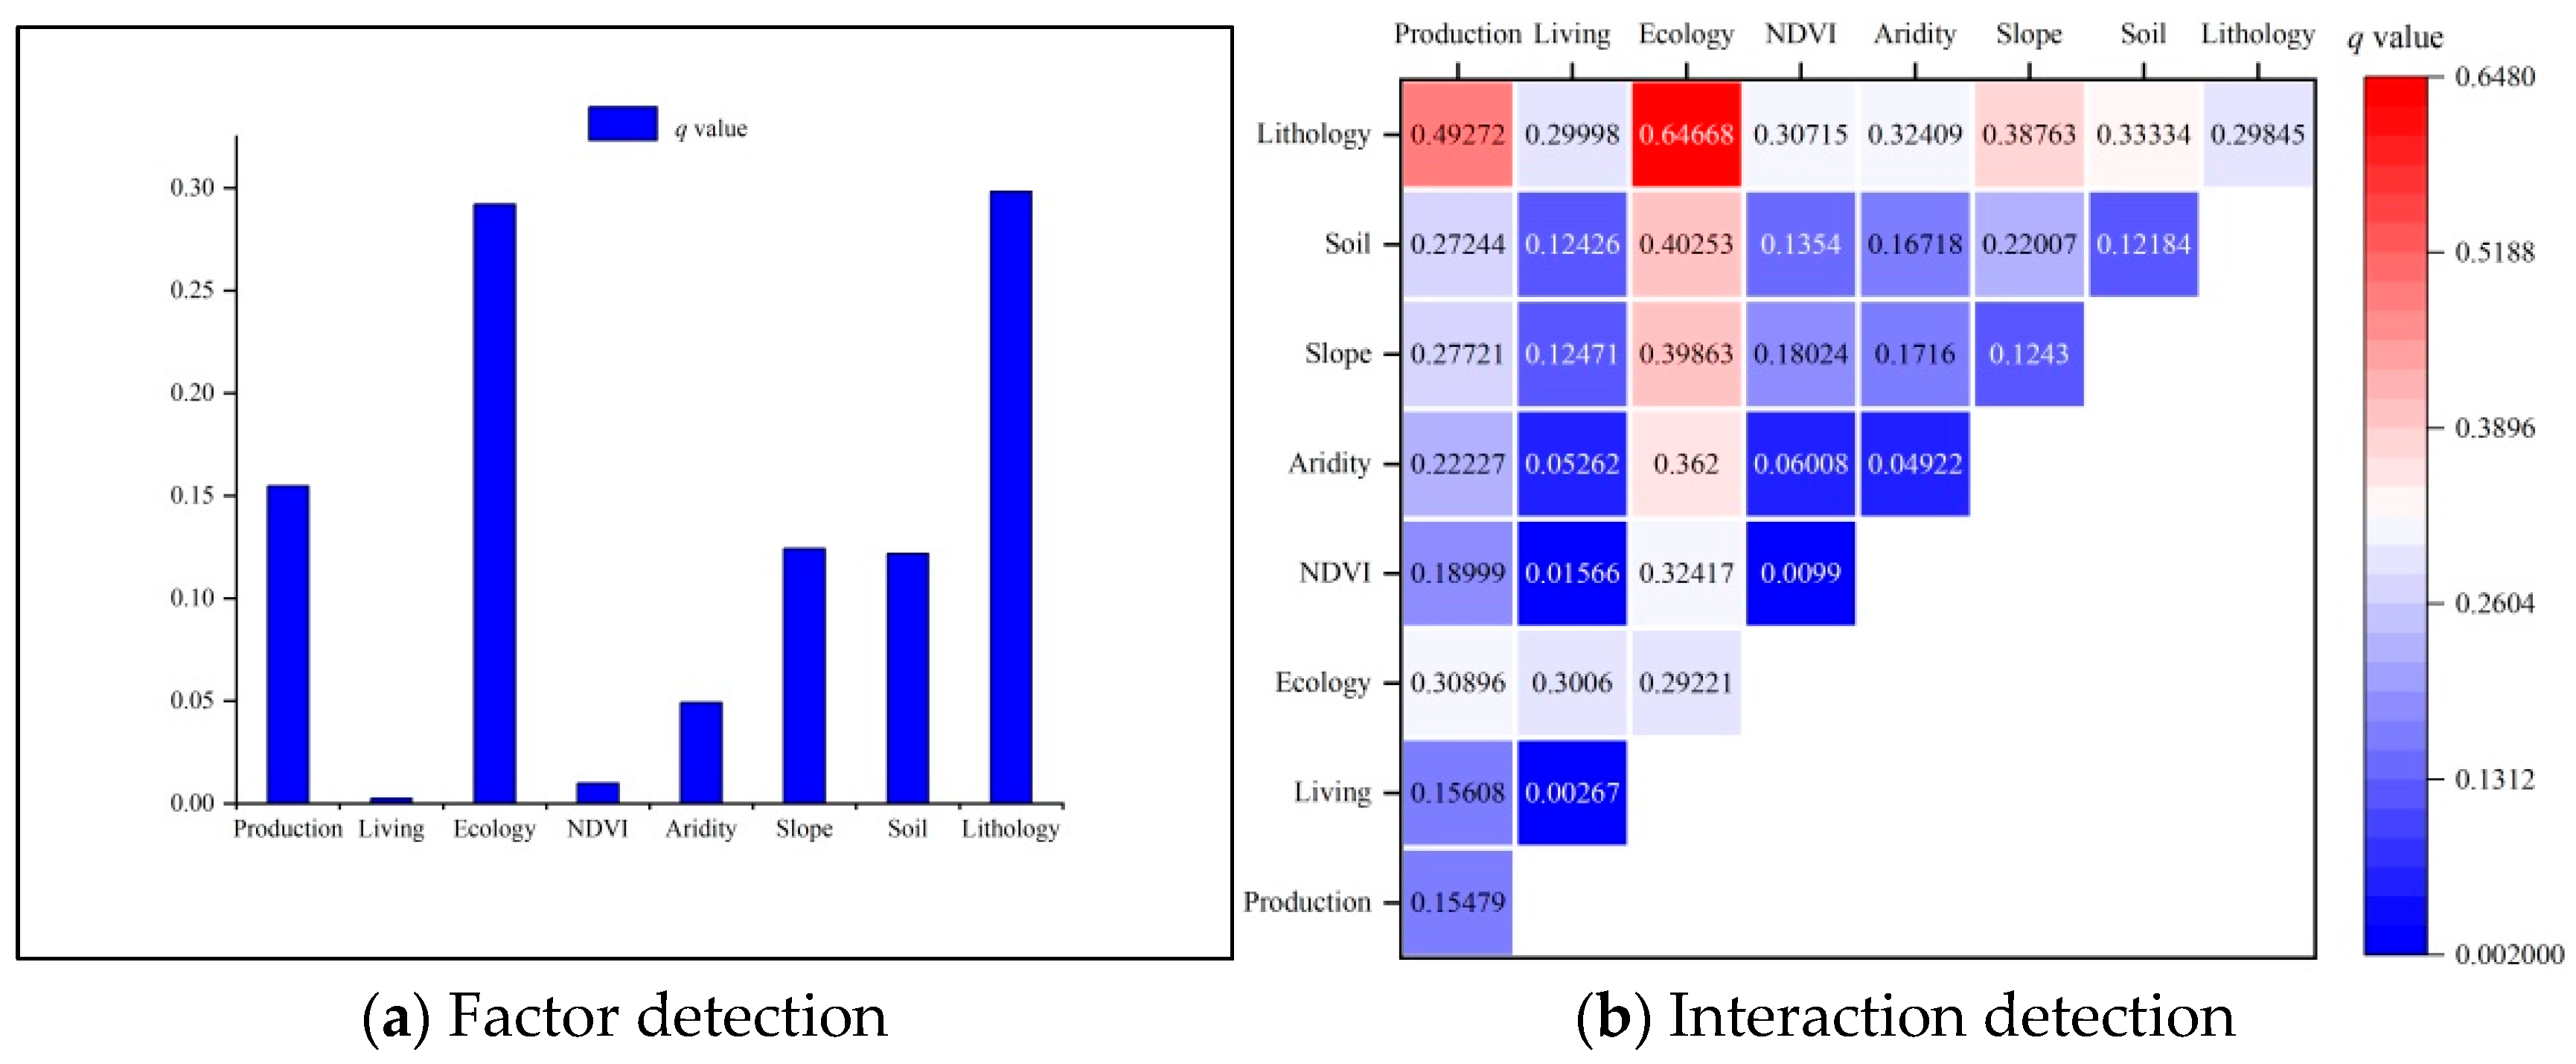
A geographical detector was used for ascertaining the significant influencing factors for final regional ecological risk in Guangxi. The results are shown in Table 4 and Table 5 and Figure 11.
As shown in Table 4 and Figure 11a, the most significant affecting factors for final risk consisted of lithology, land use ecology function, land use production function, slope, and soil, with q values of 0.29846, 0.29222, 0.15479, 0.12431, and 0.12184, respectively, in descending order. The remaining three factors (living function, aridity, and NDVI), on the other hand, had relatively much smaller influences on the final risk distribution. Moreover, the arbitrary combinations between any two of the eight affecting factors all had a larger explanatory power than the random single one within the pair (Table 5 and Figure 11b). Thereinto, the most significant bivariate combinations included lithology ∩ ecology (0.64668), lithology ∩ production (0.49272), soil ∩ ecology (0.40253), slope ∩ ecology (0.39863), lithology ∩ slope (0.38764), aridity ∩ ecology (0.36200), lithology ∩ soil (0.33334), ecology ∩ NDVI (0.32417), and lithology ∩ aridity (0.32409), etc., with q values all larger than 0.3 (bold font within Table 5).

3.4. Bivariate Local Spatial Autocorrelation Analysis

Through using a geographical detector, the important affecting factors for the final risk were ascertained. Based on this result, the spatial impact directions and association types between these significant influencing factors and final risk were further explored using the bivariate local spatial autocorrelation analysis tool within the GeoDa platform. The results are shown in Figure 12 and Table 6.
From the corresponding figure and table, we can see that compared with the land use production and ecology functions, the eco-environmental vulnerability factors (i.e., lithology, slope, and soil) had a higher and more obvious positive effect on the final risk distribution. Specifically, the combinations lithology ∩ risk, slope ∩ risk, and soil ∩ risk had larger area proportions in terms of H-H and L-L associations and smaller area proportions in the H-L and L-H associations. And thereinto, the lithology ∩ risk combination had the highest area proportion with regard to the H-H and L-L associations together (39.78%) and the lowest area proportion in H-L and L-H associations (6.09% totally), indicating that the lithology factor exhibited the strongest positive effect on the final risk distribution. In this sense, regional ecological risk management (RERM) emphasis should be given to the west and north parts of Guangxi, where karst areas, high slopes, and vulnerable limestone soil are widely distributed and a highly positive association (H-H clustering) exists between these vulnerability factors and the final regional ecological risk. In comparison, the southeast part of Guangxi exhibited a lower final risk level because of its non-karst lithology, gentle slopes, and non-limestone soils (obvious L-L clustering between the lithology, slope, soil factors, and the final risk). Therefore, the RERM concern for southeast Guangxi is secondary to west and north Guangxi according to this research.

4. Discussion

4.1. The Advancement of the Research and Further Improvements Needed in the Future

This research verifies that the current spatial statistical analysis technics (e.g., spatial autocorrelation indices and geographical detector tool) can also be utilized for the study of RERA. Specifically, as in previous RERA research, the linguistic description of final risk and then its qualitative attribution analysis based on spatial similarities between the final risk and those affecting factors were the main streams [3,12,19]. On the contrary, the in-depth mining of the final RERA result through employing quantitative analysis technics and tools is still scarce. In this sense, the proposed research adopting spatial autocorrelation analysis and geographical detector methods for the spatial association and quantitative attribution analyses of final risk represents an important improvement for RERA study and can undoubtedly advance this field in the future.
With respect to further progress in the future, adopting more suitable quantitative analysis tools in terms of spatial trait depiction and attribution analysis for the final risk, such as the obstacle degree [59,60,61,62] and geographically weighted regression [26,63,64,65] models, might be very helpful. All of these potential practices can eventually enrich the RERA domains.

4.2. Key Points and Effective Countermeasures for KRD Prevention and Cure

As manifested above through bivariate local spatial autocorrelation analysis, eco-environmental vulnerability indices, such as lithology, slope, and soil, were more significant positive affecting factors for the final risk. Therefore, the prime RERM concern should be focused on the north and west parts of Guangxi, where karst terrains, steep slopes, and limestone soil are widely distributed. First, special RERM attention should be given to those vast distribution areas of carbonate rocks to better mitigate the influences of the chemical weathering of limestone/dolomite, which can normally result in a shallow discontinuous regolith followed by soil erosion and KRD issues [66,67]. Particularly, limestones have a higher dissolution speed than dolomites [40]. Thus, the higher the proportion of limestones, the more serious the KRD issue generally will be. Second, for agricultural production, dry croplands within karst hillsides, especially those with higher slope degrees (e.g., 15–25° range) should be terraced, and soil and water conservation works added [68,69]. On the contrary, when the slope of karst croplands is larger than 25°, the grain for green projects is needed. Third, karst limestone soil is normally thin and discontinuous [30,31]. After destruction, it generally needs a long time to form a new soil layer with enough thickness [70,71]. Therefore, effective soil and water conservation works are urgently needed to conserve these vulnerable karst soils in the future.
Moreover, the geographical detection results tell us that the land use ecology and production functions also had significant influences on the final risk. However, because of the tradeoff effect [53,56] between these two kinds of land functions and the aggregation method of multiplication (R = f(H) × g(V) × h(E)) for the final risk, the influences of the two functions cancel each other out considerably, and thus their impact directions on the final risk distribution are not as much positive as those eco-environmental vulnerability factors. In this sense, the effectiveness of another aggregation choice (e.g., addition method) should be verified for future RERA research. Nevertheless, as manifested by the geographical detector, these two functions still have important impacts on the final risk. Therefore, corresponding countermeasures in terms of optimizing human production activities and protecting regional ecology function are of great importance, especially for those vulnerable karst areas. For example, first, agricultural production structure adjustment, such as replacing maize cultivation with herbivorous animal husbandry, is conducive to soil protection, and then KRD prevention and cure [68,71]. Second, fostering alternative non-agricultural livelihood for karst farmers, such as ecotourism [72] and other ecological product value realization approach (e.g., eco-compensation) [73,74], is necessary. Third, for damaged natural forests, close-up and afforestation measures are very helpful and can eventually improve the ecological health status/ecosystem services provision [29,70,75,76,77,78]. Fourth, ecological restoration projects, such as the Natural Forest Conservation Program or Rocky Desertification Control Project [79,80], can play an important role for karst ecological restoration on a broader scale [79].
Ultimately, all of the above-mentioned key points and effective countermeasures derived from RERA quantitative attribution analysis will promote sustainable development of the region.

5. Conclusions

Through using spatial autocorrelation analysis (including three indices, i.e., global Moran’s I, local Moran’s I, and bivariate local Moran’s I) and geographical detector methods, the in-depth mining of RERA results in terms of spatial association and quantitative attribution analyses was realized in this research. The results of this study showed that: (1) the north and west parts of Guangxi had a higher final ecological risk than that of the southeast part; (2) in terms of proportion, the low, medium, high, and very high final risk grades accounted for 41.85%, 28.31%, 21.86%, and 7.98% of the whole region, respectively; (3) final risk exhibited an obvious positive spatial correlation trait and the H-H association was mainly distributed within the north and west parts of Guangxi whereas the L-L association was mainly located in the southeast; (4) through geographical detection, the important influencing factors for final risk were ascertained including lithology, land use ecology and production functions, slope, and soil; (5) subsequently, the bivariate local spatial autocorrelation analysis tool was used to explore the spatial affecting directions between those significant influencing factors and final risk. The corresponding results indicated that compared with land use production and ecology functions, eco-environmental vulnerability factors (i.e., lithology, slope, and soil) had a more obvious positive effect on the final risk distribution. Undoubtedly, this research can promote the deepening of RERA in the future, especially when it comes to the in-depth mining of the final results of this kind of study. Furthermore, this research can also help ascertain the key effective RERM countermeasures based on the findings of a spatial quantitative attribution analysis for the study area.

Funding

This research was funded by the launching funds of Nanning Normal University for doctors (grant number [602021239373]). And the APC was funded by the [602021239373].

Institutional Review Board Statement

Not applicable.

Informed Consent Statement

Not applicable.

Data Availability Statement

Data is contained within the article.

Conflicts of Interest

The author declares that there are no known competing financial interests or personal relationships that could have appeared to influence the work reported in this paper.

References

  1. Ghehi, N.K.; MalekMohammadi, B.; Jafari, H. Integrating habitat risk assessment and connectivity analysis in ranking habitat patches for conservation in protected areas. J. Nat. Conserv. 2020, 56, 125867. [Google Scholar] [CrossRef]
  2. Malekmohammadi, B.; Blouchi, L.R. Ecological risk assessment of wetland ecosystems using Multi Criteria Decision Making and Geographic Information System. Ecol. Indic. 2014, 41, 133–144. [Google Scholar] [CrossRef]
  3. Wang, H.; Song, C.; Song, K. Regional ecological risk assessment of wetlands in the Sanjiang Plain with respect to human disturbance. Sustainability 2020, 12, 1947. [Google Scholar] [CrossRef]
  4. Zhao, H.; Zhu, T.; Luo, X.; Niu, M.; Zhang, L.; Gu, B. Regional ecological risk assessment of chemical industry stress under China’s coastal development strategy. J. Clean. Prod. 2022, 375, 134085. [Google Scholar] [CrossRef]
  5. Yu, W.; Zhang, L.; Ricci, P.F.; Chen, B.; Huang, H. Coastal ecological risk assessment in regional scale: Application of the relative risk model to Xiamen Bay, China. Ocean Coast. Manag. 2015, 108, 131–139. [Google Scholar] [CrossRef]
  6. Hunsaker, C.; Graham, R.; Suter, G.; O’Nell, R.; Branthouse, L.; Gardner, R. Assessing ecological risk on regional scale. Environ. Manag. 1990, 14, 325–332. [Google Scholar] [CrossRef]
  7. Ju, H.; Niu, C.; Zhang, S.; Jiang, W.; Zhang, Z.; Zhang, X.; Yang, Z.; Cui, Y. Spatiotemporal patterns and modifiable areal unit problems of the landscape ecological risk in coastal areas: A case study of the Shandong Peninsula, China. J. Clean. Prod. 2021, 310, 127522. [Google Scholar] [CrossRef]
  8. Xie, H.; Wen, J.; Chen, Q.; Wu, Q. Evaluating the landscape ecological risk based on GIS: A case-study in the Poyang Lake region of China. Land Degrad. Dev. 2021, 32, 1–13. [Google Scholar] [CrossRef]
  9. Xu, X.; Xu, L.; Yan, L.; Ma, L.; Lu, Y. Integrated regional ecological risk assessment of multi-ecosystems under multi-disasters: A case study of China. Environ. Earth Sci. 2015, 74, 747–758. [Google Scholar] [CrossRef]
  10. Landis, W.G.; Wiegers, J.A. Design considerations and a suggested approach for regional and comparative ecological risk assessment. Hum. Ecol. Risk Assess. Int. J. 1997, 3, 287–297. [Google Scholar] [CrossRef]
  11. Liu, X.; Chen, H. Regional assessment on ecological risk of ecosystems under natural hazards: An application in Guangdong Province (SE China). Nat. Hazards 2020, 100, 205–229. [Google Scholar] [CrossRef]
  12. Wang, H. Regional ecological risk assessment of the Yellow River Delta High-efficiency Eco-economic Zone, China, with respect to human production–living disturbance. Environ. Dev. Sustain. 2025, 27, 2581–2609. [Google Scholar] [CrossRef]
  13. Landis, W.G.; Wiegers, J.K. Ten years of the relative risk model and regional scale ecological risk assessment. Hum. Ecol. Risk Assess. Int. J. 2007, 13, 25–38. [Google Scholar] [CrossRef]
  14. Anderson, S.; Landis, W. A Pilot application of regional scale risk assessment to the forestry management of the Upper Grande Ronde Watershed, Oregon. Hum. Ecol. Risk Assess. 2012, 18, 705–732. [Google Scholar] [CrossRef]
  15. Heenkenda, M.K.; Bartolo, R. Regional ecological risk assessment using a relative risk model: A case study of the Darwin Harbour, Darwin, Australia. Hum. Ecol. Risk Assess. Int. J. 2016, 22, 401–423. [Google Scholar] [CrossRef]
  16. Munns, W. Assessing risks to wildlife populations from multiple stressors: Overview of the problem and research needs. Ecol. Soc. 2006, 11, 23. [Google Scholar] [CrossRef]
  17. Schleier, J.J., III; Sing, S.E.; Peterson, R.K.D. Regional ecological risk assessment for the introduction of Gambusia affinis (western mosquitofish) into Montana watersheds. Biol. Invasions 2008, 10, 1277–1287. [Google Scholar] [CrossRef]
  18. Vezi, M.; Downs, C.; Wepener, V.; O’Brien, G. Application of the relative risk model for evaluation of ecological risk in selected river dominated estuaries in KwaZulu-Natal, South Africa. Ocean Coast. Manag. 2020, 185, 105035. [Google Scholar] [CrossRef]
  19. Wang, H. Regional ecological risk assessment through the application of production-living-ecology land use function indicators: A case study of the eco-economic zone of Yellow River Delta. Environ. Sci. Pollut. Res. 2024, 31, 50967–50982. [Google Scholar] [CrossRef]
  20. Anselin, L. Local indicators of spatial association-LISA. Geogr. Anal. 1995, 27, 93–115. [Google Scholar] [CrossRef]
  21. Xie, H.; Wang, P.; Huang, H. Ecological risk assessment of land use change in the Poyang Lake Eco-economic Zone, China. Int. J. Environ. Res. Public Health 2013, 10, 328–346. [Google Scholar] [CrossRef]
  22. Gan, L.; Halik, U.; Shi, L.; Welp, M. Ecological risk assessment and multi-scenario dynamic prediction of the arid oasis cities in northwest China from 1990 to 2030. Stoch. Environ. Res. Risk Assess. 2023, 37, 3099–3115. [Google Scholar] [CrossRef]
  23. Liu, C.; Zhang, K.; Liu, J. A long-term site study for the ecological risk migration of landscapes and its driving forces in the Sanjiang Plain from 1976 to 2013. Acta Ecol. Sin. 2018, 38, 3729–3740. [Google Scholar] [CrossRef]
  24. Liu, H.; Wang, R.; Sun, H.; Cao, W.; Song, J.; Zhang, X.; Wen, L.; Zhuo, Y.; Wang, L.; Liu, T. Spatiotemporal evolution and driving forces of ecosystem service value and ecological risk in the Ulan Buh Desert. Front. Environ. Sci. 2023, 10, 1053797. [Google Scholar] [CrossRef]
  25. Gao, J.; Zhang, Y.; Zuo, L. The optimal explanatory power of soil erosion and water yield in karst mountainous areas. J. Geogr. Sci. 2023, 33, 2077–2093. [Google Scholar] [CrossRef]
  26. Lu, Q.; Fan, H.; Zhang, F.; Chen, W.; Xia, Y.; Yan, B. The dominant role of human activity intensity in spatial pattern of ecosystem health in the Poyang Lake ecological economic zone. Ecol. Indic. 2024, 166, 112347. [Google Scholar] [CrossRef]
  27. Zhang, Z.; Hou, Y.; Sun, H.; Guo, S. Study on the evaluation of the spatial function and coordination relationship of the territorial “production-living-ecological” spaces at the township-street scale. J. Nat. Resour. 2022, 37, 2898–2914. [Google Scholar] [CrossRef]
  28. Liu, Y.; Wang, J.; Deng, X. Rocky land desertification and its driving forces in the karst areas of rural Guangxi, Southwest China. J. Mt. Sci. 2008, 5, 350–357. [Google Scholar] [CrossRef]
  29. Xu, G.; Xiong, K.; Shu, T.; Shi, Y.; Chen, L.; Zheng, L.; Fan, H.; Zhao, Z.; Yang, Z. Bundling evaluating changes in ecosystem service under karst rocky desertification restoration: Projects a case study of Huajiang-Guanling, Guizhou province, Southwest China. Environ. Earth Sci. 2022, 81, 302. [Google Scholar] [CrossRef]
  30. Yang, Q.; Wang, K.; Zhang, C.; Yue, Y.; Tian, R.; Fan, F. Spatio-temporal evolution of rocky desertification and its driving forces in karst areas of Northwestern Guangxi, China. Environ. Earth Sci. 2011, 64, 383–393. [Google Scholar] [CrossRef]
  31. Yang, Q.; Jiang, Z.; Yuan, D.; Ma, Z.; Xie, Y. Temporal and spatial changes of karst rocky desertification in ecological reconstruction region of Southwest China. Environ. Earth Sci. 2014, 72, 4483–4489. [Google Scholar] [CrossRef]
  32. Cui, X.; Xu, N.; Chen, W.; Wang, G.; Liang, J.; Pan, S.; Duan, B. Spatio-temporal variation and influencing factors of the coupling coordination degree of production-living-ecological space in China. Int. J. Environ. Res. Public Health 2022, 19, 10370. [Google Scholar] [CrossRef] [PubMed]
  33. Fu, J.; Zhang, S. Functional assessment and coordination characteristics of production, living, ecological function—A case study of Henan Province, China. Int. J. Environ. Res. Public Health 2021, 18, 8051. [Google Scholar] [CrossRef]
  34. Wang, A.; Liao, X.; Tong, Z.; Du, W.; Zhang, J.; Liu, X.; Liu, M. Spatial-temporal dynamic evaluation of the ecosystem service value from the perspective of “production-living-ecological” spaces: A case study in Dongliao River Basin, China. J. Clean. Prod. 2022, 333, 130218. [Google Scholar] [CrossRef]
  35. Wu, A. Classification evaluation and pattern evolution of production-living-ecology spaces in Beijing-Tianjin-Hebei Region. Chin. J. Agric. Resour. Reg. Plan. 2019, 40, 237–242. [Google Scholar]
  36. Chen, X. Study on evaluation and regionalization of agroecological vulnerability in Guangxi. Chin. J. Agric. Resour. Reg. Plan. 2020, 41, 212–219. [Google Scholar]
  37. Yao, W.; Zhou, S.; Chen, Z.; Tang, Q.; Zhou, X.; Huang, W.; Wang, G.; Wei, X.; Zhou, Q. Butterfly community structure and diversity in Guangxi Mao’ershan National Nature Reserve. Guangxi Sci. 2024, 31, 1089–1100. [Google Scholar]
  38. Zhang, M.; Zhang, C.; Wang, K.; Yue, Y.; Qi, X.; Fan, F. Spatiotemporal variation of karst ecosystem service values and its correlation with environmental factors in Northwest Guangxi, China. Environ. Manag. 2011, 48, 933–944. [Google Scholar] [CrossRef]
  39. Xie, Y.; Lin, S.; Tu, S.; Lu, Y.; Pan, X. Identification and spatial pattern of multidimensional poverty measurement in karst rocky desertification regions. Trans. Chin. Soc. Agric. Eng. 2020, 36, 276–285. [Google Scholar]
  40. Wang, S.; Li, R.; Sun, C.; Zhang, D.; Li, F.; Zhou, D.; Xiong, K.; Zhou, Z. How types of carbonate rock assemblages constrain the distribution of karst rocky desertification land in Guizhou Province, China: Phenomena and mechanisms. Land Degrad. Dev. 2004, 15, 123–131. [Google Scholar] [CrossRef]
  41. Wang, H. Regional assessment of ecological risk caused by human activities on wetlands in the Muleng-Xingkai Plain of China using a pressure–capital–vulnerability–response model. Wetl. Ecol. Manag. 2022, 30, 111–126. [Google Scholar] [CrossRef]
  42. Gui, R.; Song, W.; Lv, J.; Lu, Y.; Liu, H.; Feng, T.; Linghu, S. Digital elevation model-driven river channel boundary monitoring using the natural breaks (Jenks) method. Remote Sens. 2025, 17, 1092. [Google Scholar] [CrossRef]
  43. Li, Q.; Zhang, Z.; Wan, L.; Yang, C.; Zhang, J.; Ye, C.; Chen, Y. Landscape pattern optimization in Ningjiang River Basin based on landscape ecological risk assessment. Acta Geogr. Sin. 2019, 74, 1420–1437. [Google Scholar]
  44. Lu, Y.; Hua, C.; Zhou, X. GIS-based sensitivity evaluation for soil erosion in Guangxi. Res. Soil Water Conserv. 2007, 14, 98–100. [Google Scholar]
  45. Zhang, X.; Dong, T.; Du, H.; Liao, C.; Wang, F. Optimization of landscape pattern in Fujiang River Basin based on landscape ecological risk assessment. Acta Ecol. Sinaca 2021, 41, 3940–3951. [Google Scholar]
  46. Gao, J.; Wang, H. Temporal analysis on quantitative attribution of karst soil erosion: A case study of a peak-cluster depression basin in Southwest China. Catena 2019, 172, 369–377. [Google Scholar] [CrossRef]
  47. Gao, J.; Wang, H.; Zuo, L. Spatial gradient and quantitative attribution of karst soil erosion in Southwest China. Environ. Monit. Assess. 2018, 190, 730. [Google Scholar] [CrossRef]
  48. Mo, J.; Chen, Y.; Mo, W. Comparison of key indicators and evaluation models of soil and water loss sensitivity in karst ecosystem. Res. Soil Water Conserv. 2021, 28, 256–266. [Google Scholar]
  49. Li, D.; Lu, D.; Zhao, Y.; Zhou, M.; Chen, G. Spatial patterns of vegetation coverage change in giant panda habitat based on MODIS time-series observations and local indicators of spatial association. Ecol. Indic. 2021, 124, 107418. [Google Scholar] [CrossRef]
  50. Liu, Q.; Yang, D.; Cao, L. Evolution and prediction of the coupling coordination degree of production-living-ecological space based on land use dynamics in the Daqing River Basin, China. Sustainability 2022, 14, 10864. [Google Scholar] [CrossRef]
  51. Zeng, B.; Xie, Q. Spatial characteristics and impact mechanism of economic development indicated by night lighting data in the Yellow River Basin. J. Desert Res. 2022, 42, 41–50. [Google Scholar]
  52. Anselin, L.; Syabri, I.; Smirnov, O. Visualizing multivariate spatial correlation with dynamically linked windows. In Proceedings of the CSISS Workshop on New Tools for Spatial Data Analysis, Santa Barbara, CA, USA, 10–11 May 2002. [Google Scholar]
  53. Gao, S.; Yang, L.; Jiao, H. Changes in and patterns of the tradeoffs and synergies of production-living-ecological space: A case study of Longli County, Guizhou Province, China. Sustainability 2022, 14, 8910. [Google Scholar] [CrossRef]
  54. Liu, Y.; Liu, X.; Zhao, C.; Wang, H.; Zhang, F. The trade-offs and synergies of the ecological-production-living functions of grassland in the Qilian mountains by ecological priority. J. Environ. Manag. 2023, 327, 116883. [Google Scholar] [CrossRef]
  55. Song, W.; Wang, C.; Chen, W.; Zhang, X.; Li, H.; Li, J. Unlocking the spatial heterogeneous relationship between Per Capita GDP and nearby air quality using bivariate local indicator of spatial association. Resour. Conserv. Recycl. 2020, 160, 104880. [Google Scholar] [CrossRef]
  56. Wang, Q.; Sun, P.; Liu, X.; Liu, Y.; Hai, W.; Zhang, X. Analysis on spatial-temporal pattern of trade-offs and synergies of “production-living-ecological” function in Loess Hilly and Gully Region-A case study of Wushan County. Chin. J. Agric. Resour. Reg. Plan. 2020, 41, 122–130. [Google Scholar]
  57. Wang, J.; Xu, C. Geodetector: Principle and prospective. Acta Geogr. Sin. 2017, 72, 116–134. [Google Scholar]
  58. Huang, F.; Zuo, L.; Gao, J.; Jiang, Y.; Du, F.; Zhang, Y. Exploring the driving factors of trade-offs and synergies among ecological functional zones based on ecosystem service bundles. Ecol. Indic. 2023, 146, 109827. [Google Scholar] [CrossRef]
  59. Cheng, H.; Zhu, L.; Meng, J. Fuzzy evaluation of the ecological security of land resources in mainland China based on the Pressure-State-Response framework. Sci. Total Environ. 2022, 804, 150053. [Google Scholar] [CrossRef]
  60. Cui, X.; Wang, Y.; Shi, L. Spatio-temporal characteristics and obstacle factors of human-land system coupling coordination in farming-pastoral ecotone of northern China. J. Agric. Resour. Environ. 2023, 40, 206–217. [Google Scholar]
  61. Ma, C.; Lin, J. Evaluation of cultivated land use efficiency based on entropy TOPSIS model and identification of its obstacle factors: A case study of three regions in the east, middle and west of China. J. China Agric. Univ. 2021, 26, 196–210. [Google Scholar]
  62. Wei, C.; Lin, Q.; Yu, L.; Zhang, H.; Ye, S.; Zhang, D. Research on Sustainable Land Use Based on Production–Living–Ecological Function: A Case Study of Hubei Province, China. Sustainability 2021, 13, 996. [Google Scholar] [CrossRef]
  63. Li, W.; Wang, Y.; Xie, S.; Sun, R.; Cheng, X. Impacts of landscape multifunctionality change on landscape ecological risk in a megacity, China: A case study of Beijing. Ecol. Indic. 2020, 117, 106681. [Google Scholar] [CrossRef]
  64. Wang, X.; Che, L.; Zhou, L.; Xu, J. Spatio-temporal Dynamic Simulation of Land use and Ecological Risk in the Yangtze River Delta Urban Agglomeration, China. Chin. Geogr. Sci. 2021, 31, 829–847. [Google Scholar] [CrossRef]
  65. Zhao, J.; Zhao, Y. Synergy/trade-offs and differential optimization of production, living, and ecological functions in the Yangtze River economic Belt, China. Ecol. Indic. 2023, 147, 109925. [Google Scholar] [CrossRef]
  66. Li, Y.; Shao, J.; Yang, H.; Bai, X. The relations between land use and karst rocky desertification in a typical karst area, China. Environ. Geol. 2009, 57, 621–627. [Google Scholar] [CrossRef]
  67. Luo, X.; Shen, C.; Chen, F.; Ran, C.; Chen, H.; Zhang, Y.; Zhu, G. Evolution of rocky desertification and its response to land use change in Karst area. Environ. Earth Sci. 2024, 83, 511. [Google Scholar] [CrossRef]
  68. Xiao, H.; Xiong, K.; Zhang, H.; Zhang, Q. Research progress for karst rocky desertification control models. China Popul. Resour. Environ. 2014, 24, 330–334. [Google Scholar]
  69. Chen, R.; Ye, C.; Cai, Y.; Xing, X. Integrated restoration of small watershed in karst regions of Southwest China. AMBIO 2012, 41, 907–912. [Google Scholar] [CrossRef]
  70. Qiao, Y.; Jiang, Y.; Zhang, C. Contribution of karst ecological restoration engineering to vegetation greening in southwest China during recent decade. Ecol. Indic. 2021, 121, 107081. [Google Scholar] [CrossRef]
  71. Wang, K.; Zhang, C.; Chen, H.; Yue, Y.; Zhang, W.; Zhang, M.; Qi, X.; Fu, Z. Karst landscapes of China: Patterns, ecosystem processes and services. Landsc. Ecol. 2019, 34, 2743–2763. [Google Scholar] [CrossRef]
  72. Cai, Y. Eco-tourism: An approach to escaping from the “poverty trap” in karst mountains of Southwestern China. China Popul. Resour. Environ. 2006, 16, 113–116. [Google Scholar]
  73. Chong, G.; Hai, Y.; Zheng, H.; Xu, W.; Ouyang, Z. Current situation and measures of karst rocky desertification control in Southwest China. J. Yangtze River Sci. Res. Inst. 2021, 38, 38–43. [Google Scholar]
  74. Shen, H.; Liu, Z.; Xiong, K.; Li, L. A study revelation on market and value-realization of ecological product to the control of rocky desertification in South China Karst. Sustainability 2022, 14, 3060. [Google Scholar] [CrossRef]
  75. Chen, Y.; Cheng, C.; Xiong, K.; Rong, L.; Zhang, S. Quantifying the biodiversity and ecosystem service outcomes of karst ecological restoration: A meta-analysis of South China Karst. Catena 2024, 245, 108278. [Google Scholar] [CrossRef]
  76. Liao, C.; Yue, Y.; Wang, K.; Fensholt, R.; Tong, X.; Brandt, M. Ecological restoration enhances ecosystem health in the karst regions of southwest China. Ecol. Indic. 2018, 90, 416–425. [Google Scholar] [CrossRef]
  77. Qi, X.; Wang, K.; Zhang, C. Effectiveness of ecological restoration projects in a karst region of southwest China assessed using vegetation succession mapping. Ecol. Eng. 2013, 54, 245–253. [Google Scholar] [CrossRef]
  78. Zhang, M.; Wang, K.; Liu, H.; Zhang, C.; Yue, Y.; Qi, X. Effect of ecological engineering projects on ecosystem services in a karst region: A case study of northwest Guangxi, China. J. Clean. Prod. 2018, 183, 831–842. [Google Scholar] [CrossRef]
  79. Tong, X.; Brandt, M.; Yue, Y.; Horion, S.; Wang, K.; De Keersmaecker, W.; Tian, F.; Schurgers, G.; Xiao, X.; Luo, Y.; et al. Increased vegetation growth and carbon stock in China karst via ecological engineering. Nat. Sustain. 2018, 1, 44–50. [Google Scholar] [CrossRef]
  80. Wei, B.; Mao, X.; Liu, S.; Liu, M.; Wang, Z.; Kang, P.; Gao, H.; Tang, W.; Feng, S.; Pan, Z. Breaking the poverty trap in an ecologically fragile region through ecological engineering: A close-up look at long-term changes in ecosystem services. J. Environ. Manag. 2024, 358, 120921. [Google Scholar] [CrossRef]
Figure 1. Location, administrative division, and elevation of Guangxi. The DEM dataset was acquired from the Resource and Environment Data Cloud Platform, Chinese Academy of Sciences (https://www.resdc.cn/).
Sustainability 17 08739 g001
Figure 2. Index system of the regional ecological risk assessment in Guangxi.
Sustainability 17 08739 g002
Figure 3. Second-level land use types of Guangxi in 2020.
Sustainability 17 08739 g003
Figure 4. Flowchart of the proposed research in Guangxi.
Sustainability 17 08739 g004
Figure 5. Human-caused ecological risk source intensities of Guangxi.
Sustainability 17 08739 g005
Figure 6. Ecological risk receptor capitals of Guangxi.
Sustainability 17 08739 g006
Figure 7. Integrated eco-environmental vulnerabilities of Guangxi.
Sustainability 17 08739 g007
Figure 8. Final regional ecological risk distributions of Guangxi.
Sustainability 17 08739 g008
Figure 9. Area proportions of regional ecological risk for Guangxi (a) and its prefectures (b).
Sustainability 17 08739 g009
Figure 10. Spatial association features of the final risk in Guangxi.
Sustainability 17 08739 g010
Figure 11. Graphical displays of the geographical detection results for the final risk in Guangxi.
Sustainability 17 08739 g011
Figure 12. Spatial association features between the final risk and its important influencing factors in Guangxi.
Sustainability 17 08739 g012
Table 1. The valuation standards for land use production-living-ecology functions in Guangxi.
First-Level Land Use TypeSecond-Level Land Use TypeProduction FunctionLiving FunctionEcology Function
CodeLand Use TypeCodeLand Use Type
1Cropland11Paddy field302
12Dry cropland301
2Forestland21Woodland103
22Shrubbery102
23Sparse woodland001
24Other woodland201
3Grassland31High coverage grassland103
32Medium coverage grassland102
33Low coverage grassland001
4Waterbody41River/canal204
42Lake204
43Reservoir/pond204
45Mudflat004
46Bench land004
99Sea waterbody204
5Construction land51City and town area441
52Rural settlement341
53Industrial, mining and transportation land411
6Unused land61Sandy land001
63Saline-alkali land001
64Swamp land004
65Bare land001
66Bare rock-texture land001
Table 2. Indices used for the karst eco-environmental vulnerability assessment in Guangxi.
FactorsGrades AssignedWeight
1234
Slope (°)
Vegetation coverage (%)
<7
>87.58
7–16
78.79–87.58
16–26
60.99–78.79
>26
<60.99
0.3
0.3
Soil vulnerabilityPurple soil, skeleton soil, red clay, mountain meadow soil,
Shajiang black soil, bare rock
Red soil, yellow soil,
yellow-brown soil, laterite, lateritic red soil
Paddy soil, moisture soilLimestone soil,
volcanic ash soil
0.2
Aridity<740740–838838–939>9390.2
RevisedKarst distribution area (Yes, No), Yes = 1, No = 0
Table 3. Area proportions of spatial association types of the final risk in Guangxi.
Association TypeHigh-High AssociationLow-Low AssociationHigh-Low AssociationLow-High AssociationNot Significant
18.09%19.55%0.91%1.46%60.00%
Table 4. Factor detection results for the final risk in Guangxi.
Risk FactorProductionLiving EcologyNDVIAriditySlopeSoilLithology
q statistic0.154790.002670.292220.009910.049220.124310.121840.29846
p value0.0000.0000.0000.0000.0000.0000.0000.000
Order of q38276451
Note: The significant impact factors detected for the final risk are in bold font.
Table 5. Interaction detection results for the final risk in Guangxi.
ProductionLiving EcologyNDVIAriditySlopeSoilLithology
Production0.15479
Living0.156080.00267
Ecology0.308960.300600.29222
NDVI0.189990.015660.324170.00991
Aridity0.222270.052620.362000.060080.04922
Slope0.277210.124710.398630.180240.171600.12431
Soil0.272440.124260.402530.135400.167180.220070.12184
Lithology0.492720.299980.646680.307150.324090.387640.333340.29846
Note: All the interaction q values larger than 0.3 are in bold font.
Table 6. Area proportions of the spatial association types between the final risk and its important influencing factors in Guangxi.
Risk FactorLithologyEcology FunctionProduction FunctionSlopeSoil
HH19.81%9.57%4.64%15.26%11.89%
LL19.97%13.43%15.36%12.71%18.22%
HL3.71%12.54%9.25%12.99%5.40%
LH2.38%13.97%19.49%7.38%11.79%
NS54.14%50.50%51.27%51.67%52.70%
Note: HH, LL, HL, LH and NS indicate the high-high, low-low, high-low, low-high, and not significant spatial association types, respectively.
Disclaimer/Publisher’s Note: The statements, opinions and data contained in all publications are solely those of the individual author(s) and contributor(s) and not of MDPI and/or the editor(s). MDPI and/or the editor(s) disclaim responsibility for any injury to people or property resulting from any ideas, methods, instructions or products referred to in the content.