Article

Spatio-Temporal Patterns and Configuration Pathways of Tourism Economic Resilience in Nine Provinces Along the Yellow River

School of Culture, Tourism, Journalism and Art, Shanxi University of Finance and Economics, Taiyuan 030006, China
*
Author to whom correspondence should be addressed.
Sustainability 2025, 17(20), 9111; https://doi.org/10.3390/su17209111 (registering DOI)
Submission received: 29 August 2025 / Revised: 2 October 2025 / Accepted: 9 October 2025 / Published: 14 October 2025
(This article belongs to the Special Issue Sustainable and Resilient Regional Development: A Spatial Perspective)

Abstract

The resilience of the tourism economy plays a pivotal role in sustaining regional economic stability across the nine provinces along the Yellow River. This study examines the spatio-temporal evolution and configurational pathways of tourism economic resilience across the nine provinces along the Yellow River during 2012–2022 by applying the Standard Deviation Ellipse and Fuzzy Set Qualitative Comparative Analysis. The results showed that: (1) From 2012 to 2019, the tourism economic resilience exhibited a steady upward tendency overall, with a slight fluctuation in the short term in 2020. (2) High and relatively high-level regions experienced a belt-like high-value zone, eventually extending to Sichuan Province, Henan Province, and Shandong Province. (3) The standard deviation ellipse exhibited a distribution pattern along the northeast-southwest axis, with its center of gravity situated in the middle reaches of the Yellow River, having shifted a total of 146.81 km. (4) Four driving pathways were identified: resistance-dominated, recovery-dominated with restructuring synergy, renewal-driven, and multi-resilience synergy-driven. Three barriers also appeared: renewal-constrained, restructuring-lagged, and overall resilience-deficient.

1. Introduction

Ecological protection and high-quality development in the Yellow River Basin (YRB) constitute a major strategic initiative for China’s coordinated regional development, holding profound significance for balancing environmental protection with socio-economic progress. This study focuses on nine provinces in the YRB, which are not only core areas for the basin’s ecological protection and economic development, but also regions with the richest tourism resources and the most urgent need for resilience construction, making them typical for research. The Outline of the Plan for Ecological Protection and High-Quality Development of the YRB, issued by the State Council in 2021, serves as a crucial guideline for its implementation, reflecting the central government’s high priority on governance. Against this backdrop, the tourism industry emerges as a pivotal link integrating the basin’s ecological value, cultural resources, and economic vitality. Its high-quality development is not merely a supporting element, but a core driver of the YRB’s overarching strategic goals [1,2]. The YRB’s unique tourism endowments further anchor this significance. Qinghai and Sichuan are noted for alpine lakes, Gansu and Ningxia for Silk Road relics set in desert landscapes, Inner Mongolia and Shanxi for steppe environments and medieval Buddhist art, Shaanxi and Henan for dense clusters of world-class historical monuments, and Shandong for coastal landforms. Together, these resources form an integrated tourism corridor that holds immense potential to fuel the YRB’s sustainable development.
However, the tourism industry faces dual tasks in advancing high-quality development. The tourism industry must not only adapt to and meet the increasingly diverse travel demands of the public in the new era, but also address structural challenges such as inadequate resource integration, product homogenization, superficial industrial convergence, and underdeveloped public services [3,4]. For the YRB in particular, multiple risks—including climatic disasters, public health crises, and market volatility—pose significant threats to tourism. Consequently, the sector’s capacity for rapid recovery, reconstruction, and even upgrading following such shocks has become a focal point for both theoretical research and policy practice.
This study aims to: (a) elucidate the spatio-temporal evolution of tourism economic resilience (TER) across the nine provinces in the YRB from 2012 to 2022—specifically, to examine the direction of the shifting center of gravity in resilience and how resilience levels vary across provinces over time; and (b) identify the configurational pathways that lead to high or non-high resilience, clarifying which of the four sub-dimensions (resistance, recovery, restructuring, and renewal) serve as essential conditions, how they interact configurationally, and whether multiple pathways can equivalently lead to high or non-high resilience. To achieve these objectives, a systematic indicator framework for TER was first constructed, and the entropy method was applied to compute indicators using multi-source data. Second, a strip heatmap is used to analyze the characteristics of the comprehensive value and the four sub-dimensions of TER during the sample period. By setting a cutoff value, the evolution process of TER is visually presented, and the trend of its center of gravity is analyzed using SDE. Finally, we use fsQCA to investigate how resistance, recovery, restructuring, and renewal configure to shape TER. We anticipate that our findings will provide ex-ante guidance for risk prevention in the study area and help mitigate welfare losses that exogenous shocks inflict on the tourism sector.

2. Literature Review

2.1. Conceptual Evolution of Tourism Economic Resilience

Resilience denotes the speed with which a system returns to its original state after disturbances; Holling first introduced the concept into ecology, distinguishing between ecological and engineering resilience [5]. Subsequent research on social-ecological systems has further introduced adaptability and transformability into the theoretical domain of resilience [6,7]. Previous studies indicate that differences in resilience levels lead to divergent regional responses to identical external risks, and effective resilience management can mitigate the impacts of such risks [8]. The tourism economy is inherently fragile, comprising numerous and complex economic elements that require the synergy of multiple industries [9]. Against this backdrop, Cochrane contends that because tourism is a complex adaptive system, it lends itself to the integrated, interdisciplinary and non-linear lens of resilience; this, in turn, reveals the underlying forces that shape Butler’s Tourism Area Life Cycle [10,11]. TER refers to the ability of the tourism economic system to flexibly adjust its strategies when confronted with sudden shocks, restore its pre-shock state, and achieve restructuring and upgrading [12,13].

2.2. Related Research on Tourism Economic Resilience

Previous research on TER has proceeded along two primary lines. Qualitative studies have traced the origins of resilience issues—for example, by focusing on the resilience of hotel family enterprises during the COVID-19 pandemic [14], whereas quantitative studies have examined the direct or net effects of single factors such as tourism specialization, industrial agglomeration, and the digital economy on resilience [15,16]. Collectively, these contributions have concentrated on measurement methods, spatio-temporal trajectories, and determinant identification, thereby furnishing a solid analytical foundation for the present and future research. Nevertheless, three critical gaps still await resolution.
First, although extant studies have employed natural breaks and spatial Markov chains to delineate agglomeration characteristics, regional disparities, and spatial dependence, they have offered only limited insight into the dynamic evolution of spatial distribution and the inter-regional transition regularities of TER. To bridge this gap, this study introduces the standard deviational ellipse (SDE) to systematically examine the centroid migration and spatial displacement of resilience.
Second, in the investigation of revealing the factors influencing the resilience of the tourism economy, previous research has mainly relied on traditional methods such as geographic detector models [17]. Although these studies can effectively identify the key drivers of the resilience of the tourism economy, they ignore the complex interactions that may exist between the antecedent variables and the resilience of the tourism economy [18,19]. Fuzzy-set Qualitative Comparative Analysis (fsQCA) is employed to unpack how multiple conditions jointly shape TER. Grounded in Ragin’s foundational principles of causal complexity and set-theoretic logic, the method constructs truth tables and conducts Boolean operations to identify configurational effects [20]. These effects are inherently nonlinear and cannot be reduced to a simple sum of individual factors, because they arise from the interplay among conditions rather than from any single causal force. By moving beyond linear assumptions, fsQCA offers deeper insight into the complex mechanisms through which independent variables influence the dependent variable [21].
Third, existing scholarship has primarily focused on inbound tourism or the Yangtze River Economic Belt as the unit of analysis [22,23]. In contrast, this study concentrates on the nine provinces along the Yellow River, which constitute a pivotal axis of national economic development and epitomize the tension between rapid growth and heightened vulnerability to natural disasters and public-health shocks. Moreover, current research mostly centers on the impacts of single factors, such as the digital economy and economic crises, on the TER in the YRB, while paying insufficient attention to the configurational logic of the interactions among multiple factors [24,25].

3. Research Design

3.1. Overview of the Study Area

The YRB stretches about 5464 km through nine provinces—Qinghai, Sichuan, Gansu, Ningxia, Inner Mongolia, Shanxi, Shaanxi, Henan, and Shandong. The watershed spans four major landform units and three major terrain terraces, and this unique geographical feature has profoundly shaped the fragility of its ecological environment and the uneven distribution of its tourism resources. These unique geographical features have profoundly shaped the region’s fragile ecological environment and the uneven distribution of its tourism resources [26,27]. As of June 2024, the majority of A-level tourist attractions along the YRB are concentrated in the lower reaches of the river, specifically in Shandong Province and Henan Province. These attractions are rated by China’s Ministry of Culture and Tourism based on standards such as resource quality and service facilities, with levels ranging from 1 A to 5 A. These regions account for 1228 and 724 A-level attractions, respectively, totaling 38.1% of the total number of A-level attractions, making them the core tourism hub of the lower reaches of the river. Next is the upper reaches of the YRB, which include Sichuan Province, Ningxia, Qinghai Province, and Gansu Province, accounting for 34.2% of the total A-level attractions in the nine provinces. Finally, the middle reaches of the YRB, which includes Shaanxi Province, Shanxi Province, and Inner Mongolia, account for 27.6% of the total A-level attractions in the nine provinces. Sichuan Province, Henan Province, and Shandong Province host 51.1% of the nine provinces’ total 5 A-level tourist attractions.
As China’s ecological security barrier and an important cradle of Chinese civilization, the YRB is rich in historical and cultural heritage, such as the Banpo Culture and Laoguantai Culture, as well as natural landscape resources like the Hukou Waterfall and Qiankun Bay. However, the tourism economy of the YRB is highly sensitive and vulnerable to sudden adverse events such as natural disasters and public health incidents [28]. These external shocks not only directly disrupt tourism operations but also indirectly exacerbate inefficiencies in tourism resource integration and weaken the recovery capacity of the industry chain [29,30]. Studying the spatio-temporal patterns and configuration pathways of TER along the Yellow River in nine provinces can help enhance overall resilience and risk-bearing capacity. This research provides theoretical support for implementing cross-regional tourism resource integration strategies and establishing tourism disaster emergency response mechanisms [31].

3.2. Research Methodology

3.2.1. Entropy-Weighted Method

The entropy-weighted method is a well-established objective weighting approach for evaluating composite levels [32]. The core advantage lies in its ability to reflect the utility value of information entropy and reduce the interference of subjective bias factors. This study applies the entropy method in Stata 17 to calculate the four dimensions of TER (resistance, recovery, restructuring and renewal) and the overall score. The calculation steps were as follows: constructing the original matrix, standardizing each indicator, calculating the entropy weights of each indicator, and finally linearly aggregating them to obtain the comprehensive evaluation index.

3.2.2. Standard Deviational Ellipse

The SDE model is a spatial–statistical technique that captures the core characteristics of spatial distribution and centroid migration trajectories via metrics such as centroid coordinates, azimuth, and ellipse area [33]. Using ArcGIS (https://www.arcgis.com/), the study employs the centroid coordinates (X, Y) to denote the arithmetic mean center of TER. The direction of centroid movement reflects the dynamic trend and spatial process of data distribution. The azimuth θ specifies the orientation of the ellipse’s major axis, thereby indicating the developmental direction of resilience distribution. The major semi-axis represents the principal direction of centroid dispersion, whereas the minor semi-axis denotes the minimal extension perpendicular to the major axis. Variations in the semi-axes are used to measure the dispersion and agglomeration of resilience distribution [34]. The computational formulas are provided below:
N   X , Y = i = 1 n w i x i / i = 1 n w i ,     i = 1 n w i y i / i = 1 n w i
δ x = i = 1 n ( w i x i ¯ cos θ w i y i ¯ sin θ ) 2 i = 1 n w i 2
δ y = i = 1 n ( w i x i ¯ sin θ w i y i ¯ cos θ ) 2   i = 1 n w i 2
θ i j = n π / 2 + a r c t a n [ ( y i y j ) / ( x i x j ) ]
where n is the number of provincial units; (X, Y) denotes the weighted mean centroid coordinates; wi represents the weight of province i; δ x and δ y refer to the standard deviations along the X- and Y-axes, in turn; and θ denotes the azimuth of the SDE.

3.2.3. Fuzzy-Set Qualitative Comparative Analysis

fsQCA is a Boolean algebra-based approach designed to identify configurational combinations of conditions sufficient for a given outcome [35]. fsQCA is a Boolean algebra-based approach designed to identify configurational combinations of conditions sufficient for a given outcome [36]. Two key concepts govern fsQCA: consistency and coverage, both ranging from 0 to 1. Consistency indicates the extent to which resistance, recovery, restructuring, and renewal lead to high TER [37]. A consistency threshold exceeding 0.9 signifies that the antecedent condition is a necessary condition for the outcome, calculated as:
C o n s i s t e n c y ( X i Y i ) = m i n ( X i   , Y i ) X i
Coverage denotes the explanatory power of the antecedent configuration for the outcome, computed as:
C o v e r a g e ( X i Y i ) = m i n ( X i , Y i ) Y i
This study analyzes how resistance, recovery, restructuring, and renewal generate TER through specific configuration pathways, constituting a causal relationship exploration study specific to this region [38]. Additionally, since all variables are continuous data, they cannot be directly simplified into binary variables. Therefore, using fsQCA as the research method can more accurately capture and analyze the complex relationships between these antecedent conditions and their impact on TER.

3.3. Indicator Selection and Data Sources

Given the complexity and multidimensionality of TER, a single indicator is insufficient to capture its full profile. This study therefore adopts a composite-indicator approach to gauge the overall level of resilience. Indicators that have been frequently employed in the extant literature on TER were selected, and their appropriateness was subsequently validated through consultation with two domain experts. Guided by the principles of comprehensiveness, accuracy, and data availability, an indicator system is constructed across four dimensions: resistance, recovery, restructuring, and renewal [8,16,17,18,37,39]. Resistance refers to the defensive and adaptive capacity of the tourism sector to maintain its structure and functions when confronted with shocks such as natural disasters or pandemics. Serving as the first line of defense of TER, it embodies the sector’s self-protection and buffering mechanisms and hinges upon factors such as tourism resources and the local economic base [40]. Recovery draws its theoretical foundations from ecological restoration theory and emphasizes the capacity to swiftly revert to the pre-shock condition—or to a higher level—after disruption [22]. As a critical safeguard of TER, recovery reflects the sector’s rapid rebound and adaptability, contingent upon pollution-control capacity, ecological quality, and tourism infrastructure. Restructuring introduces a system-reconfiguration and transformation–upgrading perspective, denoting the extent to which the tourism industry can reallocate resources and adjust operational models to adapt to a new environment after major shocks [37,41]. Restructuring encapsulates the strategic reorientation capacity of the tourism economy after disruption and is conditioned by factors such as the size of the tourism workforce and investment in fixed tourism assets [42]. Renewal signifies the preservation of vitality and competitiveness through innovation and technological advancement, integrating insights from innovation theory, technological-progress theory, and competition theory into tourism development [5,43]. Renewal is influenced by the availability of tourism talent and the level of technological sophistication [18]. Tourism colleges constitute an intellectual infrastructure sustaining sectoral innovation, whereas patent grants determine the efficiency of knowledge commercialization; together they accelerate the industry’s alignment with evolving market demands and emergent risks, thereby enhancing adaptive capacity.
All indicators are positive indicators. This study calculates the ratio of total tourism revenue to GDP based on the sum of fixed—asset investment across provinces to reflect tourism fixed—asset investment [13,14]. Other indicators can be obtained from the China Statistical Yearbook, the China Tourism Statistical Yearbook, the China Investment Statistical Yearbook, and the China Tertiary Industry Statistical Yearbook. Missing data were supplemented using linear interpolation. All indicators are positively oriented; the detailed indicator system is presented in Table 1.

4. Results

4.1. Spatio-Temporal Patterns

4.1.1. Overall Evolutionary Trajectory

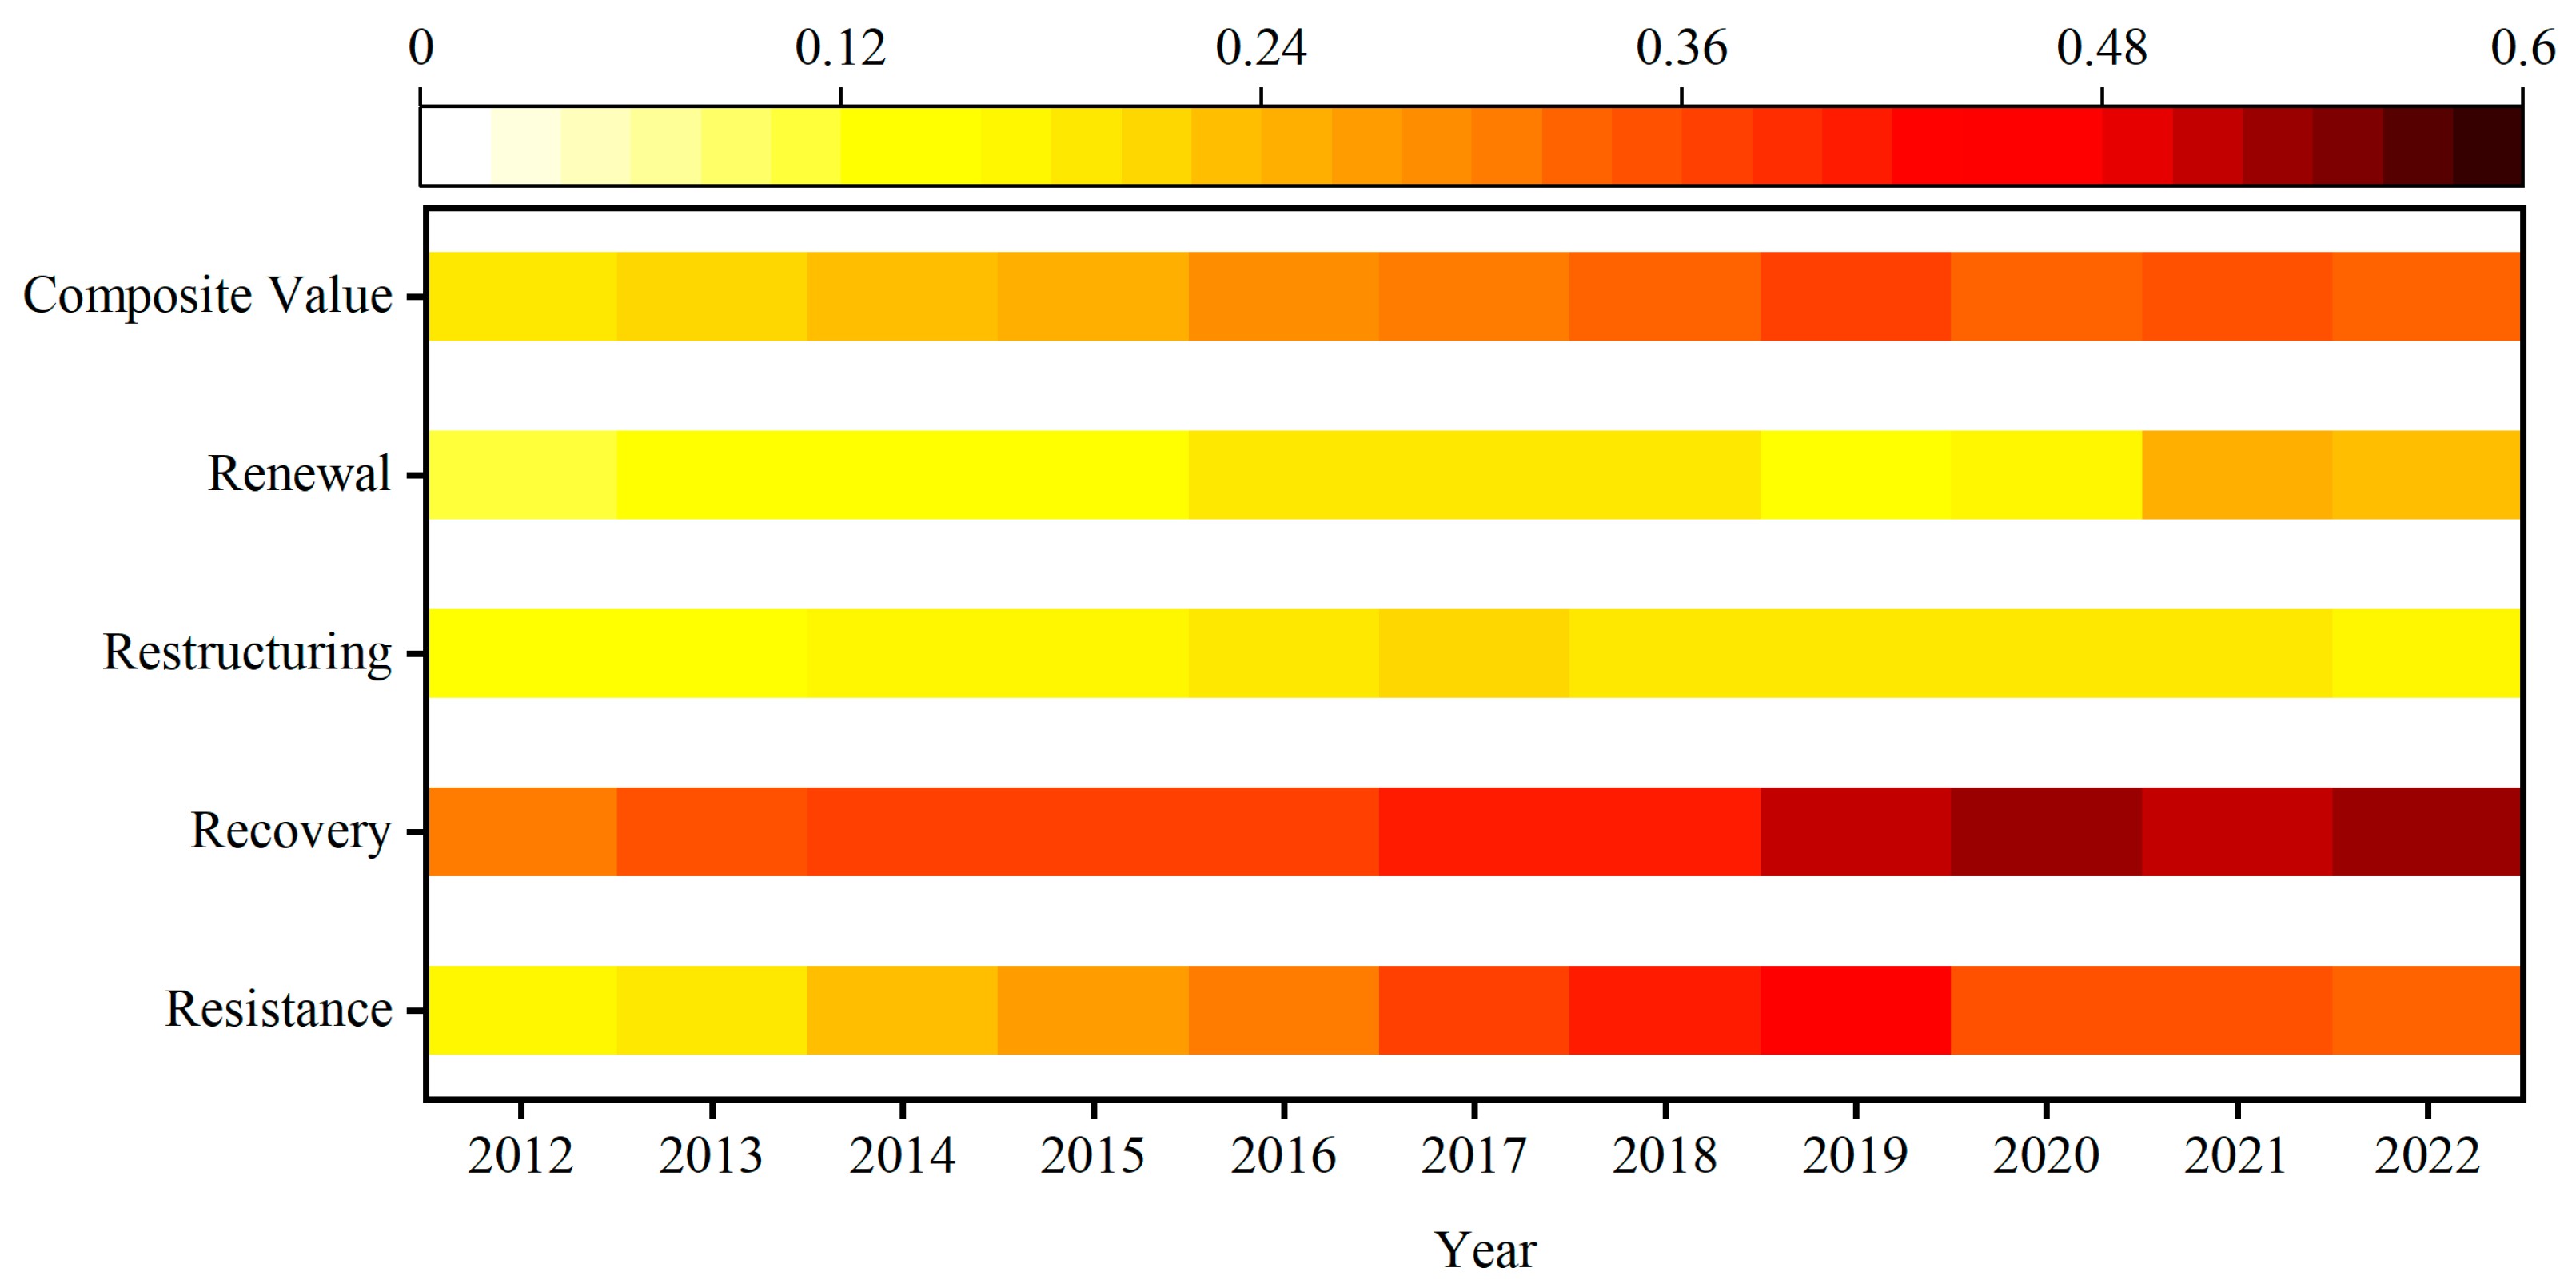
This study uses Origin 2024 software’s strip heat map to profile the overall trend of TER along the Yellow River in nine provinces from 2012 to 2022, as shown in Figure 1. The comprehensive resilience index values for the tourism economy of the nine provinces along the Yellow River all fall within the range of 0 to 0.6. In terms of trend development, although the COVID-19 pandemic in 2020 caused minor fluctuations in the short term, the overall trend has been one of steady growth, with the index exceeding 0.24 since 2016.
Dimensionally, renewal and restructuring remain comparatively weak, with values consistently below 0.24, underscoring substantial latent potential for enhancing resilience. Conversely, recovery demonstrates a monotonic increase, maintaining values above 0.48 after 2019. Resistance follows a sustained upward trajectory from 2012 onward; however, its growth plateaus after 2019, constrained by market saturation and resource limitations. Overall, this study found that the overall magnitude distribution characteristics and dynamic evolutionary tendencies of TER in the provinces covered by the YRB are highly similar to the development patterns of China’s tourism economy when compared with existing research [5].

4.1.2. Spatial Pattern Analysis

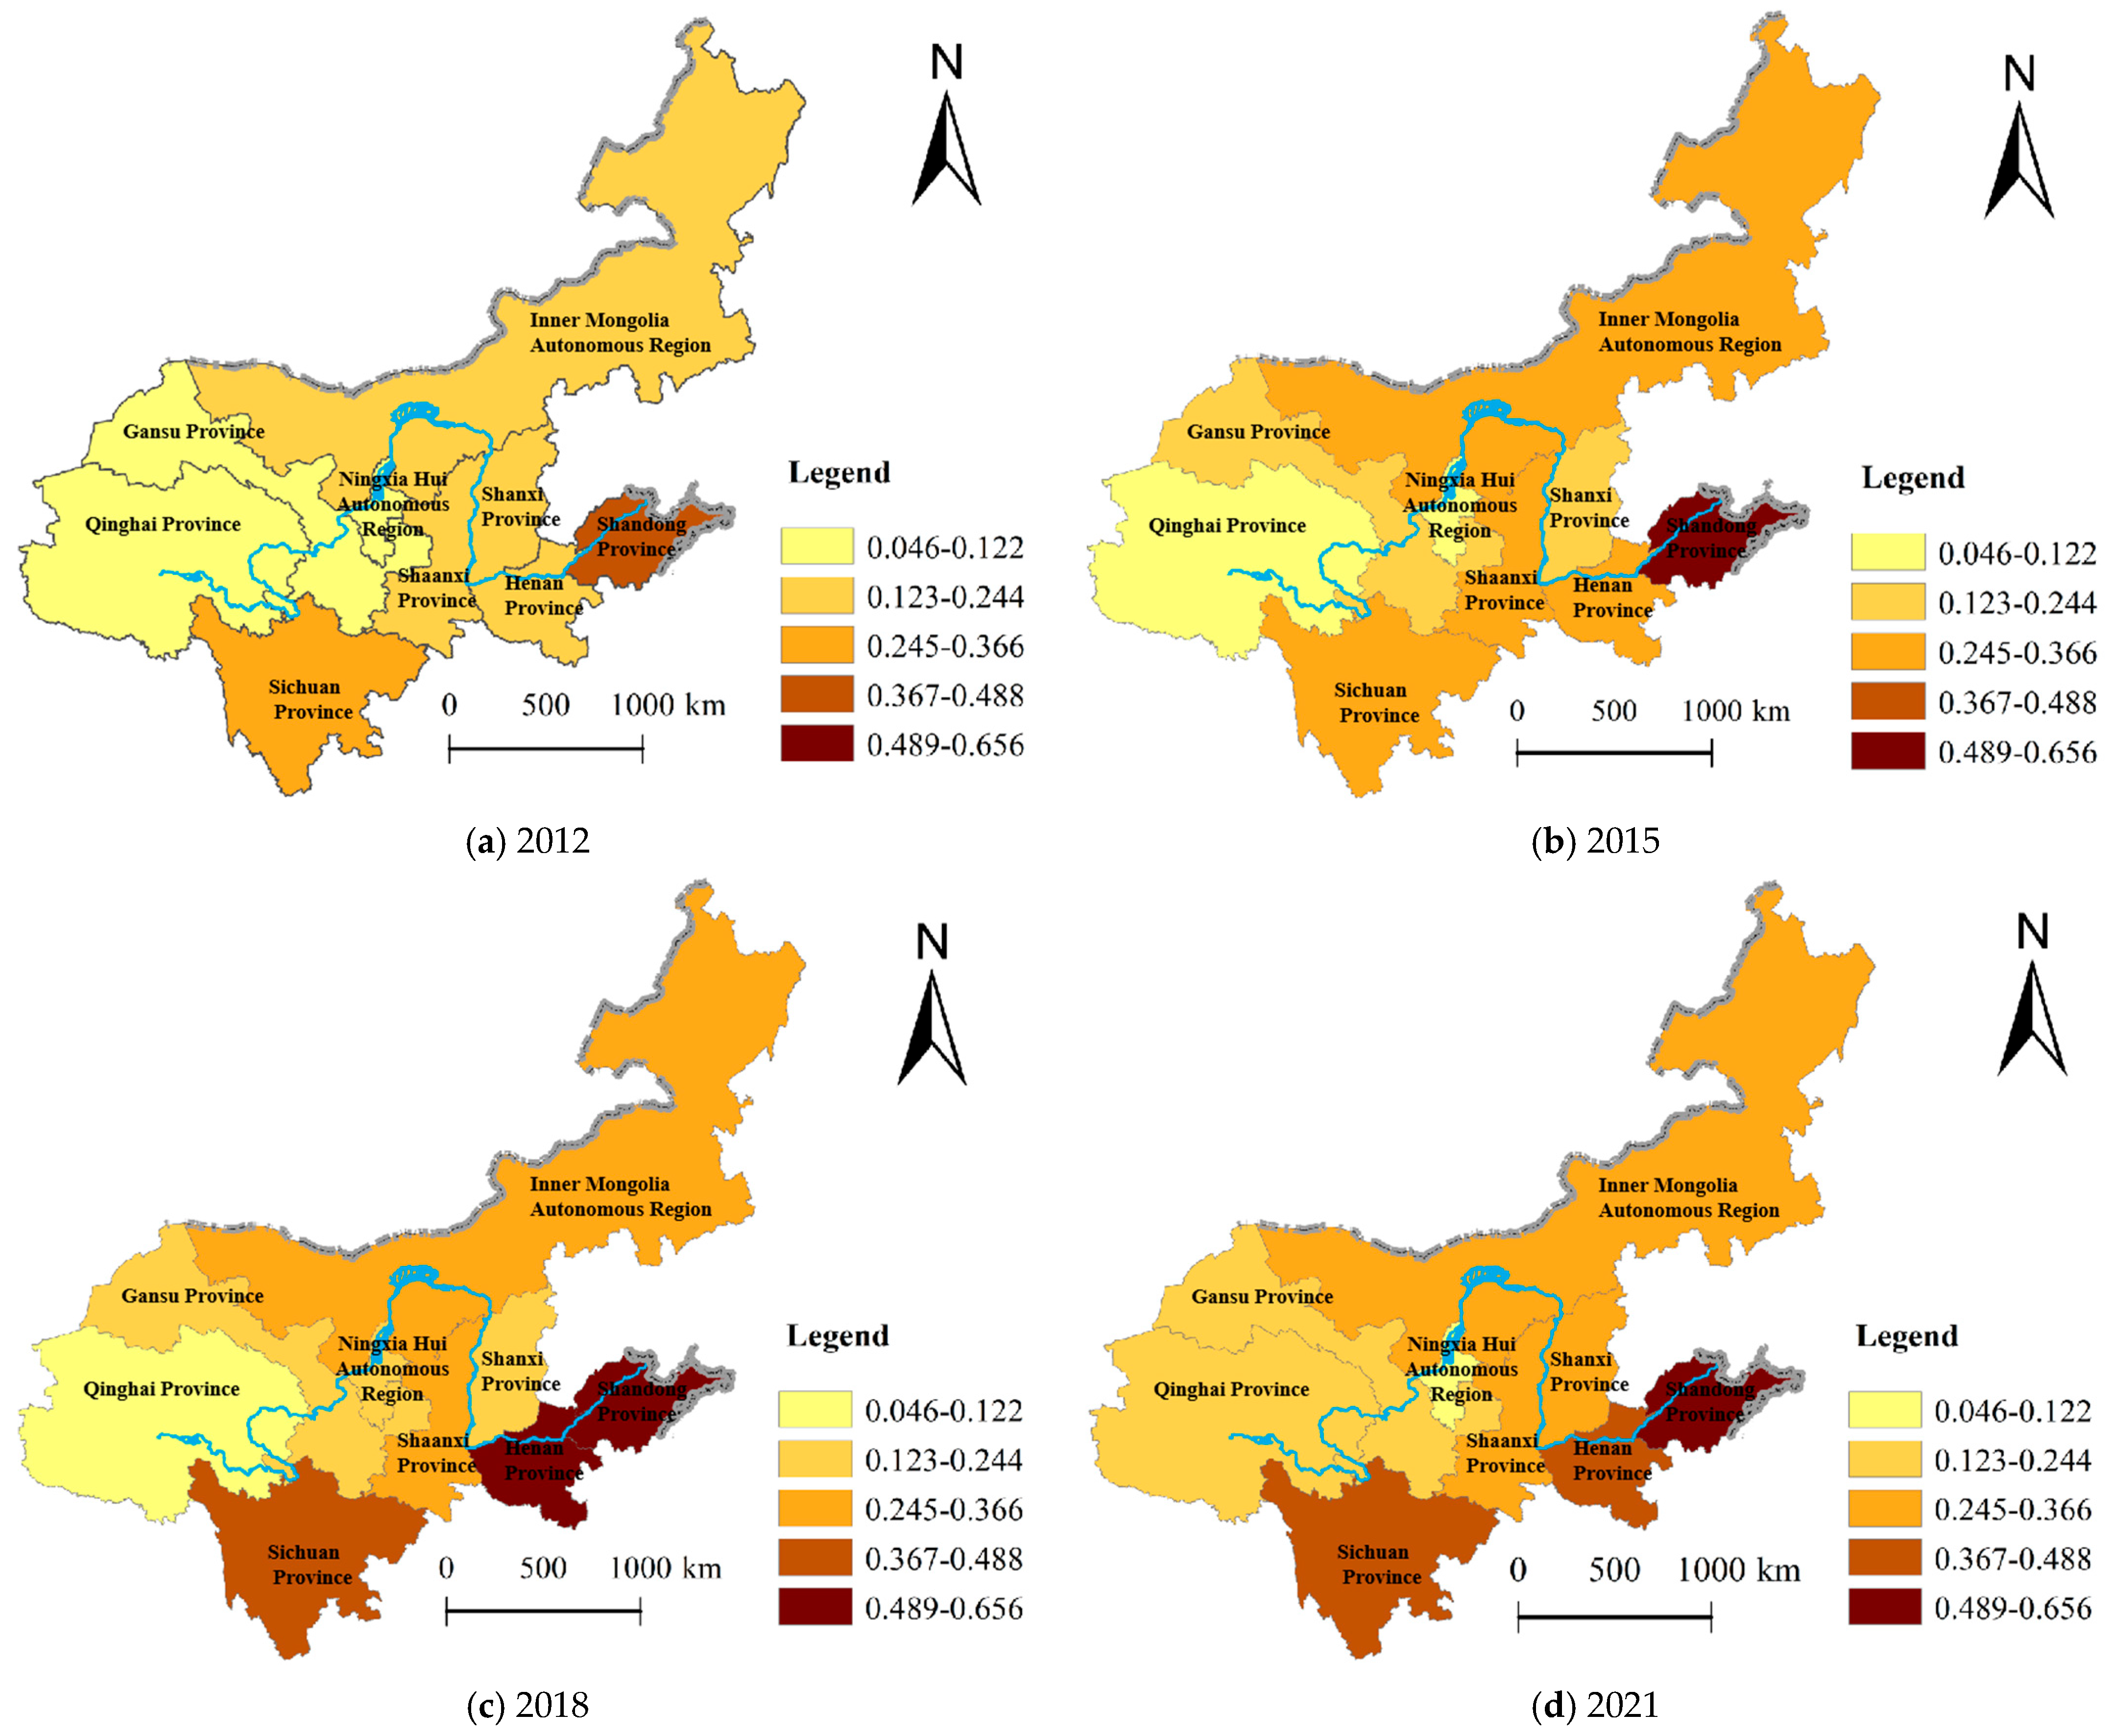
This study uses the breakpoint classification method to divide the resilience levels calculated by the entropy method, setting the breakpoints at 0.122, 0.244, 0.366, 0.488, and 0.656, and conducts a visual exploration and analysis of spatial evolution patterns based on this. Figure 2a–d illustrate the spatial distribution of TER at four time nodes: 2011, 2014, 2018, and 2021. The loci of high and higher-level resilience shifted from a single-core configuration centred on Shandong in 2012 to a multi-core pattern encompassing Sichuan, Henan, and Shandong by 2018. These provinces constitute a contiguous high-value corridor that gradually assumes a planar linkage. Sichuan upgraded its resilience by optimising the tourism industrial structure, prioritising eco-tourism, and launching the “Famous Counties for Tianfu Tourism” initiative to deepen the exploitation of local characteristics. Henan, leveraging its abundant historical and cultural resources, implemented a “Culture + Tourism” strategy and actively participated in regional co-operation within the Central Plains Economic Zone, thereby fostering tourism synergy. Through these targeted measures, both provinces consolidated their positions as high-resilience clusters. Qinghai’s resilience, initially constrained in 2012 by deficient infrastructure and limited economic development, improved by 2021 in response to surging domestic tourism demand. Ningxia experienced a monotonic ascent from low resilience in 2012 to moderately low in 2018, followed by a reversion to low levels by 2021. Overall, this evolutionary trajectory is attributable to the compounded effects of provincial economic development, endowment of tourism resources, and post-shock recovery capacity.
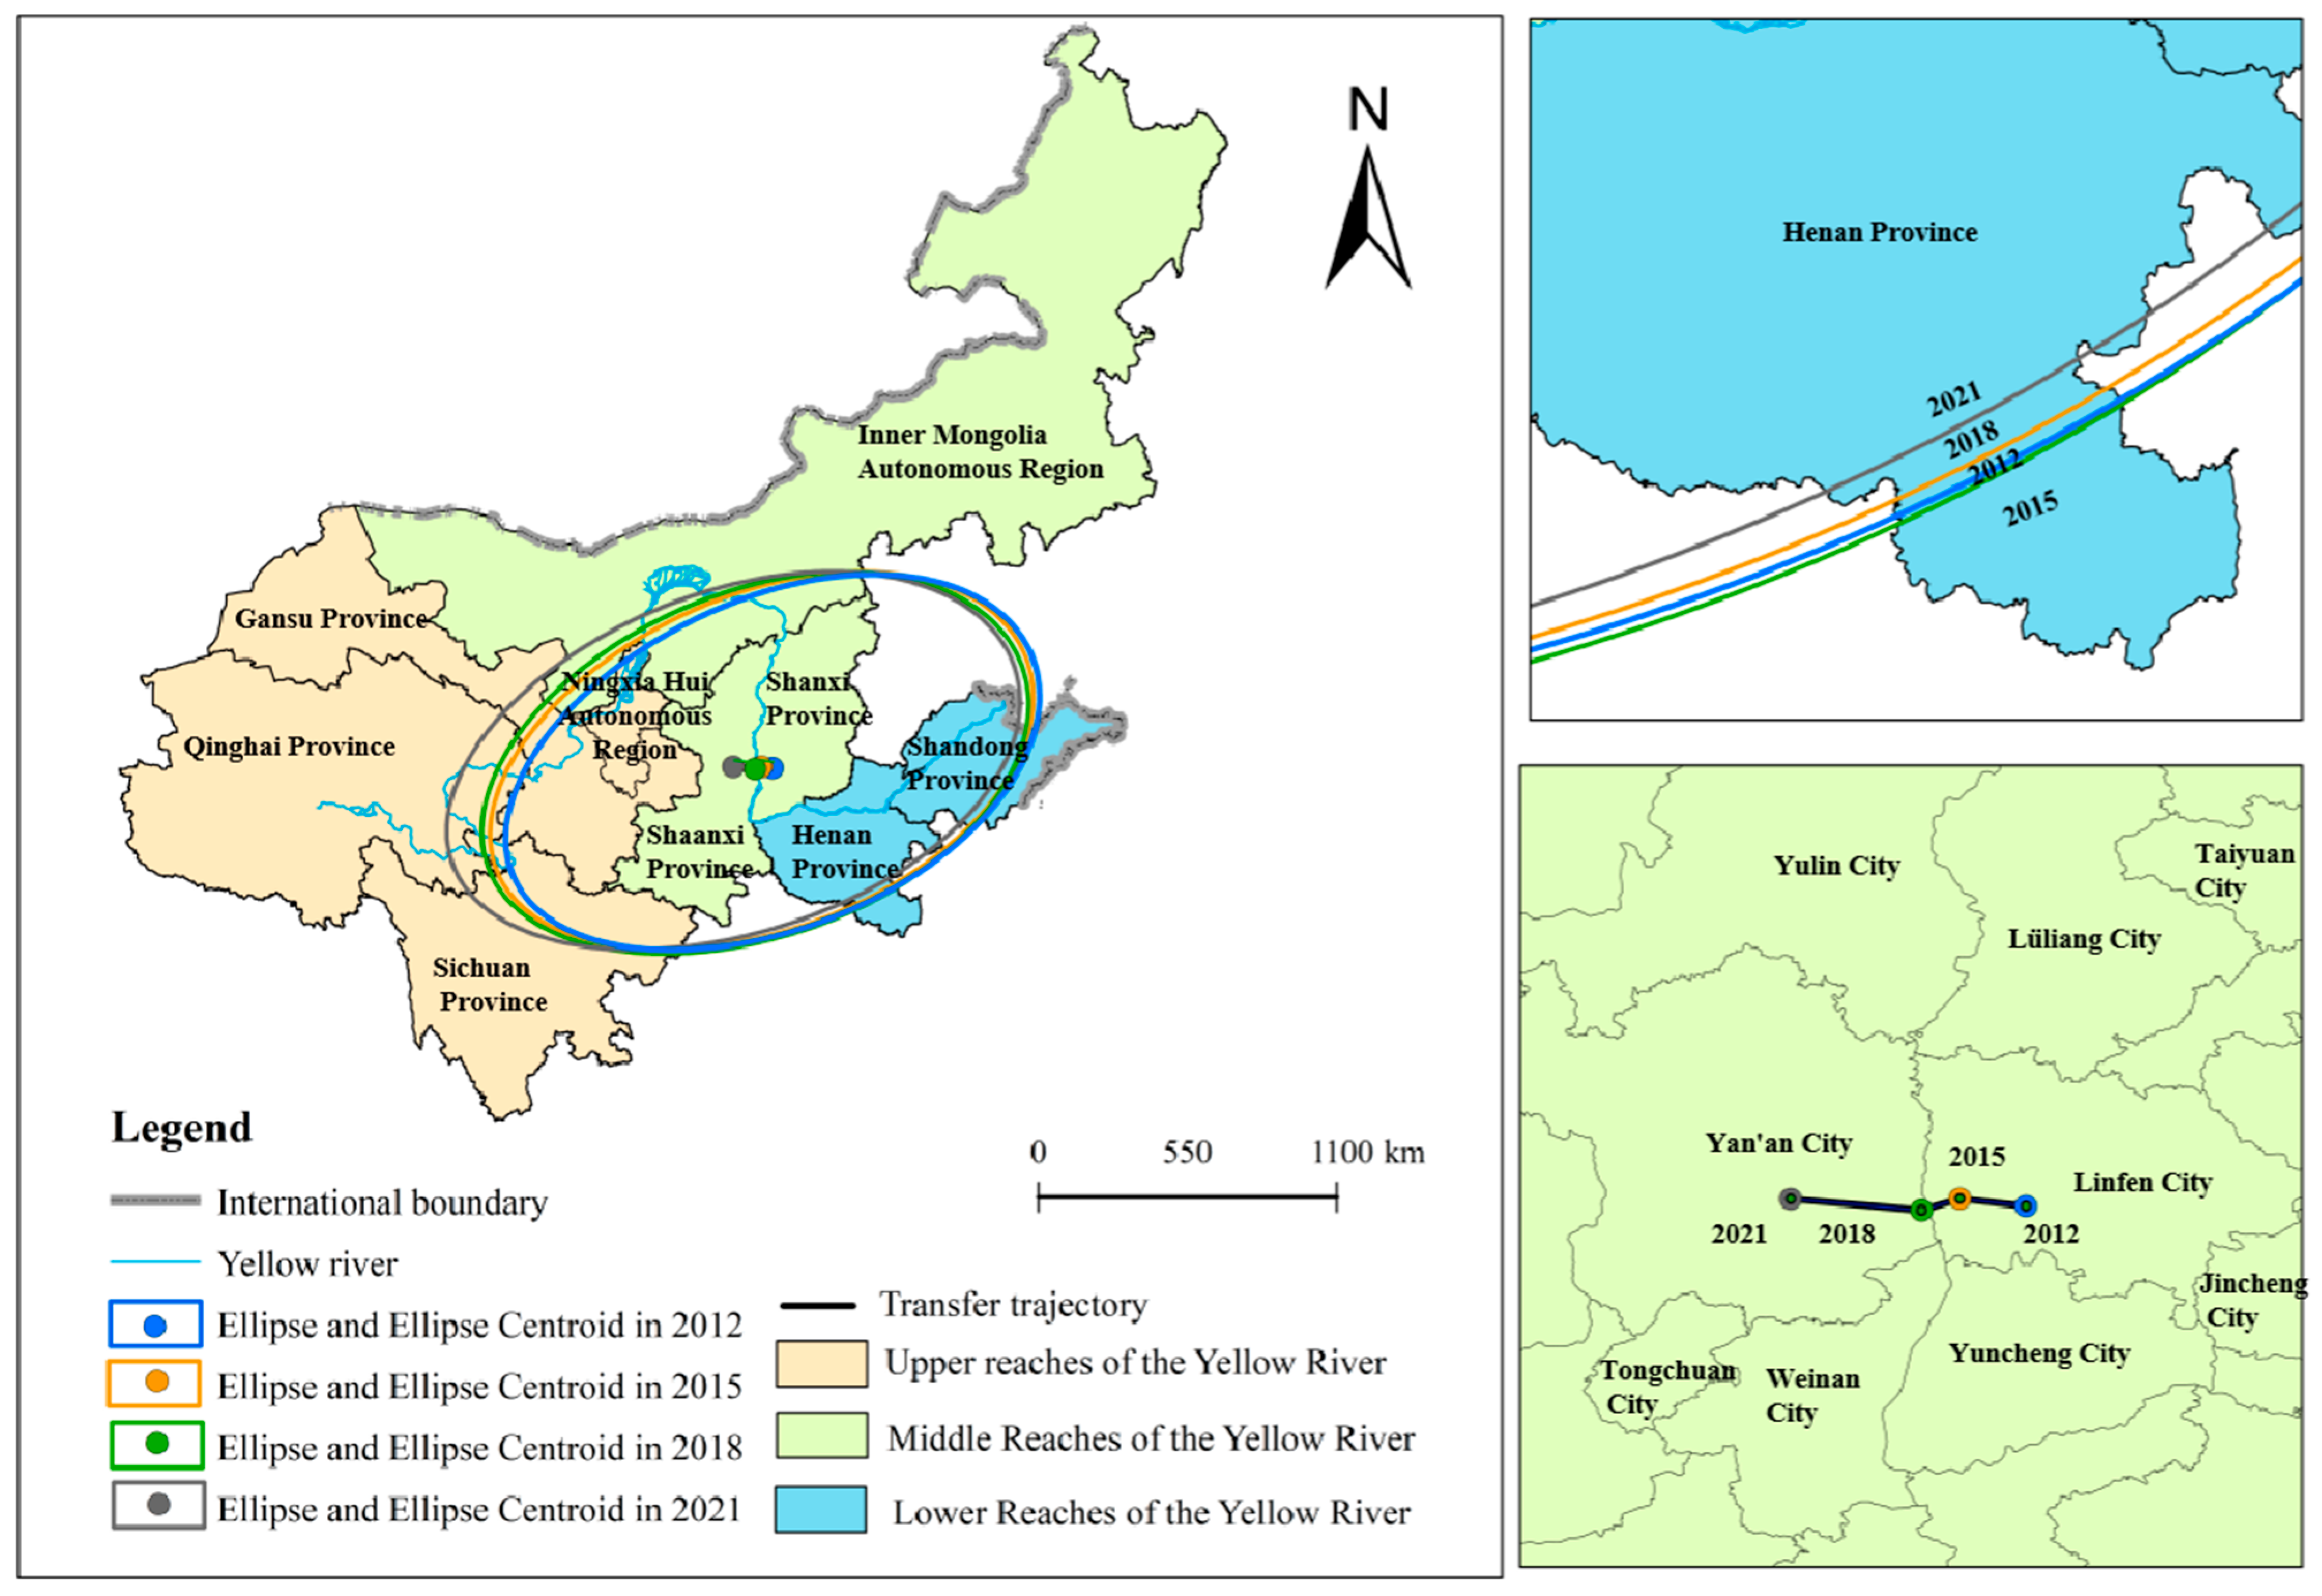
Subsequently, the evolution of the centroid of TER among the nine provinces along the Yellow River was examined by means of the SDE model. The detailed estimates are reported in Table 2 and Table 3. Figure 3 reveals that throughout the observation period, the centroid remained situated in the middle reaches of the YRB, underscoring the pivotal role of this sub-region within the broader basin-scale tourism economy. Specifically, the centroid migrated from Linfen City, Shanxi Province (36°3′28″ N, 111°1′10″ E) in 2012 to Yan’an City (36°5′46″ N, 109°43′22″ E) in 2021, tracing a path that first shifted 40.97 km northwest, then 24.83 km southwest, and finally 81.01 km northwest, yielding a cumulative displacement of 146.81 km. The migration pattern is characterized by an initial acceleration, a subsequent deceleration, and a renewed acceleration after 2018, indicating pronounced intra-regional variability in TER. The persistent westward drift of the centroid can be attributed to two interrelated dynamics. First, national policies—most notably the Western Development Strategy and the concomitant expansion of infrastructure investment—have created enabling conditions for high-quality tourism development in the central and western provinces. Second, targeted provincial initiatives have amplified these macro-level stimuli; for instance, Gansu Province has optimized its spatial tourism layout, fostered the Silk Road tourism belt, and implemented subsidy programmes such as “Attracting Tourists to Gansu,” thereby substantially enhancing its competitive positioning. The fact that the SDE centroid remained anchored within Shanxi and Shaanxi throughout the sample period highlights the intensifying agglomeration effects of these two provinces. This spatial inertia signifies their emergence as critical growth engines within the tourism economy of the nine-province Yellow River corridor.
Furthermore, the eigenvalues of the SDE model reveal a non-monotonic trajectory of the minor semi-axis, expanding from 633.27 km in 2012 to 662.39 km in 2018 before contracting to 655.34 km in 2021. By contrast, the major semi-axis exhibits a continuous elongation, rising from 1049.01 km in 2012 to 1108.70 km in 2021. This elongation is particularly pronounced in the upper reaches of YRB, signifying a conspicuous east–west extension. The phenomenon indicates that, despite complex topography and initially fragmented tourism resources, the upper basin has experienced a progressive enhancement of TER, driven by sustained improvements in tourism infrastructure and intensified resource exploitation. Qinghai Province, for instance, capitalises on its abundant natural landscapes and profound ethnic-cultural heritage to establish multiple eco-tourism corridors, effectively integrating and connecting regional resources, while simultaneously upgrading transportation networks and optimising accommodation facilities. Moreover, the SDE area exhibits continuous expansion, peaking at 2.2824 × 10⁶ km2 in 2021. Overall, the spatial configuration of TER along the nine-province Yellow River corridor demonstrates pronounced directional characteristics, with a pronounced agglomeration effect along the northeast–southwest axis. Relative to the northeastern sector, the southwestern sector increasingly functions as a pivotal source of growth.

4.2. Configurational Pathways

4.2.1. Data Calibration and Necessity Tests

This study adopts TER as the outcome variable and its four dimensions—resistance, recovery, restructuring, and renewal—as antecedent conditions. The fsQCA method is employed to assess both necessity and sufficiency of TER in 2012, 2015, 2018, and 2021. Data calibration precedes the analysis. The 95th, 50th, and 5th percentiles of each variable are set as the thresholds for full membership, crossover, and full non-membership, respectively [44]. On this basis, the necessity of individual antecedents for high and not-high TER is examined (Table 4). Results indicate that in 2012 and 2015, none of the antecedents achieved the 0.9 consistency threshold, implying that no single factor constitutes a necessary condition for either high or not-high resilience. In 2018, resistance attained a consistency score of 0.95 (>0.9), establishing it as a necessary condition for high TER. This underscores the pivotal role of resistance in fostering innovation in tourism products and elevating service quality. By 2021, the absence of renewal (i.e., not-renewal) registers a consistency of 0.92 (>0.9), revealing it to be a necessary condition for not-high TER. This finding highlights that the lack of renewal constrains the sector’s capacity to adapt swiftly to market dynamics.

4.2.2. Sufficiency Analysis

To test sufficiency, truth-tables was constructed with a frequency threshold of 1 and an initial consistency threshold of 0.7. The truth tables for the 2012 tourism economy under high-resilience and non-high-resilience condition combinations are presented in Table A1 and Table A2 of the Appendix A. Truth tables for other years may be obtained from the authors to support research reproducibility. The intermediate solution was taken as the standard, and any condition present in both the parsimonious and intermediate solutions was designated as a core condition, while others were treated as auxiliary. To ensure robustness, the original calibration anchors were reset to the 90th, 50th, and 10th percentiles, and the consistency threshold was raised to 0.75 [32]. Re-estimation produced no substantive change in the core conditions, confirming the reliability of the results.
Nine configurational pathways that generate high TER are reported in Table 5. Both individual and overall solution consistencies exceed 0.8, attesting to the reliability of the findings. These pathways are hereafter termed “driving paths,” which can be synthesised into four archetypes.
(1)
Resistance-dominated Path
The “Resistance-dominated” path refers to addressing external shocks and internal pressures faced by the tourism economy by enhancing resilience. This model includes Pathways Config. 1, Config. 2, and Config. 6, all of which rely on strong resilience as a core condition. A typical example of Config. 1 is Henan Province in 2012. The provincial government launched and implemented a series of measures, including the “Cultural Henan” tourism brand enhancement project and the optimization of tourism infrastructure, significantly increasing tourists’ interest and participation in tourism, fully demonstrating the positive role of the resistance-dominated path. Config. 6 is exemplified by Shaanxi Province in 2018, which proposed and implemented policies such as upgrading the cultural and tourism welfare electronic card and expanding cultural and tourism consumption credit services. These measures enhanced tourists’ willingness and ability to consume, thereby mitigating the negative impacts of market fluctuations to some extent, demonstrating the effectiveness of resistance-dominated pathways in maintaining the stability of the tourism economy.
(2)
Recovery-dominated with Restructuring Synergy Path
The “Recovery-dominated with Restructuring Synergy” path refers to the tourism economy facing risks and challenges, with resilience as the core driving force and reconstruction playing a synergistic role, jointly promoting the rapid recovery and resilience enhancement of the tourism economy. This model includes Config. 5 and Config. 9, both of which take resilience as the core condition and reconstruction as the auxiliary condition. A typical example of Config. 5 is Henan Province in 2015. Despite suffering from natural disasters in 2015, the province’s tourism industry quickly regained vitality thanks to efficient disaster response and recovery strategies. Affected areas swiftly advanced scenic area repairs to ensure safe and comfortable tourist experiences. Additionally, Henan Province increased investment in tourism infrastructure to further improve tourism service quality, thereby strengthening the reconstruction capacity of its tourism economy. A typical example of Config. 9 is Ningxia Province in 2021. Facing pandemic risks, the province swiftly adjusted its tourism strategies, implementing measures such as “limited capacity, reservations, and peak-spreading” to effectively stabilize the tourism market order, ensure the continuous operation of the tourism industry chain, and achieve the comprehensive recovery and enhanced resilience of its tourism economy.
(3)
Renewal-Driven Path
The “Renewal-Driven” path refers to a strategy that relies on strong renewal capacity, which enhances adaptability and resilience through continuous innovation, transformation, and upgrading. The paths included in this category are Config. 3 and Config. 7, both of which regard renewal capacity as a core condition. Config. 3 indicates that even in the absence of resistance and restructuring capabilities, high renewal capacity alone can achieve high resilience in the tourism economy. This path is commonly found in regions that prioritize tourism product innovation but have relatively stable industrial structures. A typical example is Shandong Province in 2012, which leveraged the “Hospitality Shandong” brand to deeply explore and promote local characteristics, effectively enhancing the tourism economy’s renewal capacity. In 2021, Henan Province, leveraging its rich cultural heritage, continuously innovated tourism products and services, launching the “night tourism economy” project to enhance the tourism economy’s adaptability and vitality. Config. 7 emphasizes the synergistic effect of high renewal capacity as the core, coupled with high restructuring capacity. A typical example of Config. 7 is Inner Mongolia Autonomous Region in 2018 which actively implemented diversified innovations in tourism products, such as in-depth grassland cultural tours and self-driving tours, to enrich the tourism market supply. Simultaneously, it leveraged the upgrading of tourism infrastructure and the establishment of smart tourism platforms to stabilize the tourism industry chain, thereby ensuring high-quality and efficient tourism services.
(4)
Multi-Resilience Synergy-Driven Path
The “Multi-Resilience Synergy-Driven” path denotes the promotion of steady growth in the tourism economy through the synergistic effect of resistance, rapid recovery, flexible restructuring, and continuous renewal capabilities. The core pathways of this model include Config. 4 and Config. 8. Config. 4 takes resistance, restructuring, and renewal as auxiliary conditions. A typical example is Sichuan Province in 2015, which swiftly activated emergency response measures in the face of natural disasters, such as conducting safety assessments and repairs after the Jiuzhaigou earthquake. Simultaneously, it optimized traditional tourism projects, initiated the development of rural tourism, and advanced smart tourism (e.g., the launch of the “Sichuan Tourism” app), demonstrating the application of renewal capabilities and facilitating the high-resilience development of Sichuan’s tourism economy. Config. 8 regards recovery as the key driving force, with resistance, restructuring, and renewal serving as the supporting system. A typical case of this pathway is Shanxi Province in 2021, which deeply explored the cultural connotations of “Yellow River Culture” and “Taihang Spirit.” Through policies such as issuing government consumption vouchers and extending the reimbursement period for provincial subsidy funds, strong guarantees have been provided for the recovery and resilient growth of the tourism economy. This achieved a virtuous cycle from recovery to restructuring, and then to continuous renewal, comprehensively enhancing the overall resilience.
As reported in Table 6, nine limiting configurations—hereafter “constraint pathways”—are identified for the nine-province Yellow River corridor. Both individual- and overall-solution consistencies exceed 0.80, attesting to the robustness of the results. These pathways can be synthesised into three archetypes.
First, the “Renewal-Constrained” path (Config. 10, Config. 11, Config. 17, Config. 18) refers to tourism economies that face bottlenecks in resilience development due to a lack of renewal capacity. This makes it difficult to introduce new technologies, products, and service models, results in slow recovery from shocks, and constrains long-term resilience development. A typical case of Config. 17 is Inner Mongolia Autonomous Region in 2021, where fluctuations in income levels and an incomplete social security system exacerbated the outflow of tourism talent, leading to a shortage of professional personnel. Additionally, the lag in technological development significantly hindered the construction of a smart tourism system, resulting in insufficient intelligence and convenience in tourism services, a decline in visitor experience quality, and ultimately an adverse effect on the overall resilience. These issues highlight the shortcomings of Inner Mongolia’s tourism industry in human resource allocation and technological innovation application, necessitating improvements through policy guidance and resource investment.
Secondly, the “Restructuring-Lagged” path (Config. 12, Config. 13, Config. 15) refers to the tourism economy’s lack of flexible strategies in response to environmental changes. When faced with market fluctuations, shifts in consumer preferences, and the impact of new technologies, the system reacts slowly, leading to reduced competitiveness and an inability to adapt to future trends, thereby limiting the enhancement of TER. A typical case of Config. 12 is Shanxi Province in 2012, where the restructuring capacity for TER was constrained by a shortage of tourism practitioners—resulting in declining service quality—and limited investment, which hindered the effective development of tourism resources.
Finally, the “Overall Resilience-Deficient” path (Config. 14, Config. 16) refers to a comprehensive lack of all four key capabilities (resistance, recovery, restructuring, and renewal), resulting in a fragile system. Such systems require strengthening in multiple areas, including infrastructure, innovation capacity, and industrial structure, to comprehensively enhance TER. A typical case of Config. 14 can be referenced from Gansu Province in 2015, where the relative lag in infrastructure and the singularity of the industry structure constituted the primary constraints on the diversified development of Gansu. In the face of fluctuations in the market environment and adjustments in policy orientation, these limitations significantly weakened the self-recovery and adaptability of Gansu’s tourism industry.
5. Conclusions and Recommendations

5.1. Conclusions

This study focuses on two core objectives: firstly, examining the spatio-temporal evolution characteristics of TER across nine provinces along the Yellow River from 2012 to 2022; secondly, identifying the configurational pathways that drive or constrain TER. Through systematic analysis employing SDE and fsQCA, both objectives have been fully achieved. The main findings, organized around the core research objectives, are summarized as follows.
First, from 2012 to 2019, the TER showed an overall trend of steady growth, with a slight short-term fluctuation in 2020 due to the pandemic. Regions with high and relatively high levels of TER underwent an evolution: from being mainly concentrated in Shandong Province in 2012, they expanded to Sichuan, Henan, and Shandong by 2018, forming a chain-like high-value agglomeration area. These regions demonstrated significant planar synergistic enhancement effects. The values for both the renewal and restructuring dimensions were generally below 0.24, indicating that these two aspects still hold substantial development potential and room for improvement in boosting the enhancement of TER.
Second, regarding the spatial distribution patterns of TER, the following findings have been identified. During the sample period, the SDE of TER exhibited a distribution pattern along the northeast-southwest axis. The TER center has long been located in Shanxi and Shaanxi provinces in the middle reaches of the Yellow River, demonstrating their key supporting role in boosting regional tourism-economic resilience. The SDE followed a path starting from Linfen City and ultimately returning to and stabilizing in Yan’an City, covering a total distance of 146.81 km. This migration pattern exhibited an initial acceleration followed by a slowdown, with a subsequent acceleration in 2018, reflecting the phased characteristics of internal variability within TER. Relying on the continuous advancement of tourism infrastructure and resource development in recent years, the upper reaches of the Yellow River have seen a relatively rapid lengthening of the resilience major axis, showing significant east–west expansion.
Finally, in terms of the configurational pathways influencing TER: resistance served as a necessary condition for high TER in 2018. In 2021, non-renewal emerged as a necessary condition for non-high TER. The configuration paths influencing the high and non-high TER exhibit “causal asymmetry” and the “equifinality effect.” Four driving pathways were identified: resistance-dominated, recovery-dominated with restructuring synergy, renewal-driven, and multi-resilience synergy-driven. Three constraint pathways were also delineated: renewal-constrained, restructuring-lagged, and overall resilience-deficient. The nine provinces should implement a combination of strategies to enhance the resilience of their tourism economies based on their specific conditions.

5.2. Policy Recommendations

First, consolidating and extending the advantages of the contiguous high-value corridor. Provinces within the corridor should formulate and implement targeted policies and institutional arrangements to sustain their current lead in TER. Sichuan Province is advised to upgrade disaster-mitigation facilities in areas prone to earthquakes and landslides, while leveraging Giant-Panda culture and the Ancient Shu civilization to strengthen its tourism branding. Henan Province can capitalise on its historical and cultural assets to deepen the integration of culture and tourism, thereby enhancing endogenous drivers. Shandong Province should capitalise on its coastal resources to develop marine tourism and cultivate leading cultural-tourism enterprises, with a particular focus on reinforcing renewal capacity.
Second, pooling resources to cultivate an ecosystem that enhances tourism resilience. Resistance-dominated pathways demonstrate that robust tourism assets and local economies bolster tourism’s capacity to withstand external shocks. Henan and Shaanxi should continue enriching tourism resources while further developing the tertiary sector. Recovery-dominated, restructuring-synergistic pathways indicate that provinces with sound tourism infrastructure exhibit higher levels of tourism resilience. Consequently, Ningxia must prioritize improving per capita park green space and green coverage rates. Renewal-driven pathways indicate that tourism innovation and industrial upgrading can enhance resilience through sustained innovation. Shandong should actively increase tourism employment and fixed-asset investment in tourism. Multi-resilience, synergy-driven provinces such as Sichuan require comprehensive measures to achieve coordinated tourism development.
Finally, consolidate the foundations of tourism resilience. The renewal-constrained pathway indicates that insufficient renewal capacity constrains TER enhancement. Inner Mongolia should increase the number of tourism schools and promote technological transformation within the tourism industry. The restructuring-lagged pathway demonstrates that reconstruction capacity is a key constraint affecting TER development. Shanxi Province should prioritize addressing how the scale of tourism employment and the level of tourism fixed-asset investment constrain TER. The overall resilience-deficient pathway underscores the core value of consolidating resilience foundations. Gansu Province must prioritize the coordinated development of the provincial tourism system.

5.3. Discussion

Against the backdrop of the YRB being designated a national strategic zone for ecological conservation and high-quality development, and as the tourism sector transitions from quantitative expansion to qualitative upgrading, this study dissects the spatio-temporal evolution and configurational pathways of its TER. The findings yield three principal contributions.
First, a four-dimensional indicator system—encompassing resistance, recovery, restructuring, and renewal—was developed to evaluate the level of TER. By analysing its spatio-temporal patterns across the nine provinces, the study offers a novel analytical lens for research on regional tourism disparities. Compared with extant studies that focus solely on the spatial configurations of provincial TER under the shocks of 2003 and 2020, the present research adopts a longer temporal window and a narrower spatial focus. This design captures the dynamic evolution of resilience more comprehensively, elucidates long-term trends and phased characteristics, and avoids the partiality induced by short-term fluctuations. Moreover, the previous literature on the YRB has predominantly addressed tourism high-quality development and green transitions, leaving TER largely unexamined [1,27,28,45,46].
Second, the SDE model is employed to delineate the centroid trajectory of TER, thereby revealing pronounced spatial heterogeneity and dynamic change. fsQCA further identifies four driving pathways and three constraining pathways, addressing the critique that extant research overemphasises single-factor influences such as the digital economy or innovation capacity [8]. Existing studies on TER typically resort to traditional spatial diagnostic methods such as Moran’s I, which merely generate static clustering snapshots at discrete time points and only delineate the spatial differentiation between high-value and low-value clusters [47]. By integrating the SDE with fsQCA, this study can accurately capture the continuous evolutionary characteristics of both the directional distribution and spatial morphology of TER, and further clarify the underlying mechanisms driving the emergence of such patterns. The nine provinces should therefore identify context-specific trajectories for enhancing resilience, selecting appropriate pathways grounded in their current levels of resistance, recovery, restructuring, and renewal.
Finally, the study provides a scientific basis for governmental agencies and tourism managers within the nine-province corridor to formulate forward-looking plans, upgrade the tourism sector, and enhance the economy’s capacity to withstand shocks. It also offers a transferable framework for improving TER in other regions.

5.4. Limitations and Future Research

First, owing to the limited availability of city- and county-level data, this study is confined to the nine-province along the Yellow River; disaggregation to finer spatial units is therefore required to uncover micro-level characteristics and evolutionary nuances of TER. Concurrently, given the limitations of robustness tests on small samples, future work should expand sample sizes while enhancing data frequency and consistency. This will provide more targeted policy guidance and theoretical underpinnings for coordinated regional development. Second, future indicator systems should incorporate variables more proximate to resilience—such as the frequency of natural disasters, tourism safety incidents, transport accessibility, and tourist expenditure—and integrate indicators that better capture the geographical particularities of the YRB. Third, beyond resistance, recovery, restructuring, and renewal, additional factors such as industrial agglomeration and tourism development level have been identified as potentially influential [23]; a more multidimensional perspective is thus warranted to examine their effects on TER within the nine-province corridor. Fourthly, this study employs only descriptive results of the standard deviation ellipse’s azimuth to demonstrate directional variation, without testing its statistical significance. Subsequent work may introduce Monte Carlo testing to examine the p-value of angular trends, thereby further confirming whether this directional change stems from random fluctuations.

Author Contributions

Conceptualization, T.L. and Q.Z.; methodology, T.L.; software, T.L.; validation, Q.Z.; formal analysis, T.L.; investigation, T.L.; resources, T.L.; data curation, T.L.; writing—original draft preparation, T.L.; writing—review and editing, T.L.; visualization, Q.Z.; supervision, Q.Z.; project administration, Q.Z.; funding acquisition, Q.Z. All authors have read and agreed to the published version of the manuscript.

Funding

This research was supported by (1) The Major Project of the Shanxi Provincial Philosophy and Social Science Planning (Grant No. 2024ZD023); (2) The General Project of the Shanxi Provincial Philosophy and Social Science Planning (Grant No. 2024YB096); (3) The Major Special Project for “Forging the Sense of Community for the Chinese Nation,” funded by the Shanxi Academy of Social Sciences (Grant No. ZLKTZD25008).

Institutional Review Board Statement

Not applicable.

Informed Consent Statement

Not applicable.

Data Availability Statement

The original contributions presented in this study are included in the article. Further inquiries can be directed to the corresponding author.

Conflicts of Interest

The authors declare no conflicts of interest.

Abbreviations

The following abbreviations are used in this manuscript:
CNYChinese Yuan
Config.Configuration
fsQCAFuzzy-set Qualitative Comparative Analysis
SDEStandard Deviational Ellipse
TERTourism Economic Resilience
YRBYellow River Basin

Appendix A

Table A1. Truth Table of Conditional Configurations for High Tourism Economic Resilience in 2012.
Fuzzy-Set ResilienceFuzzy-Set RecoveryFuzzy-Set RestructuringFuzzy-Set RenewalNumberFuzzy-Set TERRaw Consist.PRI Consist.
10111111
11113111
1110110.930.25
0100110.760
0000300.330
Table A2. Truth Table of Conditional Configurations for Non-High Tourism Economic Resilience in 2012.
Fuzzy-Set ResilienceFuzzy-Set RecoveryFuzzy-Set RestructuringFuzzy-Set RenewalNumber~Fuzzy-Set TERRaw Consist.PRI Consist.
00003111
01001111
1110110.970.62
1011110.690
1111300.380
Note: “~” denotes “absence”.

References

  1. Zhang, S.; Zhang, G.; Ju, H. The Spatial Pattern and Influencing Factors of Tourism Development in the Yellow River Basin of China. PLoS ONE 2020, 15, e0242029. [Google Scholar] [CrossRef]
  2. Sofronov, B. The Development of the Travel and Tourism Industry in the World. Ann. Spiru Haret Univ. Econ. Ser. 2018, 18, 123–137. [Google Scholar] [CrossRef]
  3. Chang, B.; Ding, X.; Xi, J.; Zhang, R.; Lv, X. Spatial-temporal Distribution Pattern and Tourism Utilization Potential of Intangible Cultural Heritage Resources in the Yellow River Basin. Sustainability 2023, 15, 2611. [Google Scholar] [CrossRef]
  4. Hao, M.; Li, G.; Chen, C.; Liang, L. A Coupling Relationship Between New-Type Urbanization and Tourism Resource Conversion Efficiency: A Case Study of the Yellow River Basin in China. Sustainability 2022, 14, 14007. [Google Scholar] [CrossRef]
  5. Holling, C.S. Resilience and Stability of Ecological Systems. Annu. Rev. Ecol. Syst. 1973, 4, 1–23. [Google Scholar] [CrossRef]
  6. Folke, C. Resilience: The Emergence of a Perspective for Social–Ecological Systems Analyses. Glob. Environ. Change 2006, 16, 253–267. [Google Scholar] [CrossRef]
  7. Walker, B.; Holling, C.S.; Carpenter, S.R.; Kinzig, A. Resilience, Adaptability and Transformability in Social–Ecological Systems. Ecol. Soc. 2004, 9, 5. [Google Scholar] [CrossRef]
  8. Zhang, Z.; Wu, Y. Spatiotemporal Evolution and Influencing Factors of Urban Ecological Resilience: Evidence from the Yellow River Basin, China. Sustainability 2025, 17, 7114. [Google Scholar] [CrossRef]
  9. Khater, M.; Faik, M. Tourism as a Catalyst for Resilience: Strategies for Building Sustainable and Adaptive Communities. Community Dev. 2025, 56, 175–191. [Google Scholar] [CrossRef]
  10. Cochrane, J. The Sphere of Tourism Resilience. Tour. Recreat. Res. 2010, 35, 173–185. [Google Scholar] [CrossRef]
  11. Butler, R.W. The Concept of a Tourist Area Cycle of Evolution: Implications for Management of Resources. Can. Geogr. 1980, 24, 5–12. [Google Scholar] [CrossRef]
  12. Chang, G.; Kai, W. Research on Coupling Coordination of Tourism Development and Economic Resilience in Hunan Province. Geogr. Geogr. Inf. Sci. 2022, 38, 137–144. [Google Scholar]
  13. Wang, S.; Niu, J. Co-evolution of Tourism Economy and Urban Ecological Resilience in Shandong Province. Acta Geogr. Sin. 2023, 78, 2591–2608. [Google Scholar]
  14. Wei, M.; Wei, H.X.; Huang, H. Tourism Economic Resilience and High-Quality Development in the Context of the Pandemic. Tour. Trib. 2022, 37, 5–7. [Google Scholar]
  15. Lee, Y.J.A.; Kim, J.; Jang, S.; Ash, K.; Yang, E. Tourism and Economic Resilience. Ann. Tour. Res. 2021, 87. [Google Scholar] [CrossRef]
  16. Schwaiger, K.; Zehrer, A.; Braun, B. Organizational Resilience in Hospitality Family Businesses During the COVID-19 Pandemic: A Qualitative Approach. Tour. Rev. 2022, 77, 163–176. [Google Scholar] [CrossRef]
  17. Eluwole, K.K.; Lasisi, T.T.; Parvez, M.O.; Cobanoglu, C. Application of Fuzzy-Set Qualitative Comparative Analysis (fsQCA) in Hospitality and Tourism Research: A Bibliometric Study. J. Hosp. Tour. Insights 2024, 7, 3032–3054. [Google Scholar] [CrossRef]
  18. Fang, Y.; Wang, Q.; Huang, Z.; Wu, Y. Spatial and Temporal Evolution of Tourism Economic Resilience and Mechanism of Impact in China. Prog. Geogr. 2023, 42, 417–427. [Google Scholar] [CrossRef]
  19. Yelin, F.A.N.G.; Yanni, W.U.; Zhenfang, H.; Qiuyue, W. Evolution of Inbound Tourism Industry and Its Resilience in Chinese Mainland. Econ. Geogr. 2023, 43, 188–196. [Google Scholar]
  20. Ragin, C.C. Redesigning Social Inquiry: Fuzzy Sets and Beyond; University of Chicago Press: Chicago, IL, USA, 2008. [Google Scholar]
  21. Durán-Román, J.L.; Vena-Oya, J.; Núñez-Tabales, J.M.; Rey-Carmona, F.J. How to Achieve Economic Development Through Tourism? Different Ways for Different Economies: A New Approach Through Fuzzy Set Qualitative Comparative Analysis. Tour. Econ. 2025, 31, 104–123. [Google Scholar] [CrossRef]
  22. Wang, X.; Guo, L. Spatiotemporal Characteristics and Configuration Mechanism of China’s Inbound Tourism Economic Resilience at the Provincial Level. Econ. Geogr. 2023, 43, 219–228. [Google Scholar]
  23. Wang, L.; Li, J.; Lv, L. Urban Resilience and Its Links to City Size: Evidence from the Yangtze River Economic Belt in China. Land 2023, 12, 2131. [Google Scholar] [CrossRef]
  24. Li, L.; Zhang, P.; Wang, C. What Affects the Economic Resilience of China’s Yellow River Basin Amid Economic Crisis—Spatial Heterogeneity Perspective. Int. J. Environ. Res. Public Health 2022, 19, 9024. [Google Scholar] [CrossRef]
  25. Yanchao, S.; Zuosi, T.; Qian, L.; Lingling, X. Can the Digital Economy Promote the Resilience of the Tourism Economy in the Yellow River Basin? Arid Land Geogr. 2023, 46, 1704–1713. [Google Scholar]
  26. He, X.; Cai, C.; Tang, J.; Shi, J.; Yang, R. Analysis of Coupling Coordination and Obstacle Factors Between Tourism Development and Ecosystem Services Value: A Case Study of the Yellow River Basin, China. Ecol. Indic. 2023, 157, 111234. [Google Scholar] [CrossRef]
  27. Li, D.; Zhang, X.; Lu, L.; Zhang, X.; Li, L. Spatial Distribution Characteristics and Influencing Factors of High-Level Tourist Attractions in the Yellow River Basin. Econ. Geogr. 2020, 40, 70–80. [Google Scholar]
  28. Li, S.; Cheng, Z.; Tong, Y.; He, B. The Interaction Mechanism of Tourism Carbon Emission Efficiency and Tourism Economy High-Quality Development in the Yellow River Basin. Energies 2022, 15, 6975. [Google Scholar] [CrossRef]
  29. Zhang, Y.; Du, R.; Gao, Y. Geographical Characteristics of Tourism Flow Network Structure in the Yellow River Basin: A Case Study along the Huang-Gansu-Su Section. Arab. J. Geosci. 2021, 14, 2254. [Google Scholar] [CrossRef]
  30. Watson, P.; Deller, S. Tourism and Economic Resilience. Tour. Econ. 2022, 28, 1193–1215. [Google Scholar] [CrossRef]
  31. Gocer, O.; Boyacioglu, D.; Karahan, E.E.; Shrestha, P. Cultural Tourism and Rural Community Resilience: A Framework and Its Application. J. Rural Stud. 2024, 107, 103238. [Google Scholar] [CrossRef]
  32. Yu, J. Modeling Between Water Resources Security and Regional Economic Growth in the Yellow River Basin Based on Entropy Weight Method—A Case Study for Future Smart City. J. Test. Eval. 2023, 51, 1661–1673. [Google Scholar] [CrossRef]
  33. Cheng, Y.; Chen, Y. Spatial and Temporal Characteristics of Land Use Changes in the Yellow River Basin from 1990 to 2021 and Future Predictions. Land 2024, 13, 1510. [Google Scholar] [CrossRef]
  34. Feng, Y.; Wei, H.; Huang, Y.; Li, J.; Mu, Z.; Kong, D. Spatiotemporal Evolution Characteristics and Influencing Factors of Traditional Villages: The Yellow River Basin in Henan Province, China. Herit. Sci. 2023, 11, 97. [Google Scholar] [CrossRef]
  35. Lu, D.; Zhang, X.; Yang, D.; Zhang, S. What Affects Agricultural Green Total Factor Productivity in China? A Configurational Perspective Based on Dynamic Fuzzy-Set Qualitative Comparative Analysis. Agriculture 2025, 15, 136. [Google Scholar] [CrossRef]
  36. Huang, S.; Chang, J.; Leng, G.; Huang, Q. Integrated Index for Drought Assessment Based on Variable Fuzzy Set Theory: A Case Study in the Yellow River Basin, China. J. Hydrol. 2015, 527, 608–618. [Google Scholar] [CrossRef]
  37. Jiang, T.; Cui, J.; Jia, H.; Jin, B. Comparison of Green and Low-carbon Development Path Between Yellow River Basin and Yangtze River Economic Belt—Configuration Analysis Based on “Two Mountains Theory”. Front. Environ. Sci. 2025, 13, 1644348. [Google Scholar]
  38. Kumar, S.; Sahoo, S.; Ali, F.; Cobanoglu, C. Rise of fsQCA in Tourism and Hospitality Research: A Systematic Literature Review. Int. J. Contemp. Hosp. Manag. 2024, 36, 2165–2193. [Google Scholar] [CrossRef]
  39. Cellini, R.; Cuccia, T. The Economic Resilience of Tourism Industry in Italy: What the ‘Great Recession’ Data Show. Tour. Manag. Perspect. 2015, 16, 346–356. [Google Scholar] [CrossRef]
  40. Joseph, C.A.; Kavoori, A.P. Mediated Resistance: Tourism and the Host Community. Ann. Tour. Res. 2001, 28, 998–1009. [Google Scholar] [CrossRef]
  41. Fernández, J.A.S.; Martínez, J.M.G.; Martín, J.M.M. An Analysis of the Competitiveness of the Tourism Industry in a Context of Economic Recovery Following the COVID-19 Pandemic. Technol. Forecast. Soc. Change 2022, 174, 121301. [Google Scholar] [CrossRef] [PubMed]
  42. Yrigoy, I. Strengthening the Political Economy of Tourism: Profits, Rents and Finance. Tour. Geogr. 2023, 25, 405–424. [Google Scholar] [CrossRef]
  43. Hernández-Martín, R.; Álvarez-Albelo, C.D.; Padrón-Fumero, N. The Economics and Implications of Moratoria on Tourism Accommodation Development as a Rejuvenation Tool in Mature Tourism Destinations. J. Sustain. Tour. 2015, 23, 881–899. [Google Scholar] [CrossRef]
  44. Guangping, X.; Jinshan, Z.; Yunzhou, D. The Impact of Environmental and Organizational Configuration on Corporate Entrepreneurship: A Fuzzy-Set Qualitative Comparative Analysis. Foreign Econ. Manag. 2020, 42, 3–16. [Google Scholar]
  45. Zhang, X.; Zhou, C.; Li, Y.; Zhou, L.; Ren, M.; Zhao, Y. Temporal-Spatial Characteristics and Dynamic Decoupling Process of Tourism Economic Development and Eco-Environmental Pressure in Provinces of the Yellow River Basin. J. Desert Res. 2022, 42, 241–250. [Google Scholar]
  46. Lu, X.; Qu, Y.; Sun, P.; Yu, W.; Peng, W. Green Transition of Cultivated Land Use in the Yellow River Basin: A Perspective of Green Utilization Efficiency Evaluation. Land 2020, 9, 475. [Google Scholar] [CrossRef]
  47. Sun, Y.; Lin, W.; Sun, M.; Chen, P. The Spatiotemporal Evolution and Driving Forces of Tourism Economic Resilience in Chinese Provinces. Sustainability 2024, 16, 8091. [Google Scholar] [CrossRef]
Figure 1. The Overall Evolution of TER.
Sustainability 17 09111 g001
Figure 2. The Spatiotemporal Evolution Process of TER.
Sustainability 17 09111 g002
Figure 3. The Evolutionary Trends of TER Focus.
Sustainability 17 09111 g003
Table 1. Indicator System of TER.
Evaluation
Objective
First-Level
Indicator
Second-Level IndicatorThird-Level IndicatorCommon UnitWeight
Tourism Economic ResilienceResistanceTourism Resource AbundanceTotal Number of A-Level Tourist AttractionsNumber0.0798
Tourism Economic DevelopmentTotal Tourism Revenue108 CNY0.0854
Total Tourist Arrivals104 persons0.0856
Per Capita Tourism ExpenditureCNY0.0648
Local Economic BasePer Capita GDP104 CNY0.0388
Share of Tertiary Industry in GDP%0.0297
RecoveryPollution-Control CapacityCentralized Sewage Treatment Rate%0.0244
Rate of harmless treatment of domestic waste%0.0102
Ecological EnvironmentPer Capita Park Green Spacem20.058
Green Coverage Rate%0.0297
Tourism InfrastructureQuantity of Travel AgenciesNumber0.0689
Quantity of Star-Rated HotelsNumber0.0592
RestructuringTourism WorkforceNumber of Employees in Tourism SectorPersons0.0884
Tourism InvestmentFixed-Asset Investment in Tourism108 CNY0.0730
RenewalTourism Talent PoolNumber of Tourism SchoolsNumber0.0786
Technological LevelNumber of Granted PatentsPieces0.1254
Table 2. Center of Gravity Coordinates and Migration Distance for SDE Models.
YearLongitude (°E)Latitude (°N)Migration DirectionMigration Distance (km)
2012111°1′10″36°3′28″
2015110°39′21″36°5′49″Northwest40.97
2018110°26′41″36°2′07″Southwest24.83
2021109°43′22″36°5′46″Southwest81.01
Table 3. Eigenvalues of the SDE Model of TER.
YearMajor Semi-Axis (km)Minor Semi-Axis (km)Perimeter (km)Area (104 km2)Azimuth (°)
20121049.01633.275635208.6865.15
20151062.22643.685440214.7866.29
20181063.40662.395495221.2867.23
20211108.70655.345633228.2469.26
Table 4. Results of the Analysis of Necessary Conditions.
VariableHigh Tourism Economic ResilienceNot-High Tourism Economic Resilience
20122015201820212012201520182021
ConsistencyCoverageConsistencyCoverageConsistencyCoverageConsistencyCoverageConsistencyCoverageConsistencyCoverageConsistencyCoverageConsistencyCoverage
Resistance0.890.910.880.950.950.930.810.810.350.390.330.370.320.350.390.40
~Resistance0.340.300.410.380.360.330.320.320.820.990.860.890.840.930.820.91
Recovery0.870.840.820.890.790.870.860.780.450.520.470.530.440.520.490.50
~Recovery0.510.440.570.510.570.480.450.440.870.890.800.840.890.820.790.86
Restructuring0.860.890.840.920.840.920.840.880.410.450.470.470.420.440.500.53
~Restructuring0.410.370.450.450.430.410.500.470.800.960.820.940.830.950.870.94
Renewal0.881.000.880.940.890.910.820.910.240.320.430.420.410.400.870.94
~Renewal0.400.310.390.400.350.350.460.420.780.910.840.980.810.990.920.93
Note: “~” denotes “absence”.
Table 5. Results of the Group State Analysis of High TER.
2012201520182021
ConfigurationConfig. 1Config. 2Config. 3Config. 4Config. 5Config. 6Config. 7Config. 8Config. 9
Resistance
Recovery
Restructuring
Renewal
Consistency0.9710.7210.4210.340.380.82
Raw Coverage0.860.840.310.830.360.290.870.20.7
Unique Coverage0.030.090.010.560.090.040.620.060.04
Overall Solution Consistency0.860.860.920.84
Overall Solution Coverage0.950.910.910.77
Note: ● denotes the presence of core conditions; ▲ denotes the presence of auxiliary conditions; △ denotes the absence of auxiliary conditions. A blank cell signifies that the condition may be either present or absent.
Table 6. Results of Group State Analysis of Economic Resilience of Non-High Tourism.
2012201520182021
ConfigurationConfig. 10Config. 11Config. 12Config. 13Config. 14Config. 15Config. 16Config. 17Config. 18
Resistance
Recovery
Restructuring
Renewal
Consistency10.970.890.8910.8810.880.82
Raw Coverage0.850.340.230.320.820.310.790.190.67
Unique Coverage0.600.050.010.050.550.560.070.060.04
Overall Solution Consistency0.890.870.860.81
Overall Solution Coverage0.940.640.650.64
Note: denotes the absence of core conditions; ▲ denotes the presence of auxiliary conditions; △ denotes the absence of auxiliary conditions. A blank cell signifies that the condition may be either present or absent.
Disclaimer/Publisher’s Note: The statements, opinions and data contained in all publications are solely those of the individual author(s) and contributor(s) and not of MDPI and/or the editor(s). MDPI and/or the editor(s) disclaim responsibility for any injury to people or property resulting from any ideas, methods, instructions or products referred to in the content.