Article

Multi-Objective Optimization of Window Design for Energy and Thermal Comfort in School Buildings: A Sustainable Approach for Hot-Humid Climates

1
Department of Architecture, Faculty of Built Environment, Universiti Malaya, Kuala Lumpur 50603, Malaysia
2
Centre for Building, Construction & Tropical Architecture, Faculty of Built Environment, Universiti Malaya, Kuala Lumpur 50603, Malaysia
*
Authors to whom correspondence should be addressed.
Sustainability 2025, 17(19), 8646; https://doi.org/10.3390/su17198646
Submission received: 21 August 2025 / Revised: 4 September 2025 / Accepted: 22 September 2025 / Published: 26 September 2025
(This article belongs to the Special Issue Sustainable Development of Construction Engineering—2nd Edition)

Abstract

School buildings in hot-humid climates encounter considerable difficulties in balancing energy use and thermal comfort due to this environment, necessitating optimized design strategies to reduce energy consumption while enhancing occupant comfort. This study presents sustainable design strategies for educational structures in hot-humid regions, aiming to optimize energy efficiency and thermal comfort for environmental preservation and occupant welfare. The present work introduces a multi-objective optimization framework for window design in school buildings situated in hot-humid climates, targeting a balance between Energy Use Intensity (EUI) and Thermal Comfort Time Ratio (TCTR). Exploring multi-objective optimization through NSGA-II genetic algorithms, the study conducts Sobol sensitivity analysis for parameter assessment and applies Gaussian Process Regression (GPR) for effective model validation, identifying optimal window configurations that reduce energy consumption while enhancing thermal comfort. It finds that the Window-to-Wall Ratio (WWR) and Solar Heat Gain Coefficient (SHGC) are the most significant factors, with WWR and SHGC accounting for 28.1% and 23.7% of the variance in EUI and TCTR, respectively. The results reveal a non-linear trade-off between the objectives, with the Balanced Solution offering a practical compromise: a 6.7% decrease in energy use and a 14.3% enhancement in thermal comfort. The study examined various ranges of window parameters, including WWR (0.1–0.50), SC (0.20–0.80), K (1.0–2.5 W·m−2·K−1), SHGC (0.1–0.4), Shading width (0.3–2.0 m), and Shading angle (0°–90°). The recommended compromise, known as the Balanced Solution, suggests optimal values as follows: WWR = 0.40, SC = 0.30, SHGC = 0.40, K = 1.2 W·m−2·K−1, Shading width = 1.22 m, and Shading angle = 28°. The GPR model exhibited high predictive precision, with R2 values of 0.91 for EUI and 0.95 for TCTR, underscoring the framework’s effectiveness. This research offers actionable insights for designing energy-efficient and comfortable school buildings in hot-humid climates, enriching sustainable architectural design knowledge.

1. Introduction

1.1. Background and Significance

The construction industry is a substantial contributor to global climate change and energy consumption, representing around 40% of worldwide energy usage and 36% of C O 2   emissions [1]. In China, this challenge is particularly acute, with buildings responsible for nearly 50% of national carbon emissions, a figure projected to peak at 5139 million tons of C O 2 by 2030, representing a 4.4% increase from 2020 levels [2].
Educational facilities represent a significant portion of energy consumption. In China, primary and secondary schools occupy over 840 million square meters, while higher education institutions encompass an additional 929 million square meters [3]. The Guangzhou metropolitan area alone hosts more than 3200 educational facilities, including 16 international schools, serving a population of over 2 million students [4]. In China, around 2% of newly constructed educational facilities have been awarded green building certifications [5], predominantly adhering to local standards, notably the Green Building Evaluation Standard (GB/T 50378-2019) [6]. This standard assesses buildings based on various criteria, including safety, durability, health, comfort, resource conservation, and environmental quality, categorized into levels from basic to three-star. Moreover, the Code for Design of Energy Efficiency in Buildings (GB 50189-2015) [7] sets out precise requirements for energy efficiency and comfort in school buildings. While local certifications significantly influence governmental policies and urban development, prestigious schools and international campuses may opt for global green certifications like Leadership in Energy and Environmental Design (LEED v5) [8] or Building Research Establishment Environmental Assessment Method (BREEAM v6.0.0) [9] to bolster international acclaim for their projects. Nevertheless, national standards predominantly govern green certifications for educational buildings in China, with international accreditations serving as supplementary measures.
School buildings in hot-humid climates, such as those in southern China, face unique energy management and thermal comfort challenges. Highly variable energy demands, influenced by factors like class schedules, seasonal breaks, and diverse space utilization, necessitate critical energy optimization considerations. For instance, Tianjin school buildings exhibit the lowest public building energy consumption at 24.53 kWh/(m2·a), yet further optimization is possible through enhanced design strategies [10].
Hot-humid climates are characterized by high temperatures, often exceeding 35 °C (95 °F) [11] during part of the year, and high humidity levels, in this case 80% [12]. These conditions not only cause discomfort to individuals but also elevate cooling requirements. Higher humidity levels reduce the efficiency of natural ventilation and passive cooling methods, which are widely used in traditional buildings [13]. Seasonal fluctuations are characterized by intense solar radiation in summer and moderate temperatures in winter, significantly elevating the need for cooling [14]. These conditions also promote condensation and mold growth that impacts Indoor Air Quality (IAQ), which results in longer system running time and increased energy use [15].
Traditional school buildings in regions such as Guangzhou often exhibit characteristics like expansive open areas, corridor-centric layouts, and simplistic building envelopes lacking adequate thermal insulation and ventilation [16]. While these design elements may suffice in temperate climates, they prove insufficient in managing the extreme heat and humidity prevalent in hot-humid regions. Consequently, educational institutions in such areas heavily depend on air conditioning systems to ensure thermal comfort, leading to significant energy usage [17]. The utilization of low-efficiency materials and limited shading in older structures exacerbates solar heat gain, thereby increasing the demand for cooling [18]. Conventional design elements substantially elevate building energy consumption, resulting in higher economic costs and environmental impacts [19]. Therefore, it is imperative to adopt climate-responsive design strategies, including improved insulation, shading systems, and efficient air conditioning, to enhance the energy efficiency of school buildings in hot and humid climates.
The present study proposes a multi-objective optimization approach to design windows for school buildings situated in hot-humid climates. The framework integrates evolutionary algorithms and rule-based decisions to optimize energy consumption and occupant comfort. The aim is to identify the optimal window design configurations that minimize energy use and enhance thermal comfort satisfaction among occupants.

1.2. Literature Review and Research Gap

Designing high-performance, thermally comfortable, and energy-efficient school buildings in hot and humid climates is a highly challenging task. Although significant progress has been made in enhancing building performance, attention has not been sufficiently focused on multi-objective optimization (Figure 1), particularly for educational buildings in these climates. These studies often neglect the simultaneous consideration of key design variables, such as window-to-wall ratio (WWR) and shading coefficient (SC), which are crucial for minimizing energy consumption and improving occupant health [20]. While individual design aspects have been thoroughly investigated, a complete integration of window configuration, shading, and building orientation remains absent in the literature [21].
Akopov et al. (2019) explored the interaction between air pollution and urban green spaces in Yerevan, Armenia, providing valuable environmental insights into the effect of greenery on air quality [22]. However, these studies did not address multi-performance optimization for energy-efficient building design, such as the integration of window configurations and shading devices, which are crucial for optimizing both outdoor comfort and energy use in educational buildings. Similarly, Akopov et al. (2024) introduced a parallel bi-objective hybrid real-coded genetic algorithm for solving multi-objective problems [23]. While this approach significantly improves optimization efficiency, it has not been applied to building design, particularly the trade-off between thermal comfort and energy efficiency, which is essential for school buildings.
Hwang et al. investigated the utilization of Phase Change Materials (PCMs) on school rooftops in Taiwan, demonstrating a decrease in indoor temperatures. Their study, however, was limited to roofs and did not consider the integration of PCMs with window designs, which are vital for comprehensive building performance [24]. Similarly, Mba et al. [25] assessed the effect of building orientation on natural ventilation in Nigerian schools, resulting in significant improvements in ventilation efficiency. Nonetheless, their research overlooked the incorporation of mechanical cooling systems, crucial for hot-humid climates [26]. These omissions underscore the imperative for integrated strategies that combine both passive and active cooling techniques.
Yi et al. [27] examined cooling strategies for classrooms in Guangzhou and reported a 16.6% reduction in energy consumption. Notably, their study did not employ optimization algorithms, such as evolutionary methods, which are capable of systematically exploring the design space. This highlights the necessity of employing multi-objective optimization in designing window configurations to achieve a balance between energy efficiency and thermal comfort. Similarly, Sorooshnia et al. [28] presented a kinetic shading system for residential buildings; however, they failed to take into account specific occupancy profiles particular to educational buildings.
The thermal comfort of occupants in educational facilities has been thoroughly investigated. A study by Lala et al. found that 95.1% of primary school students in India expressed satisfaction with thermal conditions, even in high heat-risk environments [29]. However, this study did not propose specific interventions to optimize comfort, highlighting the need for targeted design strategies in educational buildings. In contrast, Liu et al. developed an optimization for the window-to-wall ratio (WWR) in residential buildings in China’s hot-summer and cold-winter climate, suggesting an optimal range of 20–30% to minimize energy consumption [30]. However, this investigation did not incorporate other critical window parameters, such as shading geometry and glazing properties, which are essential considerations for school buildings.
The utilization of multi-objective optimization in designing school buildings in hot-humid climates is a topic that has not been extensively investigated. Although evolutionary algorithms, such as the Non-dominated Sorting Genetic Algorithm II (NSGA-II), have demonstrated success in optimizing competing objectives across various building types, their application in the context of window design for schools has not been extensively explored. Prior research has integrated occupant behavior into multi-objective optimization, demonstrating the ability to lower energy usage while upholding thermal comfort standards [31]. However, these methods have not yet been applied to school buildings, which present distinct occupancy patterns.
Li et al. optimized Heating, Ventilation, and Air Conditioning (HVAC) systems in commercial constructions, but neglected to consider passive design elements such as window configurations, which are crucial for school buildings with substantial cooling requirements [32]. Song et al. compared radiant cooling systems with conventional systems, demonstrating that personalized cooling could reduce energy consumption while maintaining comfort [33]. However, this approach did not address the practical implementation in educational buildings, which face budgetary constraints.
Although substantial progress has been made in building design optimization, research has predominantly focused on individual parameters, often overlooking their interdependencies. Furthermore, a majority of studies emphasize residential or office buildings, failing to account for the distinct operational requirements of educational facilities. The current study seeks to address these gaps by creating a multi-objective optimization model specifically for window design in school buildings situated in hot-humid regions.

1.3. Research Objectives and Significance

Optimizing window design in school buildings in hot-humid climates remains a significant challenge, despite advancements in building energy optimization and thermal comfort research. Previous studies have primarily examined individual parameters like the window-to-wall ratio (WWR), overlooking the intricate interactions with factors such as shading, glazing, and thermal mass [34,35]. Furthermore, most optimization efforts have been directed towards residential or office buildings, neglecting the unique operational patterns and comfort requirements of educational facilities [36,37]. These gaps underscore the need for comprehensive, multi-objective optimization strategies to tackle the design of school buildings in hot-humid climates.
The research seeks to establish a comprehensive multi-objective optimization framework specifically tailored for window design in school buildings in hot-humid climates. The primary objectives are as follows:
  • To develop an integrated parametric modeling and optimization workflow by combining Rhino/Grasshopper with the NSGA-II algorithm to optimize window configurations for school buildings.
  • To identify optimal window configurations that balance energy efficiency and thermal comfort, especially for schools in Guangzhou’s hot-humid climate, while considering crucial factors such as shading, glazing, and WWR.
  • To analyze the trade-offs between energy efficiency and thermal comfort and provide actionable design insights for architects and engineers.
  • To validate the optimization framework through a case study of a representative school building in Guangzhou, China, thereby demonstrating the framework’s real-world applicability.
This study optimizes school building design for hot-humid climates, offering valuable guidance to architects and engineers seeking to balance energy efficiency and thermal comfort. By focusing on the most influential window design parameters, the research provides Pareto-optimal solutions that yield the best trade-offs between energy use and occupant comfort.

2. Methodology

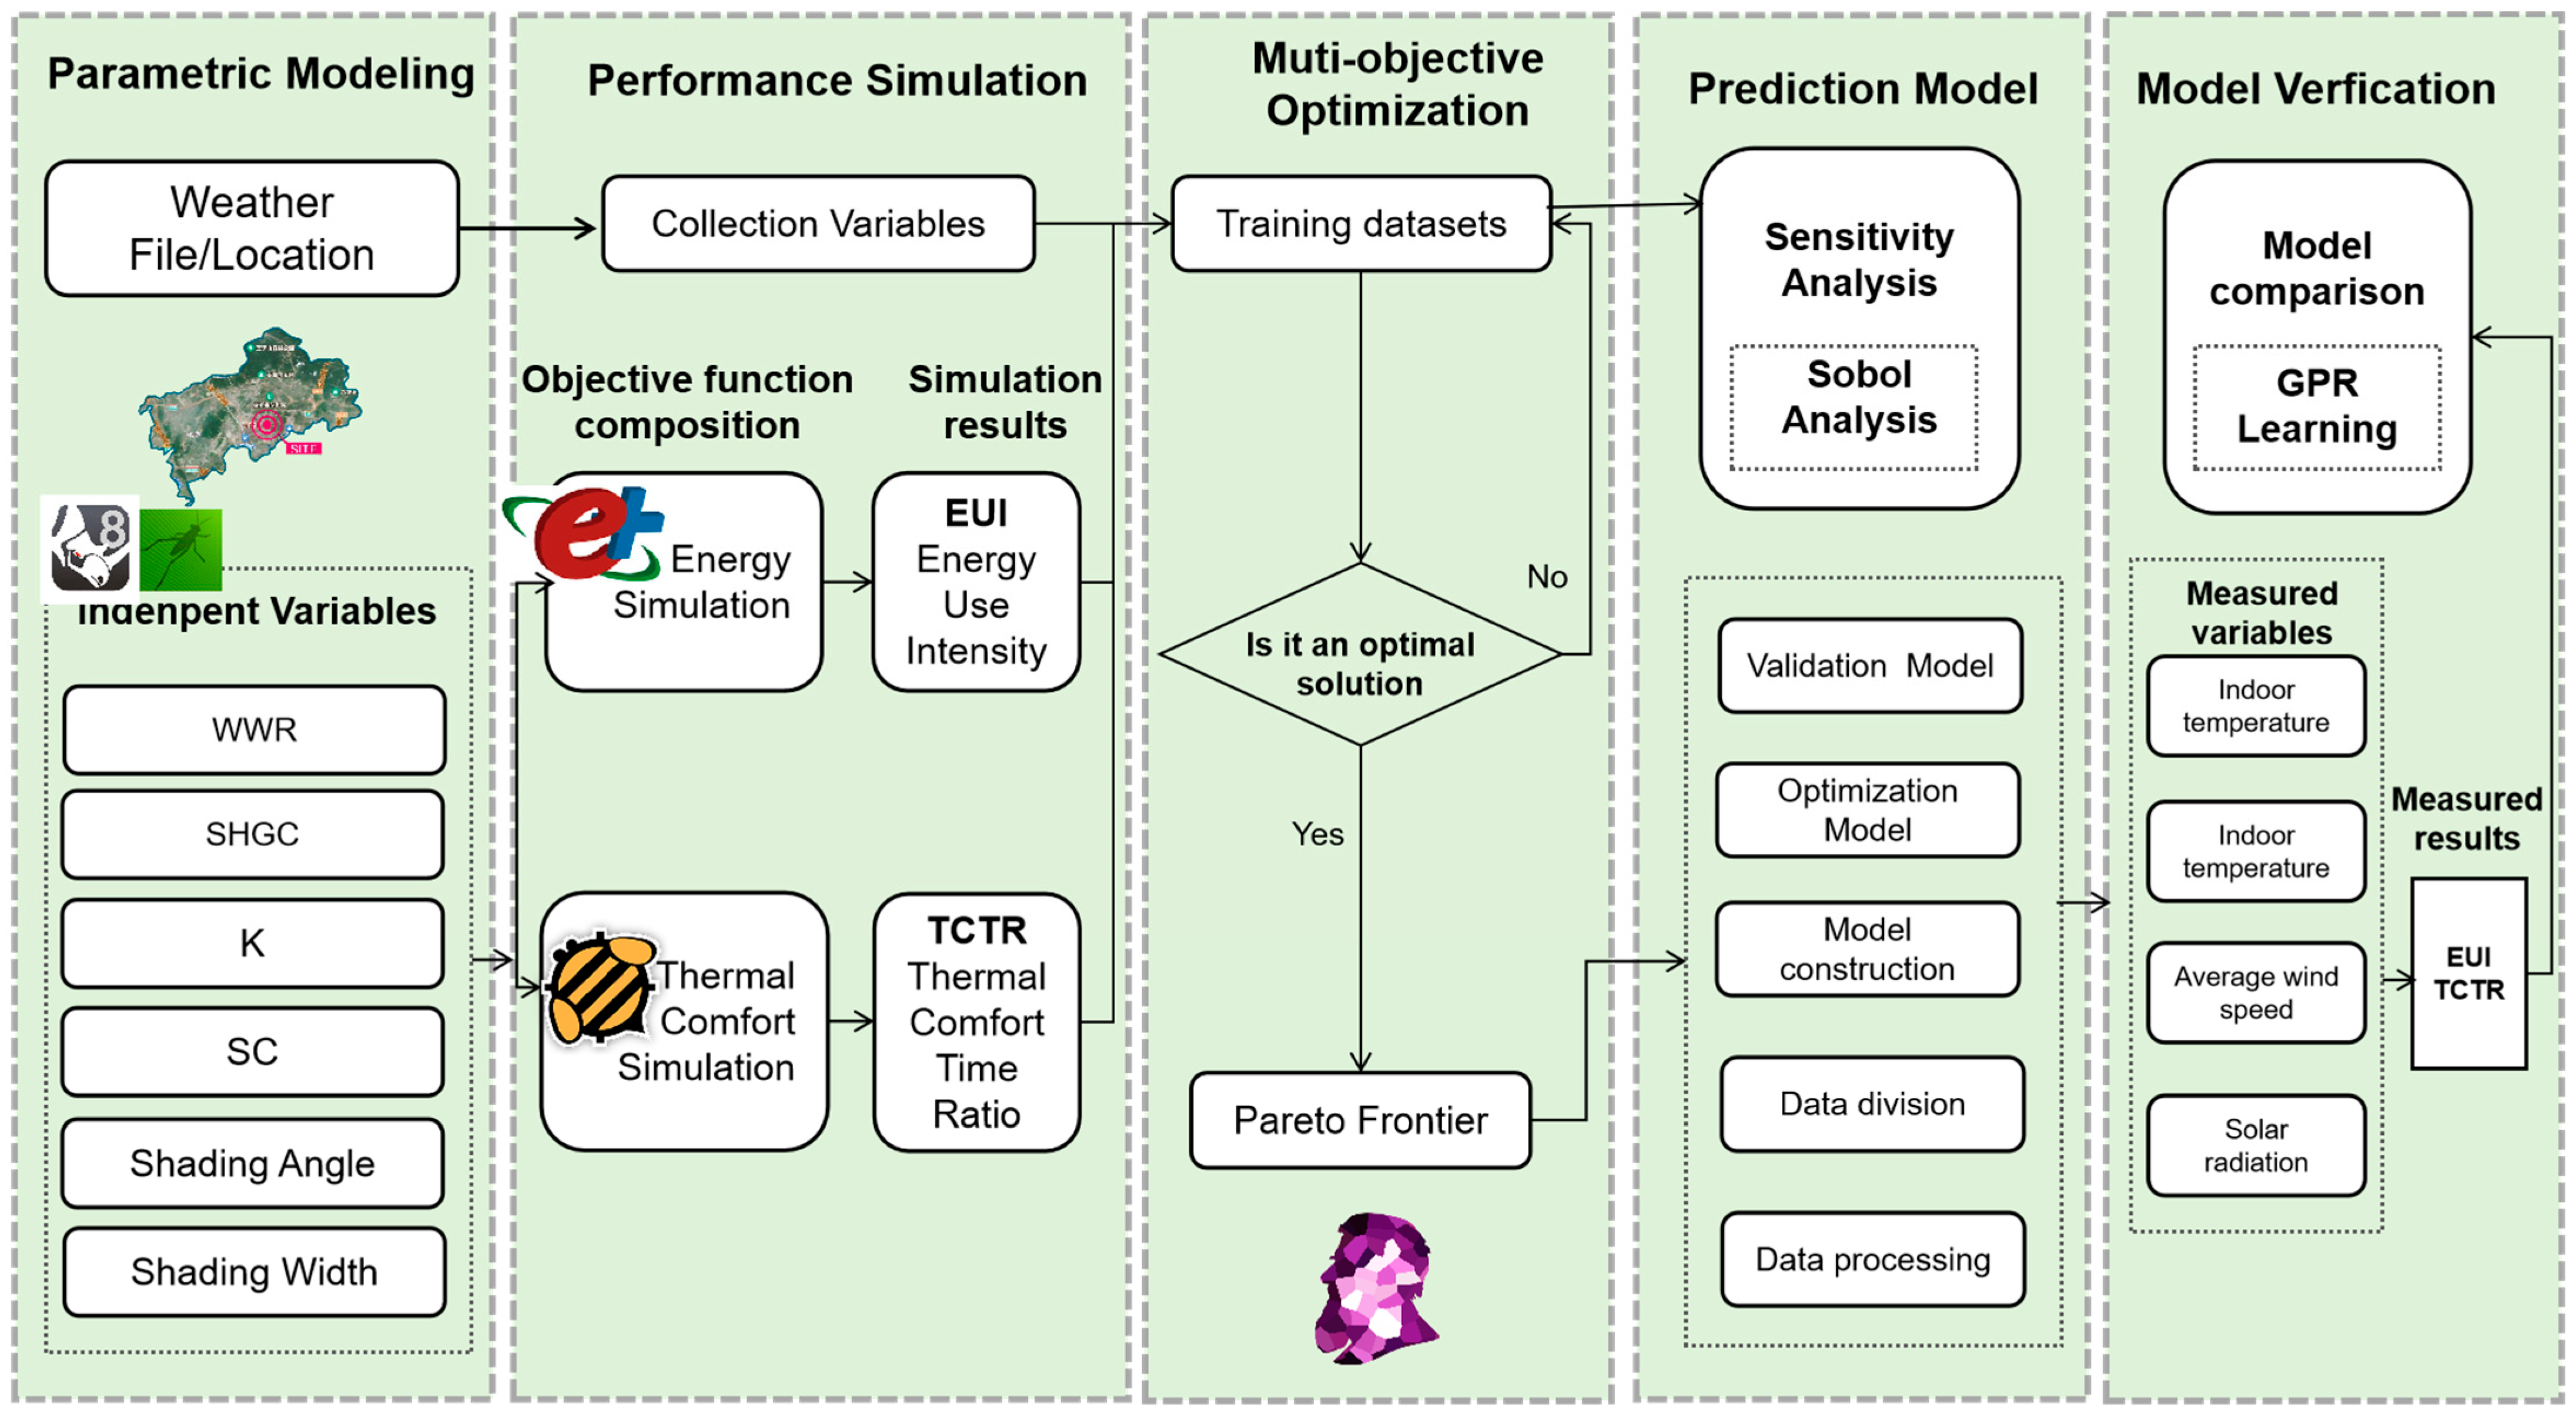
This study consists of four primary phases. Building upon prior climate analysis, the first phase involves the development of a parametric modeling framework and performance simulation. The second phase utilizes multi-objective optimization to derive Pareto-optimal solutions. The third phase incorporates sensitivity analysis, clarifying the influence and interrelationships of various physical parameters on energy use and thermal comfort in school classrooms. The fourth phase applies machine learning techniques for model verification (Figure 2).
For all software used in the study, including simulation tools such as EnergyPlus and Honeybee, the version, manufacturer, city, abbreviated state (for USA/Canada), and country have been specified. This information is included in thesection and associated with the respective software tools used for energy and thermal comfort simulations:
  • EnergyPlus: Version: 9.6, Manufacturer: U.S. Department of Energy, City: Washington, State: DC, Country: USA [38].
  • Honeybee: Version: 1.5.0, Manufacturer: Ladybug Tools, City: London, State: N/A, Country: UK [39].
  • Rhino 8: Version: 8.0, Manufacturer: Robert McNeel & Associates, City: Seattle, State: WA, Country: USA [40].
  • Grasshopper: Version: 1.0, Manufacturer: Robert McNeel & Associates, City: Seattle, State: WA, Country: USA [41].
  • Wallacei Plugin: Version: 1.2, Manufacturer: Ladybug Tools, City: London, State: N/A, Country: UK [42].

2.1. Climate Background

Guangzhou, located in southern China, has a characteristic hot-humid climate with consistently high temperatures and elevated humidity levels year-round. The average annual temperature ranges from 16 °C in winter to 35 °C in summer, reaching its highest between May and September. The region experiences high relative humidity, often exceeding 80% during the summer, which significantly affects the cooling energy demands of buildings [43].
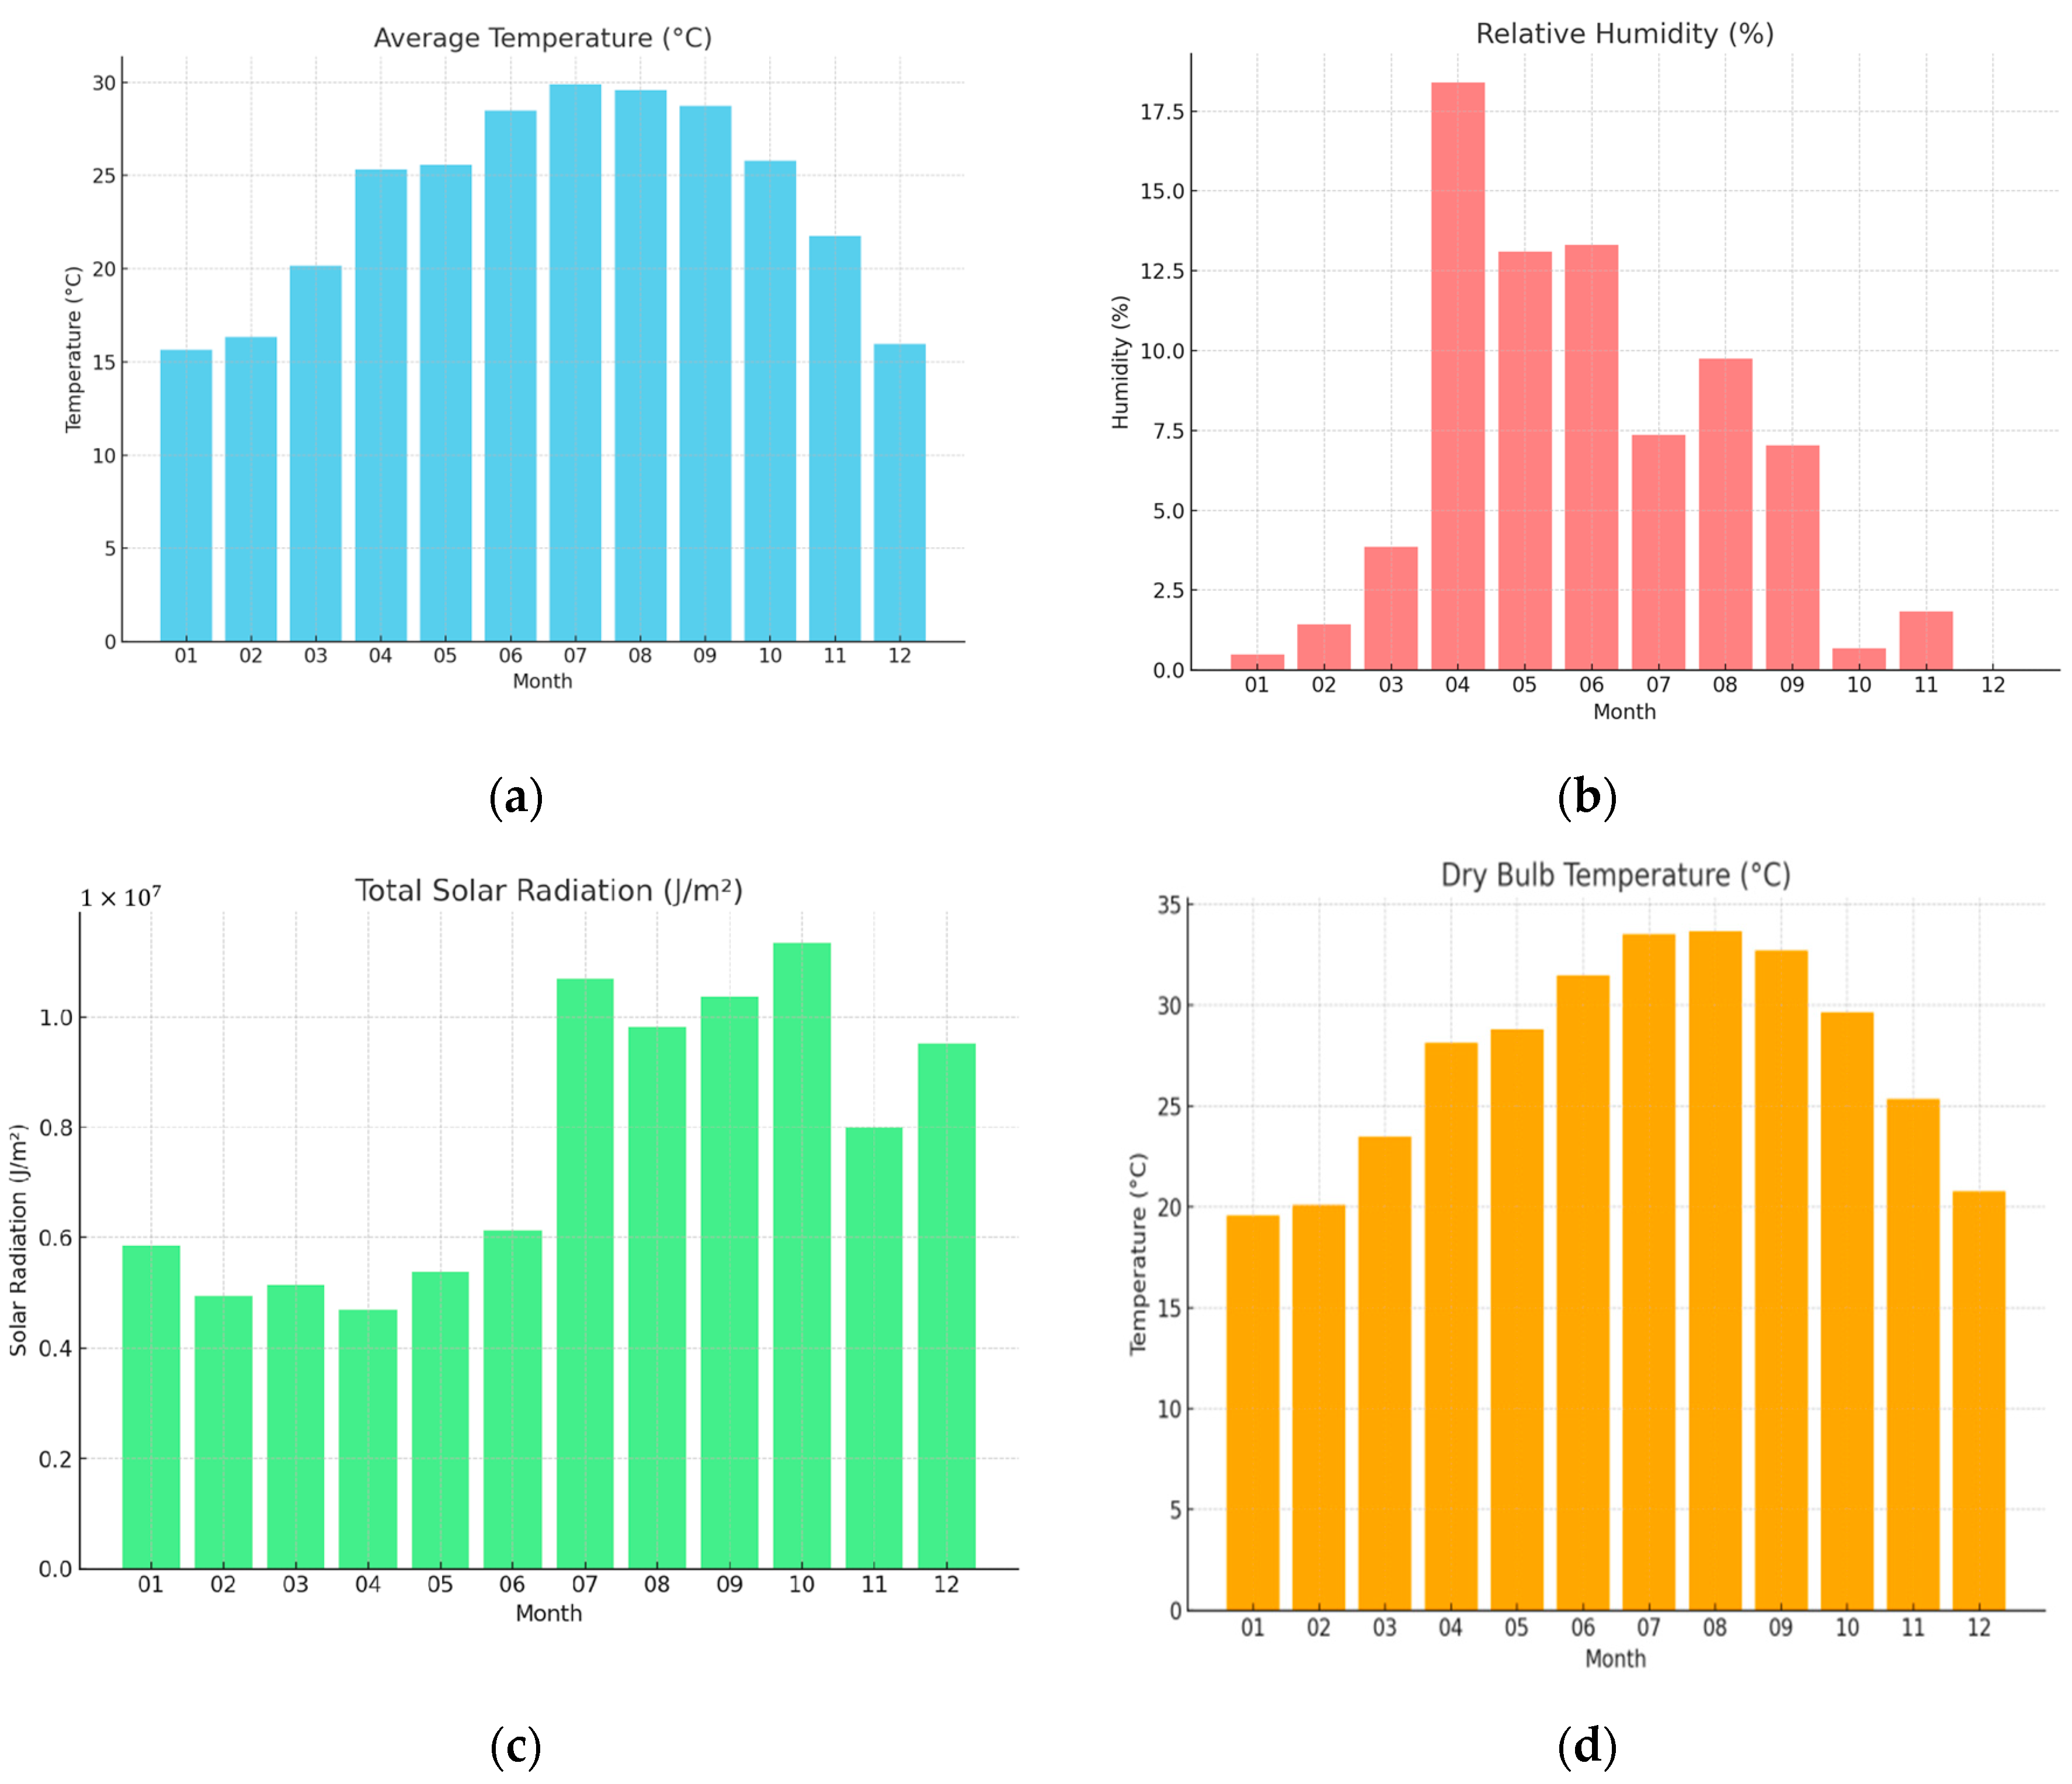
Figure 3a shows the monthly average temperature, varying from 16 °C in winter to 35 °C in summer, underscoring the seasonal fluctuations that affect cooling demands in buildings. Figure 3b depicts the relative humidity trend, often exceeding 80% in summer, emphasizing the challenge of maintaining comfortable indoor environments without excessive energy consumption. These climatic conditions are instrumental in determining thermal comfort and energy use dynamics within the built environment of this area.
Guangzhou’s hot-humid climate significantly impacts building energy use and thermal comfort. Cooling demands are predominantly influenced by solar radiation, shading, and thermal mass. Excessive heat gain through windows, exacerbated by inadequate shading, elevates energy use, underscoring the importance of window design in enhancing energy efficiency and occupant comfort [44].
The selection of window design parameters, particularly the Window-to-Wall Ratio (WWR), shading devices, and glazing properties, is crucial for controlling thermal performance in hot-humid climates. Properly designed windows can mitigate solar heat gain during the summer while ensuring adequate daylighting. These considerations are particularly important for school buildings, which often experience significant internal heat loads due to occupancy, lighting, and equipment usage. Thus, optimizing window parameters is key to enhancing energy efficiency and thermal comfort in schools in hot-humid areas.
This study explores energy-efficient window design strategies to address the significant cooling demands imposed by Guangzhou’s climate. Using a multi-objective optimization approach, this study develops a framework for optimizing window design in school buildings, tailored to the region’s climatic characteristics, as shown in Figure 3c, which demonstrates the relationship between total solar radiation and cooling load.

2.2. Performance Simulation Methods

The design models were primarily developed and imported using the parametric modeling process in Rhino 8 and Grasshopper 1.0. Initially, a foundational building geometry was established in Rhino. This geometry incorporated design parameters such as dimensions (length, width, and height), floor and roof structures, room dimensions, volumes, window placements, and shading elements sourced from architectural design documents, reports, and building codes. Subsequently, within Grasshopper, these parameters were linked to the building elements using the visual programming environment through logical statements, including the window-to-wall ratio (WWR), shading coefficient (SC), heat transfer coefficient (K), solar heat gain coefficient (SHGC), shading width, and shading angles. This functionality enables the automatic updating of the entire model in response to modifications in design parameters, such as changes in WWR or shading angles.
Geometry generated in Grasshopper was imported into EnergyPlus 9.6 and Honeybee 1.5.0 for energy consumption and thermal comfort using the Honeybee plugin. This integration facilitated the creation of 1000 unique design configurations with varying Energy Use Intensity (EUI) and Thermal Comfort Time Ratio (TCTR) values. Subsequently, the Wallacei 1.2 plugin in Grasshopper was used to apply the NSGA-II optimization algorithm for multi-objective optimization of the 1000 design scenarios. Through this optimization process, the Pareto-optimal solutions yielded the best trade-offs between EUI and TCTR. A total of 70 optimal solutions were selected, offering a diverse array of designs for architects and engineers to evaluate.
This study utilizes EnergyPlus and Honeybee models to comprehensively evaluate building energy performance and thermal comfort. The models assess the impact of key design parameters, including Window-to-Wall Ratio (WWR), Shading Coefficient (SC), Solar Heat Gain Coefficient (SHGC), Shading Angle, and Shading Width, on Energy Use Intensity (EUI) and Thermal Comfort Time Ratio (TCTR). Energy Use Intensity (EUI), calculated as the total annual energy consumption per unit floor area, serves as the primary metric for assessing energy consumption, as represented by the following equation:
E U I = E t o t a l A f l o o r
where
-
E t o t a l is the total energy consumed by the building in kilowatt-hours per year (kWh/year).
-
A f l o o r is the total floor area of the building in square meters ( m 2 ).
Energy Use Intensity (EUI) is an important benchmark for building energy efficiency as it provides a standardized measure to compare energy performance among various building types and configurations [45]. This index is also important in determining energy inefficiencies and the optimization of building design, particularly for energy consumption per floor area.
Thermal Comfort Time Ratio (TCTR): The proportion of time that the conditions are at an “acceptable” level [46]. The TCTR is obtained from the following formula:
T C = t = 1 T C C o m f o r t   t     T   ×   100
where
-
C C o m f o r t   t represents the comfort index at time t, indicating whether the indoor environment meets thermal comfort standards. If C C o m f o r t   t = 1, the indoor environment meets the comfort standards, while if C C o m f o r t   t = 0, it does not.
-
T is the total time period being considered, typically one year.
T C is the thermal comfort time ratio, which denotes the percentage of time that the indoor environment maintains thermal comfort conditions.
TCTR is commonly used in building simulations to assess indoor comfort, particularly in educational environments where occupant comfort is a priority [47]. It is widely employed to study how environmental conditions, such as temperature and humidity, impact occupant comfort in space over time. The TCTR metric ensures that indoor climates remain acceptable and plays a crucial role in energy efficiency when optimizing buildings designed for warm-humid climates.
The study utilizes simulation tools to identify key parameters, thereby streamlining the optimization process. This method enables practical assessment and accelerates the optimization of window configurations, offering valuable insights for architects and engineers striving to improve energy efficiency and thermal comfort in school buildings in hot-humid climates.

2.3. Selection of Design Parameters

The study recognizes the parameters that are vital for the EUI and TCTR, the important indicators for determining energy efficiency and thermal comfort of school buildings. These parameters were chosen based on their significance in building design, especially in hot-humid regions, and were obtained from national building codes, previous publications, and on-site measurements. The design parameters selected were the following:
  • Window-to-Wall Ratio (WWR): This parameter regulates the equilibrium between daylight, ventilation, and cooling loads, essential for minimizing energy consumption while ensuring sufficient indoor lighting. This is particularly critical in hot-humid climates, where optimizing both cooling and natural ventilation is necessary [7,48].
  • Shading Coefficient (SC): SC defines the proportion of solar heat gain transmitted through a window. A lower SC is essential for reducing the cooling load, particularly in hot climates, by limiting excessive solar radiation [6,49].
  • Heat Transfer Coefficient (K): K represents the thermal performance of window materials and assemblies. A lower K value indicates better insulation, reducing heat transfer and, thus, improving both energy efficiency and thermal comfort [6,50].
  • Solar Heat Gain Coefficient (SHGC): SHGC quantifies the fraction of incident solar heat enters the building through the window. In hot-humid climates, optimizing SHGC helps balance solar heat gain with the need for natural daylight, minimizing cooling energy consumption while maintaining occupant comfort [6,51].
  • Shading Width and Shading Angle: These two parameters are vital for controlling solar radiation during peak hours while allowing sufficient daylight for indoor spaces. Proper shading minimizes thermal discomfort by reducing solar gain and provides an effective passive cooling mechanism [7,52].
The selection of these parameters was guided by national and regional building design standards, including GB 50189-2015 (Code for Design of Energy Efficiency in Buildings) [7], and DBJ 15-51-2020 (Guangdong Province Public Building Energy Efficiency Design Standard) [53]. These standards focus on energy efficiency and occupant comfort, offering a solid foundation for selecting parameters that are critical to optimizing building performance. The selected ranges for each parameter align with these guidelines, ensuring that the study’s findings are not only scientifically valid but also practically applicable.
Other potential parameters, such as material details, furniture layout, or occupant. While other potential parameters, such as material details, furniture layout, and occupant behavior, can influence energy consumption and comfort, their effects were found to be secondary compared to the chosen parameters [54,55]. Including these would unnecessarily complicate the model and increase computational demands, reducing optimization efficiency and interpretability. Therefore, focusing on the most significant parameters keeps the model manageable and aligned with practical design requirements.
This approach consolidates the rationale for parameter selection in a single location and provides a comprehensive description of the influences on energy use and thermal comfort in schools. By incorporating adopted building codes and realistic design strategies, the investigation offers a practical framework for improving school building performance in hot-humid climates.

2.4. Multi-Objective Optimization

Objective functions such as Energy Use Intensity (EUI) and Thermal Comfort Time Ratio (TCTR) are key metrics for evaluating energy efficiency and thermal comfort, respectively. EUI, expressed as annual specific energy consumption per unit floor area (kWh/m2·year), represents the overall building energy efficiency. TCTR, which quantifies the duration of time that indoor thermal comfort remains acceptable for occupants, is crucial for human comfort. Both metrics are significantly influenced by design parameters, such as Window-to-Wall Ratio (WWR), Solar Heat Gain Coefficient (SHGC), and Shading Coefficient (SC) in the solution vector x. The correlations between these design variables and the objectives are established based on empirical data and EnergyPlus simulations.
The objective functions E U I x   and T C ( x ) constitute a multi-objective optimization conundrum aimed at minimizing EUI to curtail energy consumption while maximizing TCTR to enhance thermal comfort. Typically, these objectives are at odds, as reducing energy usage may compromise comfort, and improving comfort may escalate energy consumption. To reconcile this conflict, the NSGA-II algorithm is utilized to derive Pareto-optimal solutions that offer optimal compromises between these objectives. The abstract formulation of the problem involves input parameters x (e.g., WWR, SHGC, SC, K, Shading Width, Shading Angle) that impact the output performance metrics E U I ( x ) and T C x . The optimization seeks to navigate the solution space to strike a balance between energy efficiency and comfort, yielding a collection of Pareto-optimal solutions.
This study employs the NSGA-II algorithm, combined with Grasshopper, to optimize window configurations in school buildings. The multi-objective optimization aims to minimize Energy Use Intensity (EUI) and maximize the Thermal Comfort Time Ratio (TCTR), both of which are critical indicators of sustainable building design. The objective functions for EUI and TCTR are defined as follows:
F ( x )   =   [   f 1 ( x ) ,   f 2 ( x ) ] =   [ M i n i m i z e   E U I x ,   M a x i m i z e   T C ( x ) ]
where
-
f 1 x =   Energy Use Intensity function (EUI)
-
f 2 x =   Thermal Comfort time percentage function (TC)
A reliable multi-objective optimization approach is essential to resolve the trade-off between energy savings and thermal comfort. We employ the widely used NSGA-II algorithm for multi-objective optimization to efficiently obtain a set of Pareto-optimal solutions. This methodology enables a fair quantification of the trade-offs between the conflicting goals of energy-efficient operation and occupant comfort [56]. NSGA-II has been successfully applied to building design optimization, particularly in scenarios with conflicting objectives, such as energy use and occupant well-being.
The crowding-distance metric further helps in preserving diversity among the Pareto-optimal solutions. The crowding distance, d i , of a solution i is calculated by evaluating the density of neighboring solutions in the objective space. The formula for crowding distance is given by
d i = m = 1 N f i , m + 1 f i , m 1 f m a x , m f m i n , m
where
-
d i is the crowding distance of the i -th solution,
-
f i , m + 1 and f i , m 1 are the objective values of the neighboring solutions on the m -th objective,
-
f m a x , m and f m i n , m are the maximum and minimum values of the m -th objective.
This metric maintains a diverse set of Pareto-optimal solutions, preventing the optimization process from focusing solely on improving individual objectives and instead maximizing the distribution of solutions across the Pareto front.
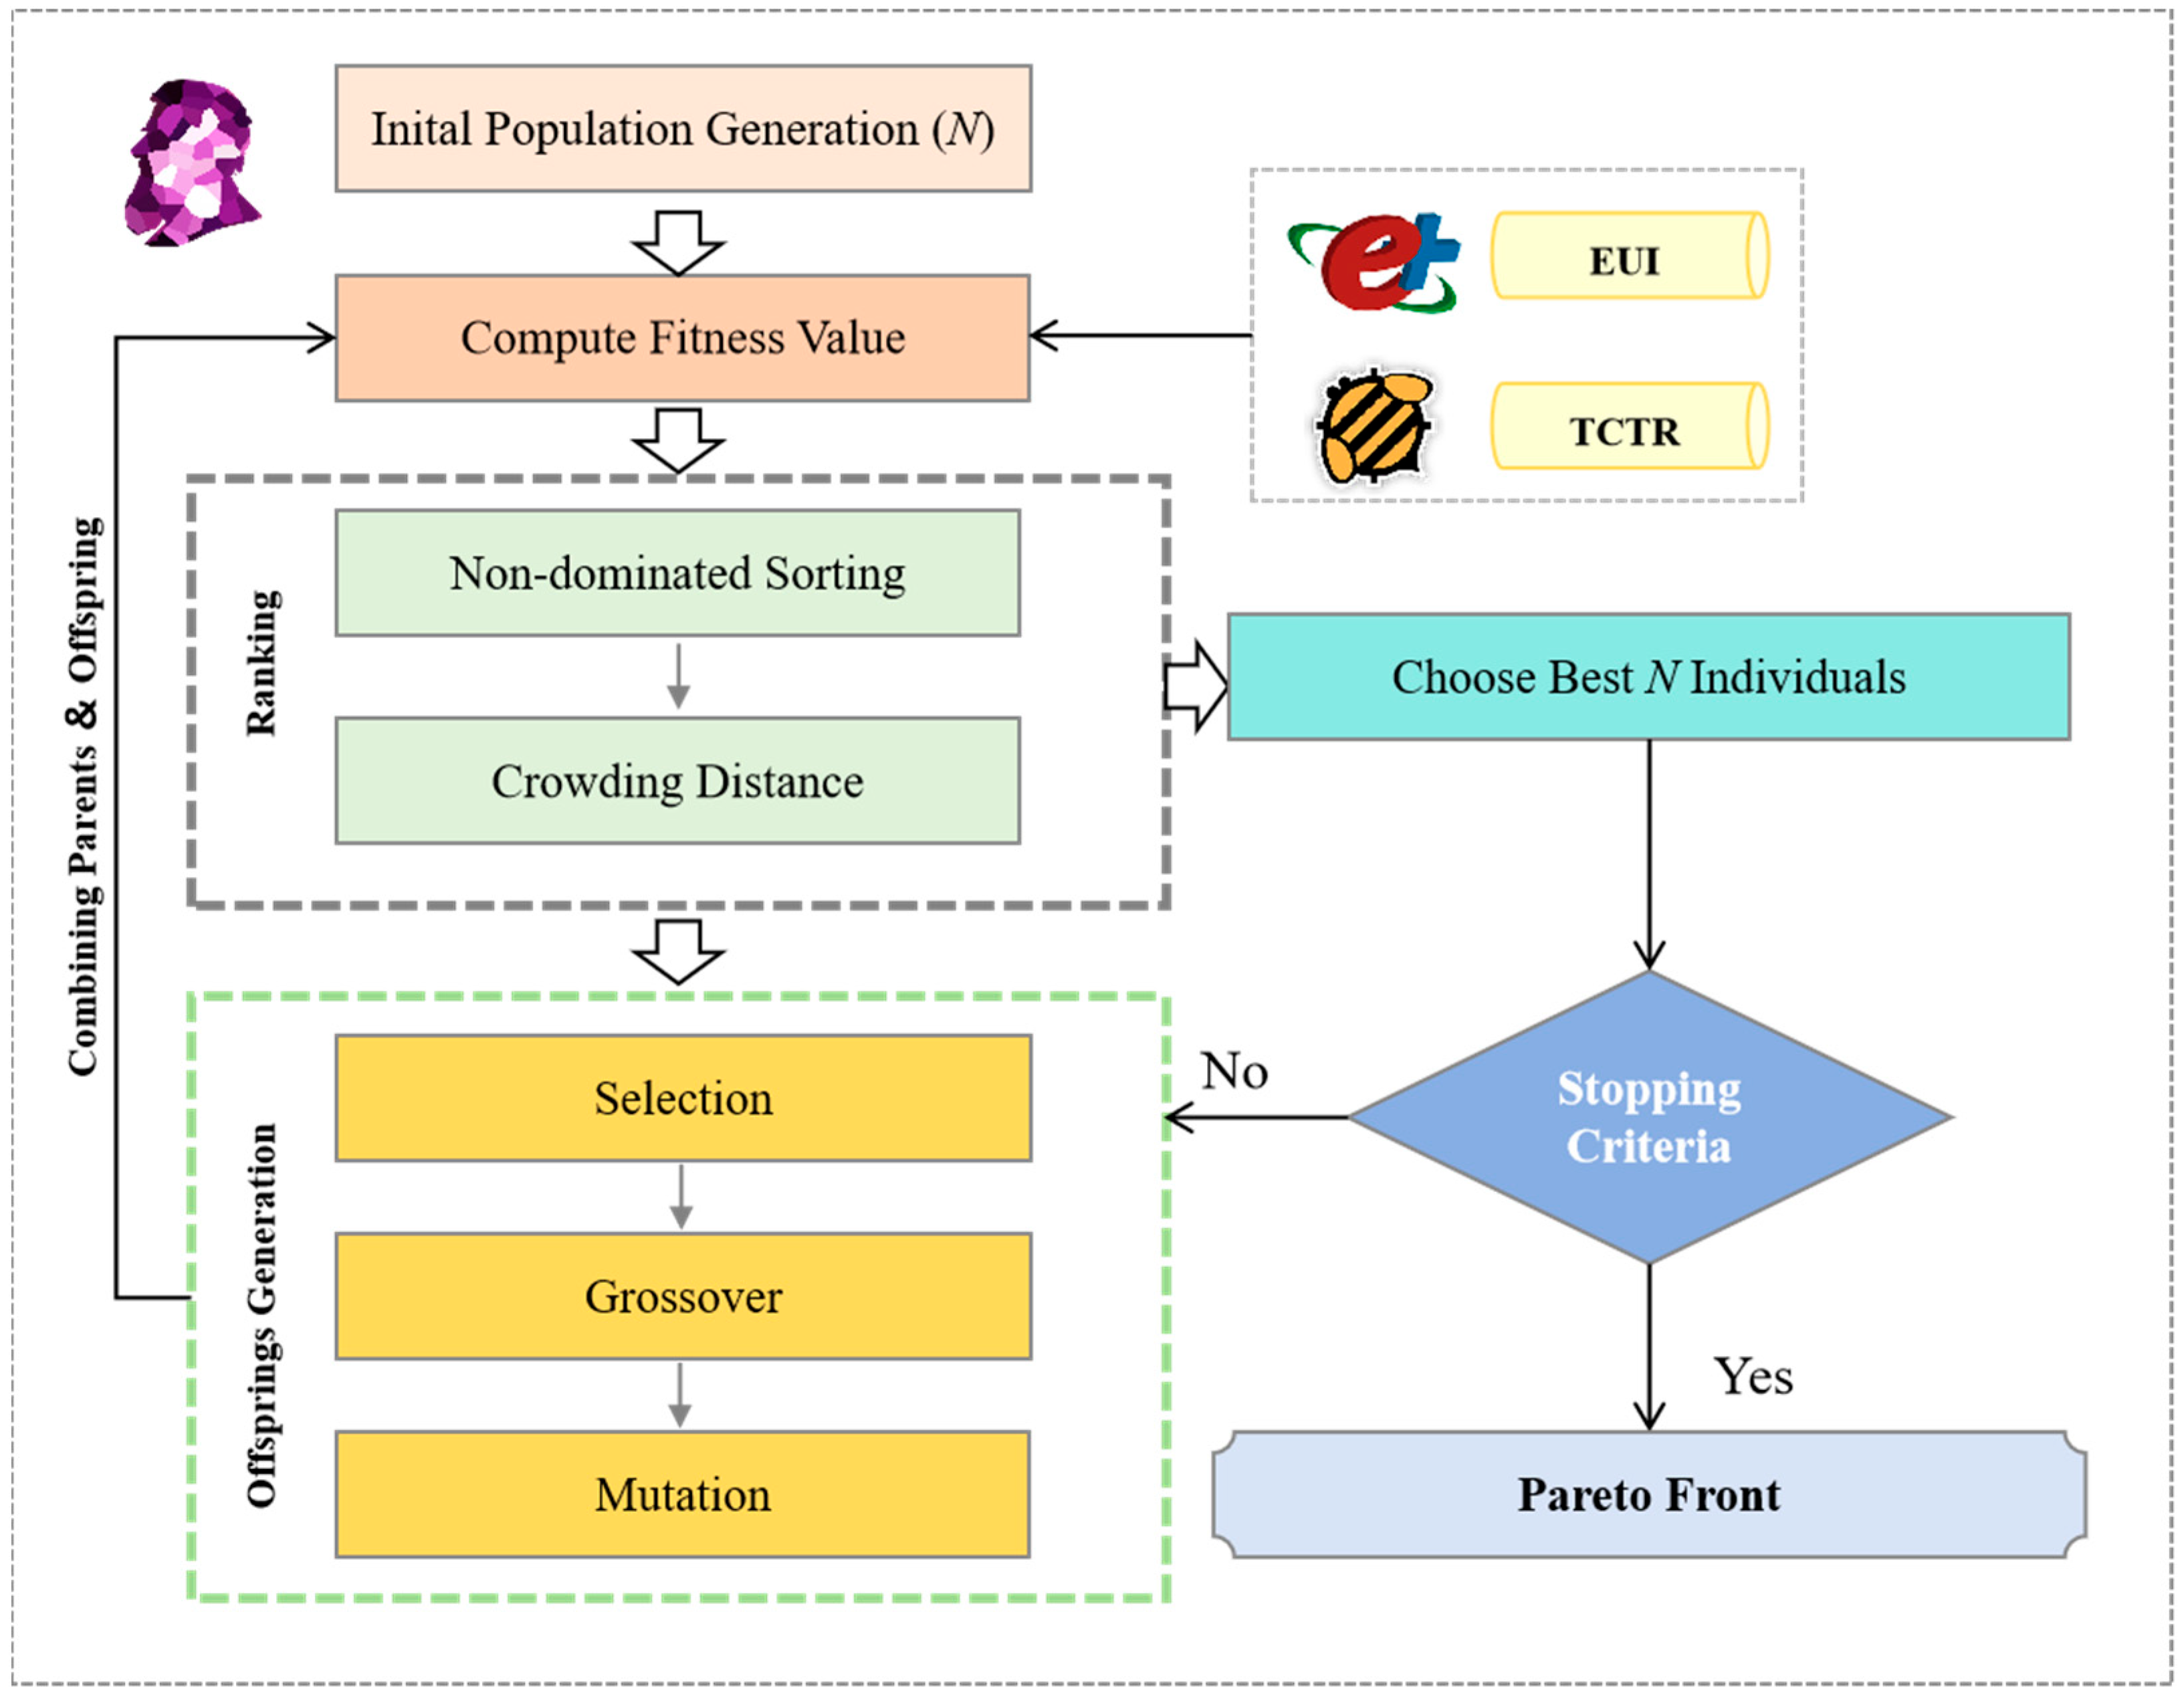
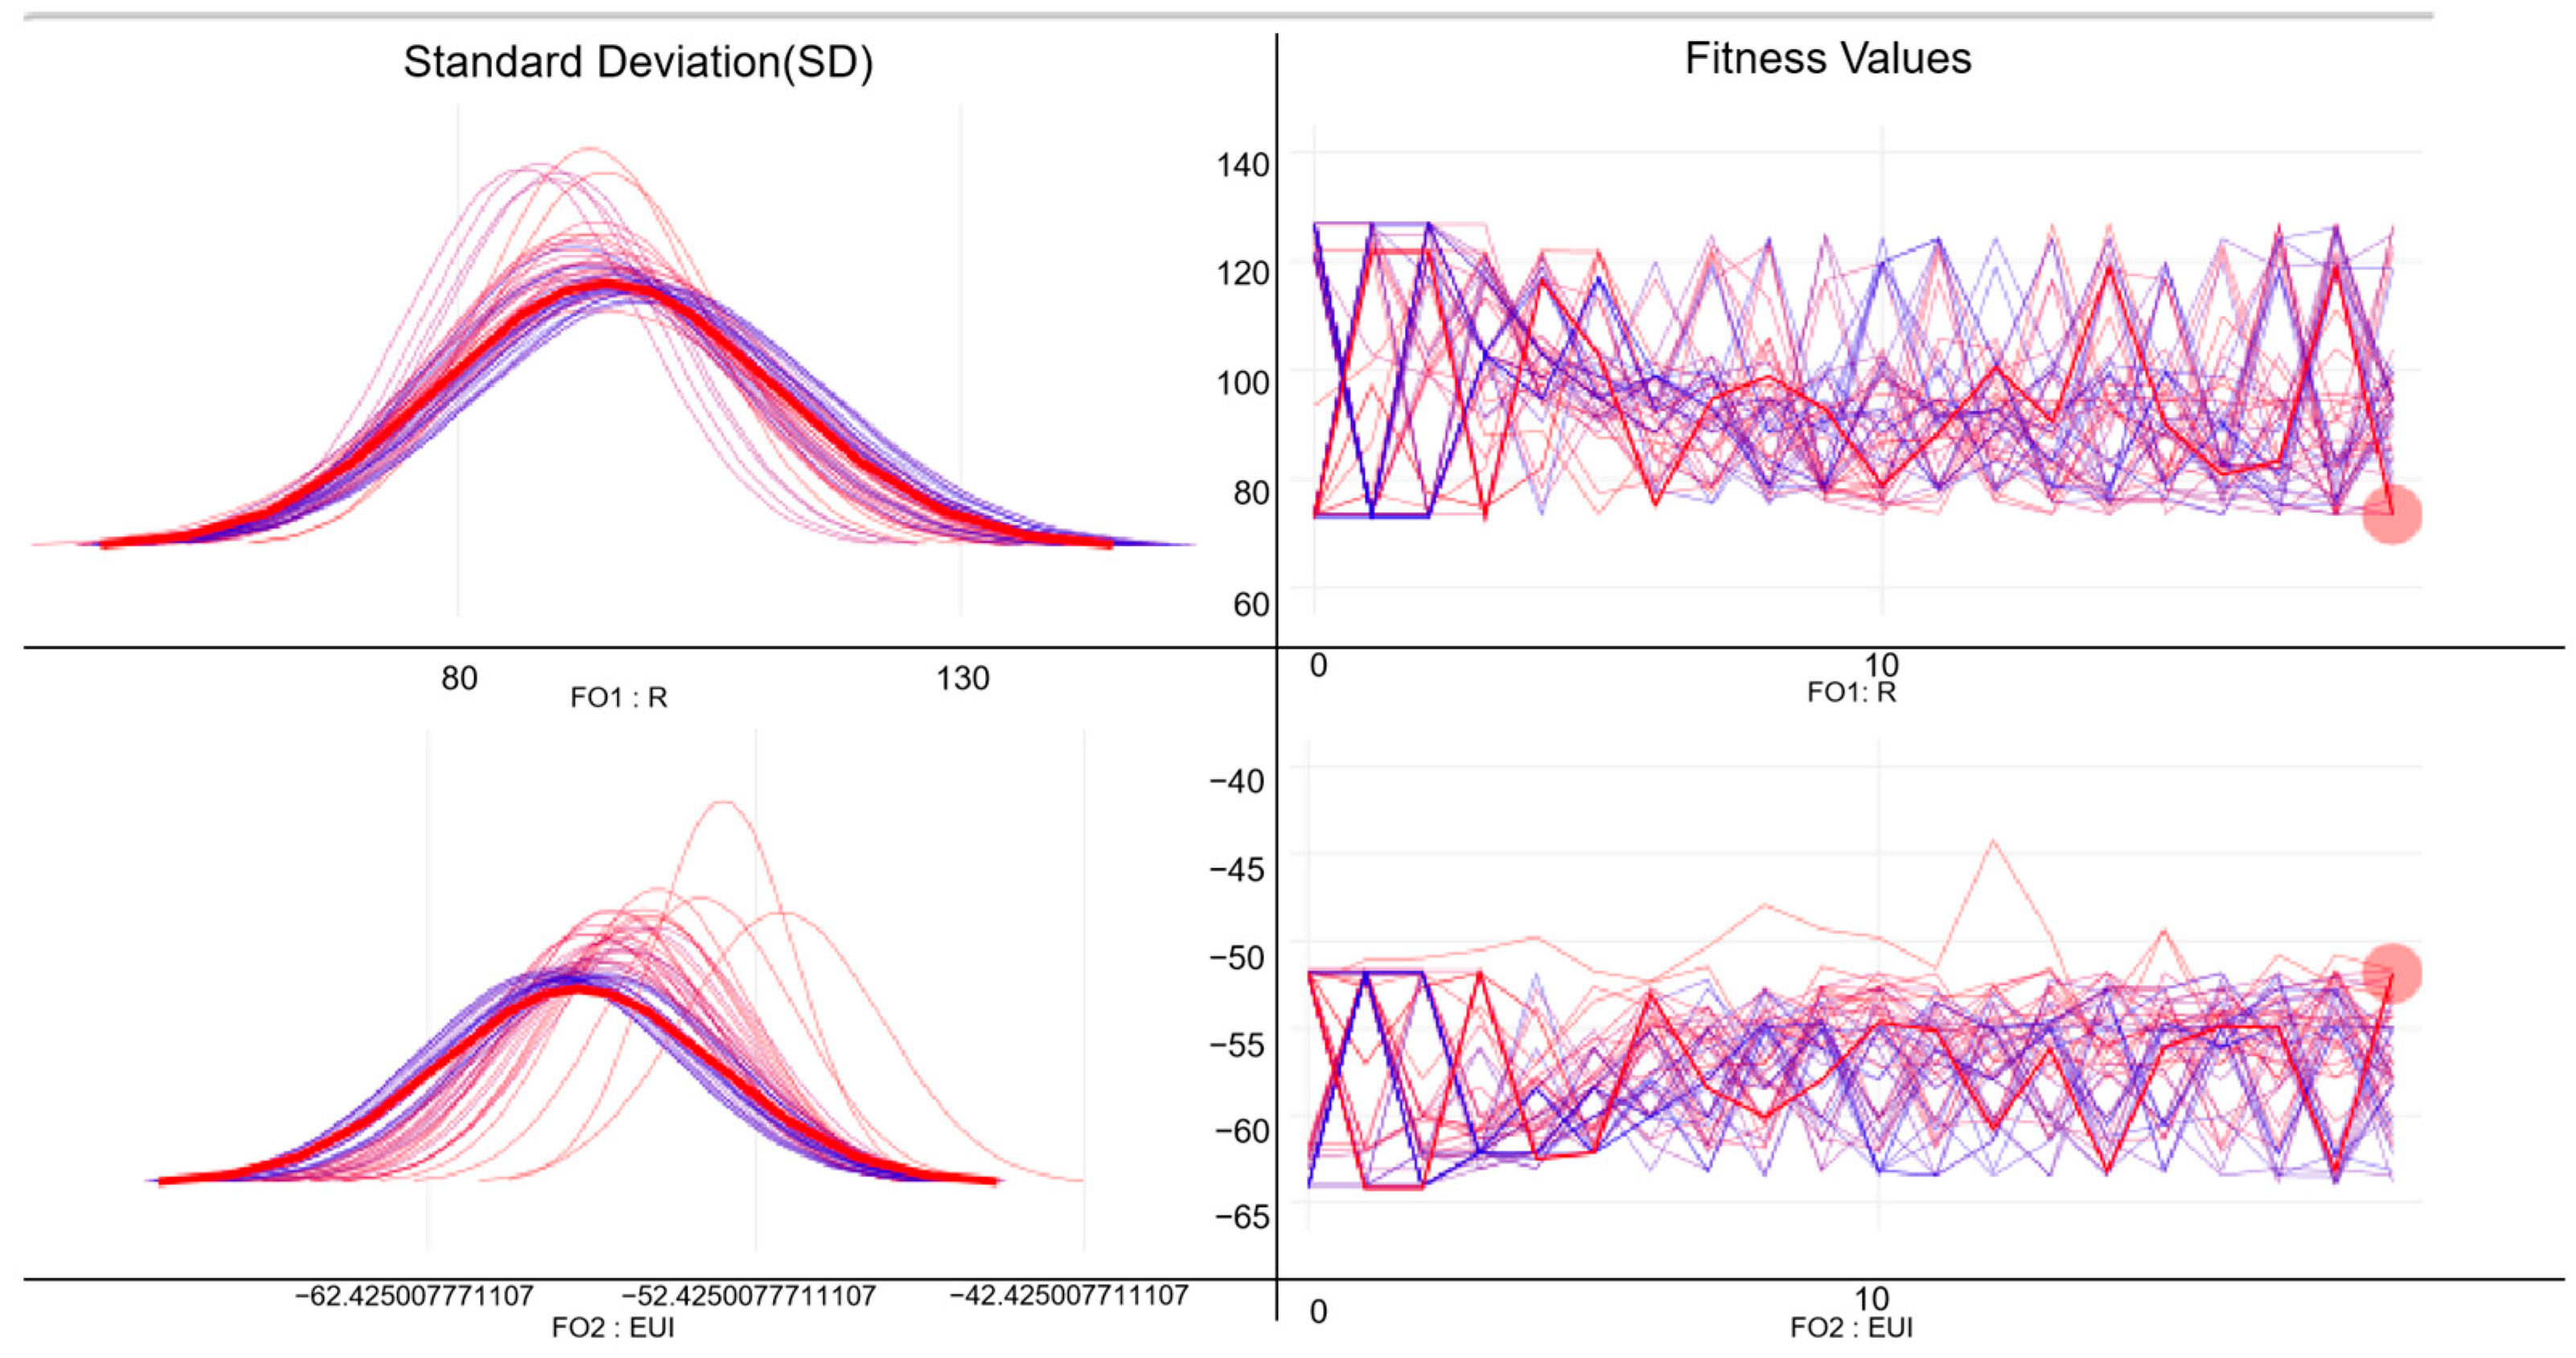
The present study employs the Non-dominated Sorting Genetic Algorithm II (NSGA-II) to generate Pareto-optimal solutions. The optimization process commences with the random initialization of a population. Individuals are then evaluated using a multi-objective fitness function, which considers both Energy Use Intensity (EUI) and Thermal Comfort Time Ratio (TCTR) as objectives. Non-dominated sorting is utilized to classify individuals into distinct Pareto fronts, where each front comprises solutions that are not dominated by any other. To maintain diversity within the population, the crowding distance metric is computed, which promotes the selection of solutions that are evenly distributed across the objective space (Figure 4).
The subsequent phase entails implementing selection, crossover, and mutation operations to create a new cohort of individuals, which is then merged with the parental generation. After merging the populations, an additional step of non-dominated sorting is performed to select the best solutions for the next generation. This process is repeated until the termination condition is met, resulting in a final set of Pareto-optimal solutions. These represent the most suitable trade-offs between energy consumption and comfort, providing a set of well-defined design alternatives for decision-makers to compare and select [57].

2.5. Sensitivity Analysis and Machine Learning Models

This study utilizes Sobol sensitivity analysis and Gaussian Process Regression (GPR) to evaluate the influence of key design parameters on building Energy Use Intensity (EUI) and Thermal Comfort Time Ratio (TCTR). Sobol sensitivity analysis, a recognized global sensitivity analysis technique, partitions the variance in model outputs to elucidate how input parameters influence the system’s behavior. This methodology has been extensively applied in building energy simulations to identify critical design variables that significantly influence building performance [58].
Sobol sensitivity analysis employed Latin Hypercube Sampling (LHS), a robust statistical technique ensuring efficient and representative sampling across the input space. LHS divides each parameter range into intervals, sampling one point from each to maintain analysis accuracy while capturing input parameter variability [59].
Sobol sensitivity indices quantitatively assess each input parameter’s contribution to the overall variance in the model output. The first-order sensitivity index S i captures the direct effect of a given parameter, while the total-order sensitivity index S T i accounts for both direct effects and interactions between parameters [60]. Mathematically, these indices are defined as Equation (5). This formulation enables a comprehensive evaluation of parameter importance and the identification of the key drivers of model output uncertainty.
S i = V a r E Y X i V a r Y S T i = 1 V a r E Y X i V a r Y
where
-
E Y X i is the conditional expectation of Y given the input parameter X i ,
-
V a r Y is the variance of the output Y,
-
X i   represents all input parameters except X i
The identified indices are essential for pinpointing the most influential parameters affecting Energy Use Intensity (EUI) and Thermal Comfort Time Ratio (TCTR), thus directing the optimization process to focus on variables that significantly impact building performance.
Gaussian Process Regression (GPR) is a probabilistic machine learning method that approximates simulation outcomes to improve computational efficiency [61]. It offers a non-linear approximation of complex models, facilitating quicker predictions with quantifiable uncertainty. This renders GPR suitable for optimization problems where extensive simulations are computationally expensive. By using fewer simulations, GPR reduces the computational burden during the optimization process, enabling more efficient identification of optimal window configurations.
This study utilizes Gaussian Process Regression (GPR) to minimize the number of simulations necessary for optimization, thereby accelerating the process and enhancing its efficiency [62]. By integrating Sobol sensitivity analysis with GPR, this study creates a robust framework for optimizing window designs in school buildings located in hot-humid climates. Focusing on the key parameters identified through sensitivity analysis enables a more precise optimization that balances energy efficiency and thermal comfort.

3. Results

3.1. Model Simulation

3.1.1. Simulation

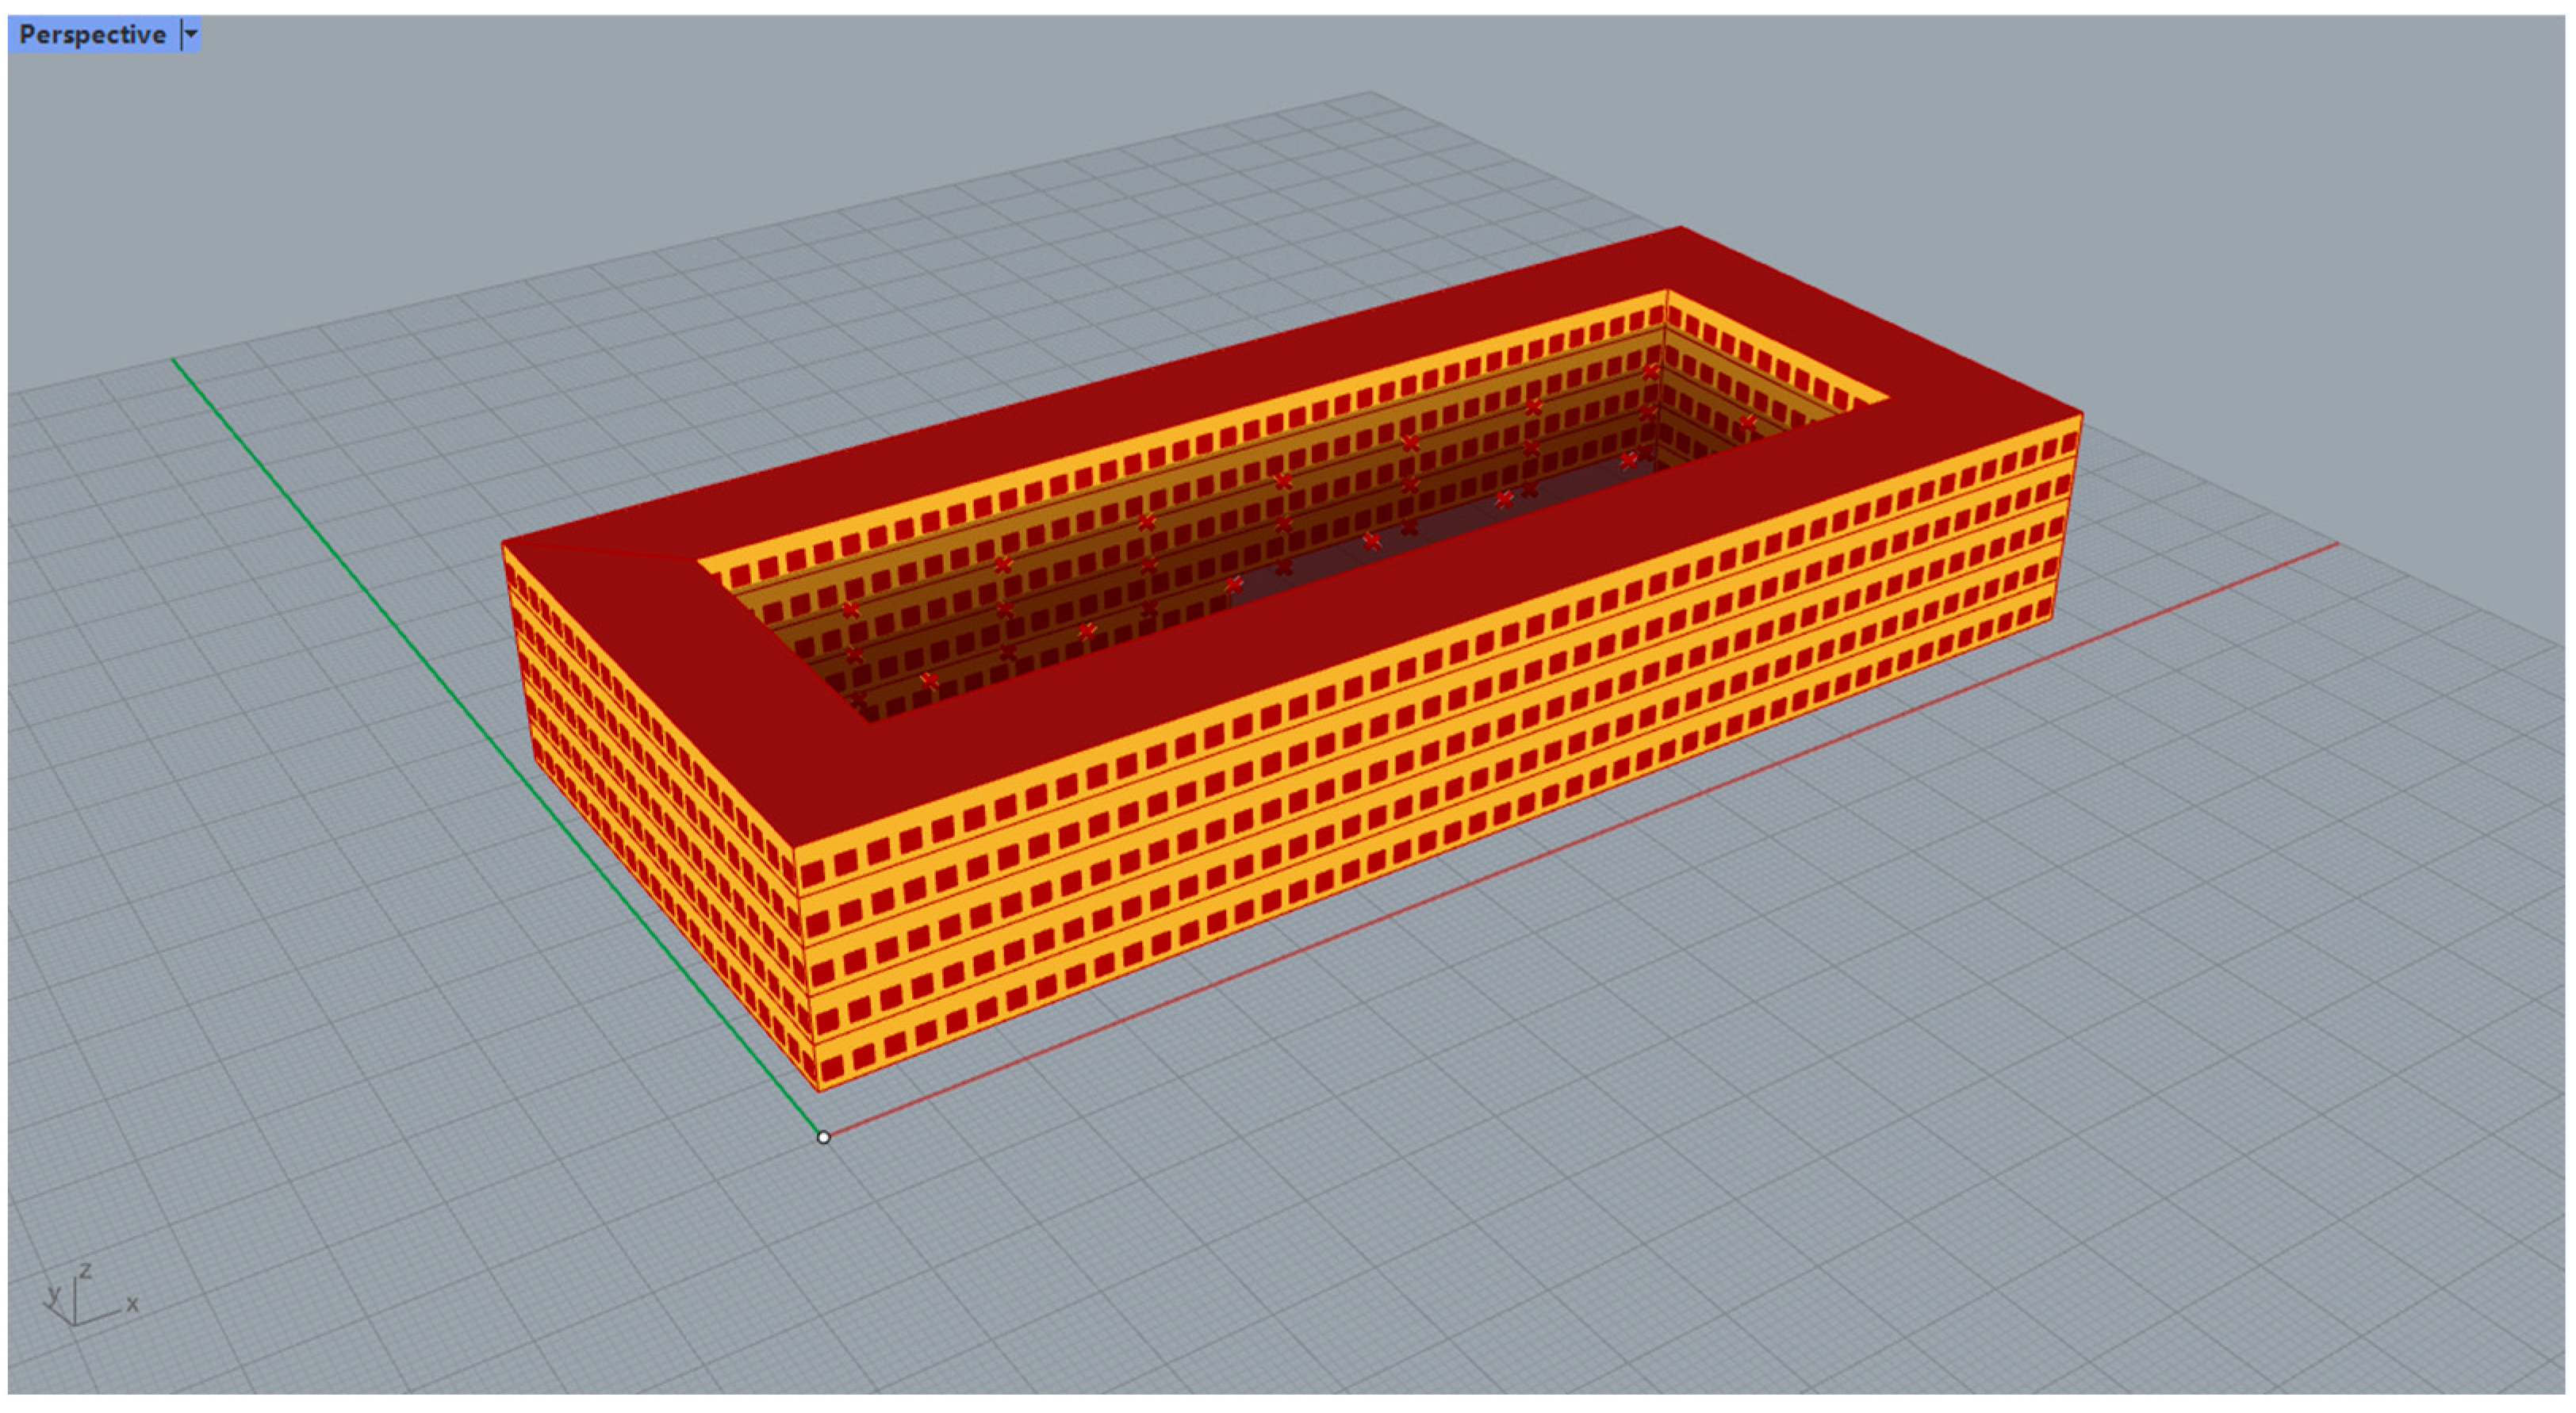
This study evaluates the Energy Use Intensity (EUI) and Thermal Comfort Time Ratio (TCTR) of school buildings in hot-humid climates, with a focus on optimal window configurations. Building morphology and window placement significantly influence thermal comfort and energy consumption [63]. A digital model of a representative school building in Guangzhou, measuring 120 by 80 m and arranged around a central courtyard, was developed. Classrooms are predominantly oriented southward to maximize natural lighting and ventilation [64].
The choice of a representative school building in Guangzhou was based on a quantitative research approach designed to assess building energy usage and thermal comfort. This approach integrated empirical data collection with simulation methods. The chosen school building typifies common public building design, specifically regarding occupant density and students’ concern for thermal comfort and energy conservation.
Schools, with their high occupant density, offer a unique opportunity to investigate how window design parameters impact energy consumption and thermal comfort [65]. Selecting an educational building in Guangzhou is particularly relevant due to the region’s hot and humid climate, which poses distinct challenges for enhancing energy efficiency and indoor thermal conditions (Figure 5).
This case study offers robust empirical data, including design parameters and measured conditions, crucial for parameter calibration and model validation, ensuring scientific repeatability and accuracy. Detailed design information and current performance metrics render this building ideal for testing the optimization model developed here. The project’s representative nature, diverse parameters, and available energy consumption and climate data further affirm its suitability as a validation tool for the optimization method.
Optimizing building design heavily depends on parametric modeling and multi-objective optimization to create a 3D model. Design requirements include handling complex geometries, addressing interactions among multiple parameters, and striking a harmonious balance between energy efficiency and thermal comfort. The primary software utilized for modeling is Rhino, which aids in creating 3D geometries and integrates with Grasshopper for visual parametric programming [66]. This cohesive method allows for swift iterations and adaptable design adjustments by establishing parametric relationships among design variables. EnergyPlus and Honeybee (integrated with Rhino and Grasshopper) are then used for performance simulations, providing crucial insights into energy use and thermal comfort. These tools allow for dynamic simulations of various design scenarios, ensuring a comprehensive evaluation of energy efficiency and occupant comfort in building design.
The energy efficiency and thermal comfort of a building are greatly influenced by six key window parameters: window-to-wall ratio (WWR), shading coefficient (SC), solar heat gain coefficient (SHGC), thermal transmittance (K), shading width, and shading angle [67]. These parameters are critical as they directly impact energy consumption and the indoor thermal environment. This study investigates how these parameters interact to identify patterns that optimize the Energy Use Intensity (EUI) and Thermal Comfort Time Ratio (TCTR) performance metrics.
EUI measures the annual energy consumption per unit floor area, while TCTR indicates the duration for which indoor conditions remain within acceptable comfort levels [68]. Energy-cooling operations are influenced by environmental factors, the building envelope, and occupant comfort, particularly with respect to the frequency of controlled overheating events [69].
This research reduces simulation complexity by omitting non-essential design details and focusing on the key parameters that significantly affect building performance. The method allows for quicker evaluations and more efficient optimization, offering practical recommendations for window design in educational buildings.

3.1.2. Multi-Objective Optimization Window Parameter Settings

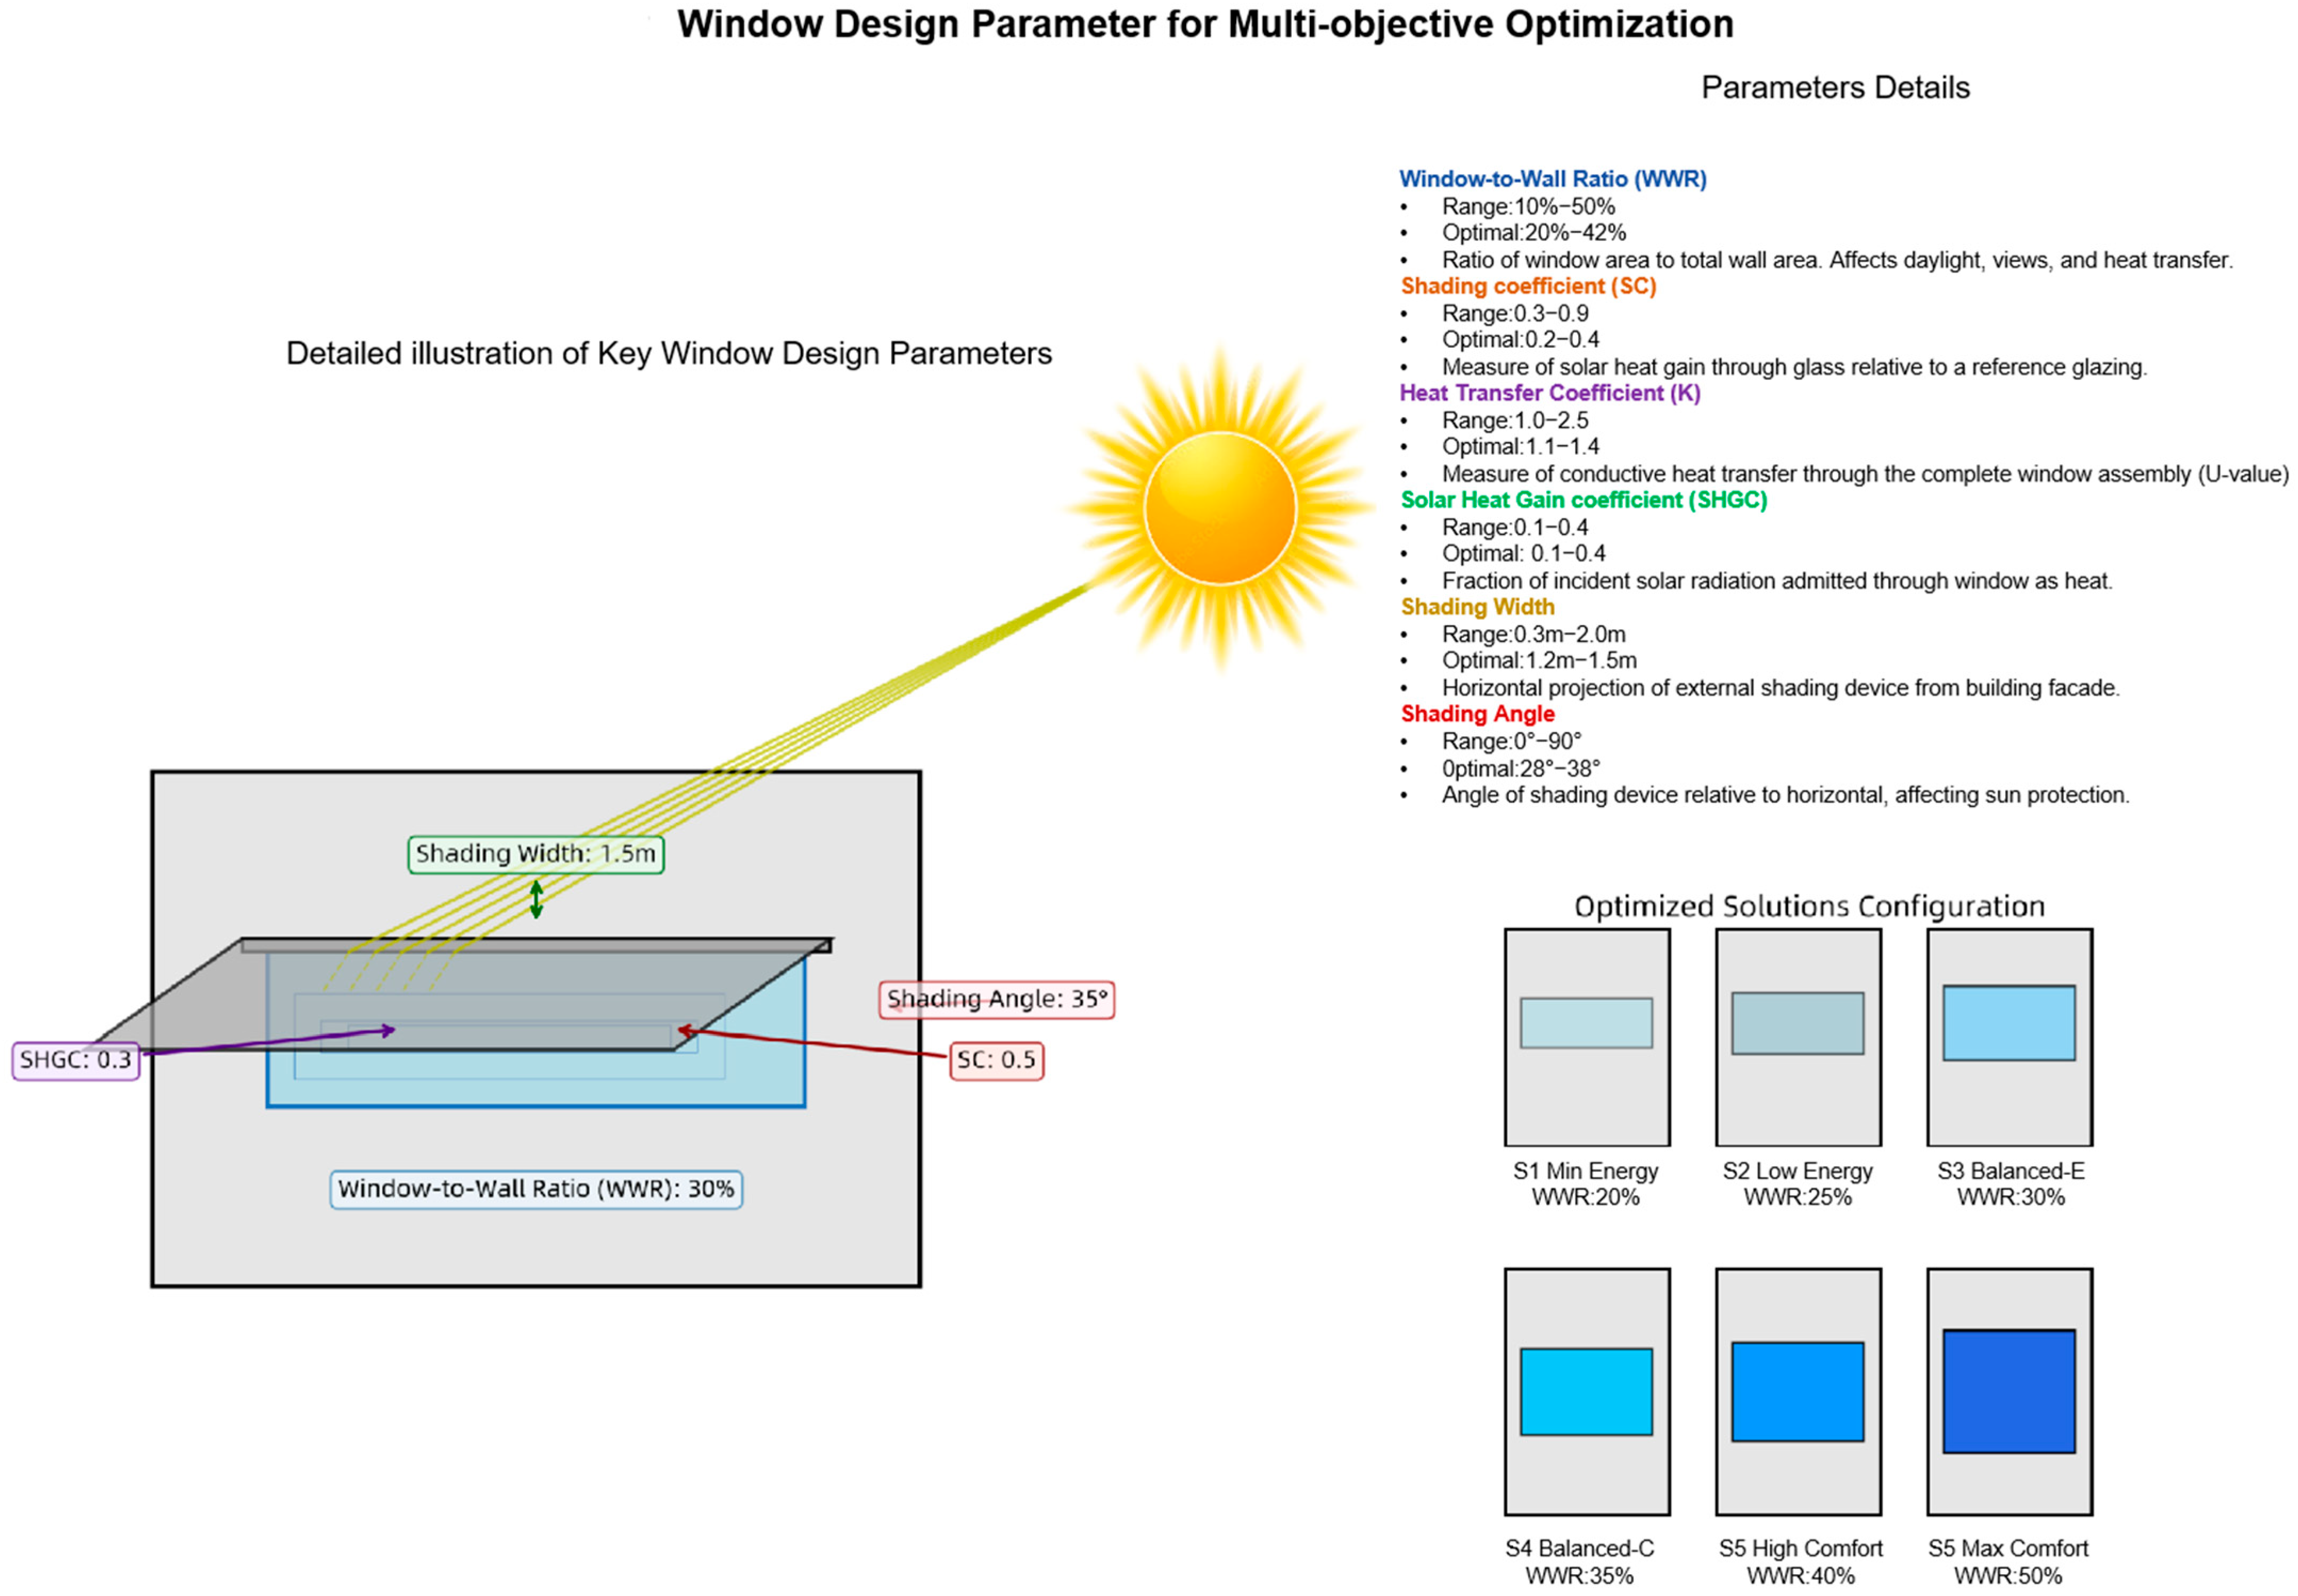
Key window design variables, including window-to-wall ratio (WWR), shading coefficient (SC), solar heat gain coefficient (SHGC), thermal transmittance (K), shading width, and shading angle, were investigated in this study. These variables were selected based on their significant impact on energy efficiency and thermal comfort, and their relevance to building energy codes within the physical construction of a typical school in Guangzhou (Figure 6 and Table 1).
WWR (0.1 to 0.5) generally can control the energy loss, natural lighting, and natural ventilation from the indoor environment, which can significantly avoid being the waste of energy while the indoor lighting is enough [70].
SC (0.2 to 0.8) is the fraction of solar heat gain transmitted using shading devices (limiting solar radiation makes the cooling load less) [71].
SHGC (0.1 to 0.4) measures the proportion of solar radiation admitted through the window as heat, influencing cooling demand and internal temperature, thereby affecting both energy efficiency and thermal comfort [72].
K (1.0 to 2.5 W/(m2·K)) characterizes the thermal insulation properties of the window system, with a lower K value enhancing energy efficiency by reducing heat transfer [72].
Shading Width (0.3 to 2.0 m) measures the horizontal projection length of external shading devices, which is crucial for controlling solar gain and optimizing daylight availability [73].
Shading Angle (0° to 90°) adjusts the angle of shading devices to optimize solar protection throughout the year, depending on their seasonal effectiveness in blocking solar radiation [73].
Table 1. Window Design Parameters: Physical Meaning, Design Impact, and References.
ParameterPhysical MeaningDesign ImpactReference
Window-to-Wall Ratio (WWR)Ratio of window area to total wall area.Affects daylight, views, ventilation, and heat transfer.Sharma et al., 2022 [74]; Wang et al., 2022 [75]
Shading Coefficient (SC)Fraction of solar heat gain transmitted through shading device.Controls solar gain, reduces cooling loads, and enhances shading efficiency.Seyedzadeh et al., 2018 [76]
Solar Heat Gain Coefficient (SHGC)The fraction of solar radiation admitted through the window as heat.Influences cooling energy demand, impacts indoor temperature.Kalmár, F. 2020 [77]; Alhuwayil et al., 2019 [78]
Heat Transfer Coefficient (K)Measure of the total window system’s heat transmission performance.Affects building energy efficiency and thermal insulation.Alhuwayil et al., 2018 [78]
Shading WidthHorizontal projection length of the external shading device.Provides sun protection, modifies daylight, and reduces solar heat gain.Tan et al., 2024 [79]
Shading AngleAngle between the shading device and the horizontal plane.Optimizes sun protection seasonally, impacts view and daylight.Mazzetto et al., 2025 [80]
The optimization framework was carefully designed to navigate the trade-offs between energy efficiency and thermal comfort within the context of conventional school buildings located in hot-humid environments. The selected parameters enabled the efficient exploration of this balance within the inherent constraints of such building typologies.

3.1.3. Constraints

The optimization process incorporated a set of constraints to ensure the technical feasibility and practical applicability of the generated solutions. These constraints were formulated based on national and local building codes, design standards, and practical experience gained from the construction of educational facilities in Guangzhou.
The multi-objective optimization was subjected to the following constraints:
This is example 2 of an equation:
0.10 ≤ WWR ≤ 0.50
0.20 ≤ SC ≤ 0.80
1.0 ≤ K ≤ 2.5 W/(m2·K)
0.1 ≤ SHGC ≤ 0.40
0.30 m ≤ Shading Width ≤ 2.0 m
0° ≤ Shading Angle ≤ 90°
TC ≥ 50%
Among these, WWR represents the window-to-wall ratio, SC represents the shading coefficient, K represents the thermal conductivity coefficient, SHGC represents the solar heat gain coefficient, and TC represents the annual thermal comfort time percentage.
Constraints were directly integrated into the optimization process using Grasshopper/Wallacei in conjunction with the EnergyPlus simulation platform, ensuring that the evolutionary algorithm generated only feasible solutions. These constraints were crucial for balancing technical specifications with practical applications, ensuring that designs met Guangzhou’s climatic demands and adhered to relevant building standards (Table 2).

3.2. Simulation Results Verification and Case Analysis

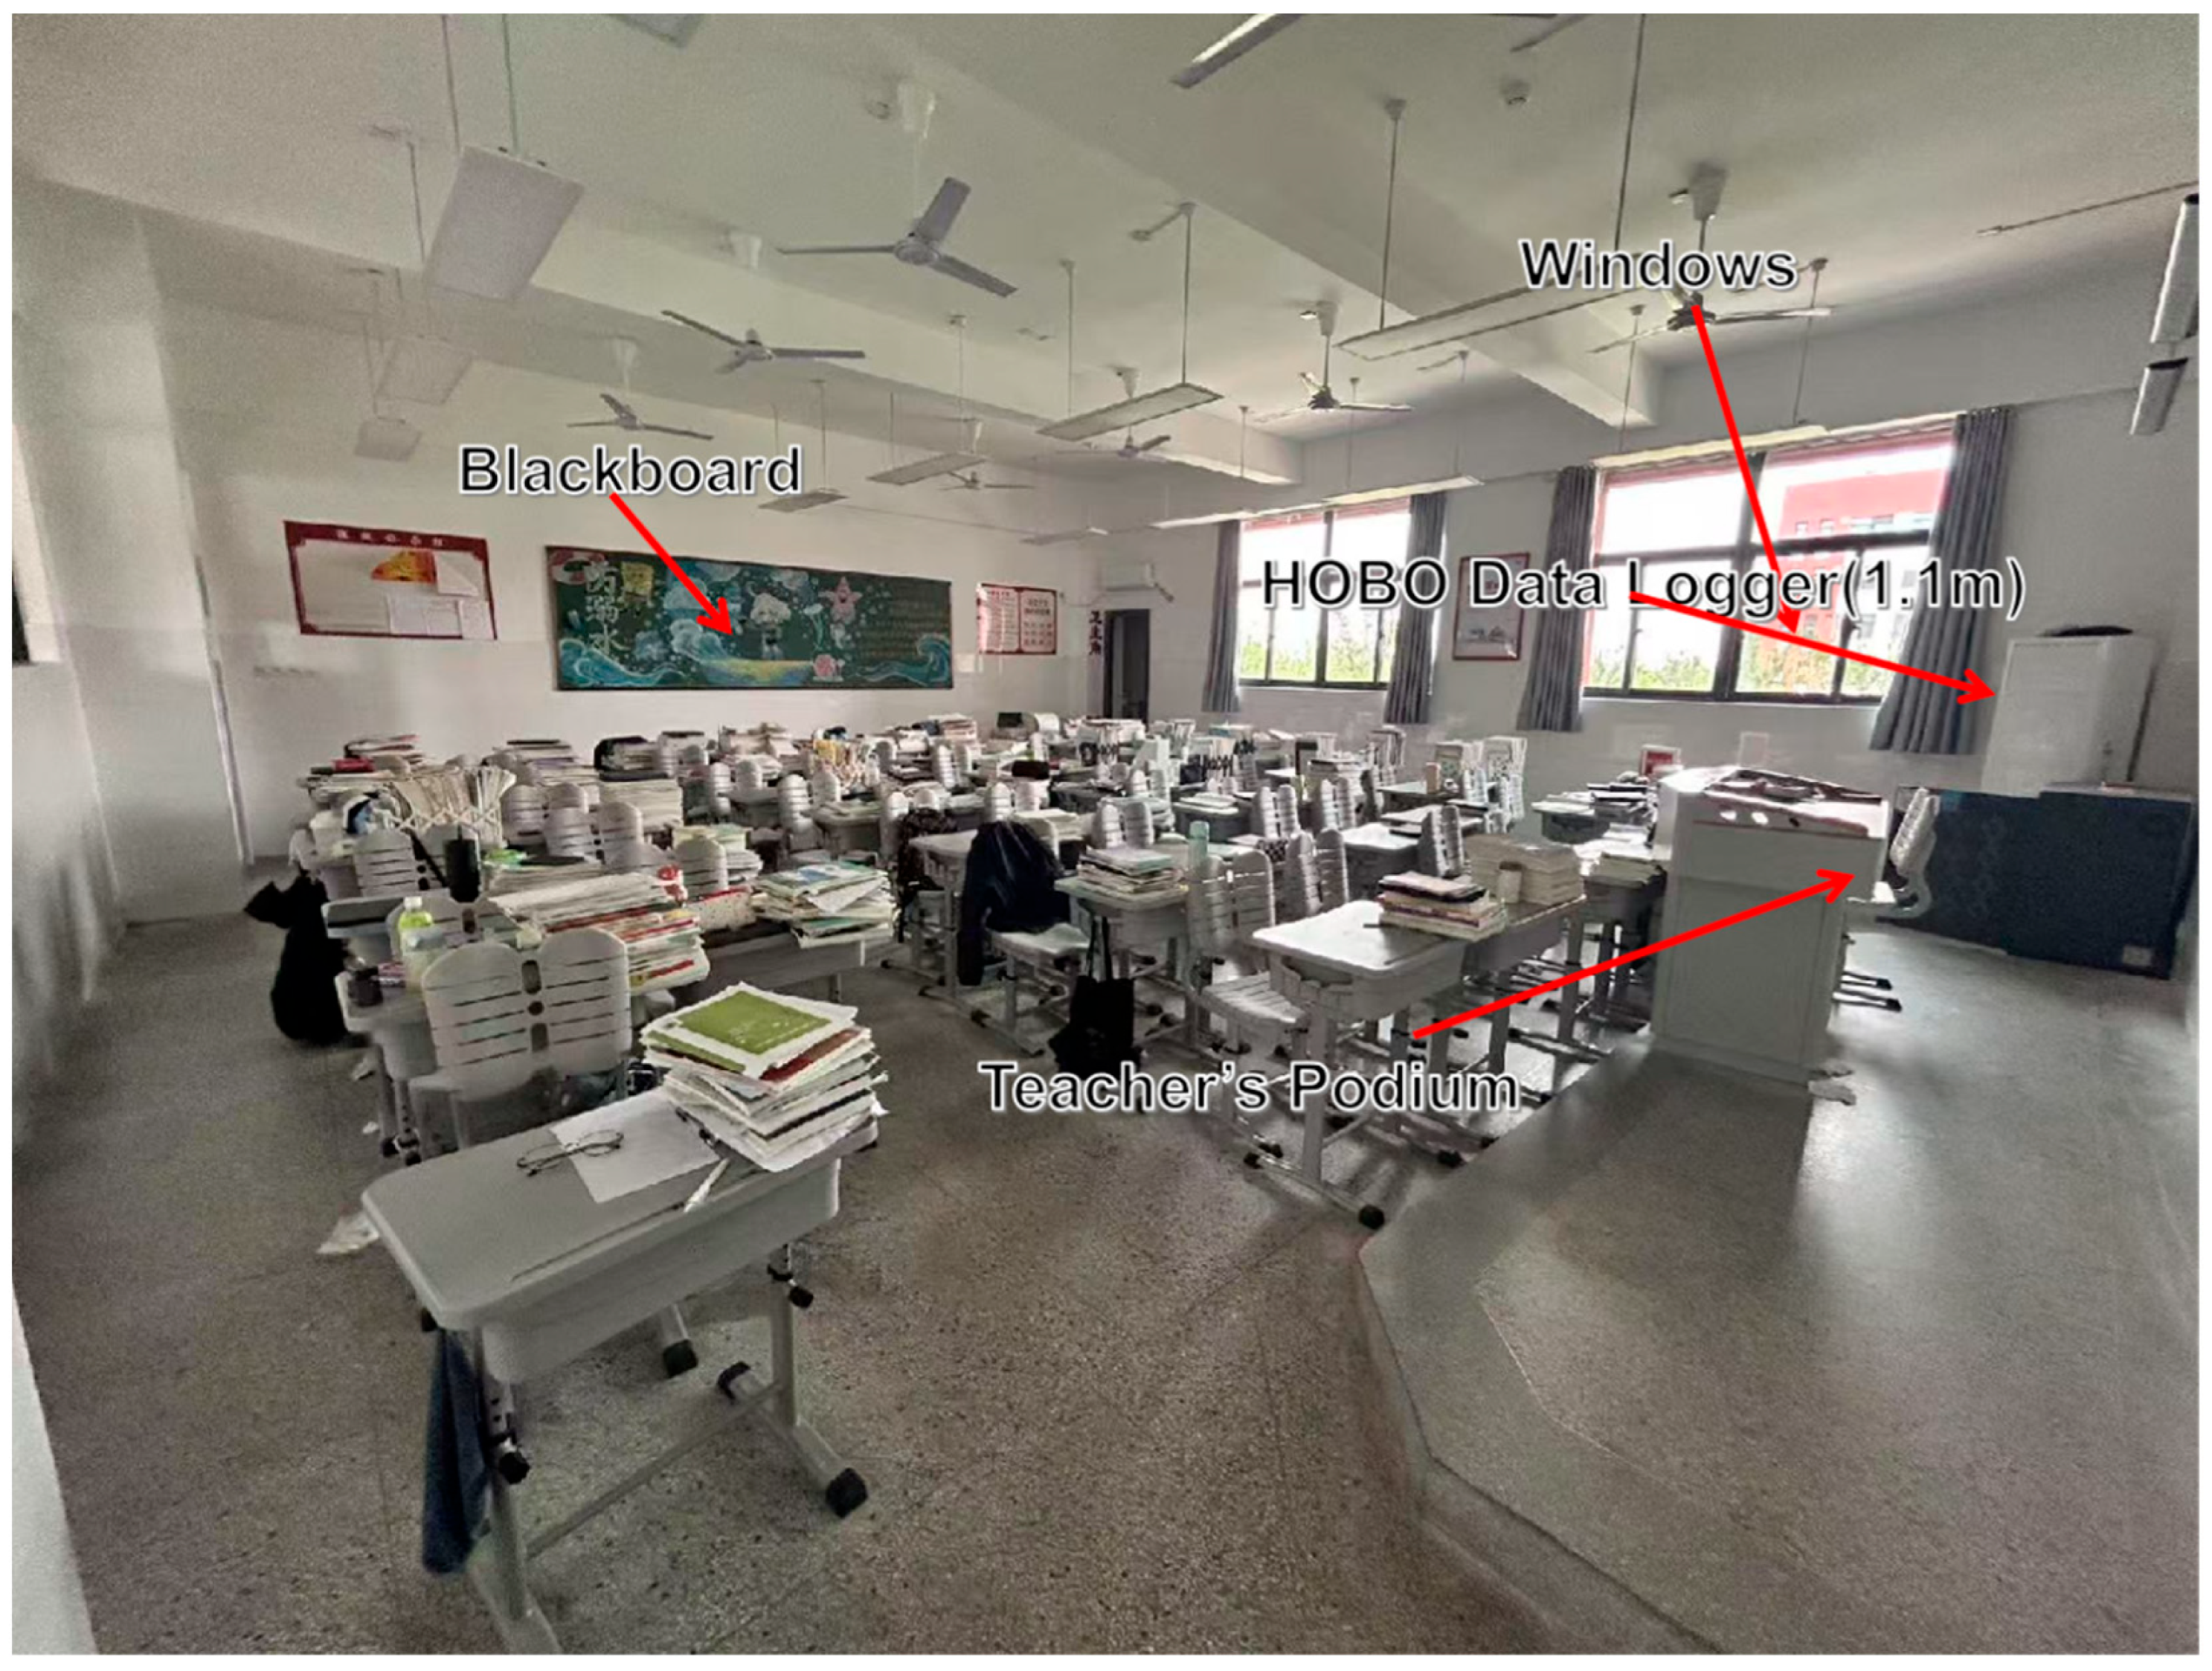
To validate the simulation results from the multi-objective optimization framework, a case study was conducted on a representative school building in Guangzhou’s Huadu District. Indoor environmental parameters, such as temperature and relative humidity, were measured and compared with the simulation data. Measurements were taken during typical summer and winter weeks using a HOBO U12-015 Data Logger (Onset Computer Corporation, Bourne, MA, USA), positioned 1.1 m above the floor, with data recorded every 5 min. Meteorological data from the China Meteorological Administration’s Typical Meteorological Year (TMY) dataset were used as input for the simulation model (Table 3).
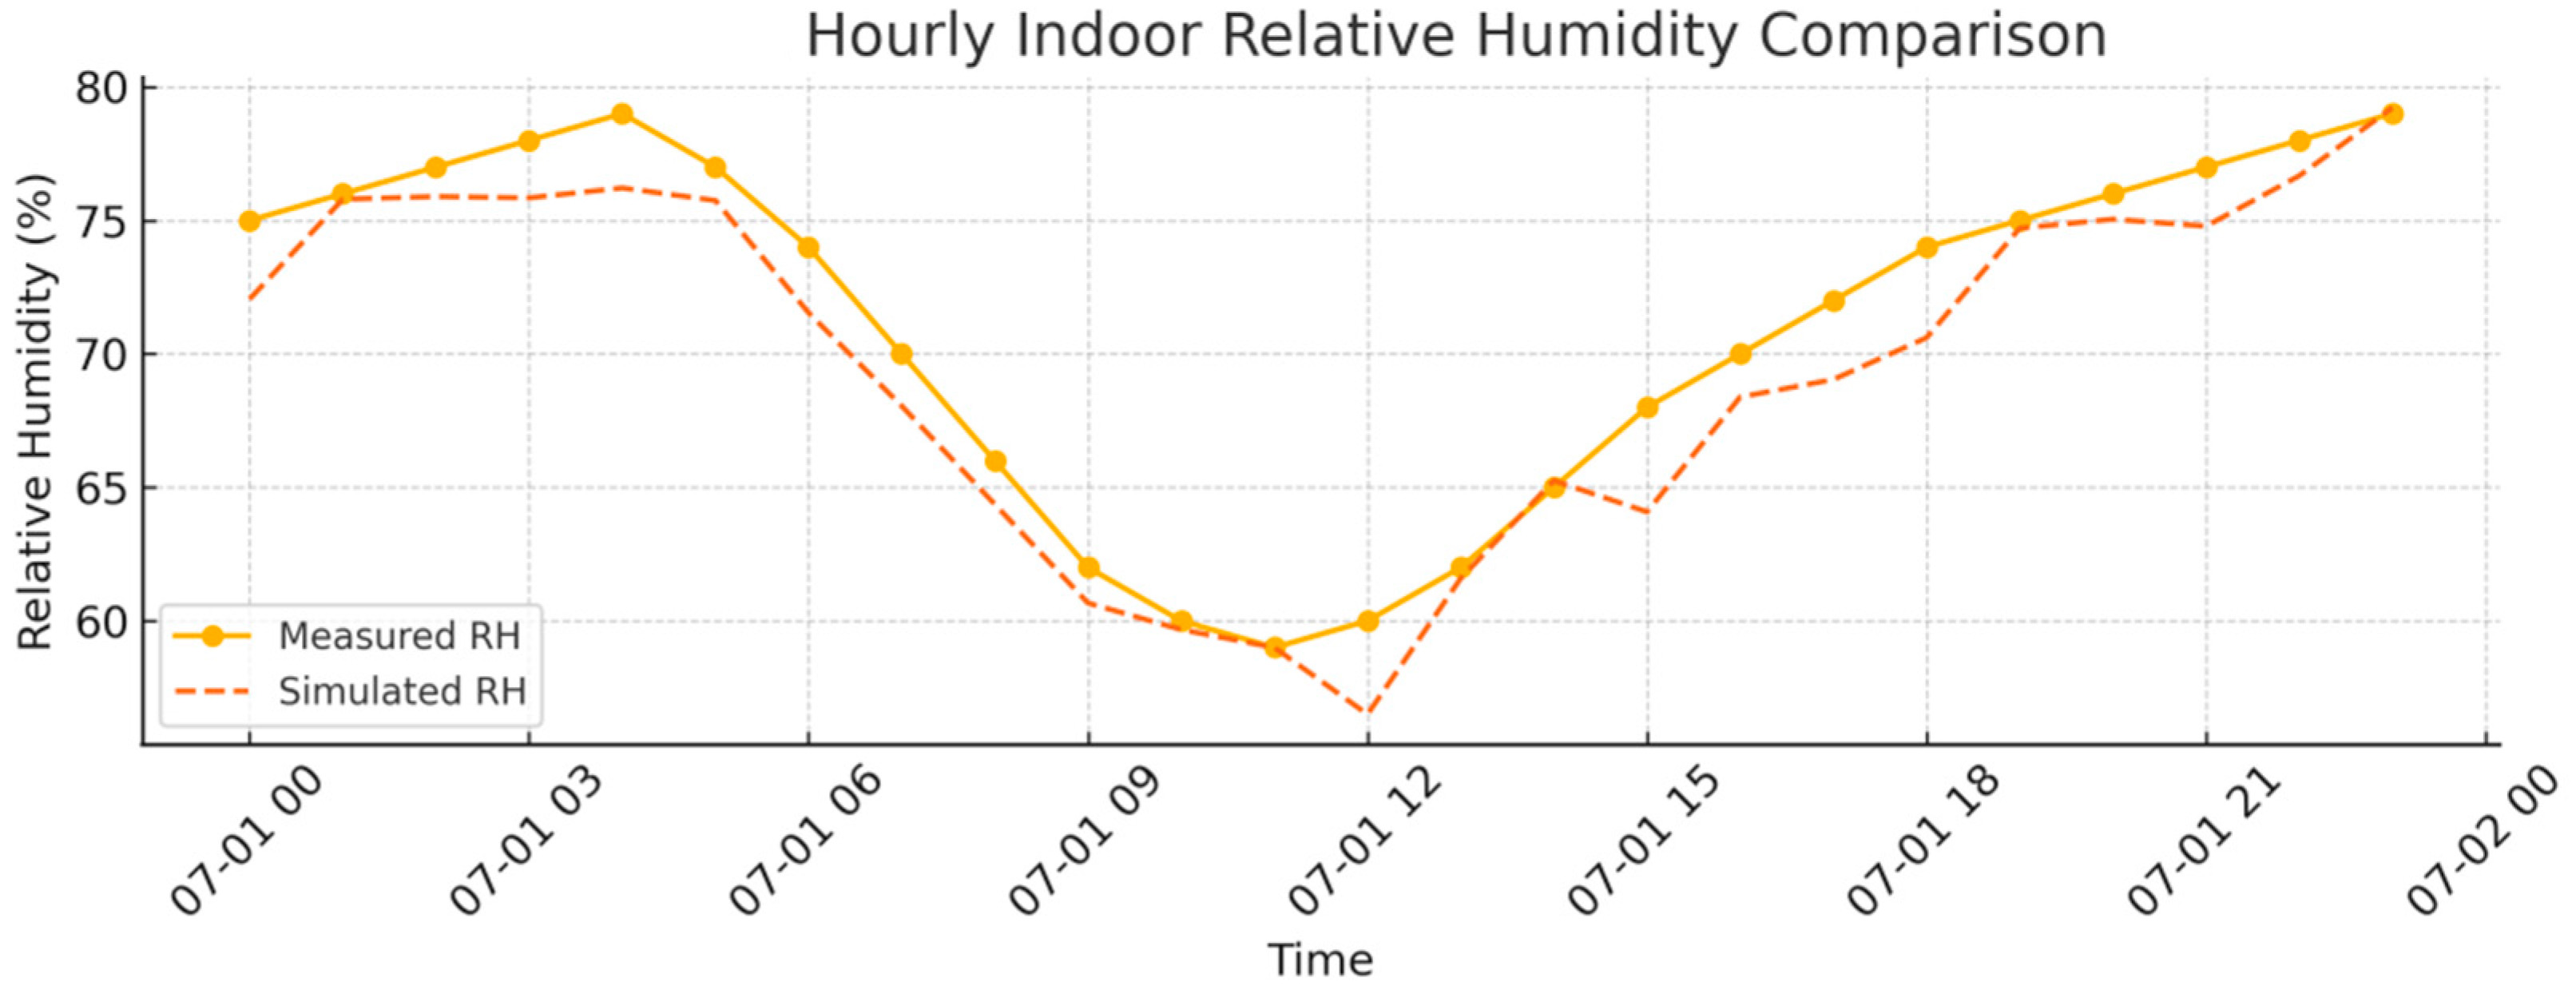
Figure 7 illustrates the layout of the monitored classroom and sensor deployment, with the HOBO U12 Data Logger placed near the windows to record indoor temperature and relative humidity. Data collected during typical summer and winter weeks were compared with simulation outputs to validate the model, which used meteorological data from the China Meteorological Administration’s Typical Meteorological Year (TMY) dataset. Figure 8 and Figure 9 compare hourly temperature and relative humidity between simulations and measurements, revealing strong concordance with slight deviations during peak afternoon temperatures and peak humidity hours.
This validation study robustly endorses the use of the multi-objective optimization framework and simulation model for predicting indoor climate conditions in school classrooms. The results affirm the model’s effectiveness in designing energy-efficient windows that maintain thermal comfort in hot-humid environments.

3.3. Multi-Objective Optimization Results

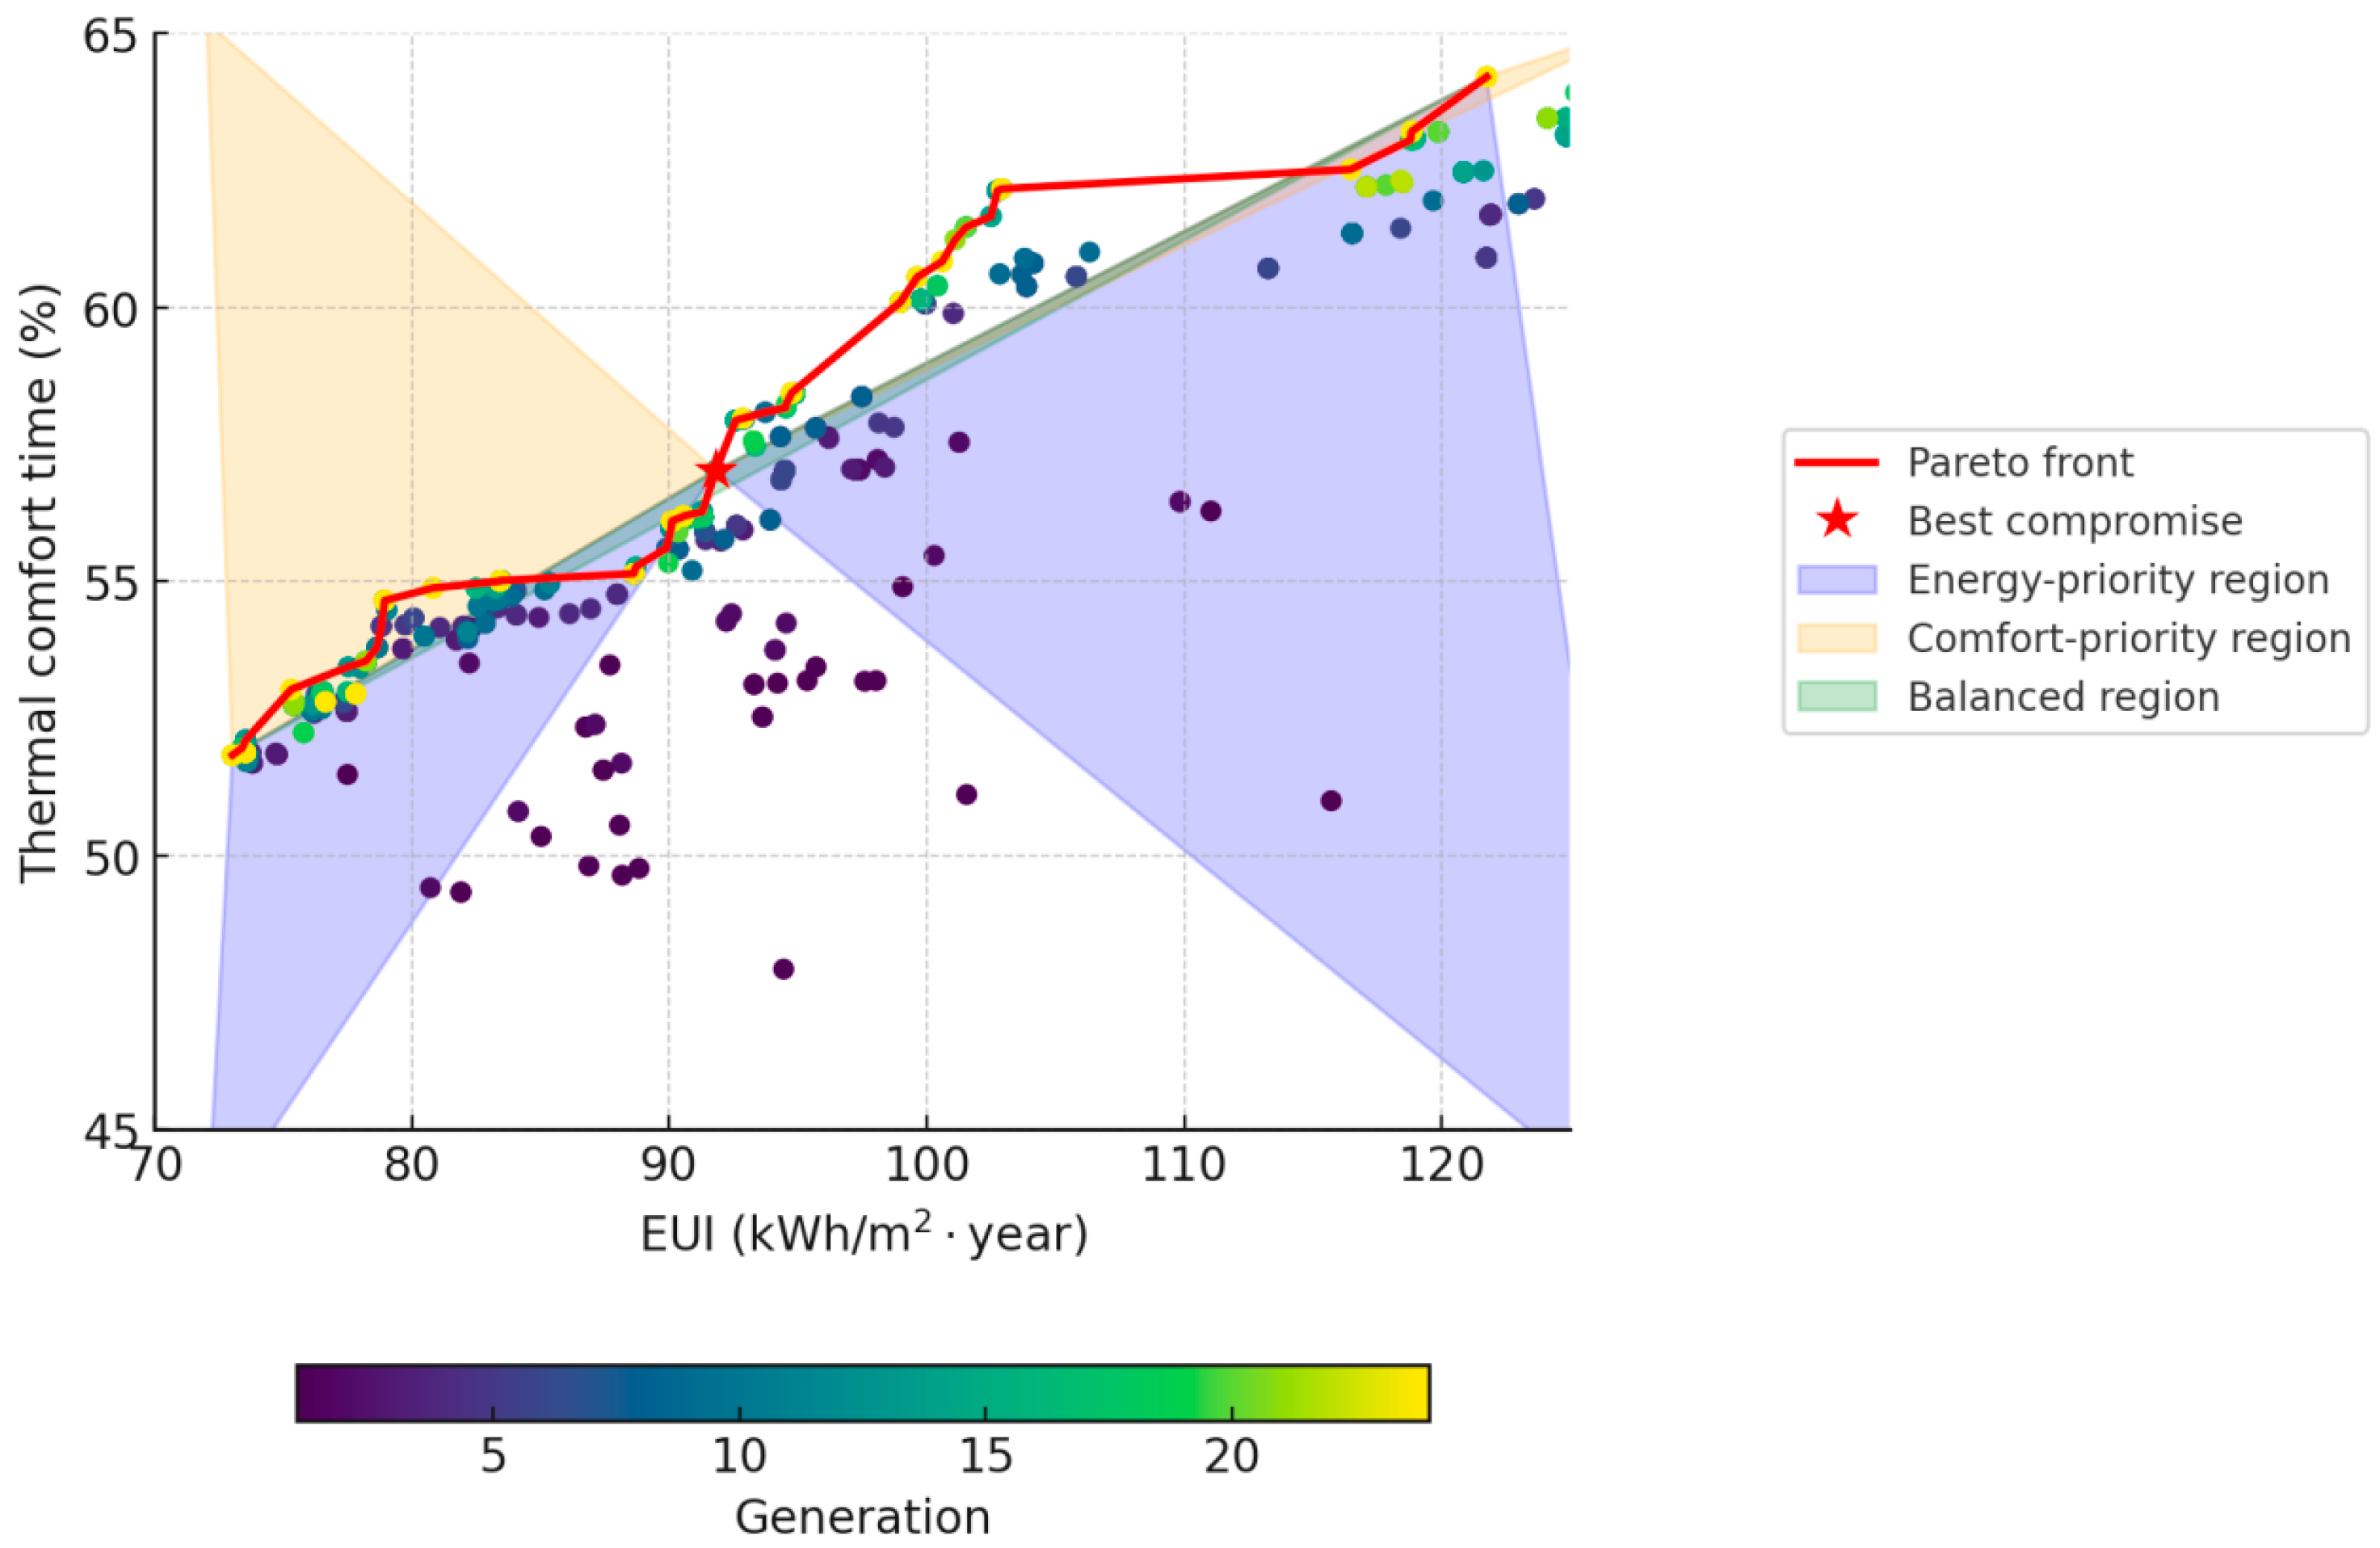
The current research utilizes a multi-objective optimization framework, leveraging the NSGA-II algorithm and EnergyPlus simulation, to balance energy use intensity (EUI) and thermal comfort time ratio (TCTR) for school buildings in a hot-humid climate. By systematically adjusting 1000 distinct window design configurations, the optimization process generated 70 Pareto-optimal solutions, effectively illustrating the inherent trade-offs between energy efficiency and thermal comfort. The results reveal a non-linear relationship between these two objectives, whereby improvements in one often result in a corresponding decrease in the other.
To facilitate the practical implementation of the Pareto set, we establish recommended parameter ranges based on Pareto-optimal solutions. For each variable in the window design, we present (1) the complete range observed across the Pareto front (minimum to maximum) and (2) the interquartile range (IQR, 25th to 75th percentile), which signifies the middle 50% of Pareto solutions and serves as a robust target for design. Table 4 outlines these ranges and emphasizes the IQR-derived “practical optimum” for designers. Furthermore, we offer three exemplary Pareto configurations (Lowest-EUI, Highest-TCTR, and Balanced) to demonstrate specific design selections for energy-focused, comfort-focused, and compromise solutions, respectively (refer to Table 5).
The Balanced Solution strikes an optimal compromise between the conflicting goals of energy consumption and occupant comfort in educational buildings. This approach is especially beneficial in classrooms, where energy efficiency and thermal comfort are crucial for sustainability. The optimization results underscore the need to balance Energy Use Intensity (EUI) and Thermal Comfort Temperature Range (TCTR) in school building design. The Balanced Solution achieves significant improvements in both energy efficiency and comfort without substantial trade-offs (Figure 10). It ensures minimized energy use while maximizing occupant comfort, in alignment with sustainable building design objectives [93,94].

3.4. Sensitivity Analysis Results

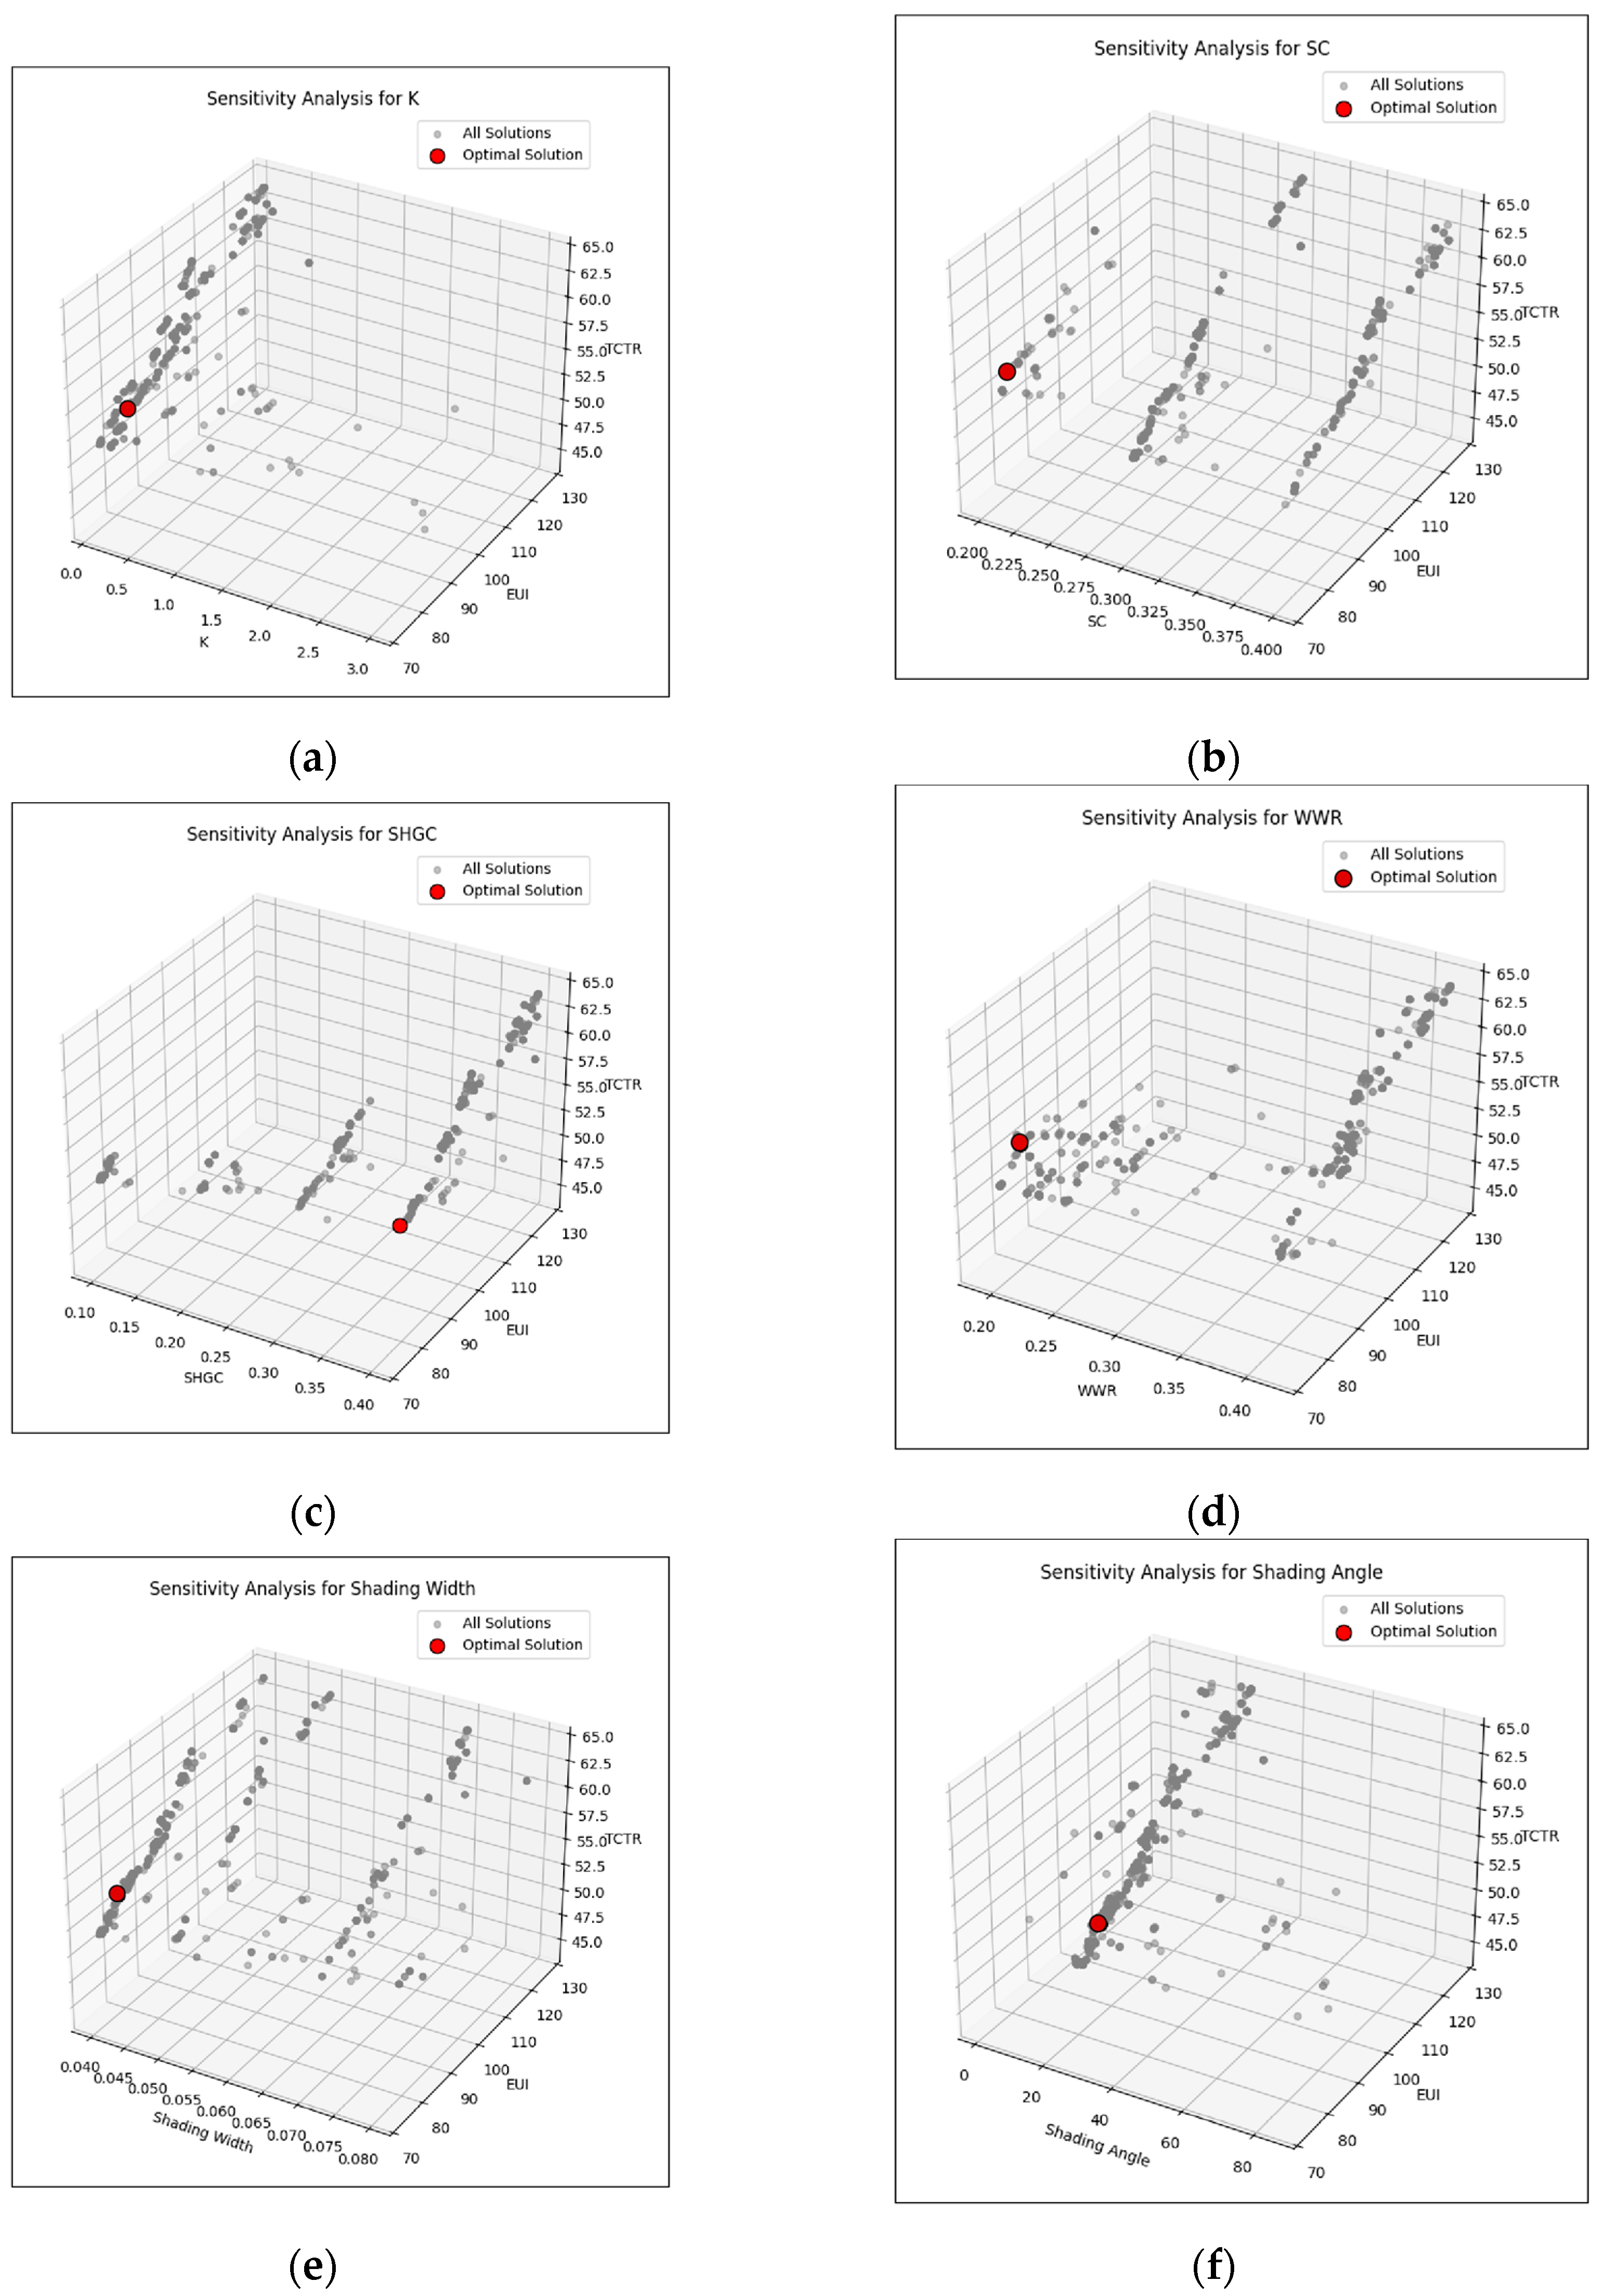
Sobol sensitivity analysis was performed to assess the impact of critical window design parameters on Energy Use Intensity (EUI) and Thermal Comfort Time Ratio (TCTR). Sobol indices were used to quantify each input parameter’s contribution to the variance in the outputs. These indices decompose total variance to evaluate both the direct effect of individual parameters (first-order indices) and the combined effect of parameter interactions (total-order indices) [95].
First-order Sobol indices indicate that WWR and SHGC significantly impact EUI and TCTR, underscoring their importance in energy-efficient and thermally comfortable design. Additionally, WCOSI results reveal that the relationship between WWR and SC substantially affects EUI and TCTR.
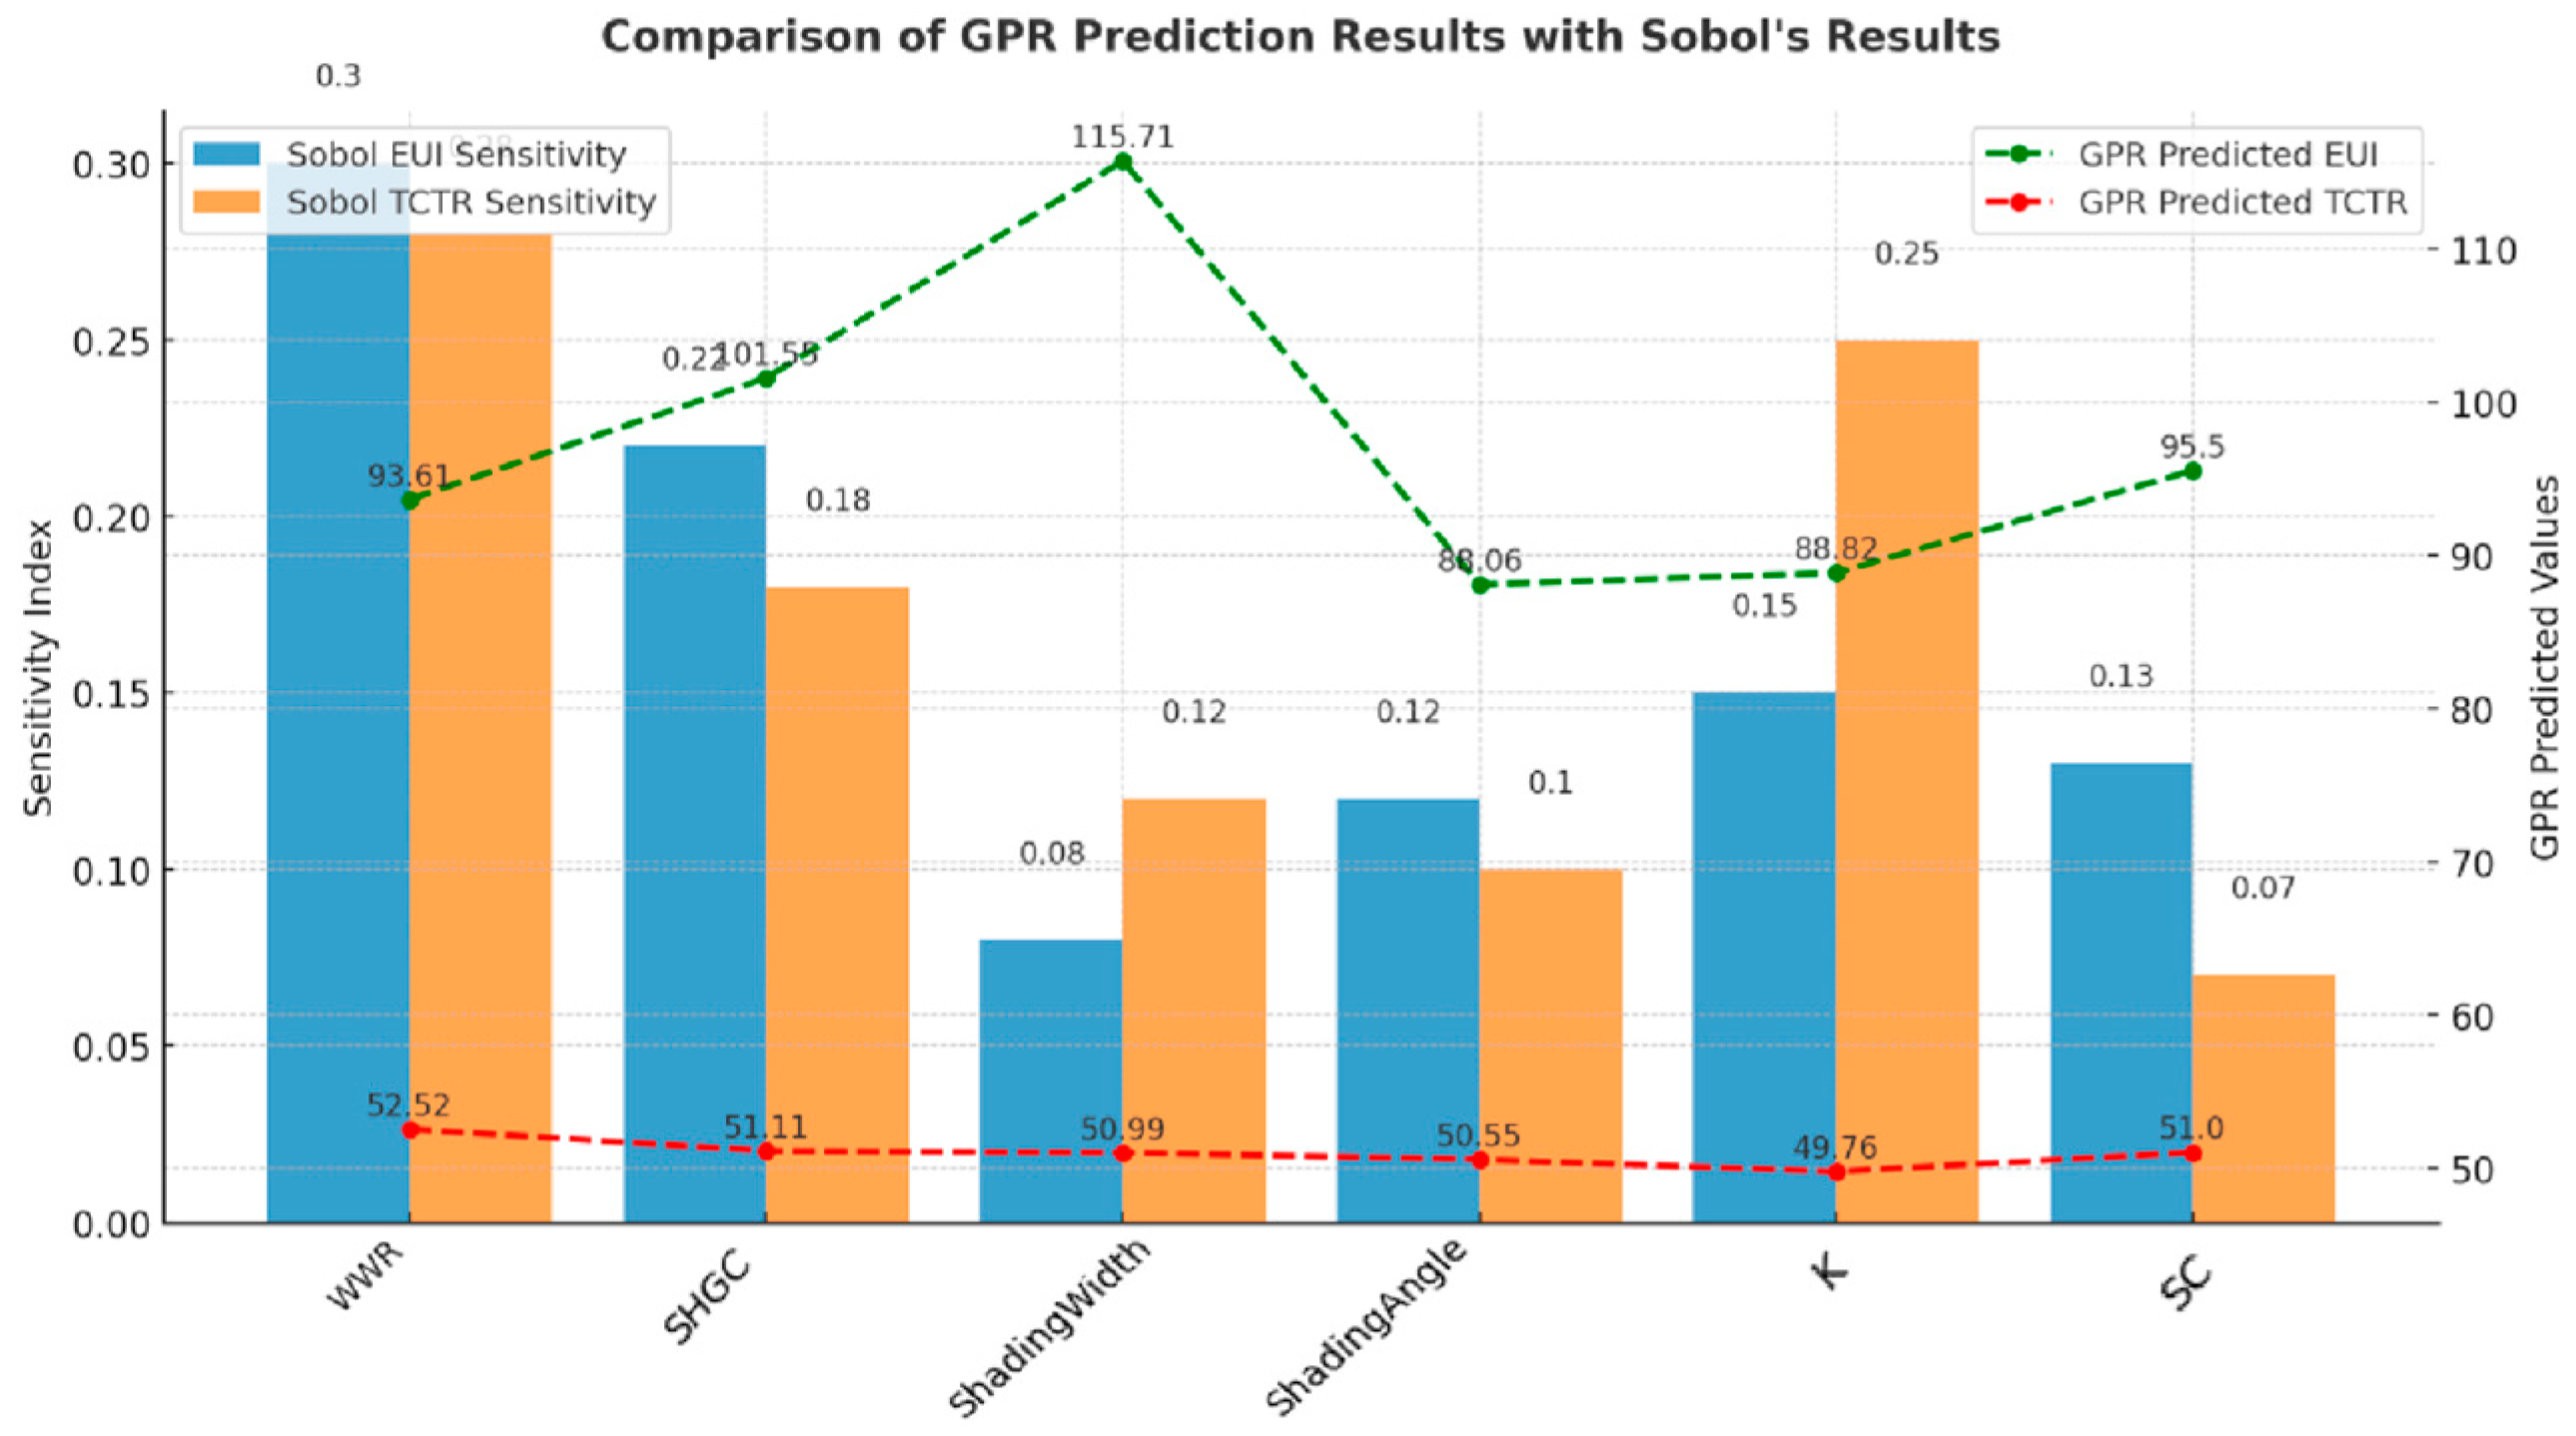
According to the Sobol sensitivity analysis, as shown in Figure 11, WWR is the most important independent factor for EUI and TCTR of the building, followed by the SHGC. In particular, WWR and SHGC explain 28.1% and 23.7% of the total EUI and TCTR variance, respectively. These results emphasize each variable’s effective contribution to both energy saving and thermal comfort in the design of school buildings.
The Sobol sensitivity analysis revealed that the Window-to-Wall Ratio (WWR) and Solar Heat Gain Coefficient (SHGC) are the most influential factors in determining both Energy Use Intensity (EUI) and Thermal Comfort Time Ratio (TCTR). The potential of these aspects for the building’s energy demand and the well-being of the occupants makes it essential to consider these aspects with the general energy optimization problem. More precisely, WWR affects the daylighting and ventilation cooling penetration, while SHGC addresses the overheating by the solar gain aspect of windows. Small variations in these parameters can result in significant differences in building energy performance as a whole, thus highlighting the need for a suitable optimization strategy. Moreover, the investigation prompts the interdependence among the considered factors, especially WWR and SC, which emphasize the importance of a more holistic optimization of the building envelope. These identified factors can help inform designer choices in support of building designs that maximize energy efficiency while also enabling thermal comfort in hot-humid school buildings. These results offer practical advice to architects and designers on the balance between occupant well-being and energy consumption.

3.5. Machine Learning GPR Verification

Gaussian Process Regression (GPR) was used to estimate EUI and TCTR based on building design parameters. This probabilistic model is particularly useful in optimization scenarios where simulation evaluations are time-consuming. GPR accelerates model predictions by approximating the simulation model and provides associated uncertainty estimates, making it well-suited for large-scale optimization problems [96].
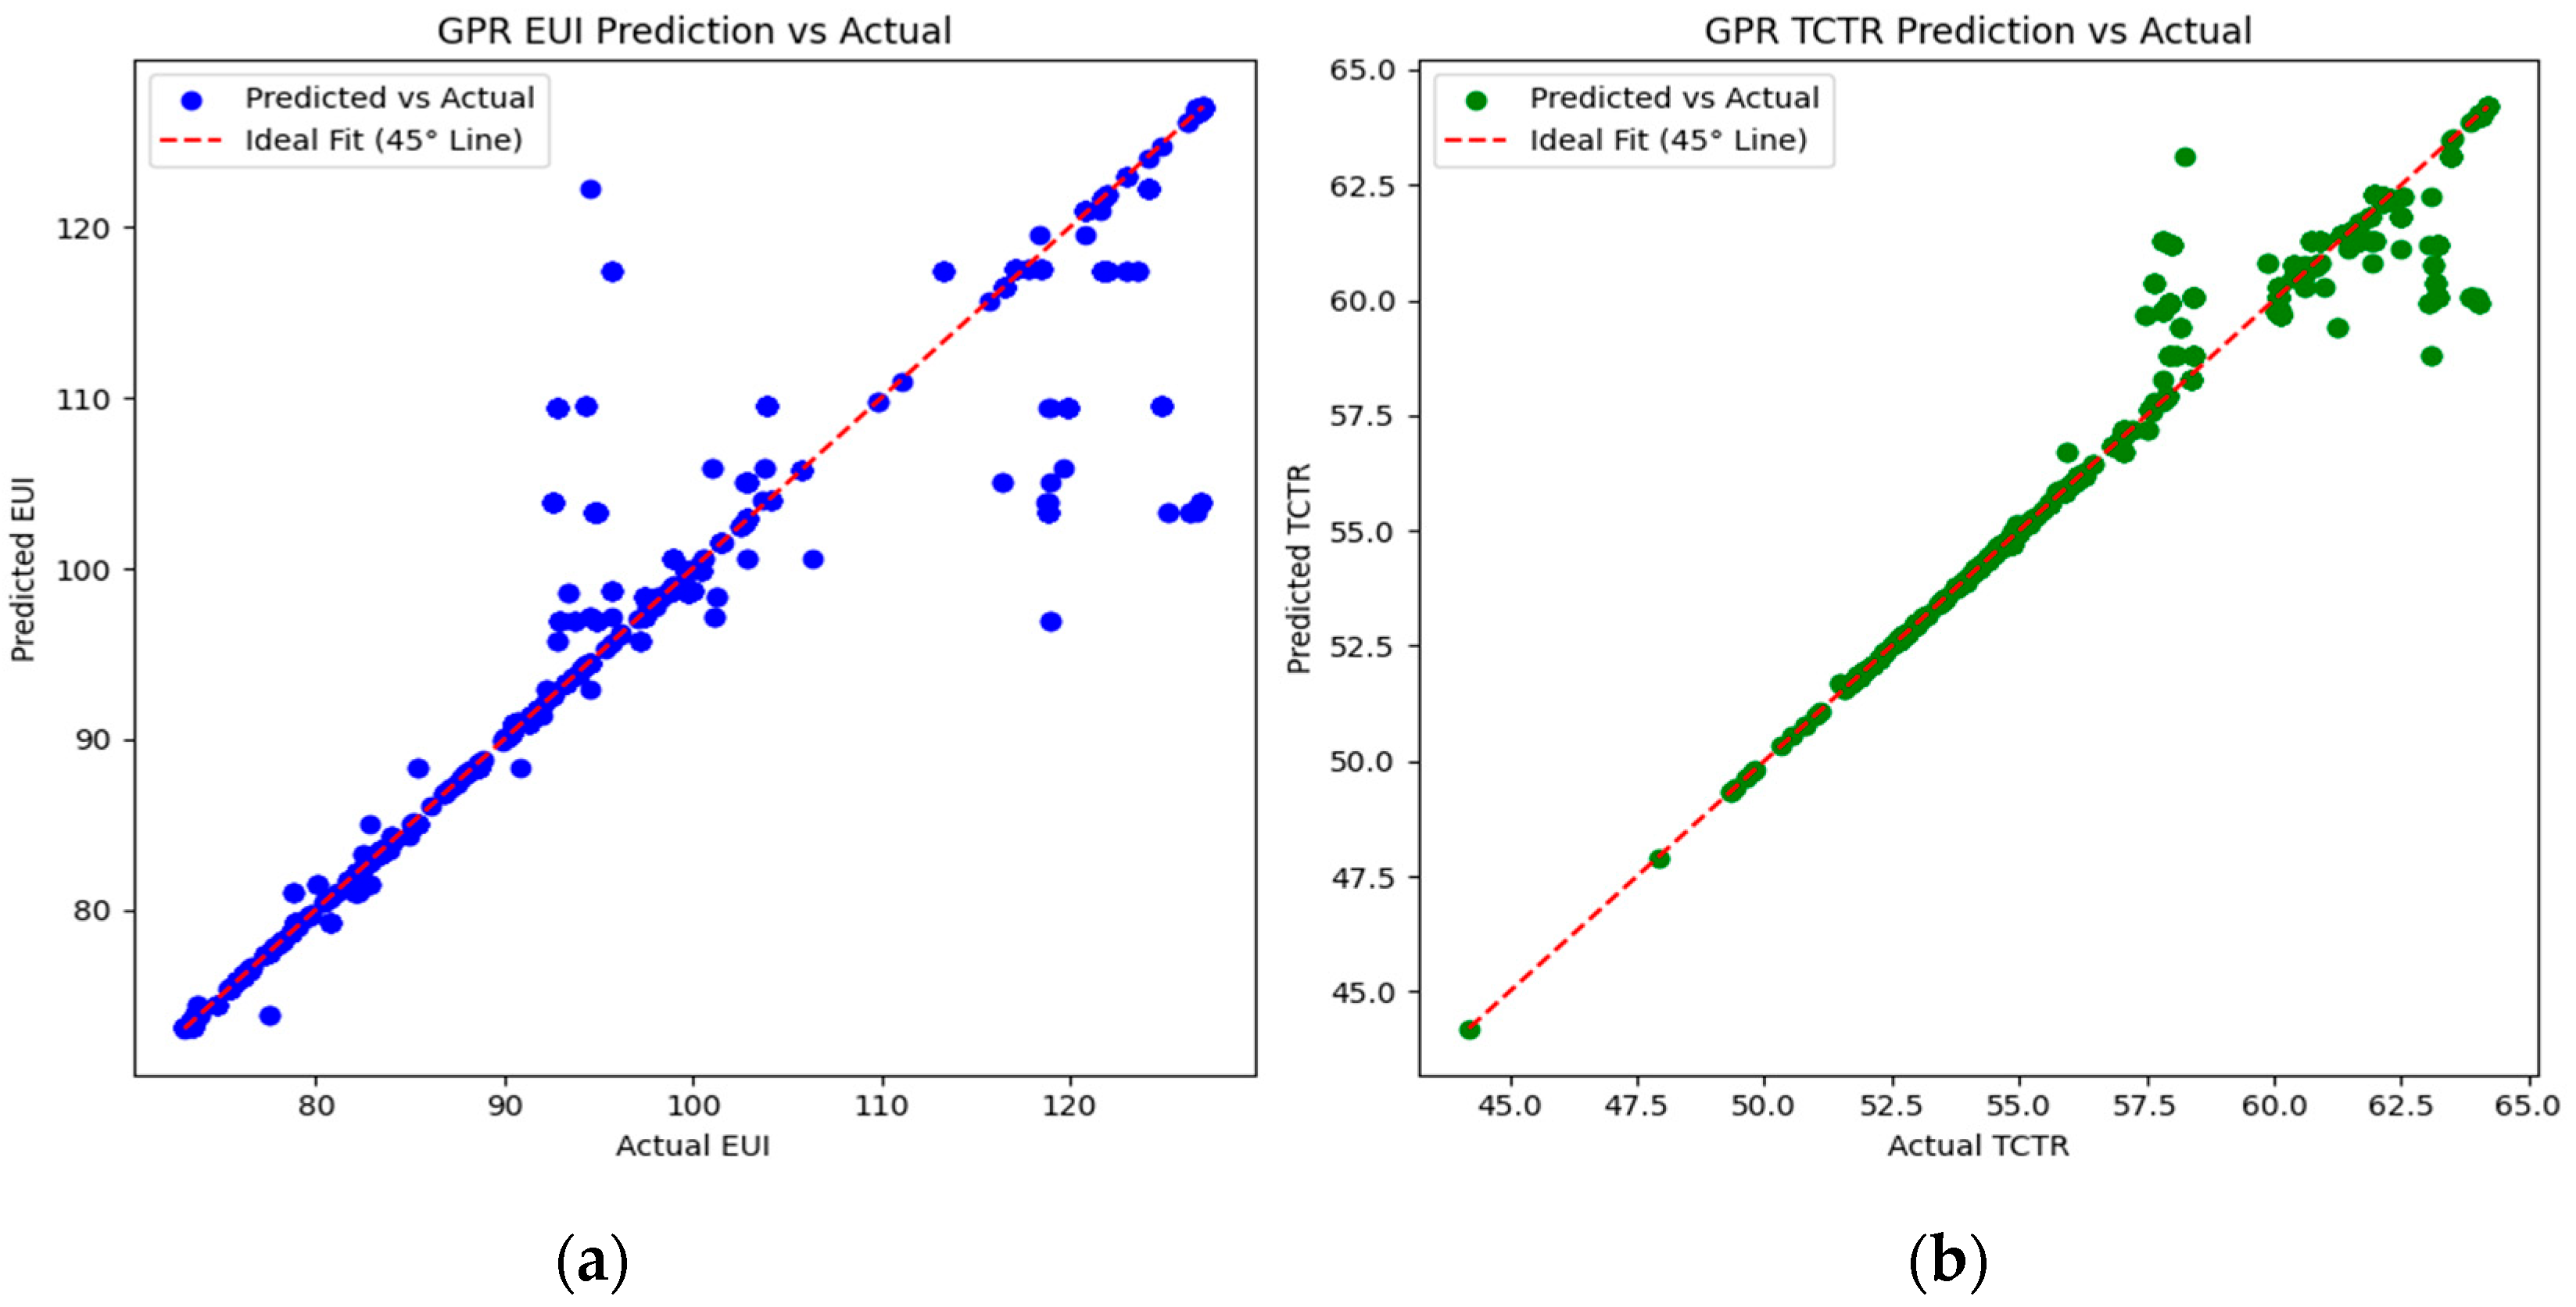
The goodness of fit for the GPR model was validated using R-squared values comparing predicted and measured EUI and TCTR. Validation showed the model’s sensitivity, with R2 values of 0.91 for EUI and 0.95 for TCTR, indicating strong predictive capabilities. Additionally, low RMSE values for both metrics confirmed the GPR model’s robust performance in estimation (Table 6).
The GPR model was validated with a test dataset, as shown in the residual plot in Figure 12, which demonstrates strong alignment between predicted and actual values, indicating no significant bias in the model’s predictions.
SHAP analysis quantified the contribution of each input parameter to the model’s predictions, further validating the model [97]. The SHAP values corroborated the findings of Sobol sensitivity analysis, identifying the Window to Wall Ratio (WWR) and the Solar Heat Gain Coefficient (SHGC) as the most influential parameters for both Energy Use Intensity (EUI) and Total Carbon Emissions (TCTR). These results emphasize the importance of these parameters in the optimization process.
The validated GPR model effectively predicts both EUI and TCTR. The alignment of SHAP analysis with Sobol sensitivity analysis reinforces the GPR model’s reliability for determining optimization strategies. These results confirm GPR as a suitable method for predicting building performance within an MOO framework, enabling faster and optimal evaluations during the design phase.

4. Discussion

4.1. Optimization Results

4.1.1. Optimization of Window Design Parameters

The Baseline Classroom exhibited an EUI of 101.55 kWh/m2·year and a TCTR of 51.11%. Comparison with optimized solutions derived from the multi-objective optimization framework highlights a direct trade-off between energy consumption and thermal comfort, underscoring the challenge of balancing these often-conflicting objectives.
The performance of the Balanced Solution consequently brings a saving in energy of 6.7% and an enhancement of comfort by 14.3% as can be seen in Table 7. This option is also ideal when it comes to educational institutions (such as schools) to help maintain energy costs and comfort.
The analysis reveals non-linear trade-offs between energy efficiency and thermal comfort, with improvements in one objective often resulting in trade-offs in the other. Therefore, achieving an optimal balance is crucial. The Balanced Approach effectively manages these trade-offs, offering substantial gains at minimal cost. This approach is particularly beneficial for schools, where thermal comfort is as important as energy efficiency throughout the building’s lifespan.
The findings quantify the impact of WWR and SHGC on both EUI and TCTR, highlighting their significance in optimizing building energy performance. WWR influences energy demand by regulating heat gain, while SHGC plays a key role in managing daylight and solar heat gain. Both factors are crucial for indoor thermal comfort and must be carefully balanced to achieve both energy savings and occupant satisfaction in hot-humid climates [98].

4.1.2. Trade-Off EUI and TCTR

The MOO analysis reveals a critical trade-off between EUI and TCTR. Prioritizing thermal comfort often reduces energy efficiency, while prioritizing energy efficiency typically sacrifices thermal comfort. The nonlinearity of the two objectives highlights the need to carefully balance their relative importance based on the specific goals of the project (Figure 13).
In educational buildings, where thermal comfort and energy performance are highly demanding, the Balanced Solution provides a practical approach. This method enables designers to consider both energy consumption and thermal comfort as equally important aspects, achieving sustainability and comfort with minimal trade-offs. The optimization analysis helps designers recognize the importance of optimizing both energy performance and thermal comfort through variations in the window-to-wall ratio (WWR) and solar heat gain coefficient (SHGC). Particularly applicable to schools, the Balanced Solution significantly improves both energy use and comfort, while minimizing the conflict between the two.

4.2. Sensitivity Index Analysis

The Sobol sensitivity analysis highlighted the window design parameters most affecting EUI and TCTR. It is found that together with SHGC, WWR influences the building cooling and thermal comfort the most, and it should be optimized at the end of the optimization process (Figure 14).
A balance of energy efficiency and comfort might be struck by optimal WWR and SHGC. The WWR is the key factor determining energy consumption due to solar gain, and the SHGC specifies the level of thermal comfort by determining the heat gain transmitted through the building. Also, the connection between WWR and SHG is significant; simultaneous optimization of both WWR and SHG can improve the overall performance of the building.
The Sobol analysis is consistent with the GPR results, and it validates the significance of WWR and SHGC for minimizing EUI and TCTR. The results provide useful insights for designers to focus on critical parameters in designing school building windows for hot-humid climates.

4.3. GPR Learning Validation

Gaussian Process Regression (GPR) was used to predict Energy Use Intensity (EUI) and evaluate discomfort hours (TCTR) based on optimization parameters. This approach provides a computationally efficient method for forecasting without relying on extensive simulations, facilitating faster optimization [99].
The performance of the GPR model was validated by comparing its predictions with actual EUI and TCTR data. The model demonstrated strong predictability, with R2 values of 0.91 for EUI and 0.95 for TCTR. Furthermore, the low Root Mean Square Error (RMSE) for both metrics further supports the model’s effectiveness (Figure 15).
SHAP analysis further confirmed that WWR and SHGC should be considered the main factors affecting both EUI and TCTR, which aligns with the results from the Sobol sensitivity analysis. This consistency emphasizes the importance of these parameters in the optimization process.

4.4. Practical Implications and Physical Applications

This research provides practical guidelines for architects and engineers designing schools in hot-humid climates. The solution process effectively optimizes the balance between energy savings and thermal comfort through the control of WWR and SHGC.
The window design of a school building can be optimized using linear programming to reduce energy demand and improve thermal comfort. Specifically, adjusting the Window-to-Wall Ratio (WWR) and Solar Heat Gain Coefficient (SHGC) according to the hot-humid climate of regions like Guangzhou can significantly reduce cooling loads while ensuring occupant comfort. This model can be scaled to a school-wide level and provides a long-term solution for energy-efficient design.
The framework outlined in this study is adaptable to various building types and climates, aiding the global effort to reduce building energy consumption. By integrating multi-objective optimization with advanced simulation tools such as EnergyPlus and NSGA-II, designers can systematically and efficiently explore alternative designs that balance energy efficiency with occupant comfort, addressing both environmental and human-centered objectives.
The study emphasizes three key parameter combinations obtained from Pareto-optimal solutions, offering practical recommendations for school designers in hot-humid climates. These configurations, namely Lowest-EUI (energy-priority), Highest-TCTR (comfort-priority), and Balanced Solution (recommended compromise), present actionable insights for optimizing the balance between energy efficiency and comfort. These findings, outlined in Table 5, signify distinct design priorities: the Lowest-EUI solution aims to minimize energy usage, the Highest-TCTR solution focuses on maximizing comfort, and the Balanced Solution provides an optimal trade-off between the two objectives.
Additional research on multi-objective optimization in educational building design, especially in regions with similar climatic conditions, reinforces the significance of this study. Previous works by Abdul Rahman et al. (2011) [100], Kadi et al. (2021) [101], and Triana et al. (2019) [98] have investigated optimizing building designs for energy efficiency and thermal comfort in tropical and hot-humid climates. These studies highlight strategies such as enhancing natural ventilation, shading, and solar protection. Nonetheless, they often concentrate on passive techniques or specific parameters, creating a gap in comprehensive multi-objective optimization for educational buildings. Our study addresses this gap by incorporating a broader array of design parameters, such as shading width and angle, and explicitly considering the trade-offs between energy efficiency and thermal comfort.
By concentrating on key window design parameters, this study offers a practical tool for improving building performance in hot-humid climates. The findings guide architects and provide a foundation for future research aimed at optimizing building designs to achieve sustainability goals and enhance occupant well-being.

4.5. Limitations

The proposed multi-objective optimization framework demonstrates significant robustness, yet several limitations warrant attention. Primarily, the model is based on a simplified classroom layout with fixed window designs, omitting dynamic facade systems and real-time occupant behavior. Although this simplification reduces computational complexity, it may limit the applicability of the findings to more complex educational buildings or irregularly shaped structures.
The optimization results presented herein might be considered conservative when applied to future climate adaptation designs, as the underlying climate data is derived from the Typical Meteorological Year (TMY) dataset. While representative, this dataset does not fully capture the potential impacts of extreme weather events or long-term climate change.
The study does not consider the potential influence of climate change on the efficacy of the optimized window parameters. With the continual shifts in climate patterns, variables such as rising temperatures and heightened occurrences of extreme weather events could impact the functionality of window configurations in the future. For example, elevated temperatures may escalate the need for cooling energy, and varying humidity levels might impact the thermal comfort criteria [102]. Hence, forthcoming research should investigate how climate forecasts could modify the efficiency of existing window parameters and adapt design approaches correspondingly.
Moreover, the model shows considerable promise for worldwide implementation, but its efficacy and flexibility may vary based on climatic factors, construction codes, and user preferences across various locales. The algorithm is particularly suitable for hot and humid environments, where it can tackle the intricate task of optimizing energy efficiency while ensuring thermal comfort. Nevertheless, dissimilarities in climate, as seen in colder areas, may necessitate modifications to the optimization criteria. Additionally, the computational requirements of the algorithm present a constraint for extensive or instantaneous deployment in regions with limited high-performance computing resources.
The methodology outlined in this study extends beyond geographical boundaries, including regions outside China. Although the investigation focuses on school buildings in Guangzhou, the fundamental optimization model is based on universally applicable building physics principles and globally recognized performance standards (e.g., LEED v5 [8], BREEAM v6.0.0 [9]), making it adaptable to similar hot-humid climates found in regions such as Southeast Asia, South America, and coastal Africa. The model’s versatility also permits its extension to diverse building typologies, including hospitals, office buildings, and various public structures. To effectively implement this model in different regions, it is essential to integrate local climatic data, building regulations, and cultural considerations into the framework to ensure successful adaptation and achieve optimal outcomes.
The simulation assumed a uniform activity pattern and consistent device usage, neglecting the variability inherent in real school occupancy and usage. In practice, variations in occupant density, behavior, and interaction can substantially affect thermal comfort and, thus, the accuracy of the outcomes.
While integrating Gaussian Process Regression (GPR) improved optimization efficiency and reduced computational costs, prediction errors may still persist, particularly at the boundaries of the design space. Future research should focus on refining the GPR model by incorporating active learning or adaptive sampling strategies to enhance prediction accuracy.

5. Conclusions

This study presents a multi-objective optimization framework focused on window configurations in school buildings located in hot-humid climates, with the aim of balancing energy consumption and thermal comfort. By incorporating evolutionary algorithms, Sobol sensitivity analysis, and Gaussian Process Regression (GPR), the research provides valuable insights into optimizing window designs to enhance building performance.
According to the results obtained in this research, the optimal practices of windows are better considered by architects and planners to modify the parameters of WWR and SHGC. More precisely, in energy-efficient construction, the solution with the lowest-EUI (WWR = 0.20 and SHGC = 0.10) will lead to highly reduced energy demand and is therefore suitable for climates in which energy performance is of key interest. For comfort-motivated designs, the Highest-TCTR values (with WWR = 0.42, SHGC = 0.40) have the best comfort but not the best energy efficiency. The Balanced Solution (WWR = 0.40, SHGC = 0.40, SC = 0.30) is suggested, representing an optimal balance between energy and thermal comfort.
The optimization reveals a well-defined trade-off between the EUI and referring to the TCTR. The Balanced Solution gives a pragmatic middle ground, which is an improvement over each metric without the dramatic sacrifices. The most influential parameters in both EUI and TCTR are WWR and SHGC, as verified by analytical techniques such as SHAP and Sobol analysis.
The research contributes to a better understanding of sustainable building design by providing measurable recommendations for the improvement of school buildings in hot and humid climates. It provides architects and engineers with a simple and effective process for bringing the energy use of any building down to sustainable levels. Furthermore, the work illustrates the beneficial application of advanced machine learning approaches (such as Gaussian process regression) in improving both optimization results and computational effort.
The developed framework in this paper is promising to be extended to applications to various types of buildings and climatic zones to expand the ways of researchers on multi-objective optimization in educational infrastructure availability under harsh climatic conditions.
Optimization studies are of crucial importance to designers, as they show the necessity of compromising WWR with SHGC to fulfill the requirements of both energy savings and thermal comfort. That balance is no less vital for educational buildings, where these are designed to high levels of energy efficiency and comfort with few compromises. The results pertain to large, commercial, and residential facilities in both hot-humid and cold climates. It is recommended to investigate adaptive building systems, including dynamic facades and smart glazing for enhanced performance in various occupancy and climate situations. Furthermore, the combination of machine learning with the optimization problem could open up a time adaptation of building response based on the ongoing weather context or the user’s activities.
The optimization solution we propose delivers significant benefits beyond the design phase and affects different actors in the building sector. The model can create optimal design solutions that account for building energy efficiency, thermal comfort, and cost, reducing the need for in situ modifications in the form of rework and materials waste, which would in turn increase the efficiency of construction. Furthermore, the solutions developed in the design phase take local code constraints and performance requirements into account, which helps to ensure that construction teams execute to code and, as a result, lowers the risk of the final built assets.
Conducting a detailed parameter sensitivity analysis enables engineers and consultants to pinpoint crucial design variables, facilitating improved construction and operational strategies. The energy-efficient solutions generated from this analysis can be utilized by building owners and policymakers to reduce energy consumption, minimize operating costs, and enhance long-term user comfort. By integrating these elements, the algorithm supports a decision support system (DSS) that enhances building performance throughout its lifecycle, benefiting all stakeholders.
In conclusion, the multi-objective optimization algorithm offers significant advantages to designers, construction managers, and owners alike. Its capacity to enhance decision-making efficiency, ensure regulatory adherence, and boost cost-effectiveness across construction and operational stages makes it a valuable asset in the construction sector. Especially in hot-humid climates such as Guangzhou, this approach can significantly improve indoor comfort levels and reduce energy usage, resulting in long-term economic and environmental benefits.

Author Contributions

Conceptualization, T.X.; methodology, T.X.; software, T.X.; validation, T.X.; formal analysis, T.X.; investigation, T.X.; resources, T.X.; data curation, T.X.; writing—original draft preparation, T.X.; writing—review and editing, A.S.A. and N.M.; supervision, A.S.A. and N.M.; project administration, A.S.A. and N.M. All authors have read and agreed to the published version of the manuscript.

Funding

This research received no external funding.

Institutional Review Board Statement

Not applicable.

Informed Consent Statement

Not applicable.

Data Availability Statement

The data supporting the findings of this study are available upon request from the corresponding author. The data is not publicly available due to privacy.

Acknowledgments

The authors would like to express their sincere gratitude to Azlan Shah Ali and Norhayati Mahyuddin for their invaluable support and guidance throughout the course of this research. Their expertise and constructive feedback have greatly contributed to the success of this study.

Conflicts of Interest

The authors declare no conflicts of interest.

Abbreviations

The following abbreviations are used in this manuscript:
EUIEnergy Use Intensity
TCTRThermal Comfort Time Ratio
WWRWindow-to-Wall Ratio
SHGCSolar Heat Gain Coefficient
SCShading Coefficient
NSGA-IINon-dominated Sorting Genetic Algorithm II
GPRGaussian Process Regression
TMYTypical Meteorological Year
LEEDLeadership in Energy and Environmental Design
BREEAMEstablishment Environmental Assessment Method
IAQIndoor Air Quality
HVACHeating, Ventilation, and Air Conditioning
PCMsPhase Change Materials
GBGreen Building
FARFloor Area Ratio
SVFSky View Factor
BDBuilding Density
R2Coefficient of Determination
RMSERoot Mean Square Error
LHSLatin Hypercube Sampling

References

  1. International Energy Agency (IEA). CO2 Emissions in 2022. IEA. Available online: https://www.iea.org/reports/co2-emissions-in-2022 (accessed on 23 September 2025).
  2. You, K.; Ren, H.; Cai, W.; Huang, R.; Li, Y. Modeling carbon emission trend in China’s building sector to year 2060. Resour. Conserv. Recycl. 2023, 188, 106679. [Google Scholar] [CrossRef]
  3. Wang, Y. Report on Smart Education in China. In Smart Education in China and Central & Eastern European Countries; Springer: Berlin/Heidelberg, Germany, 2023; pp. 11–50. [Google Scholar] [CrossRef]
  4. China Statistical Yearbook 2023; China Statistics Press: Beijing, China, 2023; Available online: https://www.chinayearbooks.com/china-statistical-yearbook-2023.html (accessed on 23 September 2025).
  5. Global Sustainable Buildings Guide. Green Certification. Baker McKenzie. 2023. Available online: https://resourcehub.bakermckenzie.com/en/resources/global-sustainable-buildings/asia-pacific/china/topics/green-certification (accessed on 23 September 2025).
  6. GB/T 50378-2019; Assessment Standard for Green Building. Ministry of Housing and Urban-Rural Development of PRC. State Administration for Market Regulation: Beijing, China, 2019. Available online: https://www.chinesestandard.net/PDF.aspx/GBT50378-2019 (accessed on 23 September 2025).
  7. GB 50189-2015; Design Standard for Energy Efficiency of Public Buildings. Ministry of Housing and Urban-Rural Development of PRC. State Administration for Market Regulation: Beijing, China, 2015. Available online: http://www.jianbiaoku.com/webarbs/book/73810/1628137.shtml (accessed on 23 September 2025).
  8. U.S. Green Building Council (USGBC). LEED v5 Reference Guide for Operations and Maintenance: April 2025 Launch Edition. U.S. Green Building Council. 2025. Available online: https://www.usgbc.org/resources/leed-v5-reference-guide-operations-and-maintenance-april-2025-launch-edition (accessed on 23 September 2025).
  9. BRE Global. BREEAM in-Use International Technical Manual: Commercial Buildings (v6.0.0, Chinese Edition). Building Research Establishment. 2021. Available online: https://www.bregroup.cn/wp-content/uploads/2021/08/BIU-International-Commercial-Technical-Manual_V6.0_CN.pdf (accessed on 23 September 2025).
  10. Guo, T.; Lin, Z.; Zhao, Y.; Fang, Z.; Fan, Y.; Zhang, X.; Yang, J.; Li, Y. Investigation and optimization of outdoor thermal comfort in elementary school campuses: Example from a humid-hot area in China. Build. Environ. 2024, 248, 111055. [Google Scholar] [CrossRef]
  11. Yan, H.; Liu, Q.; Zhao, W.; Pang, C.; Dong, M.; Zhang, H.; Gao, J.; Wang, H.; Hu, B.; Yang, L.; et al. The coupled effect of temperature, humidity, and air movement on human thermal response in hot-humid and hot-arid climates in summer in China. Build. Environ. 2020, 177, 106898. [Google Scholar] [CrossRef]
  12. López-Pérez, L.A.; Flores-Prieto, J.J.; Ríos-Rojas, C. Adaptive thermal comfort model for educational buildings in a hot-humid climate. Build. Environ. 2019, 150, 181–194. [Google Scholar] [CrossRef]
  13. Tejero-González, A.; Andrés-Chicote, M.; García-Ibáñez, P.; Velasco-Gómez, E.; Rey-Martínez, F.J. Assessing the applicability of passive cooling and heating techniques through climate factors: An overview. Renew. Sustain. Energy Rev. 2016, 65, 727–742. [Google Scholar] [CrossRef]
  14. Hwang, R.-L.; Liao, W.-J.; Chen, W.-A. Optimization of energy use and academic performance for educational environments in hot-humid climates. Build. Environ. 2022, 222, 109434. [Google Scholar] [CrossRef]
  15. Orlik-Koźdón, B. Effect of indoor climatic conditions on the risk of water vapor condensation and mould growth. J. Build. Eng. 2024, 95, 110198. [Google Scholar] [CrossRef]
  16. Song, Y.; Liao, C. Structural materials, ventilation design and architectural art of traditional buildings in Guangdong, China. Buildings 2022, 12, 900. [Google Scholar] [CrossRef]
  17. Lakhdari, K.; Sriti, L.; Painter, B. Parametric optimization of daylight, thermal and energy performance of middle school classrooms, case of hot and dry regions. Build. Environ. 2021, 204, 108173. [Google Scholar] [CrossRef]
  18. Da’abis, M.S. Green school buildings and environmental holistic elements approach to cope with hot and humid climate challenges—Bahrain case study. J. Sustain. Cities Built Environ. 2024, 2, 1–40. [Google Scholar] [CrossRef]
  19. Al-Saadi, A.; Al-Saadi, S.; Khan, H.; Al-Hashim, A.; Al-Khatri, H. Judicious design solutions for zero energy school buildings in hot climates. Sol. Energy 2023, 264, 112050. [Google Scholar] [CrossRef]
  20. Alghamdi, S.; Tang, W.; Kanjanabootra, S.; Alterman, D. Effect of architectural building design parameters on thermal comfort and energy consumption in higher education buildings. Buildings 2022, 12, 329. [Google Scholar] [CrossRef]
  21. Franco, A.; Bartoli, C.; Conti, P.; Miserocchi, L.; Testi, D. Multi-objective optimization of HVAC operation for balancing energy use and occupant comfort in educational buildings. Energies 2021, 14, 2847. [Google Scholar] [CrossRef]
  22. Akopov, A.S.; Beklaryan, L.A.; Saghatelyan, A.K. Agent-based modelling of interactions between air pollutants and greenery using a case study of Yerevan, Armenia. Environ. Model. Sofware 2019, 116, 7–25. [Google Scholar] [CrossRef]
  23. Akopov, A.S. An lmproved Parallel Biobjective Hybrid Real-Coded Genetic Algorithm withClustering-Based Selection. Cybern. Inf. Technol. 2024, 24, 32–49. [Google Scholar] [CrossRef]
  24. Hwang, R.-L.; Chen, B.-L.; Chen, W.-A. Analysis of incorporating a phase change material in a roof for the thermal management of school buildings in hot-humid climates. Buildings 2021, 11, 248. [Google Scholar] [CrossRef]
  25. Mba, E.J.; Sam-amobi, C.G.; Okeke, F.O. An assessment of orientation on effective natural ventilation for thermal comfort in primary school classrooms in Enugu City, Nigeria. Eur. J. Sustain. Dev. 2022, 11, 114. [Google Scholar] [CrossRef]
  26. Cherier, M.K.; Hamdani, M.; Kamel, E.; Guermoui, M.; Bekkouche, S.M.E.A.; Al-Saadi, S.; Djeffal, R.; Bashir, M.O.; Elshekh, A.E.A.; Drozdova, L.; et al. Impact of glazing type, window-to-wall ratio, and orientation on building energy savings quality: A parametric analysis in Algerian climatic conditions. Case Stud. Therm. Eng. 2024, 61, 104902. [Google Scholar] [CrossRef]
  27. Yi, L.; Xie, Y.; Lin, C. Thermal environment and energy performance of a typical classroom building in a hot-humid region: A case study in Guangzhou, China. Geofluids 2022, 2022, 3226001. [Google Scholar] [CrossRef]
  28. Soroshnia, E.; Rahnamayizekavat, P.; Rashidi, M.; Sadeghi, M.; Samali, B. Passive intelligent kinetic external dynamic shade design for improving indoor comfort and minimizing energy consumption. Buildings 2023, 13, 1090. [Google Scholar] [CrossRef]
  29. Lala, B.; Murtyas, S.; Hagishima, A. Indoor thermal comfort and adaptive thermal behaviors of students in primary schools located in the humid subtropical climate of India. Sustainability 2022, 14, 7072. [Google Scholar] [CrossRef]
  30. Liu, H.; Zhang, Z.; Ma, X.; Lu, W.; Li, D.; Kojima, S. Optimization analysis of the residential window-to-wall ratio based on numerical calculation of energy consumption in the hot-summer and cold-winter zone of China. Sustainability 2020, 12, 6138. [Google Scholar] [CrossRef]
  31. Xu, Y.; Zhang, G.; Yan, C.; Wang, G.; Jiang, Y.; Zhao, K. A two-stage multi-objective optimization method for envelope and energy generation systems of primary and secondary school teaching buildings in China. Build. Environ. 2021, 204, 108142. [Google Scholar] [CrossRef]
  32. Li, L.; Qi, Z.; Ma, Q.; Gao, W.; Wei, X. Evolving multi-objective optimization framework for early-stage building design: Improving energy efficiency, daylighting, view quality, and thermal comfort. Build. Simul. 2024, 17, 2097–2123. [Google Scholar] [CrossRef]
  33. Song, B.; Bai, L.; Yang, L. Analysis of the long-term effects of solar radiation on the indoor thermal comfort in office buildings. Energy 2022, 247, 123499. [Google Scholar] [CrossRef]
  34. Li, Y.; He, J. Evaluating the improvement effect of low-energy strategies on the summer indoor thermal environment and cooling energy consumption in a library building: A case study in a hot-humid and less-windy city of China. Build. Simul. 2021, 14, 1423–1437. [Google Scholar] [CrossRef]
  35. Mba, E.J.; Okeke, F.O.; Okoye, U. Effects of wall openings on effective natural ventilation for thermal comfort in classrooms of primary schools in Enugu metropolis, Nigeria. JP J. Heat Mass Transf. 2021, 22, 269–304. [Google Scholar] [CrossRef]
  36. Li, Q.; Zhang, L.; Zhang, L.; Wu, X. Optimizing energy efficiency and thermal comfort in building green retrofit. Energy 2021, 237, 121509. [Google Scholar] [CrossRef]
  37. Vijayan, D.S.; Sivasuriyan, A.; Patchamuthu, P.; Revathy, j. Thermal performance of energy-efficient buildings for sustainable development. Environ. Sci. Pollut. Res. 2021, 29, 51130–51142. [Google Scholar] [CrossRef] [PubMed]
  38. U.S. Department of Energy. EnergyPlus; Version 9.6; U.S. Department of Energy: Washington, DC, USA, 2021; Available online: https://energyplus.net (accessed on 21 September 2025).
  39. Ladybug Tools. Honeybee; Version 1.5.0; Ladybug Tools: London, UK, 2021; Available online: https://www.ladybug.tools/honeybee.html (accessed on 21 September 2025).
  40. Robert McNeel & Associates. Rhinoceros; Version 8.0; Robert McNeel & Associates: Seattle, WA, USA, 2023; Available online: https://www.rhino3d.com (accessed on 21 September 2025).
  41. Robert McNeel & Associates. Grasshopper; Version 1.0; Robert McNeel & Associates: Seattle, WA, USA, 2021; Available online: https://www.rhino3d.com/docs/grasshopper/Transform/Rotate-3D (accessed on 21 September 2025).
  42. Wallacei LLC. Wallacei; Version 1.2; Wallacei LLC: London, UK, 2021; Available online: https://www.wallacei.com (accessed on 21 September 2025).
  43. Jun, H.; Fei, H. Research on multi-objective optimization of building energy efficiency based on energy consumption and thermal comfort. Build. Serv. Eng. Res. Technol. 2024, 45, 1–15. [Google Scholar] [CrossRef]
  44. Wu, H.; Zhang, T. Multi-objective optimization of energy, visual, and thermal performance for building envelopes in China’s hot summer and cold winter climate zone. J. Build. Eng. 2022, 59, 105034. [Google Scholar] [CrossRef]
  45. Zheng, S.; Huang, G.; Zhou, X.; Zhu, X. Climate-change impacts on electricity demands at a metropolitan scale: A case study of Guangzhou, China. Appl. Energy 2020, 261, 114295. [Google Scholar] [CrossRef]
  46. Cheung, P.K.; Jim, C.Y. Improved assessment of outdoor thermal comfort: 1-hour acceptable temperature range. Build. Environ. 2019, 151, 303–317. [Google Scholar] [CrossRef]
  47. Riaz, H.; Arif, S.; Yousuf, S.; Bashir, M.N.; Ali, M.M.; Badruddin, I.A. Thermal comfort model for classrooms using occupant-centered approach. Case Stud. Therm. Eng. 2025, 73, 106589. [Google Scholar] [CrossRef]
  48. Sayadi, S.; Hayati, A.; Salmanzadeh, M. Optimization of Window-to-Wall Ratio for Buildings Located in Different Climates: An IDA-Indoor Climate and Energy Simulation Study. Energies 2021, 14, 1974. [Google Scholar] [CrossRef]
  49. Merrin, M.J.; Meghana, C.; B, V. Evaluating the efficacy of external shading devices on building energy consumption: A case study in hot climate. Therm. Sci. 2025, 80. [Google Scholar] [CrossRef]
  50. Zakaria, N.M.; Omar, M.A.; Mukhtar, A. Numerical study on the thermal insulation of smart windows embedded with low thermal conductivity materials to improve the energy efficiency of buildings. CFD Lett. 2023, 15, 41–52. [Google Scholar] [CrossRef]
  51. Bhatia, A.; Sangireddy, S.A.R.; Garg, V. An approach to calculate the equivalent solar heat gain coefficient of glass windows with fixed and dynamic shading in tropical climates. J. Build. Eng. 2019, 22, 90–100. [Google Scholar] [CrossRef]
  52. DBJ 15-51-2020; Announcement on the release of the Guangdong Provincial Standard for Energy-Efficient Design of Public Buildings. Guangdong Provincial Department of Housing and Urban-Rural Development: Guangzhou, China, 2020. Available online: https://zfcxjst.gd.gov.cn/attachment/0/480/480712/3096758.pdf (accessed on 23 September 2025).
  53. Chai, J.; Fan, J. Advanced thermal regulating materials and systems for energy saving and thermal comfort in buildings. Mater. Today Energy 2022, 24, 100925. [Google Scholar] [CrossRef]
  54. Alotaibi, B.S.; Khalifa, K.R.M.; Abuhussain, M.A.; Yahua, M.S.; Maghrabi, A.; Abba, S.I. Integrating renewable-based solar energy into sustainable and resilient urban furniture coupled with a logical multi-comparison study of Cyprus and Saudi Arabia. Processes 2023, 11, 2887. [Google Scholar] [CrossRef]
  55. Zhang, J.; Zhou, X.; Lei, S.; Luo, M. Energy and comfort performance of occupant-centric air conditioning strategy in office buildings with personal comfort devices. Build. Simul. 2022, 15, 899–911. [Google Scholar] [CrossRef]
  56. Chaturvedi, S.; Rajasekar, E.; Natarajan, S. Multi-objective building design optimization under operational uncertainties using the NSGA II algorithm. Buildings 2020, 10, 88. [Google Scholar] [CrossRef]
  57. Brownlee, A.E.I.; Wright, J.A. Constrained, mixed-integer and multi-objective optimisation of building designs by NSGA-II with fitness approximation. Appl. Soft Comput. 2015, 33, 114–126. [Google Scholar] [CrossRef]
  58. Nguyen, A.T.; Reiter, S. A performance comparison of sensitivity analysis methods for building energy models. Build. Simul. 2015, 8, 651–664. [Google Scholar] [CrossRef]
  59. Nouri, A.; van Treeck, C.; Frisch, J. Sensitivity assessment of building energy performance simulations using MARS meta-modeling in combination with Sobol’ method. Energies 2024, 17, 695. [Google Scholar] [CrossRef]
  60. Kristensen, M.H.; Petersen, S. Choosing the appropriate sensitivity analysis method for building energy model-based investigations. Energy Build. 2016, 130, 166–176. [Google Scholar] [CrossRef]
  61. Shen, Y. Load estimation models for the heat demand of buildings: Application of optimized Gaussian process regression. J. Appl. Sci. Eng. 2024, 28, 1–10. [Google Scholar] [CrossRef]
  62. Maiworm, M.; Limon, D.; Findeisen, R. Online learning-based model predictive control with Gaussian process models and stability guarantees. Int. J. Robust Nonlinear Control 2021, 31, 8785–8812. [Google Scholar] [CrossRef]
  63. McKay, M.D.; Beckman, R.J.; Conover, W.J. A comparison of three methods for selecting values of input variables in the analysis of output from a computer code. Technometrics 1979, 21, 239–245. [Google Scholar] [CrossRef]
  64. Zhai, Y.; Wang, Y.; Huang, Y.; Meng, X. A Multi-Objective Optimization Methodology for Window Design Considering Energy Consumption, Thermal Environment, and Visual Performance. Renew. Energy 2019, 134, 1190–1199. [Google Scholar] [CrossRef]
  65. Wu, S.; Zhou, P.; Xiong, Y.; Ma, C.; Wu, D.; Lu, W. Strategies for driving the future of educational building design in terms of indoor thermal environments: A comprehensive review of methods and optimization. Buildings 2025, 15, 816. [Google Scholar] [CrossRef]
  66. Gao, B.; Zhu, X.; Ren, J.; Ran, J.; Kim, M.K.; Liu, J. Multi-objective optimization of energy-saving measures and operation parameters for a newly retrofitted building in future climate conditions: A case study of an office building in Chengdu. Energy Rep. 2023, 9, 2269–2285. [Google Scholar] [CrossRef]
  67. Li, W.; Zhang, J.; Zhao, T. Indoor thermal environment optimal control for thermal comfort and energy saving based on online monitoring of thermal sensation. Energy Build. 2019, 197, 57–67. [Google Scholar] [CrossRef]
  68. Mahiwal, S.G.; Bhoi, M.K.; Bhatt, N. Evaluation of energy use intensity (EUI) and energy cost of commercial building in India using BIM technology. Asian J. Civ. Eng. 2021, 22, 877–894. [Google Scholar] [CrossRef]
  69. Li, S.; Li, Y.; Wang, M.; Peng, J.; He, Y. Optimization study of photovoltaic direct-driven air conditioning system based on occupants’ behavior and thermal comfort. Renew. Energy 2025, 251, 123389. [Google Scholar] [CrossRef]
  70. Troup, L.; Phillips, R.; Eckelman, M.J.; Fannon, D. Effect of window-to-wall ratio on measured energy consumption in US office buildings. Energy Build. 2019, 203, 109434. [Google Scholar] [CrossRef]
  71. Mohamed Nor Izam, N.S.; Itam, Z.; Sing, W.L.; Syamsir, A. Sustainable development perspectives of solar energy technologies with focus on solar photovoltaic—A review. Energies 2022, 15, 2790. [Google Scholar] [CrossRef]
  72. Ganji Kheybari, A.; Gutai, M.; Mok, B.; Cavana, G. Thermal comfort of standard and advanced glazed building envelopes. Energy Build. 2025, 329, 115211. [Google Scholar] [CrossRef]
  73. Wang, C.; Yang, H.; Ji, J. Performance analysis of a PV/T shading device for enhancing energy saving and human comfort. Appl. Energy 2024, 376, 124248. [Google Scholar] [CrossRef]
  74. Sharma, S.K.; Mohapatra, S.; Sharma, R.C.; Alturjman, S.; Altirjman, C.; Mostarda, L.; Stephan, T. Retrofitting Existing Buildings to Improve Energy Performance. Sustainability 2022, 14, 666. [Google Scholar] [CrossRef]
  75. Wang, X.; Li, W.; Luo, Z.; Wang, K.; Shah, S.P. A critical review on phase change materials (PCM) for sustainable and energy efficient building: Design, characteristics, performance and application. Energy Build. 2022, 260, 111923. [Google Scholar] [CrossRef]
  76. Seyedzadeh, S.; Pour Rahimian, F.; Glesk, I.; Roper, M. Machine learning for estimation of building energy consumption and performance: A review. Vis. Eng. 2018, 6, 5. [Google Scholar] [CrossRef]
  77. Kalmár, F.; Kalmár, T. Thermal Comfort Aspects of Solar Gains during the Heating Season. Energies 2020, 13, 1702. [Google Scholar] [CrossRef]
  78. Alhuwayil, W.K.; Mujeebu, M.A.; Algarny, A.M.M. Impact of external shading strategy on energy performance of multi-story hotel building in hot-humid climate. Energy 2019, 169, 1166–1174. [Google Scholar] [CrossRef]
  79. Tan, X.Y.; Mahyuddin, N.; Kamaruzzaman, S.N.; Mat Wajid, N.; Abidin, A.M.Z. Investigation into energy performance of a multi-building complex in a hot and humid climate: Efficacy of energy saving measures. Open House Int. 2024, 49, 489–513. [Google Scholar] [CrossRef]
  80. Mazzetto, S. Dynamic Integration of Shading and Ventilation: Novel Quantitative Insights into Building Performance Optimization. Buildings 2025, 15, 1123. [Google Scholar] [CrossRef]
  81. Chiesa, G.; Acquaviva, A.; Grosso, M.; Bottaccioli, L.; Floridia, M.; Pristeri, E.; Sanna, E.M. Parametric Optimization of Window-to-Wall Ratio for Passive Buildings Adopting a Scripting Methodology to Dynamic-Energy Simulation. Sustainability 2019, 11, 3078. [Google Scholar] [CrossRef]
  82. Chandrasekaran, C.; Sasidhar, K.; Madhumathi, A. Energy-efficient retrofitting with exterior shading device in hot and humid climate—Case studies from fully glazed multi-storied office buildings in Chennai, India. J. Asian Architect. Build. Eng. 2022, 22, 2209–2223. [Google Scholar] [CrossRef]
  83. GB 50033-2013; Standard for Daylighting Design of Buildings. China Architecture & Building Press: Beijing, China, 2013. Available online: http://www.jianbiaoku.com/webarbs/book/50/2440035.shtml (accessed on 23 September 2025).
  84. Enteria, N.; Yoshino, H. Energy-efficient and renewable energy-supported buildings in hot and humid regions. In Building in Hot and Humid Regions; Enteria, N., Awbi, H., Santamouris, M., Eds.; Springer: Berlin/Heidelberg, Germany, 2019; pp. 185–203. [Google Scholar]
  85. Lee, Y.-J.; Kim, S.-H.; Ryu, J.-H.; Lee, K.-H. Optimizing window glass design for energy efficiency in South Korean office buildings: A hierarchical analysis using energy simulation. Buildings 2023, 13, 2850. [Google Scholar] [CrossRef]
  86. Lee, S.-J.; Song, S.-Y. Energy efficiency, visual comfort, and thermal comfort of suspended particle device smart windows in a residential building: A full-scale experimental study. Energy Build. 2023, 298, 113514. [Google Scholar] [CrossRef]
  87. Khalaf, M.; Ashrafian, T.; Demirci, C. Energy efficiency evaluation of different glazing and shading systems in a school building. E3S Web Conf. 2019, 111, 03052. [Google Scholar] [CrossRef]
  88. GB 50099-2011; Code for Design of School. China Architecture & Building Press: Beijing, China, 2012. Available online: http://www.jianbiaoku.com/webarbs/book/414/2559815.shtml (accessed on 21 September 2025).
  89. da Silva, F.; Veras, J.C.G. A design framework for a kinetic shading device system for building envelopes. Front. Archit. Res. 2023, 12, 837–854. [Google Scholar] [CrossRef]
  90. GB/T 50785-2012; Standardization Administration of the People’s Republic of China. Evaluation Standard for Indoor Thermal Environment in Civil Buildings. China National Standardization Management Committee: Beijing, China, 2012. Available online: https://www.chinesestandard.net/PDF.aspx/GBT50785-2012 (accessed on 23 September 2025).
  91. Yang, B.; Olofsson, T.; Wang, F.; Lu, W. Thermal Comfort in Primary School Classrooms: A Case Study under Subarctic Climate Area of Sweden. Build. Environ. 2018, 135, 237–245. [Google Scholar] [CrossRef]
  92. GB 50666-2011; Code for Construction of Concrete Structures. Ministry of Housing and Urban-Rural Development of the People’s Republic of China, General Administration of Quality Supervision, Inspection and Quarantine of the People’s Republic of China. China Architecture & Building Press: Beijing, China, 2011. Available online: https://www.chinesestandard.net/PDF.aspx/GB50666-2011 (accessed on 23 September 2025).
  93. Yue, N.; Li, L.; Morandi, A.; Zhao, Y. A metamodel-based multi-objective optimization method to balance thermal comfort and energy efficiency in a campus gymnasium. Energy Build. 2021, 253, 111513. [Google Scholar] [CrossRef]
  94. Heydari, A.; Sadati, S.E.; Gharib, M.R. Effects of different window configurations on energy consumption in building: Optimization and economic analysis. J. Build. Eng. 2021, 35, 102099. [Google Scholar] [CrossRef]
  95. Petersen, S.; Kristensen, M.H.; Knudsen, M.D. Prerequisites for Reliable Sensitivity Analysis of a High Fidelity Building Energy Model. Energy Build. 2019, 183, 1–16. [Google Scholar] [CrossRef]
  96. Liu, S.-Y.; How, J.P. Gaussian Processes for Learning and Control: A Tutorial with Examples. IEEE Control Syst. Mag. 2018, 38, 33–50. [Google Scholar] [CrossRef]
  97. Wang, H.; Liang, Q.; Hancock, J.T.; Khoshgoftaar, T.M. Feature selection strategies: A comparative analysis of SHAP-value and importance-based methods. J. Big Data 2024, 11, 44. [Google Scholar] [CrossRef]
  98. Triana, M.A.; De Vecchi, R.; Lamberts, R. Building Design for Hot and Humid Climate in a Changing World. In Building in Hot and Humid Regions: Historical Perspective and Technological Advances; Enteria, N., Awbi, H., Santamouris, M., Eds.; Springer: Berlin/Heidelberg, Germany, 2019; pp. 59–73. [Google Scholar]
  99. Zeng, A.; Ho, H.; Yu, Y. Prediction of Building Electricity Usage Using Gaussian Process Regression. J. Build. Eng. 2020, 28, 101054. [Google Scholar] [CrossRef]
  100. Abdul Rahman, M.A.; Khalid, H.L.; Yusup, Y. Optimizing wind power for energy-efficient building design in tropical hot-humid climates of Malaysia. J. Sustain. Dev. 2011, 4, 217–230. [Google Scholar] [CrossRef]
  101. Kadi, B. Design Strategies for Energy-Efficient and Climate-Responsive Building: Case of Hot Humid Climate’s Library Building. In Proceedings of the Conference on Design Strategies for Energy Efficient and Climate Responsive Building, Istanbul, Turkey, August 2021; Available online: https://www.researchgate.net/publication/353760799 (accessed on 23 September 2025).
  102. Ye, Z.; Li, L.; Cao, W.; Wang, J.; Zhao, L.; Pang, Y.; Li, H.; Wan, F.; Huang, M. Hygrothermal response capacity prediction of traditional buildings in hot-humid regions of China under future climate change. J. Build. Eng. 2025, 107, 112733. [Google Scholar] [CrossRef]
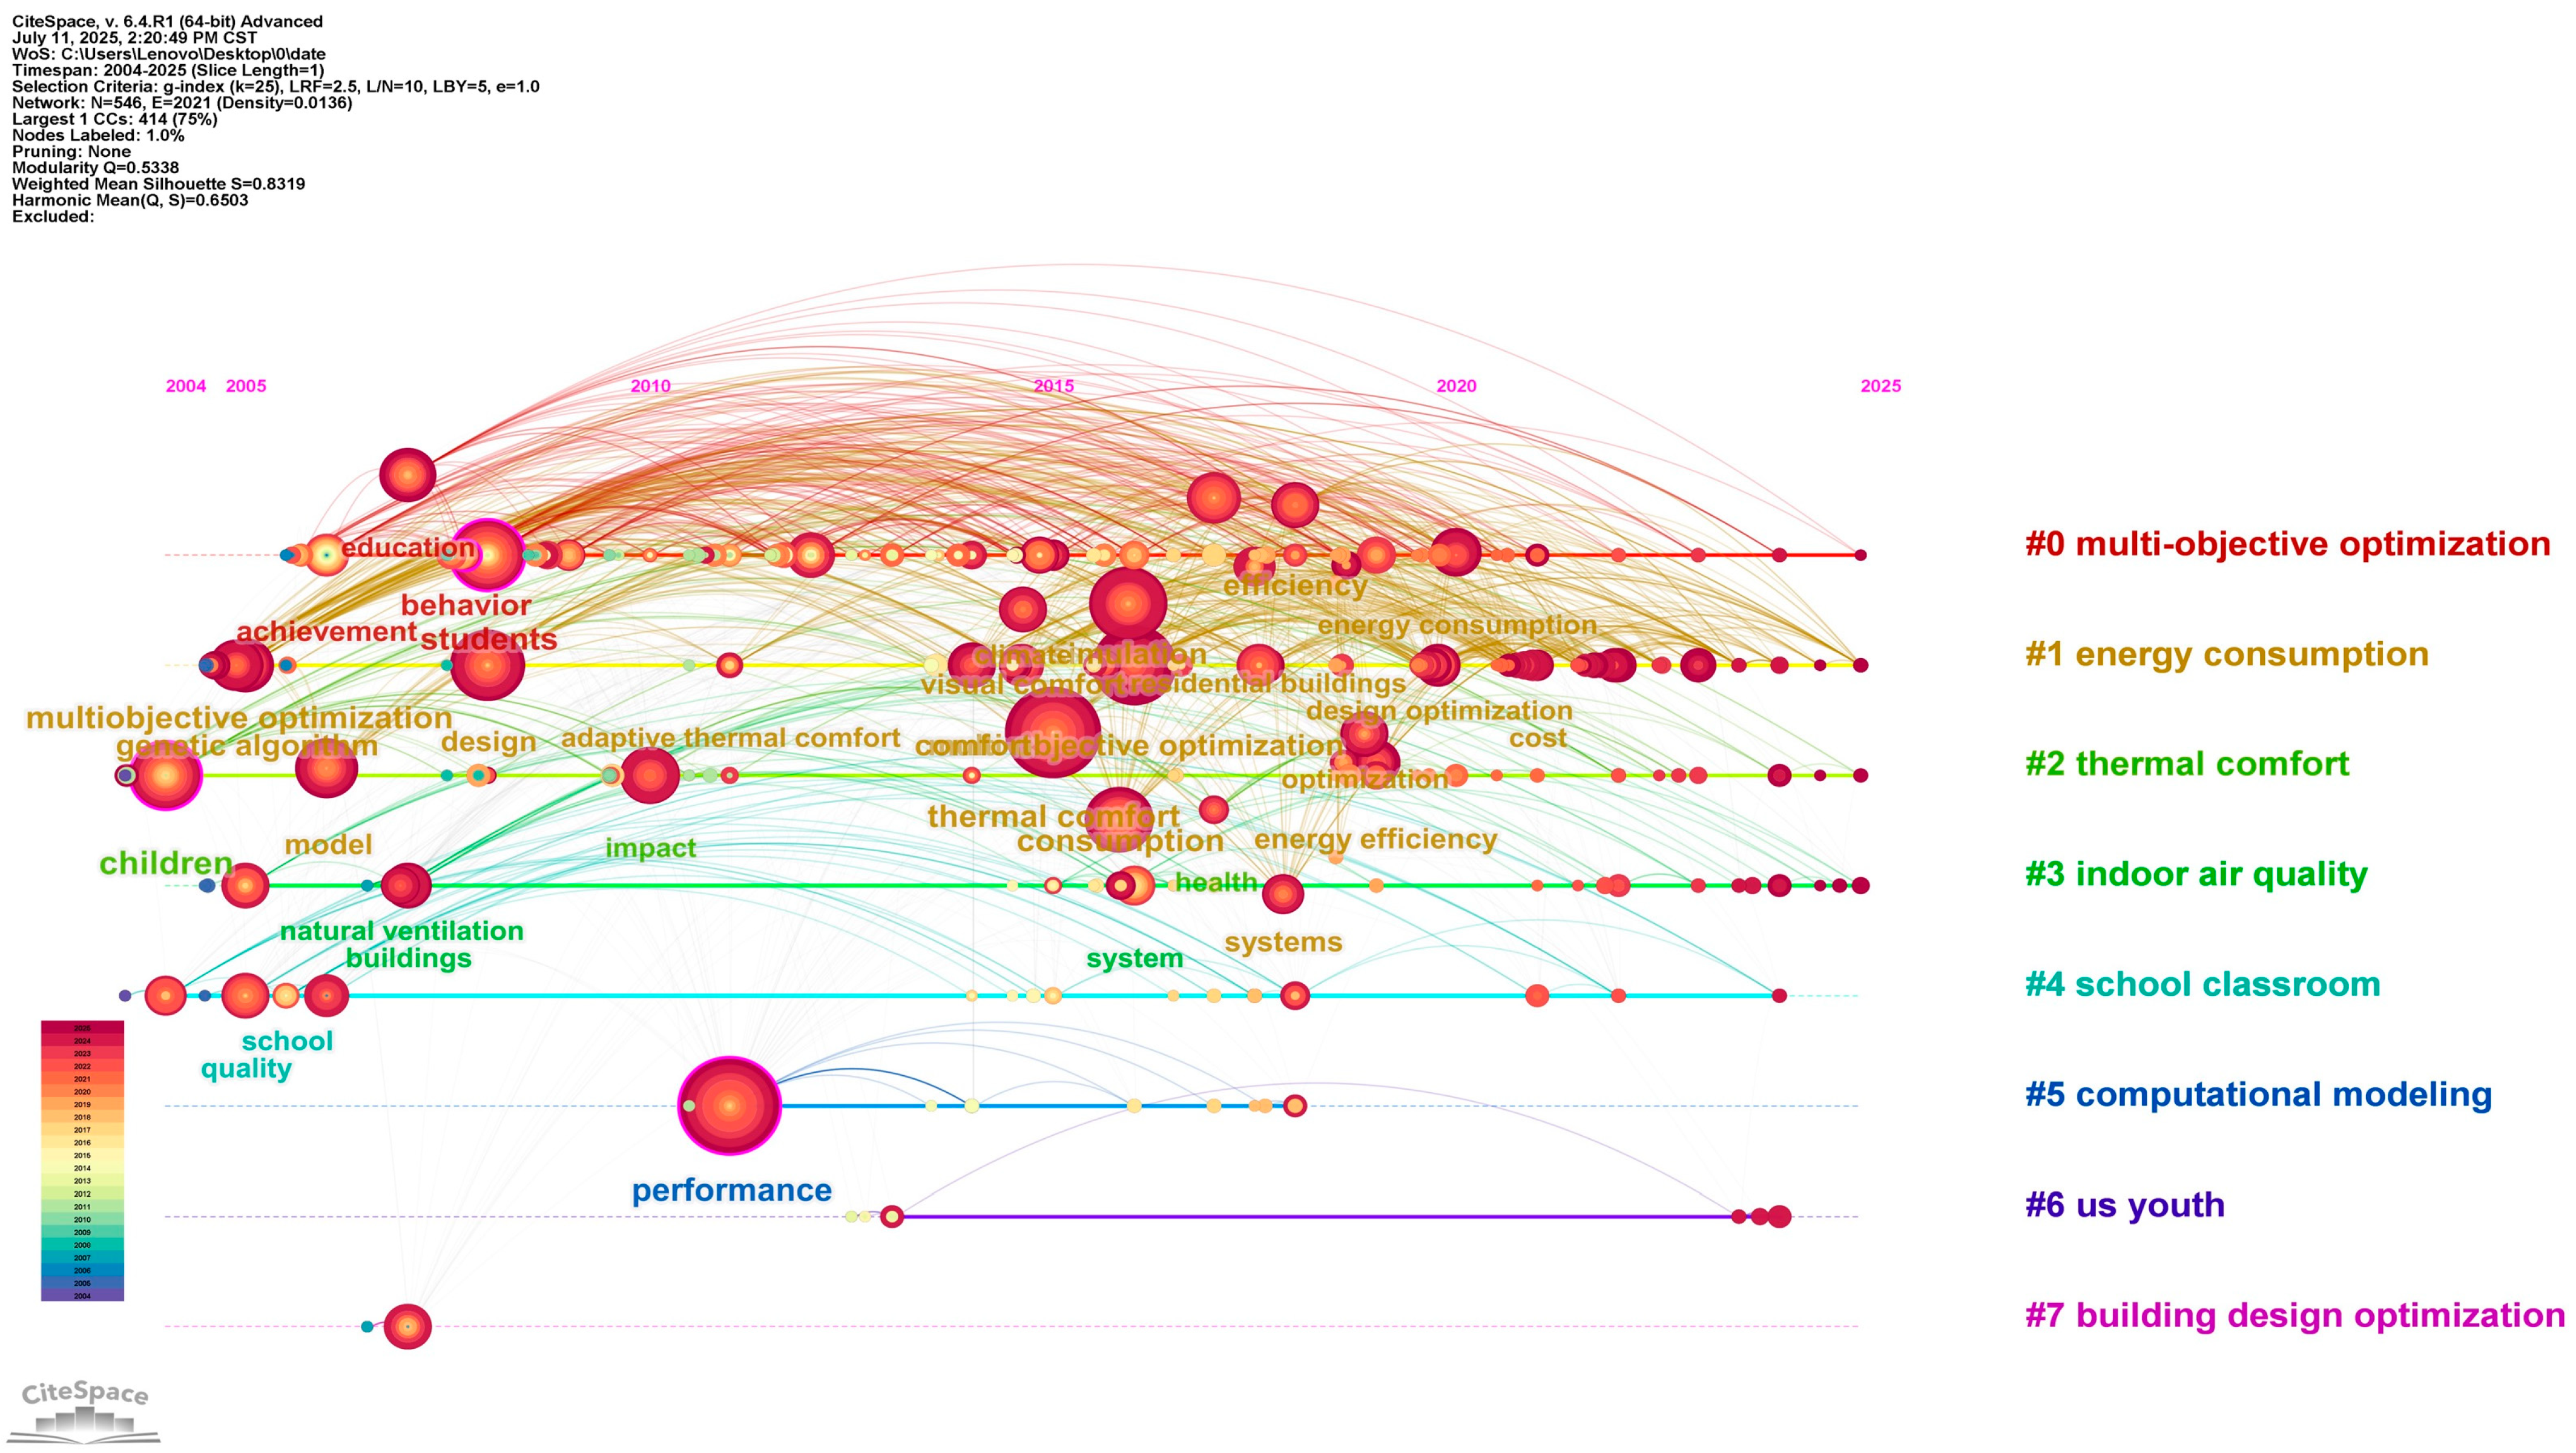
Figure 1. Keyword Co-occurrence Network for Multi-Objective Optimization. The diagram emphasizes the rising attention towards adaptive thermal comfort and genetic algorithms, with a particular emphasis on multi-objective optimization and energy consumption.
Sustainability 17 08646 g001
Figure 2. Research Framework for Multi-Objective Optimization in School Building Design. This figure illustrates the methodology used in this study, starting with the identification of performance metrics and design variables, followed by sensitivity analysis, multi-objective optimization, and machine learning techniques. The framework integrates energy consumption, thermal comfort, and optimization strategies to generate optimal window configurations for school buildings in hot-humid climates.
Sustainability 17 08646 g002
Figure 3. Monthly Climate Data for Guangzhou. This figure shows the average temperature (a), relative humidity (b), total solar radiation (c), and dry bulb temperature (d) throughout the year. The graphs illustrate seasonal climate variations, which critically influence building energy use and thermal comfort. This data is crucial for incorporating climate factors into the design optimization of school buildings in hot-humid regions.
Sustainability 17 08646 g003
Figure 4. NSGA-II Optimization Process for Multi-Objective Building Design. This flowchart illustrates the steps involved in the NSGA-II optimization process, from the initial population generation to the final Pareto front output, focusing on the evaluation of EUI and TCTR as the primary objective functions.
Sustainability 17 08646 g004
Figure 5. Three-dimensional Model of the Representative School Building Used for Simulation. This 3D model depicts a typical school building in Guangzhou, designed to assess energy consumption and thermal comfort. The building layout follows common school building designs with a central courtyard, where classrooms are oriented southward to optimize natural lighting and ventilation.
Sustainability 17 08646 g005
Figure 6. Window Design Parameters for Multi-Objective Optimization. The diagram offers an integrated consideration of the design factors of the windows, the uncertainties, and the impact on building energy consumption and thermal conditions. Window design variables, such as window-to-wall ratio (WWR), and shading and solar heat gain coefficients (SC and SHGC) were analyzed to minimize energy demand and improve thermal comfort for a school building sited in a hot-humid region.
Sustainability 17 08646 g006
Figure 7. Monitored Classroom and Sensor Deployment Layout. This figure illustrates the placement of the HOBO U12 Data Logger near the windows, providing context for the data collection process used to validate the simulation results.
Sustainability 17 08646 g007
Figure 8. Hourly Indoor Air Temperature Comparison. This graph contrasts simulated and actual hourly temperature variations in the classroom on a typical hot-season day. The simulation aligns closely with observed temperature trends, with only minor discrepancies during peak afternoon hours.
Sustainability 17 08646 g008
Figure 9. Hourly Indoor Relative Humidity Comparison. This graph contrasts simulated and observed hourly variations in classroom relative humidity. The simulation closely aligns with actual data, showing only slight discrepancies during peak temperature intervals.
Sustainability 17 08646 g009
Figure 10. Pareto Front of Energy Efficiency (EUI) and Thermal Comfort Time Ratio (TCTR). This figure illustrates the trade-off between energy consumption and thermal comfort in building design. The red line represents the Pareto front, showing optimal solutions where energy use and comfort are balanced. Points on the curve demonstrate different design configurations, with the green points representing the Balanced Solution, offering the best compromise between energy efficiency and thermal comfort.
Sustainability 17 08646 g010
Figure 11. First-order and Second-order Sobol Sensitivity Analysis Results. (a) First-order Sensitivity (S1) for EUI and TCTR; (b) Second-order Sensitivity (S2) for EUI and TCTR. The figure presents the first and second-order Sobol analysis results for EUI and TCTR, highlighting the interaction effects of design parameters. Solutions reveal that WWR and SHGC exhibit the highest sensitivity indices, serving as critical factors for optimizing energy consumption and thermal comfort. The figure also marks the optimal location, offering a clear demonstration of each parameter’s impact on building energy efficiency and comfort.
Sustainability 17 08646 g011
Figure 12. GPR Prediction vs. Actual Data Comparison. (a) GPR EUI Prediction vs. Actual; (b) GPR TCTR Prediction vs. Actual. This figure juxtaposes GPR model predictions with actual measurements for EUI and TCTR, demonstrating a strong correlation and affirming the GPR model’s reliability in forecasting energy use and thermal comfort outcomes.
Sustainability 17 08646 g012
Figure 13. Wallacei Optimization Trend. This graph illustrates the dynamic behavior of optimization during the multi-objective process. As generations progress, EUI decreases while TCTR increases. The different colored lines represent the performance trends of various solution sets across generations, while the red circle highlights the final converged solution on the Pareto front. The standard deviations of EUI and TCTR indicate both the diversity of the solution set and the convergence towards a singular solution.
Sustainability 17 08646 g013
Figure 14. (af) Sobol Sensitivity Analysis Diagram for Each Parameter. These plots illustrate the sensitivity of each design parameter, revealing that WWR and SHGC exhibit consistently high sensitivity indices across all solutions, not just the optimal ones. This underscores their significance in improving EUI and TCTR. Additionally, the diagrams indicate the optimal parameter positions, providing insights into their impact on building energy consumption and comfort.
Sustainability 17 08646 g014
Figure 15. Comparison of GPR Predictions with Sobol Sensitivity Results. This graph compares GPR model predictions of EUI and TCTR with the Sobol sensitivity indices and reveals that both methods are consistent in identifying the parameters that have the most influence, i.e., WWR and SHGC.
Sustainability 17 08646 g015
Table 2. Constraints.
Constraint NameValue Range/RequirementExplanationReference
Window-to-Wall Ratio (WWR)0.10–0.50Ensure compliance with national and local building codes for educational buildings.GB 50189-2015 [7]; Chiesa et al., 2019 [81]
Shading Coefficient (SC)0.20–0.80Range covers typical external shading devices suitable for hot-humid climates.Chandrasekaran 2022 [82]; GB 50033-2013 [83]
Heat Transfer Coefficient (K)1.0–2.5 W/(m2·K)Follows requirements of the “Design Standard for Energy Efficiency of Public Buildings.”GB 50189-2015 [7]; Enteria et al., 2022 [84]
Solar Heat Gain Coefficient (SHGC)0.10–0.40Matches glazing options recommended for minimizing cooling loads in subtropical schools.Lee, Y.-J et al., 2023 [85]; Lee, S.-J et al., 2019 [86]
Shading Width0.3–2.0 mConforms to feasible engineering practice and construction guidelines for sun shading elements.Khalaf et al., 2019 [87]; GB 50096-2011 [88]
Shading Angle0°–90°Reflects adjustable range for horizontal external shading based on climate-responsive design principles.da Silva et al., 2023 [89]; GB 50033-2013 [83]
Thermal Comfort (TC)≥50%Ensures compliance with recommended standards for indoor environmental quality in classrooms.GB/T 50785-2012 [90]; Yang et al., 2018 [91]
ConstructabilityMust use standard materials/processesRequires all window and shading systems to be easily constructed and maintainable in the local context.GB 50666-2011 [92]; Enteria et al., 2019 [84]
Table 3. Measurement Equipment Information.
ParameterInstrumentModelMeasurement RangeAccuracyPlacementSampling Interval
Air TemperatureHOBO Data LoggerU12013−20 °C to 70 °C±0.35 °C (0–50 °C)Near window, 1.1 m above floorEvery 5 min
Relative HumidityHOBO Data LoggerU120135–95% RH±2.5% (10–90% RH typical)Near window, 1.1 m above floorEvery 5 min
Outdoor Climate DataChina Meteorological AdminTMY datasetRegional typical valuesLocal weather stationHourly
Table 4. Parameter ranges from Pareto set.
ParameterObserved Pareto Range (Min–Max)Recommended (IQR, 25–75%)—Practical TargetShort Note
WWR0.1–0.520–42%Balance daylight and cooling load
SC0.20–0.900.20–0.40Lower SC reduces solar gain
K1.0–2.51.1–1.4Aim for improved glazing/frame assembly
SHGC0.10–0.400.10–0.40Use combined SHGC × shading factor when checking
Shading Width0.3–2.0 m1.2–1.5 mHorizontal projection of external shade
Shading Angle0°–90°28°–38°Angle relative to horizontal; optimizes seasonal protection
Note: “Recommended (IQR)” denotes the interquartile range (25–75%) of the Pareto-optimal solutions and is suggested as a robust design envelope. Full Pareto min–max ranges are also provided for reference.
Table 5. Representative parameter configurations (parameter-only, for design guidance).
SolutionWWRSCSHGCK (W·m−2·K−1)Shading Width (m)Shading Angle (°)
Lowest-EUI (energy-priority)0.20.400.101.11.0427°
Highest-TCTR (comfort-priority)0.420.400.401.41.518°
Balanced (recommended compromise)0.400.300.401.21.2228°
Table 6. GPR Model Verification Results.
MetricEUI (R2)TCTR (R2)EUI (RMSE)TCTR (RMSE)
Training Set0.910.954.52.3
Test Set0.890.945.12.7
Table 7. Comparison of Optimization Results.
Solution TypeEUI (kWh/m2·year)Thermal Comfort Time Ratio TCTR (%)Energy Saving (%)Comfort Improvement (%)
Lowest EUI Solution73.0351.8328.11.4
Highest Comfort Solution118.8463.21−17.023.7
Balanced Solution94.7558.446.714.3
Disclaimer/Publisher’s Note: The statements, opinions and data contained in all publications are solely those of the individual author(s) and contributor(s) and not of MDPI and/or the editor(s). MDPI and/or the editor(s) disclaim responsibility for any injury to people or property resulting from any ideas, methods, instructions or products referred to in the content.