Abstract
Bioplastics are gaining attention as eco-friendly alternatives to conventional plastics, with Polybutylene Adipate Terephthalate (PBAT) emerging as a promising biodegradable substitute for polyethylene (PE) in food packaging. Commercial PBAT is often blended with other plastics or bio-based fillers to improve mechanical properties and reduce costs, though these additives can influence its environmental footprint. Therefore, this study quantifies the environmental impacts of producing PBAT resin blends reinforced with common inorganic fillers and compares end-of-life (EoL) performance against PE. While prior studies have largely assessed virgin PBAT or PBAT/Polylactic Acid (PLA) systems, systematic LCA of commercial-style PBAT blends with inorganic fillers and screening LCA level for comparisons of composting vs. landfill remain limited. The contributions of this study are to: (i) map gate-to-gate environmental hotspots for PBAT-blend conversion, (ii) provide a screening gate-to-grave comparison of PBAT composting vs. PE landfill using ReCiPe 2016 and IPCC GWP100 methods, and (iii) discuss theoretical implications for material substitution in the context of EoL strategies. The results indicated that producing 1 kg of PBAT blend generated a single score impact of 921 mPt with Human Health and Resource categories contributing similarly, and a GWP of 8.64 kg CO2-eq, dominated by mixing and drying processes. EoL screening showed PBAT composting offered clear advantages over landfilling PE, yielding −53.9 mPt and 11.35 kg CO2-eq savings, effectively offsetting production emissions. In contrast, landfilling PE resulted in 288.8 mPt and 2.2 kg CO2-eq emissions. Sensitivity analysis further demonstrated that a 30% reduction in electricity use could decrease impacts by up to 10%, underscoring the importance of energy efficiency improvements and renewable energy adoption for sustainable PBAT development.
1. Introduction
Packaging materials represent approximately 40% of total plastic production, with the food industry being the largest end-user [1]. Conventional plastics, made from fossil/petroleum-based polymers, are highly resistant to degradation, resulting in the massive accumulation of waste [2]. To address the environmental concerns of conventional plastics, bioplastics have emerged as a sustainable alternative with a wide range of applications such as packaging, textiles, and agriculture [3].
Bioplastics generally refer to materials that are either bio-based, biodegradable, or both. Bio-based plastics are derived partially or entirely from renewable biological sources such as corn, sugarcane, or potato starch, reducing reliance on fossil fuels and lowering the overall carbon footprint [1,4]. Biodegradable plastics are polymers, whether petroleum-based or bio-based, that can decompose into carbon dioxide, methane, water, inorganic compounds, or biomass within a reasonable timeframe, thereby mitigating the problem of waste accumulation [1,4]. Specific categories of these biodegradable polymers are also classified as compostable, which means they can degrade at the end of life at a faster rate in an industrial composting environment [1,4,5].
Beyond conventional end-of life (EoL) pathways such as recycling, incineration, and landfilling, biodegradable plastics offer the potential to be managed through organic waste treatment methods including composting [6]. However, when disposed of in landfills, the anaerobic degradation activities can generate methane, a potent greenhouse gas, raising concerns about the environmental implications [7]. This highlights the importance of evaluating alternative waste management strategies, such as industrial composting, alongside the recyclability of bioplastics, to ensure environmentally sound disposal practices during the transition toward biodegradable materials [8].
Among bioplastics, polybutylene adipate terephthalate (PBAT) is a fossil-based biodegradable polymer which widely used in active food packaging applications (Figure 1) [1]. As a commercially produced material, PBAT is considered a cost-competitive alternative to conventional plastics such as polyethylene (PE) [9]. The high flexibility of PBAT makes it attractive for various applications in the packaging sector. However, its limited mechanical strength requires improvement, which is usually achieved through blending with complementary polymers or fillers [9]. Blending PBAT with fillers not only improves mechanical performance but also increases cost efficiency by partially substituting the primary polymer with less expensive fillers. However, blending bioplastics with other materials often requires additional processing steps, which may affect the overall environmental footprint [10]. To ensure sustainable application and inform material development, a comprehensive environmental impact assessment of PBAT-based blends is essential.
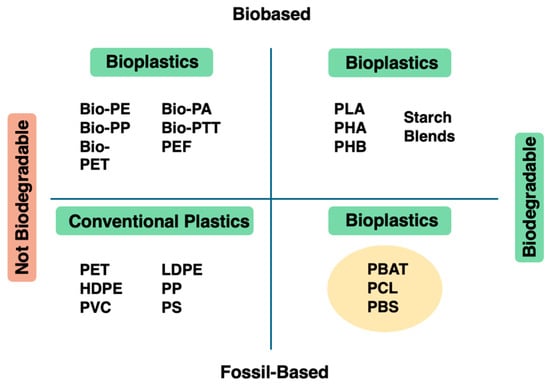
Figure 1.
Classification of plastics based on biodegradability and feedstock origin (adopted from [11]).
Life cycle assessment (LCA) is a powerful tool for evaluating the environmental impacts of a product or service over its entire life cycle in terms of various impact categories [8]. LCA is particularly valuable for assessing bioplastics to enable a thorough comparison with conventional plastics and critically evaluate sustainability claims across different production methods and EoL scenarios [12,13,14]. The waste management stage, whether through biodegradation, composting, incineration, landfilling, or recycling, plays a crucial role in shaping a bioplastic’s overall environmental profile and must be carefully considered in the analysis [13,15]. Recent studies, such as Luo et al. [16], performed a comparative cradle-to-gate LCA of PBAT produced from fossil-derived and second-generation bio-based feedstocks. The results showed that bio-based PBAT had a 37% lower global warming potential (GWP) compared to fossil-based PBAT, and up to 32% lower than conventional plastics such as low-density PE and high-density PE. To examine the production phase, Wang et al. [17] conducted a gate-to-gate analysis of petroleum-based PBAT and compared it with biomass-derived alternatives.
Although several studies have investigated PBAT and its blend, the existing literature remains fragmented, particularly regarding comprehensive LCA of PBAT-based composites under varying EoL scenarios. Prior works have primarily focused on the incorporation of fillers or blending strategies to enhance PBAT’s performance [18]. For example, Zhou et al. [10] analyzed the gate-to-gate environmental performance of a composite film made from PBAT and montmorillonite fillers. The results demonstrated a lower environmental impact and reduced carbon emissions compared to a 100% PBAT film, as the composite film production required fewer PBAT pellets. Choi et al. [19] assessed the carbon footprint of packaging films made from a polylactic acid (PLA)/PBAT blend, covering the full cradle-to-grave life cycle. Suwanmanee et al. [20] compared the GWP of bio-PE and a PBAT/starch blend using a cradle-to-grave LCA under three EoL scenarios: full landfilling, landfilling/incineration, and landfilling/composting. The results indicated that bio-PE had a lower carbon footprint, and the landfilling/composting pathway resulted in the lowest GWP among the scenarios. Saibuatrong et al. [21] performed a cradle-to-grave environmental impact analysis on conventional PE, bio-PE, and PBAT/starch. Results showed lower carbon emissions for bio-PE and PBAT/starch due to the photosynthesis reaction during plant growth. They also observed that composting was the most viable waste management strategy for PBAT/starch in terms of high ecosystem quality, confirming the former findings.
During blending process, inorganic fillers such as talc, silica, and magnesium compounds are widely used in polymer reinforcement due to their ability to enhance mechanical strength, stiffness, and barrier properties [22]. Their compatibility with PBAT makes them attractive for improving material performance in food packaging applications while maintaining biodegradability. Although recent literature has attempted to analyze the environmental impact of PBAT, there is still a lack of LCA research focusing on PBAT blended with common fillers such as talc, silica, and magnesium. These materials are frequently used in the commercial production of cost-effective PBAT for food packaging applications. To address the existing research gap, the present study aims to perform a comprehensive comparative analysis between fossil-based biodegradable PBAT blends, which incorporate specific inorganic fillers, and traditional fossil-based non-biodegradable PE. To meet the overarching goals outlined above, the study focuses on the following sub-objectives:
Quantitative environmental impact analysis (gate-to-gate) and identification of process hotspots: This objective focuses on performing a detailed environmental impact assessment limited to the production phase (gate-to-gate) of the polymer blends. Utilizing ReCiPe method and the IPCC’s GWP 100-year timeframe, this analysis quantifies impacts across multiple categories including human health, ecosystem quality, and resource depletion. The analysis aims to identify critical process stages or components (“hotspots”) within the production chain that contribute highly to environmental burdens, thereby highlighting opportunities for targeted improvements or innovation.
Comparative screening-level EoL assessment: Beyond the production phase, this sub-objective expands the scope to conduct a preliminary evaluation of the EoL environmental impacts associated with fossil-based PBAT blends in comparison to conventional PE. This screening-level assessment focuses on examining how the biodegradability and composting potential of PBAT influence key environmental indicators. Both ReCiPe impact indicators and CO2 emissions are evaluated to capture environmental performance differences between the two materials. This approach serves as a proof of concept to demonstrate the potential benefits of adopting biodegradable plastics in EoL management.
2. Materials and Methods
LCA is selected as the methodological framework for this study because it provides a systematic and standardized approach (ISO 14040/44) [23] to evaluate the environmental performance of products across multiple impact categories and life cycle stages. In the context of bioplastics, LCA is particularly critical for assessing not only the direct emissions associated with polymer production but also the broader implications of scaling up biodegradable alternatives and substituting conventional petroleum-based plastics [6]. By quantifying potential impacts on human health, ecosystems, and resource depletion, LCA enables transparent comparisons and highlights trade-offs that would not be evident through single-indicator methods such as carbon footprint alone.
2.1. Goal and Scope Definition
The objective of this study is to apply LCA as a standardized framework to quantify and compare the environmental performance of biodegradable PBAT reinforced with inorganic fillers against conventional PE resin, using CTK Bio Canada Inc. as the case study. As a producer of advanced bioplastic material, CTK Bio Canada Inc. develops high-performance alternatives to virgin plastics that aim to reduce carbon emissions and landfill wastes while maintaining supply chain compatibility. Employing LCA enables evidence-based decision-making by identifying environmental hotspots and evaluating trade-offs between conventional and biodegradable options. In the context of bioplastics, LCA is particularly valuable for examining the implications of scaling up production and substituting petroleum-based plastics with biobased or biodegradable alternatives [6]. Accordingly, this study assesses the potential sustainability benefits of PBAT composites over PE by quantifying key environmental indicators.
2.1.1. Functional Unit
The functional unit of this LCA study is defined as 1 kg of resin produced. This ensures a fair comparison by focusing on the material production phase, as the resources required for applications such as cup manufacturing and paper lamination are assumed to be the same for both PE and PBAT based resin.
2.1.2. System Boundaries
As shown in Figure 2, the system boundary for this study focuses on the production of 1 kg of PBAT resin, supplying raw materials (excluding detailed production processes) and the conversion steps required to produce a biodegradable PBAT blend. In the first scenario, this assessment adopts a gate-to-gate approach, focusing only on the processes within the production facility, from the intake of raw materials to the completion of PBAT based resin. This study also considers second scenario with a focus on EoL strategies for PBAT based resin and PE. The process begins with the supply of raw PBAT pellets, which serve as the main input material. These pellets are then processed through several stages in the conversion phase. The first step is weighing and suction, where electricity is used to handle and transfer the raw material. Next, the pellets go through mixing and drying, where additives like talc, silica, and magnesium are introduced. This stage also consumes both heat and electricity to ensure proper mixing and moisture removal.
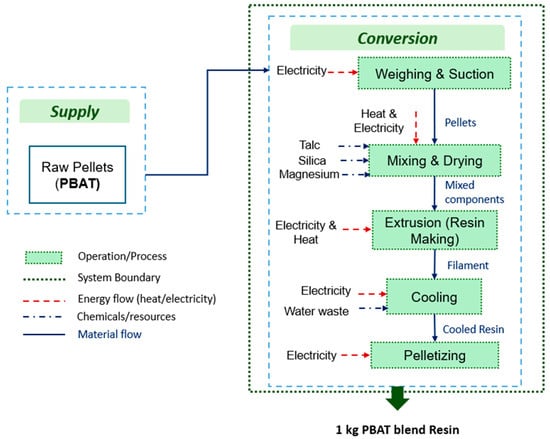
Figure 2.
Process flowchart of the PBAT-based resin production for cup manufacturing.
After mixing, the material is sent to the extrusion process, where heat and electricity are applied to melt and shape it into a filament. The filament is then cooled down using electricity and water before moving to the final pelletizing stage, where the material is cut into small pellets using electricity (pelletizer). At the end of the process, PBAT resin is produced, ready for further applications.
Throughout these steps, different flows are considered. Material flow tracks how PBAT resin moves through the system, while chemical/resource inputs represent the added substances. The composition of the final PBAT blend consists of approximately 80% PBAT resin, 15% talc, 3% silica, and 2% magnesium (wt%). These values were obtained through expert consultation (senior scientist, CTK, and CEO of a Canadian bioplastics company, March 2025).
2.2. Life Cycle Inventory (LCI) Analysis
For inventory analysis, all inputs and outputs of the involved processes are quantified and identified per functional unit (1 kg of PBAT resin blend). Data are collected from two main sources: (i) primary data supplied by CTK Bio Canada Inc. (e.g., feedstock requirements for PBAT, additive loading, filler content, and material losses), (ii) secondary data from the literature and EcoInvent database within SimaPro software (e.g., electricity generation, heat supply, raw material extraction, and water treatment). The inventory data is presented in Table 1.

Table 1.
Data collection inventory for PBAT production (values were obtained from published sources, the EcoInvent database, and expert consultation (senior scientist, CTK, and CEO of a Canadian bioplastics company, March 2025)).
For each conversion stage, mass and energy balances are constructed (mixing/drying, extrusion/cooling, pelletizing), normalized to 1 kg output resin. According to literature, electricity demand for drying is estimated at 0.128 kWh/kg of PBAT resin [24], while motor mixing requires 0.55 kWh/kg and 8.42 kWh/kg of heat energy (Ecoinvent). Additive feedstock inputs per tonne of final output include 0.155 tonnes of talc, 0.03 tonnes of silica, and 0.015 tonnes of magnesium (Industry expert). Additionally, suction and material transfer consume 0.75 kWh/kg [25].
Extrusion consumes 0.6 kWh/kg of electricity and the cooling stage requires 9.72 kWh/kg [26], with corresponding cooling water demand of 1.78 L/kg and 0.0643 L/kg of water waste ([25]; Industry expert). Pelletizing consumes an additional 0.15 kWh per 1 kg PBAT resin processing [26], with a material loss rate of 0.061 kg. Other Assumptions to simplify the analysis are detailed as follows:
- Transportation Exclusion: All transportation activities, including raw material delivery and product distribution, are excluded from this assessment to maintain a gate-to-gate system boundary focused solely on on-site operations.
- PBAT Approximation Using PE: In this study, PBAT is approximated using PE synthesis for the cup production stage. This approximation is justified by the focus on a gate-to-gate analysis, where the aim is to assess the impacts associated with downstream processing rather than upstream synthesis. Existing research on PBAT has primarily examined its environmental impacts using various raw material types scenarios, largely due to the lack of primary manufacturing data [27]. As a result, many studies have relied on assumptions based on PET or PE synthesis. Given that PE and PBAT share similar mechanical properties and behave comparably in extrusion and lamination processes, PE serves as a practical proxy for modeling material flow and energy demand during PBAT-blend product conversion. Furthermore, using PE as the conventional plastic counterpart in comparative assessments ensures consistency in evaluating processing impacts, minimizing bias from differences in upstream production pathways.
- LDPE Resin for PE Cup Production: For PE-based cups, low-density polyethylene (LDPE) granules, used for lamination process, are assumed as the reference material. For consistency, LDPE was modeled in SimaPro using EcoInvent datasets under the same functional unit (1 kg resin), system boundaries, and impact assessment methodologies (ReCiPe 2016 and IPCC GWP100a) as PBAT. EoL was modeled as landfill disposal, representing the conventional waste pathway for LDPE.
- End-of-Life Composting Credit: Composting of PBAT is modeled to yield a substitute for organic fertilizer, with the resulting benefits treated as an avoided burden in the LCA. This approach supports global sustainable development trends, lowers reliance on primary raw materials, and cuts down the volume of waste destined for landfills. During composting, the biodegradable components convert into CO2 and water, while the remaining inorganic materials are considered non-toxic to soil. The environmental credits from this substitution are included in the long-term impact assessment, in line with standard system expansion practices in LCA.
2.3. Impact Assessment
The Life Cycle Impact Assessment (LCIA) phase is conducted to translate the life cycle inventory data into potential environmental impacts. This study applies two complementary methods for environmental impact evaluation: the ReCiPe 2016 Midpoint (H) [28] method, one of the most widely recognized LCIA methodologies, for multi-category impact assessment and the Intergovernmental Panel on Climate Change (IPCC) GWP 100a method for climate change analysis. All assessments are performed using SimaPro version 8 software in accordance with ISO 14044 guidelines.
ReCiPe Midpoint is developed to harmonize problem-oriented (midpoint) and damage-oriented (endpoint) approaches. This midpoint method provides characterization factors across 18 impact categories (as shown in Table 2), representing environmental mechanisms at an intermediate level of cause-effect chain. These include climate change, ozone depletion, terrestrial acidification, freshwater and marine eutrophication, photochemical oxidant formation, human toxicity, ecotoxicity (terrestrial, freshwater, marine), ionizing radiation, particulate matter formation, fossil and mineral resource scarcity, land use, and water use.
Table 2.
Impacts categories, evaluated by the ReCiPe impact assessment method.
These are subsequently aggregated into 3 damage categories at the endpoint level:
- Human Health (measured in DALY);
- Ecosystem Quality (measured in species·yr);
- Resource Scarcity (measured in USD 2013).
In endpoint modeling methods such as ReCiPe, this climate-related impact is further translated into Disability-Adjusted Life Years (DALY) to reflect the potential burden on human health through diseases linked to global warming (e.g., cancer, vector-borne, or noncommunicable diseases). Beyond climate change, additional air-related impact categories include ozone depletion (measured in kg CFC-11 eq), ionizing radiation (kg U235 eq), and photochemical oxidant formation (kg NMVOC eq), all contributing to human health damage. Ecosystem-related impacts, such as freshwater and marine eutrophication (measured in kg P and kg N eq, respectively) and ecotoxicity (in kg 1,4-DCB eq), are typically expressed at the endpoint level in terms of species loss per year (species·yr) [28]. These categories capture biodiversity degradation driven by land use change, fertilizer runoff, pesticide application, and aquatic pollution. The endpoint approach of ReCiPe allows for a more integrated interpretation of environmental damage, bridging midpoint emissions with real-world outcomes on both human and ecological systems. The ReCiPe weighting step further enables the comparison of different impact categories through normalization and weighting factors. The weighted damage score (D) is typically computed using Equation (1):
where is the characterized result for impact category i, is the normalization factor typically represents average global or regional contribution per person per year, and is the weighting factor as the relative importance assigned to each impact category.
This ReCiPe method was selected for its global relevance, comprehensive coverage of impact pathways, and compatibility with European and international datasets. Unlike region-specific models such as TRACI, ReCiPe offers a more universal perspective, which is particularly beneficial when assessing globally produced materials such as PBAT and PE resins.
Following the ISO framework, the LCIA process includes the mandatory steps of:
- Selection and classification: linking emissions and resource uses to relevant environmental impact categories;
- Characterization: applying scientifically derived characterization factors to quantify the contribution of each elementary flow to an impact category.
Most LCA of bioplastics focus on climate change–related environmental impacts, typically using the GWP metric, expressed in kilograms of CO2-equivalent per kilogram of polymer [29]. In this regard, the IPCC 2007 GWP 100a methodology is utilized along with the method of the ReCiPe LCA.
3. Results
3.1. Gate-to-Gate Analysis (Without End-of-Life)
The results of this LCIA reflect the environmental burdens associated with the production of 1 kg of PBAT, including mixing, drying, extrusion, cooling, and pelletizing operations.
The environmental performance of the PBAT resin production process was assessed across multiple midpoint and endpoint impact categories using the ReCiPe method, complemented by IPCC GWP 100a for climate change. The analysis was divided into two primary process stages: mixing & drying and extrusion & pelletizing.
Across midpoint indicators as shown in Figure 3, extrusion & pelletizing generally exerts a slightly greater influence, particularly in categories such as terrestrial ecotoxicity, marine ecotoxicity, and agricultural land occupation, where its contribution exceeds 70%.
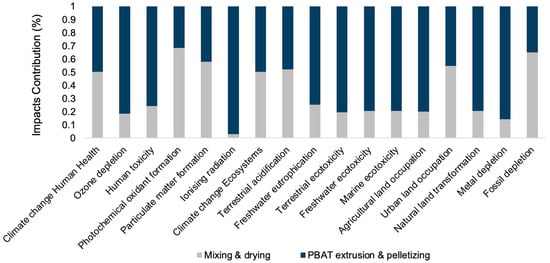
Figure 3.
Relative contribution of mixing & drying and PBAT extrusion & pelletizing to midpoint-level environmental impact categories (ReCiPe midpoint).
Figure 4 illustrates the relative contribution of two production stages, mixing & drying and PBAT extrusion & pelletizing, to the overall environmental damage across three ReCiPe endpoint categories: Human Health, Ecosystems, and Resources. In terms of human health impacts, the contribution is nearly balanced, with mixing & drying accounting for approximately 47% of the total damage and extrusion & pelletizing making up the remaining 53%. A similar trend is observed for ecosystem damage, where mixing & drying contributes roughly 45%, and the extrusion stage slightly dominates at 55%. These outcomes highlight that both stages are environmentally intensive in terms of emissions and toxicity-related burdens.
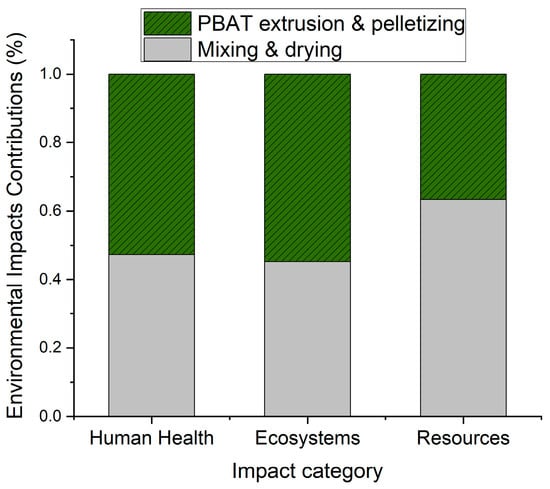
Figure 4.
Relative contribution of each process stage to impact categories.
However, a notably different pattern is seen in the resource damage category. Here, mixing & drying contributes the majority share, over 63%, compared to approximately 37% from extrusion and pelletizing.
Overall, while the environmental burdens are shared across both process phases, mixing & drying is clearly the dominant contributor to resource depletion, making it a critical target for optimization in efforts to reduce the environmental footprint of PBAT resin production.
The detailed environmental impact quantification per impact category with the total amount is also summarized in Table 3.
Table 3.
Environmental impacts quantification per impact category.
Based on the impact assessment results presented in Figure 5a, at the endpoint level, the absolute environmental impacts across the three damage categories, Human Health, Ecosystems, and Resources, demonstrate varying magnitudes and contributions. The Resource damage category exhibits the highest total environmental impact, reaching nearly 0.002 units. This makes it the most significant among the three, even when all categories are treated with equal weighting.
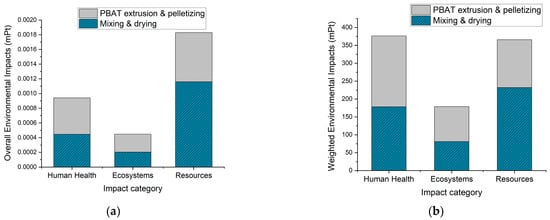
Figure 5.
Absolute environmental impacts (unitless) across impact categories; (a) equal weights across impact categories; (b) customized weighting across impact categories.
Based on the weighted endpoint results shown in Figure 5b, the environmental burden associated with the production of 1 kg of PBAT resin has been evaluated using ReCiPe weighting factors of 400 for Human Health, 400 for Ecosystems, and 200 for Resources. These weights reflect a higher priority placed on human health and ecosystem protection relative to resource depletion, consistent with many policy and academic frameworks. As shown in Figure 5b, the weighted environmental impacts for both human health and resource depletion are nearly equal, each contributing approximately 376.4 and 365.82 milli points (mPt), respectively, making them the dominant environmental concerns in the PBAT production process. This outcome indicates that, despite resource damage receiving a lower weight, its absolute impact is high enough to match that of human health when normalized.
The 376.4 mPt (maximum amount) for human health is not “out of” a fixed scale like 100, rather, it comes from the Environmental Footprint (EF) impact assessment method, where the unit “Pt” (point) represents the aggregated damage to the environment based on normalization and weighting across multiple impact categories.
- Pt values are relative and used to compare contributions across processes and categories;
- A higher Pt means a greater environmental burden.
Based on the weighted ReCiPe endpoint assessment, the total environmental impact of producing 1 kg of the bioplastic is calculated to be 921 mPt. This single score aggregates the contributions from human health, ecosystem quality, and resource depletion, providing a comprehensive measure of the overall environmental burden. This score remains constant in the comparative analysis and serves as a fixed reference point for benchmarking other materials assessed under similar system boundaries, functional unit, and characterization conditions.
Table 4 presents the normalization reference values for each impact category based on the ReCiPe model. These values are used to scale and compare the magnitude of environmental impacts across categories, enabling a standardized interpretation of LCA results. They represent the global average annual environmental load per capita and provide a baseline for assessing the relative significance of each impact category within the overall assessment [28].
Table 4.
Normalization Reference Values for Environmental Impact Categories (ReCiPe Model) [30].
The contribution network shown in Figure 6 using a 17% cut-off threshold, reinforces these findings by highlighting key resource inputs. Electricity, comprising 38.6 MJ per kg of PBAT resin, contributes nearly 35% of the overall impact. The production of PBAT granules (0.8 kg) also accounts for a substantial portion of the burden in mixing and drying stage. Notably, magnesium alloy and other additive inputs, despite their small mass, introduce high impact per unit due to energy-intensive processing and extraction. While Figure 6 displays percentage contributions, the corresponding absolute values are presented in Table 5. The table confirms that the two main process stages, mixing and drying, and extrusion and pelletizing, together account for the full single-score of 921 mPt. Within these stages, upstream inputs such as electricity (~355 mPt), PBAT granulate (~173 mPt), and magnesium alloy (~174 mPt) emerge as critical hotspots. These results demonstrate that energy consumption and raw material sourcing are the dominant drivers of environmental impacts in PBAT resin production.
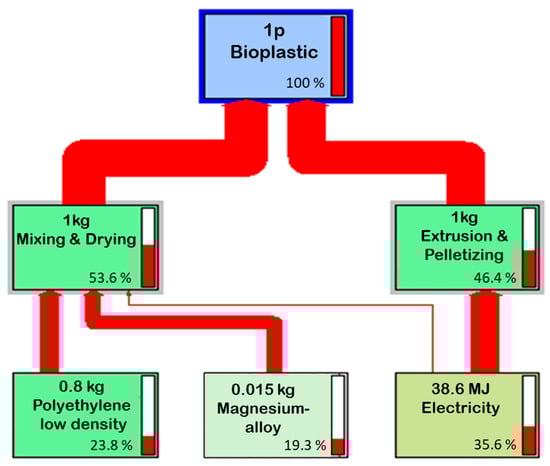
Figure 6.
Network diagram of environmental impacts (Pt) across the PBAT-based resin production system, showing the flow of impacts within the conversion facility (gate-to-gate).
Table 5.
Absolute contributions (Pt) for 1 kg PBAT resin (total single-score = 921 mPt).
Collectively, these results highlight that mixing and drying holds the highest overall process-level impact, primarily due to material demands. At the input level, electricity consumption during extrusion and the use of PBAT and magnesium alloy represent the key upstream environmental hotspots. Reducing energy use an in-extrusion stages could improve the sustainability of PBAT resin production.
Also, as illustrated in Figure 7, the total greenhouse gas emissions associated with the gate-to-gate production of 1 kg of PBAT-based bioplastic are approximately 8.64 kg CO2 eq, with mixing and drying alone contributing over 4.3 kg CO2 eq. This highlights the significant role of thermal energy use in early processing stages.
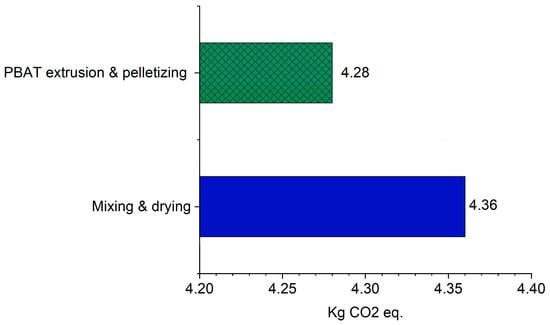
Figure 7.
CO2-equivalent emissions (kg CO2 eq) per process stage based on IPCC GWP 100a method.
When compared with previous studies such as Luo et al. [16] the GWP in this analysis (8.64 kg CO2) is higher than the reported 5.89 kg CO2, primarily due to the inclusion of additional processes. These extra conversion steps for producing PBAT-blend pellets account for approximately 2.75 kg CO2 of the total impact.
3.2. Bioplastics Waste Management and End-of-Life Options
In this study, the EoL scenario of composting for biodegradable bioplastics is compared against the landfilling of fossil-based polymers, such as PE, which are non-biodegradable and persist in the environment for extended periods. Fossil-based plastics that cannot degrade should be confined to landfill systems to prevent environmental leakage and mitigate long-term microplastics pollution.
While multiple disposal options exist for bioplastics, including recycling, landfilling, incineration, and degradation in various environments, their biodegradability offers a distinct environmental advantage. Composting aligns with circular economy goals by enabling bioplastics to return to the biosphere in a controlled and beneficial manner. While biodegradation in water or sewage can help if plastic ends up in the environment, it should not be considered the main disposal method. Instead, certified industrial composting provides a structured and sustainable path, allowing bioplastics to be managed through organic waste streams with minimal environmental burden [30].
As shown in Figure 8, several midpoint-level impact categories show clear environmental benefits when bioplastics are composted rather than disposing PE in landfills. Composting delivers notable net credits in metal depletion, particulate matter formation, climate change (ecosystems), and multiple land use and ecotoxicity categories. These benefits indicate avoided environmental burdens, particularly in resource depletion and ecosystem damage. However, trade-offs are observed, with composting leading to higher burdens in ozone depletion, ionizing radiation, freshwater eutrophication, human toxicity, and fossil depletion. This mixed profile suggests that while composting can significantly reduce certain high-impact categories, targeted process improvements are necessary to mitigate the few impact areas where burdens increase.
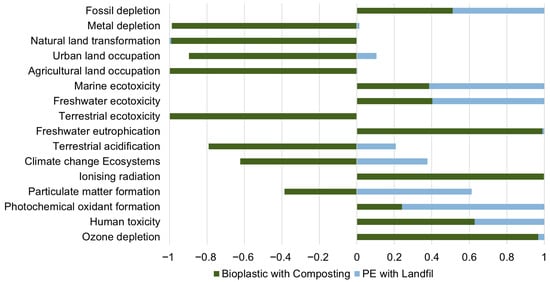
Figure 8.
Comparative end-of-life impact assessment of bioplastic with composting versus polyethylene (PE) with landfill across multiple environmental impact categories.
Moreover, the comparison of endpoint-level environmental impacts under different EoL scenarios highlights the environmental advantages of composting bioplastics. In Figure 9a, composting results in strong net benefits for both human health and ecosystems, shown as negative values around −100 mPt and −120 mPt, respectively, indicating that composting helps avoid environmental damage. In contrast, PE with landfill disposal shows significant environmental burden across all categories.
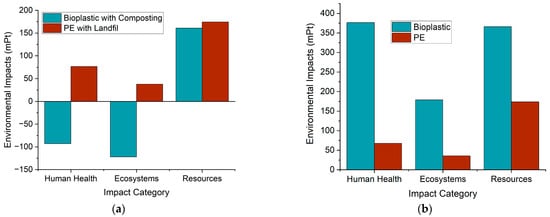
Figure 9.
Comparison of endpoint environmental impacts (mPt); (a) bioplastic with composting vs. PE with landfill; (b)bioplastic vs. PE without end of life strategies.
While the Resource category shows a negative impact for both materials, bioplastics with composting still perform slightly better than PE with landfill. However, when compared to the scenario with no composting or landfill (Figure 9b), surprisingly, the gate-to-gate analysis reveals that bioplastics can perform worse than conventional plastics when EoL treatment is not considered.
As shown in Figure 10, the single-score comparative environmental impact assessment between bioplastic (PBAT-based) and PE reveals significant differences across lifecycle stages. In the gate-to-gate phase, bioplastic exhibits a substantially higher total environmental impact (921.09 mPt) compared to PE (276.97 mPt), primarily due to resource-intensive production processes. However, in the gate-to-grave phase, bioplastic demonstrates a net negative environmental impact (−53.95 mPt), indicating environmental benefits during EoL treatment such as biodegradation or carbon sequestration. In contrast, PE shows a considerable impact (288.81 mPt) in this phase due to persistent waste and emissions, making bioplastic more favorable when evaluated over the entire life cycle. This emphasizes the critical role of EoL strategies in life cycle assessments and highlights that a fair, apples-to-apples comparison must account for biodegradability pathways. Incorporating composting clearly demonstrates the environmental advantages of bioplastics, turning them from a burden into a benefit.
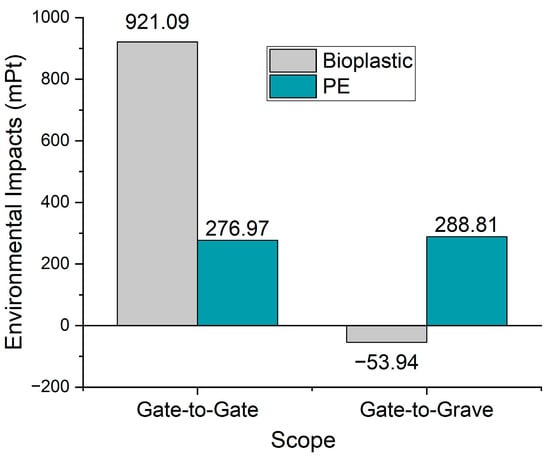
Figure 10.
Single score Environmental impacts (mPt) of Bioplastic and PE assessed in gate-to-gate and gate-to-grave life cycle stages.
The findings are consistent with those of Chen et al. [27] who reported that the total environmental impacts of PBAT pellets is approximately twice that of PE pellets, primarily due to the use of PET synthesis instead of PBAT resin synthesis. In our analysis, the environmental impacts of PBAT-blend bioplastic is nearly three times higher than that of PE (as per Figure 10), driven by the additional processes required to mix PBAT with other ingredients.
While the production of 1 kg of bioplastic generates approximately 8.64 kg CO2 eq. (as shown in Figure 7), composting offsets 11.35 kg CO2 eq., leading to a net negative impact of −2.71 kg CO2 eq. per kg of bioplastic as shown in Figure 11. This indicates that composting not only neutralizes the production emissions but also returns more carbon savings to the environment. Comparing bioplastic and PE, Figure 11 shows that landfilling 1 kg of PE emits 2.22 kg CO2 eq. This represents a total improvement of 4.93 kg CO2 eq. per kg of material when switching from PE to bioplastic with composting. Therefore, advances in cost-effective EoL and waste disposal methods can enhance the sustainable adoption of PBAT, offering practical pathways for the growth of the biodegradable plastics industry [27].
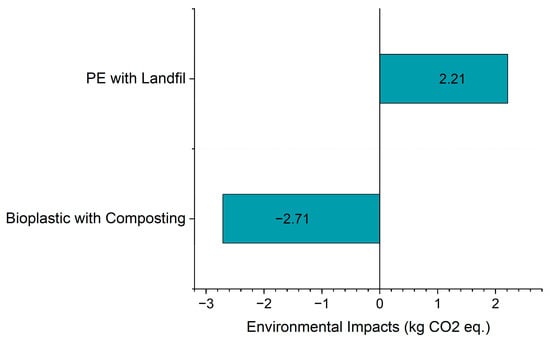
Figure 11.
Comparison of end-of-life environmental impacts for bioplastic with composting and PE with landfill, expressed in kg CO2 equivalent.
3.3. Uncertainty Analysis
Uncertainty analysis is essential in LCA studies to ensure reliable comparisons and draw robust conclusions regarding the environmental sustainability of bioplastics that is biodegradable versus petrochemical-based plastics, which is non-biodegradable [6].
Given the significant role of electricity identified in the network analysis in Figure 6 mostly due to the extrusion & pelletizing process, this sensitivity analysis shown in Figure 12 confirms its influence, a 30% reduction in electricity use during the extrusion process results in a 12%, 11%, and 7% improvement in total environmental impacts of ecosystems, human health, and resources impact categories, respectively. This underscores that investing in more energy-efficient equipment can marginally enhance the sustainability of bioplastic production.
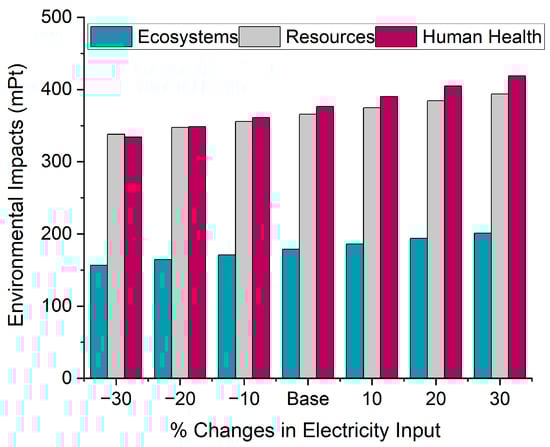
Figure 12.
Sensitivity analysis of environmental impacts for PBAT resin production under ±30% variation in electricity input.
For the improvement pathways, previous studies also showed that plastic packaging process consumes large amount of electricity increasing its potential environmental impacts in case of improper energy management [29]. So, it is essential to explore new energy sources and solutions minimizing its harmful effects [31].
The findings from the LCA analysis of this study can serve as a decision-making framework for implementing changes in each company’s energy management, helping to minimize the environmental impact of this stage and the overall process [32].
3.4. Effect of Data Quality Uncertainty on Impact Categories
The life cycle inventory data are subject to uncertainties due to factors such as data reliability, quality, and availability, which may influence the overall LCA outcomes. To address these limitations, an uncertainty assessment was carried out using Monte Carlo (MC) simulation in SimaPro software [33]. The analysis was based on 3000 iterations with a 95% confidence interval, reporting mean, median, and standard deviation values for each impact category. To represent the probability distributions of uncertain parameters, the pedigree matrix approach was applied, which incorporates expert judgment of data quality (as shown in Table 6). In this framework, potential deviations are attributed to reliability, completeness, and representativeness in terms of time, geography, and technology. For each uncertain parameter, particularly those related to materials processes, random values were generated within defined uncertainty ranges, assuming a lognormal distribution. Approximately 75% of the process units in the dataset were characterized in this way.
Table 6.
Pedigree matrix employed for mixing & drying processes data quality uncertainties (the definition of indicator scores “1–5” can be found in [34] (the higher score on an indicator suggests higher reliability of the associated data)).
The MC simulation demonstrated that, with a 95% confidence interval, the scenario of producing 1 p of bioplastic with composting (A) compared to 1 p of PE with landfill (B) shows notable differences across impact categories, as shown in Table 7. It represents the difference (A–B) for each damage category using the ReCiPe Endpoint (H) method. Negative mean values indicate lower impacts for A relative to B, while positive values indicate higher impacts. represents the probability (%) that A performs equal to or worse than B.
Table 7.
Monte Carlo simulation results (95% confidence interval) comparing 1 p bioplastic with composting (A) and 1 p polyethylene (PE) with landfill (B), using the ReCiPe Endpoint (H) method.
On average, ecosystem and human health damages are lower for scenario A relative to scenario B, with mean values of −0.0004 and −0.00042, respectively. Both categories display narrow confidence intervals (ecosystems: −0.00043 to −0.00035; human health: −0.00051 to −0.00027), indicating that the observed reductions are statistically robust under input uncertainty.
For the resources category, the mean difference (−4.87 × 10⁻⁵) is relatively small, and the 95% confidence interval spans both negative and positive values (−0.00022 to 0.000226), suggesting that there is no clear statistical difference between alternatives A and B in terms of resource depletion. The coefficient of variation (CV) for resources (−226.85) further highlights a high degree of variability, reinforcing the uncertainty in this category.
The standard deviations for ecosystem and human health impacts (2.03 × 10⁻⁵ and 6.43 × 10⁻⁵, respectively) are modest, while that of resources (0.00011) is considerable, consistent with the wide uncertainty range. This indicates that human health and ecosystems categories yield reliable improvements when adopting composting, while resource-related outcomes remain inconclusive.
Conducting statistical analysis confirms that the differences in ecosystems and human health categories are significant (p-value < 0.05), meaning there is less than 5% probability that the observed differences occurred by chance.
The higher variability in the resource category compared to ecosystems and human health highlights the need for improved precision in inventory data, particularly regarding energy and material flows contributing to resource depletion. The comparison of alternatives under uncertainty supports the previous LCIA findings, with the exception of resource use, where further refinement of system boundary assumptions is necessary.
3.5. Managerial Insights and Future Research Direction
The findings of this study carry several implications for industrial managers and policymakers engaged in sustainable packaging strategies. First, the environmental advantage of PBAT depends upon the availability of appropriate EoL infrastructure. Composting enables PBAT to outperform conventional PE, whereas in the absence of such systems, PBAT exhibits higher environmental burdens. Organizations considering adoption of PBAT should therefore assess regional waste management capacity or establish partnerships with composting providers to ensure intended sustainability benefits are realized.
Second, the analysis underscores the need to improve operational efficiency in the production of PBAT blends. The mixing and drying phases were identified as energy-intensive hotspots, suggesting that targeted interventions such as process optimization, equipment upgrades, and renewable electricity integration can reduce environmental impacts.
Finally, this study demonstrates the value of LCA coupled with statistical analysis as a decision-making framework for evaluating trade-offs in bioplastic adoption. Managers and policymakers can employ LCA outcomes to inform procurement decisions, identify priority areas for improvement, and design policies consistent with circular economy objectives.
It is also important to consider the limitations of this work. The defined system boundaries may limit processes and contributions beyond the production stage, and data access constraints restricted the level of detail in the life cycle inventory. As highlighted by Luo et al. [16], future studies should extend the scope to full cradle-to-grave assessments of PBAT with fillers, incorporating upstream activities such as the supply of adipic acid, butanediol, and purified terephthalic acid, The development of localized life cycle inventories, supported by active industry participation, will be essential to strengthen accuracy and contextual relevance. Furthermore, integrating life cycle cost analysis with environmental assessment [35,36] would provide more comprehensive decision support, while coupling economic, environmental, social, and technical dimensions [37,38] would enable a more holistic evaluation of bioplastics within circular economy frameworks. Together, these recommendations and limitations highlight where industrial practice can be improved today and where future research is required to ensure PBAT’s role in sustainable packaging is realized.
4. Conclusions
This study employed life cycle assessment (LCA) to evaluate and compare the environmental impacts of PBAT-based bioplastic resin blends reinforced with inorganic fillers and conventional polyethylene (PE), with a particular focus on resin production and end-of-life (EoL) disposal. The results indicated that production of PBAT blends is resource- and energy-intensive, with the mixing and drying phase identified as critical hotspots. Producing 1 kg of PBAT resin resulted in a total single-score impact of 921 mPt using the ReCiPe 2016 endpoint method, with the Human Health and Resource categories contributing nearly equally. The climate change impact assessed using the IPCC GWP 100a method was 8.64 kg CO2 eq/kg, with mixing and drying being the dominant contributor.
The EoL analysis provided critical insights that distinguish this study from prior works. While previous LCAs have primarily examined virgin PBAT or PBAT/PLA systems, this study shows that PBAT blends only surpass PE in environmental performance when composting is modeled as a substitution for inorganic fertilizer is implemented. Under this scenario, composting PBAT achieved net negative impacts of −53.9 mPt and carbon savings of 11.35 kg CO2-eq, effectively offsetting the burdens incurred during production. By contrast, PE disposed via landfill produced 288.8 mPt and 2.2 kg CO2-eq, reinforcing that without composting, PBAT cannot be considered environmentally preferable to PE. The sensitivity analysis further underscored the importance of production efficiency, demonstrating that a 30% reduction in electricity consumption can lower environmental impacts by up to 10%. Overall, these findings highlight that the environmental competitiveness of PBAT depends on both cleaner production processes and the availability of appropriate EoL treatment systems.
Author Contributions
Conceptualization, N.A.-S.; methodology, N.A.-S.; software, N.A.-S.; validation, N.A.-S., R.L., and A.G.; formal analysis, N.A.-S.; investigation, N.A.-S., A.S.M., and R.L.; resources, N.A.-S., A.S.M., and R.L.; data curation, N.A.-S., R.L., and A.G.; writing—original draft preparation, N.A.-S. and R.L.; writing—review and editing, N.A.-S., R.L., A.G., A.S.M.; visualization, N.A.-S.; supervision, A.S.M. and N.A.-S.; project administration, A.S.M., D.S., and N.A.-S.; funding acquisition, A.S.M. and D.S. All authors have read and agreed to the published version of the manuscript.
Funding
This research was funded by the University of British Columbia (UBC) Materials and Manufacturing Research Institute (MMRI) Circular Economy Seed Funding Program (CESF).
Data Availability Statement
The raw data supporting the conclusions of this article will be made available by the authors on request.
Acknowledgments
The authors gratefully acknowledge the support of their industry partner, CTK Bio Canada Inc., as well as funding provided by the CESF.
Conflicts of Interest
Author Arvind Gupta and Daniel Shum were employed by CTK Research and Development Canada Ltd. The remaining authors declare that the research was conducted in the absence of any commercial or financial relationships that could be construed as a potential conflict of interest.
Correction Statement
This article has been republished with a minor correction to the Data Availability Statement. This change does not affect the scientific content of the article.
References
- Shlush, E.; Davidovich-Pinhas, M. Bioplastics for Food Packaging. Trends Food Sci. Technol. 2022, 125, 66–80. [Google Scholar] [CrossRef]
- Ali, S.S.; Elsamahy, T.; Koutra, E.; Kornaros, M.; El-Sheekh, M.; Abdelkarim, E.A.; Zhu, D.; Sun, J. Degradation of conventional plastic wastes in the environment: A review on current status of knowledge and future perspectives of disposal. Sci. Total Environ. 2021, 771, 144719. [Google Scholar] [CrossRef]
- Nanda, S.; Patra, B.R.; Patel, R.; Bakos, J.; Dalai, A.K. Innovations in applications and prospects of bioplastics and biopolymers: A review. Environ. Chem. Lett. 2022, 20, 379–395. [Google Scholar] [CrossRef] [PubMed]
- Nizamuddin, S.; Baloch, A.J.; Chen, C.; Arif, M.; Mubarak, N.M. Bio-based plastics, biodegradable plastics, and compostable plastics: Biodegradation mechanism, biodegradability standards and environmental stratagem. Int. Biodeterior. Biodegrad. 2024, 195, 105887. [Google Scholar] [CrossRef]
- Peelman, N.; Ragaert, P.; De Meulenaer, B.; Adons, D.; Peeters, R.; Cardon, L.; Van Impe, F.; Devlieghere, F. Application of bioplastics for food packaging. Trends Food Sci. Technol. 2013, 32, 128–141. [Google Scholar] [CrossRef]
- Bishop, G.; Styles, D.; Lens, P.N.L. Environmental performance comparison of bioplastics and petrochemical plastics: A review of life cycle assessment (LCA) methodological decisions. Resour. Conserv. Recycl. 2021, 168, 105451. [Google Scholar] [CrossRef]
- Changwichan, K.; Silalertruksa, T.; Gheewala, S.H. Eco-efficiency assessment of bioplastics production systems and end-of-life options. Sustainability 2018, 10, 952. [Google Scholar] [CrossRef]
- Van Roijen, E.C.; Miller, S.A. A review of bioplastics at end-of-life: Linking experimental biodegradation studies and life cycle impact assessments. Resour. Conserv. Recycl. 2022, 181, 106236. [Google Scholar] [CrossRef]
- Roy, S.; Ghosh, T.; Zhang, W.; Rhim, J.W. Recent progress in PBAT-based films and food packaging applications: A mini-review. Food Chem. 2023, 437, 137822. [Google Scholar] [CrossRef]
- Zhou, S.-J.; Zhang, D.; Xiong, S.-J.; Liu, Q.; Shen, X.; Yu, S.; Sun, Z.; Wen, J.; Wang, L.; Yuan, T.-Q. A high-performance and cost-effective PBAT/montmorillonite/lignin ternary composite film for sustainable production. ACS Sustain. Chem. Eng. 2024, 12, 14704–14715. [Google Scholar] [CrossRef]
- Vinci, G.; Ruggieri, R.; Billi, A.; Pagnozzi, C.; Di Loreto, M.V.; Ruggeri, M. Sustainable management of organic waste and recycling for bioplastics: A lca approach for the italian case study. Sustainability 2021, 13, 6385. [Google Scholar] [CrossRef]
- Olagunju, O.A.; Kiambi, S.L. Life Cycle Analysis (LCA) of Bioplastics Compared to Conventional Plastics: A Critical Sustainability Perspective. In Biomass-Based Bioplastic and Films; Springer: Cham, Switzerland, 2024; pp. 175–205. [Google Scholar]
- Islam, M.; Xayachak, T.; Haque, N.; Lau, D.; Bhuiyan, M.; Pramanik, B.K. Impact of bioplastics on environment from its production to end-of-life. Process. Saf. Environ. Prot. 2024, 188, 151–166. [Google Scholar] [CrossRef]
- Akbarian-Saravi, N.; Sowlati, T.; Ahmad, H.; Hewage, K.; Sadiq, R.; Milani, A.S. Life cycle assessment of hemp-based biocomposites production for agricultural emission mitigation strategies: A case study. In Biocomposites and the Circular Economy; Elsevier: Amsterdam, The Netherlands, 2025; pp. 261–285. [Google Scholar] [CrossRef]
- Hobbs, S.R.; Harris, T.M.; Barr, W.J.; Landis, A.E. Life cycle assessment of bioplastics and food waste disposal methods. Sustainability 2021, 13, 6894. [Google Scholar] [CrossRef]
- Luo, C.; Zhou, Y.; Chen, Z.; Bian, X.; Chen, N.; Li, J.; Wu, Y.; Yang, Z. Comparative life cycle assessment of PBAT from fossil-based and second-generation generation bio-based feedstocks. Sci. Total Environ. 2024, 954, 176421. [Google Scholar] [CrossRef] [PubMed]
- Wang, B.-X.; Cortes-Peña, Y.; Grady, B.P.; Huber, G.W.; Zavala, V.M. Techno-economic analysis and life cycle assessment of the production of biodegradable polyaliphatic–polyaromatic polyesters. ACS Sustain. Chem. Eng. 2024, 12, 9156–9167. [Google Scholar] [CrossRef]
- Beber, V.C.; De Barros, S.; Banea, M.D.; Brede, M.; De Carvalho, L.H.; Hoffmann, R.; Costa, A.R.M.; Bezerra, E.B.; Silva, I.D.S.; Haag, K.; et al. Effect of Babassu natural filler on PBAT/PHB biodegradable blends: An investigation of thermal, mechanical, and morphological behavior. Materials 2018, 11, 820. [Google Scholar] [CrossRef] [PubMed]
- Choi, B.; Yoo, S.; Park, S.I. Carbon footprint of packaging films made from LDPE, PLA, and PLA/PBAT blends in South Korea. Sustainability 2018, 10, 2369. [Google Scholar] [CrossRef]
- Suwanmanee, U.; Charoennet, N.; Leejarkpai, T.; Mungcharoen, T. Comparative life cycle assessment of bio-based garbage bags: A case study on bio-PE and PBAT/starch. In Materials and Technologies for Energy Efficiency; Universal-Publishers: Boca Raton, FL, USA, 2015; pp. 193–197. [Google Scholar]
- Saibuatrong, W.; Cheroennet, N.; Suwanmanee, U. Life cycle assessment focusing on the waste management of conventional and bio-based garbage bags. J. Clean. Prod. 2017, 158, 319–334. [Google Scholar] [CrossRef]
- Itabana, B.E.; Mohanty, A.K.; Dick, P.; Sain, M.; Bali, A.; Tiessen, M.; Lim, L.; Misra, M. Poly(Butylene Adipate-Co-Terephthalate) (PBAT)-Based Biocomposites: A Comprehensive Review. Macromol. Mater. Eng. 2024, 309, 2400179. [Google Scholar] [CrossRef]
- International Standardization Organization. 2006. Available online: https://www.iso.org/standard/37456.html (accessed on 1 July 2025).
- Siracusa, V.; Ingrao, C.; Giudice, A.L.; Mbohwa, C.; Rosa, M.D. Environmental assessment of a multilayer polymer bag for food packaging and preservation: An LCA approach. Food Res. Int. 2014, 62, 151–161. [Google Scholar] [CrossRef]
- Perugini, F.; Mastellone, M.L.; Arena, U. A life cycle assessment of mechanical and feedstock recycling options for management of plastic packaging wastes. Environ. Prog. 2005, 24, 137–154. [Google Scholar] [CrossRef]
- Caceres-Mendoza, C.; Santander-Tapia, P.; Sanchez, F.A.C.; Troussier, N.; Camargo, M.; Boudaoud, H. Life cycle assessment of filament production in distributed plastic recycling via additive manufacturing. Clean. Waste Syst. 2023, 5, 100100. [Google Scholar] [CrossRef]
- Chen, G.; Li, J.; Sun, Y.; Wang, Z.; Leeke, G.A.; Moretti, C.; Cheng, Z.; Wang, Y.; Li, N.; Mu, L.; et al. Replacing Traditional Plastics with Biodegradable Plastics: Impact on Carbon Emissions. Engineering 2024, 32, 152–162. [Google Scholar] [CrossRef]
- Mark, A.J.H.; Steinmann, Z.J.; Elshout, P.M.; Stam, G.; Verones, F.; Vieira, M.D.M.; Hollander, A.; Zijp, M.; van Zelm, R. ReCiPe 2016: A Harmonized Life Cycle Impact Assessment Method at Midpoint and Endpoint Level Report I: Characterization; RIVM: Bilthoven, The Netherlands, 2016. [Google Scholar]
- Walichnowska, P.; Mazur, M.; Idzikowski, A. Implementation of modern films in the process of mass packaging of bottles based on the circular economy. Sci. Pap. Silesian Univ. Technol. Organ. Manag. Ser. 2024, 207, 2024. [Google Scholar] [CrossRef]
- Dadhwal, S.; Ashton, L.; Fraser, E.D.G.; Corradini, M.G. Life cycle assessment to evaluate bioplastics as alternatives to petroleum-based plastics in the food industry. In Innovative Food Packaging and Processing Technologies; Academic Press: Cambridge, MA, USA, 2024; pp. 449–473. [Google Scholar] [CrossRef]
- Hamed, T.A.; Alshare, A. Environmental Impact of Solar and Wind energy-A Review. J. Sustain. Dev. Energy Water Environ. Syst. 2022, 10, 1090387. [Google Scholar] [CrossRef]
- Salvi, A.; Arosio, V.; Compagnoni, L.M.; Cubiña, I.; Scaccabarozzi, G.; Dotelli, G. Considering the environmental impact of circular strategies: A dynamic combination of material efficiency and LCA. J. Clean. Prod. 2023, 387, 135850. [Google Scholar] [CrossRef]
- Weidema, B.P. Multi-user test of the data quality matrix for product life cycle inventory data. Int. J. Life Cycle Assess. 1998, 3, 259–265. [Google Scholar] [CrossRef]
- Data Quality Guideline for the Ecoinvent Database Version 3. Available online: https://lca-net.com/publications/show/overview-methodology-data-quality-guideline-ecoinvent-database-version-3/ (accessed on 1 July 2025).
- Akbarian-Saravi, N.; Sowlati, T.; Milani, A.S. Cradle-to-gate life cycle assessment of hemp utilization for biocomposite pellet production: A case study with data quality assurance process. Clean. Eng. Technol. 2025, 27, 101027. [Google Scholar] [CrossRef]
- Akbarian-Saravi, N.; Sowlati, T.; Fry, D.; Milani, A.S. Techno-economic analysis and multi-criteria assessment of a hemp-based biocomposite production supply chain: A case study. In Biocomposites and the Circular Economy; Elsevier: Amsterdam, The Netherlands, 2025; pp. 287–321. [Google Scholar] [CrossRef]
- Akbarian-Saravi, N.; Sowlati, T.; Milani, A.S. A Robust Analytical Network Process for Biocomposites Supply Chain Design: Integrating Sustainability Dimensions into Feedstock Pre-Processing Decisions. Sustainability 2025, 17, 7004. [Google Scholar] [CrossRef]
- Akbariansaravi, N. A Sustainability Assessment Model for Selecting Pre-Processing Equipment in Hemp-Based Biocomposite Supply Chains Under Techno-Economic, Environmental, and Social Measures. Ph.D. Thesis, University of British Columbia, Vancouver, BC, Canada, 2025. [Google Scholar]
Disclaimer/Publisher’s Note: The statements, opinions and data contained in all publications are solely those of the individual author(s) and contributor(s) and not of MDPI and/or the editor(s). MDPI and/or the editor(s) disclaim responsibility for any injury to people or property resulting from any ideas, methods, instructions or products referred to in the content. |
© 2025 by the authors. Licensee MDPI, Basel, Switzerland. This article is an open access article distributed under the terms and conditions of the Creative Commons Attribution (CC BY) license (https://creativecommons.org/licenses/by/4.0/).