Article

Subsidy Ceilings and Sequential Synergy: Steering Sustainable Outcomes Through Dynamic Thresholds in China’s Urban Renewal Tripartite Game

1
School of Architecture and Civil Engineering, Xihua University, Chengdu 610039, China
2
School of Civil and Environmental Engineering, Oklahoma State University, Stillwater, OK 74078, USA
3
School of Investment and Construction Management, Dongbei University of Finance and Economics, Dalian 116025, China
*
Author to whom correspondence should be addressed.
Sustainability 2025, 17(19), 8713; https://doi.org/10.3390/su17198713
Submission received: 19 August 2025 / Revised: 24 September 2025 / Accepted: 26 September 2025 / Published: 28 September 2025
(This article belongs to the Special Issue Sustainable Development of Construction Engineering—2nd Edition)

Abstract

Aligning with the UN Sustainable Development Goals (SDGs 11 and 13), this study examines how dynamic subsidy thresholds steer environmental resilience, social inclusion, and fiscal sustainability in China’s urban renewal. Using evolutionary game theory (EGT) and system dynamics (SD), stakeholder strategies are modeled under varying policy interventions, with key parameters calibrated through Chongqing’s LZ case and MATLAB simulations. These include government subsidies (M1, M2), penalties (S2), and stakeholder benefits (R1–R5). The results reveal the following two distinct types of critical thresholds: a universal and robust fiscal warning line for developers (M1 > 600 k RMB) and a threshold for residential subsidies that is moderated by psycho-social factors (M2), with its value fluctuating within a certain range (approximately 550 k RMB to 850 k RMB). A sequential synergy pathway is proposed: “government-led facilitation → developer-driven implementation (when R3 > 450 k RMB) → resident participation (triggered by R2 > 150 k RMB).” The study advocates differentiated incentives and penalties, prioritizing early-stage governmental leadership to foster trust, promote inclusive participation, and align with environmental, social, and economic sustainability goals. This integrated framework reveals critical policy leverage points for enhancing social and fiscal resilience, providing a replicable model for sustainable and resilient urban governance in the Global South.

1. Introduction

Urban regeneration is becoming more recognized as important for sustainable development with rapid urbanization, aligning closely with the United Nations Sustainable Development Goals (SDGs), particularly Goal 11: Sustainable Cities and Communities [1], and Goal 13: Climate Action [2]. This is especially true for aging communities facing declining infrastructure and low livability [3], where renewal projects are critical for enhancing ecological resilience, improving resource efficiency, and promoting inclusive urban transformation. In China, initiatives like the “Shuang Xiu” policy focus on community-centered regeneration. But their implementation has faced challenges. These challenges come from conflicts among three key stakeholders. The government wants to achieve policy effectiveness, despite fiscal constraints (R4). Developers want viable returns (R3). Residents resist displacement unless they are given tangible benefits (R2) [4,5]. Collaborative governance is often suggested as a solution. But existing static analyses do not capture the dynamic negotiations of benefits among these actors. These negotiations happen in response to policy incentives and are essential for achieving long-term social, economic, and environmental sustainability.
Existing research is largely confined to two dimensions. Theoretically, the stakeholder framework identifies sources of conflict [6], yet it neglects bounded rationality and the evolution of strategic behavior over time [7]. Methodologically, game-theoretic models assume complete rationality [8], whereas qualitative case studies (e.g., co-financing in Singapore or FAR incentives in Japan) offer context-specific insights but fail to provide generalized tools for simulating policy effects [9]. Therefore, several key research questions remain:
  • Above what critical levels do financial subsidies lead to a deterioration of cooperation? Do these critical levels show different stability for different types of subjects (e.g., developers vs. residents)?
  • What quantitative thresholds cause a shift from conflict to collaboration in multi-party relationships?
  • Why have community residents been slow to adopt collaborative behaviors [10,11]?
This study bridges these gaps by synthesizing Evolutionary Game Theory (EGT) and System Dynamics (SD). This integrated approach allows us to quantify dynamic trajectories and nonlinear policy effects, such as subsidy ceilings, which remain undetected in static analyses. Focusing on Chongqing’s LZ, a historical center experiencing renewal tensions, the simulation aims to simulate the evolution of strategies among the government, developers, and residents. A unique analytical framework is proposed, capable of quantifying the dynamic trajectories of stakeholder evolution from a low-equilibrium state (e.g., strategy combination (0,0,0)) to a cooperative (1,1,1) state and elucidating the successive convergence mechanism of “government guidance → developer response → community residents’ participation”. By combining evolutionary game theory and system dynamics (SD), this paper identifies several key policy leverage points. For example, when the government financial subsidy exceeds certain thresholds, the originally stable cooperative structure can rapidly destabilize. Furthermore, the policy parameters are linked to agent-based learning mechanisms, thereby enhancing the practical applicability of collaborative governance theory. At the theoretical level, this paper constructs a stage-by-stage evolutionary framework of “resource introduction → factor integration → collaborative governance”, thereby extending the boundaries of evolutionary game theory within urban governance research. At the practical level, the optimal range of developer subsidies is identified (e.g., M1 = 150 k–600 k RMB), and it is found that, compared with pure cash incentives, effective government financial subsidies exceed 1000 k RMB. Critically, China’s “people-centered” renewal model offers useful insights for countries in the Global South facing similar urbanization challenges. These include upgrading informal settlements in Southeast Asia and urban restructuring in post-colonial Africa. Static policy analyses do not capture threshold effects, such as subsidy limits at M1 = 600 k RMB for developers. This leads to fiscal inefficiencies and stakeholder distrust, ultimately undermining the sustainability of urban transformation efforts. Understanding these dynamic interactions is critical for designing policies that are not only effective but also resilient—able to withstand fiscal pressures, maintain social cohesion, and promote long-term environmental sustainability.
The rest of the paper is as follows. Section 2 reviews the literature related to community renewal and analyzes research progress and shortcomings; Section 3 identifies the core demands and behavioral assumptions of the three types of participants; Section 4 develops a three-party evolutionary game model and analyzes its evolutionary stability; Section 5 constructs a system dynamics model and performs sensitivity simulations; and Section 6 and Section 7 discuss the implications for theories, policies, and sustainable urban transformation.

2. Literature Review

Urban renewal now focuses on integrated sustainability instead of only physical transformation. This new approach matches circular economic principles. It emphasizes resource efficiency, such as reusing materials in regeneration. It also supports climate-resilient infrastructure upgrades [12]. However, putting these ideas into practice remains difficult. Ongoing conflicts among multiple stakeholders slow progress. Early urban regeneration mainly aimed at slum clearance and economic benefits [13,14]. Later, the goals expanded to include environmental resilience, social cohesion, and economic improvement [15]. In China, this shift faces specific challenges. Government-led projects often ignore residents’ needs. This leads to demolition conflicts, spatial oppression, and social tension [16,17]. Market-led redevelopment also finds it hard to balance the interests of various groups [16,18]. Some programs try to increase community participation. For example, Chongqing’s Resident Rehabilitation Committee seeks to empower residents. But these efforts often face problems. Information gaps and institutional distrust reduce their effectiveness [19,20]. The challenges of institutional distrust, conflicting stakeholder interests, and fiscal constraints are not unique to China but are endemic to urban renewal across the Global South. Similarly, funding limitations and participatory gaps have been observed in large-scale informal settlement upgrading programs in Lagos, Nigeria [21], where top-down approaches often fail to garner resident trust. Parallel challenges of market-driven displacement and community resistance are also documented in Jakarta, Indonesia [22].
Current theories about these conflicts are often static. Stakeholder theory sees governments, developers, and residents as key actors with different goals [23,24,25]. But most studies limit their interactions to equilibrium models [8] or general governance ideas [6]. These methods miss three key dynamic mechanisms important for policy simulation [26]. First, actors have limited rationality. They learn and imitate others over time. They do not make perfect decisions immediately [7]. Second, policy tools like subsidies (M1, M2) and penalties (S2) are time-sensitive and have threshold effects. These effects are invisible in static studies [27,28]. Third, real-world cases show that cooperation in urban renewal happens step by step. The government starts first and offers incentives. Developers react next. Residents become involved last. This sequence is not captured in current game models [10].
Evolutionary Game Theory (EGT) provides a useful framework for studying these issues. However, using it in real situations has certain limitations. EGT can model how people learn in public goods games. But few urban renewal studies use it to include policy feedback or long-term cooperation under sustainability governance [29]. Some countries have tried specific solutions. Japan used market incentives like FAR bonuses [30]. Singapore built trust through co-funded voting systems [31]. Yet these methods are hard to transfer directly to China. China’s governance system is more state-centered. This leads to two important questions. How can the three main stakeholders change from conflict to cooperation after policy changes? What practical steps can help them stabilize cooperation faster?
This aligns with recent advances in modeling complex stakeholder dynamics in infrastructure projects, as seen in [32]. This study fills research gaps by combining evolutionary game theory (EGT) with system dynamics (SD). It draws on collaborative governance theory, which stresses the value of “networked participation” [33]. The model treats stakeholder interactions as an evolutionary system. Policy parameters can change how these actors make decisions. Unlike traditional static methods, this model captures three dynamic elements. First, it shows phase transitions, such as from government initiation to developer involvement and finally to resident purchases. Second, it reveals nonlinear policy effects. For example, cooperation breaks down when subsidies pass a certain level. Third, it includes time lags in how residents respond. These delays are a major bottleneck in China’s renewal process [34]. This simulation approach offers practical insights. It helps build institutional trust and can support sustainable urban renewal in China and other Global South regions.

3. Research Methodology

3.1. Problem Statement

In community renewal, the government acts as the public affairs administrator. It holds legal power to promote economic growth and raise land value. It also works to improve living conditions through urban renewal. These efforts aim to boost the city’s competitiveness and support long-term sustainability [35,36]. However, the government must balance many competing goals. These include efficiency against equity, economic development against social stability, and short-term results against long-term sustainability. Managing these conflicts and economic risks is an ongoing challenge. Developers act as implementers in renewal projects. Their main goal is to maximize profit. They often try to lower quality standards, reduce compensation costs, and use government connections to gain policy advantages [18]. Residents are essential participants in renewal. Their main needs are a better living environment and improved quality of life. For a long time, residents held a relatively weak position in the process. But as government rules improve, their rights are gradually better protected. Successful community renewal depends on balancing these different interests. It also requires cooperation among all three groups. Effective coordination is necessary to achieve outcomes that are environmentally responsible, socially fair, and economically sustainable [37].
The government, residents, and developers are the main stakeholders in community renewal. Their choices greatly affect how renewal projects are carried out. These decisions help determine whether a project supports sustainable urban development. This paper uses collaborative decision-making theory [38] to help these groups resolve conflicts. Through communication, information sharing, and joint decisions, they can reach an agreement. This approach improves decision-making efficiency and integrates sustainability principles. The study framework is shown in Figure 1.

3.2. Model Assumptions and Construction of Payment Matrix

In a community renewal project, the primary game interactions occur between the government and community residents, the government and developers, and developers and community residents. These interactions involve both conflicts and cooperation, with the common goal of all three parties being to improve the community’s living standards.
This study employs an evolutionary game model, which, unlike traditional game theory, aligns more closely with the relationships among stakeholders in community renewal due to its incorporation of finite rationality. Evolutionary game theory posits that individuals typically reach a game equilibrium (dynamics) through iterative attempts. In this framework, participant behavior is constrained and does not require complete reliance on perfect information.
Based on an analysis of the three primary stakeholders in community renewal and renovation projects—the government, community residents, and developers—the following assumptions for constructing the three-party game model are established, with the specific parameters outlined in Table 1.
Hypothesis 1.
The government, residents, and developers all show limited rationality. They continuously learn and adjust their strategies based on experience. Each party aims to maximize its own benefits within given conditions. For example, developers may change their behavior in response to government policies and market demands. Over time, they may choose to join community renewal projects [39]. Similarly, as the government works to improve public welfare and as information becomes more open, residents may update their strategies. They can become more willing to take part in renewal activities. This helps them protect their rights and shape future living conditions. The government’s behavioral strategy is {incentive, disincentive}, and the probability of occurrence is (x,1 − x). The behavioral strategy of the resident group is {participation, non-participation}, with probability of occurrence (y,1 − y). The developer’s behavioral strategy is {remodeling, no remodeling} with the probability of occurrence (z,1 − z), where x, y, and z satisfy (0 < x ≤ 1; 0 < y ≤ 1; 0 < z ≤ 1).
Hypothesis 2.
The government can choose to use incentives for community renewal. This decision requires the government to pay a cost, called C1. The government also provides policy support, such as tax breaks labeled M1. These actions help to increase social benefits, referred to as R4. If the government does not offer incentives, developers will not be motivated to participate. Then the government must bear a cost alone, called C2. When residents participate, the government provides them with incentives, called M2. A good incentive program encourages developers and residents to work together. This cooperation improves the government’s political performance. Because of this improved performance, the government may then receive rewards from higher authorities. These rewards are labeled W.
Hypothesis 3.
A developer might choose not to cooperate. If the developer does not join the community renewal project, the social benefit remains at a normal level, called R5. If the developer chooses to cooperate and participate, the developer will provide project funding, called C4. By participating, the developer will also gain financial benefits. These benefits are labeled R3.
Hypothesis 4.
When the government is not incentivized, the residents are not active, and the developers are not cooperative, the government is punished and loses S2.
Based on the above variable settings and related hypotheses, we construct a three-party evolutionary game model based on the government, developers, and community residents. According to the set of evolutionary game strategies of the government, residents, and developers, the community renewal game system contains a total of eight strategy combinations, and the three-party evolutionary game model is built based on this. The parameter settings and decision tree of the game model are shown in Figure 2 and Table 1.
Based on the above assumptions, the mixed-strategy game matrix of the government, community residents, and community residents is shown in Table 2.

4. Model Construction and Analysis

Based on the benefit matrix shown in Table 2, the replication dynamics equations for the government, community residents, and developers can be calculated. Replication dynamics is one of the core parts of evolutionary game theory [43]. It is a dynamic differential equation that describes the frequency or intensity of the use of a certain strategy in a group [44]. This framework enables analysis of strategy stability among participants. The replication dynamics model conceptualizes the population as a continuous entity. Although actual stakeholder numbers are finite, this deterministic approximation remains standard in Evolutionary Game Theory (EGT). The model facilitates the identification of evolutionary stable strategies (ESSs) and analysis of system dynamics. It provides robust insights into anticipated directions of strategic evolution.

4.1. Participant Stability Analysis

4.1.1. Government Stability Analysis

The notation V 11 represents the expected return when the government adopts the “incentive” strategy, V 12 to denote the expected return when the government adopts the “disincentive” strategy, and V x to denote the average expected return when the government chooses the mixed strategy. By calculating the expected return and average return, the replication dynamic equation is as follows. The detailed calculation procedure is shown in the Appendix A.
F x = d x d t = x V 11 V x = x x 1 [ C 1 R 4 S 2 W z · ( C 2 M 1 S 2 ) + y · ( M 2 + S 2 C 1 ) + y z · ( C 1 S 2 ) ]
d F ( x ) d x = 2 x 1   [ C 1 R 4 S 2 W z · ( C 2 M 1 S 2 ) + y · ( M 2 + S 2 C 1 ) + y z · ( C 1 S 2 ) ]
According to the stability theorem of differential equations [45], the probability that the government chooses an “incentive” strategy is in a steady state and must satisfy: F x = 0 and d F x d x < 0 . When F x = 0 , the government’s unilateral stable evolution point can be obtained: z ( y ) * = ( W + R 4 + S 2 C 1 + y · ( C 1 M 2 S 2 ) ) ( M 1 + S 2 ( 1 y ) ) .
As shown in Figure 3: (a) When z = z ( y ) * , F x 0 . This means that all points on the x-axis remain stable regardless of any value taken by x. When z z ( y ) * , x = 0 and x = 1 are the two evolutionarily stable equilibrium points, i.e., both government disincentives and government incentives are stable. (b) When z < z ( y ) * , then d F x d x | x = 0 > 0 , and d F x d x | x = 1 < 0 . x = 1 is the ESS, which means that the government has chosen “incentive” as the evolutionary stable strategy. (c) When z > z ( y ) * , then d F x d x | x = 0 < 0 , and d F x d x | x = 1 > 0 , then x = 0 is an ESS, i.e., the government chooses “no incentive” as the evolutionary stabilization strategy.

4.1.2. Stability Analysis of Community Residents

The expected return for community residents adopting the “active participation” strategy is denoted as V 21 , while the expected return for the “non-participation” strategy is denoted as V 22 , and the average expected return for the mixed strategy is denoted as V y . Therefore, the replication dynamics of community residents are as follows. The detailed calculation process is shown in the Appendix A.
F y = d y d t = y V 21 V y = y y 1 ( R 2 R 1 C 3 + S 1 + x · M 2 )
d F ( y ) d y = 1 2 y ( R 2 R 1 C 3 + S 1 + x · M 2 )
According to the stability theorem of differential equations, the evolutionary stable strategy condition for community residents is: y = 0 and d F y d y < 0 . When d F y d y = 0 , the unilateral evolutionary stabilization point of community residents can be obtained x * = ( R 2 + R 1 + C 3 S 1 ) M 2 . As shown in Figure 4: (a) When x = x * , then F y 0 , indicating that any point on the y-axis is a steady state regardless of the value of y taken. When x x * , then y = 0 and y = 1 are the two evolutionary stable equilibrium points, i.e., both negative and active resident participation are stable points. (b) When x < x * , then d F y d y | y = 0 < 0 , d F y d y | y = 1 > 0 . Then y = 0 is ESS, i.e., residents choose “non-participation” as an evolutionarily stable strategy. (c) When x > x * , then d F y d y | y = 0 > 0 , d F y d y | y = 1 < 0 . Then y = 1 is ESS, i.e., residents choose “active participation” as the evolutionary stabilization strategy.

4.1.3. Developer Stability Analysis

The expected return for the developer adopting the “remodeling” strategy is denoted as V 31 , while the expected return for adopting the “no remodeling” strategy is denoted as V 32 , and the average expected return for the mixed strategy is denoted as V z . Therefore, the dynamic equation of the developer’s replication is as follows. The detailed calculation procedure is shown in the Appendix A.
F z = d z d t = z V 31 V z = z z 1 ( C 4 R 3 + R 5 x · M 1 )
d F ( z ) d z = 1 2 z ( C 4 R 3 + R 5 x · M 1 )
According to the stability theorem for differential equations, the developer’s evolutionarily stable strategy conditions are F z = 0 and d F z d z < 0 . When d F ( z ) d z = 0 , the unilateral evolutionary stabilization point of the developer can be obtained x * * = C 4 R 3 + R 5 M 1 . As shown in Figure 5: (a) When x = x * * , then F z 0 , indicating that it is a stable state regardless of any value of z. When x x * * , then z = 0 and z = 1 are two evolutionary stable equilibrium points, i.e., the developer’s no-remodeling and remodeling are both stable points. (b) When x < x * * , the d F z d z | z = 0 < 0 , d F z d z | z = 1 > 0 . Then z = 0 is ESS, i.e., the developer chooses “no retrofit” as the evolutionary stabilization strategy. (c) When x > x * * , the d F z d z | z = 0 > 0 , d F z d z | z = 1 < 0 . Then z = 1 is ESS, i.e., the developer chooses “retrofit” as the evolutionary stabilization strategy.

4.2. Analysis of System Evolutionary Stability Points

The joint replication dynamic equations F x , F y , and F z define a three-dimensional dynamical system that models the evolutionary dynamics of the government, residents, and developers. This system remains stable when the expectations for the different strategies of the government, residents, and developers align, which is expressed by the following set of replication dynamic equations. The replication dynamic system is shown in Equation (7).
F x = d x d t = x x 1   [ C 1 R 4 S 2 W z · ( C 2 M 1 S 2 ) + y · ( M 2 + S 2 C 1 ) + y z · ( C 1 S 2 ) ] F y = d y d t = y y 1   ( R 2 R 1 C 3 + S 1 + x · M 2 ) F z = d z d t = z z 1   ( C 4 R 3 + R 5 x · M 1 )
Let F x = F y = F z = 0 , then the replicated dynamic system can be derived that the game evolution system of the three-party core interest subjects has eight pure strategy local evolutionary stable equilibrium points, which are (0,0,0), (1,0,0), (0,1,0), (0,0,1), (1,1,0), (1,0,1), (0,1,1), (1,1,1). Due to the various evolutionary competitions, the stability of the replicated dynamical system can only be achieved under strict Nash equilibrium conditions. If the replicated dynamic system represents an evolutionary game equilibrium that is asymptotically stable, it must satisfy the conditions for Nash equilibrium, which must be a pure strategy equilibrium. Thus, this study focuses solely on examining the evolutionary stability of the eight pure strategy equilibrium points.
Friedman proposed a method based on the evolutionary model Jacobi matrix for determining the stability of local equilibrium points, and in this way determined the evolutionary stabilization strategy (ESS) of the system [46]. The partial derivatives of the replicated dynamic equations of the government, community residents, and developers, respectively, and the points in the Jacobi matrix can then be obtained, and the construction of the Jacobi matrix is shown in Equation (8). The specific calculation procedure is shown in the Appendix A.
J = F ( x ) x F ( x ) y F ( x ) z F ( y ) x F ( y ) y F ( y ) z F ( z ) x F ( z ) y F ( z ) z
Lyapunov’s law requires that this equilibrium point is stable only when all the eigenvalues λ of the Jacobian matrix are less than 0, defined as the sink; when one eigenvalue of the Jacobian matrix is positive, the equilibrium point is unstable and is the source point; and when the eigenvalues of the Jacobian matrix are either two negative or one positive or two positive or one negative, it is the saddle point. By bringing the equilibrium points under these eight pure strategies into the Jacobian matrix, the corresponding eigenvalues can be computed, as summarized in Table 3. Since the sign of the eigenvalues depends on the magnitude of the different parameter values, stability analysis of the replication dynamic system remains conditional and context specific. In the subsequent case study chapter (Section 5.2), a baseline parameter set is defined, from which specific values for these eigenvalues are calculated to facilitate an explicit stability discussion.
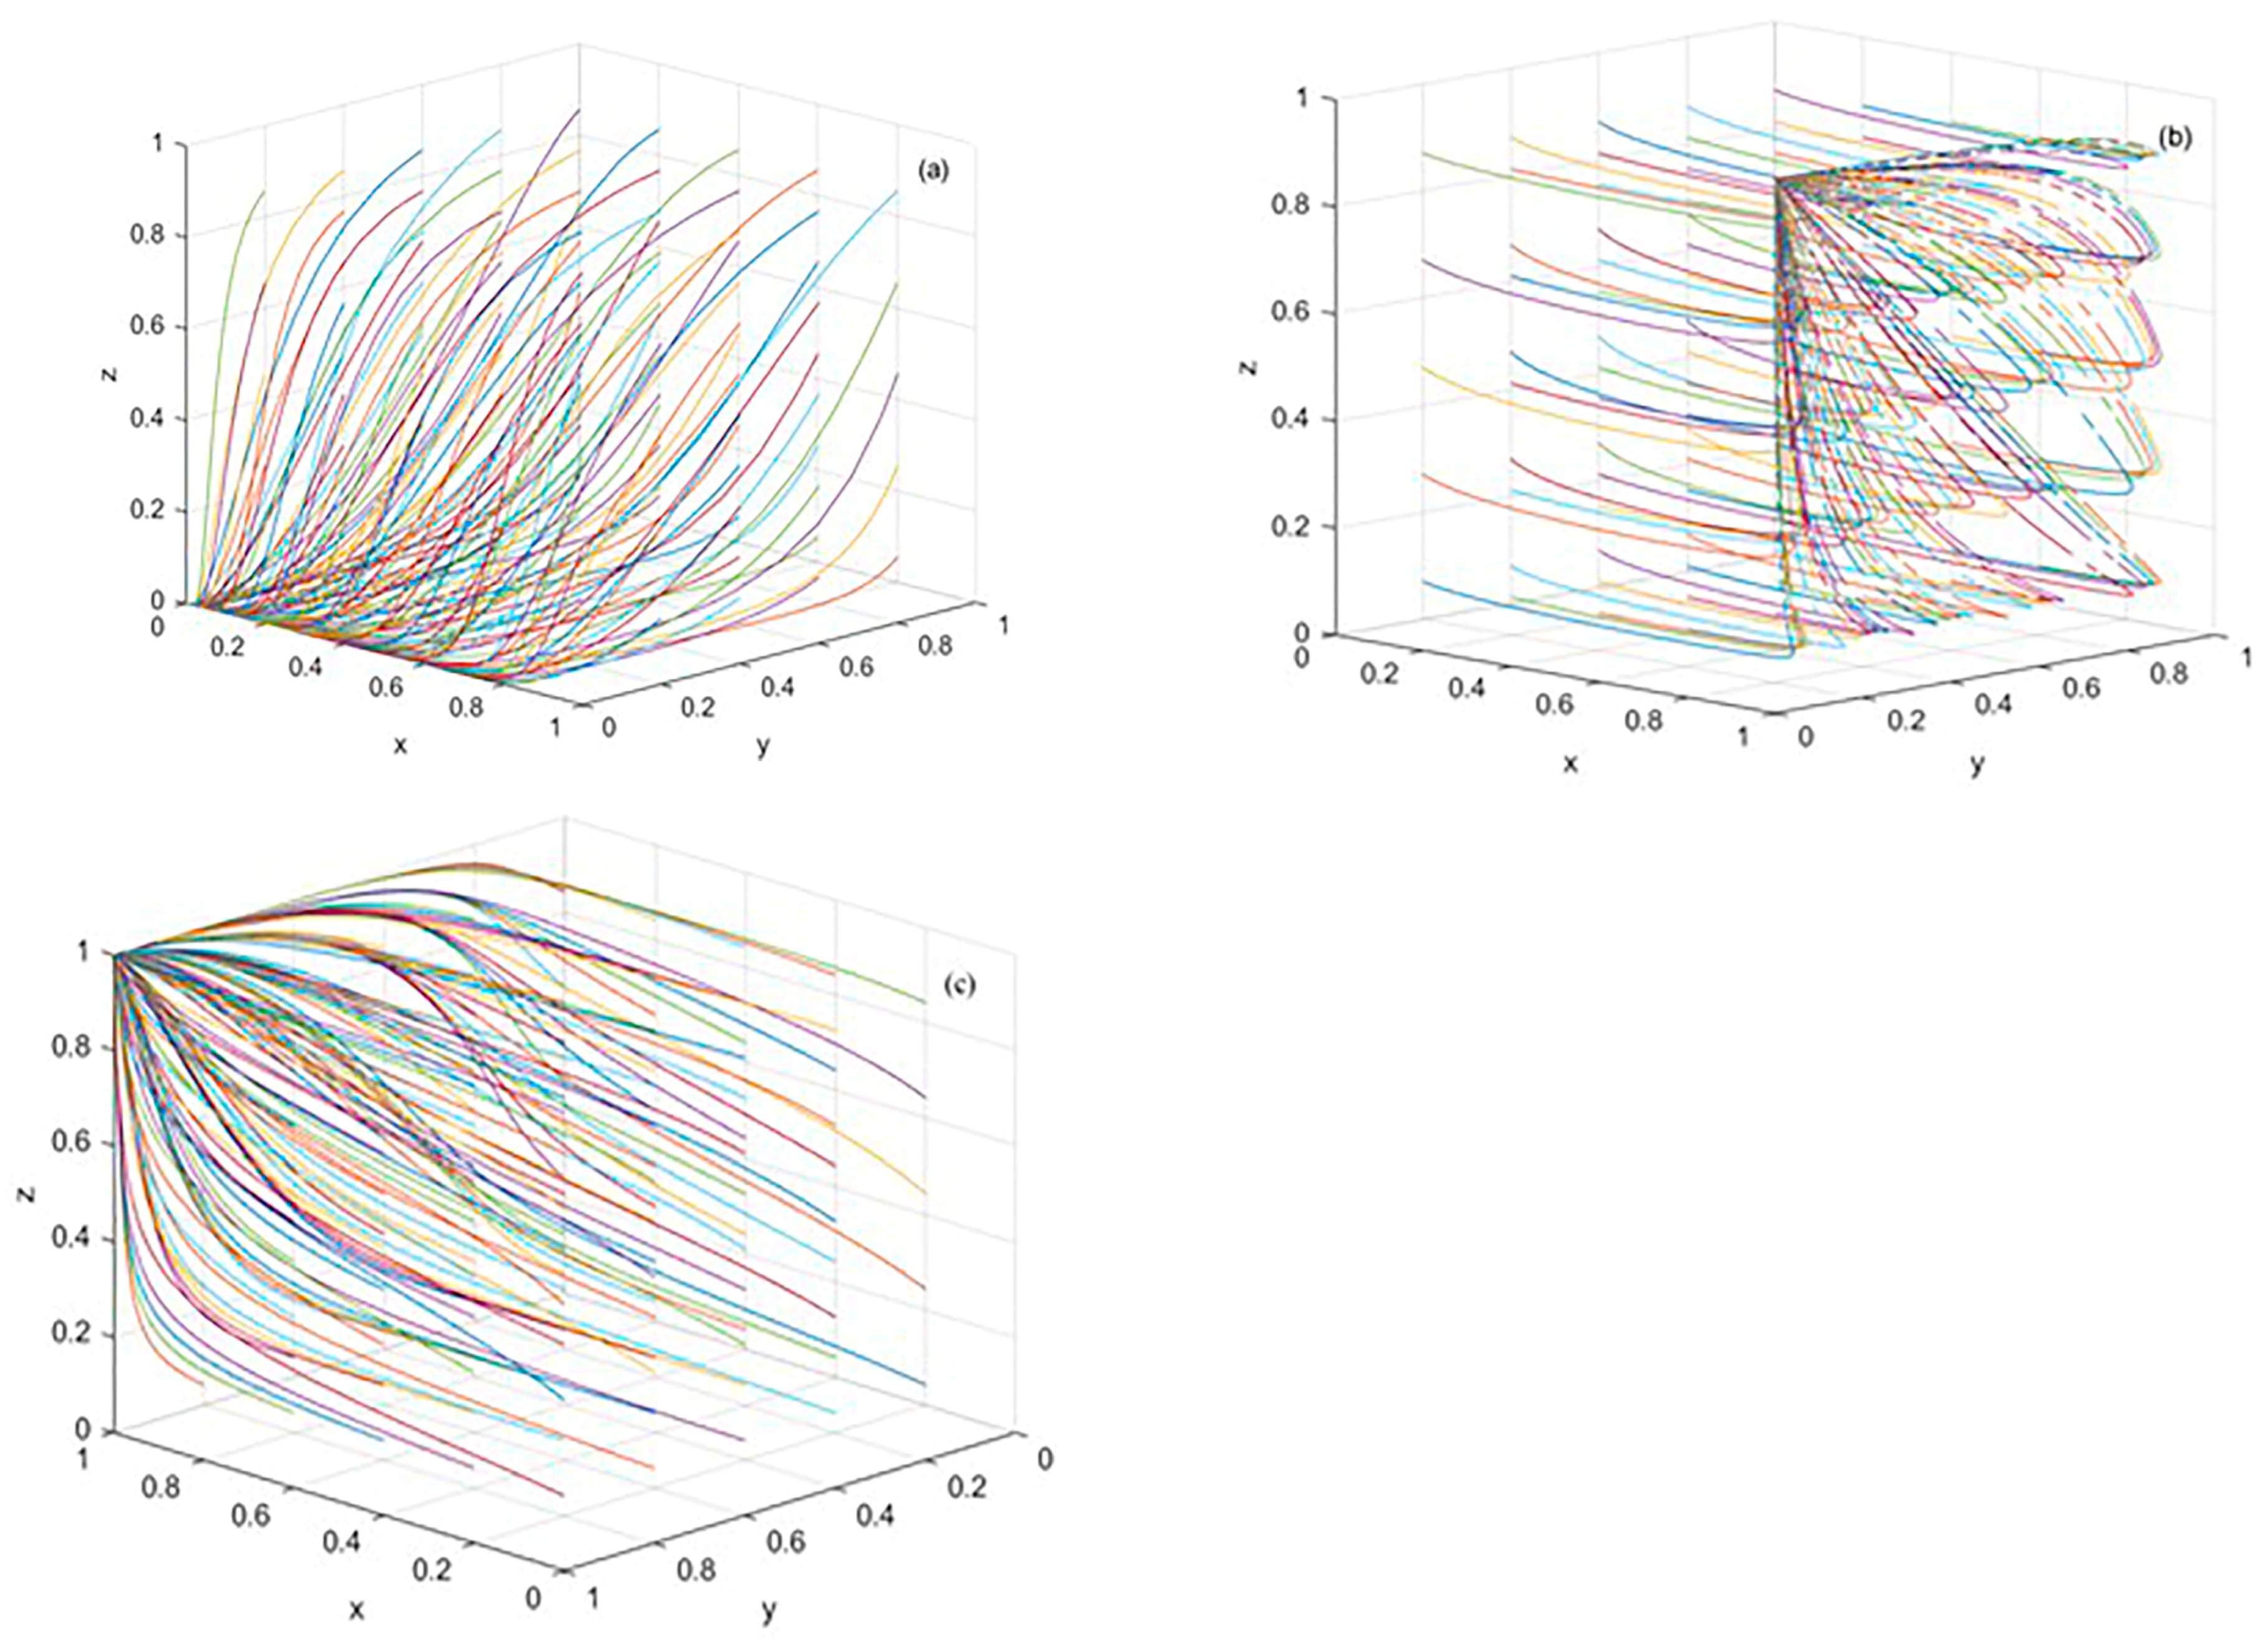
When the three-dimensional dynamical system satisfies the evolutionary stability condition, eight pure strategy equilibrium points are derived from the above three-dimensional system of equations H, H1 (0,0,0), H2 (1,0,0), H3 (0,1,0), H4 (0,0,1), H5 (1,1,0), H6 (1,0,1), H7 (0,1,1), H8 (1,1,1). H2 (1,0,0), H3 (0,1,0), H5 (1,1,0) are the three points of equilibrium, because the developer chooses not to cooperate, and will not participate in community renewal, which is not in line with the reality of the demand for collaborative development of community regeneration, and therefore we do not take into account these points of equilibrium. H7 (0,1,1) is the ideal state of community regeneration in the future, regulated by the market. H7 (0,1,1) is the ideal state of future development of community regeneration, which is regulated by the market and does not need to be incentivized by the government to realize community regeneration, but this paper discusses the synergy of the three parties to achieve the win–win situation of all parties’ interests, so it is also not discussed. The equilibrium points (0,0,0), (1,0,1), and (1,1,1) are ESSs. According to the circular economy life cycle theory [47], community regeneration can be divided into three phases: the resource-oriented phase (0,0,0), the factor integration phase (1,0,1), and the shared governance and synergy stage (1,1,1). The stability of community renewal in different periods is analyzed as follows.
Resource-oriented stage: In the resource-oriented stage of a community renewal project, none of the three parties has fully cooperated, and all of them have a wait-and-see or resistant attitude. The government has not implemented incentive policies, and residents are concerned about potential harm to their interests and the high costs of participation, while developers are reluctant to cooperate due to substantial capital investments and low returns. Therefore, the equilibrium point of this stage is (0,0,0). As shown in Table 3, the three conditions for this point as ESSs are: (1) R4 + W + S2 < C1: Governments tend to choose a “no incentive” strategy when the social benefits and incentives are not sufficient to cover the costs of the program. (2) R2 + S1 < R1 + C3: Community residents tend to choose “non-participation” strategies when the benefits to residents are not sufficient to offset the costs of participation. (3) R3 < R5 + C4: Developers tend to choose the “no rehabilitation” strategy when their returns are lower than what they would obtain if they did not participate. The resource-oriented phase of community renewal is shown in Figure 6a.
Element Integration Stage: With the continuous promotion of urban renewal policies, community renewal has gradually become an important part of the city’s function and image. The government fosters multi-party collaborative renovation through policies such as financial subsidies and tax incentives, while developers have progressively acknowledged the market potential and branding opportunities. However, residents remain hesitant to participate due to concerns over relocation costs, lack of trust, and uncertain returns. Despite the gradual optimization of the institutional environment, residents continue to hesitate to engage in community renewal, primarily due to relocation costs, mistrust, and unclear benefit perceptions. Thus, the equilibrium point at this stage is (1,0,1). As shown in Table 3, the following conditions need to be met for this point to become an ESS: (1) C1 + M1 < R4 + W + C2: When government subsidies and incentives are smaller than the social benefits and rewards received, the government tends to choose the “incentive” strategy; (2) M2 + R2 + S1 < C3 + R1: When the benefits and subsidies to residents should be less than the costs and social benefits of participation, community residents tend to choose the “non-participation” strategy; (3) C4 + R5 < M1 + R3: When the developer’s subsidies and revenues should be greater than the project’s construction funds and normal returns, the developer tends to choose the “renovation” strategy. The elemental integration stage of community renewal is shown in Figure 6b.
The co-governance and synergy stage: With improvements in the policy system and the stabilization of government incentives, public trust has significantly increased, with developers viewing community renewal as a stable investment opportunity and residents experiencing improvements in both the environment and quality of life due to their active participation. Consequently, trust gradually builds, and their willingness to participate grows. At this stage, win–win benefits emerge through synergy among the three parties. Thus, the equilibrium point corresponding to the co-management and synergy stage is (1,1,1), representing the evolutionary stabilization strategy that most closely aligns with the ideal of community renewal. Table 3 presents the three conditions for ESSs at this equilibrium point: (1) C1 − C2 + M1 + M2 − R4 − W < 0: Government incentives and subsidies are smaller than project construction funds, social benefits, and rewards, marking the government inclined to choose the “incentive” strategy; (2) C3 − M2 + R1 − R2 − S1 < 0: When the cost of participation is less than the government subsidy and additional benefits, residents are more likely to adopt the “active participation” strategy; (3) C4 − M1 − R3 + R5 < 0: When the developer’s construction capital and normal returns are less than the government subsidies, incentives and economic returns, the developer tends to choose the “retrofit” strategy. This leads to (1,1,1) evolutionary stabilization strategy. The stage of community renewal is shown in Figure 6c.
Throughout the system’s evolution from the initial game state to a stable strategy set, core stakeholders adopt stable strategies in a defined sequence. First, the government, as the dominant party, establishes its stable strategy through incentives and policy guidance. Next, developers, after observing the continuity of government incentives and the predictability of project benefits, gradually adjust their strategies toward cooperative participation. Finally, community residents form a stable tendency to participate once they perceive the tangible benefits of community regeneration and environmental improvements. Therefore, the evolutionary path shows a strategy establishment sequence of “government–developer–residents”, ultimately converging to a stable cooperative strategy set (1,1,1).

5. System Dynamics Simulation

To further validate and test the model, and to reflect the dynamic evolution of the behavioral decisions of the government, developers, and community residents more clearly and intuitively, this chapter uses MATLAB 2024a simulation software to simulate and analyze the evolution path of the equilibrium point of (1,1,1) and the various parameters according to the above dynamic equations of the tripartite replication of the main body of the community renewal and the assumption conditions. In doing so, the simulation not only examines strategic stability but also evaluates the environmental, social, and economic sustainability implications of different policy scenarios. Considering that there is a lack of accurate development data about community renewal and renovation projects, this paper refers to the actual case background of the LZ area and combines the literature analysis to set the relevant parameters.

5.1. Background

Considering the lack of accurate development data on community renewal and transformation projects, this study draws on the actual case background of the LZ area and incorporates literature analysis to define the relevant parameters.
Jiefangbei, a key landmark in Chongqing and the city’s downtown center, includes the LZ area, which holds significant historical and cultural value. However, the area has a complex ownership history, involving various government departments, private enterprises, and residents. This results in significant coordination challenges in planning and management. Additionally, the LZ serves as a focal point for multiple interest groups, with the government responsible for guidance and regulation, the market driving economic development, and residents and merchants focusing on public services and historical preservation. The interplay of these competing interests makes Jiefangbei a prime example of the intersection between government, market, and social forces. Field research identifies several challenges in the area, including aging buildings, inadequate public facilities, and poor transportation connectivity. Furthermore, the area’s cultural continuity and character are lacking, presenting obstacles to both cultural and economic development.

5.2. Initial Parameters and Data Sources

In community renewal, due to differing interests and behavioral strategies among stakeholders, frequent iterations of the game are required to achieve desired outcomes. This study employs MATLAB R2021a simulation software to identify the conditions under which the three parties reach an evolutionary stable strategy, such as C1 − C2 + M1 + M2 − R4 − W < 0, C3 − M2 + R1 − R2 − S1 < 0, and C4 − M1 − R3 + R5 < 0. Simulation parameters are then defined based on the context of the actual case study. To ensure the reliability and scientific validity of the simulation, this study is grounded in relevant policy specifications, the actual background and cost–benefit data of the LZ area, and relevant literature [10,20,28,34,48], with certain parameters estimated and assumed where direct quantification is not feasible; specific values are presented in Table 4. Due to difficulties in quantifying some parameters, including inconsistent units and excessively large cost values, the values are proportionally reduced and rounded to 10 k RMB for uniformity in the analysis. Upon determination of the benchmark parameters, these values are substituted into the eigenvalue expressions of the Jacobi matrix (Table 3) from the preceding theoretical analysis section (Section 4.2) to allow for numerical verification of the stability of the equilibrium points. The results are presented in Table 5. The evolutionary trajectory of the three parties is analyzed using the simulation in Figure 6, resulting in the identification of the final evolutionary stable strategy. A sensitivity analysis is conducted to assess the impact of parameter changes on the attainment of synergistic strategies by the three parties. The critical thresholds (M1 and M2) were validated using bootstrap resampling (n = 1000) and parameter drift analysis (±10% perturbation). This procedure provides confidence intervals for both thresholds and evaluates their robustness. The optimal solution is inferred from the simulation path diagram, providing predictions for the distribution of benefits among the three parties.
This study simulates six key parameters using the established three-party game model, with numerical simulations conducted through MATLAB 2024a software. Figure 7 illustrates the trajectories of three-party game behaviors under different initial values, with the scenario simulation, integrating the system dynamics model and real-world case, reflecting the co-management and synergy phase of community renewal. All stakeholders, government, developers, and residents adopt active strategies. After 50 iterations under different initial conditions, the system reaches a stable evolutionary strategy (1,1,1), with simulation results aligning with the theoretical framework outlined in Section 4.2. The images further suggest that the government must actively facilitate the participation of developers and residents in the community renewal process. This study demonstrates that collaborative decision-making fosters communication and the exchange of opinions among the three stakeholders, facilitating consensus-building, reducing conflicts, and enhancing the efficiency of community renewal, thereby contributing to the city’s sustainable development. A full breakdown of the parameter scaling process is provided in Appendix A Table A1 to facilitate model replication and adaptation.

5.3. Sensitivity Analysis of Key Parameters

In this study, six key parameters are simulated using MATLAB 2024a software to explore the influence of various stakeholders on tripartite synergistic decision-making under different benefit distributions. All monetary parameters and variables in the simulation are uniformly measured in units of 10 k RMB. The fixed costs, which cannot be altered, are excluded from the model. The selected parameters include the incentives from the higher government (W), subsidies to developers (M1), subsidies to residents (M2), benefits to residents (R2), benefits to developers (R3), and government gains (R4). The goal is to examine their impact on the evolutionary game behaviors of the three stakeholders in community renewal. Initially, the probability of the government, residents, and developers each selecting a strategy is set at 20%, adjusting only one parameter at a time while holding the others constant. The analysis is detailed as follows:

5.3.1. Reward from Higher Government (W)

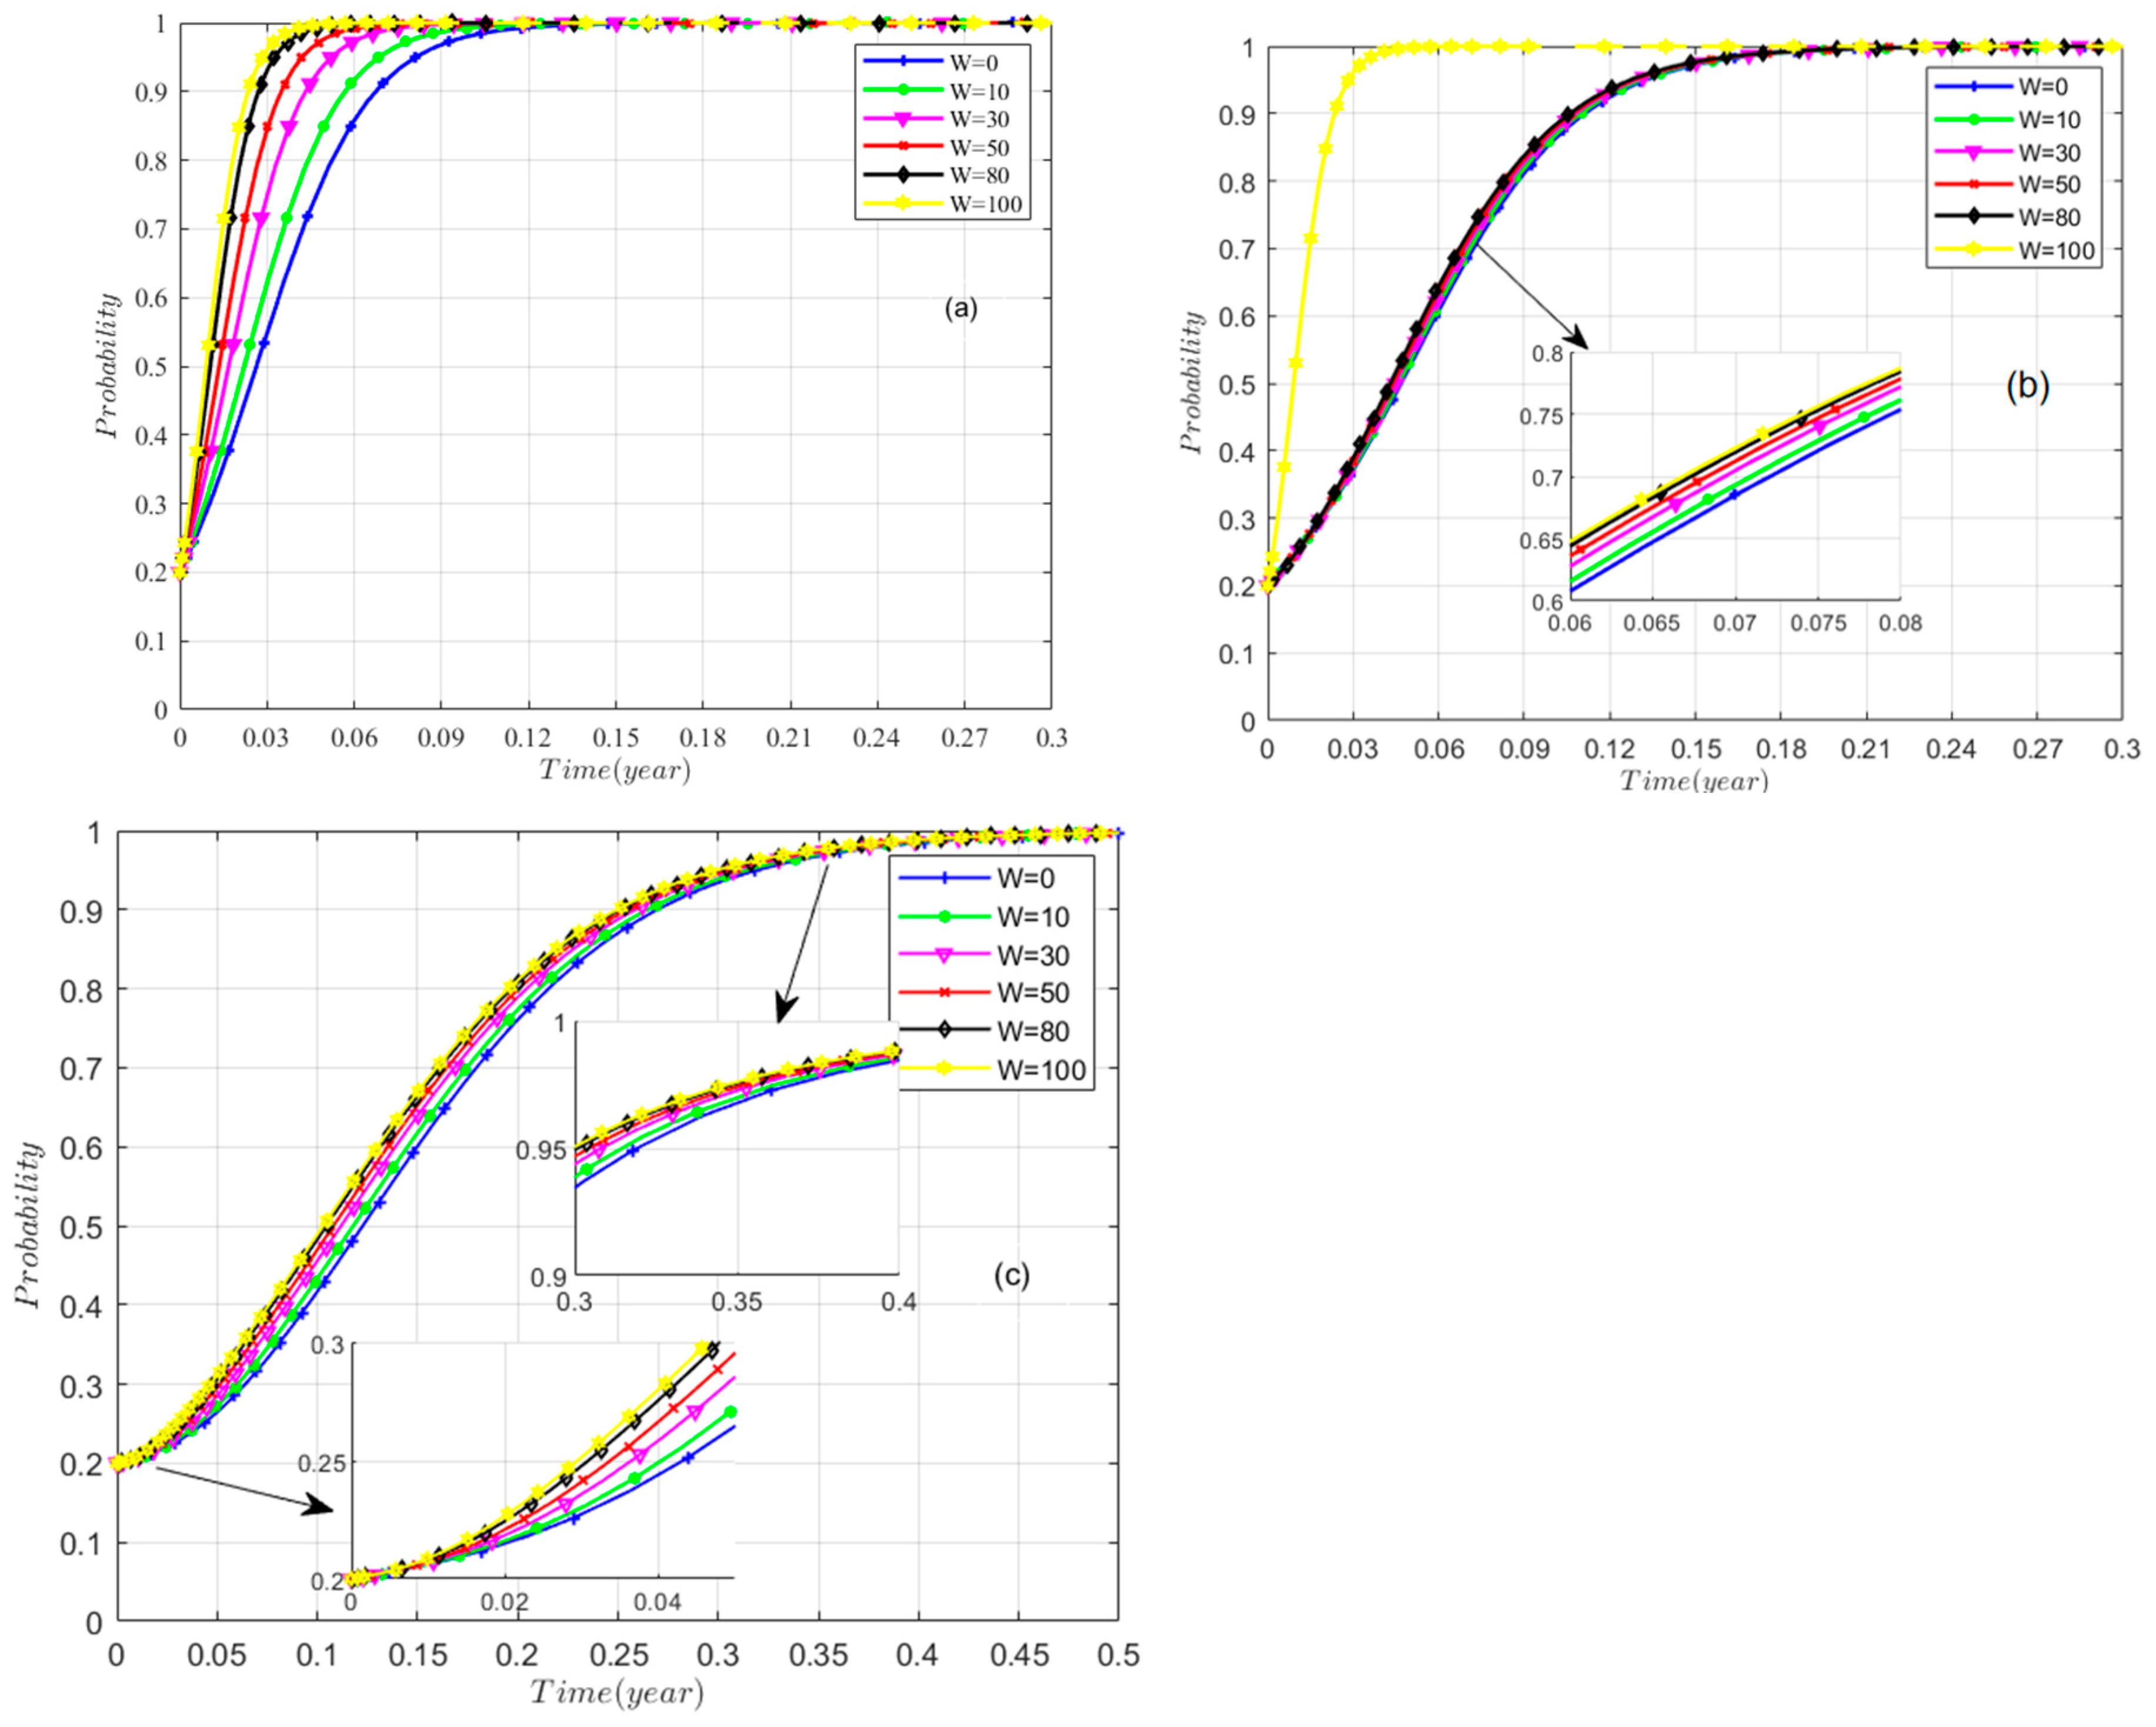
The evolutionary paths of the government, community residents, and developers are presented in Figure 8 for W values set at 0, 10, 30, 50, 80, and 100. W is the reward from the higher government for the local government to use incentive strategies for community renewal. From Figure 8a, it is observed that when W equals 0, the government requires more time to adopt an incentive strategy. As W increases, the government’s decision-making accelerates, thereby hastening the system’s convergence toward evolutionary stability—characterized by incentivization, active participation, and cooperation—and improving the efficiency of achieving tripartite synergy. Furthermore, the government’s incentive strategy positively influences developers and residents, increasing the rate at which residents adopt “active participation” and developers pursue “cooperation.” This indicates that W affects not only the government but also developers and residents, with higher-level government incentives simultaneously stimulating the initiative of all three stakeholders and reducing the time required for active engagement in decision-making. To promote developers’ “active cooperation” and residents’ “active participation” in community regeneration, higher-level governments can employ appropriate incentives to enhance local government motivation, foster enthusiasm among all stakeholders, and create a virtuous cycle in community renewal initiatives. From a sustainability perspective, timely incentives from higher-level governments can align stakeholder actions toward shared environmental and social goals, thereby creating both a virtuous cycle in community renewal initiatives and a resilient governance structure.
Compared with Figure 8a, community residents exhibit a significantly delayed strategic response to W, suggesting they require more time to perceive and build trust. This lag underscores the importance of sustained communication and visible environmental and social benefits to gradually foster resident confidence in the renewal process. Figure 8c shows that developers’ strategy evolution follows a pattern of “mid-term sensitivity followed by a late-stage surge.” Initially, developers monitor policy stability and market clarity, resulting in delayed responses; however, once government and resident strategies stabilize, they intervene rapidly. Across all three trajectories, the convergence sequence is observed to follow the order of government, developers, and residents, thereby validating the strategic transmission logic of “government–investor–residents “and confirming that early government leadership is critical for cascading sustainability-driven behavior throughout the system.

5.3.2. Government Subsidies to Developers (M1)

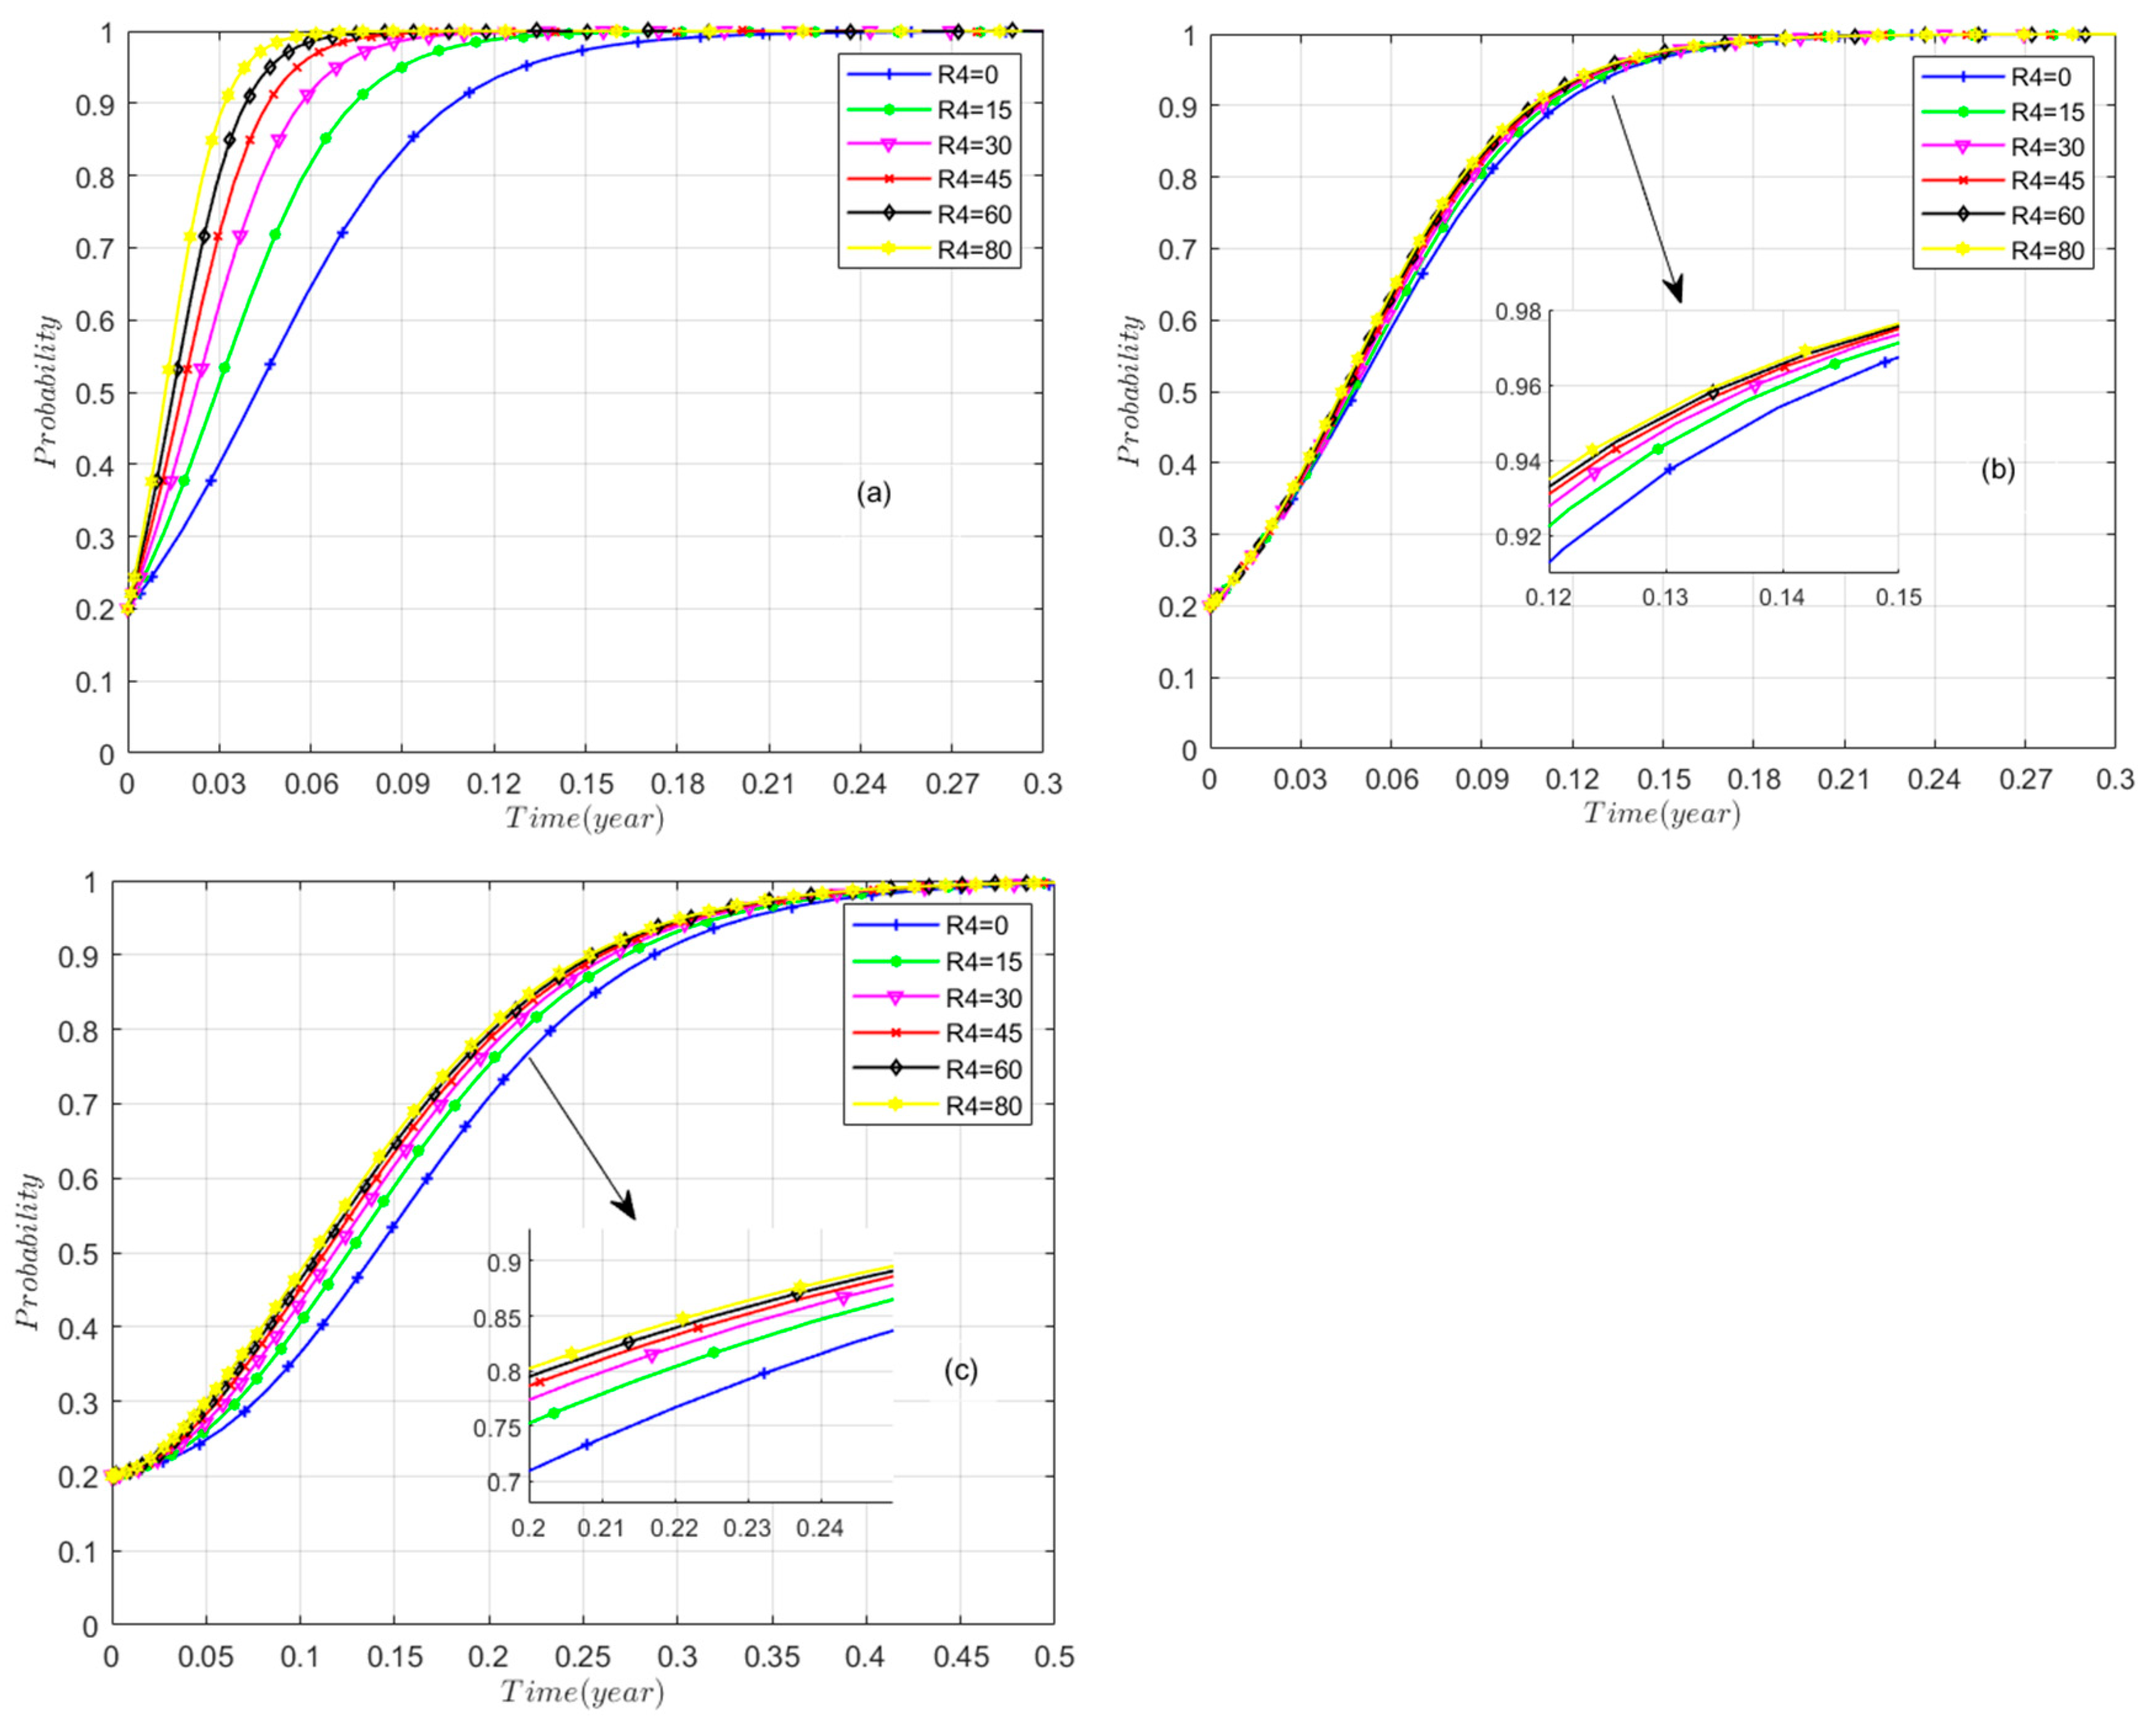
As shown in Figure 9, M1 was set at 0, 15, 30, 45, 60, and 80 for the simulation. The results indicate that adjustments to the government’s subsidy level (M1) for developers produce distinct variations in the evolutionary trajectories of the three stakeholders’ behavioral strategies. As illustrated in Figure 9a, when M1 equals 0, although no fiscal expenditure is incurred, the government’s willingness to incentivize rises slowly because social returns remain limited due to developers’ non-responsiveness and residents’ lack of cooperation. In contrast, when M1 ranges from 15 to 60, the system gradually evolves toward stability, achieving tripartite synergy characterized by government incentives, active resident participation, and developer-led renovation. Within this range, the likelihood of developers and residents adopting “active renovation” and “active participation” strategies rises proportionally with the subsidy level. However, when M1 exceeds the threshold of 80, the convergence of the government’s strategy slows markedly, and the increased fiscal burden constrains its ability to sustain incentives, resulting in strategic stagnation, thereby undermining both long-term policy resilience and the steady pursuit of sustainable urban transformation.
Figure 9c shows that M1 exerts the strongest influence on developers. When M1 equals 0, developers consistently adopt a non-cooperative strategy, and their willingness to cooperate remains negligible, preventing system evolution. Once M1 exceeds 30, developer cooperation increases sharply, revealing a clear incentive threshold effect. However, when M1 surpasses 80, cooperation declines despite high subsidies. Over-reliance on subsidies intensifies fiscal pressure on local governments, constraining their capacity to maintain incentives. Furthermore, due to complex ownership structures and diverse project types in community renewal, developers often face relatively low subsidies and high operational costs, which diminish their willingness to cooperate and hinder the realization of tripartite synergies.
Therefore, subsidies should be maintained within an optimal range to promote synergistic cooperation among the government, developers, and residents, stimulate motivation across all parties, and exert a significant positive impact on the advancement of community renewal projects. In this process, it is essential to establish economic subsidies at an appropriate level to ensure both incentive effectiveness and fiscal sustainability.

5.3.3. Government Subsidies to Residents (M2)

Figure 10a, b, and c illustrate the evolutionary trajectories of the government, community residents, and developers when M2 takes the values of 0, 20, 40, 60, 70, and 80, respectively. As shown in Figure 10b, when M2 is 0, the absence of resident subsidies results in limited motivation for community renewal, thereby slowing the system’s evolutionary process and hindering the formation of tripartite synergy. When M2 varies between 20 and 60, the system gradually attains evolutionary stability, reflecting synergy among the three parties (government incentives, residents’ active participation, and developers’ renovation). As local government subsidies increase within this range, the likelihood of developers and residents adopting “active renovation” and “active participation” strategies correspondingly rises. However, when M2 exceeds an approximate critical range (e.g., about 600 k RMB–800 k RMB under the parameters of this case), systemic stability declines markedly despite an initial acceleration in resident participation. It is worth noting that the upper and lower bounds of the range are highly sensitive to the other parameters of the model that characterize residents’ trust, costs, and benefits. Excessive subsidies not only intensify fiscal pressure and constrain the government’s capacity to sustain incentives but also raise skepticism among residents regarding subsidy viability and expose developers to potential cost escalations following policy withdrawal. Consequently, a durable consensus among the three stakeholders becomes difficult to achieve, thereby disrupting the synergistic evolutionary trajectory.
Therefore, resident subsidies (M2) should be maintained within a balanced range that ensures both effective incentives and fiscal sustainability, thereby enhancing residents perceived benefits, stimulating developers’ anticipated returns, sustaining government incentives, and establishing a stable strategic foundation for the ongoing advancement of community renewal, and provides a resilient strategic foundation for long-term, sustainability-oriented community renewal.

5.3.4. Residents’ Revenue (R2)

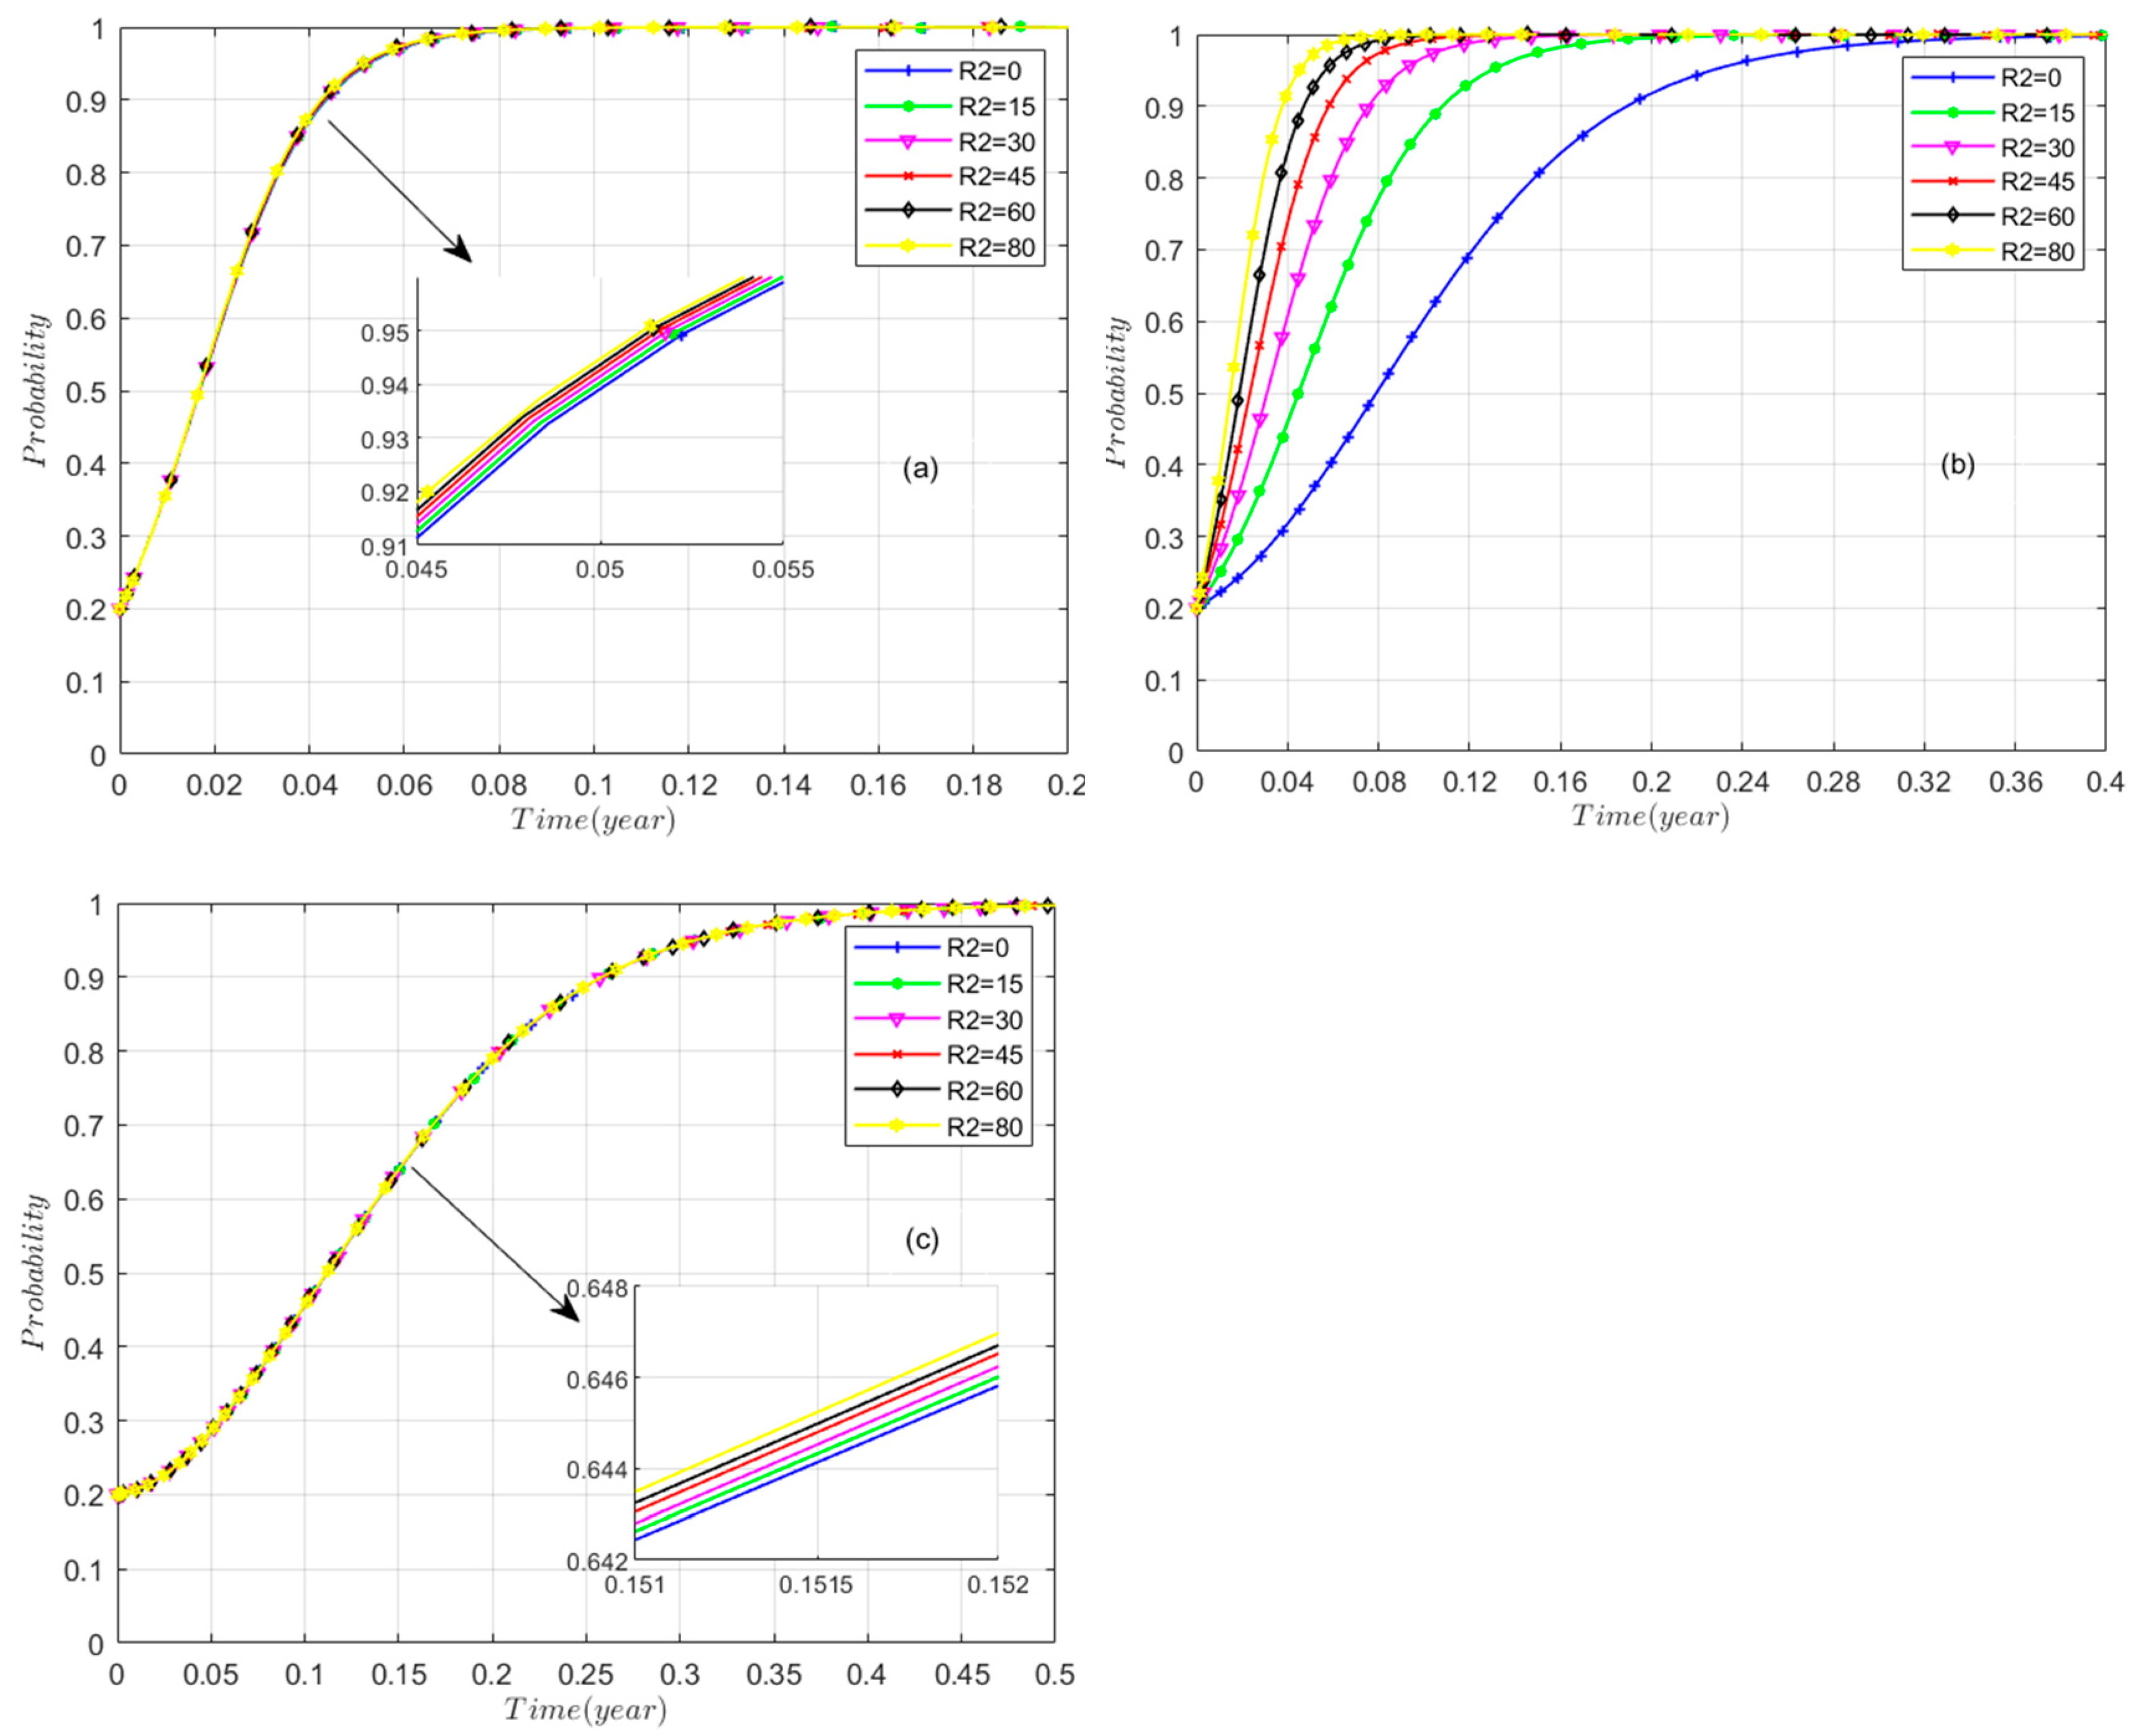
As shown in Figure 11, R2 values were set at 0, 15, 30, 45, 60, and 80 for the simulation. Figure 11a, b, and c show the evolutionary paths of the government, community residents, and developers, respectively. For the government and developers, the influence of R2 is limited; however, when R2 ranges from 0 to 80, the system gradually attains evolutionary stability, reflecting synergy among the three parties (government incentives, active resident participation, and developer-led renovation) while also reinforcing the social dimension of sustainability by directly improving residents’ perceived benefits and sense of inclusion. As residents’ benefits increase, they adopt the “active participation” strategy more rapidly. R2 thus positively influences residents’ strategic choices; as benefits grow, residents’ motivation strengthens, thereby accelerating the achievement of tripartite synergy.

5.3.5. Developer’s Revenue (R3)

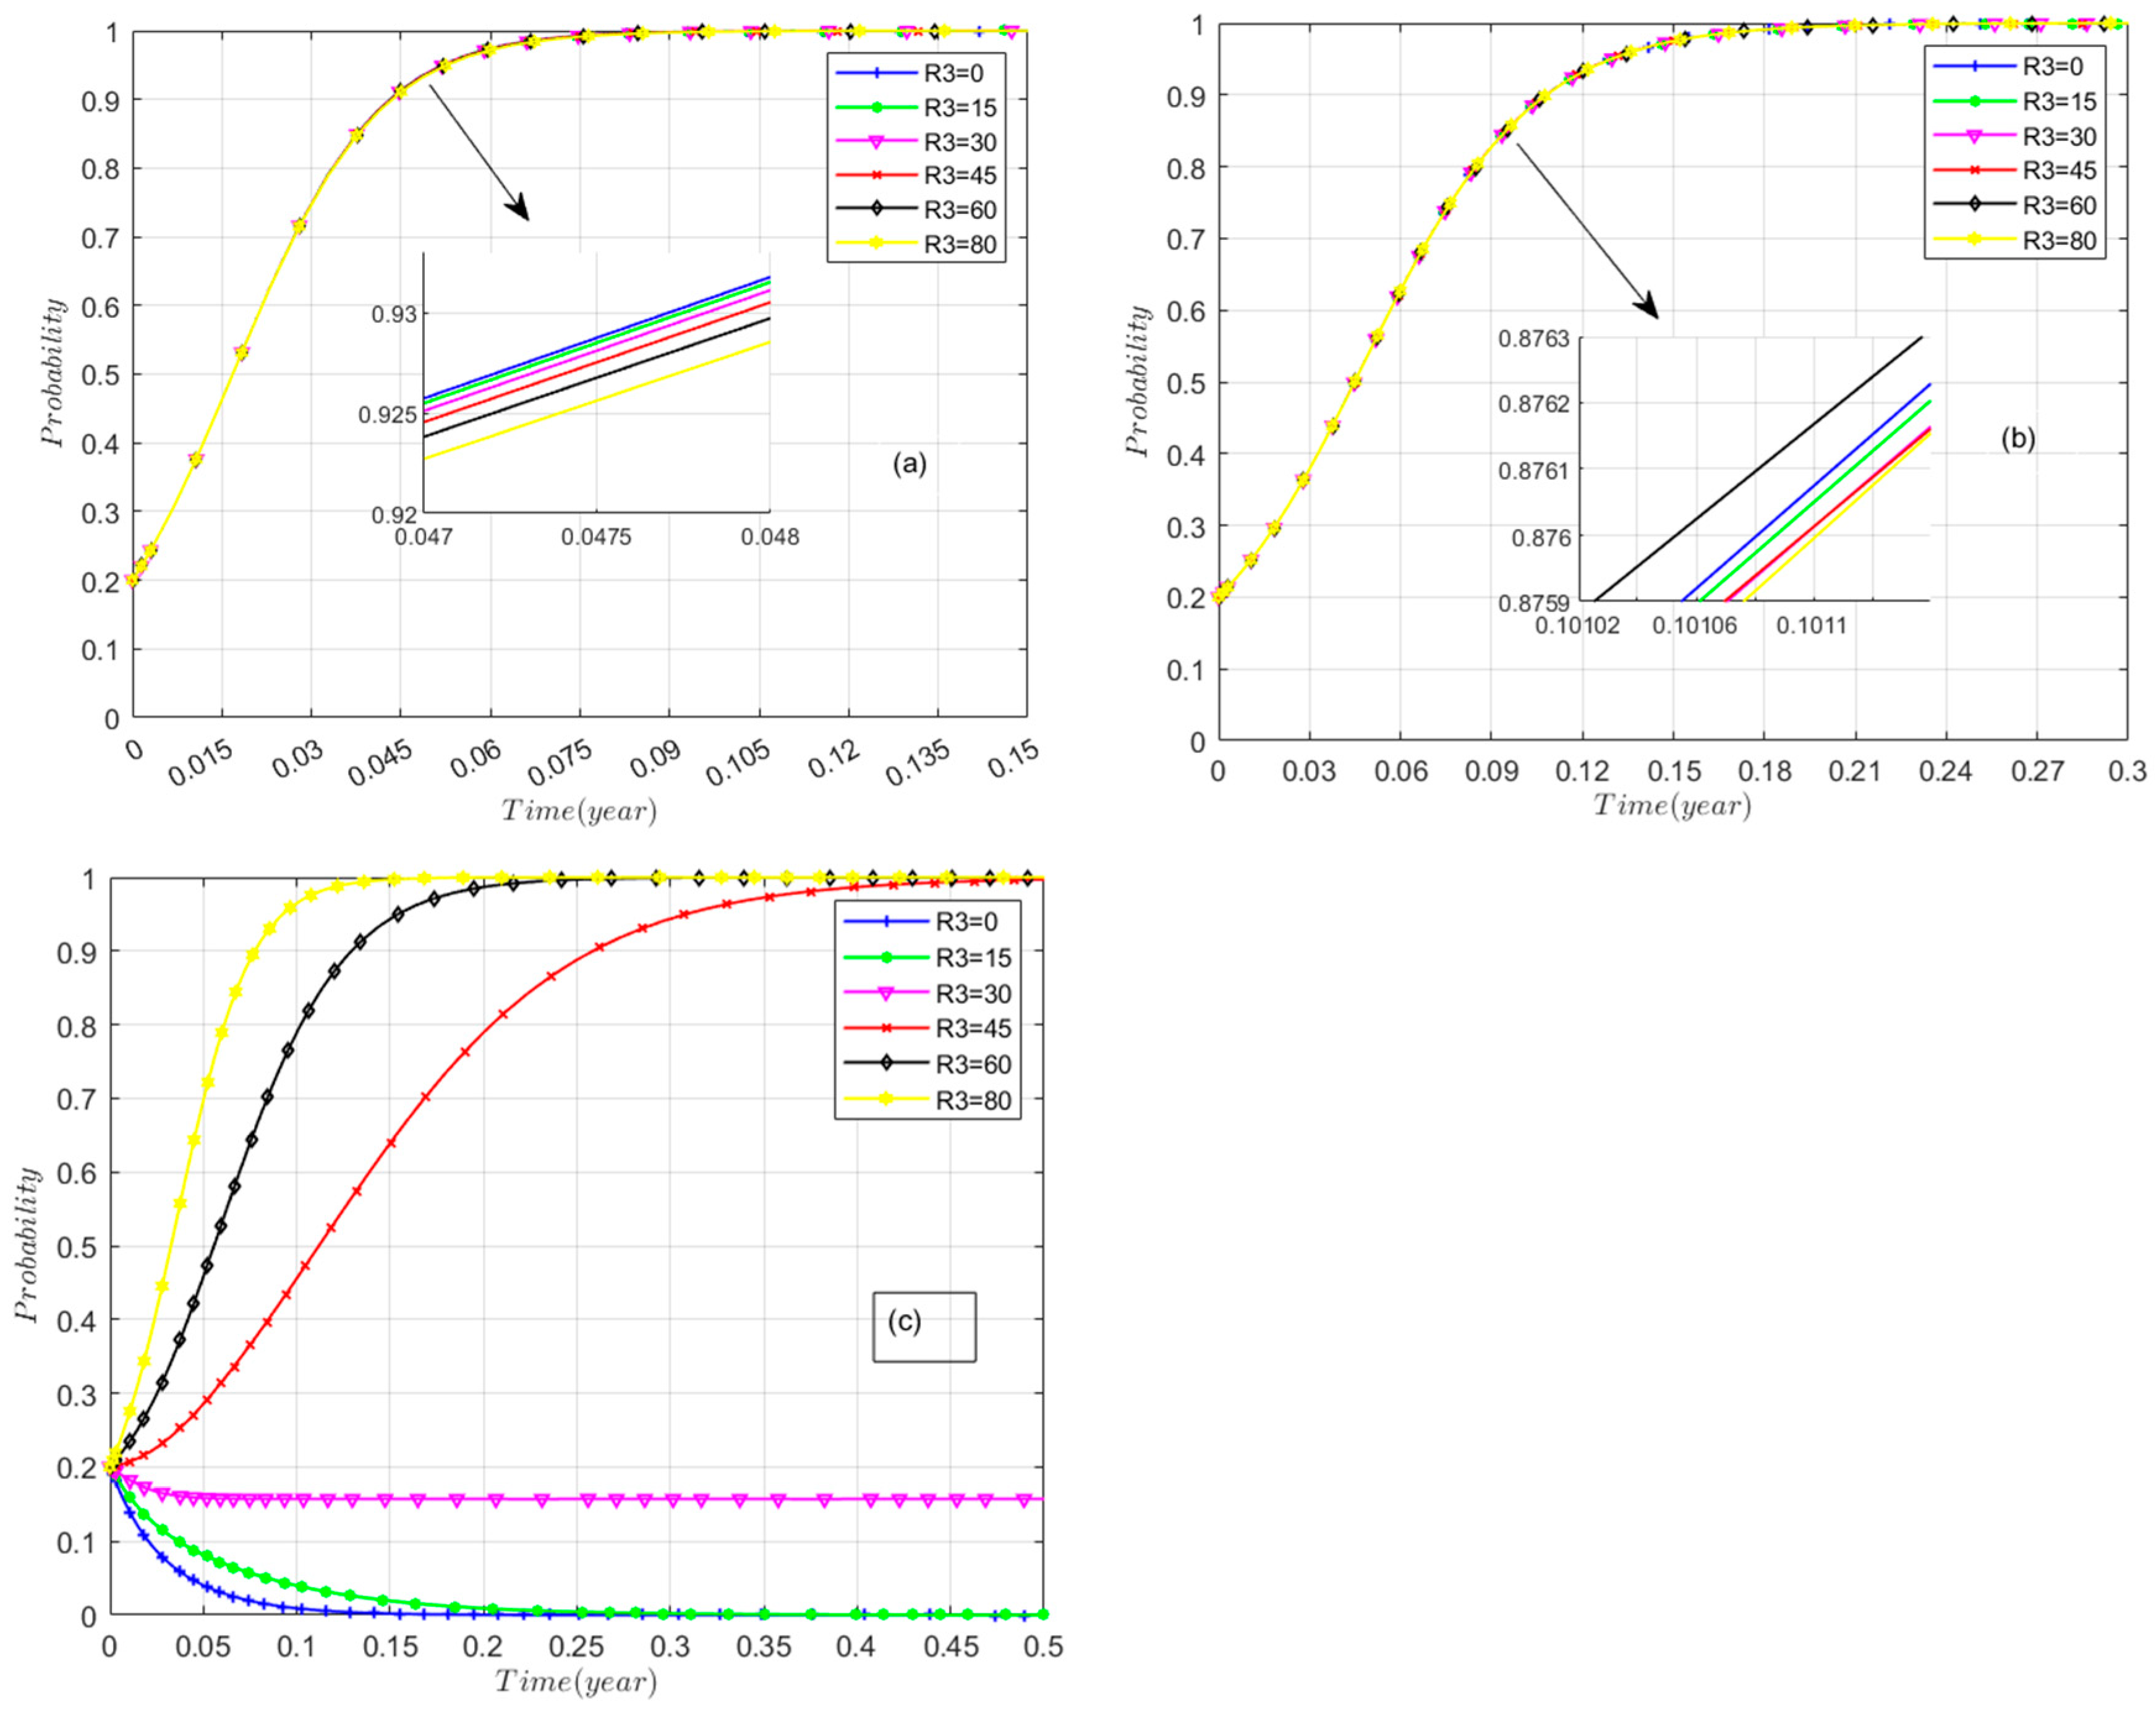
Figure 12 illustrates the evolutionary paths of the government, community residents, and the developer when R3 takes the values of 0, 15, 30, 45, 60, and 80, respectively. As shown, when R3 ranges from 0 to 15, developer participation benefits in community renewal are insufficient; when benefits fall below costs, developers become reluctant to participate and adopt a “no renovation” strategy. When R3 ranges from 15 to 45, benefits improve but remain comparatively low relative to other projects, resulting in limited developer participation in community renewal. Once R3 exceeds 45, as benefits rise, developers adopt an “active transformation” strategy. This shows that the right benefit level can drive developer investment in energy-efficient construction, resource conservation, and environmentally friendly urban renewal. As revenue increases, developer motivation strengthens, thereby accelerating the attainment of tripartite synergy. From a sustainability view, linking developer incentives with long-term urban resilience ensures that profitability and sustainable construction move forward together. This lowers ecological impacts and improves community well-being.

5.3.6. Government’s Revenue (R4)

Figure 13 illustrates the evolutionary paths of the government, community residents, and developers for government revenue (R4) values of 0, 15, 30, 45, 60, and 80, respectively. As shown, higher R4 values enable the government to achieve evolutionary strategic stability at an increasingly rapid pace. Elevated R4 strengthens the government’s inclination toward the “incentive” strategy, which in turn motivates developers and residents to actively participate in community renewal. This virtuous cycle not only accelerates tripartite strategic convergence but also supports long-term fiscal capacity for continued investment in green infrastructure, public amenities, and socially inclusive renewal initiatives. This dynamic fosters more rapid synergy among the three core stakeholders, improves the efficiency of community renewal, and ultimately facilitates a win-win outcome for all parties involved.
In summary, an analysis of the six parameters indicates that incentives from higher levels of government to local governments (W), the benefits derived from residents’ participation in community renewal (R2), the benefits accruing from developers’ participation (R3), and the social benefits gained by the government (R4) increase as their respective values rise, thereby accelerating the attainment of tripartite synergy and reinforcing the alignment of stakeholder actions with sustainability objectives. However, the government’s subsidies to the developers (M1) and residents (M2) must be carefully controlled within an appropriate range to achieve an optimal state and foster synergy among all three parties.

5.4. Robustness Test of Critical Thresholds

To address potential concerns regarding the validity of the model’s assumptions and the stability of the identified critical thresholds, a comprehensive robustness test was conducted. Rather than varying individual parameters, a ±20% simultaneous perturbation was applied to all other parameters in the model, and the critical values for both the developer subsidy (M1) and the resident subsidy (M2) were recalculated. This approach tests the thresholds’ resilience under a scenario of widespread parameter uncertainty.
The results, summarized in Figure 14, reveal a significant divergence in the behavior of the two thresholds:
  • Developer Subsidy Threshold (M1): The critical value for M1 demonstrated high robustness. Its estimates remained tightly clustered within a narrow range of [575 k RMB, 625 k RMB] around the baseline value of 600 k RMB. This indicates that the fiscal limit for developer subsidies is a stable and reliable feature of the model, relatively insensitive to uncertainties in other inputs.
  • Resident Subsidy Threshold (M2): In contrast, the critical value for M2 exhibited low robustness and high sensitivity. Under parameter perturbation, its estimates varied widely across a range of approximately [550 k RMB, 850 k RMB]. This suggests that the precise monetary incentive required to secure resident participation is not a fixed point but is highly contingent on the specific configuration of socio-economic factors and individual perceptions captured by other model parameters.
This test validates the use of M1 as a robust policy benchmark and provides crucial context for interpreting M2, indicating that strategies targeting residents must be flexible and adaptive to local conditions.

6. Discussion

6.1. Dynamic Evolution of Policy Intervention and Collaborative Governance for Long-Term Sustainability

Simulation results show that the government and developers eventually stabilize their strategies. The government chooses to “incentivize,” and developers choose to “transform”. However, community residents adopt their strategies more slowly. This finding aligns with the “government-led-developer-empty-residents-hesitant” stage structure described by Haoyu and Tao [10]. The process develops through three main stages. It begins with resource orientation, shown as H1 (0,0,0) in Figure 6. It then moves to factor integration, shown as H6 (1,0,1). Finally, it reaches shared governance synergy, shown as H8 (1,1,1). This progression shows that policy interventions must adapt to a changing strategic environment. The government primarily supports renewal through incentives and subsidies. The value of these incentives, labeled M1, is typically under 30. Projects move forward once they become economically feasible. For example, this occurs when the developer’s benefit R3 exceeds 45. Integrating sustainability criteria into these requirements is important. These criteria can include energy efficiency, green space provision, and inclusive planning. Including such criteria ensures that early incentives do more than just attract market participation. They also help build a foundation for long-term resilience.
However, residents typically remain disengaged until tangible benefits are evident, and their strategic responses generally lag those of developers (e.g., Figure 9 and Figure 10). This delay does not stem from irrationality but from a rational trust deficit: residents delay participation until benefits are demonstrably realized (R2↑), reinforcing Xu and Maimaitituerxun’s [34] emphasis that “there is no substitute for the government’s institutional drive in the early stages of collaborative governance” and highlights the importance of early-stage policy alignment with sustainability goals.
The identified synergy pathway reflects state-influenced governance models. Other initiation sequences are conceivable. These could include developer-led or resident-led approaches. However, these alternatives were not evolutionarily stable in the model. The model reflects the institutional and resource realities of urban renewal in China. Future comparative research could explore conditions for these alternative sequences. Such research would examine their emergence in different governance contexts.

6.2. Balancing Nonlinear Policy Effects and Fiscal Sustainability in Community Renewal

This study reveals nonlinear policy effects. These findings challenge static analytical paradigms. Developer subsidies exceeding a critical threshold cause a problem. When M1 surpasses 600 k RMB, fiscal overload occurs. This leads to unsustainable incentives. Consequently, tripartite cooperation declines, as shown in Figure 9c. Similarly, resident subsidies beyond a certain point create issues. Exceeding M2 of 700 k RMB fosters dependency psychology. This undermines long-term trust among stakeholders. These thresholds demonstrate an important principle. Fiscal sustainability must be pursued alongside environmental and social benefits. Excessive subsidies strain government budgets. They can also divert resources from important programs. This mechanism helps explain why some regeneration programs—such as Bangkok’s canal upgrading—encountered difficulties in sustaining momentum, and why Jakarta’s Kampung Improvement Program showed limitations in efficiency and continuity [52,53]. In this context, these cases are presented as qualitative illustrations of the model’s mechanism rather than strict quantitative validations. It should be noted that currently available data on cost per dwelling, GHG (Greenhouse gases) reduction, and resident satisfaction are fragmented and reported under inconsistent conventions, precluding reliable cross-city comparisons. Thus, the focus of this study lies in uncovering the evolutionary mechanism while providing a methodological basis for future quantitative validation once consistent datasets become available.
Robustness tests were conducted on these critical thresholds. The results further support nonlinear logic. Findings show the developer subsidy threshold M1 is highly robust. This threshold provides a clear fiscal red line near 600 k RMB. In contrast, the resident subsidy threshold M2 shows significant contextual sensitivity. Its value fluctuates within an approximate range of 550 k RMB to 850 k RMB. This important difference highlights a key distinction. The economic rules governing market entities appear universal. However, the socio-psychological mechanisms behind resident cooperation are highly context-dependent. Therefore, effective policy must acknowledge both the existence of thresholds and their different natures. Policies should respect this fundamental difference between economic and social drivers.
More innovatively, the study demonstrates that sustainable synergy requires strict sequential progression: government-led institutional foundation (Phase 1) → market response to viability signals (R3 > 450 k RMB triggers Phase 2) → resident participation based on tangible outcomes (Phase 3). This ‘government guidance–developer response–resident trust’ transmission logic (Figure 6) deconstructs a fundamental contradiction in Western participatory models: premature resident involvement in Chongqing’s LZ case increased transaction costs (C3) by 30%, undermining initial collaboration stability. Conversely, Jakarta’s market-led approach bypassed institutional groundwork and resulted in insufficient overall efficiency and stability [53]. Thus, sequential synergy emerges as an imperative for high-tension urban renewal contexts.
The transferability of China’s approach lies herein: the identified sequential synergy and early-warning threshold mechanisms can provide Global South cities with a ‘policy immune system’ to avoid replicating fiscal traps observed elsewhere. For instance, the findings help explain why subsidy-intensive projects like Bangkok’s canal renewal stalled due to fiscal overload, and why Jakarta’s market-driven redevelopment approach proved inefficient by bypassing critical government institutional infrastructure [22]. Accordingly, it is proposed that for cities like Lagos or Jakarta [21,22], embedding calibrated subsidy caps (e.g., M1 ≤ 0.1% × local GDP per capita) into renewal statutes could prevent fiscal overruns while maintaining stakeholder engagement.

6.3. Stage-Sensitive Policy Adjustment for Long-Term Sustainability

This dynamic understanding reshapes the theory of collaborative governance in three key ways. First, the EGT-SD integration model addresses the “resident participation paradox” by introducing a delay mechanism for asymmetric strategies, which fails to account for the time factor in the traditional equilibrium framework [8]. Second, H6 (1,0,1) is established as the key bridge stage where developers participate before residents, thus validating the theory of “emerging synergy” proposed by Song et al. [33]. Third, the model reveals how core participants learn through policy feedback: residents exhibit limited rationality-driven behaviors when R2 − C3 > R1, particularly when benefits include environmental quality improvements, equitable public space access, and enhanced community well-being—a view that is consistent with Y. Zhao et al.’s [54] study on behavioral urbanization.
The results indicate nonlinear policy impacts: developer subsidies exceeding M1 = 600 k RMB lead to a decline in willingness to cooperate (Figure 9c), while resident subsidies beyond M2 = 700 k RMB trigger dependency loops (Figure 10b). To strengthen the validity of the thresholds, bootstrap resampling (n = 1000) (Figure 15) and ±10% parameter drift tests were further conducted (Figure 14). The bootstrap results show that M1 is highly robust, with a narrow 95% confidence interval of [577.8 k RMB, 615 k RMB], which tightly brackets the reported threshold (600 k RMB). By contrast, M2 exhibits higher sensitivity, with a wider 95% confidence interval of [688.3 k RMB, 727.2 k RMB], indicating greater vulnerability to parameter perturbations. The robustness checks confirm that developer-oriented subsidies (M1) provide a more stable level, while resident-oriented subsidies (M2) require careful calibration to avoid fiscal inefficiency and instability. These findings support the assumptions of the simulation model and ensure that the thresholds are not arbitrary but statistically grounded.
These thresholds provide actionable leverage points for policymakers:
  • For Chinese cities: Implement phase-sensitive interventions (e.g., FAR incentives during the factor-integration stage) to avoid fiscal overload. Chinese policymakers should shift toward stage-adjusted strategies: In the resource-oriented phase, the government should lead the trust framework (e.g., transparent cost–benefit demonstration platforms) rather than relying solely on large-scale subsidies. In the factor integration phase, the focus should shift to market-driven mechanisms, such as incentives for increased volume (R3), without exhausting fiscal resources. In the shared governance phase, participatory budgeting becomes viable—introducing resident involvement earlier increases transaction costs (C3↑) and destabilizes initial collaboration. This systematic advancement counters China’s one-size-fits-all participatory empowerment, criticized by Haoyu & Tao [10].
  • For Global South contexts (e.g., Lagos, Jakarta, Indonesia), embed subsidy caps (e.g., M1 ≤ 0.1% × local GDP per capita) into renewal statutes. In Jakarta’s Kampung Improvement Program, studies suggest that subsidy thresholds aligned with fiscal capacity may help reduce fiscal pressure while maintaining relatively high levels of resident participation [31,55,56,57]. It should be stressed that available data on cost per dwelling, GHG reduction, and resident satisfaction remain fragmented and inconsistent, so these cases are presented here as qualitative illustrations, not as strict quantitative validations. Globally, this study offers principles to address socio-institutional tensions:
  • Fiscal policy should supersede short-term political demands: Adjust subsidies to local capacity (e.g., M1 ≤ 25% of project costs).
  • Active participation requires demonstrated outcomes: “Show then participate” outperforms “pay then pray”.
  • Stage-by-stage analysis informs intervention timing: Track developer participation rates as key indicators for phase transition readiness.
This study proposes a generalizable analytical framework rather than a fixed policy prescription. The core theoretical mechanisms, the tripartite evolutionary game structure, the dynamic replication processes, and the method for identifying evolutionary stable strategies (ESSs) and threshold conditions are inherently transferable across different urban contexts. The specific numerical results and thresholds (e.g., M1 = 600 k RMB) presented herein are demonstrative instances derived from the Chongqing case. For policymakers in other cities, the primary utility of this research lies in applying the same methodological process with localized data. This involves: (1) calibrating all cost, benefit, and subsidy parameters to reflect local socioeconomic conditions; (2) replicating the stability analysis to identify the city’s unique critical thresholds and leverage points; and (3) simulating policy scenarios to anticipate dynamic outcomes. This framework thus serves as a versatile and replicable tool for designing context-specific energy efficiency policies, particularly in the Global South.

6.4. Limitations and Future Research

Despite its contributions, this study is subject to several limitations that offer avenues for future research. First, the developer stakeholder is modeled as a homogeneous entity. In practice, developers are heterogeneous, encompassing state-owned enterprises (SOEs) that may prioritize policy compliance and private firms driven primarily by profit maximization. While this simplification was necessary for model parsimony and due to the challenges in obtaining segregated data for empirical calibration, future studies could bifurcate this agent type. This would allow for investigating how differential subsidy thresholds (M1) and policy instruments could more effectively engage these distinct developer subgroups.
Second, residents are treated as a homogeneous group, neglecting the critical heterogeneity between landlords and tenants. Their interests are often misaligned, as landlords may benefit from property value appreciation while tenants bear the disruption and potential displacement costs. Future models should disaggregate this stakeholder group to explore how policies such as relocation compensation or rental protection can be tailored to mitigate this internal conflict and foster more equitable outcomes.
Finally, the model proposed in this study assumes continuous policy inputs, whereas real-world policy announcements are often discrete and pulsed. Future research could employ hybrid simulation approaches, such as combining system dynamics with discrete-event simulation, to investigate how pulsed or staggered subsidy schemes influence the convergence path and stability of stakeholder strategies. Such work could potentially identify optimal intervention timing.

7. Conclusions

This study establishes three paradigm shifts in collaborative governance for urban renewal through dynamic evolutionary game modeling. First, quantifying subsidy ceilings (M1 = 600 k RMB, M2 = 700 k RMB) demarcates critical inflection points in policy efficacy. Exceeding these thresholds triggers cooperation decline—a finding that overturns the conventional wisdom of “more subsidies yield better outcomes”. By linking fiscal thresholds to environmental and social performance, these ceilings offer fiscally constrained Global South cities precision tools for balancing resource allocation with long-term sustainability. Second, the sequential synergy pathway demonstrates the temporal rigidity of institutional trust: governments must first establish transparent governance frameworks; developer engagement activates only after market viability signals are confirmed (R3 > 450 k RMB); and resident participation is ultimately guided by tangible benefit perception (R2 > 150 k RMB). This structured progression not only accelerates strategic convergence but also ensures that early interventions embed energy efficiency, green infrastructure, and social inclusiveness into the renewal process. The Chongqing LZ project’s threefold efficiency advantage over Jakarta’s model validates this pathway’s universal applicability.
Although the quantitative findings are based on Chongqing data calibration, the most significant contribution of this study is the development and demonstration of a reproducible methodological framework. This integrated approach combining EGT and SD provides a generic structure for modeling the dynamic interactions of multi-agent governance in a sustainable development transition. The framework’s external validity and portability stem from its design itself: it generates context-specific insights when fed with local data. As such, this study provides researchers and practitioners in other cities with a ‘plug and play’ analytical toolkit to derive their own evidence-based policy recommendations, thus enhancing the generalizability and practical impact of the findings. Robustness testing of the critical thresholds (M1, M2) deepens this understanding. It confirms that the developer subsidy threshold (M1) is highly robust, serving as a universal fiscal alarm bell. In contrast, the resident subsidy threshold (M2) exhibits justified contextual sensitivity, fluctuating within a range (550 k RMB–850 k RMB). This is not a model flaw but rather validates that resident decision-making is profoundly mediated by local socio-psychological factors. This finding provides a mathematical basis for the necessity of “differentiated” policy prescriptions.
Building on these insights, differentiated policy prescriptions are proposed: For Chinese cities, strictly adhere to the three-phase intervention logic, replacing cash subsidies with market instruments like FAR incentives during the factor-integration stage. For Global South cities, embed subsidy caps (e.g., M1 ≤ 0.1% × local GDP per capita) into renewal statutes through dynamic simulation systems. This suggests a practical subsidy cap of roughly M1 ≤ 0.1% of local GDP per capita (based on 2023 nominal GDP per capita of 600 k RMB in Chongqing) [58], a rule of thumb that can be adapted by other cities based on their economic data. These findings not only deconstruct the tripartite tension of “state–market–society” but also reveal that collaborative governance is a temporal art in non-equilibrium systems—precision interventions at optimal stages hold greater transformative power than scaled resource inputs. Ultimately, by quantifying these thresholds and pathways, the study offers a roadmap for guiding urban renewal away from unstable, short-term interventions and toward resilient, self-sustaining collaborative governance.

Supplementary Materials

The following supporting information can be downloaded at: https://www.mdpi.com/article/10.3390/su17198713/s1.

Author Contributions

Conceptualization, L.W.; methodology, L.W.; validation, Y.S.; data curation, P.R.; writing—original draft preparation, L.W. and P.R.; writing—review and editing, Y.S. and G.Z.; visualization, L.W. and P.R.; project administration, L.W. All authors have read and agreed to the published version of the manuscript.

Funding

This research was supported by the National Natural Science Foundation of China (NSFC) (No. 72371043).

Data Availability Statement

Data are contained within the article.

Acknowledgments

The authors thank the editor and anonymous reviewers for their numerous constructive comments and encouragement that have improved our paper greatly.

Conflicts of Interest

The authors declare no conflicts of interest.

Abbreviations

The following abbreviations are used in this manuscript:
EGTEvolutionary Game Theory
SDSystem Dynamic
GHGGreenhouse gases
C1Project construction funds are borne by the government when it incentivizes developers to participate in regeneration.
C2Project construction funds are borne by the government when it does not incentivize developers to participate in regeneration.
WGovernment incentives for developers and residents to receive incentives from higher-level authorities
M1Government economic subsidies and tax incentives for developers to participate in regeneration
M2Government subsidies for residents to participate in regeneration
S2When governments are not incentivized, residents are negatively engaged, developers are uncooperative, and governments are penalized for losses.
R4The social benefits of government incentives for community renewal include three parts of sustainability: environmental, social, and economic.
C3Community residents are actively involved in the cost of community renewal.
R1Social benefits of normal life for community residents before community regeneration
R2Neighborhood residents receive additional benefits for their active participation in community regeneration.
S1Community residents who participate negatively in community regeneration and are dissatisfied with the results of the regeneration and transformation will bear certain losses.
C4Developer Participation in Community Renewal Project Construction Funding.
R3Economic benefits to developers of participating in community regeneration.
R5Normal social benefits when developers do not cooperate.
xThe probability that the government chooses an incentive strategy.
yProbability of community residents choosing to actively participate.
zThe probability that a developer will choose to cooperate.

Appendix A

Table A1. Parameter Scaling Reference.
ParameterOriginal Estimated ValueOriginal UnitScaling FactorSimulation Value
C1200,000RMB100,00020
C2400,000RMB100,00045
C3100,000RMB100,00010
C4300,000RMB100,00030
M1150,000RMB100,00015
M2100,000RMB100,00010
W300,000RMB100,00030
R1100,000RMB100,00010
R2150,000RMB100,00015
R3450,000RMB100,00045
R4500,000RMB100,00050
R5150,000RMB100,00015
S1300,000RMB100,00030
S2200,000RMB100,00020
Figure A1. Evolutionary paths at different stages of community renewal. (a) shows the evolutionary pathway during the resource-oriented phase; (b) shows the evolutionary pathway during the element integration phase; (c) shows the evolutionary pathway during the co-governance and synergy phase. The different colored lines in the figure indicate how the strategies of the government, developers and residents evolved at each stage. The different colors help distinguish the different paths.
Sustainability 17 08713 g0a1

References

  1. United Nations. Goal 11: Make Cities and Human Settlements Inclusive, Safe, Resilient and Sustainable. Available online: https://sdgs.un.org/goals/goal11 (accessed on 30 July 2023).
  2. United Nations. Goal 13: Take Urgent Action to Combat Climate Change and Its Impacts. Sustainable Development Goals. Available online: https://www.un.org/sustainabledevelopment/climate-change/ (accessed on 30 July 2025).
  3. Hassen, N.; Kaufman, P. Examining the role of urban street design in enhancing community engagement: A literature review. Health Place 2016, 41, 119–132. [Google Scholar] [CrossRef]
  4. Wang, D.; Li, S. Social conflicts and their resolution paths in the commercialized renewal of old urban communities in China under the perspective of public value. J. Urban Manag. 2025, 14, 402–417. [Google Scholar] [CrossRef]
  5. Zheng, X.; Sun, C.; Liu, J. Exploring stakeholder engagement in urban village renovation projects through a mixed-method approach to social network analysis: A case study of Tianjin. Humanit. Soc. Sci. Commun. 2024, 11, 27. [Google Scholar] [CrossRef]
  6. Wang, H.; Zhao, Y.; Gao, X.; Gao, B. Collaborative decision-making for urban regeneration: A literature review and bibliometric analysis. Land Use Policy 2021, 107, 105479. [Google Scholar] [CrossRef]
  7. Zhong, J.; Li, B.; Shen, G.; Zhou, L. Ally, deterrence, or leverage in the tripartite game? The effects of indirect stakeholders in historic urban regeneration. Cities 2024, 149, 104931. [Google Scholar] [CrossRef]
  8. Wang, Y.; Xiang, P. Investigate the Conduction Path of Stakeholder Conflict of Urban Regeneration Sustainability in China: The Application of Social-Based Solutions. Sustainability 2019, 11, 5271. [Google Scholar] [CrossRef]
  9. Ibarloza, A.; Malles, E.; Ibarloza, E.; Heras-Saizarbitoria, I. The needs and effects of housing renewal policies in Spain: Implications for sustainability and accessibility. Sustain. Cities Soc. 2018, 40, 244–253. [Google Scholar] [CrossRef]
  10. Haoyu, F.; Tao, Y. Study on the Path and Strategy of Upgrading Renovation of Old Community Based on the Residents’ Needs: A Case of Youdian Xincun Community, Wuhan. In Proceedings of the 2023 5th International Conference on Civil Architecture and Urban Engineering (ICCAUE 2023), Xiamen, China, 17–19 November 2023. [Google Scholar]
  11. Li, Y.; Zhang, S.; Zhu, D. Co-creation of community micro-renewals: Model analysis and case studies in Shanghai, China. Habitat Int. 2023, 142, 102951. [Google Scholar] [CrossRef]
  12. Ghisellini, P.; Cialani, C.; Ulgiati, S. A review on circular economy: The expected transition to a balanced interplay of environmental and economic systems. J. Clean. Prod. 2016, 114, 11–32. [Google Scholar] [CrossRef]
  13. Wang, H.; Xu, Y. Achieving Neighborhood-Level Collaborative Governance through Participatory Regeneration: Cases of Three Residential Heritage Neighborhoods in Shanghai. Sustainability 2024, 16, 2082. [Google Scholar] [CrossRef]
  14. Knittel, R.E. The effect of urban renewal on community development. Am. J. Public Health Nations Health 1963, 53, 67–70. [Google Scholar] [CrossRef]
  15. Aiken, M.; Cairns, B.; Thake, S. Community Ownership and Management of Assets; Institute for Voluntary Action Research: London, UK, 2008. [Google Scholar]
  16. Xu, S.; Liu, B. Functional preference and spatial response of urban renewal entities in Beijing. Habitat Int. 2024, 153, 103191. [Google Scholar] [CrossRef]
  17. He, S.; Wu, F. China’s Emerging Neoliberal Urbanism: Perspectives from Urban Redevelopment. Antipode 2009, 41, 282–304. [Google Scholar] [CrossRef]
  18. Atkinson, R.; Tallon, A.; Williams, D. Governing urban regeneration in the UK: A case of ‘variegated neoliberalism’ in action? Eur. Plan. Stud. 2019, 27, 1083–1106. [Google Scholar] [CrossRef]
  19. Mirzaei, R. Building Trust and Enhancing Governance in Urban Management: Strategies for Sustainable Development and Improved Urban Quality. In Proceedings of the 4th International Congress on Civil Engineering Architecture Building Materials and Environment, Helsinki, Finland, 10 March 2025. [Google Scholar]
  20. Sun, G.; Li, M.; Dong, J.; Wan, S.; Feng, J. Evaluation of key factors for promoting green construction practices based on a hybrid decision-making framework: A case study on the renovation of old residential communities in China. Axioms 2023, 12, 971. [Google Scholar] [CrossRef]
  21. World Bank. Lagos Diagnostic Study and Pathway for Transformation; World Bank: Washington, DC, USA, 2023. [Google Scholar]
  22. Mulligan, B. Housing Rights in Jakarta: Collective Action and Policy Advocacy, Indonesia; World Habitat: Leicester, UK, 2023; Available online: https://world-habitat.org/wp-content/uploads/2023/12/Housing-Rights-in-Jakarta-Collective-Action-and-Policy-Advocacy-Indonesia.pdf (accessed on 17 September 2025).
  23. Miles, S. Stakeholder Theory Classification: A Theoretical and Empirical Evaluation of Definitions. J. Bus. Ethics 2017, 142, 437–459. [Google Scholar] [CrossRef]
  24. Freeman, R.E. Strategic Management: A Stakeholder Approach; Cambridge University Press: Cambridge, UK, 2010. [Google Scholar]
  25. Mitchell, R.K.; Agle, B.R.; Wood, D.J. Toward a Theory of Stakeholder Identification and Salience: Defining the Principle of Who and What Really Counts. Acad. Manag. Rev. 1997, 22, 853–886. [Google Scholar] [CrossRef]
  26. Zhang, R.; Nie, L.; Zhao, C.; Zhao, X. Eco-efficiency as a Catalyst for Citizen Co-production: Evidence from Chinese Cities. arXiv 2025, arXiv:2504.13290. [Google Scholar]
  27. Fan, C.; Li, X. Exploring effective incentive policies for sustainable development of green buildings in China: Based on evolutionary game theory and numerical simulation analysis. Eng. Constr. Archit. Manag. 2025, 32, 3326–3348. [Google Scholar] [CrossRef]
  28. Ofek, S.; Portnov, B.A. Differential effect of knowledge on stakeholders’ willingness to pay green building price premium: Implications for cleaner production. J. Clean. Prod. 2020, 251, 119575. [Google Scholar] [CrossRef]
  29. Lord, F.; Prior, J. How do governance visions, institutions and practices enable urban sustainability transformations? A study of Battambang and Sihanoukville, Cambodia. Front. Sustain. Cities 2024, 6, 1342524. [Google Scholar] [CrossRef]
  30. Jung, H.-J. Urban Planning Policy for Realizing Public Objectives Through Private Development in Seoul. Sustainability 2019, 11, 2698. [Google Scholar] [CrossRef]
  31. Lin, C.L.; Chan, E.H.W.; Chiang, W.-H. Urban renewal governance and manipulation of plot ratios: A comparison between Taipei, Hong Kong and, Singapore. Land Use Policy 2022, 119, 106158. [Google Scholar] [CrossRef]
  32. Gan, B.-L.; Zhang, D.-M.; Huang, Z.-K.; Zheng, F.-Y.; Zhu, R.; Zhang, W. Ontology-driven knowledge graph for decision-making in resilience enhancement of underground structures: Framework and application. Tunn. Undergr. Space Technol. 2025, 163, 106739. [Google Scholar] [CrossRef]
  33. Song, W.; Elahi, E.; Hou, G.; Wang, P. Collaborative governance for urban waste management: A case study using evolutionary game theory. Sustain. Cities Soc. 2025, 126, 106380. [Google Scholar] [CrossRef]
  34. Xu, B.; Maimaitituerxun, M. Research on the Promotion Strategy of Green Renovation in Old Residential Areas. J. Phys. Conf. Ser. 2025, 3005, 012028. [Google Scholar] [CrossRef]
  35. Wu, X.; Li, H. Gated Communities and Market-Dominated Governance in Urban China. J. Urban Plan. Dev. 2020, 146, 04020025. [Google Scholar] [CrossRef]
  36. Tipple, G. Settlement upgrading and home-based enterprises: Discussions from empirical data. Cities 2004, 21, 371–379. [Google Scholar] [CrossRef]
  37. Davidson, F. Planning for performance: Requirements for sustainable development. Habitat Int. 1996, 20, 445–462. [Google Scholar] [CrossRef]
  38. Li, F.; Lynam, A.; Huang, H.; Wei, J. Institutional co-production at neighbourhood scale: Cases of urban renewal for Shanghai’s ageing population. Habitat Int. 2024, 144, 103000. [Google Scholar] [CrossRef]
  39. Dezhi, L.; Qianli, X.; Guanying, H.; Bingzhen, D.; Haibo, F. How to share benefits of old community renewal project in China? An improved Shapley Value approach. Habitat Int. 2022, 126, 102611. [Google Scholar] [CrossRef]
  40. Xu, X.; Shi, F.; Zhu, J. Analyzing the critical factors influencing residents’ willingness to pay for old residential neighborhoods renewal: Insights from Nanjing, China. Environ. Dev. Sustain. 2025, 27, 13461–13487. [Google Scholar] [CrossRef]
  41. Devisscher, T.; Ordóñez-Barona, C.; Dobbs, C.; Dias Baptista, M.; Navarro, N.M.; Orozco Aguilar, L.A.; Cercas Perez, J.F.; Rojas Mancebo, Y.; Escobedo, F.J. Urban forest management and governance in Latin America and the Caribbean: A baseline study of stakeholder views. Urban For. Urban Green. 2022, 67, 127441. [Google Scholar] [CrossRef]
  42. Chen, W.Y. Public willingness-to-pay for conserving urban heritage trees in Guangzhou, south China. Urban For. Urban Green. 2015, 14, 796–805. [Google Scholar] [CrossRef]
  43. Cressman, R.; Tao, Y. The replicator equation and other game dynamics. Proc. Natl. Acad. Sci. USA 2014, 111, 10810–10817. [Google Scholar] [CrossRef]
  44. Hu, Y.; Chi, Y.; Zhou, W.; Li, J.; Wang, Z.; Yuan, Y. The interactions between renewable portfolio standards and carbon emission trading in China: An evolutionary game theory perspective. Energy 2023, 271, 127047. [Google Scholar] [CrossRef]
  45. Zhao, D.; Wang, J.; Li, Y.-K.; Tang, J.-H.; Zhang, S.-W. How to promote the transition of fuel vehicle enterprises under dual credit policy? An improved tripartite evolutionary game analysis with time delay. Energy 2024, 293, 130696. [Google Scholar] [CrossRef]
  46. Friedman, D. Evolutionary Games in Economics. Econometrica 1991, 59, 637–666. [Google Scholar] [CrossRef]
  47. Primc, K.; Kalar, B.; Slabe-Erker, R.; Dominko, M.; Ogorevc, M. Circular economy configuration indicators in organizational life cycle theory. Ecol. Indic. 2020, 116, 106532. [Google Scholar] [CrossRef]
  48. Zhang, X.; Du, L.; Song, X. Identification of Urban Renewal Potential Areas and Analysis of Influential Factors from the Perspective of Vitality Enhancement: A Case Study of Harbin City’s Core Area. Land 2024, 13, 1934. [Google Scholar] [CrossRef]
  49. Park, E.J.; Kang, E.; Shin, Y.-J. Urban Regeneration and Community Participation: A Critical Review of Project-Based Research; Open House International: London, UK, 2025. [Google Scholar]
  50. Jiayu, Z.; Xiaodong, Y.; Manman, X.; Dagang, L. Guidance experiments on residents’ participation in decision-making activities related to urban settlement regeneration in China. Humanit. Soc. Sci. Commun. 2024, 11, 873. [Google Scholar] [CrossRef]
  51. Zhao, T.; Zhu, J.; Jian, Z.; Zhou, X.; Zhang, P. Effects of the “Urban Double Repairs” Policy on Urban Land-Use Carbon Emission Efficiency. Sustainability 2024, 16, 10531. [Google Scholar] [CrossRef]
  52. Boonyabancha, S. Baan Mankong: Going to scale with “slum” and squatter upgrading in Thailand. Environ. Urban. 2005, 17, 21–46. [Google Scholar] [CrossRef] [PubMed]
  53. Devas, N. Indonesia’s Kampung Improvement Program: An evaluative case study. Ekistics 1981, 48, 19–36. [Google Scholar]
  54. Zhao, Y.; Zhang, L.; Li, S. Green game among government, enterprises, and the public: A study on the dynamics of enterprise green transformation from the perspective of Tripartite evolution. Sustain. Futures 2025, 10, 100894. [Google Scholar] [CrossRef]
  55. The World Bank. Urban Community Upgrading; The World Bank: Washington, DC, USA, 2002; Available online: https://documents1.worldbank.org/curated/en/385661467999127434/pdf/99012-WP-Box393181B-PUBLIC-Urban-community-upgrading.pdf (accessed on 17 September 2025).
  56. Indonesian Ministry of Public Works and Housing. Kampung Improvement Program: Achievements and Challenges. Available online: https://spada.uns.ac.id/pluginfile.php/632973/mod_resource/content/1/Paper%20KIP.pdf (accessed on 17 September 2025).
  57. Asian Development Bank. Financing Integrated Settlements Development Project; Asian Development Bank: Mandaluyong, Philippines, 2006; Available online: https://www.adb.org/sites/default/files/project-documents//37473-ino-tacr.pdf (accessed on 17 September 2025).
  58. Chongqing Municipal Bureau of Statistics. Chongqing Statistical Yearbook 2023; China Statistics Press: Beijing, China, 2023. [Google Scholar]
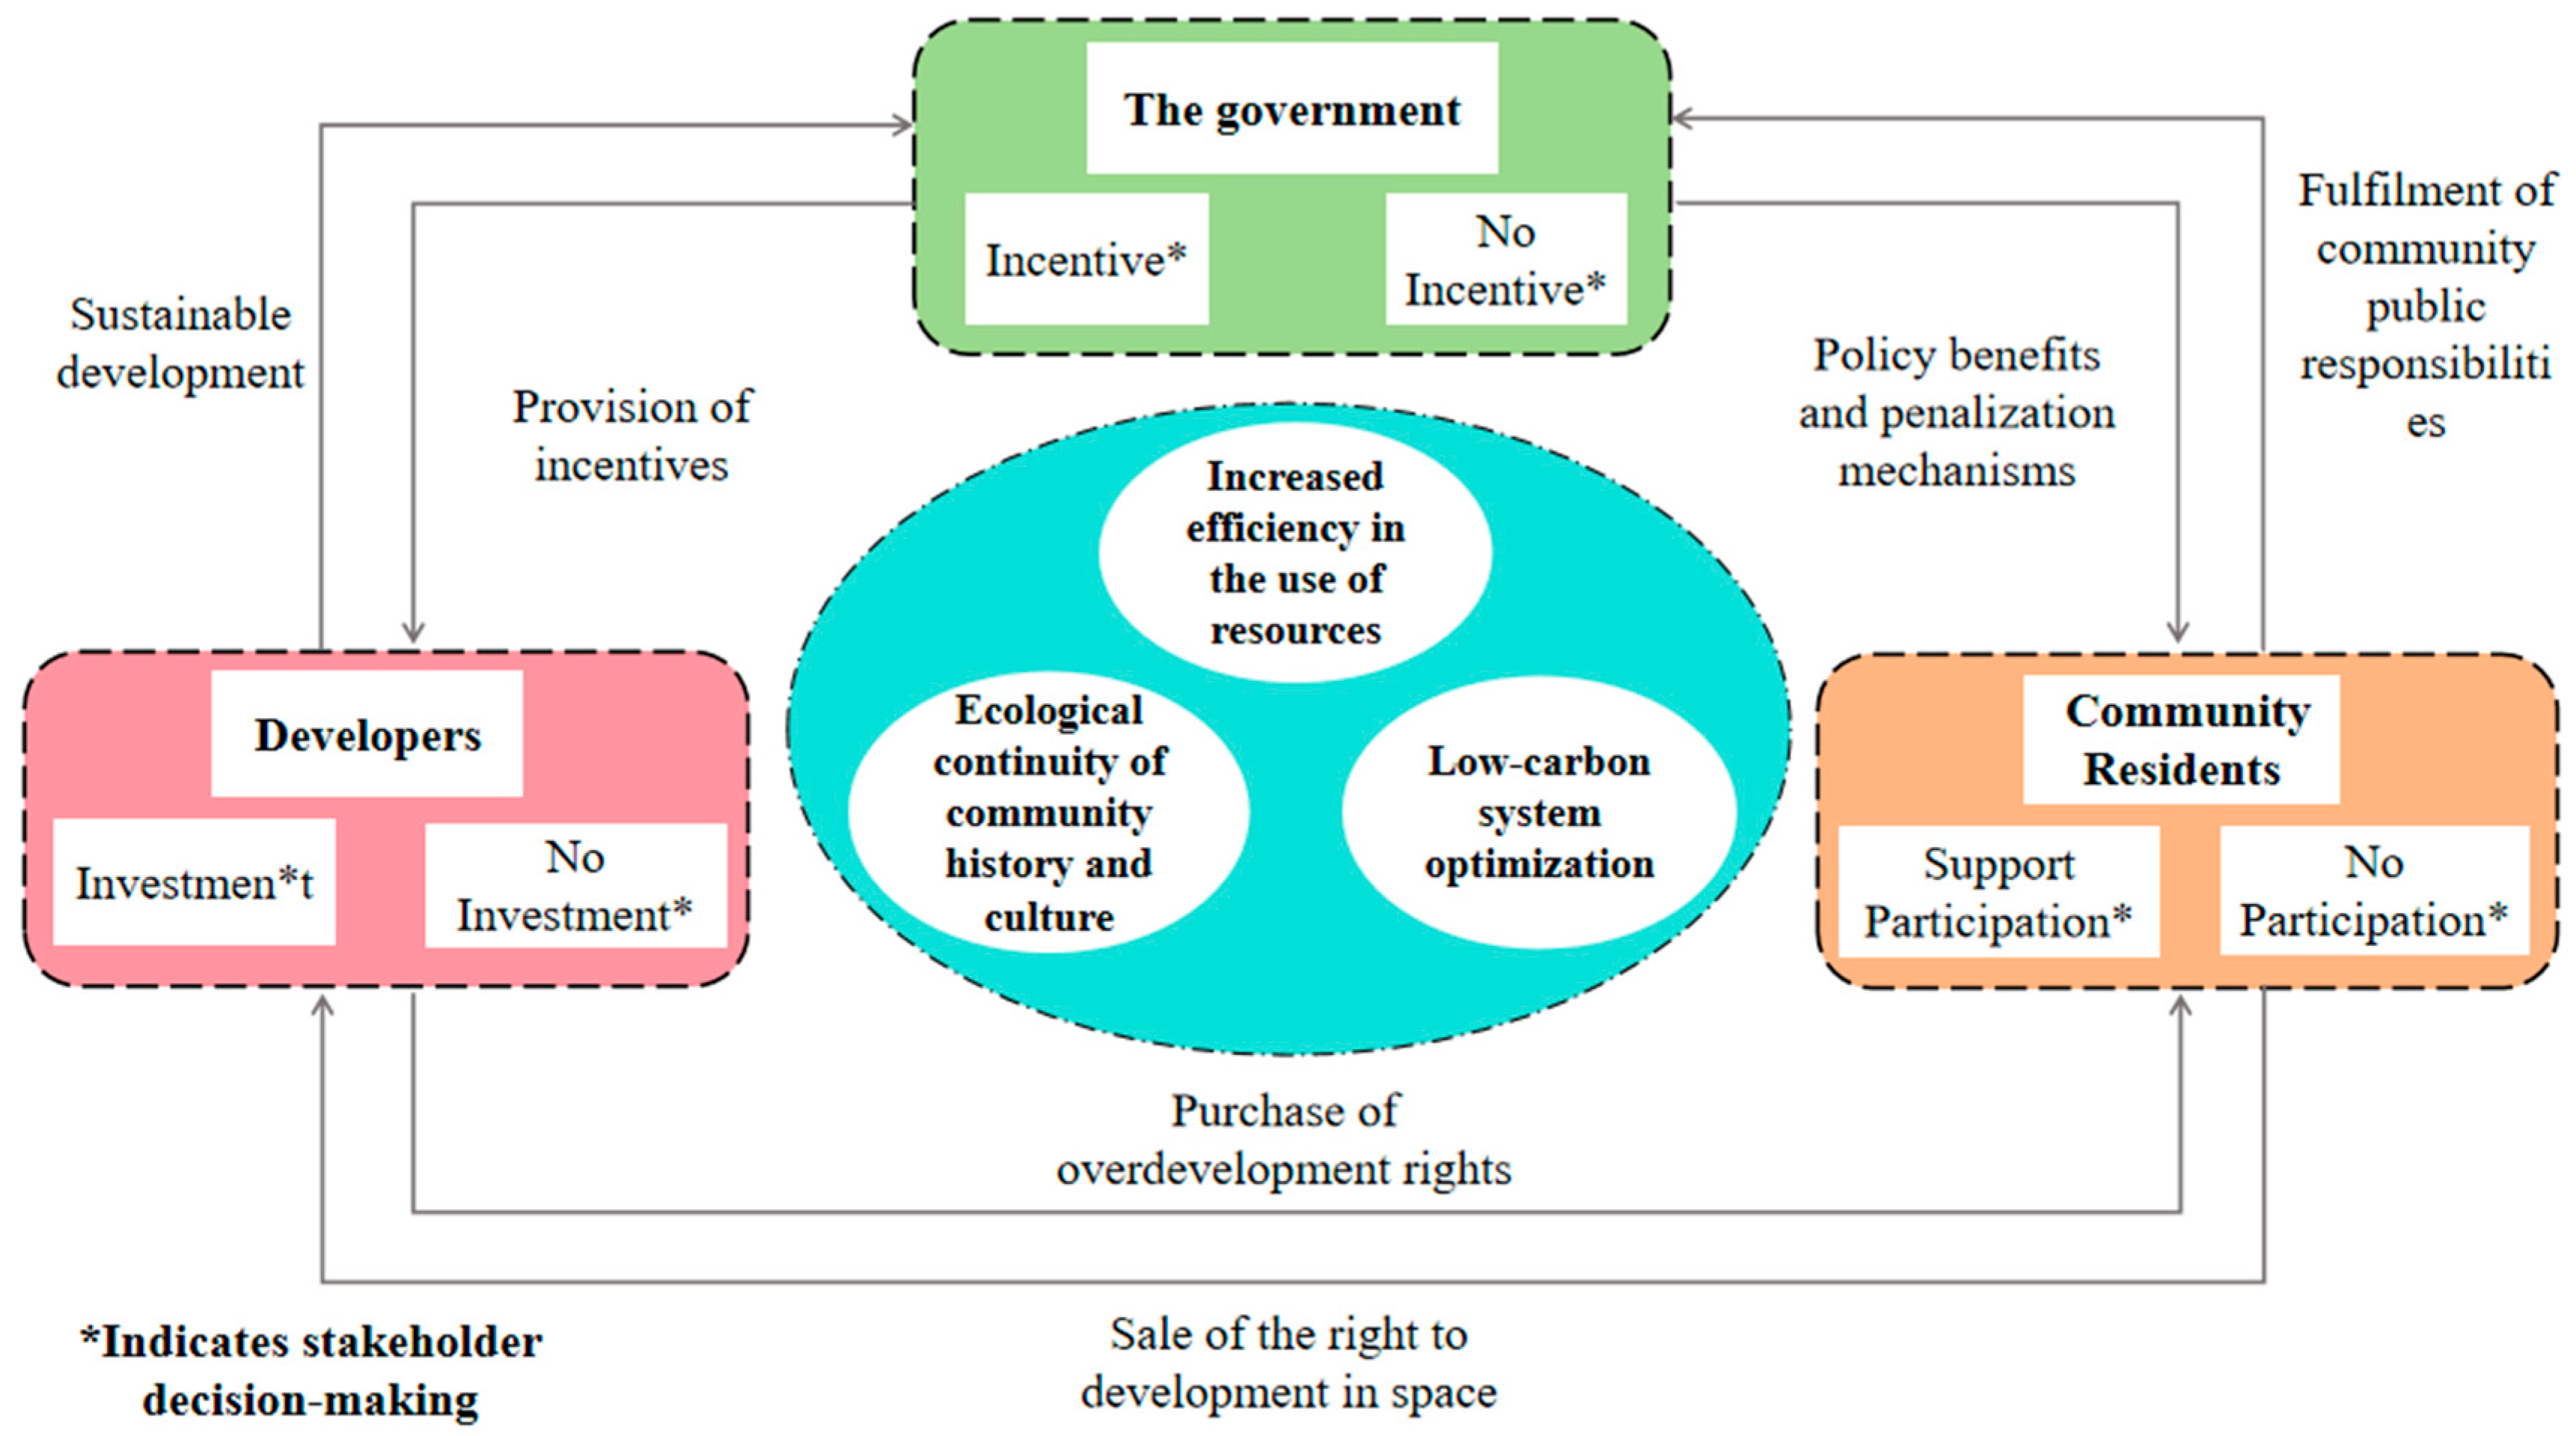
Figure 1. Research framework.
Sustainability 17 08713 g001
Figure 2. A three-way evolutionary game model for community renewal.
Sustainability 17 08713 g002
Figure 3. Evolution of government strategy choices. The “*” marks the neutral steady-state point of the government’s strategy. The arrow indicates the evolutionary process from one strategy to another, pointing to the stable equilibrium points of the system under different conditions.
Sustainability 17 08713 g003
Figure 4. Evolution of residents’ strategy choices. The “*” marks the neutral steady-state point of community residents’ strategy. The arrow indicates the evolutionary process from one strategy to another, pointing to the stable equilibrium points of the system under different conditions.
Sustainability 17 08713 g004
Figure 5. Evolutionary process of developer strategy selection. The “**” marks the neutral steady-state point of the developer’s strategy. The arrow indicates the evolutionary process from one strategy to another, pointing to the stable equilibrium points of the system under different conditions.
Sustainability 17 08713 g005
Figure 6. The temporal evolution of community renewal across different stages. (a) shows the temporal evolutionary pathway during the resource-oriented phase; (b) shows the temporal evolutionary pathway during the element integration phase; (c) shows the temporal evolutionary pathway during the co-governance and synergy phase.
Sustainability 17 08713 g006
Figure 7. Evolutionary path of the three-party game with different initial values. This figure illustrates the evolutionary paths of a three-party game under different initial conditions, with probability scales clearly labeled at 0.1 intervals (range 0–1). The original simulation data can be found in the Supplementary Materials. The different colored lines represent the evolutionary paths of the three-party game, where the strategies of the three parties (government, residents, and developers) evolve over time. Each colored line corresponds to a different initial combination of strategies for the three parties (represented by different initial values for x, y, and z).
Sustainability 17 08713 g007
Figure 8. The effect of different higher government rewards on the system’s evolutionary process. (a) illustrates the impact of different upper-level government incentives on the evolution of government strategies; (b) illustrates the impact of different levels of government incentives on the strategic evolution process among community residents; (c) illustrates the impact of different upper-level government incentives on the evolution of developers’ strategies.
Sustainability 17 08713 g008
Figure 9. The effect of different government subsidies to developers on the evolution process of the system. (a) illustrates the impact of different government subsidies to developers on the evolution of government strategies; (b) illustrates the impact of different government subsidies on developers and their role in the evolution of community residents’ strategies; (c) illustrates the impact of different government subsidies on developers and their role in the evolution of developer strategies. The decline phase is characterized by the quadratic function z = −0.00033309 × (M1)2 + 0.034426 × (M1) − 0.0075503, with a goodness-of-fit of R2 = 0.97698.
Sustainability 17 08713 g009
Figure 10. Impacts of Different Government Subsidies to Residents on the Evolutionary Process of the System. (a) illustrates the impact of different government subsidies on residents on the evolution of government strategies; (b) illustrates the impact of different government subsidies on the strategic evolution process of community residents; (c) illustrates the impact of different government subsidies on residents on the evolution of developers’ strategies.
Sustainability 17 08713 g010
Figure 11. Impact of different residents’ revenue on the system evolution process. (a) illustrates the impact of varying resident incomes on the evolutionary process of the government strategy system; (b) illustrates the impact of varying resident incomes on the evolutionary process of the community’s strategic system; (c) illustrates the impact of varying resident incomes on the evolutionary process of the developer strategy system.
Sustainability 17 08713 g011
Figure 12. Impact of Different Developers’ Revenue on System Evolution. (a) describe the impact of changes in different developers’ revenues on the evolution of the government strategic system; (b) describe the impact of changes in different developers’ revenues on the evolution of the community strategic system; (c) describe the impact of changes in different developers’ revenues on the evolution of the developer strategic system.
Sustainability 17 08713 g012
Figure 13. Impact of Different Governments’ Revenue on System Evolution. (a) describe the impact of varying government revenues on the evolution of government strategic systems; (b) describe the impact of varying government revenues on the evolution of community strategic systems; (c) describe the impact of varying government revenues on the evolution of developer strategic systems.
Sustainability 17 08713 g013
Figure 14. Variation Ranges of M1 and M2 Critical Values under Parameter Perturbation.
Sustainability 17 08713 g014
Figure 15. Bootstrap distribution and confidence intervals for M1 and M2 critical thresholds.
Sustainability 17 08713 g015
Table 1. Parameters and Variables.
ParameterMeaning
C1Project construction funds are borne by the government when it incentivizes developers to participate in regeneration.
C2Project construction funds are borne by the government when it does not incentivize developers to participate in regeneration.
WGovernment incentives for developers and residents to receive incentives from higher-level authorities
M1Government economic subsidies and tax incentives for developers to participate in regeneration
M2Government subsidies for residents to participate in regeneration
S2When governments are not incentivized, residents are negatively engaged, developers are uncooperative, and governments are penalized for losses.
R4The social benefits of government incentives for community renewal include three parts of sustainability: environmental, social, and economic.
C3Community residents are actively involved in the cost of community renewal.
R1Social benefits of normal life for community residents before community regeneration
R2Neighborhood residents receive additional benefits for their active participation in community regeneration.
S1Community residents who participate negatively in community regeneration and are dissatisfied with the results of the regeneration and transformation will bear certain losses.
C4Developer Participation in Community Renewal Project Construction Funding.
R3Economic benefits to developers of participating in community regeneration.
R5Normal social benefits when developers do not cooperate.
xThe probability that the government chooses an incentive strategy.
yProbability of community residents choosing to actively participate.
zThe probability that a developer will choose to cooperate.
Table 2. Mixed-strategy game matrix for government, developers, and community residents.
Governments
Incentives (x)Disincentive (1 − x)
people living in the communityRemodel (y)developerparticipate actively (z)(W − C11 − M1 − M2 + R4,
M2 + R2 − C3, M1 + R3 − C4)
(−C2, R2 − C3, R3 − C4)
non-participation (1 − z)(W − M1 − C1 + R4, R1 − S1,
M1 + R3 − C4)
(−C2, R1 − S1, R3 − C4)
no remodeling (1 − y)developerparticipate actively (z)(W − C1 − M2 + R4,
M2 + R2 − C3, R5)
(−C2, R2 − C3, R5)
non-participation (1 − z)(W − C1 + R4, R1 − S1, R5)(−S2, R1 − S1, R5)
Note: Non-market attributes (e.g., social capital, heritage value) are monetized based on estimates from existing contingent valuation studies in comparable Chinese renewal projects [40,41,42]. While this introduces uncertainty, it allows for a consolidated analysis of stakeholder trade-offs.
Table 3. Eigenvalues of the Jacobi matrix at local equilibrium points.
Equilibrium PointEigenvalue 1Eigenvalue 2Eigenvalue 3
(0,0,0)λ1 = W + S2 + R4 − C1λ2 = R2 − R1 − C3 + S1λ3 = R3 − C4 − R5
(0,0,1)λ1 = C2 − C1 − M1 + R4 + Wλ2 = R2 − R1 − C3 + S1λ3 = C4 − R3 + R5
(0,1,0)λ1 = C2 − C1 − M2 + R4 + Wλ2 = C3 + R1 − R2 − S1λ3 = R3 − C4 − R5
(0,1,1)λ1 = C2 − C1 − M1 − M2 + R4 + Wλ2 = C3 + R1 − R2 − S1λ3 = C4 − R3 + R5
(1,0,0)λ1 = C1 − R4 − S2 − Wλ2 = M2 − C3 − R1 + R2 + S1λ3 = M1 − C4 + R3 − R5
(1,0,1)λ1 = C1 − C2 + M1 − R4 − Wλ2 = M2 − C3 − R1 + R2 + S1λ3 = C4 − R3 − M1 + R5
(1,1,0)λ1 = C1 − C2 + M2 − R4 − Wλ2 = C3 − M2 + R1 − R2 − S1λ3 = M1 − C4 + R3 − R5
(1,1,1)λ1 = C1 − C2 + M1 + M2 − R4 − Wλ2 = C3 − M2 + R1 − R2 − S1λ3 = C4 − R3 − M1 + R5
Note: The governance stage for each equilibrium point is consistently defined throughout the text.
Table 4. Parametric simulation data.
ParametersSimulation Data
(10 k RMB)
Rationale and Description
C120Estimation based on the case: In the LZ renewal pilot, the government participates in infrastructure investment through guiding capital and special funds, representing approximately 20–30% of the construction cost, with the value set within the range of [30, 50].
C240At this time, the developer does not cooperate, the government needs to independently bear the renewal expenditure, according to the “full coverage” logic set higher than C1, set to [60, 80], and used for sensitivity testing.
C310Referring to the special incentive ratio mentioned in the National Urban Renewal Pilot Fund Management Measures (2021), it is set at 5–10% of the total project investment, which is taken as [8, 12].
C430Based on national and local urban renewal preferential policies (e.g., tax rebates, subsidized loans, the value is set to [15, 25].
M115Based on [28] quantitative analysis of the impact of incentives on developer behavior in green building, the amount of subsidies and tax credits is set to be 15–25% of the developer’s total investment in total to motivate cooperation.
M210This loss is difficult to quantify and is set to a medium–high value [30, 50] for modeling the feedback pressure on the government from policy incentive failures.
W30Drawing on research on multi-tiered intergovernmental incentives, the central/provincial incentives were set at 5–10% of total investment at the prefecture and municipal levels, which reasonably reflects the resource feedback from higher levels on the performance of renewal projects.
R110Referring to [20], the quantitative weights of the three types of indicators, namely, “environmental improvement, public service, and governance capacity”, are used in the performance assessment of urban resilience regeneration.
R215Based on the marginal benefits from housing improvements, environmental enhancements, etc., in Lin and Park [31,49], set up and measure the elasticity of their impacts in a sensitivity analysis.
R345Based on ROI assumptions, estimated at a reasonable profit range of 15–30 percent.
R450Same as R1
R515Based on Jiayu and Xiaodong et al.’s “conservative profit” setting in the green development game model [50].
S130Lacking a direct quantitative basis, this paper estimates the cost of negative events in an old district project in Wuhan by [10,51].
S220Same as S1
Table 5. Eigenvalue Values and Stability Judgment of Equilibrium Points Based on Baseline Parameter Set.
Equilibrium PointEigenvalue 1Eigenvalue 2Eigenvalue 3
(0,0,0)λ1 = 80λ2 = 25λ3 = 0
(0,0,1)λ1 = 85λ2 = 25λ3 = 0
(0,1,0)λ1 = 90λ2 = −25λ3 = 0
(0,1,1)λ1 = 75λ2 = −25λ3 = 0
(1,0,0)λ1 = −80λ2 = 35λ3 = 15
(1,0,1)λ1 = −85λ2 = 35λ3 = −15
(1,1,0)λ1 = −90λ2 = −35λ3 = 15
(1,1,1)λ1 = −75λ2 = −35λ3 = −15
Disclaimer/Publisher’s Note: The statements, opinions and data contained in all publications are solely those of the individual author(s) and contributor(s) and not of MDPI and/or the editor(s). MDPI and/or the editor(s) disclaim responsibility for any injury to people or property resulting from any ideas, methods, instructions or products referred to in the content.