Article

Tool for the Establishment of Optimal Open Green Spaces Using GIS and Nature-Based Solutions: Al-Sareeh (Jordan) Case Study

by
Anwaar M. Banisalman
1,*,
Mohamed M. Elsharkawy
2 and
Ahlam Eshruq Labin
1
1
Architecture Engineering Department, Faculty of Engineering, Al Al-Bayt University, Mafraq 130040, Jordan
2
Soil and Water Sciences Department, Faculty of Agriculture, Beni-Suef University, Beni-Suef 62514, Egypt
*
Author to whom correspondence should be addressed.
Sustainability 2025, 17(19), 8647; https://doi.org/10.3390/su17198647
Submission received: 20 August 2025 / Revised: 14 September 2025 / Accepted: 18 September 2025 / Published: 26 September 2025

Abstract

Urban sprawl is a growing issue in developing countries such as Jordan, where urban populations continue to expand rapidly and are projected to reach 70% of the global population by 2050. This urbanization creates significant challenges, particularly the depletion of natural resources and the reduction in green areas. This study proposes an approach to improve the selection of open green space locations by integrating Geographic Information Systems (GISs) with Nature-based Solutions (NbSs) for urban sustainability and resilience. Using Al-Sarih, Jordan, as a case study, GIS was applied to analyze environmental factors, including soil, meteorological, and geological data, through a weighted overlay analysis to assess potential park sites. The results indicated that most parks are situated in areas with suitable geological and soil conditions. However, their distribution is uneven, with dense coverage in the northern region and limited availability in southern and western parts. This imbalance highlights the need for equitable green space planning to ensure accessibility for all residents. This study underscores the value of integrating GIS and NbS in optimizing green infrastructure, providing a scientific framework for sustainable urban planning. It further emphasizes the importance of spatial and natural data interactions to support resilient city development.

1. Introduction

Urban green spaces are essential for sustainable cities, serving as key examples of NbSs by integrating green infrastructure, fostering habitats for native species, enhancing pollination, and ensuring ecosystem connectivity [1]. Choosing the optimal site for a green area, such as a park or green infrastructure, is critical for ensuring ecological, social, and functional success [2]. Green park locations have recently caused significant challenges because urban growth that does not take into account additional public green space can lead to lower living standards. Urban densification also causes a lack of available land, and conflicting demands for space have made it difficult to locate green spaces in urban settings [3]. By utilizing GIS for mapping and analyzing land use, vegetation cover, soil types, and ecological corridors, Neema and Ohgai [4] identified vacant spaces suitable for green infrastructure. Another widely used approach is Multi-Criteria Decision Analysis (MCDA), which combines various criteria such as environmental, economic, and social factors to rank potential sites for green spaces. Mukhopadhyay et al. [5] used MCDA as a strategic tool to identify locations with the greatest potential for sustainable green infrastructure by considering variables such as social justice, environmental resilience, and urban planning requirements. This approach facilitated the selection of sites that could maximize ecological benefits while meeting community needs. Similarly, Gontte, [6] employed MCDA frameworks to include ecosystem services into the site selection process. The usefulness of MCDA in balancing intricate, multifaceted aspects to guide efficient green space development and support more general urban sustainability objectives is highlighted in both studies [7].
Another method used in green space planning is Ecological Suitability Modeling, which evaluates land suitability based on parameters such as soil quality, water availability, and vegetation compatibility. Castelli et al. [8] identified locations for urban greening to improve biodiversity utilizing suitability models. Accessibility and Equity Mapping, which assesses walking distances to green spaces and public transit networks, is another important technique. Kifayatullah et al. [9] used this method to identify regions where underprivileged populations have restricted access to these vital resources by utilizing accessibility and equity mapping to detect gaps in access to urban green spaces. In addition to visualizing the geographical distribution of green areas, this mapping technique revealed disparities in access based on socioeconomic status, emphasizing the need for more equitable planning. It also evaluated the proximity of parks to socioeconomically deprived neighborhoods and found that these populations often face significant barriers to accessing high-quality green spaces. Their assessment of park proximity showed how socioeconomic position affects access to green spaces, highlighting the significance of addressing these inequalities to promote both environmental and social justice in urban design [10]. In addition, Chanchitpricha and Fischer [11] explained how to include Environmental Impact Assessment (EIA) principles to maintain a balance between green-space preservation and urban expansion. Sundar et al. [12] suggested an urban heat island (UHI) analysis that uses satellite imagery and temperature data to identify heat-prone areas suitable for green space development. They recommended strategically placing parks as a means of lowering urban temperatures, with a focus on locating UHI in densely populated areas. Similarly, UHI data were used to inform the planning of climate-resilient green infrastructure, highlighting the importance of green areas in reducing the effects of UHI [13].
Therefore, recent studies such as Frantzeskaki et al. [14] and Koutsovili et al. [15] pointed out the methods of site selection for green areas used in the studies, such as Hydrological and Flood Risk Mapping, Community Engagement and Participatory Approaches, Landscape Ecology and Connectivity Analysis, and remote sensing and Satellite Data. These methods integrate environmental science, urban planning, and public policy to ensure green areas are optimally located for their ecological and social functions. NbS is defined by the International Union for Conservation of Nature (IUCN) as “actions to protect, sustainably manage, and restore natural or modified ecosystems, addressing societal challenges effectively and adaptively, simultaneously providing human well-being and biodiversity benefits” [16]. The European Commission describes NbS as “solutions inspired by, supported by, or copied from nature, designed to address societal challenges such as climate change, water security, food security, and disaster risk” [16]. “Modeling Place-Based Nature-Based Solutions to Promote Urban Sustainability” is an example of such studies that highlights the economic, social, and environmental co-benefits of urban Nature-based Solutions by integrating a variety of ecosystem services offered by NbS and encourages the broad use of NbS by demonstrating their capacity to meet all-encompassing urban sustainability objectives. This study assists in determining the best places to apply these solutions in metropolitan areas by employing GIS for spatial modeling, which results in more resilient communities. Schwartz et al. [17] investigated the spatial relationships between biophysical and social values for carbon sequestration potential. Their study highlights areas where NbS can simultaneously address climate change and biodiversity conservation by mapping spatial linkages using GIS, thus providing comprehensive insights into the potential of NbS. Batuigas et al. [18] employed spatial analysis to identify NbS sites that support water management objectives, utilizing GIS and case study data by identifying the spatial extent of existing and potential NbS locations in Germany to inform water management strategies. Furthermore, Mubeen et al. [19] used GIS to define suitable locations for large-scale NbS to reduce flood risks, thereby demonstrating the effectiveness of spatial analysis in NbS planning.
Xie et al. [20] showed how GIS can be used in environmental planning to analyze geological formations, soil properties, and rainfall data to find appropriate locations for water harvesting structures. They used these features to select the site, and the most common features they used were rainfall, soil composition, and geology. However, their primary purpose is to serve planners by creating references, and their application and practices are limited in developing countries, such as Jordan. In Jordan, combining GIS and spatial analysis with NbS provides a targeted approach for addressing socioeconomic and environmental challenges. Due to its dry environment, scarce water supply, and increasing urbanization, NbS is a crucial instrument for sustainable development. In the Jordanian context, Al-Bakri et al. [21] used GIS and NbS criteria in the Azraq Oasis Restoration to represent changes in vegetation cover, and water levels were tracked by utilizing GIS and NbS strategies, including growing salt-tolerant plants and replenishing aquifers. Al Hreisha et al. [22] used NbS for the Wadi Mujib Biosphere Reserve for biodiversity hotspots, GIS mapping was used to aid in conservation planning, and NbS was used to prioritize community-based management and sustainable tourism. Also, Greater Amman Municipality identified the heat island impacts in Amman, utilizing GIS models, and green roofs and tree planting were found to be examples of NbSs used to attempt to improve urban livability. While GIS and NbS have been applied globally, few studies in Jordan have systematically integrated natural land suitability factors with urban green planning. This study adapts these frameworks to the semi-arid context of Al-Sareeh.
However, the purpose of this study is to assess how well NbS and GIS may be integrated to optimize Jordan’s site selection and spatial planning. Al-Sarih, located in the southern part of Irbid in Jordan, has less than 35% urban green space, which poses a risk to ecosystem services and biodiversity. Given these difficulties, this study raises a crucial research question: How much do natural factors, including soil composition, rainfall patterns, and geological features, affect the design of green spaces in semi-arid urban settings like Al-Sarih? We aim to compare GIS-based stratification with NbS planning frameworks in a methodical manner to improve their location, effectiveness, and co-benefits. In line with global and national sustainability and climate resilience objectives, this study aims to create a data-driven, collaborative approach that facilitates more effective urban NbS implementation.

2. Materials and Methods

2.1. Study Area

The study site is located in Al-Sarih, between 32°31′22.00″ N and 32°29′13.00″ N in latitude and 35°52′16.00″ E and 35°55′28.00″ E in longitude, southeast of Irbid and about 62 km from the capital, with an elevation of 600 m above sea level, and represents the second most densely populated area in the Irbid Governorate. Irbid—Jordan’s third most populous city—is situated approximately 70 km north of Amman along the northern Gilead ridge (Figure 1). It has diverse ecosystems and distinctive vegetation patterns which are shaped by its varied topography. Meanwhile, Al-Sarih is a major agricultural center in a semi-arid climate [https://koppen.earth/, accessed on 15 July 2025] and is distinguished by mixed land use patterns, mostly agricultural and urban.

2.2. Environmental and Site Analysis in Al-Sarih, Jordan

Deforestation, excessive grazing, and unchecked urban growth are the main causes of ecological deterioration in Jordan, where more than 80% of the land is categorized as semi-arid or desert. Afforestation and sustainable land management are two examples of site-specific interventions that are recognized as essential mitigation techniques. With GIS, they may be efficiently planned and tracked [23]. Steep terrain and unsustainable farming methods are major contributors to land degradation, especially soil erosion, in Al-Sarih, according to GIS-based spatial analysis. In order to improve ecological resilience and land stability, priority zones for NbS have been selected, such as contour farming and plant restoration [24]. The necessity of integrated water management techniques is underscored by Jordan ranking as one of the most water-scarce countries, providing less than 100 m3 of renewable water per capita yearly [25].
A mixed-use land plan is supported by the region, blending farmland with new business and residential construction. Seasonal rains and fertile soils sustain traditional crops including wheat, barley, and olives. Urban sprawl, meanwhile, is worsening soil deterioration and increasingly endangering agricultural land. In certain places, agricultural methods and hilly terrain may be factors contributing to soil deterioration. An appropriate setting for investigating the relationship between rural land use, urban growth, and ecological preservation is provided by community-based NbS research in Al-Sarih. GIS technologies make it easier to identify possible areas for rainwater collection, green infrastructure installation, and reforestation (Figure 2). Al-Sarih has less than 35% urban green space, which poses a risk to ecosystem services and biodiversity. In light of these challenges, this study focuses on analyzing the impact of natural factors such as soil composition, rainfall patterns, and geological features on the design of green spaces in semi-arid urban areas like Al-Sarih.

2.3. Study Tool

GIS tools are mandatory for supporting NbS through resource mapping, scenario modeling, and stakeholder engagement. GIS enables the identification of critical intervention areas, such as flood-prone regions experiencing declining ecological health. Tools such as the U.S. Geological Survey’s National Hydrography Dataset support the mapping of ecosystem services to effectively guide conservation and restoration initiatives effectively [26]. Additionally, GIS enables predictive scenario modeling to evaluate the impacts of NbS strategies, such as afforestation or urban parks, on social, economic, and environmental outcomes. Geospatial data can simulate changes in carbon sequestration, temperature regulation, and flood risk reduction [27]. Through these applications, GIS integrates spatial analysis with participatory approaches, thereby advancing the implementation and evaluation of NbS initiatives. By analyzing spatial data on land use, vegetation, water resources, and socioeconomic aspects, GIS assists in identifying appropriate locations for NbS implementation. Simulating situations such as floodplain restoration or urban green infrastructure aids in decision making. For instance, the potential of urban trees and green roofs to reduce urban heat and control stormwater in cities has been evaluated using GIS technologies. GIS is essential for determining the best places to apply NbS, such as flood-prone areas for wetland restoration or urban heat islands for the construction of green infrastructure. GIS assists in evaluating and ranking places according to ecological, social, and environmental data by combining statistical methods, multi-criteria modeling, and geospatial analysis. “Green Infrastructure Mapping Guide: Using GIS for Coastal Resilience Planning 2023” demonstrates how GIS may assist NbS by facilitating location-specific, data-driven solutions that tackle pressing environmental issues, and offers a thorough framework for mapping and planning green infrastructure projects using GIS, assisting in making decisions that improve coastal resilience by implementing measures such as flood prevention and wetland restoration. The U.S. Geological Survey has restored the hydrology in wetlands around the Great Lakes region using GIS-based techniques [28]. GIS helps locate urban heat islands in urban settings, where green roofs and tree planting can reduce high temperatures, improve air quality, and advance urban sustainability [29].
This study integrated the most used methods in related studies to comprehensively achieve the research aim. This study uses quantitative methods to examine certain NbS initiatives using the Case-Based Approach. A quantitative method was applied using the Geographic Information System and satellite remote sensing, which are crucial tools for providing data at different temporal and spatial resolutions. Data were collected first from Google Earth, the open street website, and the Department of Statistics, and second from remotely sensed data from Earth Explorer USGS. Then, data prepared by georeferencing, projection, and attribute table development; GIS spatial analysis (overlay was used); and Remote Sensing Analysis (land classification) frequently provided evidence for statistical correlation (natural factors vs. green spaces) in urban studies because of the ease of access to cross-regional images [30]. ArcGIS and QGIS are tools for processing spatial data. For the analysis of imagery, platforms such as Google Earth Engine were used to gather primary data, such as statistics, remote sensing, and geospatial information pertaining to Al-Sarih city, which encompasses the following elements: urban land use maps, identification of current green space locations, and soil type maps derived from geological surveys. Natural factors such as rainfall, soil, and geology were prioritized due to their influence on vegetation growth and hydrological cycles (Frantzeskaki et al.) [15]. Rainfall data from the Jordan Meteorological Department (2010–2020 average), both historical and contemporary, were obtained from the meteorological agencies. Soil and geology data from the Royal Jordanian Geographic Centre; geological maps detailing rock formations, slope gradients, and elevation levels; and satellite imagery, such as that provided by Landsat 8 OLI/TIRS imagery from USGS Earth Explorer, were used to detect areas of green space. The GIS software that was used included ArcGIS 10.8 for spatial analysis, QGIS 3.22 for raster conversion, and Google Earth Engine for satellite preprocessing.

2.4. GIS-Based Data Preparation and Green Space Assessment

Spatial data preparation was conducted using GIS, including georeferencing, projection alignment, and attribute table development. Subsequently, spatial overlay analysis was applied to integrate thematic layers such as soil types, rainfall distribution, and geological maps (Table 1). The rainfall average is based on data from 2010 to 2020 (10-year average), as sourced from the Jordan Meteorological Department. The 2018 dataset was selected as the most complete, spatially consistent, and validated dataset available for Al-Sarih during this period.
Considering Table 2 below, there is currently no formal categorization of green spaces in Jordan. However, classification is feasible, allowing for the designation of parks and the establishment of administrative units.

2.5. Assessment of Existing Urban Green Spaces

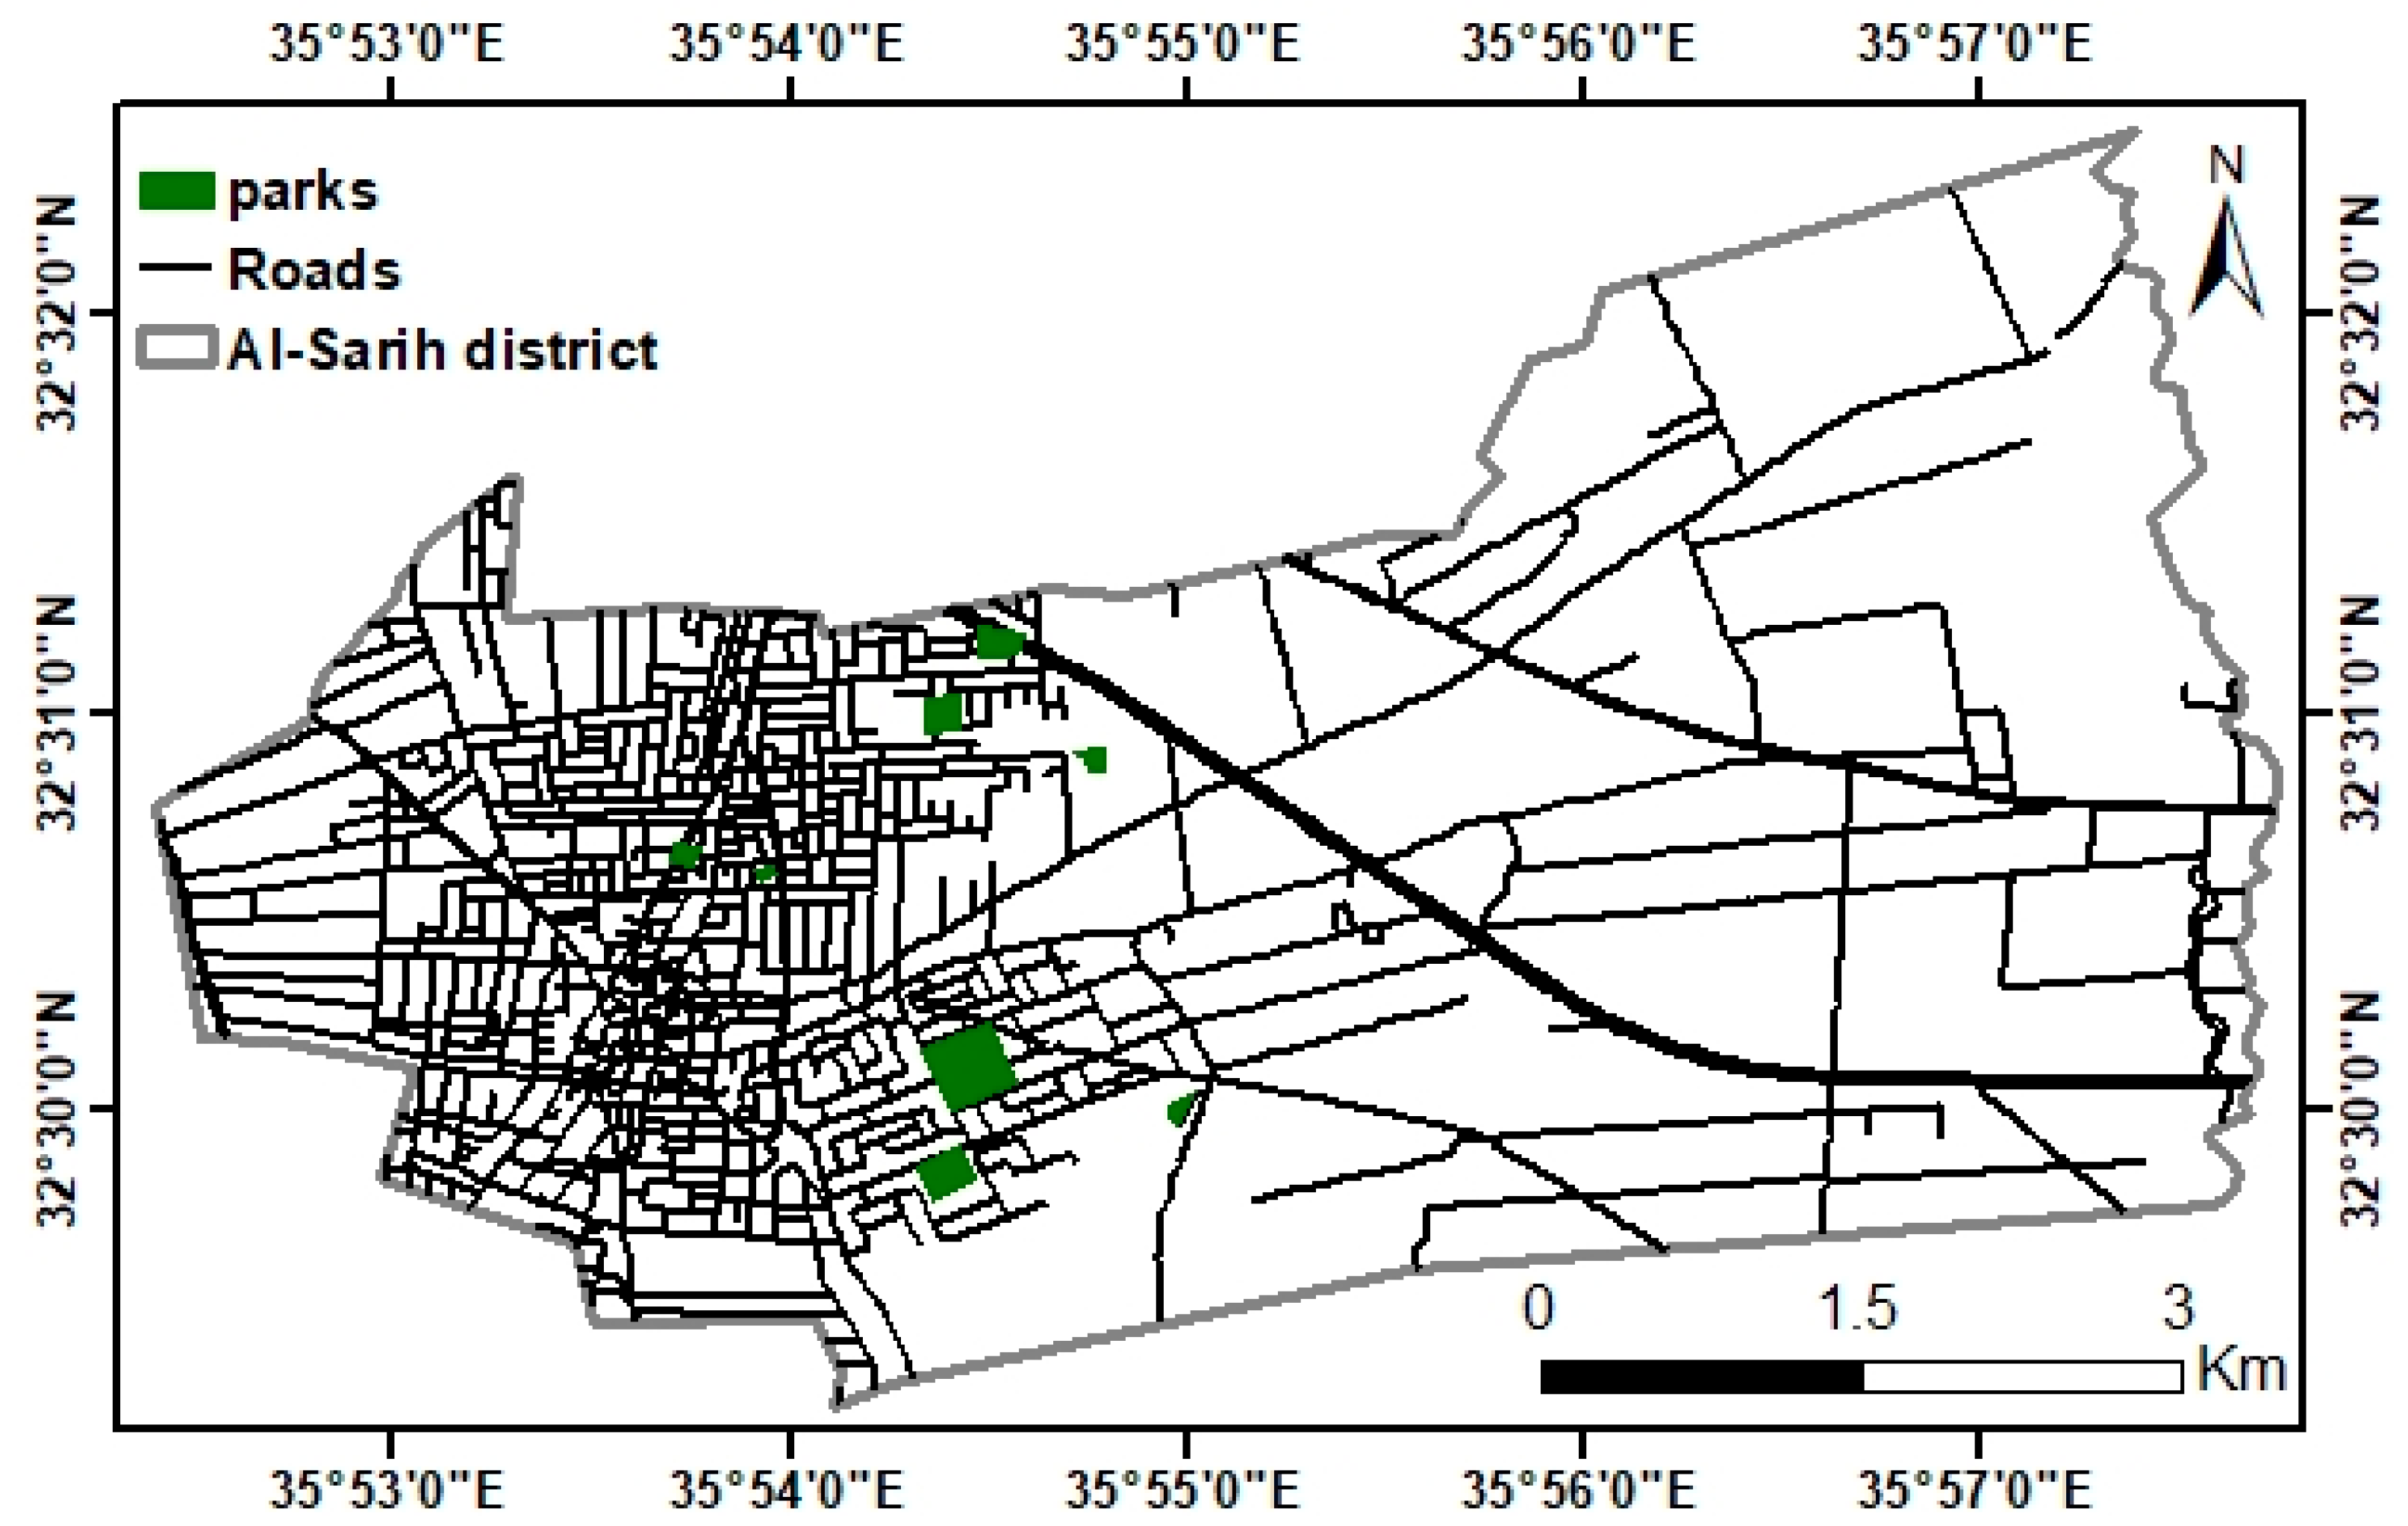
Figure 3 illustrates the spatial distribution of existing parks within the municipal land use map.
As shown in Table 2, urban green spaces can be classified into three main categories: Park Green Spaces, Attached Green Spaces, and Other Green Spaces. Park Green Spaces include theme parks and street parks, which offer recreational and esthetic functions. Attached Green Spaces refer to green areas linked with streets, residential zones, institutions, and other organized bodies. Other Green Spaces, such as scenic forest lands, provide visual and environmental benefits through natural woodland landscapes. Despite the absence of an official classification system in Jordan, these typologies provide a useful framework for evaluating and organizing urban green spaces in Al-Sarih. The analysis of parks in the land use municipality map revealed that they occupy approximately 92% of the assessed area, though they remain underrepresented in the western region. While their distribution is moderate, some clustering exists, with noticeable concentrations in certain zones and deficiencies in the eastern and northern sectors of Al-Sarih. The green-colored regions on the map highlight existing parks, which are relatively scarce and unevenly distributed, despite being favorably located in relation to natural criteria such as soil type, rainfall, and geology. To facilitate spatial visualization, most datasets were stored as feature classes linked to attribute tables, which were then converted into raster format to display the data through a color-coded scheme and legend (Figure 4).
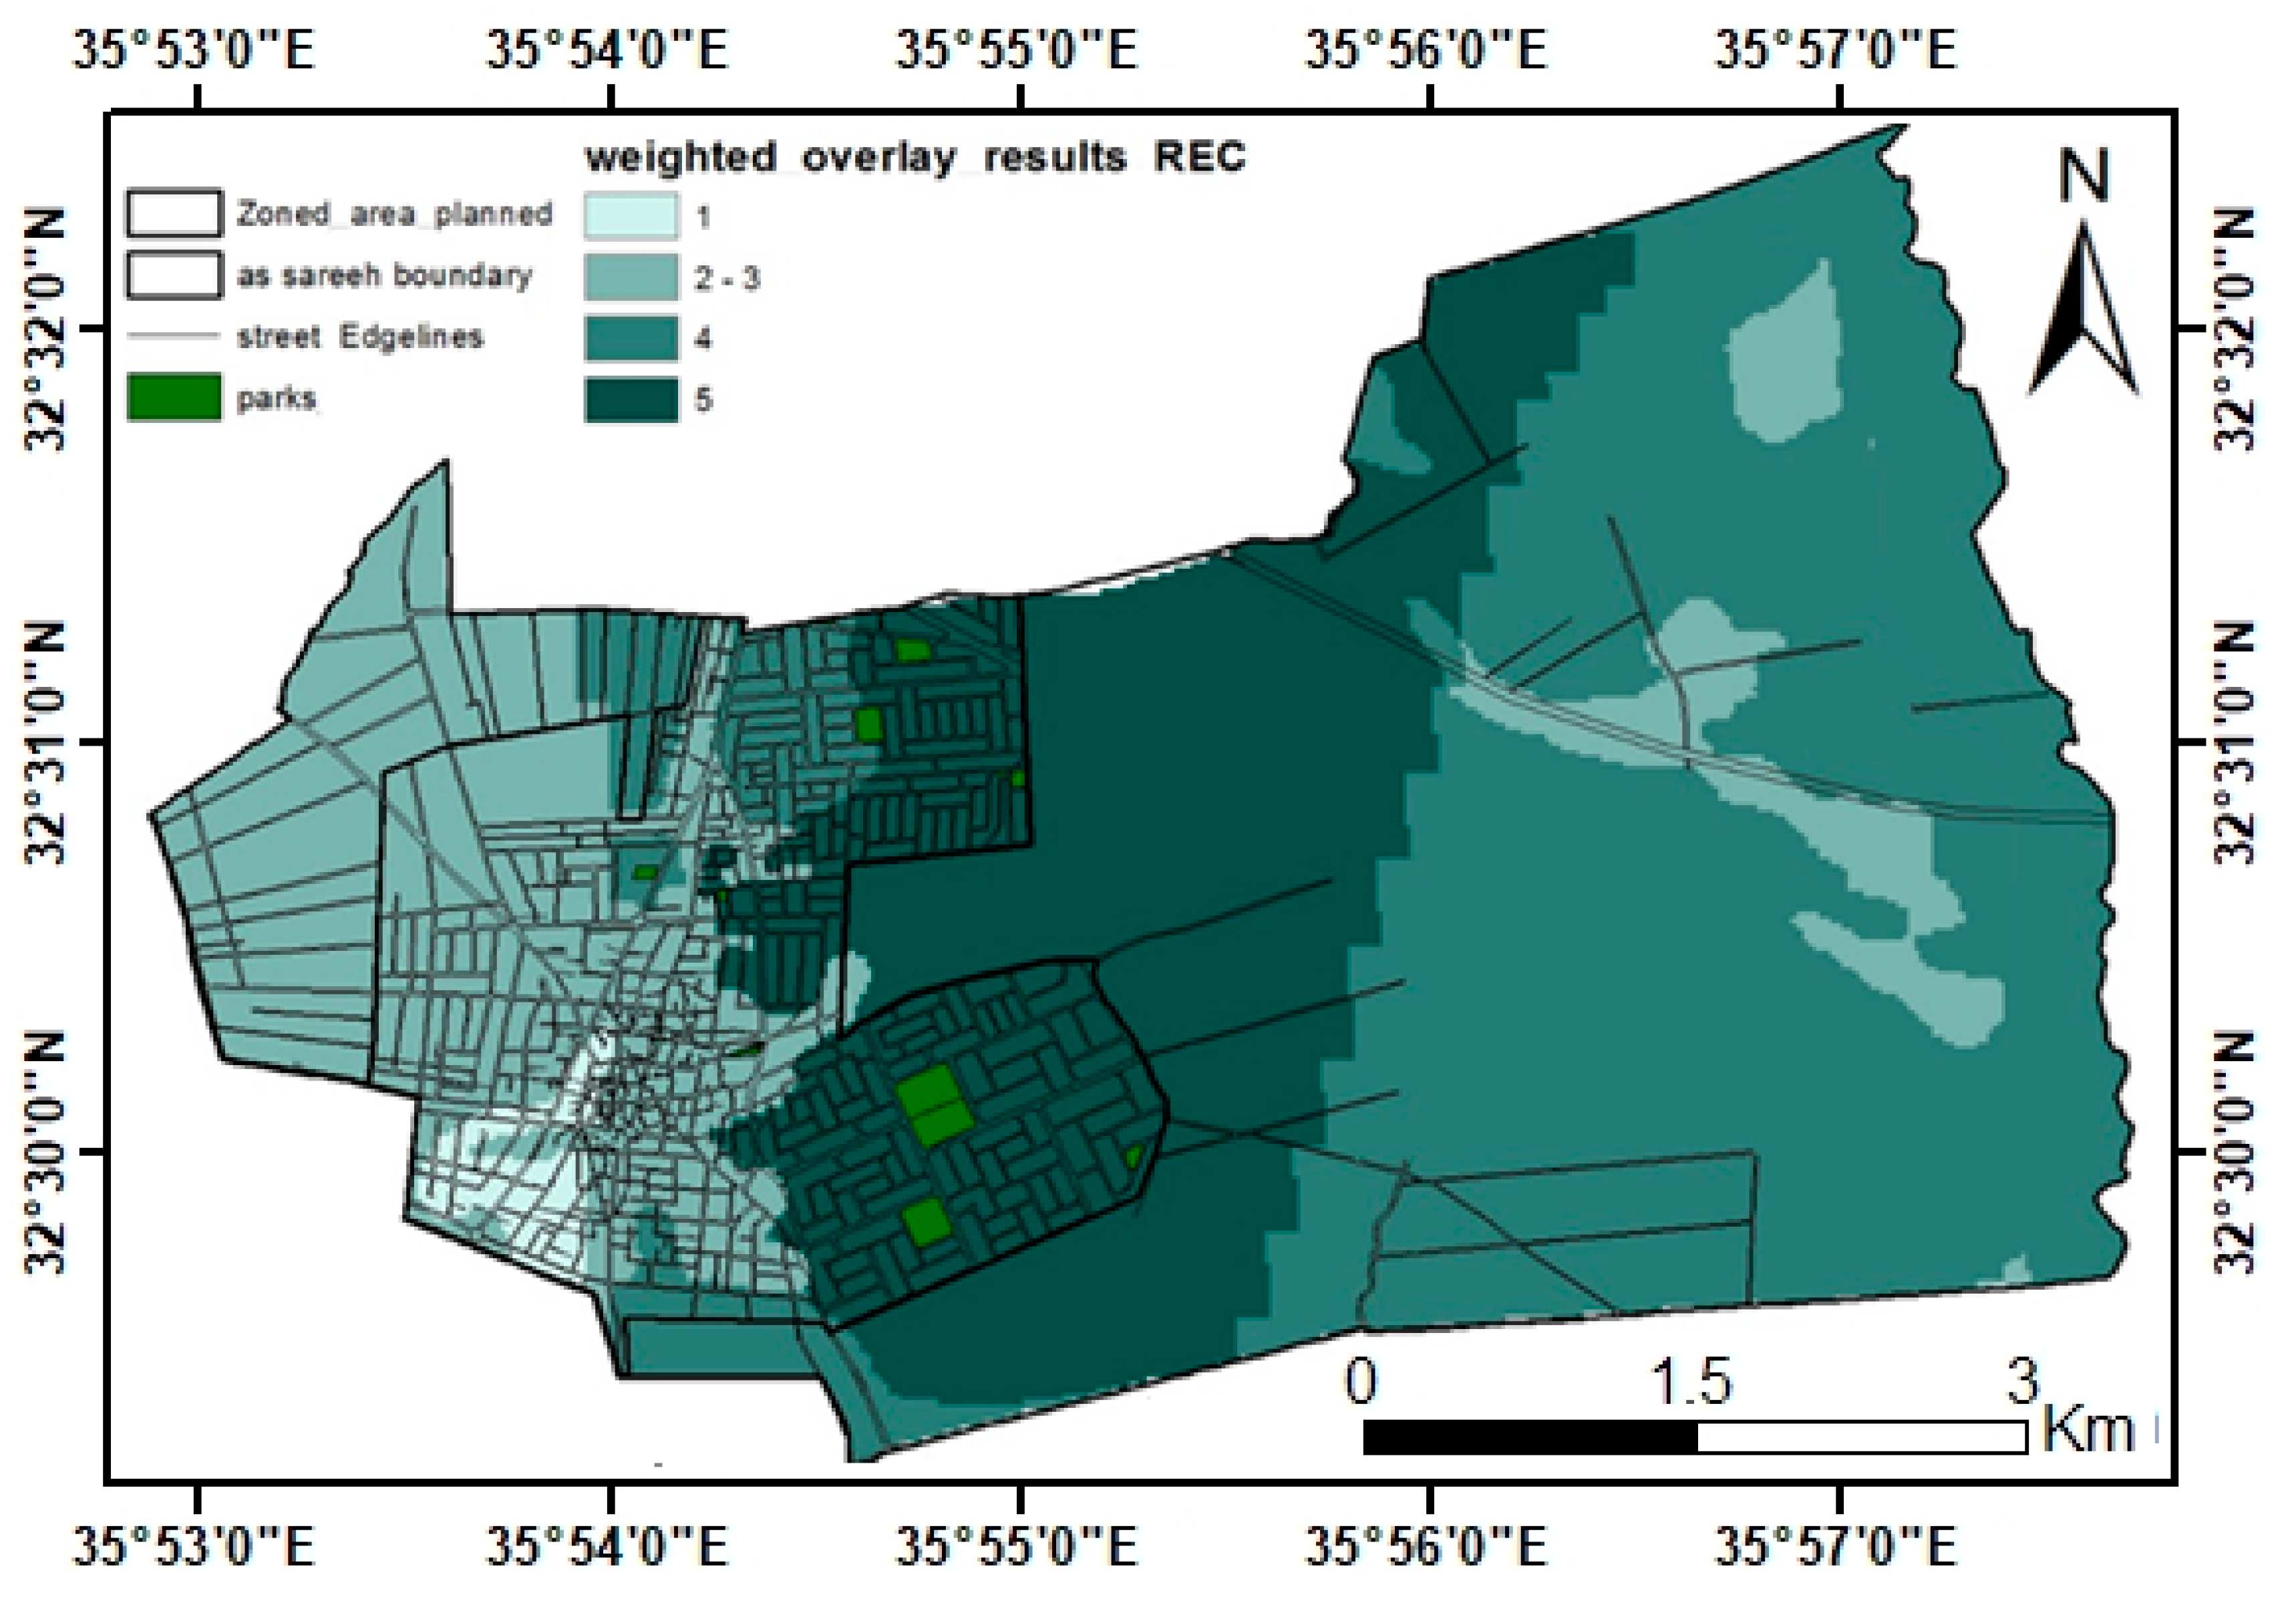
ArcGIS was used to assess the suitability of park locations as proposed by the municipality in the land use map. Three main variables (soil, rainfall, and geology) were considered, with the park location as the dependent variable. A weighted overlay method was employed to combine the previously produced maps. This tool overlays multiple raster datasets using a common scale and assigns weights to each based on its importance [31]. The weighted overlay tool, a spatial analysis tool, operates with raster files. Therefore, all factors were converted into raster format. The procedure involved the following steps: First, the ‘weighted overlay’ tool was launched from the ArcMap search table. Second, raster datasets were added using the “add” button. Third, each raster was assigned a percentage value based on its relative importance, ensuring the total equaled 100%. Weighting was informed by previous Multi-Criteria Decision Analysis (MCDA) applications in green space suitability analysis, emphasizing rainfall as the dominant ecological factor in semi-arid climates. For this study, geology was weighted at 30%, soil at 30%, and rainfall at 40% [5]. Finally, the reclassify tool was used to modify raster values for clearer representation on the map. Geological factors are crucial in determining park locations. As shown in Figure 5, existing parks are located in sandy areas, which align with the ideal geological conditions for park development. However, spatial analysis revealed that parks are clustered in the northern region, leaving the southern area without parks, which is a concern. Parks occupy only 5% of the study area.
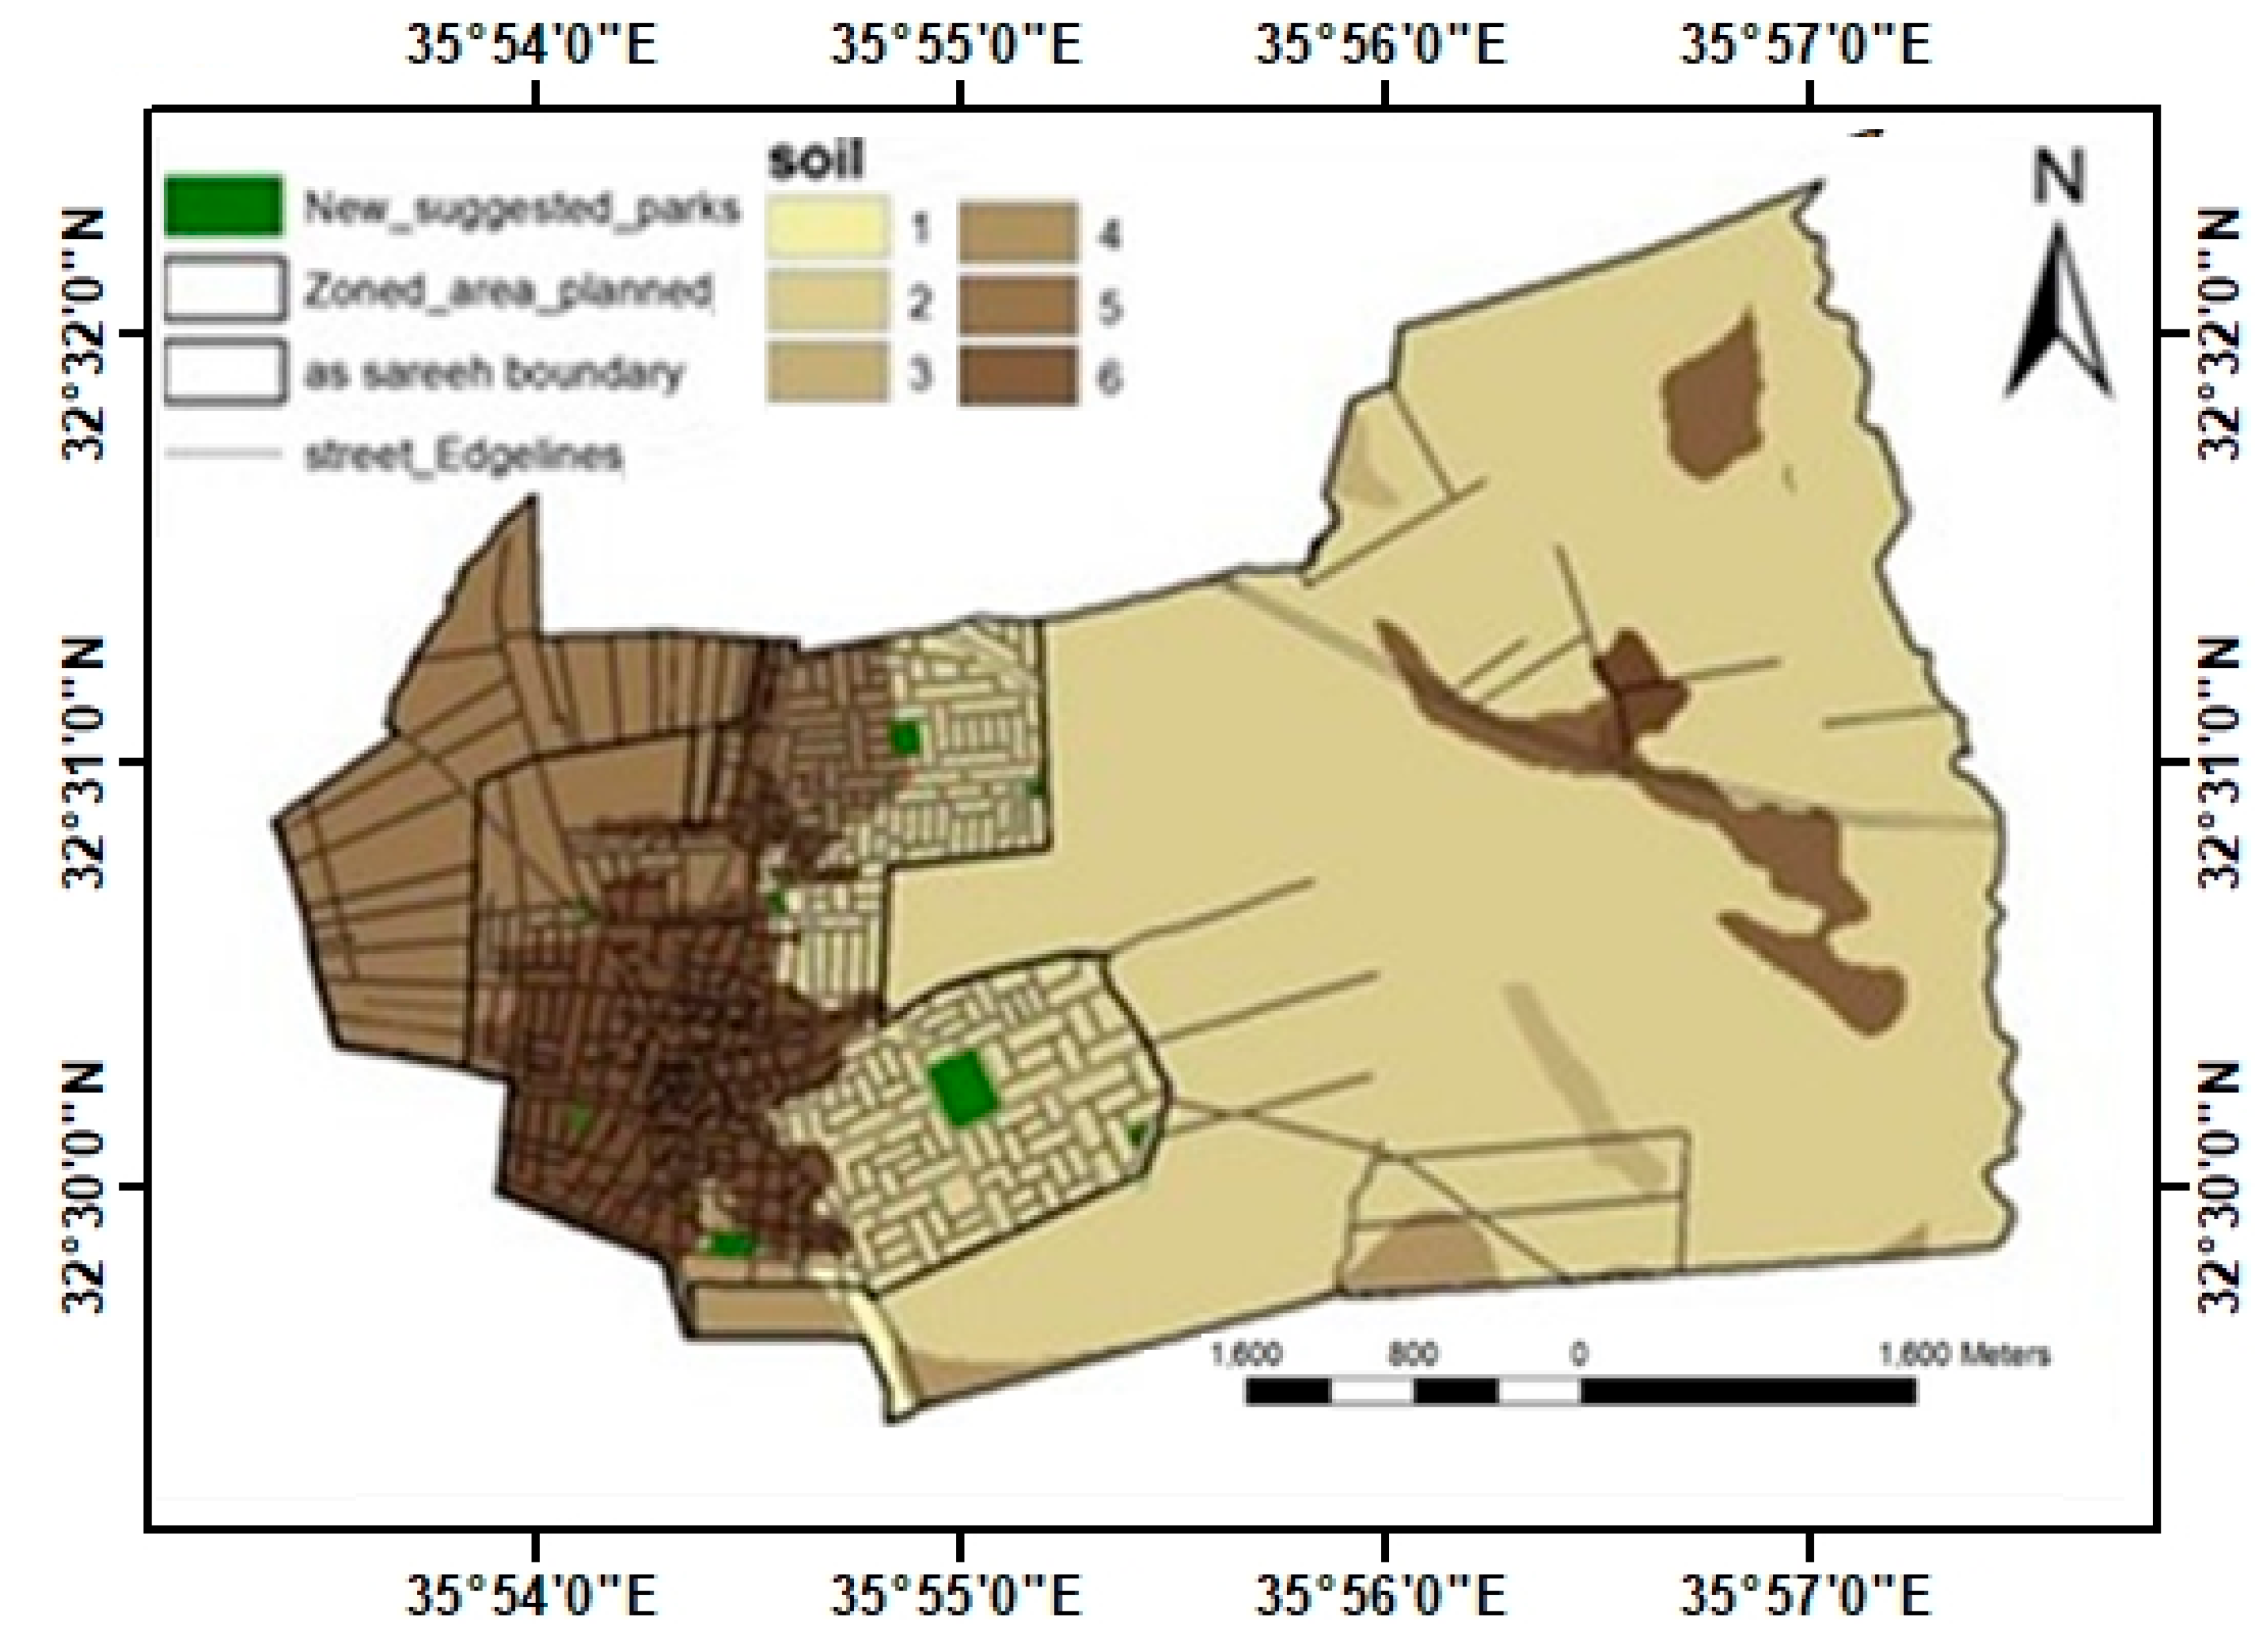
Rainfall is a key factor affecting both parks and agricultural lands. The study area has a rainfall rate ranging from 250 mm to 500 mm. As seen in Figure 4, existing parks fall within the 350–400 mm rainfall range, considered moderate and favorable for both parks and agricultural use. Soil types across the study area, illustrated in Figure 6 and detailed in Table 3 (Source: Royal Jordanian Geographic Centre), vary significantly.
Areas classified as value (1)—rolling limestone ridges with moderate slopes—are optimal for park construction. Darker areas (values 4 and 5), characterized by clay surfaces, represent agricultural lands but are still suitable for park development. Existing parks are located in both limestone and clay regions (Figure 6).
To refine the analysis, the ‘Symbology’ tool was used, selecting a four-class scheme for better accuracy and visualization. The final overlay map, shown in Figure 7, indicates that darker areas represent more suitable park locations. Notably, existing parks are located in these favorable zones.
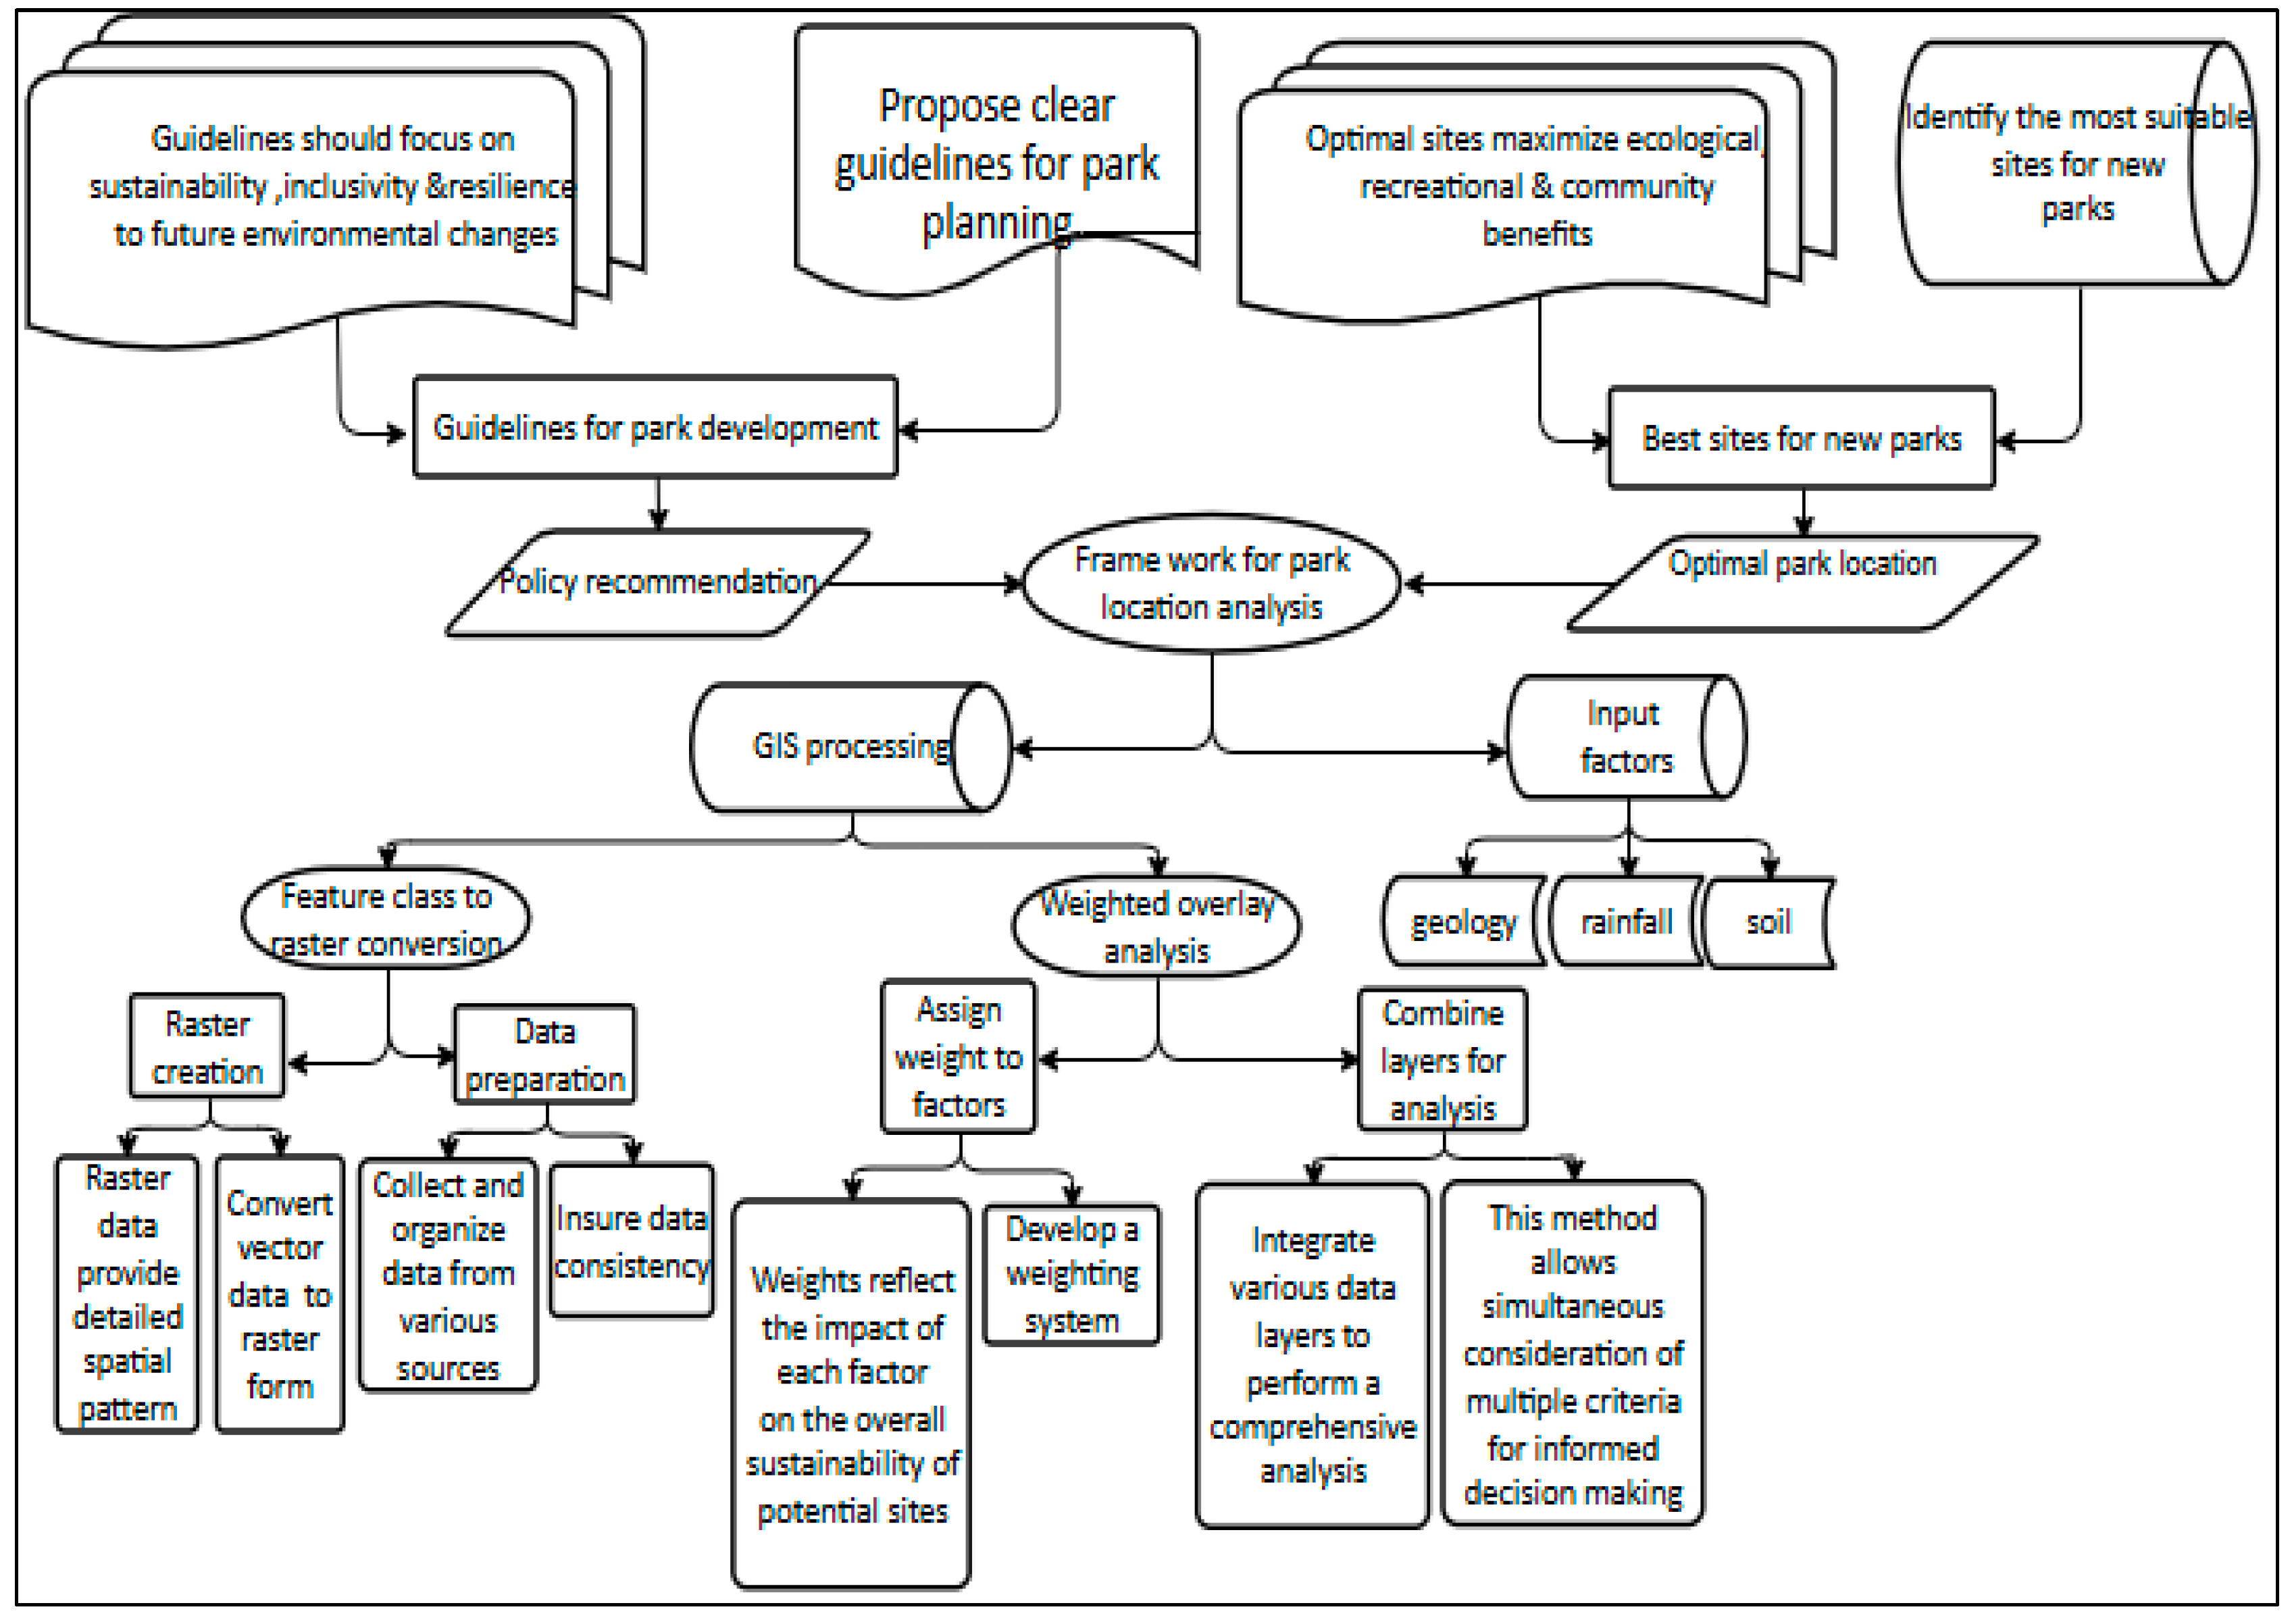
Figure 8 presents the conceptual flowchart outlining the workflow employed for NBS planning.

3. Results and Discussion

The results demonstrate how green space planning can be optimized through the integration of GIS and NbS, particularly in crowded areas such as Al-Sarih. Urban green spaces are critical for promoting sustainability, supporting biodiversity, and enhancing public health. Additionally, they provide essential ecosystem services, including air quality improvement, stormwater regulation, and opportunities for recreation and social interaction. However, increasing urbanization and high population density hinder the equitable distribution and accessibility of green spaces in many cities, including Al-Sarih. This section discusses the importance of applying GIS and NbS approaches to address these challenges. Integrating GIS with NbS in urban planning allows for a systematic evaluation of environmental, social, and functional criteria when selecting suitable locations for green spaces. Prior research underscores the necessity of incorporating a wide range of ecological, social, and technical factors in site selection. For instance, ref. [4] stressed the importance of analyzing soil types, vegetation cover, and land use patterns when planning green infrastructure [32]. Multi-Criteria Decision Analysis (MCDA) has also been utilized to prioritize potential green space sites based on environmental, economic, and social factors [1].
This study aligns with these methodologies by incorporating environmental variables such as rainfall, soil type, and geological features into a GIS-based assessment of park site suitability in Al-Sarih. These variables play a crucial role in determining the viability and sustainability of green spaces. The analysis revealed that most of Al-Sarih’s parks are located in areas with favorable characteristics—such as sand-dominated geology, fertile soils, and moderate rainfall (350–400 mm). A total area of approximately 7.8 km2 was identified for the development of new parks in Al-Sarih, with five new park sites proposed across the region. Once implemented, these additions are expected to significantly enhance accessibility to green spaces, raising the percentage of the population living within 500 m of a park—whether existing or proposed—to around 72%. This improvement reflects a strategic effort to promote the equitable distribution of green spaces and improve residents’ quality of life. Research has highlighted that residents in high-density or lower socioeconomic areas often have reduced access to urban green spaces [9]. Equity and accessibility mapping can help identify underserved areas and guide the strategic placement of parks to meet the needs of all urban residents. The findings of this study support this approach, as most existing parks in Al-Sarih fall within a 500 m buffer, ensuring reasonable access for nearby communities. Moreover, NbSs offer an innovative and holistic approach to achieving urban sustainability. By leveraging natural processes and ecosystem benefits, these strategies address critical challenges such as climate change, water management, and biodiversity conservation. Studies [18,33] emphasized the value of integrating ecosystem services into the design of green spaces. For example, NbS techniques such as tree planting, green roofs, and water retention systems can mitigate urban heat island effects, enhance biodiversity, and promote social well-being. While opportunities exist to enhance green space distribution—especially in underserved southern and western sectors—the findings indicate that the municipality’s proposed park locations are environmentally suitable. NbS implementation can also help Al-Sarih address pressing environmental issues such as urban heat islands and water scarcity. Previous research has shown that urban greenery can reduce temperatures through evapotranspiration and shading [8].
This study highlights the necessity of integrating GIS and NbS methodologies in urban planning to optimize green space allocation. By considering environmental, social, and ecological factors within a comprehensive planning framework, cities can maximize the benefits of green infrastructure. These findings contribute to the growing body of literature on sustainable urban planning and offer a model for other Jordanian and global cities to enhance their green space strategies. This study serves as a foundation for future park planning and highlights both the strengths and weaknesses of current green space distribution. While the municipal land use plan aligns well with environmental considerations, it must address disparities in distribution, especially in the southern and western zones. Incorporating geological, soil, and rainfall data into green space suitability assessments offers valuable guidance to urban planners and policymakers. A data-driven approach ensures parks are socially accessible and environmentally sustainable. The findings affirm that spatial analysis can facilitate equitable and resilient urban development, reinforcing the importance of GIS in planning. In developing regions, limitations such as low-resolution satellite imagery and data gaps are more common than in developed countries, which often utilize high-resolution datasets (Figure 9).
This study presents a summarized conceptual framework (Figure 10) illustrating the relationships between input variables, GIS processing steps, and analytical outputs. Input factors include soil, rainfall, and geology. GIS processing involved raster conversion, weighted overlay analysis, and evaluation of park distribution, suitability, and accessibility. This structured methodology supports the production of mapping outputs for identifying ideal green space locations and provides actionable guidance for urban planners to enhance the spatial distribution of parks. It ensures a comprehensive evaluation of natural factors and their spatial relationships while leveraging GIS as a powerful planning tool.
Together, the findings support the framework depicted in Figure 10 and Figure 11 and underscore its practical implementation. Future work will include demographic layers such as population density and accessibility analysis using GIS buffers to improve equity in green space distribution.

4. Conclusions

This study confirms that key NbSs, including rainfall, geology, and soil type, are critical for selecting suitable sites for urban green spaces. The application of GIS proved to be a powerful tool in enhancing stakeholder awareness and providing a scientific basis for sustainable urban planning. To effectively formulate and implement local policies, decision makers must understand and adopt NbS strategies. This research presents a robust methodology for applying spatial analysis to site selection, offering a replicable model for other regions. Despite its potential, there were difficulties in combining GIS with NbS, especially in monitoring outcomes, simulating ecological services, and facilitating spatial planning. These obstacles can be overcome by enhancing access to open spatial datasets, developing methods to manage low-resolution data, and using technologies like drones, IoT, and advanced remote sensing to enable real-time management. Providing communities and local governments with easy-to-use GIS tools and appropriate training will further support regional nature-based service initiatives while maintaining contextual relevance. By addressing these limitations and through GIS capabilities, the regional implementation of NbS can be significantly improved. Future research should focus on developing integrated Decision Support Systems (DSSs) that combine GIS with other analytical tools, offering planners a unified platform for planning, executing, and monitoring NbS. These systems should also include advanced visualization and scenario analysis tools to facilitate stakeholder engagement and informed decision making. Urban planning requires the integration of natural factors, and NbS provides a reliable foundation for effective land use decisions. It is time to establish a formal framework that incorporates NbS into planning practices. As decision makers seek to achieve sustainable development, GIS remains an important tool for enhancing environmental sensitivity, understanding land allocation trade-offs, and improving the overall urban environment.

Author Contributions

Conceptualization, A.M.B. and M.M.E.; methodology, A.M.B.; software, M.M.E.; validation, A.M.B., M.M.E. and A.E.L.; formal analysis, A.M.B.; investigation, M.M.E.; resources, A.E.L.; data curation, A.M.B.; writing—original draft preparation, A.M.B. and A.E.L.; writing—review and editing, M.M.E.; visualization, A.M.B.; supervision, A.M.B.; project administration, M.M.E.; funding acquisition, M.M.E. All authors have read and agreed to the published version of the manuscript.

Funding

This research received no external funding.

Institutional Review Board Statement

Not applicable.

Informed Consent Statement

Not applicable.

Data Availability Statement

Data are available on request from the authors.

Conflicts of Interest

The authors declare no conflicts of interest.

References

  1. Wang, D.; Xu, P.Y.; An, B.W.; Guo, Q.P. Urban green infrastructure: Bridging biodiversity conservation and sustainable urban development through adaptive management approach. Front. Ecol. Evol. 2024, 12, 1440477. [Google Scholar] [CrossRef]
  2. Jezzini, Y.; Assaf, G.; Assaad, R.H. Models and methods for quantifying the environmental, economic, and social benefits and challenges of green infrastructure: A critical review. Sustainability 2023, 15, 7544. [Google Scholar] [CrossRef]
  3. Verheij, J.; Ay, D.; Gerber, J.D.; Nahrath, S. Ensuring public access to green spaces in urban densification: The role of planning and property rights. Plan. Theory Pract. 2023, 24, 342–365. [Google Scholar] [CrossRef]
  4. Neema, M. Nigar, and Akira Ohgai. Multitype Green-Space Modeling for Urban Planning Using GA and GIS. Environ. Plan. B Plan. Des. 2013, 40, 447–473. [Google Scholar] [CrossRef]
  5. Mukhopadhyay, A.; Jana, S.K.; Hati, J.P.; Acharyya, R.; Pal, I. Sustainable Development through Geospatial Multi-Criteria Decision-Making (MCDM): A Comprehensive Analysis. In Artificial Intelligence, Geographic Information Systems, and Multi-Criteria Decision-Making for Improving Sustainable Development, 1st ed.; Auerbach Publications: Florida, FL, USA, 2025; pp. 18–38. [Google Scholar]
  6. Gontte, A.T. Review on potential urban development site selection using geospatial-based multi-criteria decision analysis (MCDA) techniques in the context of Ethiopia. Sci. Front. 2024, 5, 102–109. [Google Scholar] [CrossRef]
  7. Mecca, B. Assessing the sustainable development: A review of multi-criteria decision analysis for urban and architectural sustainability. J. Multi-Criteria Decis. Anal. 2023, 30, 203–218. [Google Scholar] [CrossRef]
  8. Castelli, K.R.; Silva, A.M.; Dunning, J., Jr. Improving the biodiversity in urban green spaces: A nature based approach. Ecol. Eng. 2021, 173, 106398. [Google Scholar] [CrossRef]
  9. Kifayatullah, S.; Saqib, Z.; Khan, M.I.; Zaman-ul-Haq, M.; Kucher, D.E.; Ullah, S.; Tariq, A. Equitable urban green space planning for sustainable cities: A GIS-based analysis of spatial disparities and functional strategies. Sci. Rep. 2025, 15, 22686. [Google Scholar] [CrossRef]
  10. Heo, S.; Nori-Sarma, A.; Kim, S.; Lee, J.T.; Bell, M.L. Do persons with low socioeconomic status have less access to greenspace? Application of accessibility index to urban parks in Seoul, South Korea. Environ. Res. Lett. 2021, 16, 084027. [Google Scholar] [CrossRef]
  11. Chanchitpricha, C.; Fischer, T.B. The role of impact assessment in the development of urban green infrastructure: A review of EIA and SEA practices in Thailand. Impact Assess. Proj. Apprais. 2022, 40, 191–201. [Google Scholar] [CrossRef]
  12. Sundar, G.; Patchaiammal, P.; Venkateshwarulu, B.V.; Kumar, T.P.; Rajamannar, K.; Tripathi, R.K. Integrative remote sensing approaches using generative adversarial networks for urban heat island analysis and mitigation. Remote Sens. Earth Syst. Sci. 2024, 7, 681–698. [Google Scholar] [CrossRef]
  13. Nizam, A.M.K.; Noor, M.; Iqbal, Z. Surface urban heat island effects analysis in the most populated city in Thailand: Towards sustainable urban development. AUIQ Tech. Eng. Sci. 2025, 2, 4. [Google Scholar] [CrossRef]
  14. Frantzeskaki, N.; McPhearson, T.; Collier, M.J.; Kendal, D.; Bulkeley, H.; Dumitru, A.; Walsh, C.; Noble, K.; Van Wyk, E.; Ordóñez, C.; et al. Nature-Based Solutions for Urban Climate Change Adaptation: Linking Science, Policy, and Practice Communities for Evidence-Based Decision-Making. BioScience 2019, 69, 455–466. [Google Scholar] [CrossRef]
  15. Koutsovili, E.I.; Tzoraki, O.; Kalli, A.A.; Provatas, S.; Gaganis, P. Participatory approaches for planning nature-based solutions in flood vulnerable landscapes. Environ. Sci. Policy 2023, 140, 12–23. [Google Scholar] [CrossRef]
  16. Cohen-Shacham, E.; Andrade, A.; Karangwa, C.; Maginnis, S. Proposing the IUCN Global Standard for NbS as The Main Operational Framework to Implement UNEA Resolutions 5/5 on NbS for Supporting Sustainable Development. IUCN Information Paper. Available online: https://engage.iucn.org/system/files/2024-02/IUCN%20Information%20paper_IUCN%20Global%20Standard%20for%20Nature-based%20Solutions%20and%20UNEA%20Resolutions_1502024.pdf (accessed on 15 July 2025).
  17. Schwartz, C.; Klebl, F.; Ungaro, F.; Bellingrath-Kimura, S.D.; Piorr, A. Comparing participatory mapping and a spatial biophysical assessment of ecosystem service cold spots in agricultural landscapes. Ecol. Indic. 2022, 145, 109700. [Google Scholar] [CrossRef]
  18. Batuigas, K.; Petrovic, A. Enhancing Urban Flood Resilience: A Pilot Case Study of a GIS Suitability Mapping Framework for NBS Placement in Sweden. Available online: https://www.diva-portal.org/smash/record.jsf?pid=diva2%3A1879570 (accessed on 9 July 2025).
  19. Mubeen, A.; Ruangpan, L.; Vojinovic, Z.; Sánchez Torrez, A.; Plavšić, J. Planning and suitability assessment of large-scale nature-based solutions for flood-risk reduction. Water Resour. Manag. 2021, 35, 3063–3081. [Google Scholar] [CrossRef]
  20. Xie, Y.; Xie, B.; Wang, Z.; Gupta, R.K.; Baz, M.; AlZain, M.A.; Masud, M. Geological resource planning and environmental impact assessments based on GIS. Sustainability 2022, 14, 906. [Google Scholar] [CrossRef]
  21. Al-Bakri, J.T.; D’Urso, G.; Calera, A.; Abdalhaq, E.; Altarawneh, M.; Margane, A. Remote sensing for agricultural water management in Jordan. Remote Sens. 2022, 15, 235. [Google Scholar] [CrossRef]
  22. Al Hreisha, H. Azraq Oasis Restoration. PANORAMA Solutions for a Healthy Planet. Available online: https://panorama.solutions/en/solution/azraq-oasis-restoration (accessed on 10 July 2025).
  23. Attah, R.U.; Gil-Ozoudeh, I.; Garba, B.M.P.; Iwuanyanwu, O. Leveraging geographic information systems and data analytics for enhanced public sector decision-making and urban planning. Magna Sci. Adv. Res. Rev. 2024, 12, 152–163. [Google Scholar] [CrossRef]
  24. Simelton, E.; Carew-Reid, J.; Coulier, M.; Damen, B.; Howell, J.; Pottinger-Glass, C.; Van Der Meiren, M. NBS framework for agricultural landscapes. Front. Environ. Sci. 2021, 9, 678367. [Google Scholar] [CrossRef]
  25. Al-Addous, M.; Bdour, M.; Alnaief, M.; Rabaiah, S.; Schweimanns, N. Water resources in Jordan: A review of current challenges and future opportunities. Water 2023, 15, 3729. [Google Scholar] [CrossRef]
  26. Wilson, T.; Boyles, R.P.; DeCrappeo, N.; Drexler, J.Z.; Kroeger, K.D.; Loehman, R.A.; Pearce, J.M.; Waldrop, M.P.; Warwick, P.D.; Wein, A.M.; et al. U.S. Geological Survey Climate Science Plan—Future Research Directions (Circular 1526). U.S. Geological Survey. 2024. Available online: https://pubs.usgs.gov/publication/cir1526 (accessed on 14 July 2025).
  27. Qasim, M. Geospatial Technologies for Monitoring Carbon Sequestration and Assessing Nature-Based Solutions for Climate Change Mitigation. Master’s Thesis, Universidade NOVA de Lisboa, Lisbon, Portugal, March 2025. Available online: https://run.unl.pt/handle/10362/2259 (accessed on 23 July 2025).
  28. Speldrich, B.; Gerla, P.; Tschann, E. Characterizing groundwater interaction with lakes and wetlands using GIS modeling and natural water quality measurements. Water 2021, 13, 983. [Google Scholar] [CrossRef]
  29. Budzik, G.; Sylla, M.; Kowalczyk, T. Understanding urban cooling of blue–green infrastructure: A review of spatial data and sustainable planning optimization methods for mitigating urban heat islands. Sustainability 2025, 17, 142. [Google Scholar] [CrossRef]
  30. Wu, Z.; Hou, B.; Guo, X.; Ren, B.; Li, Z.; Wang, S.; Jiao, L. CCNR: Cross-regional context and noise regularization for SAR image segmentation. Int. J. Appl. Earth Obs. Geoinf. 2023, 121, 103363. [Google Scholar] [CrossRef]
  31. Malakar, K.D.; Roy, S.; Kumar, M. Practical approaches to GIS data analysis. In Geospatial Technologies in Coastal Ecologies Monitoring and Management; Springer: Cham, Switzerland, 2025; pp. 159–190. [Google Scholar] [CrossRef]
  32. Lourdes, K.T.; Hamel, P.; Gibbins, C.N.; Sanusi, R.; Azhar, B.; Lechner, A. Planning for green infrastructure using multiple urban ecosystem service models and multicriteria analysis. Landsc. Urban Plan. 2022, 226, 104500. [Google Scholar] [CrossRef]
  33. Puplampu, D.A.; Boafo, Y.A. Exploring the impacts of urban expansion on green spaces availability and delivery of ecosystem services in the Accra metropolis. Environ. Chall. 2021, 5, 100283. [Google Scholar] [CrossRef]
Figure 1. Location of the study area: (A) Jordanian governorates, (B) Al-Sarih District, and (C) planned Al-Sarih map.
Sustainability 17 08647 g001
Figure 2. Sites of park distribution in Al-Sarih district.
Sustainability 17 08647 g002
Figure 3. The spatial distribution of existing parks within the municipal land use map.
Sustainability 17 08647 g003
Figure 4. The spatial distribution of average rainfall rates at Al-Sarih region.
Sustainability 17 08647 g004
Figure 5. Land use map overlaying with the geological content.
Sustainability 17 08647 g005
Figure 6. Park location overlayed with soil map.
Sustainability 17 08647 g006
Figure 7. Park location related to weighted overlay map.
Sustainability 17 08647 g007
Figure 8. Flowchart of GIS methodology followed for Nature-based Solutions.
Sustainability 17 08647 g008
Figure 9. Final suggested locations of new parks.
Sustainability 17 08647 g009
Figure 10. Integrated NbS-GIS framework for sustainable urban green area site selection.
Sustainability 17 08647 g010
Figure 11. Framework for park location analysis.
Sustainability 17 08647 g011
Table 1. Data sources and descriptions.
DataAttributeSource
Remote sensing dataAlsarih 0.5 m air digital orthophoto mapRoyal Jordanian Geographic Centre
Land use dataAlsarih 1:10,000, using data including roads and settlementsRoyal Jordanian Geographic Centre
Green space distribution in Alsarih Alsarih 1:10,000 green space mapsRoyal Jordanian Geographic Centre
Climatic data2010–2020 (10-year average)Jordan Meteorological Department
StatisticsDemographic data, survey data, environmental dataJordan Meteorological Department
Table 2. Classification of urban green spaces.
Primary ClassificationSecondary ClassificationImplication
A: Park Green SpaceA1: Theme ParksA1: These have a specific content or form and include green recreational facilities such as children’s parks, zoos, botanical gardens, historic parks, scenic parks, amusement parks, etc.
A2: Street ParksA2: These are located outside of the urban road space, in a piece of green space that is relatively independent, and include small gardens and street plaza green spaces.
B: Attached Green SpaceB1: Attached Green SpaceB1: This includes street trees and other green belts, green residential areas, and other residential parks, institutes, organizations, military units, enterprise, and institution-owned green spaces.
C: Other Green SpaceC1: Scenic Forest LandsC1: These landscapes with a certain scenic value play a role in urban environments throughout the woodland landscape.
Table 3. Soil types.
GradeSoil Type
1Rolling limestone ridges and moderate hill slopes. Deep colluvial pockets in places.
2Gently undulating plains with deep colluvial/aeolian mantle.
3 Gently undulating plain with deep colluvial/aeolian mantle: significant weathering to cracking clays.
4Undulating plain with deep colluvial/aeolian weathering to cracking clays.
5Undulating plains: deep colluvial mantle weathering to cracking clays.
6Low limestone hillocks at edge of plain and pockets of deep colluvium.
Disclaimer/Publisher’s Note: The statements, opinions and data contained in all publications are solely those of the individual author(s) and contributor(s) and not of MDPI and/or the editor(s). MDPI and/or the editor(s) disclaim responsibility for any injury to people or property resulting from any ideas, methods, instructions or products referred to in the content.