1. Introduction
The transition towards a sustainable energy model has positioned solar photovoltaic (PV) power as a cornerstone of the climate strategy in many countries. In Europe, the Green Deal sets the ambitious target of reducing net greenhouse gas emissions by at least 55% by 2030 and achieving climate neutrality by 2050 [
1]. To achieve this, the deployment of renewable sources and the transformation of the energy system towards greater efficiency, resilience, and sustainability have been prioritized. Within this framework, solar PV has experienced consistent growth in recent years, both in installed capacity and electricity generation. According to Eurostat, in 2022, 23.1% of the European Union’s gross final energy consumption came from renewable sources, compared to just 8.3% two decades earlier [
2]. Among these, solar PV stands out for its modularity, fast deployment, and decreasing cost per installed watt. In Spain, growth has been particularly significant, both in large-scale solar farms and in self-consumption systems. In 2022 alone, more than 5300 MW of new PV capacity were installed, contributing to nearly 7000 GWh of electricity production in certain regions [
3]. This accelerated deployment generates increasing demand for spatially explicit, up-to-date, and scalable tools to monitor land use transformation, support decision-making, and foster sustainable land resource management.
The systematic detection of photovoltaic installations is essential in various fields: regulatory compliance, environmental impact assessment, cadastral updating, grid management, land use analysis, and the smart and efficient installation of solar panels [
4,
5,
6]. Accurate land mapping of PV infrastructures is also critical to assess land occupation trends, plan sustainable energy corridors, and anticipate potential land-use conflicts, especially in rural and peri-urban areas. However, traditional detection tools—based on orthophotos, administrative records, or field surveys—suffer from limitations in coverage, update frequency, and operational cost. In this context, satellite remote sensing emerges as a promising alternative, enabling automated, scalable, and accurate mapping of solar infrastructures.
Many recent studies have approached PV detection using very high-resolution (VHR) imagery acquired by satellites, aircraft, or Unmanned Aerial Vehicles (UAVs). These methods, usually based on semantic segmentation with convolutional neural networks (CNNs), deliver highly detailed results in urban and industrial environments. In studies such as [
7], high-resolution color satellite orthophotos with a spatial resolution of 0.3 m per pixel, provided by the US Geological Survey, were employed. The authors implemented a region-based object detection framework combined with a Support Vector Machine (SVM) classifier trained on candidate region features such as color, shape, and texture. Their system achieved a detection rate of 94%, correctly identifying 50 out of 53 PV installations with only 4 false positives, as evaluated through ROC analysis. However, this approach depends heavily on up-to-date RGB imagery of consistent quality and very high resolution, which restricts its scalability for large-scale or rural studies. Importantly, the method is object-based—focusing on detecting entire regions or objects—rather than operating at the pixel level. Relying exclusively on single-date RGB imagery can limit PV detection, as some modules may remain undetected due to strong sunlight reflections, which significantly alter their apparent spectral response compared to their typical signatures. In [
8], they introduce Deep Solar PV Rener, a detail-oriented deep learning network, to enhance PV segmentation from satellite imagery by addressing challenges like small PV areas. Their network incorporates Split-Attention Network, combines Dual-Attention Network with Atrous Spatial Pyramid Pooling, and integrates PointRend Network to refine PV boundary prediction achieving significant improvements reaching a F-Score of 90.91%.
More recently, multi-source fusion strategies have been explored to improve detection accuracy by leveraging both spatial detail and spectral richness. For instance, Wang et al. [
9] proposed FusionPV, a deep learning framework that jointly processes RGB orthophotos and Sentinel-2 imagery. Their results showed improved performance, especially in heterogeneous landscapes, but also revealed the need for precise spatial alignment and increased computational demand. Similarly, Zhao et al. [
10] introduced PV-Unet, a network specifically designed to extract PV arrays from RGB and multispectral images with different resolutions. While their method achieved strong results in urban settings, it relied on manually curated datasets and complex fusion schemes.
Compared to these works, our study takes a more modular approach by assessing each data source (orthophotos and Sentinel-2) independently over the same study area and parcel baseline. This design allows us to explicitly quantify their relative strengths, divergences, and complementarities. While our orthophoto-based results align with previous literature in terms of high precision in structured environments [
7,
10], we also report a significant rate of false positives due to visual similarities with hedgerow plantations or water bodies—an issue only briefly noted in earlier works. On the other hand, our Sentinel-2 model, trained on multitemporal spectral profiles, successfully detected solar installations absent from the orthophotos due to acquisition date, highlighting a key advantage over VHR-only methods. This reinforces findings from Wang et al. [
9] regarding the utility of temporal signals, even when spatial resolution is limited.
Sentinel-2, part of the European Copernicus program, offers multitemporal multispectral imagery with a revisit frequency of five days in Europe and spatial resolutions of 10 to 60 m. With 13 spectral bands covering visible, near-infrared (NIR), and short-wave infrared (SWIR) wavelengths, Sentinel-2 captures subtle spectral differences that can distinguish between land cover types. This makes it particularly suitable for identifying artificial surfaces, including rooftops and solar panels, especially in contexts where high-resolution data are unavailable or impractical.
Unlike orthophotos, which provide very high spatial resolution but typically only RGB information and limited temporal coverage [
11], Sentinel-2 imagery offers coarser spatial resolution but richer spectral information and frequent revisits [
12]. Orthophotos allow for detailed visual analysis and accurate shape delineation of objects, whereas Sentinel-2 enables multi-temporal, multispectral analysis, capturing spectral signatures that can help discriminate between materials and land cover types over time. This contrast makes the combined use of both data sources highly valuable for mapping solar infrastructure and understanding its spatial distribution over time, particularly in the context of sustainable land development and energy planning. In summary, our contribution is twofold: (i) we provide a structured comparison between two widely used data modalities in solar infrastructure mapping, and (ii) we empirically validate their performance on a real-world, parcel-level dataset—highlighting where each method reinforces or departs from existing literature. This comparative design supports decision-making in operational contexts where resource availability, update frequency, and spatial coverage differ.
Over the past few years, two main methodological paths have been explored in the literature for PV detection: (i) semantic segmentation of VHR imagery and (ii) pixel-wise classification using satellite multispectral data. While segmentation with deep CNNs like U-Net or DeepLab has proven effective in VHR datasets, it faces challenges of cost, availability, and generalization. In contrast, pixel-wise approaches offer better scalability and have shown promising results when using multispectral imagery with carefully selected features.
Some works, such as Zhang et al. [
13], applied a pixel-based Random Forest (RF) classifier with Landsat 8 imagery (30 m resolution) to map photovoltaic power plants across China. By generating autumn 2020 composites to minimize cloud interference and incorporating terrain constraints to filter unsuitable areas, the authors reported very high classification performance, achieving an overall accuracy (OA) above 95%.
Recent studies support the potential of Sentinel-2 for PV detection even without VHR or radar data. Zixuan et al. [
14] employed E-UNet for segmenting Sentinel-2 images, achieving 98.9% accuracy. Other studies have combined Sentinel-1 and Sentinel-2 with models such as YOLO [
15,
16] or Random Forest [
17] to detect large PV plants, leveraging textural and structural cues [
18], where their models achieved over 90% accuracy in detecting large-scale PV panels using Sentinel-1 synthetic aperture radar (SAR) images with YOLO techniques.
In parallel, other approaches have combined multispectral and radar sources, such as Sentinel-1 and Sentinel-2, to improve robustness by fusing optical and microwave information. Zhang et al. [
19], for instance, used a Random Forest classifier for mapping photovoltaic (PV) panels with multitemporal Sentinel-1 and Sentinel-2 data, reaching 94.3% accuracy in coastal China in 2021. Wang et al. [
20] integrated nighttime light data (VIIRS) to improve urban-rural discrimination, achieving 98.9% overall accuracy. Other pixel-wise studies [
21] have proposed an Enhanced PV Index (EPVI) based on Sentinel-2 imagery to improve the spectral discrimination of photovoltaic panels from surrounding land covers. By applying this index, the spatial distribution of China’s PV power stations in 2020 was mapped, achieving an overall accuracy of about 97.6%. These studies highlight the value of multitemporal and multisource data fusion for enhancing detection accuracy at regional scales. However, most rely on heterogeneous data sources—combining radar, multispectral, or nighttime imagery—or focus exclusively on large PV plants visible in coarse-resolution composites. In contrast, our study focuses solely on multitemporal Sentinel-2 imagery and applies the analysis at the individual parcel level, enabling fine-grained identification of both large and medium-scale installations over agricultural zones.
Spectral classification based solely on Sentinel-2 has proven to be a viable alternative when sufficient temporal resolution is available and the data is properly prepared. The key to these approaches lies in the multitemporal exploitation of spectral signatures, as photovoltaic installations exhibit specific and temporally stable reflective patterns that differ from those of vegetation or natural surfaces. While the EPVI approach [
21] and Random Forest models [
19] achieved high performance by designing custom spectral indices or combining features, they did not conduct a systematic comparison with VHR orthophoto-based methods. Moreover, they generally operate at the pixel or region level without using a parcel-based framework, which limits their application to cadastral or regulatory needs. Our methodology bridges this gap by combining a pixel-wise deep learning classifier trained with temporal profiles and applying it over 227,000 georeferenced parcels—offering direct applicability to land management and planning systems.
As summarized in
Table 1, although these works report promising accuracies, they differ substantially in terms of spatial resolution, input data requirements, and study contexts. Most are limited to urban or industrial areas, focus on large-scale solar plants, or depend on costly or auxiliary datasets. Therefore, their findings are not directly comparable to the approach proposed here, which uniquely explores the exclusive use of multitemporal Sentinel-2 imagery for parcel-level photovoltaic detection over extensive agricultural areas.
To address this gap, we propose a fully automated methodology based exclusively on multitemporal Sentinel-2 imagery, without requiring orthophotos, radar data, or additional external sources. We develop and validate a dense neural network trained on pixel-level multitemporal features over more than 227,000 georeferenced agricultural parcels, optimized with Grid Search techniques [
22]. As a reference, we compare our method with a segmentation-based approach using the pretrained “Solar PV Segmentation” model by Kleebauer et al. [
23], based on DeepLabV3 with ResNet101 and evaluated over RGB orthophotos with 25 cm resolution. The study focuses on Extremadura (Spain), a region of strategic importance for solar energy. In 2022, Extremadura accounted for 31% of new PV capacity installed in Spain (1467 MW), reaching a total of 5348 MW and producing 6953.8 GWh of PV electricity—68% of its total renewable generation [
3]. These figures make it an ideal testbed for validating solar detection methods under diverse landscape and installation conditions.
This study presents a direct comparison between two approaches for photovoltaic (PV) detection applied to the same set of agricultural parcels: high-resolution RGB orthophoto segmentation and pixel-wise multitemporal spectral classification using Sentinel-2 imagery. Despite its coarser 10 m spatial resolution, Sentinel-2 proves effective for PV detection by exploiting its multispectral bands and frequent five-day revisit cycle. Its multitemporal nature allows the identification of installations that may be missed in orthophotos due to acquisition timing and offers the possibility of tracking the construction and expansion of solar plants, supporting planning and management needs. Furthermore, the Sentinel-2–based workflow is fully automated and computationally efficient, in contrast to orthophoto-based methods, which demand more intensive computation and manual preprocessing. By explicitly comparing results from both methods—pixel-wise and object-based—on the same geographical and administrative base, this study contributes to ongoing research on multi-source PV detection, while reinforcing the practicality and scalability of Sentinel-2–based approaches when aligned with cadastral units.
The work is structured in different sections, where
Section 2 focuses exclusively on describing the data and algorithms used, without presenting numerical results or performance evaluations. The following sections are devoted to the results (
Section 3) and a detailed analysis of model behavior and limitations (
Section 4). The methodology is structured into four subsections. First, the study area and the reference datasets used for training and validation are described. Then, the segmentation procedure for rooftop solar panels from orthophotos is detailed. Next, the Sentinel-2 imagery and multitemporal preprocessing are introduced. Finally, the pixel-based spectral classification model is presented, including its structure, training process, and evaluation criteria.
2. Materials and Methods
This study proposes a system for the automated detection of photovoltaic installations based exclusively on multitemporal imagery from the Sentinel-2 satellite, using a pixel-level spectral classification model. The approach is designed to be practical, replicable, and scalable, without relying on orthophotos or other external data sources.
As a comparative baseline, a segmentation method based on high-resolution RGB aerial orthophotos was also implemented, using the Deepness plugin for QGIS [
24]. This plugin enables the application of deep learning models directly on georeferenced imagery. Specifically, the pre-trained Solar PV Segmentation model developed by Kleebauer et al. [
23] was used. This model is based on the DeepLabV3 architecture with a ResNet101 backbone and is specifically designed for rooftop solar panel detection. It achieves an F-score of 95.27%. This second approach serves as a reference baseline against which the performance of the proposed system is evaluated.
2.1. Study Area and Reference Data
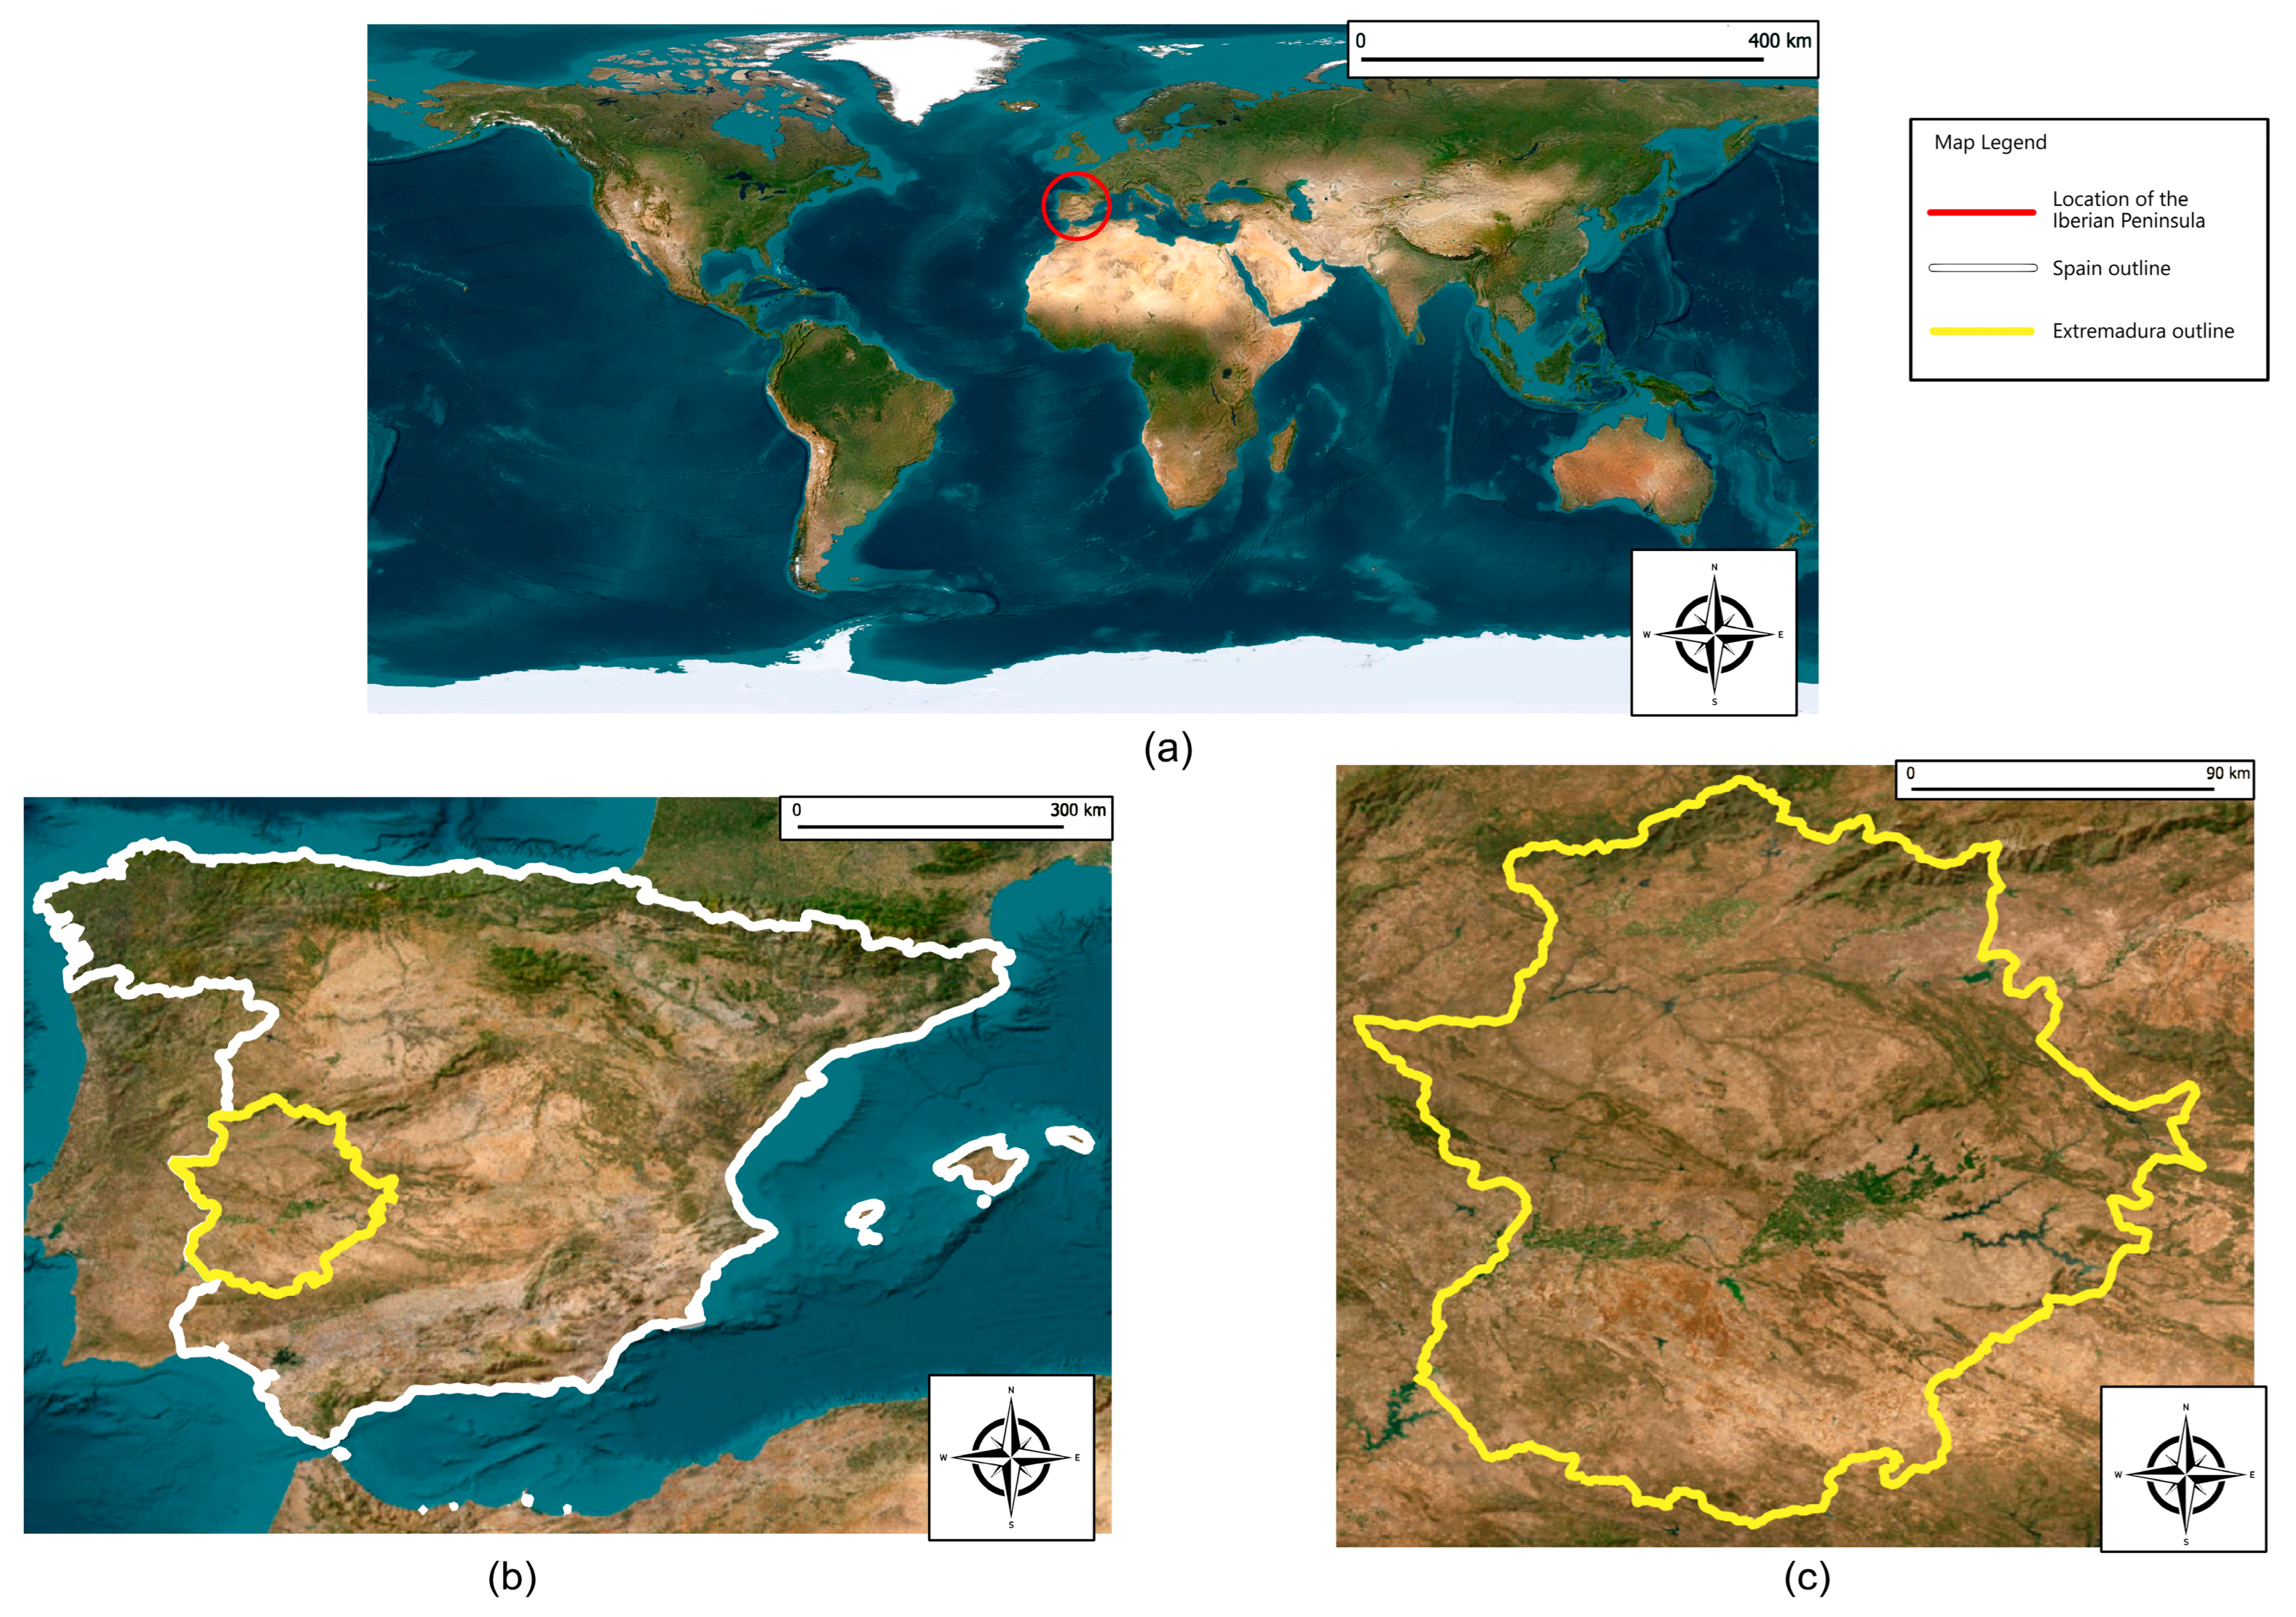
The study was conducted in the region of Extremadura, located in southwestern Spain (
Figure 1b). This predominantly rural region is characterized by vast agricultural and livestock areas, low population density, and high levels of solar radiation. These conditions make it a strategic area for the deployment of photovoltaic solar energy systems, both as ground-mounted solar farms and rooftop installations on industrial or agricultural buildings. Extremadura spans 41,635 km
2, has an average annual temperature of 17.9 °C, an average annual precipitation of 456 mm, and an average relative humidity of 59.08%. Elevation across the study area ranges from 150 to 1112 m above sea level. The central geographical coordinates of the study are approximately 38°40′0″ N, 6°10′0″ W (
Figure 1c).
Extremadura was selected as the study area both for its strategic role in Spain’s solar energy development and for the availability of reliable reference data provided by the regional government (“Junta de Extremadura”) through its technical departments. Data collection was carried out using the official geographic delimitations from the SIGPAC system (Spanish Land Parcel Identification System), ensuring accurate identification and classification of the analyzed parcels.
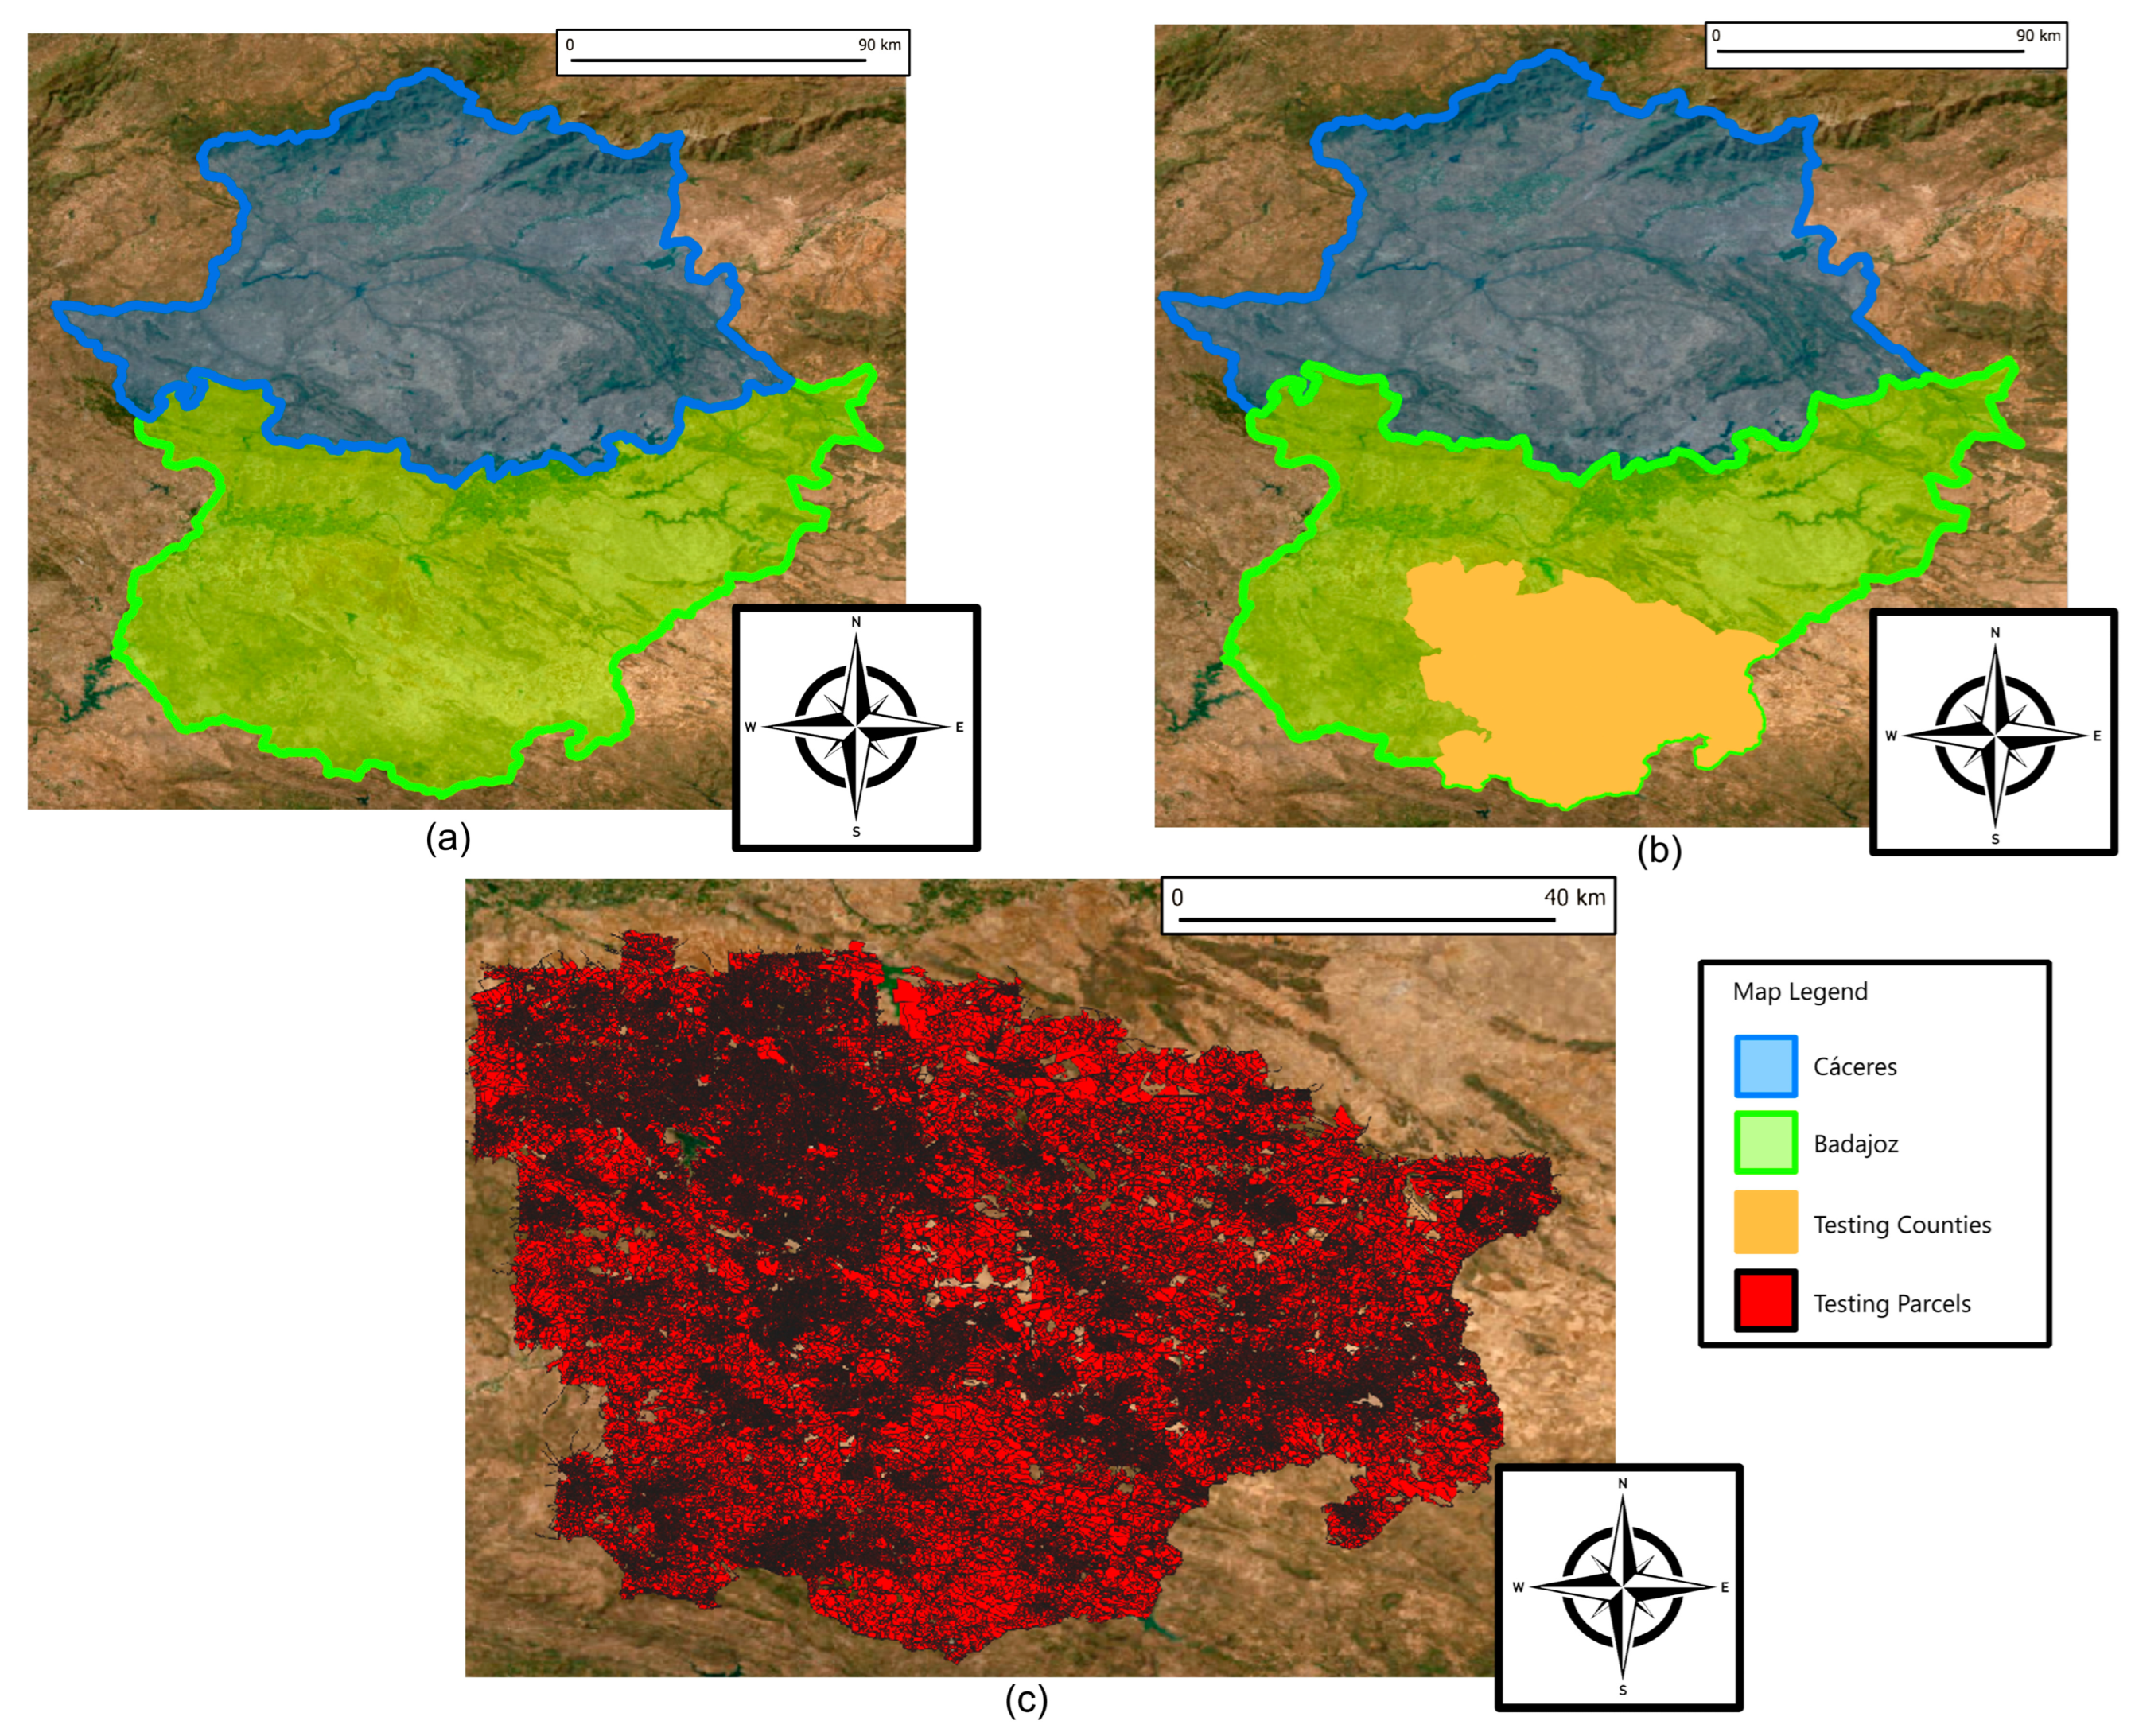
For the model training phase, parcels located in the Cáceres province of Extremadura were used (
Figure 2a). This area includes a total of 953,322 agricultural parcels over a surface of 19,868 km
2. Positive instances (i.e., parcels with visible solar panel installations) were validated by experts from the Junta de Extremadura through manual inspection of RGB orthophotos from the Spanish National Aerial Orthophotography Plan (PNOA). Only parcels showing clear visual evidence of photovoltaic structures were selected, resulting in 1150 positive parcels distributed across 113 municipalities. A balanced dataset was created by randomly selecting 1150 negative parcels (without any visual signs of solar installations) with similar land use characteristics.
For the testing and evaluation phase, an area of approximately 21,767 km
2 was used. Specifically, four counties in Extremadura were selected: Tierra de Barros, Zafra-Río Bodión, Campiña Sur, and Tentudía (
Figure 2b). These areas present notable geographic and socioeconomic diversity, enabling a robust assessment of model performance under varying conditions. In total, 227,121 parcels were analyzed during this phase, covering a combined area of 594,510.12 hectares (
Figure 2c). Importantly, this same set of parcels was used as the reference dataset for both methodological approaches (Sentinel-2 pixel-wise classification and orthophoto-based semantic segmentation), ensuring a fair and consistent basis for comparison despite the differences in model architectures. These parcels were automatically classified as either containing or not containing solar installations using the methods described in the following sections. The coordinates and geographic boundaries of the study parcels are available in the dataset at
https://doi.org/10.5281/zenodo.16261223 (accessed on 24 August 2025).
For image preprocessing, georeferencing, model training, and inference, a workstation was used equipped with Ubuntu 24.04.2 LTS operating system, an Intel Core i7-14700KF processor (20 cores, up to 5.6 GHz), an NVIDIA GeForce RTX 4070 Ti graphics card (12 GB), and 32 GB of DDR4 RAM. The software stack included Python 3.10 for implementing models and tools, and SNAP 11.0.1 for Sentinel-2 image processing.
2.2. Detection of Photovoltaic Installations Through Segmentation on Orthophotos
This section describes the procedure used for detecting photovoltaic installations from high-resolution aerial imagery. This approach is proposed as a comparative baseline against the method introduced in this work, which is based on multitemporal Sentinel-2 images.
The segmentation was performed using RGB orthophotos from the 2022 National Aerial Orthophotography Plan (PNOA), available for the autonomous community of Extremadura. This year was chosen as a reference because there are currently no more recent orthophotos available for the region.
Specifically, the segmentation was carried out using the pretrained “Solar PV Segmentation” model developed by Kleebauer et al. [
23], based on the DeepLabV3 architecture. This model has been specifically designed for detecting solar panels in high-resolution aerial images and has demonstrated a strong generalization capacity. According to the authors, it achieves an F1-score of 95.27% and an IoU of 91.04%, making it one of the most accurate and robust publicly available solutions for this task. Additionally, the DeepLabV3-based architecture is widely recognized for its effectiveness in segmenting objects with clearly defined edges [
25]. Due to this choice, the technical details of the segmentation process are relatively brief compared to those provided in
Section 2.3. The main focus here is on the preparation and preprocessing of the orthophotos for model input, as well as their adaptation to the specific characteristics of the study area. Rather than developing a model from scratch, this study adapts the existing pretrained model for use under comparable experimental conditions.
The photovoltaic installation detection process through segmentation involves the following sequential steps: (a) downloading high-resolution satellite images, (b) geospatial preprocessing including parcel clipping, (c) application of the “Solar PV Segmentation” model, specifically trained to identify morphological configurations and spectral patterns associated with PV installations, and (d) large-scale segmentation automation, which enabled this analysis to be conducted over a total of 227,122 parcels in the study area. The following subsections describe these subprocesses in detail.
2.2.1. High-Resolution Image Download
A total of 435 orthophotos from 2022 were used, captured on different days between June and July of that year, in GeoTIFF format with a spatial resolution of 0.25 m per pixel and approximate dimensions of 60,000 × 40,000 pixels each, resulting in a total volume of 923.7 GB. These images were downloaded from the website of the Spanish National Center for Geographic Information (CNIG) [
26].
To reduce processing volume and focus the analysis on a representative region, four counties within Extremadura were selected, as described in
Section 2.1. This reduced the dataset to 92 images, covering a total of 227,121 parcels and 594,510.12 hectares.
2.2.2. Parcel Clipping and Preprocessing
Once the study area was defined, it was necessary to ensure that the orthophotos were properly clipped and aligned with the 227,121 parcels contained in the region. To achieve this, the corresponding georeferenced graphical declarations were used, provided by the Junta de Extremadura in GeoJSON format, which precisely delineates the geometry of each parcel.
Based on these geometries, an automated process was developed to identify, for each parcel, the orthophotos that contained it either fully or partially. This is particularly important since a single parcel can span multiple images when located at their edges.
Once the images associated with each parcel were identified, the first step consisted of reprojecting them to match the spatial reference system used by the parcel geometry—either EPSG:25829 or EPSG:25830. This process was carried out using the OSgeo/GDAL library for Python. The result of each reprojection was saved as a temporary numbered TIFF file.
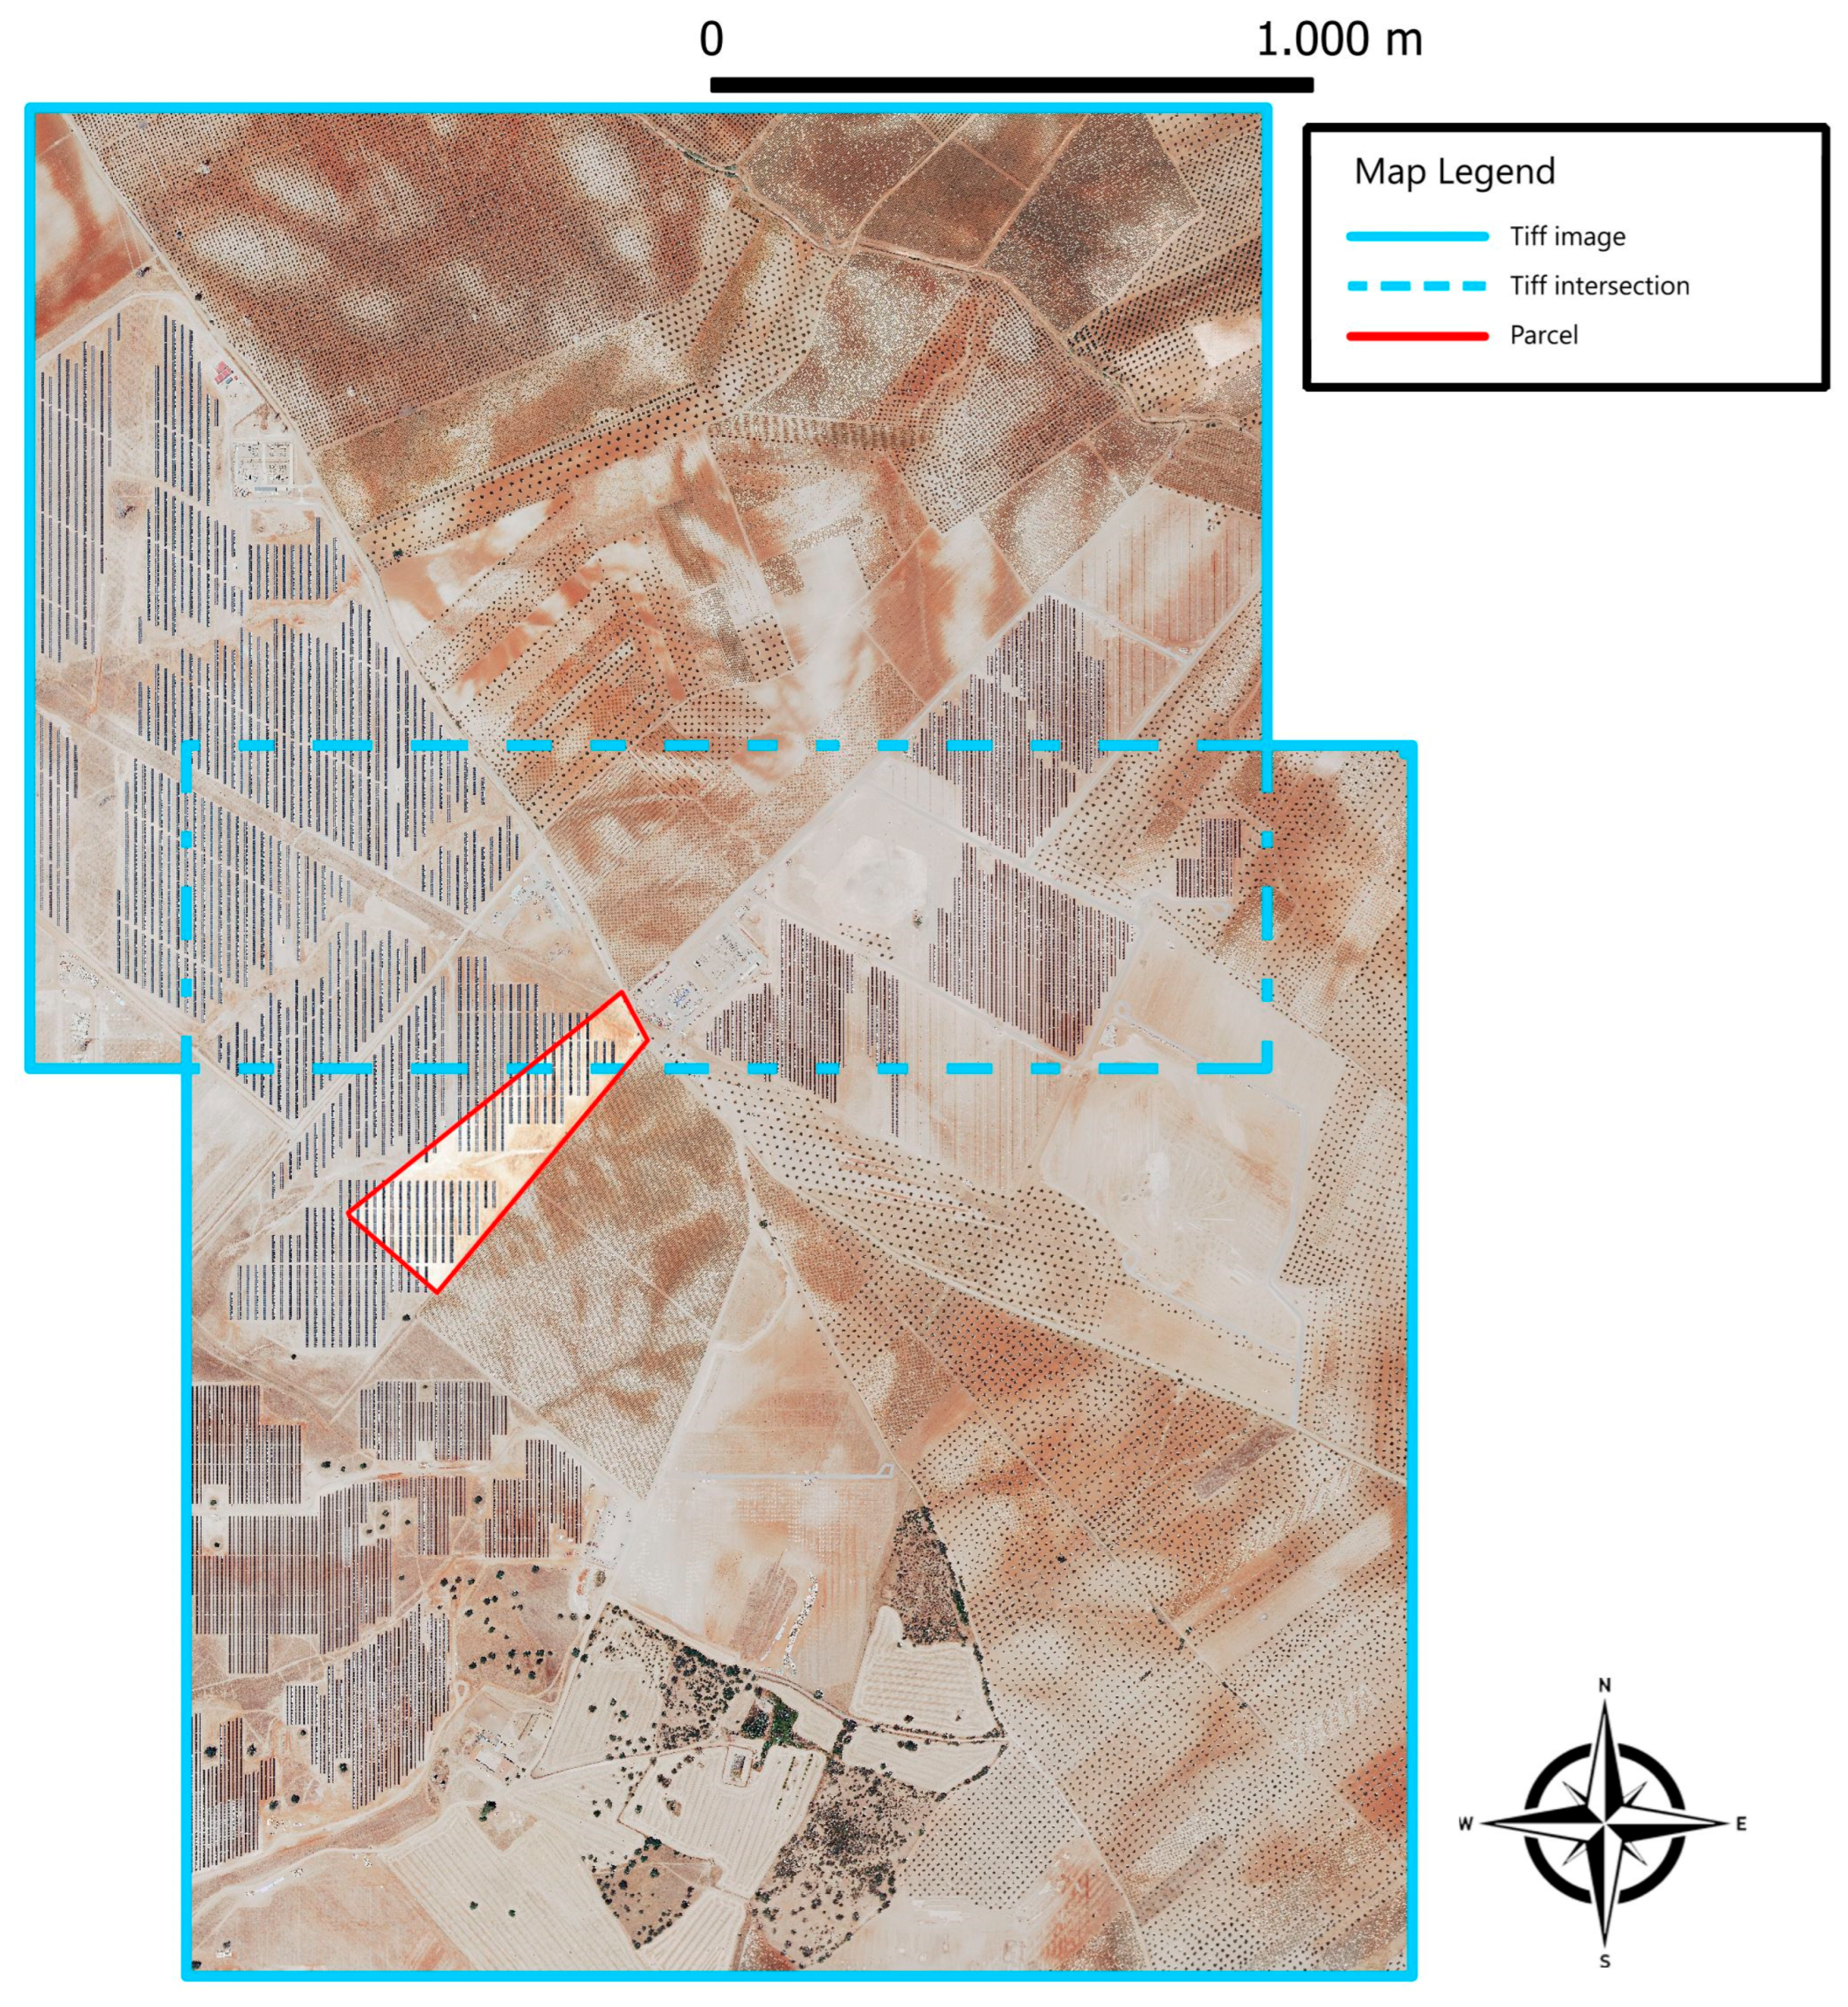
After ensuring that all images associated with a parcel were in the same coordinate system, they were merged into a single virtual mosaic, creating a VRT (Virtual Raster) file that serves as a logical representation of the combined images without physically duplicating the data. This VRT was then converted into a real disk image, producing a single GeoTIFF file that consolidated the necessary spatial information for further analysis of the parcel. An example of the result of this image fusion is shown in
Figure 3.
The next step involved the individualized geospatial clipping of each parcel from the fused image. To do this, it was first verified that both the image and the parcel geometry shared the same spatial reference system. If not, the parcel geometry was reprojected to the corresponding system (EPSG:25829 or EPSG:25830). This ensured perfect spatial alignment between the vector polygon and the raster image containing it.
Once both the image and the parcel geometry shared the same coordinate system, a rasterized mask was generated from the parcel polygon. This step is essential because it translates a vector geometry (composed of coordinates and vertices) into a discrete matrix structure that can be directly applied to orthophotos in pixel form. First, an in-memory vector layer was created using OGR, based on the reprojected parcel geometry. Then, that layer was converted into a binary mask in which the pixels inside the polygon perimeter were assigned a value of 1, and the rest a value of 0 (outside the clipping area). This rasterized matrix has the same resolution and dimensions as the original image, allowing it to be overlaid without alignment errors. The main reason for creating this raster mask is that orthophotos consist of pixel matrices, and clipping must occur at the pixel level. Since vector geometries do not naturally align with rows and columns, a rasterized mask acts as a bridge between both formats, enabling the clipping operation to be formulated as an efficient and precise matrix operation.
Once the mask was generated, it was applied to each spectral band of the original image (red, green, and blue) using filtering operations. In this process, only the pixel values corresponding to the interior of the parcel were retained, and exterior values were set to null or zero, ensuring a clean crop.
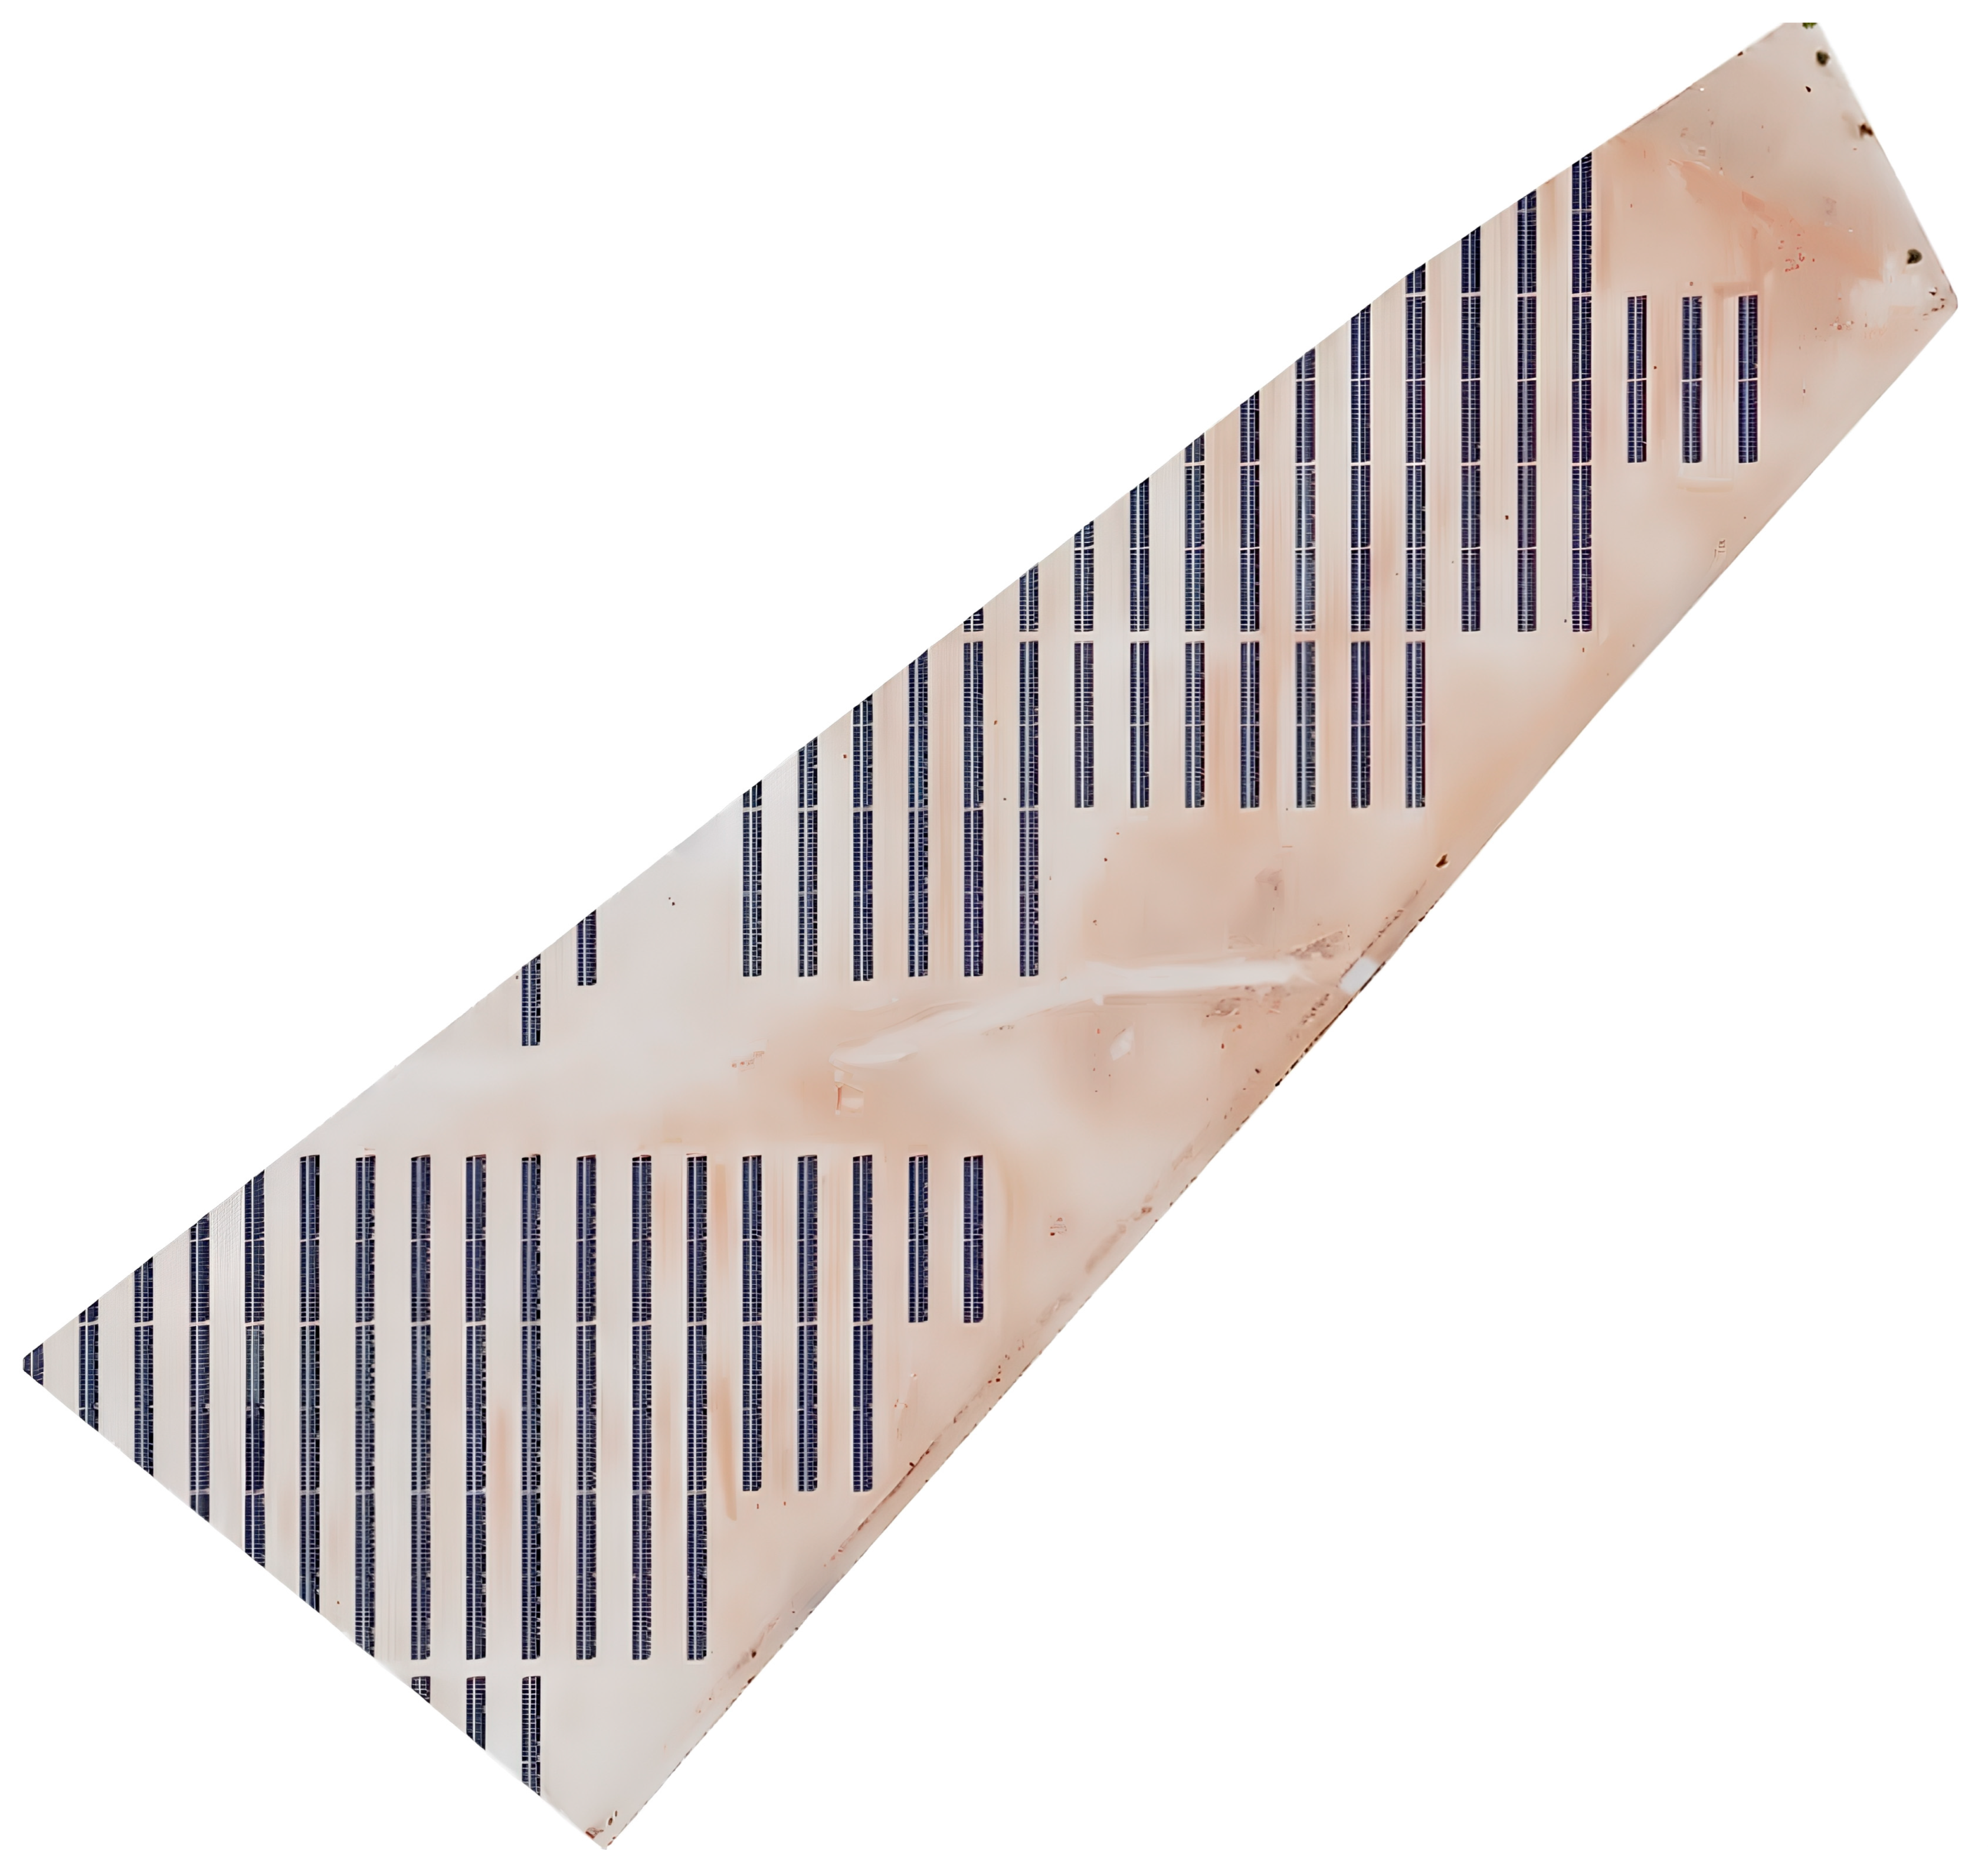
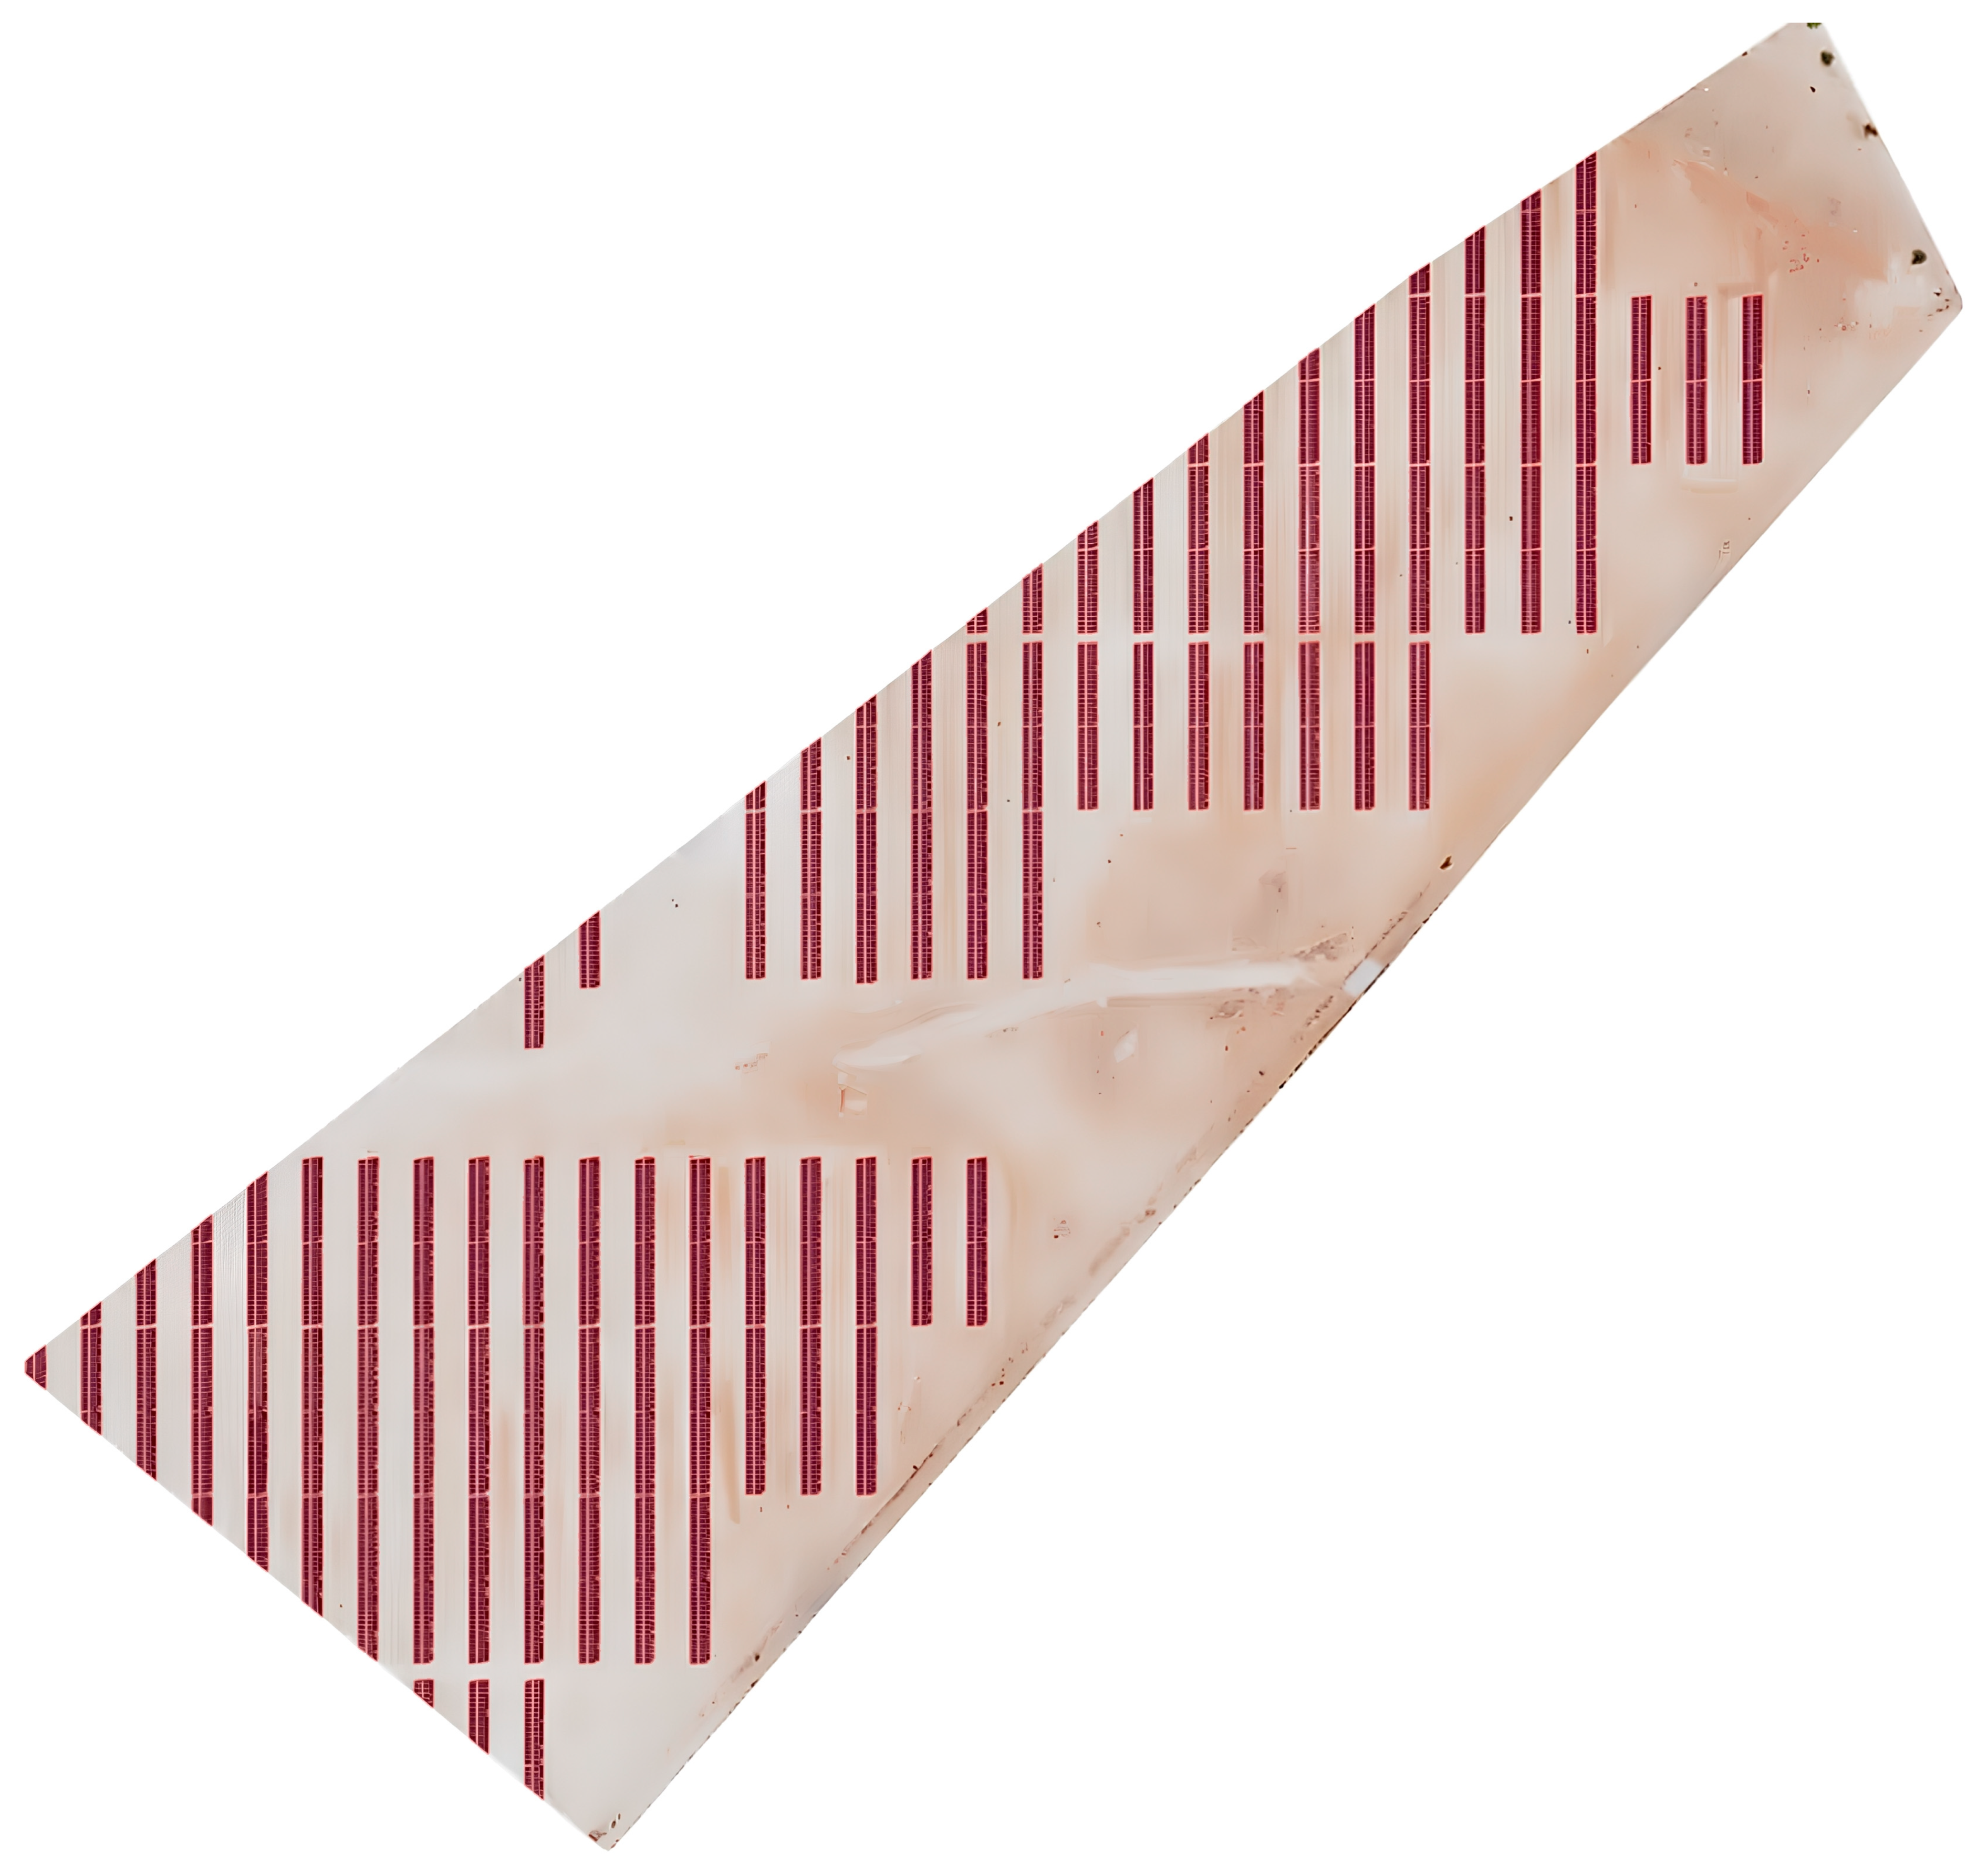
Finally, a new final image was reconstructed, the dimensions of which were adjusted to fit the cropped plot, thus ensuring correct georeferencing of the result, preserving both its spatial location and reference system. The final image resulting from a cropped plot is shown in
Figure 4.
2.2.3. Segmentation Using Deepness and the Solar PV Segmentation Model
This subsection describes the open-access model Solar PV Segmentation, used for the segmentation of photovoltaic installations in RGB orthophotos of previously processed parcels, as outlined in the preceding subsection. It also details the fine-tuning process carried out to adapt the model to the specific case study. To perform the segmentation and detection process with this model, the Deepness plugin for QGIS [
24] was used. This plugin specializes in semantic segmentation via deep learning and supports the integration of pretrained models.
Specifically, the pretrained “Solar PV Segmentation” model developed by Kleebauer et al. [
23] was used. It is based on the DeepLabV3 architecture with a ResNet101 backbone. This deep neural network architecture employs atrous (dilated) convolutions to capture context at multiple scales, enabling the detection of objects of various sizes with higher precision. It also incorporates an Atrous Spatial Pyramid Pooling (ASPP) mechanism, which improves segmentation by processing image features at multiple sampling rates before applying convolution.
The model was trained on a diverse dataset, including UAV data, aerial and satellite imagery, with resolutions ranging from 0.1 m to 3.2 m, as well as images from different countries such as France, Germany, and China. Its ability to handle multiple image sources and resolutions made it highly suitable for the present study, as the images used had a resolution of 0.25 m/pixel. The model demonstrated superior performance compared to those trained exclusively on a single-resolution image type, achieving an F1-score of 95.27% and an IoU of 91.04%. The training was performed on a system equipped with a NVIDIA Tesla A100-SXM4 GPU with 40 GB of VRAM and 512 GB of RAM.
This model was selected for several reasons: first, its excellent performance in key semantic segmentation metrics, and second, its availability as a pretrained model, which allows seamless integration into analysis workflows without the need for training from scratch. Additionally, its DeepLabV3-based architecture is widely recognized for its effectiveness in segmenting objects with well-defined edges, such as photovoltaic panels. These features make it especially well-suited for this study’s objective—direct comparison with pixel-by-pixel detection of solar panels using Sentinel-2 images—allowing technical efforts to focus on model fine-tuning and on designing a preprocessing pipeline to adapt RGB orthophotos to the model’s input requirements.
Although the model initially yielded good results, adjustments were necessary to adapt it to the study images and minimize false positives and negatives in solar panel detection. Specifically, three key tunable parameters were modified: segmentation resolution, confidence threshold, and small-segment filtering.
The segmentation resolution defines the granularity level for object detection; if too low, segmentation may be incomplete, whereas excessively high resolution may cause unnecessary fragmentation.
The confidence threshold controls the model’s sensitivity in classifying a segment as a solar panel; higher values reduce the likelihood of false positives but may exclude structures that should be correctly classified.
Lastly, small-segment removal filters out very small detections that might represent image noise, preventing misclassification of irrelevant elements like roads or dense vegetation.
After multiple tests and adjustments, the optimal values were set as follows: a segmentation resolution of 25 cm/pixel (aligned with the orthophoto resolution), a confidence threshold of 0.95, and a minimum segment size of 20 pixels. The use of a 0.95 confidence threshold minimized false positives by ensuring that only highly confident structures were selected, thereby reducing erroneous inclusion of elements like trees or water bodies. Meanwhile, the 20-pixel filtering threshold eliminated small, non-relevant areas unrelated to photovoltaic installations. An example of the segmentation and detection output is shown in
Figure 5.
2.2.4. Tiling and Automation
Once the parcel images had been processed and the model selected and fine-tuned, the large-scale automated detection of solar panels was carried out. The Solar PV Segmentation model requires inputs of 256 × 256 pixels, which necessitated adapting the parcel images to this size. Therefore, each image was divided into tiles of 256 × 256 pixels. This tiling process can lead to fragmentation of detected objects and loss of spatial continuity, especially in the case of large installations spanning multiple tiles. After the individual segmentation and detection of each tile, a final reconstruction was required for each parcel, involving the post-processed merging of all generated tiles.
All the aforementioned processing was performed using Python scripts and was completed after 874.4 h of computation. The total computation time of 874.4 h reflects the cumulative duration required to process more than 227,000 parcels, including image preprocessing, tiling into 256 × 256 patches, inference, post-processing, and PV detection. With parallelization on multiple machines or high-performance computing infrastructure, this runtime could be substantially reduced, underscoring the scalability of the proposed approach.
This segmentation and identification process led to the detection of a total of 101 parcels, covering an area of 4081.38 hectares that contained solar panels. Specifically, considering only the positively segmented zones, the total area of solar panels detected amounted to 1325.82 hectares. These results provide a detailed map of the distribution of photovoltaic infrastructures in the study region, ensuring high accuracy in the delineation of each installation.
2.3. Detection of Photovoltaic Panels Using Sentinel-2
This section presents in detail the methodology proposed in this study for the detection of photovoltaic installations, based on the use of multispectral images from the Sentinel-2 satellite. Unlike other approaches, such as the use of RGB orthophotos described in the previous section, this method leverages the multitemporal and spectral nature of Sentinel-2 data to address the problem from a more generalizable and automatable perspective. As this is the core methodological contribution of the work, the section is developed in greater depth, describing each stage of the process—from data collection and preprocessing to model training and parcel classification—through an applied analysis of 227,121 land parcels in the study region.
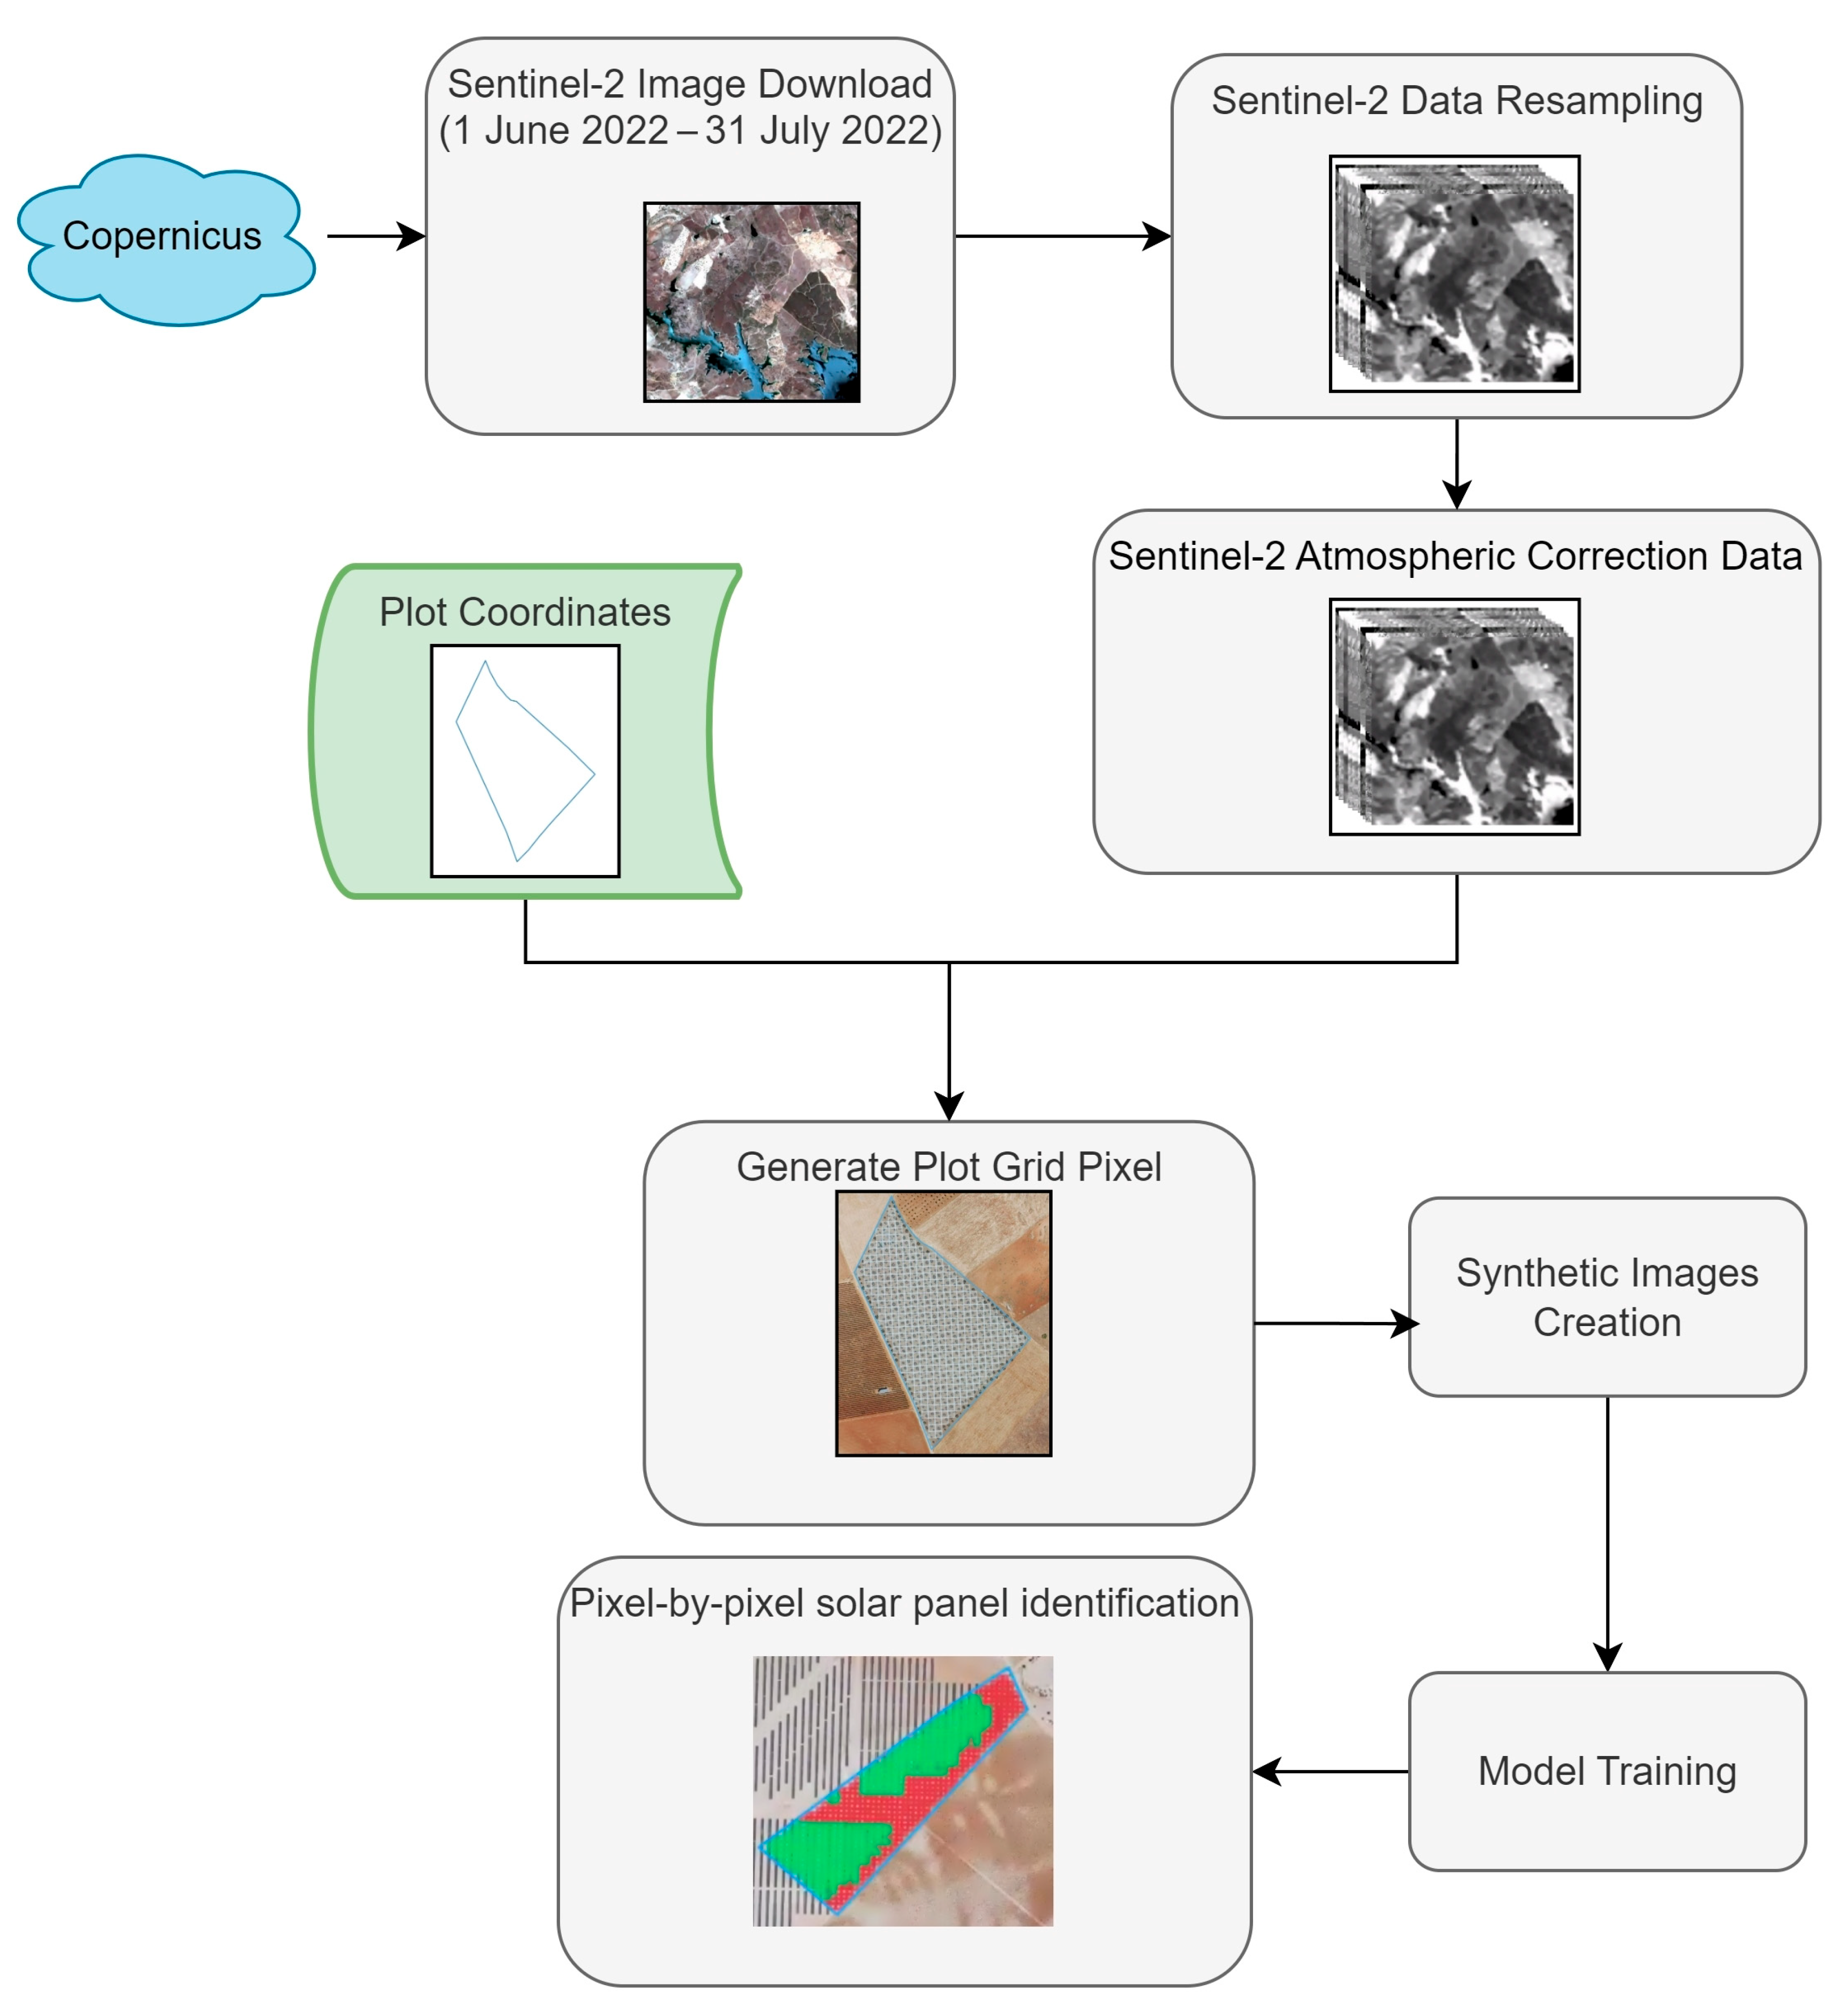
The workflow (summarized in
Figure 6) begins with the download and preprocessing of Sentinel-2 images corresponding to the period from 1 June to 31 July 2022, over the study area. Simultaneously, the geographic identification of the pixels associated with each of the study parcels is carried out. Once both processes are completed, synthetic images are generated, the model is trained, and finally, pixel-level identification of solar panels is performed on a large scale. These procedures are detailed in the following subsections.
2.3.1. Image Download and Processing
A total of 121 Sentinel-2 images were downloaded between 1 June and 1 July 2022. This period was used to match the acquisition timeframe of the orthophotos, which are collected over multiple dates. This approach ensures temporal consistency between datasets and allows the detection algorithm to leverage spectral information from several time points, improving robustness and comparability with high-resolution aerial imagery. These images were retrieved using the official Copernicus API based on OData (Open Data Protocol), a standard approved by both ISO/IEC and OASIS, which provides a RESTful HTTPS-based API [
27].
Since the proposed method requires multiple images to analyze the temporal evolution of each pixel, using full-sized original Sentinel-2 images could lead to RAM overload and internal storage issues. Therefore, memory optimization became a priority. To address this, once the original images were downloaded, they were segmented into more manageable areas, reducing their size from 110 × 110 km to 5 × 5 km (5000 × 5000 m) tiles. This segmentation used the same coordinate reference system as Sentinel-2 (SRC), EPSG:32630, corresponding to WGS 84/UTM Zones 30N and 29N. Taking this division into account, a total of 331 zones were analyzed (
Figure 7).
For the automated and large-scale image clipping process, we used the Python interface of SNAP (available at
https://step.esa.int/main/download/snap-download/ accessed 17 July 2025), known as esa_snappy. After collecting and clipping the images, data from each spectral band were extracted, rescaled to a 10 m resolution, and normalized within a range of 0 to 1 to avoid anomalies in the original values. Subsequently, anomalous values were removed using ESA-provided cloud, water, and shadow detection models, complemented with our own outlier detection algorithms and interpolation techniques [
28], enabling both anomaly filtering and smoothing of the data distribution.
The spatial boundaries of each parcel were defined using georeferenced polygons provided by administrative databases and the GIS system of the Junta de Extremadura. These polygons were used to map Sentinel-2 image pixels to the corresponding interior pixels of each parcel. However, since parcel boundaries may include pixels that partially fall outside the defined area, those pixels were excluded from the analysis to prevent spectral information from neighboring areas from contaminating the results.
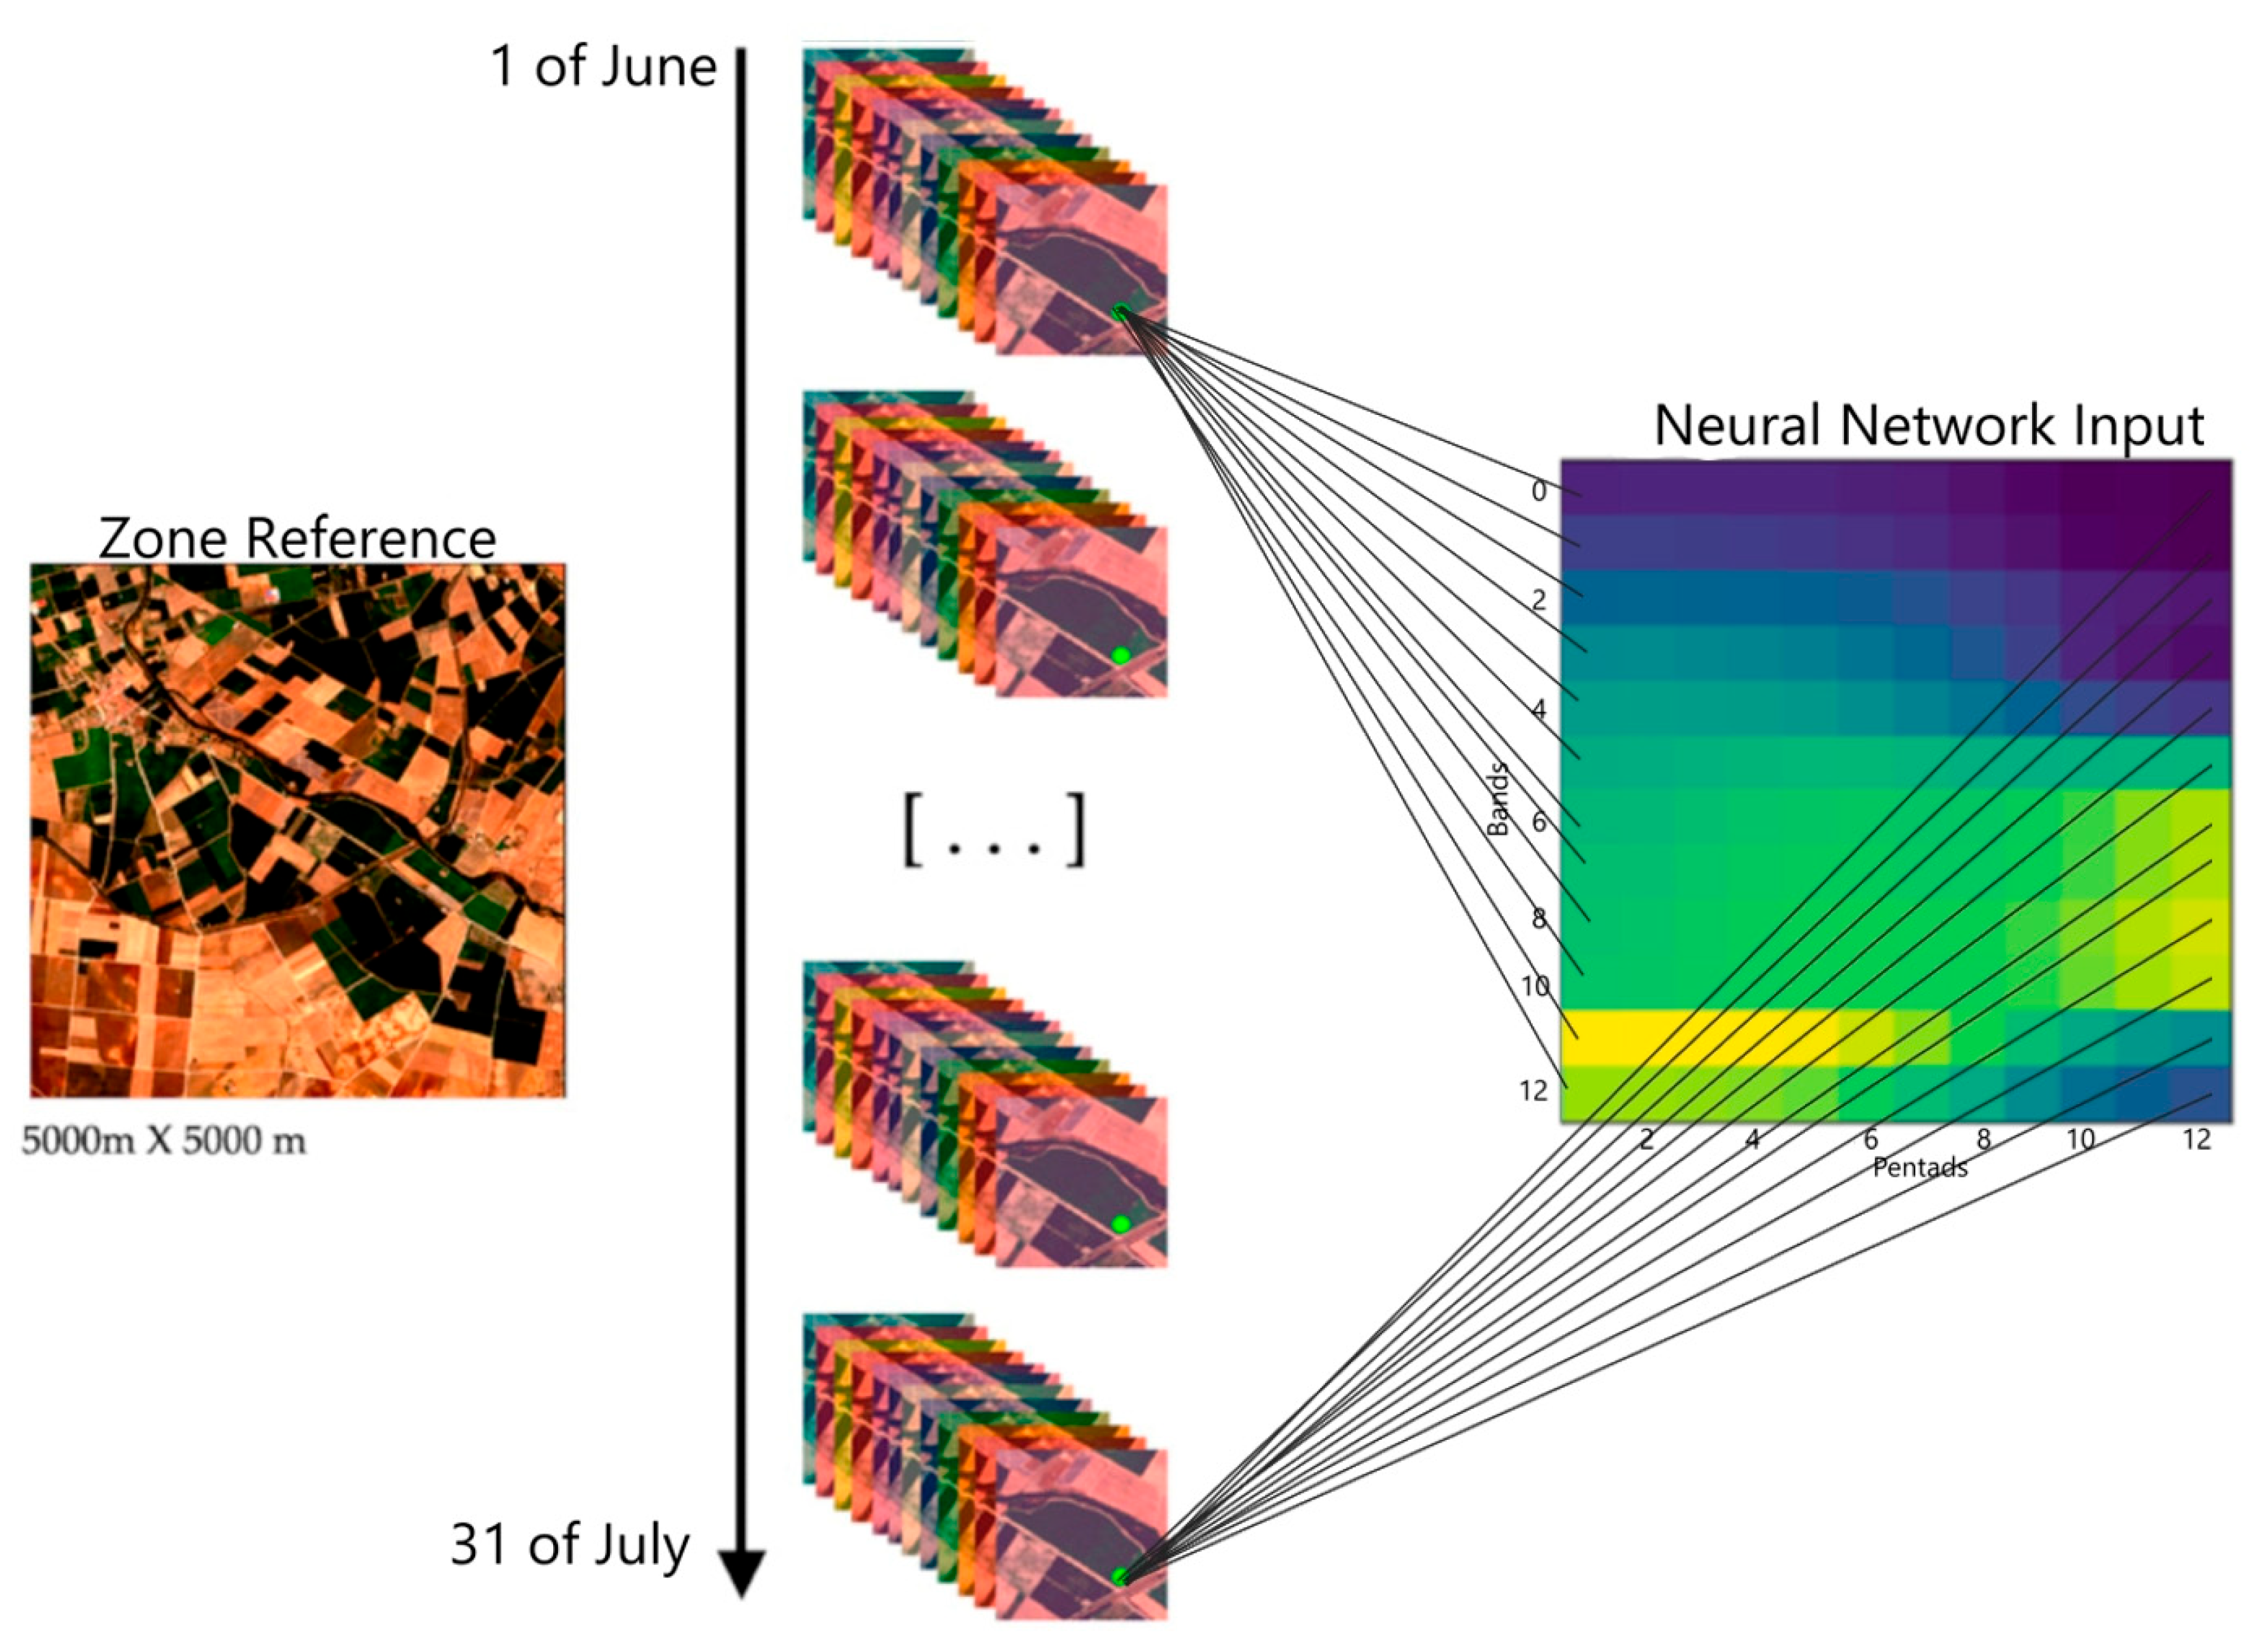
Once the pixels corresponding to each parcel were extracted and stored in the database, we prepared the input data for the training model. To this end, synthetic images were generated for each of the 331 study zones, following the methodology proposed in [
29]. These synthetic images integrate the multispectral information from all 12 Sentinel-2 bands corresponding to the selected dates (1 June to 31 July 2022, 12 pentads, 5-day intervals) and are organized in a format directly interpretable by the neural network. For each pixel, spectral data from multiple acquisition dates were combined into a matrix capturing both spectral and temporal information. This two-dimensional representation (
Figure 8), where one dimension represents the temporal sequence and the other represents the spectral bands, reduces the complexity of the original data and enhances the network’s ability to distinguish between classes during training and detection. Each pixel’s temporal evolution across the period is, thus, explicitly encoded and leveraged in the classification process. The resulting images formed the dataset used for the training, validation, and testing phases of the model, as well as for its direct application during the operational deployment of the automatic photovoltaic installation detection system. The entire process, from image download to the generation of synthetic images, took a total of 96.1 h.
2.3.2. Neural Network Training and Hyperparameter Tuning
To evaluate the performance of the solar panel detection model, the dataset was divided into two subsets: 70% for training and 30% for validation. This ratio is widely used in machine learning as it allows the model to learn general patterns from the training set, while the validation set is used to tune hyperparameters and prevent overfitting. Finally, a test set is used to assess the model’s final performance on unseen data. This strategy is based on previous deep learning optimization studies, such as those presented in [
30,
31].
The solar panel detection model was implemented using the Keras library with TensorFlow in the Python programming language. A sequential dense neural network was trained using pixels from 227,121 parcels as inputs, with positive examples corresponding to solar panels and negative examples including vegetation, buildings, and water bodies. Hyperparameters were optimized via a grid search [
18] over the study period (1 June–31 July 2022) to ensure temporal consistency with the orthophotos.
Table 2 presents the 10 best-performing models obtained after testing 73 combinations through the grid search procedure, where the architecture parameters (number of neurons per layer), batch size, and learning rate were varied. The selected models are ranked by their F-score, a metric that combines precision and recall into a single measure, offering a balanced and robust evaluation of the model’s performance in classification tasks. The full list of the 73 evaluated models is included in
Appendix A,
Table A1.
The best-performing model, with two hidden layers of 64 and 32 neurons, a batch size of 128, and a learning rate of 0.0005, achieved an F-score of 0.9794, precision of 0.9922, recall of 0.9669, overall accuracy of 0.9822, and a low error rate (1.56% false negatives, 0.25% false positives). This model was selected for its reliability and robustness for large-scale, pixel-wise detection of photovoltaic installations.
Using this model—hereafter referred to as the optimal model—a pixel-by-pixel prediction was carried out over the 227,121 agricultural plots (an example is shown in
Figure 9), with a total area of 594,510.12 hectares. When processing the Sentinel-2 pixels (10 m × 10 m), the total area analyzed amounted to 494,073.12 hectares. This difference is due to the exclusion of pixels that were not entirely within the geometric boundaries of each plot, thereby ensuring that only spectral data from within each parcel were analyzed. As a result, plots that were too small (e.g., 0.01 ha) or had irregular shapes in which no full pixels could fit were discarded from the analysis.
The detection results using the optimal model identified 97 plots containing solar panels, covering a total of 3577.95 hectares. Considering only those pixels classified as photovoltaic panels, the actual area of solar panels amounted to 1366.59 hectares. The time required for parcel-level identification was 75.2 h. When adding the total time spent from image download to identification, the overall processing time was 171.4 h.
3. Results and Discussion
This study addressed the detection of photovoltaic infrastructures using two distinct methodological approaches: semantic segmentation on high-resolution RGB orthophotos, and pixel-wise spectral classification based on multitemporal Sentinel-2 imagery. Both methods were applied over the same study area, allowing for a direct quantitative and qualitative comparison of the results. The full analysis of both segmentation results and pixel-wise classification is available in the dataset:
https://doi.org/10.5281/zenodo.16261507 (accessed on 24 September 2025).
3.1. Comparative Analysis of Detection Performance
The pretrained “Solar PV Segmentation” model [
23] achieved an F1-score of 95.27% and an IoU of 91.04% across orthophotos (
Section 2.2). For pixel-wise classification (
Section 2.3), the best-performing neural network reached a precision of 0.9922, a recall of 0.9669, an overall accuracy of 0.9822, and a loss of 0.0420. Importantly, the selection also considered misclassification rates: this model achieved the lowest false negative rate (1.56%) and false positive rate (0.25%), ensuring robust detection while minimizing both overlooked photovoltaic plots and incorrect identifications.
Orthophoto segmentation identified 101 parcels totaling 4081.38 hectares (1325.82 hectares effectively covered by PV), whereas Sentinel-2 classification detected 97 parcels covering 3577.95 hectares (1366.59 hectares of PV).
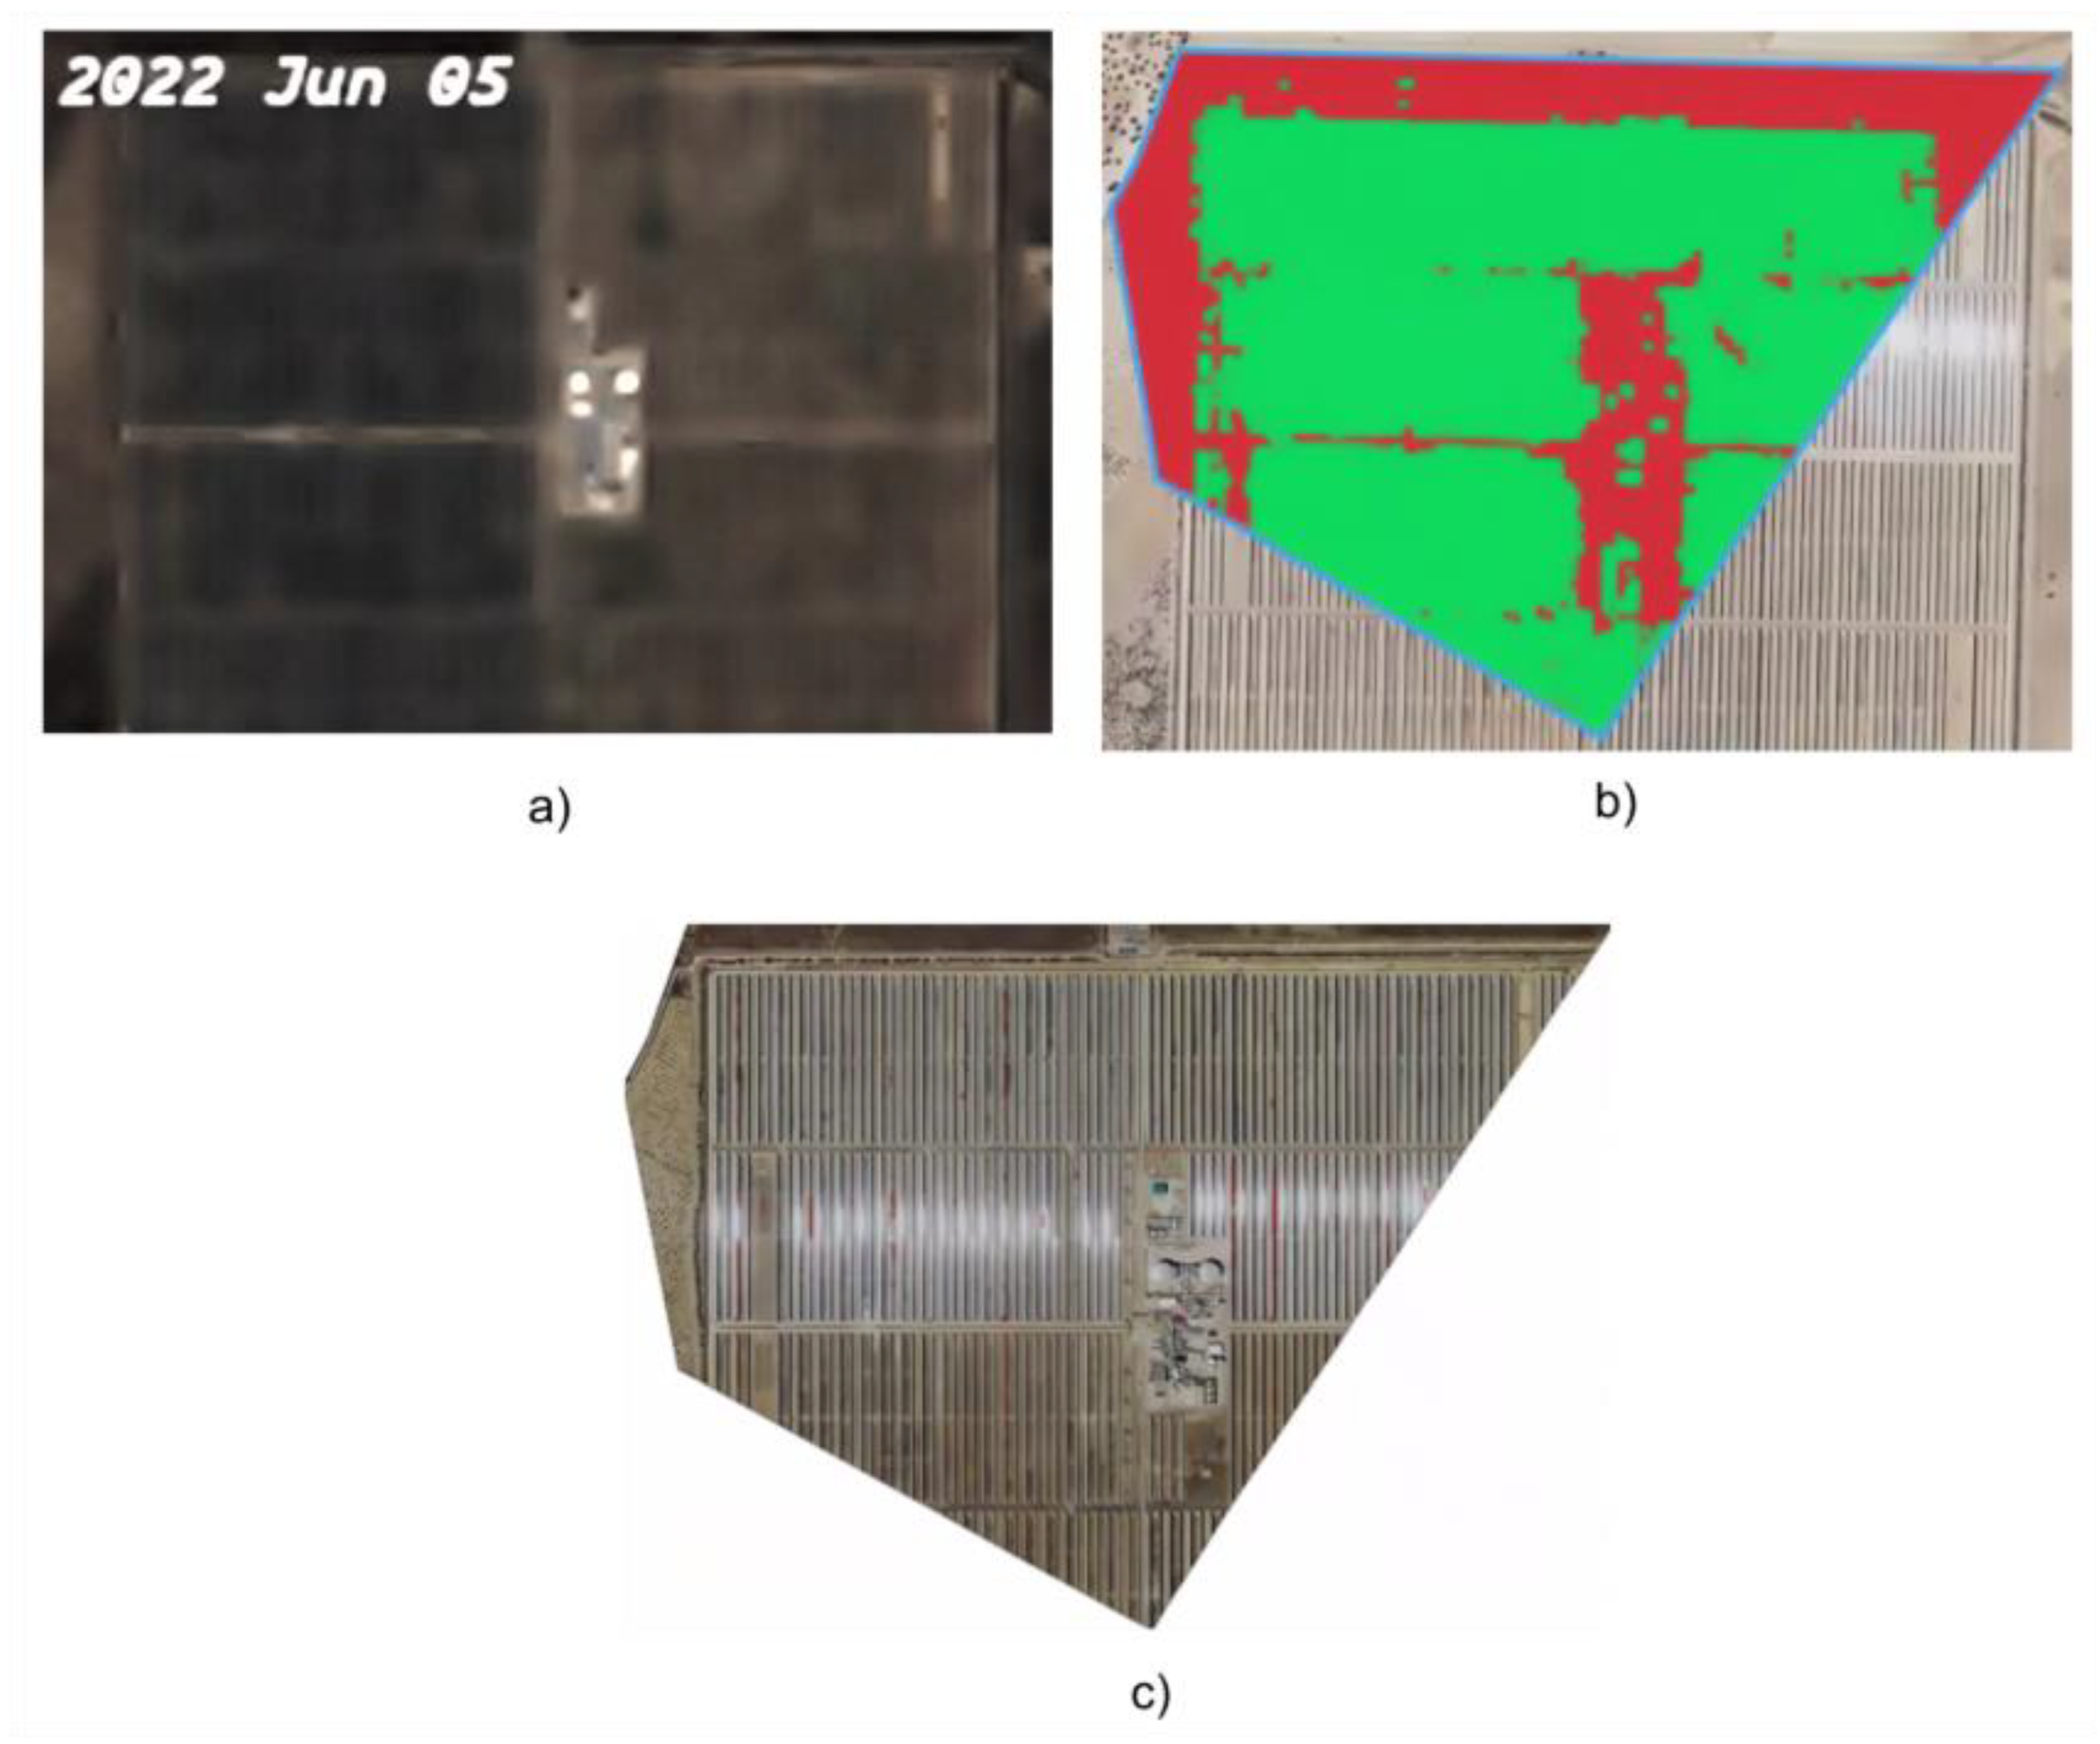
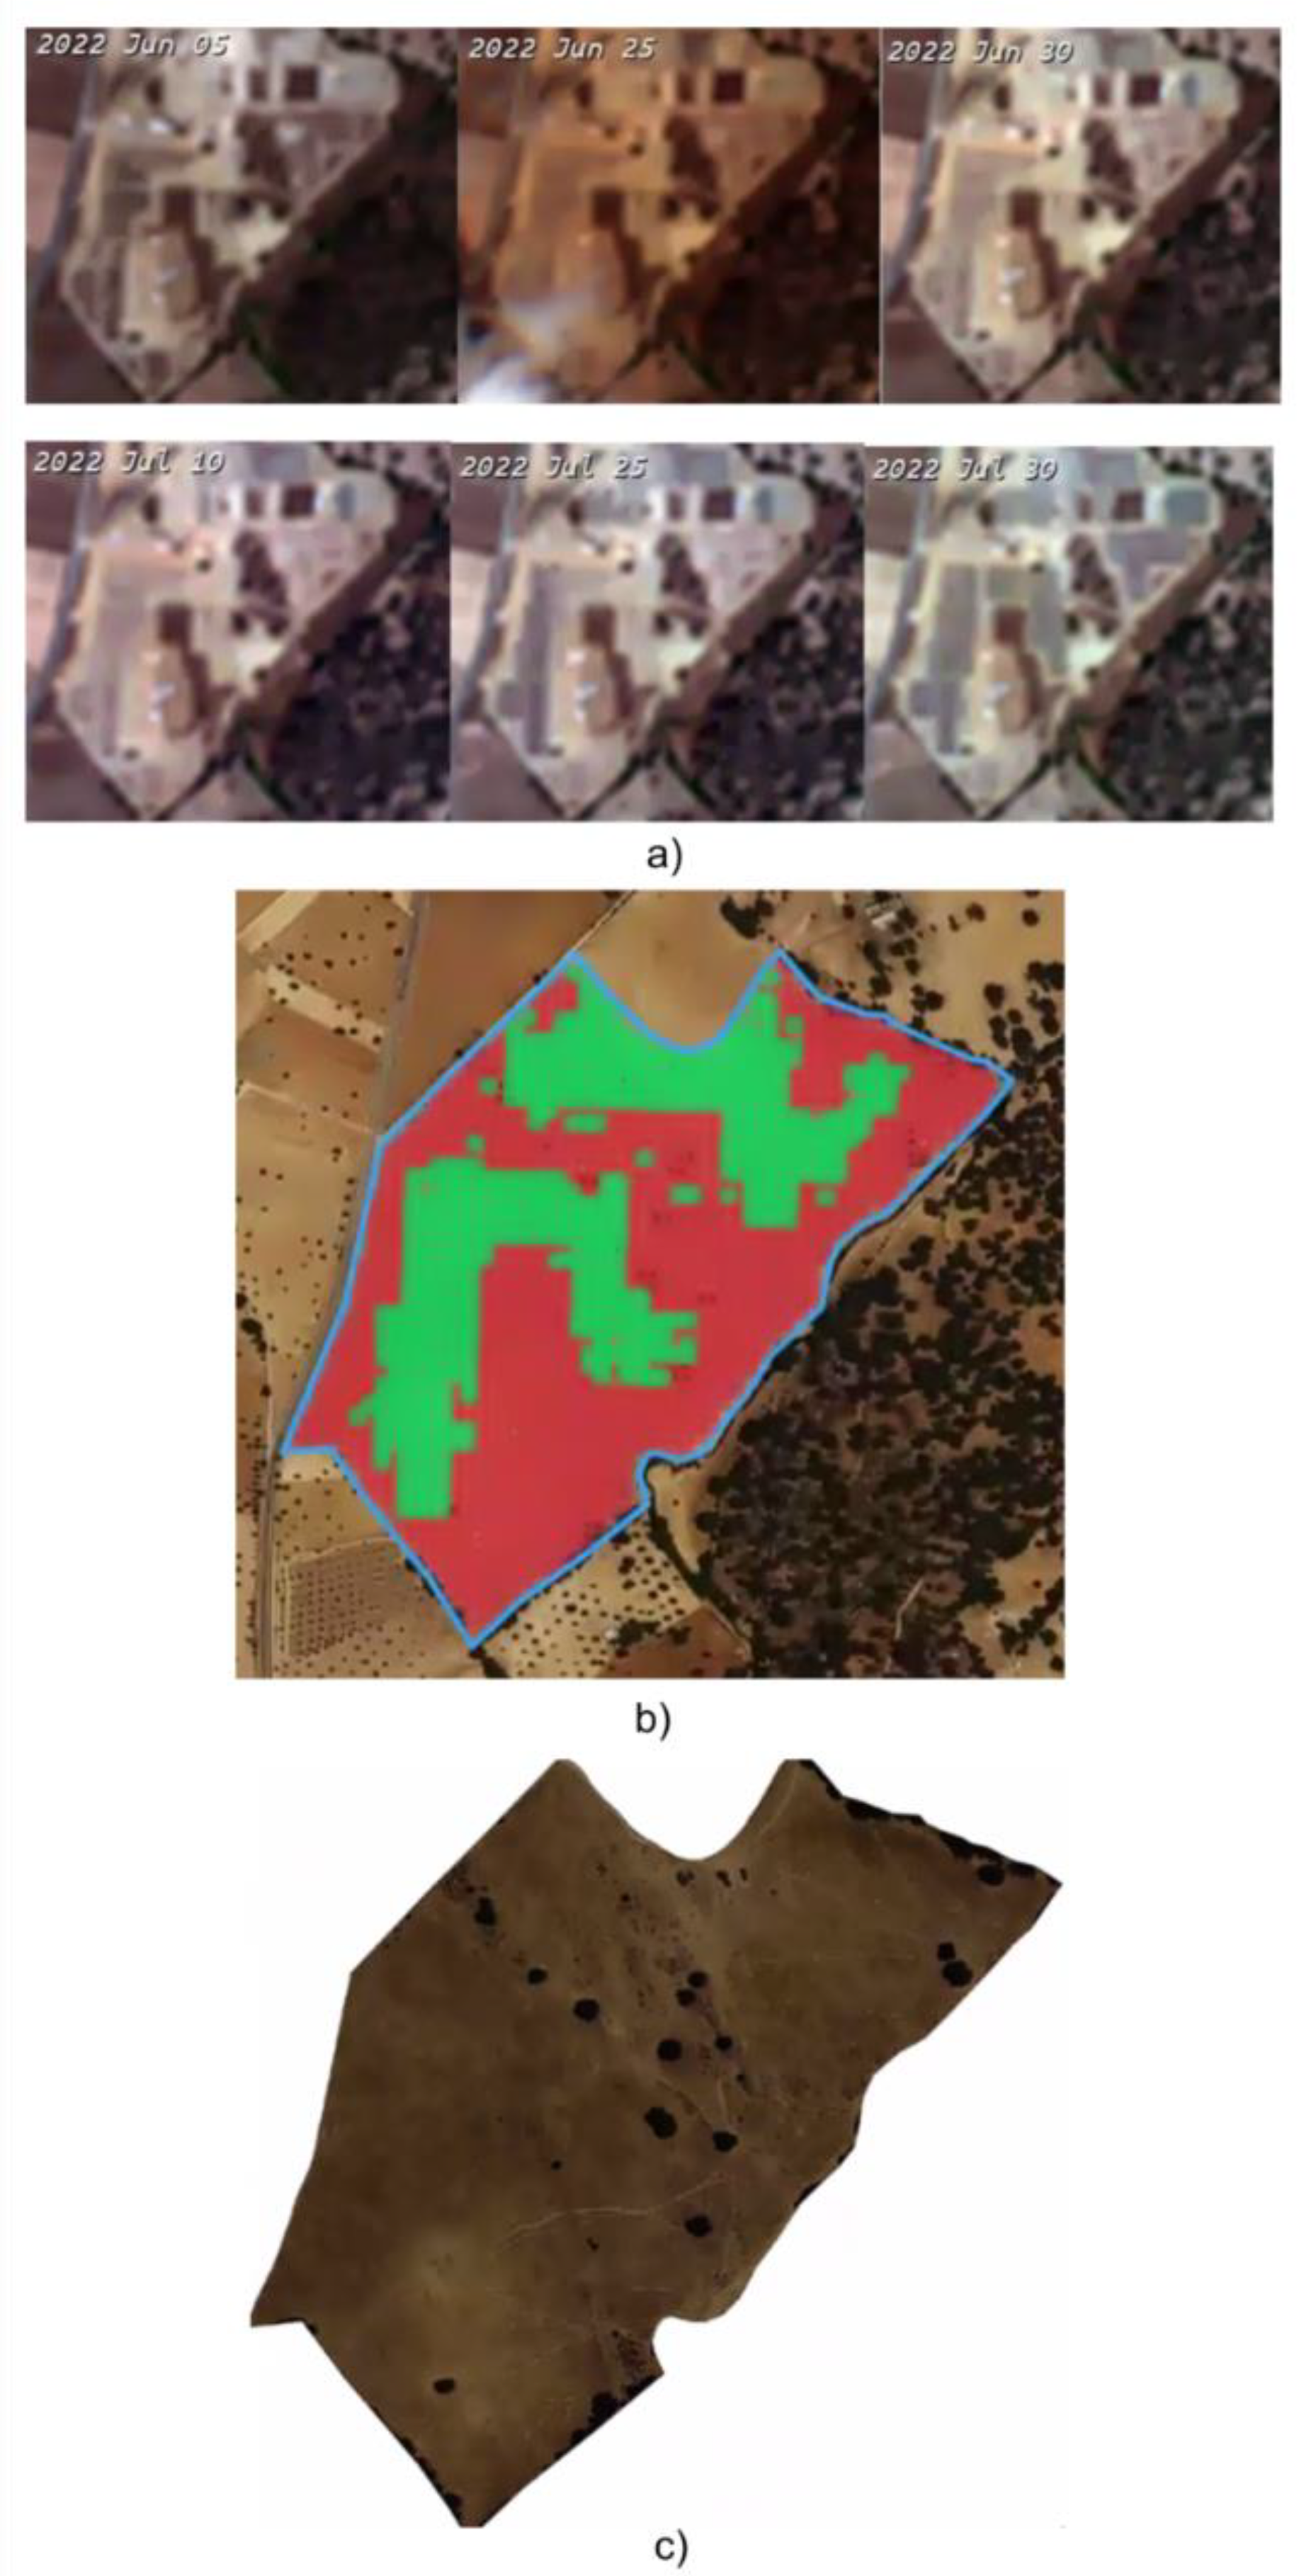
Figure 10 and
Figure 11 illustrate representative parcels from the four counties of Badajoz, including both those containing photovoltaic panels and those without installations.
Figure 10 shows positive cases where PV systems were successfully detected by both the segmentation and pixel-wise classification approaches, while
Figure 11 presents negative cases corresponding to parcels without PV installations.
3.2. Analysis of Error Patterns and Methodological Limitations
Both approaches coincided in the detection of 92 parcels, representing 86.79% of the total unique parcels detected (106 in total). The average absolute difference in surface area detected per parcel between the two methods was 6.67 hectares, demonstrating a high level of agreement, though not without deviations attributable to the specific characteristics of each technique.
Differences between the two approaches were evident in error types. For orthophoto segmentation:
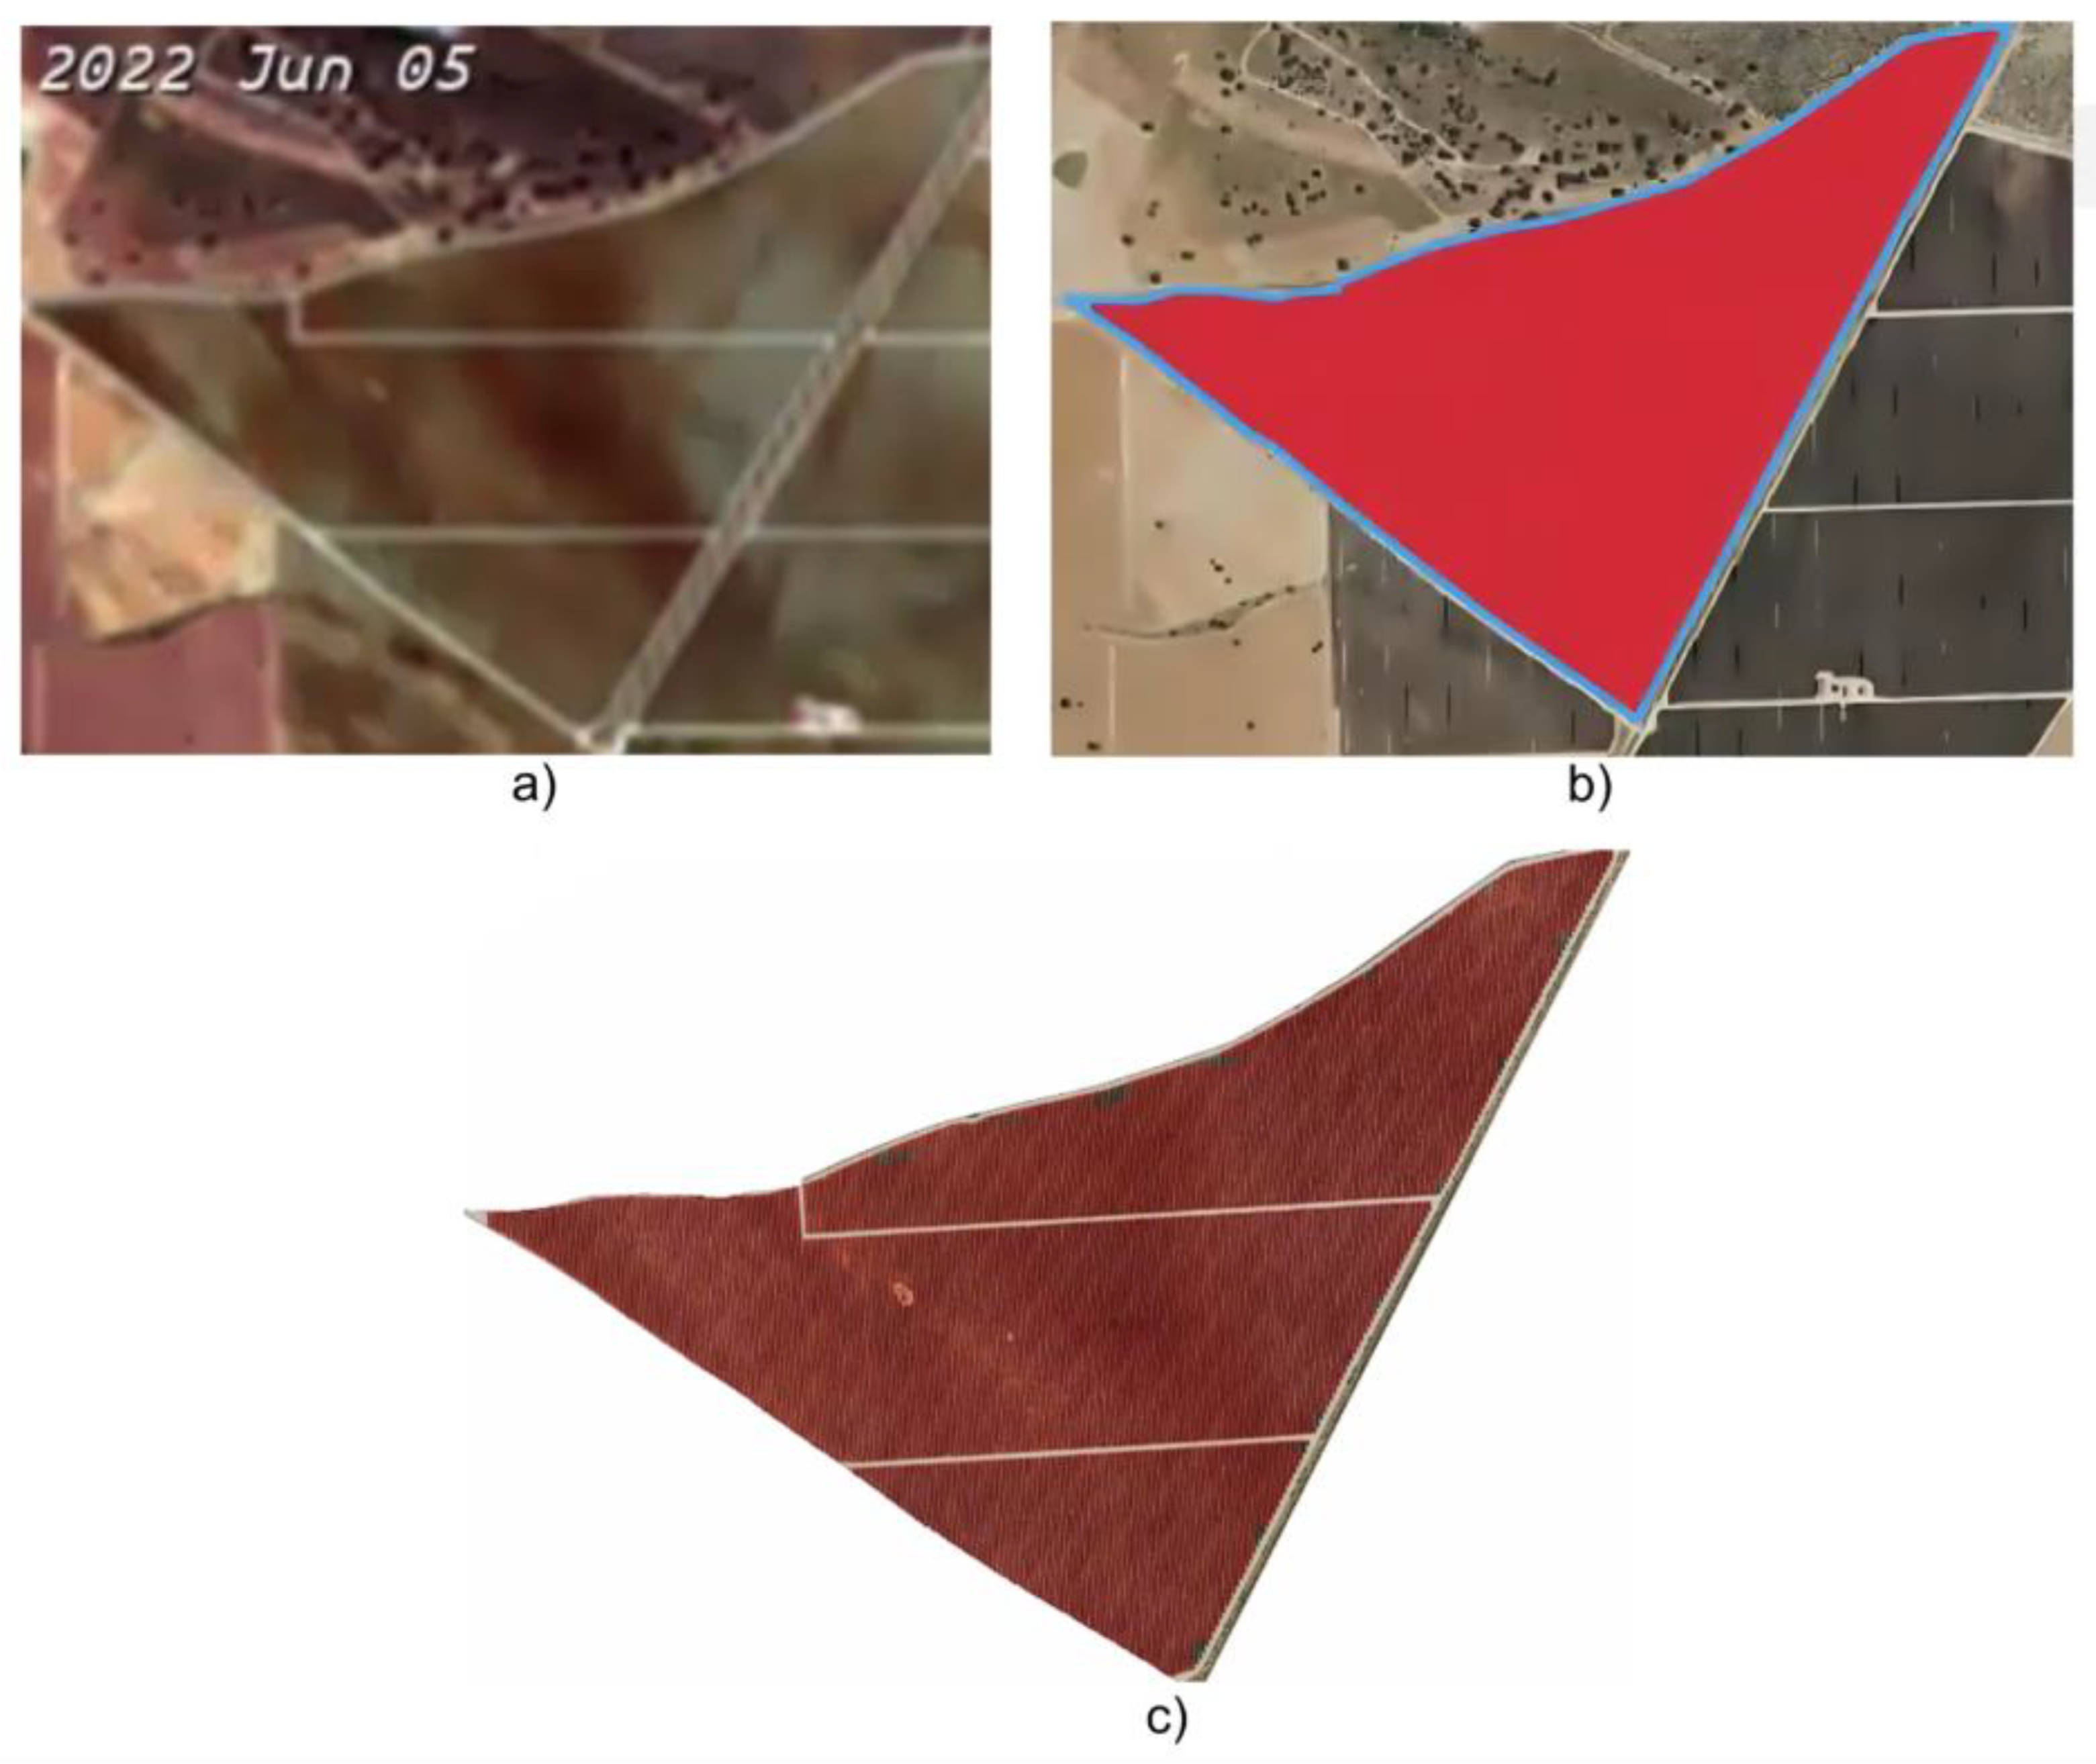
Hedgerow olive groves: These plantations exhibit a regular and densely aligned pattern that visually resembles photovoltaic installations. The model frequently confused these crops with solar panels due to the similarity in texture and layout (
Figure 12). A total of 5 plots with hedgerow olive trees were mis-detected with segmentation, while a total of 0 parcels were detected with a pixel-wise approach.
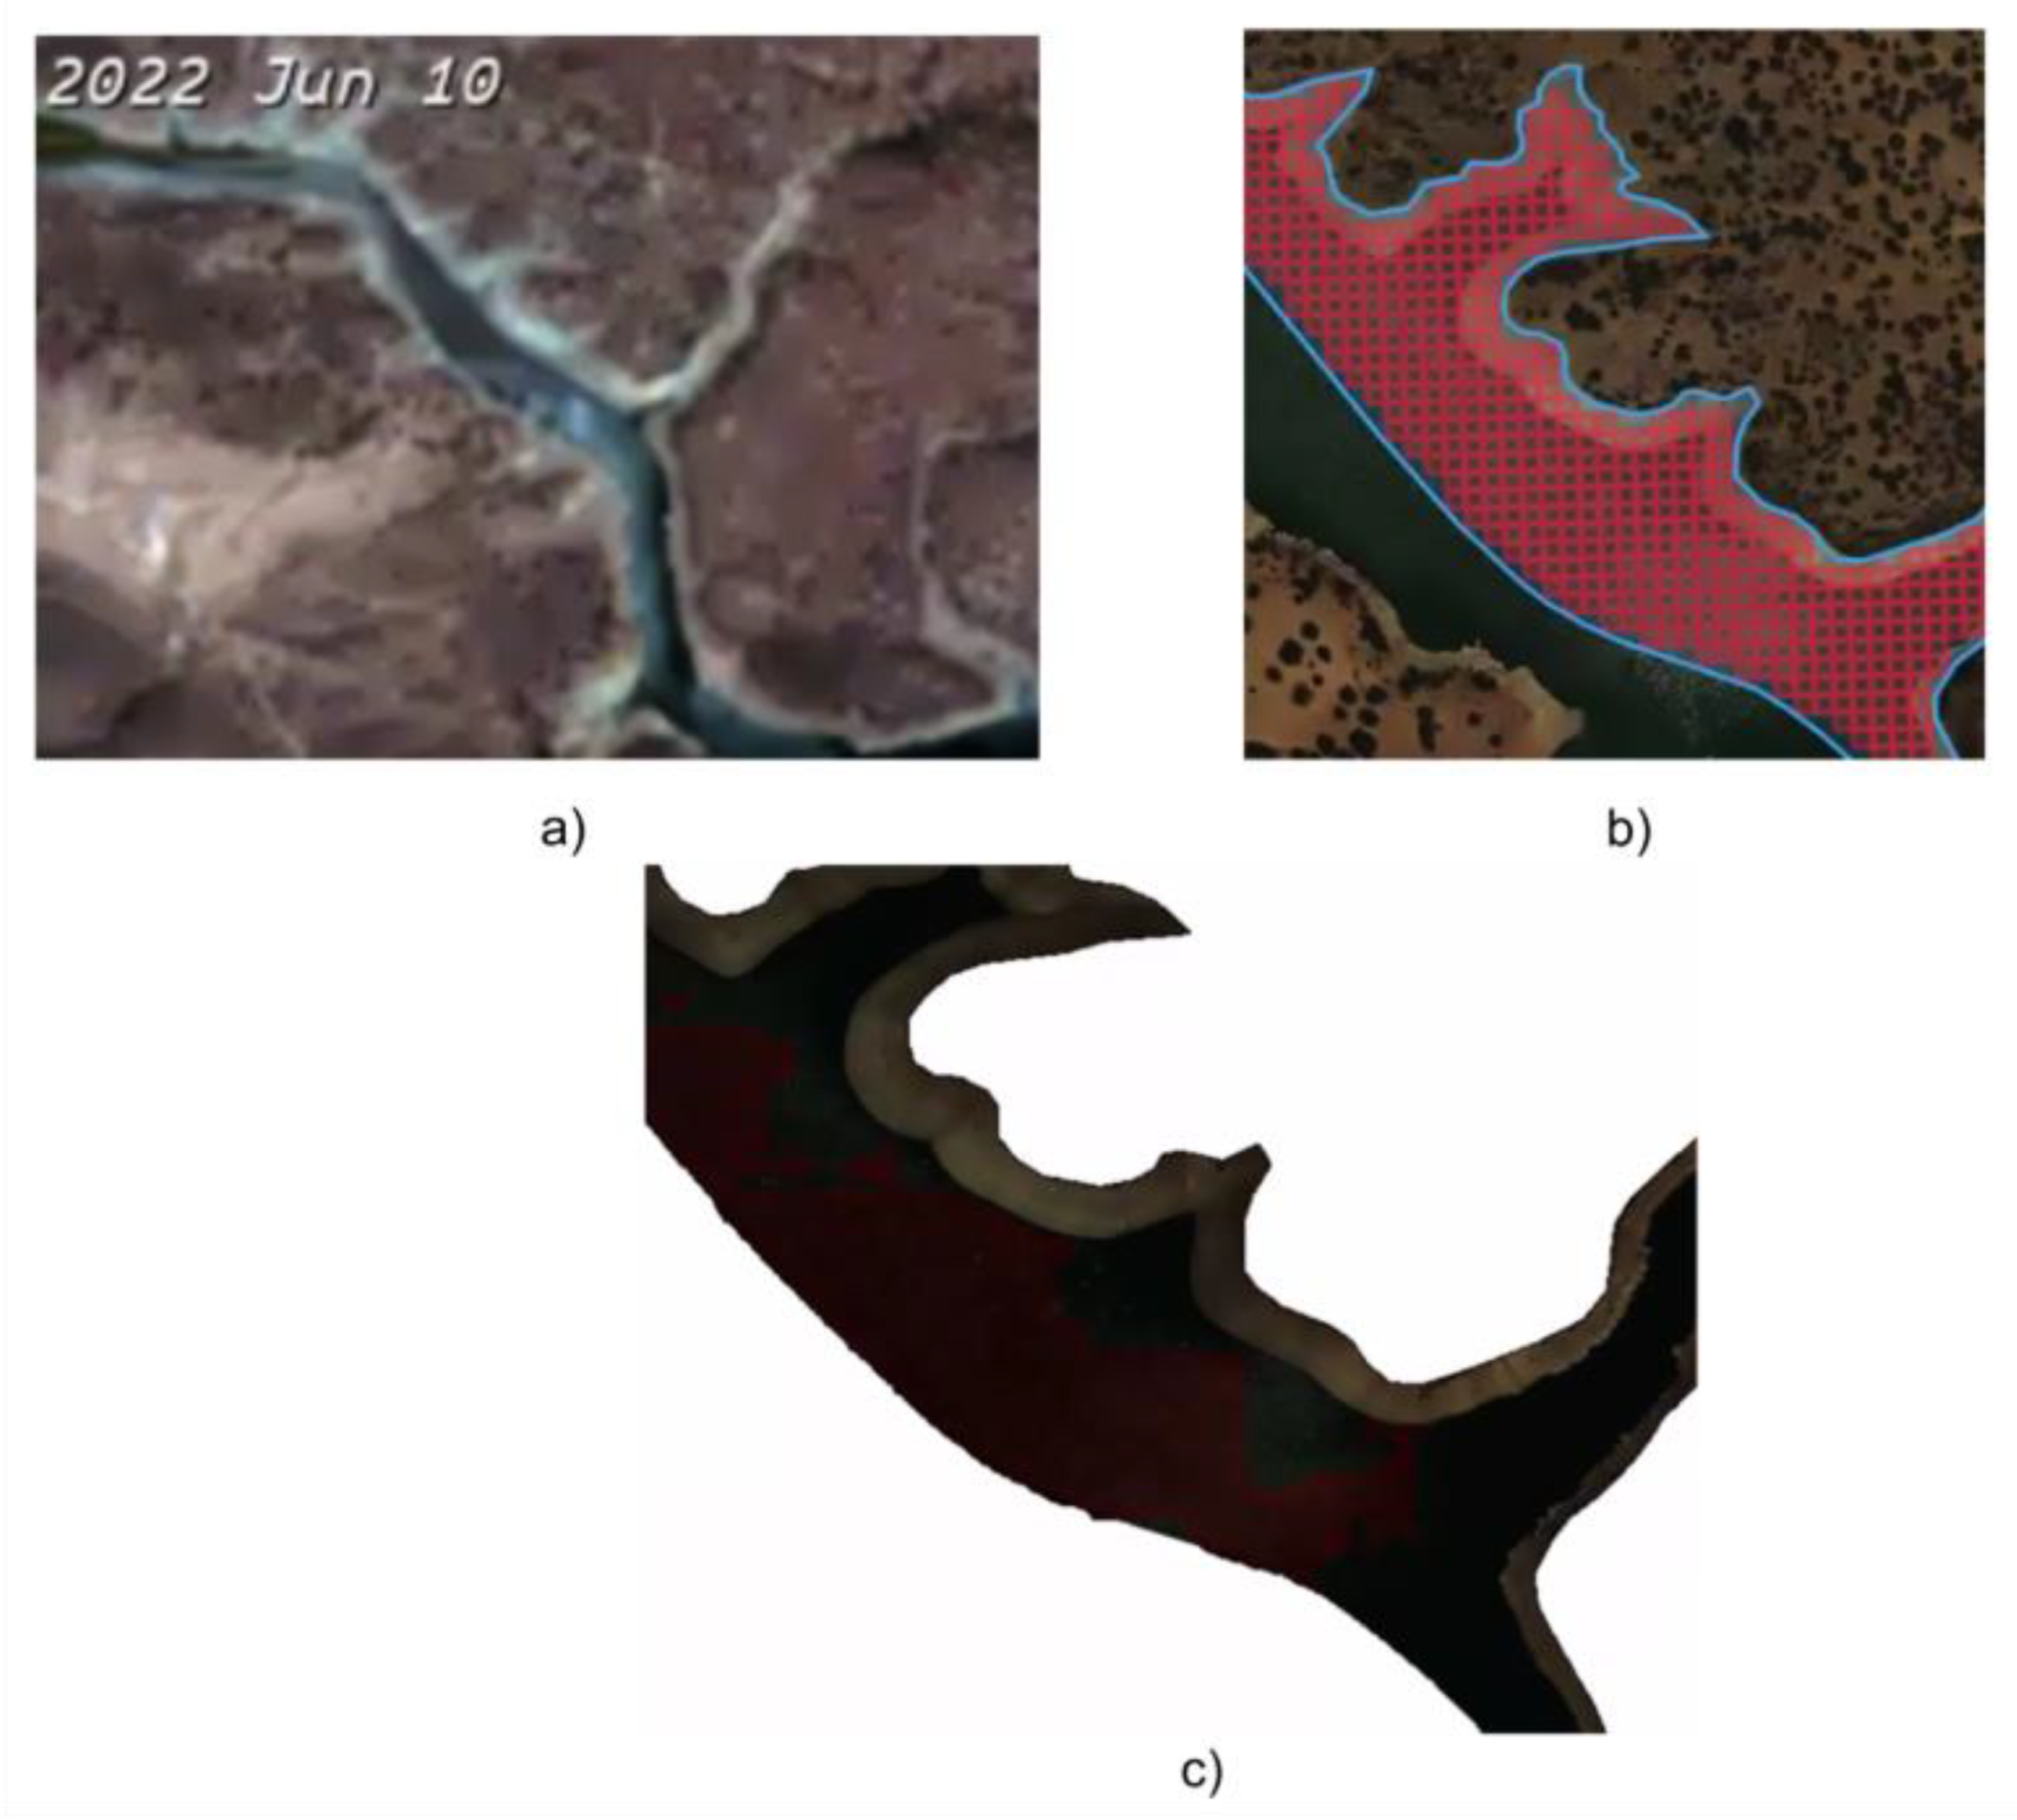
Water bodies: Reservoirs, rivers, and ponds caused specular reflections in the RGB orthophotos, which led the model to mistakenly label them as solar installations (
Figure 13). A total of 3 water body plots were mis-detected with segmentation, while with the pixel-wise approach, 0 plots were detected.
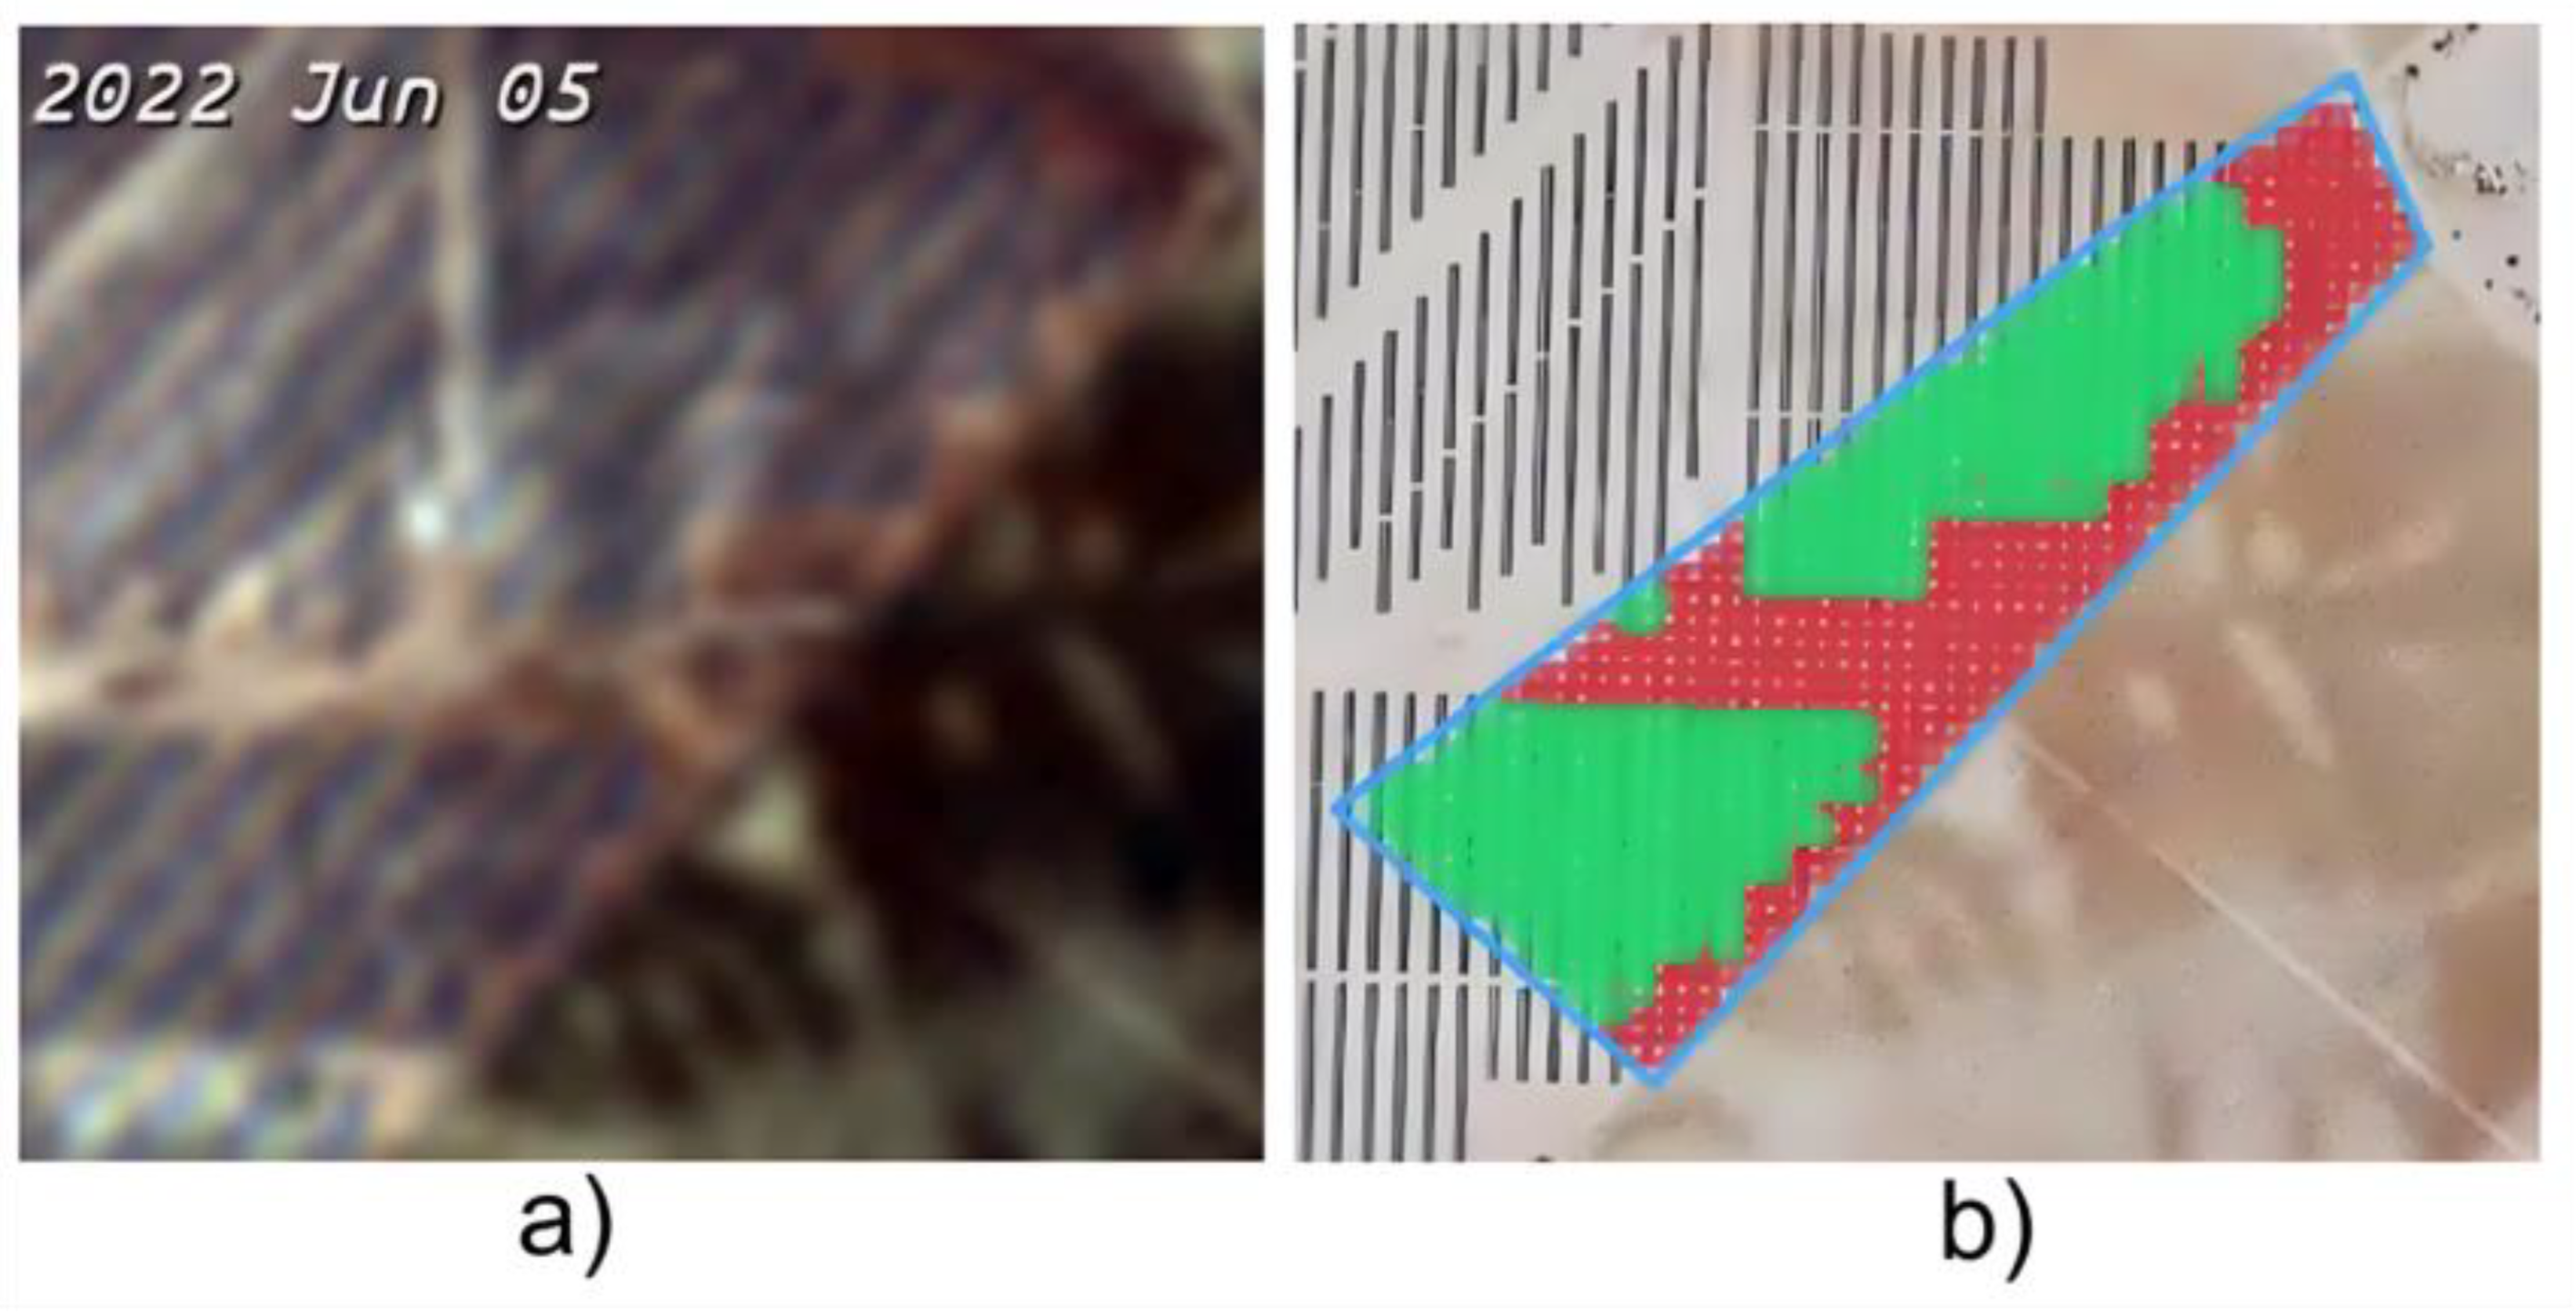
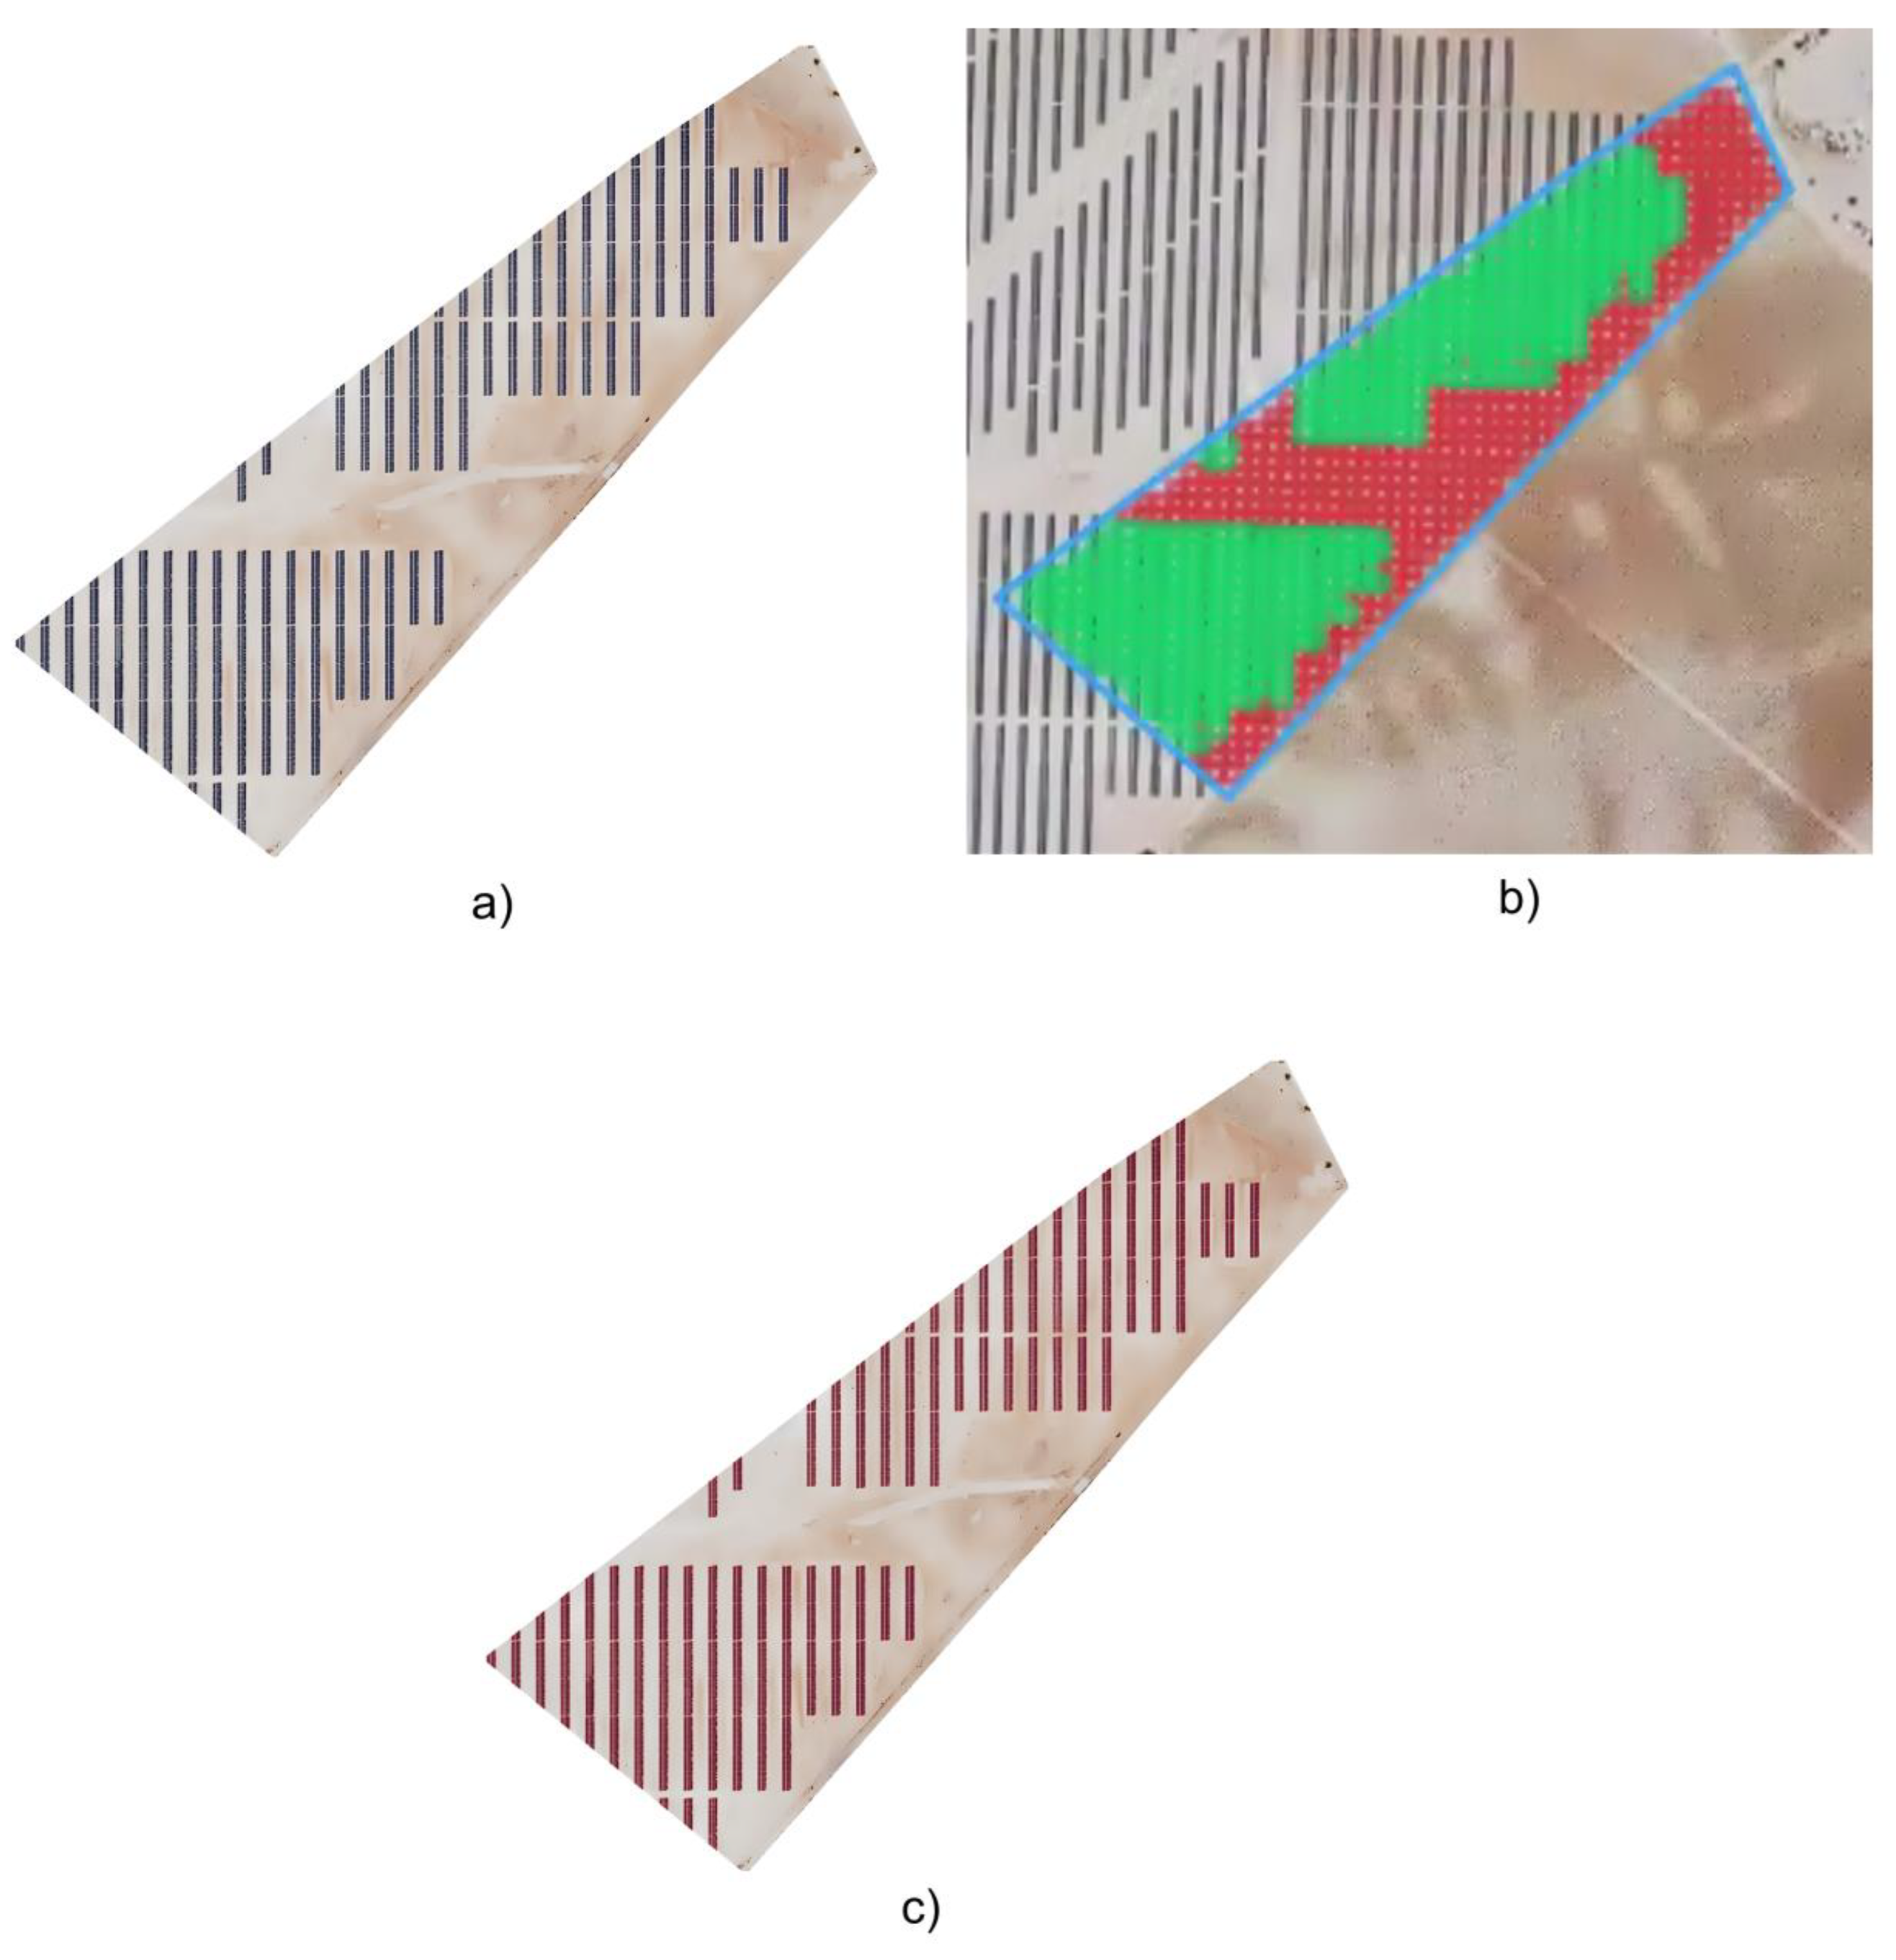
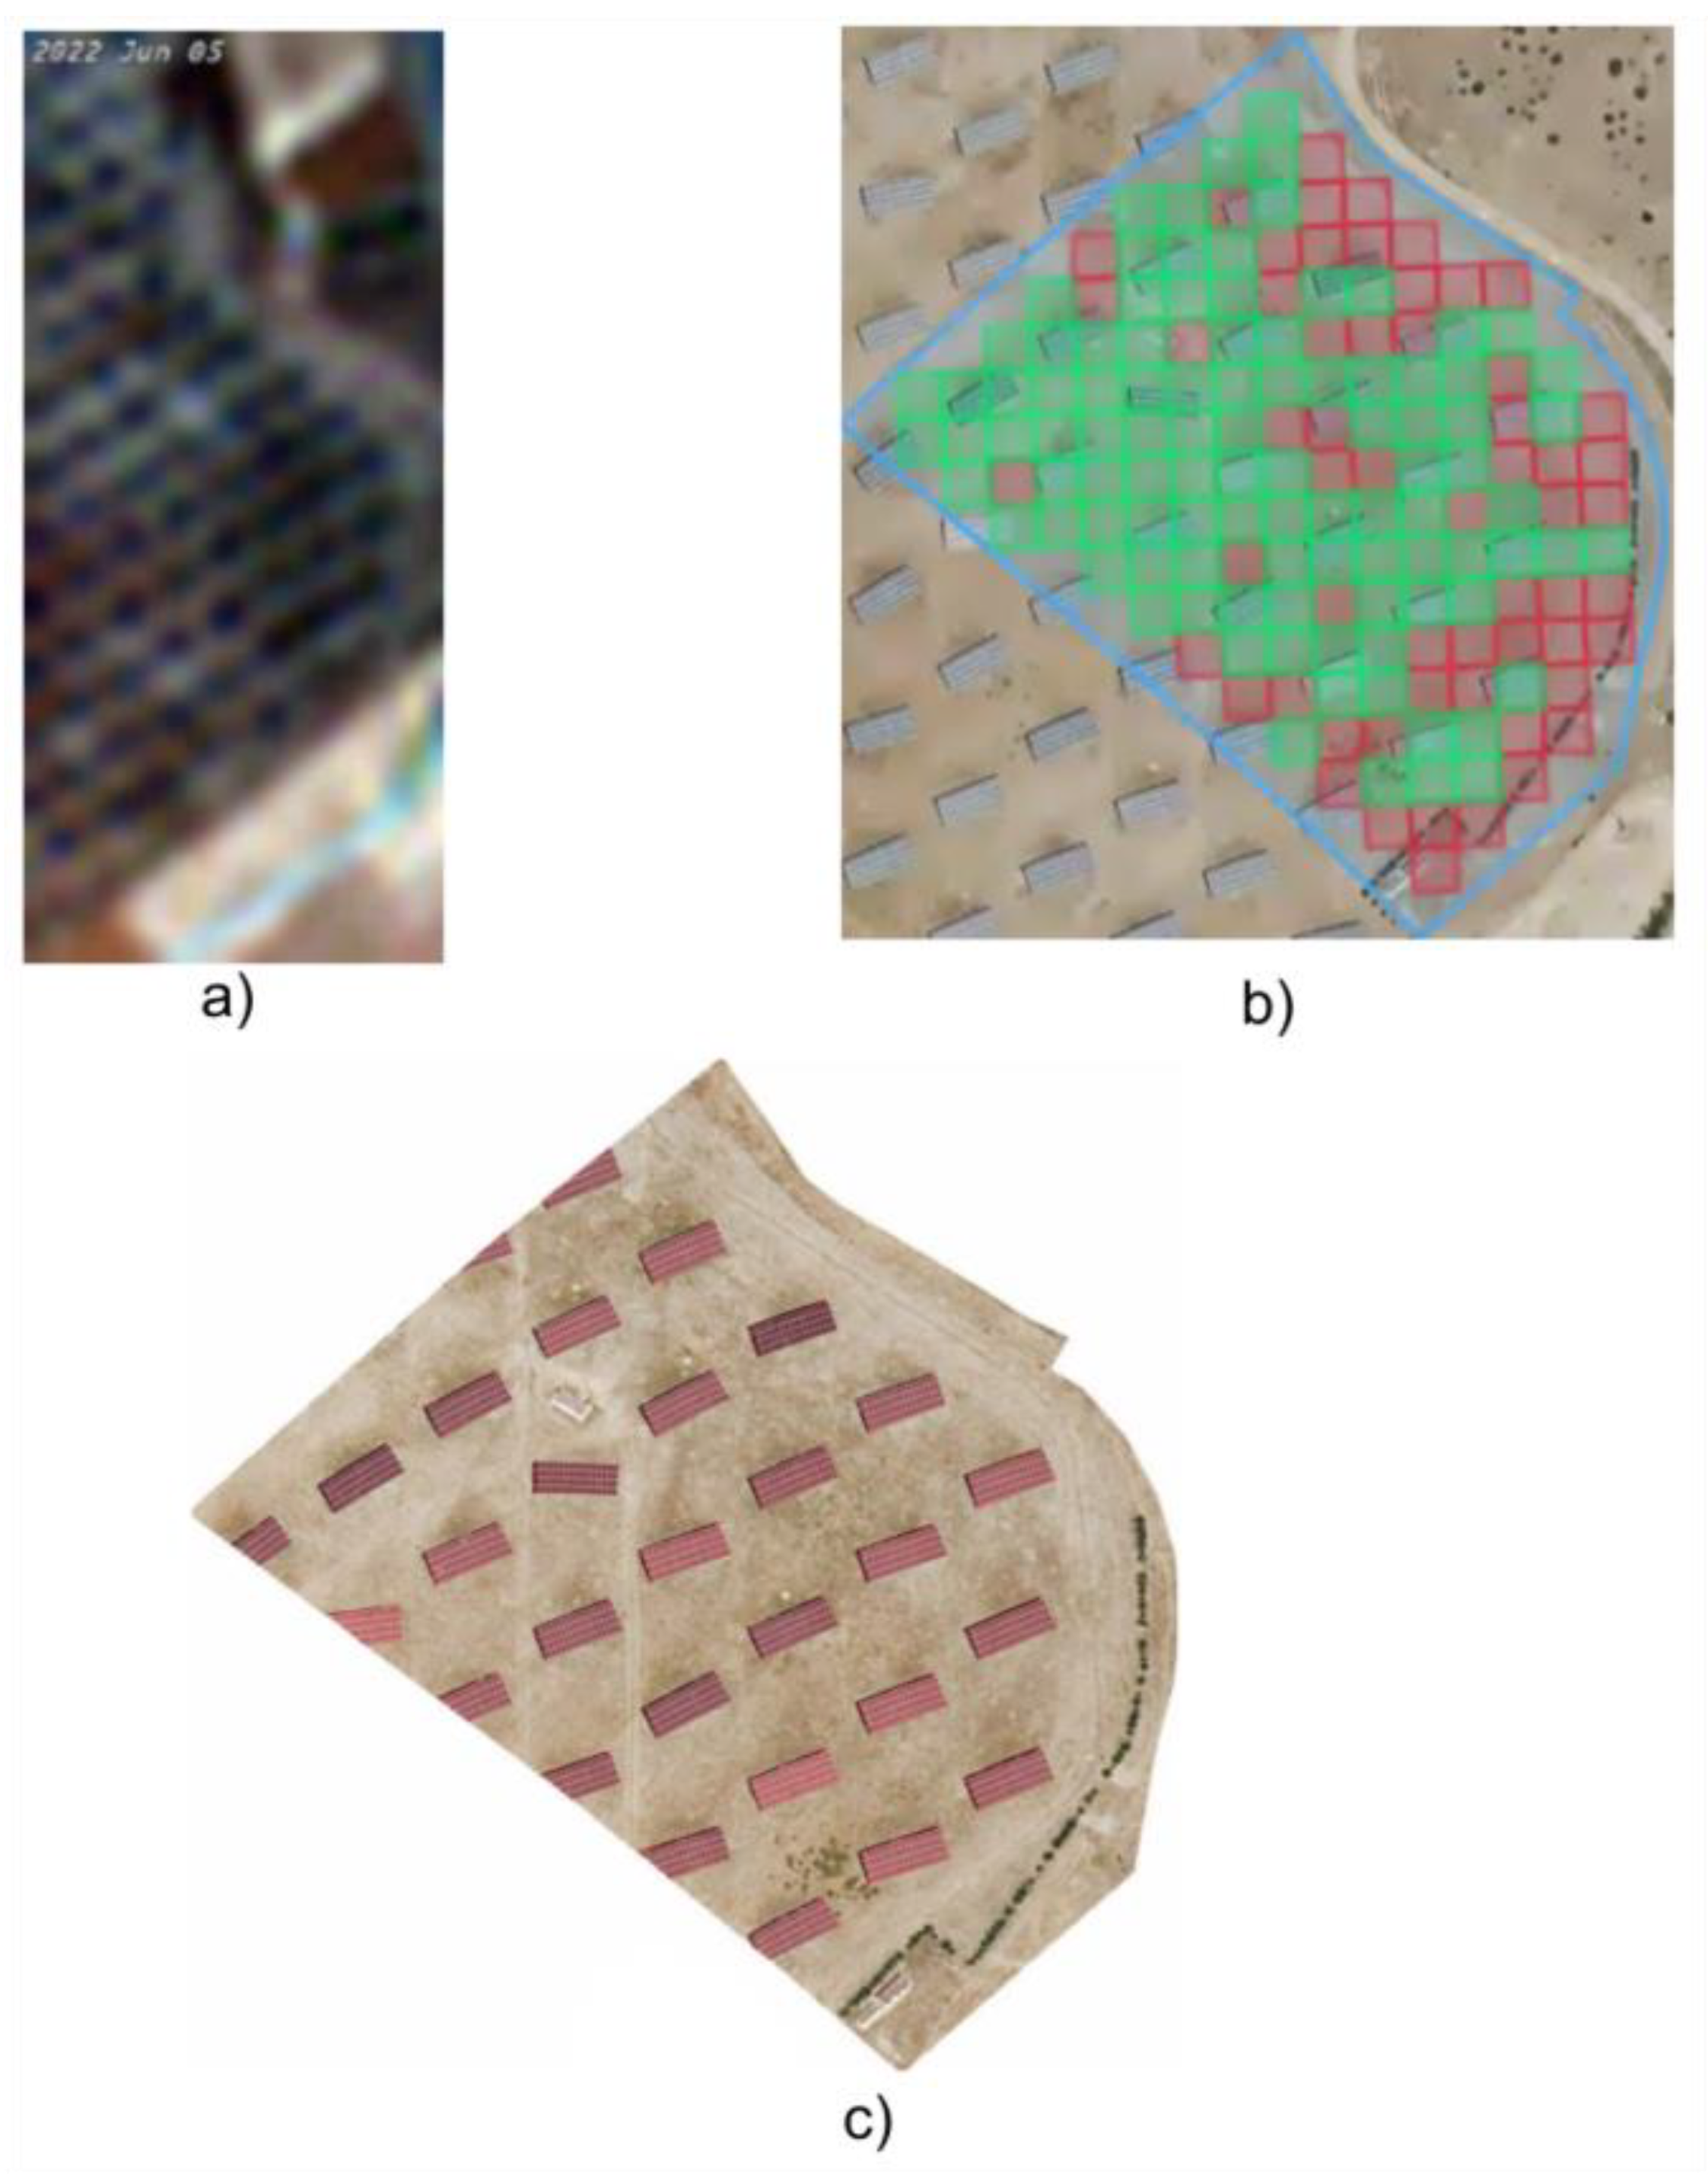
Image perspective: In some orthophotos, solar panels appeared almost vertically relative to the image capture angle, making them harder to detect visually (
Figure 14a). These installations were missed by the segmentation model but correctly identified by Sentinel-2 thanks to their distinctive spectral signature (
Figure 14b). Both detected 2 parcels, but with the pixel-by-pixel approach the detection was much more accurate.
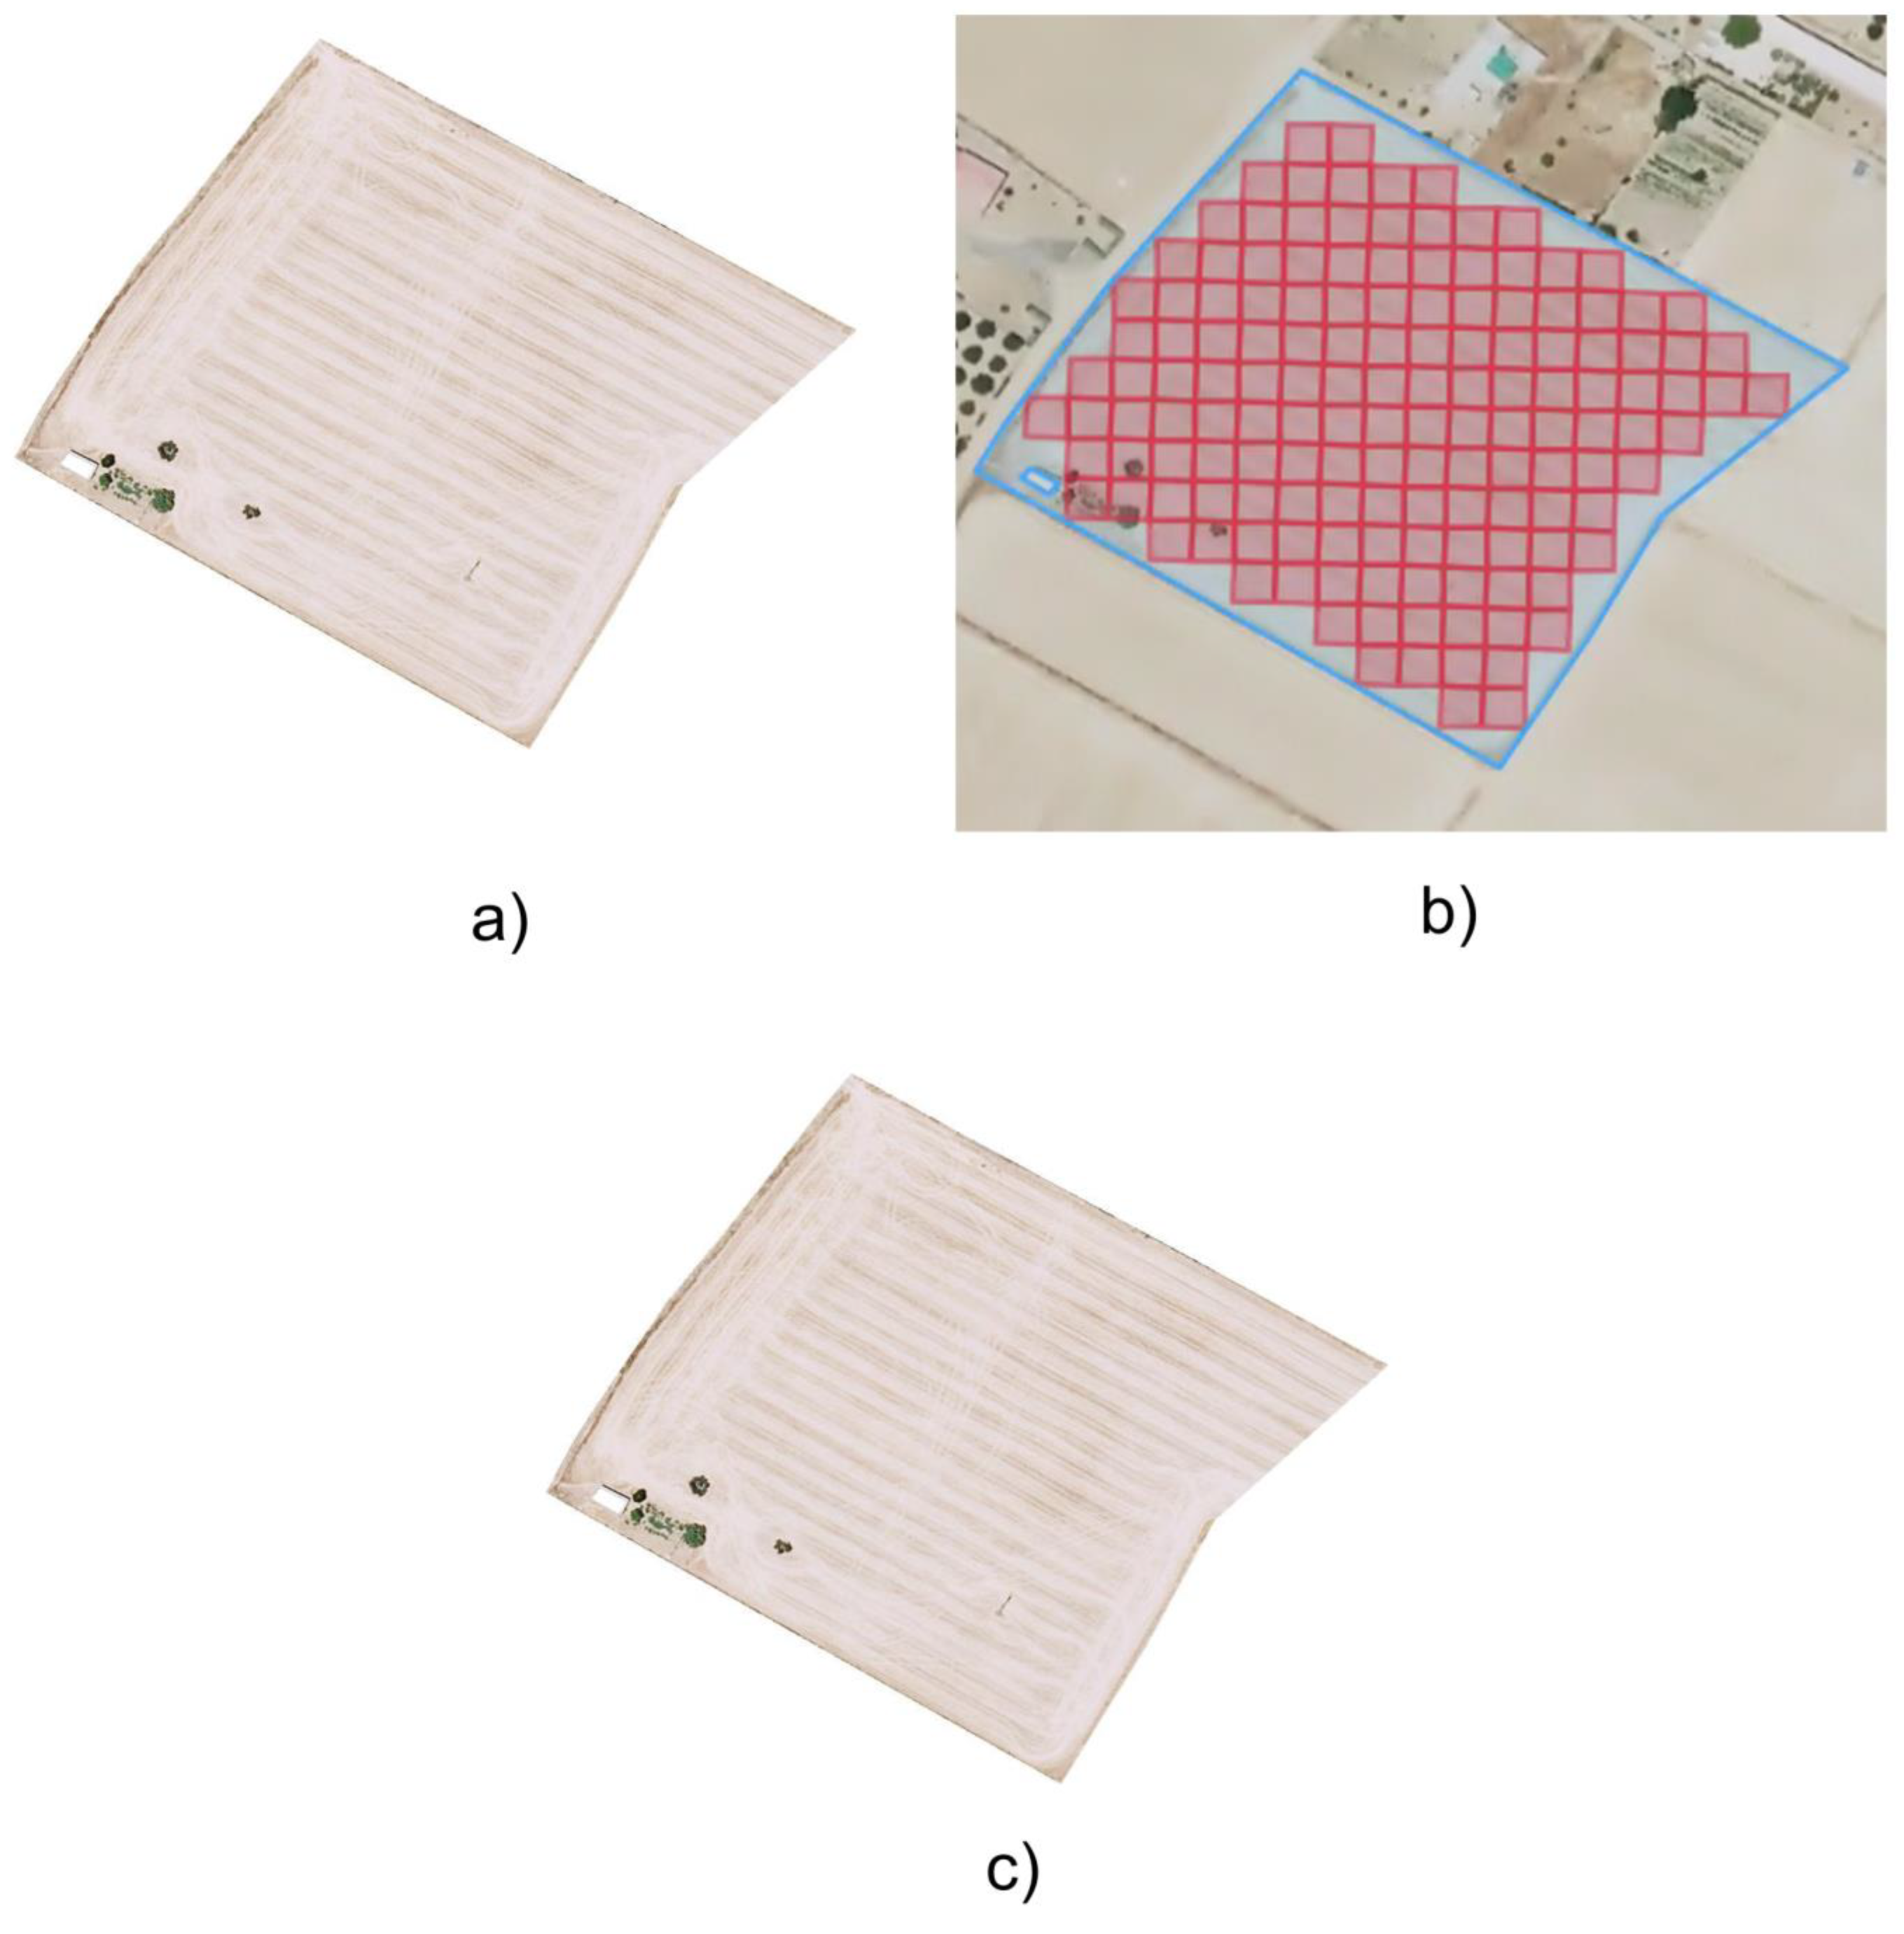
Temporal obsolescence: Some installations built between June and July 2022 were not yet visible in the orthophotos used. In contrast, the Sentinel-2 images, with their high temporal frequency, allowed the model to capture the spectral changes caused by the newly installed panels, enabling their detection (
Figure 15). Only one parcel was detected pixel-wise with Sentinel-2.
Although the Sentinel-2–based detection approach demonstrated strong overall performance, two notable limitations were identified:
Small and dispersed installations: The 10 m spatial resolution did not provide sufficient spectral detail, resulting in missed detections of smaller or irregularly distributed photovoltaic systems (
Figure 16). A total of three dispersed installations were detected with both techniques, but the segmentation approach has greater accuracy.
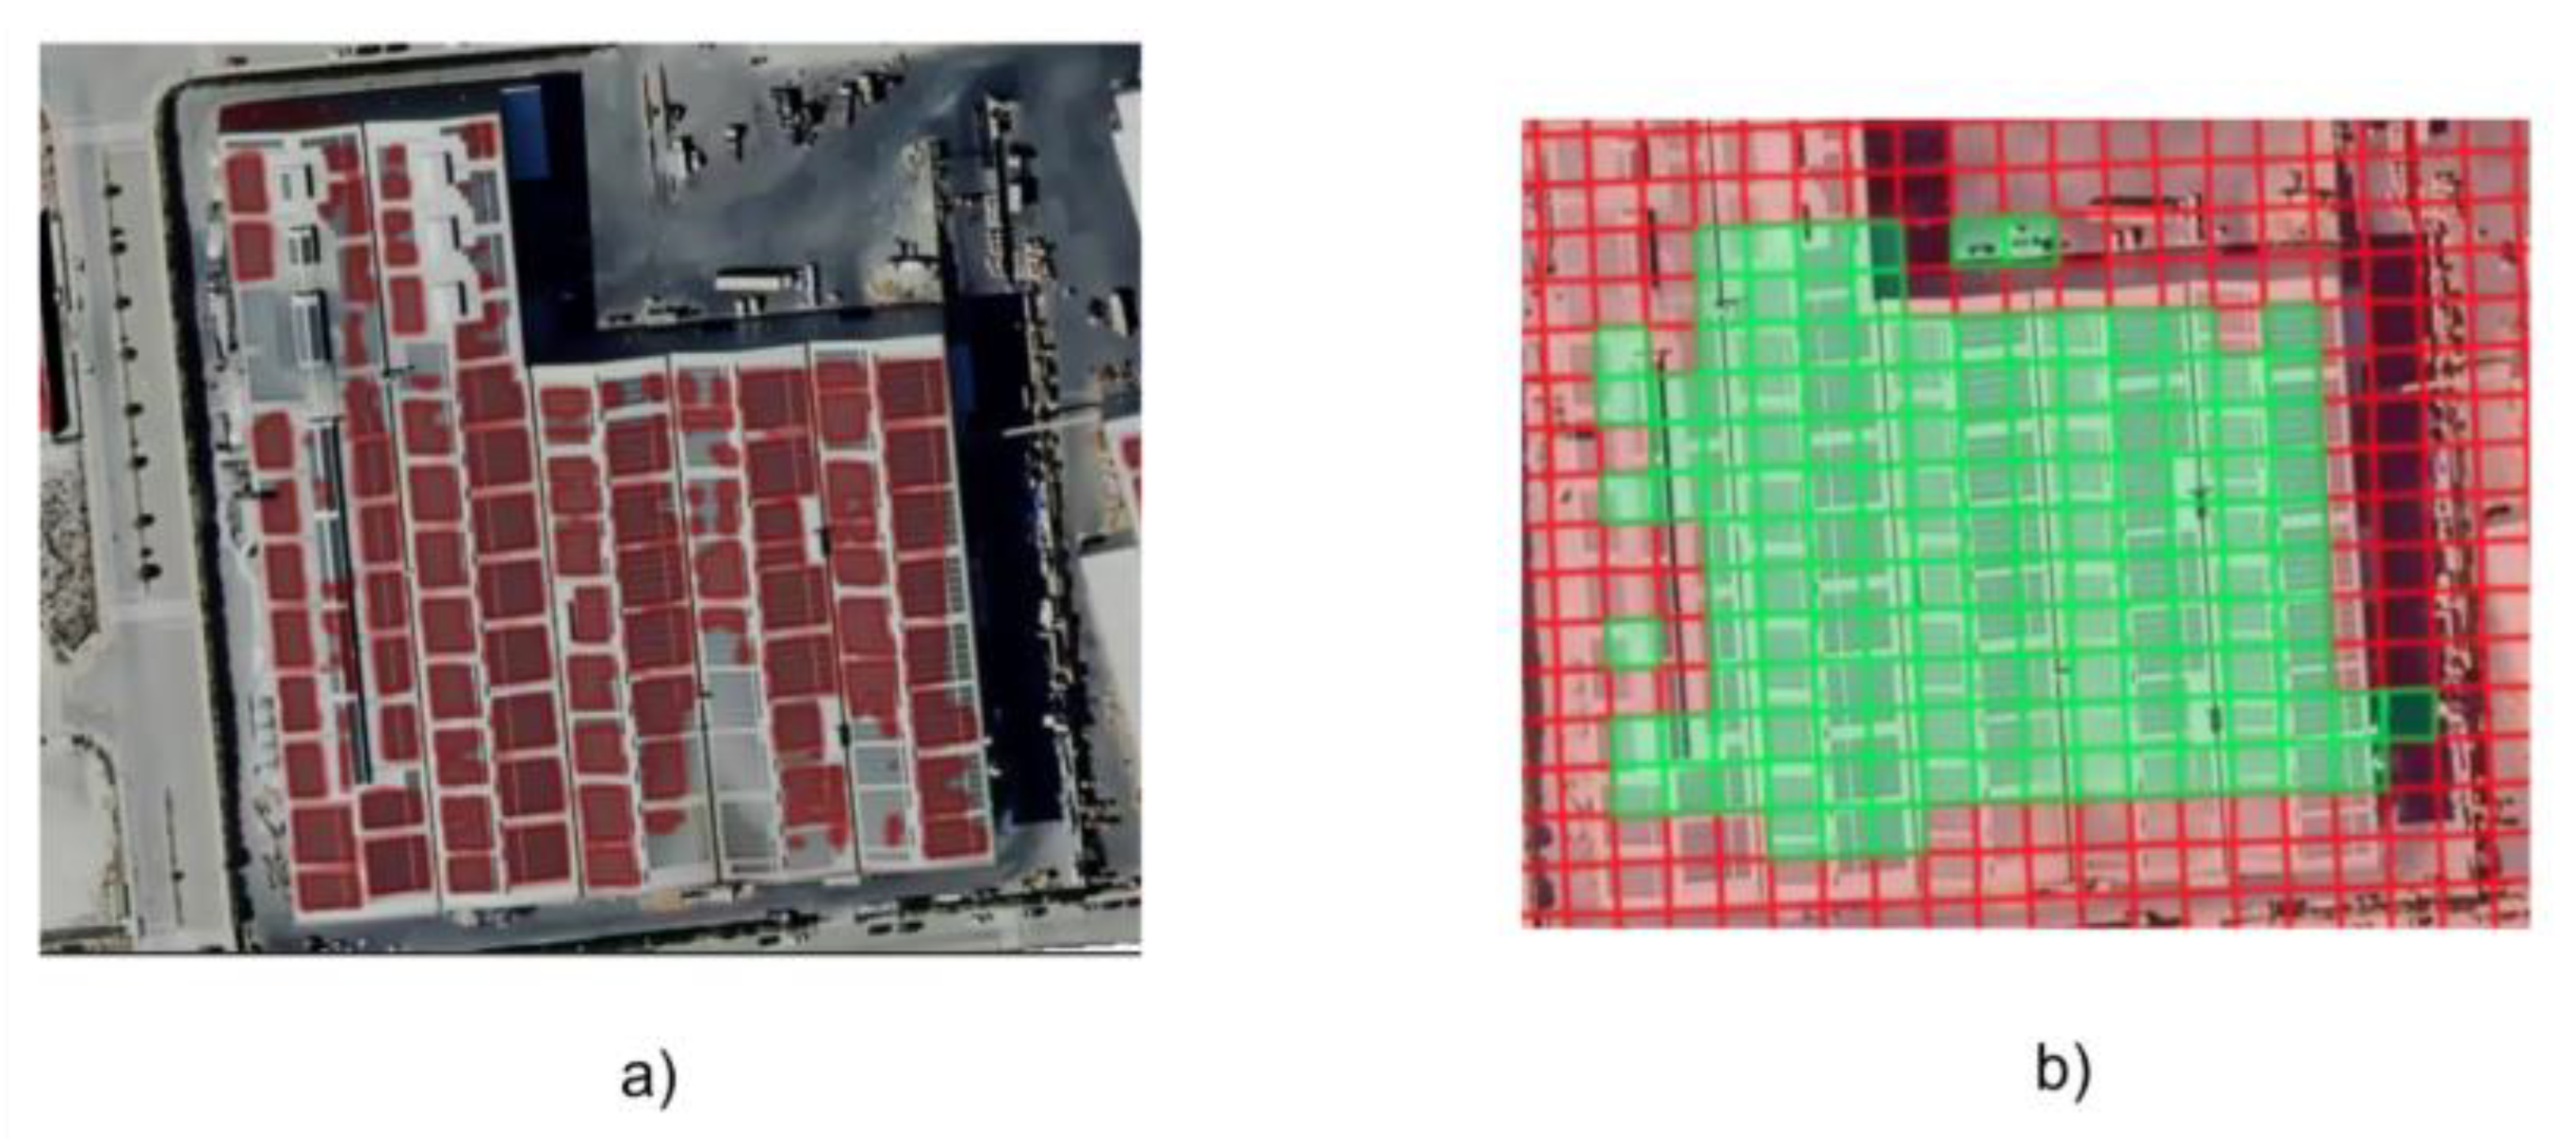
Urban environments: While effective in identifying large, clustered installations, the method frequently overestimated the surface area due to limited capacity to delineate individual rooftop systems with precision (
Figure 17). A total of two urban environments were detected with both techniques, but the segmentation approach has greater accuracy.
3.3. Trade-Offs: Spatial vs. Temporal-Spectral Resolution
The comparison between orthophoto segmentation and Sentinel-2 pixel-wise classification highlights fundamental trade-offs between spatial and temporal-spectral resolution. High-resolution RGB orthophotos provide fine spatial detail, enabling precise delineation of PV panels, even for small installations or complex urban rooftops. However, this precision comes at the cost of large file sizes, extensive preprocessing (cropping, mosaicking, georeferencing), and high computational demands. Moreover, orthophotos are usually acquired on specific dates, which may not coincide with the construction of new PV installations, potentially missing recently built infrastructure.
Sentinel-2 imagery, in contrast, offers a coarser spatial resolution (10 m) but compensates with multispectral data across all its bands and a frequent revisit cycle (every 5 days in Europe). This temporal richness allows multitemporal detection of PV panels, capturing spectral changes over time and enabling identification of newly installed or partially shaded panels that might be missed in single-date orthophotos. Additionally, the fully automated pipeline for Sentinel-2 reduces human intervention and computational load, making it more scalable for large-area monitoring.
These differences imply that the choice of methodology depends on the study objectives. For applications requiring parcel-level accuracy and precise boundary delineation (e.g., cadastral updates or detailed infrastructure surveys), orthophoto segmentation is preferable. Conversely, for regional or national-scale monitoring where automation, up-to-date information, and repeated observations are critical, Sentinel-2 offers a more practical solution. This trade-off between precision and temporal-spectral richness is central to designing efficient PV monitoring systems.
3.4. Implications for Large-Scale PV Monitoring and Policy Making
The findings of this study have direct implications for sustainable energy management, regulatory monitoring, and policy formulation. Sentinel-2’s temporal and multispectral capabilities enable automated, frequent, and cost-effective monitoring of PV installations, providing decision-makers with up-to-date information on renewable energy infrastructure. This supports strategic planning for grid integration, identification of underperforming or newly installed PV plants, and evaluation of regional energy targets.
By integrating multitemporal satellite observations, authorities can track construction timelines and infrastructure expansion, which is valuable for both operational management and long-term energy planning. The approach also demonstrates the potential for combining open-access satellite data with machine learning models to reduce reliance on costly, high-resolution aerial imagery, aligning with principles of sustainable resource management and energy monitoring.
Orthophoto-based segmentation, while less scalable, remains important for validating large-scale remote sensing results and for applications that demand high spatial accuracy, such as precise assessment of PV coverage per parcel or urban-scale energy auditing. Together, these complementary methods provide a framework that balances scalability, precision, and temporal relevance, informing both scientific research and practical decision-making in sustainable energy deployment.
At the same time, we acknowledge several methodological and contextual limitations. The study is geographically focused on Extremadura, Spain. Expanding the methodology to other regions, incorporating higher temporal resolution imagery, or combining data sources could further improve robustness and applicability. This positions the study as a foundation for scalable, replicable systems that monitor solar energy infrastructure in support of sustainability goals.
Furthermore, several of the photovoltaic installations identified in this study via orthophoto segmentation have been the subject of field visits by technicians from the Agricultural Department of the Regional Government of Extremadura. These visits, conducted as part of their routine inspection tasks, provided indirect yet valuable confirmation of the detected sites, adding an empirical layer of validation to the results and reinforcing the robustness of the methodological comparison.
Future work could explore the integration of additional open-access satellite data sources, multi-sensor fusion, or larger and more diverse datasets to extend the generalizability of our findings and improve PV detection across different environmental and geographic contexts.
