Article

Ecological Security Pattern Construction for Carbon Sink Capacity Enhancement: The Case of Chengdu Metropolitan Area

1
School of Civil Engineering and Architecture, Southwest University of Science and Technology, Mianyang 621000, China
2
Ministry of Education Key Laboratory for Earth System Modeling, Department of Earth System Science, Institute for Global Change Studies, Tsinghua University, Beijing 100084, China
*
Author to whom correspondence should be addressed.
Sustainability 2025, 17(10), 4483; https://doi.org/10.3390/su17104483
Submission received: 25 February 2025 / Revised: 3 May 2025 / Accepted: 7 May 2025 / Published: 14 May 2025

Abstract

:
Constructing regional ecological security patterns (ESP) and enhancing carbon sequestration are essential for achieving China’s dual-carbon goals. However, rapid urbanization has intensified landscape fragmentation, disrupted ecosystem flows, and significantly altered urban ecological networks, weakening their carbon sink functions. Using the Chengdu metropolitan area (CMA) as a case study, a time-series ESP from 2000 to 2020 was constructed. Morphological Spatial Pattern Analysis (MSPA), the Minimum Cumulative Resistance (MCR) model, the gravity model, and complex network theory were employed to assess the spatiotemporal evolution and carbon sequestration capacity of the ecological network. Results revealed continuous declines in ecological sources and corridors, an initial rise then stabilization in resistance, and weakening connectivity, particularly in central and western subregions. Reductions in modularity and topological indices reflected lower ecological stability and greater vulnerability. Forest land served as the primary carbon sink, closely associated with multiple topological metrics; grassland sequestration correlated with clustering, while water bodies were positively linked to centrality measures. Adding 10 stepping-stone nodes and 45 corridors could enhance carbon sequestration by approximately 4156 Mg C yr−1, with forests contributing 94.8% by 2020. This study provides scientific support for resilient regional ESP construction and dual-carbon strategy advancement.

1. Introduction

Excessive CO2 emissions are accelerating global warming and intensifying extreme weather events, including heatwaves and floods, thereby posing a substantial threat to the sustainable development of human societies [1]. As the world’s largest developing country and one of the major emitters, China’s efforts to reduce emissions are pivotal to global climate governance [2]. To address this challenge, the Chinese government has proposed the “dual carbon” strategy achieving peak carbon emissions by 2030 and carbon neutrality by 2060 [3]. However, urban areas have emerged as major emission centers, accounting for 85% of China’s energy consumption [4]. In particular, metropolitan regions driven by dense transportation networks and spatial agglomeration have intensified habitat fragmentation and weakened ecosystem carbon sequestration [5,6]. Under the dual-carbon context, balancing urban development with ecological protection to improve regional carbon sink potential has become an urgent priority.
Against this backdrop, the ecological security pattern (ESP) has emerged as a critical spatial approach to enhance carbon sequestration potential and mitigate urban carbon emissions [7]. ESP studies have established a relatively mature technical framework encompassing “ecological source identification—resistance surface construction—ecological corridor extraction” [8]. In the early stages, nature reserves, ecological redlines, or large ecological patches were commonly designated as ecological sources [9]. With further research advancements, methodologies such as Morphological Spatial Pattern Analysis (MSPA) and ecosystem service value assessments have been incorporated to build a more integrated ecological source system [10,11]. Ecological resistance surfaces, describing landscape resistance to species migration and dispersal, are typically constructed using expert scoring or parametric models [12]. Ecological corridors—ribbon-like regions connecting ecological sources—facilitate the flow of energy, materials, and information and are extracted using models such as the Minimum Cumulative Resistance (MCR) model, circuit theory, and gravity models [12,13]. ESP has been widely applied in constructing ecological networks for forests and watersheds [14], playing a key role in improving landscape connectivity, preserving biodiversity, and mitigating habitat fragmentation [15]. With the deepening of ecological network research, carbon emission reduction and carbon storage have become emerging focal areas [16,17]. The research focus has gradually shifted toward multi-objective optimization, aiming to enhance regional carbon storage capacity through corridor construction and spatial land optimization [18]. For example, Liang et al. [17] achieved carbon-neutral landscape reconstruction by optimizing the spatial layout of desert mining areas [19]; Qiu et al. [20] proposed strategies based on ecological network theory to enhance the carbon sequestration function of forest ecosystems; and Fang et al. [21] found a significant correlation between ecological network topology and vegetation carbon sink capacity. These findings indicate that optimizing ecological networks can not only enhance carbon sink efficiency but also improve the overall stability of ecosystems.
Despite notable research progress, several gaps and deficiencies persist. First, carbon sink functionality has not been systematically integrated into the indicator systems for identifying ecological sources and corridors, leading to an overemphasis on structural connectivity while overlooking spatial variations in carbon benefits [22]. Second, research on ecological networks in regions with high human activity intensity, such as metropolitan areas and urban agglomerations, remains relatively limited, and there is a lack of optimization pathways tailored to the complexities of urban spatial structures and land use conflicts [17,23]. Third, most current ESP constructions fail to adequately address multi-objective synergies, particularly the trade-off mechanisms between ecological connectivity and carbon sink capacity [24]. Moreover, redundant corridors, broken nodes, and insufficient connectivity are common issues within ecological networks, significantly restricting the realization of carbon sink functions [18,25]. Therefore, there is an urgent need to establish an ecological network optimization system that integrates “structure-function-carbon benefits” to enhance the carbon sequestration potential and sustainability of megacity ecosystems [26,27]. To overcome these challenges, complex network theory provides new perspectives on the topological optimization of ecological security models [28]. By incorporating topological indicators such as degree centrality, betweenness centrality, and clustering coefficients into network analysis [14,29], it becomes possible to quantitatively evaluate the ecological cycling capacity of key nodes, offering structural support to enhance carbon sequestration [30]. In topologically optimized ecological networks, species migration becomes more efficient, vegetation restoration potential increases, and carbon storage capacity is significantly improved [31,32]. Therefore, investigating how metropolitan ecological networks affect carbon sequestration capacity can offer a scientific basis for network optimization, supporting carbon neutrality targets and advancing the sustainable development of regional ecosystems.
This study focuses on the CMA. Ecological sources were identified through a combination of Morphological Spatial Pattern Analysis (MSPA) and Conefor, incorporating ecological importance and ecological redline data. Potential ecological corridors were initially delineated using the Minimum Cumulative Resistance (MCR) model and further refined with the gravity model to construct the ecological security pattern. The resulting ecological network was abstracted into a topological structure, with ecological sources represented as nodes and corridors as edges. Carbon sequestration capacity was assessed using land use-specific carbon coefficients and analyzed relative to network topology. Key patches with degraded ecological function or low carbon sink capacity were identified, and an optimization strategy involving the addition of new corridors and stepping-stone nodes was proposed and verified through comparative analysis. This research aims to address three core scientific questions.
(1)
What were the spatial and temporal characteristics of the ecological network and carbon sink capacity in the CMA from 2000 to 2020?
(2)
Does a significant relationship exist between the topological structure of the ecological network and its carbon sink capacity?
(3)
What strategies can be developed to optimize the ecological network structure and improve carbon sink potential in metropolitan regions?

2. Materials and Methods

2.1. Study Area

The CMA is located in the western Sichuan Basin (102°49′–105°27′ E, 29°15′–31°42′ N), covering 33,114 km2 and encompassing four core cities: Chengdu, Deyang, Meishan, and Ziyang (Figure 1). As a densely populated and economically active region in western China, the CMA plays a pivotal role in the Yangtze River Economic Belt and the Belt and Road Initiative [33]. By 2022, it hosted over 31.2 million residents, contributed more than 38% of Sichuan Province’s GDP, and accounted for over 85% of its total carbon emissions [34,35]. The CMA also serves as an ecological barrier in the upper Yangtze River, encompassing key ecological zones such as the Longmen and Qionglai Mountains and Longquanshan Urban Forest Park [36]. However, rapid urbanization and transportation expansion have intensified landscape fragmentation and ecological degradation, substantially increasing carbon emissions. Thus, constructing a well-connected ecological network is vital for harmonizing urban development with ecological sustainability.

2.2. Data Source and Processing
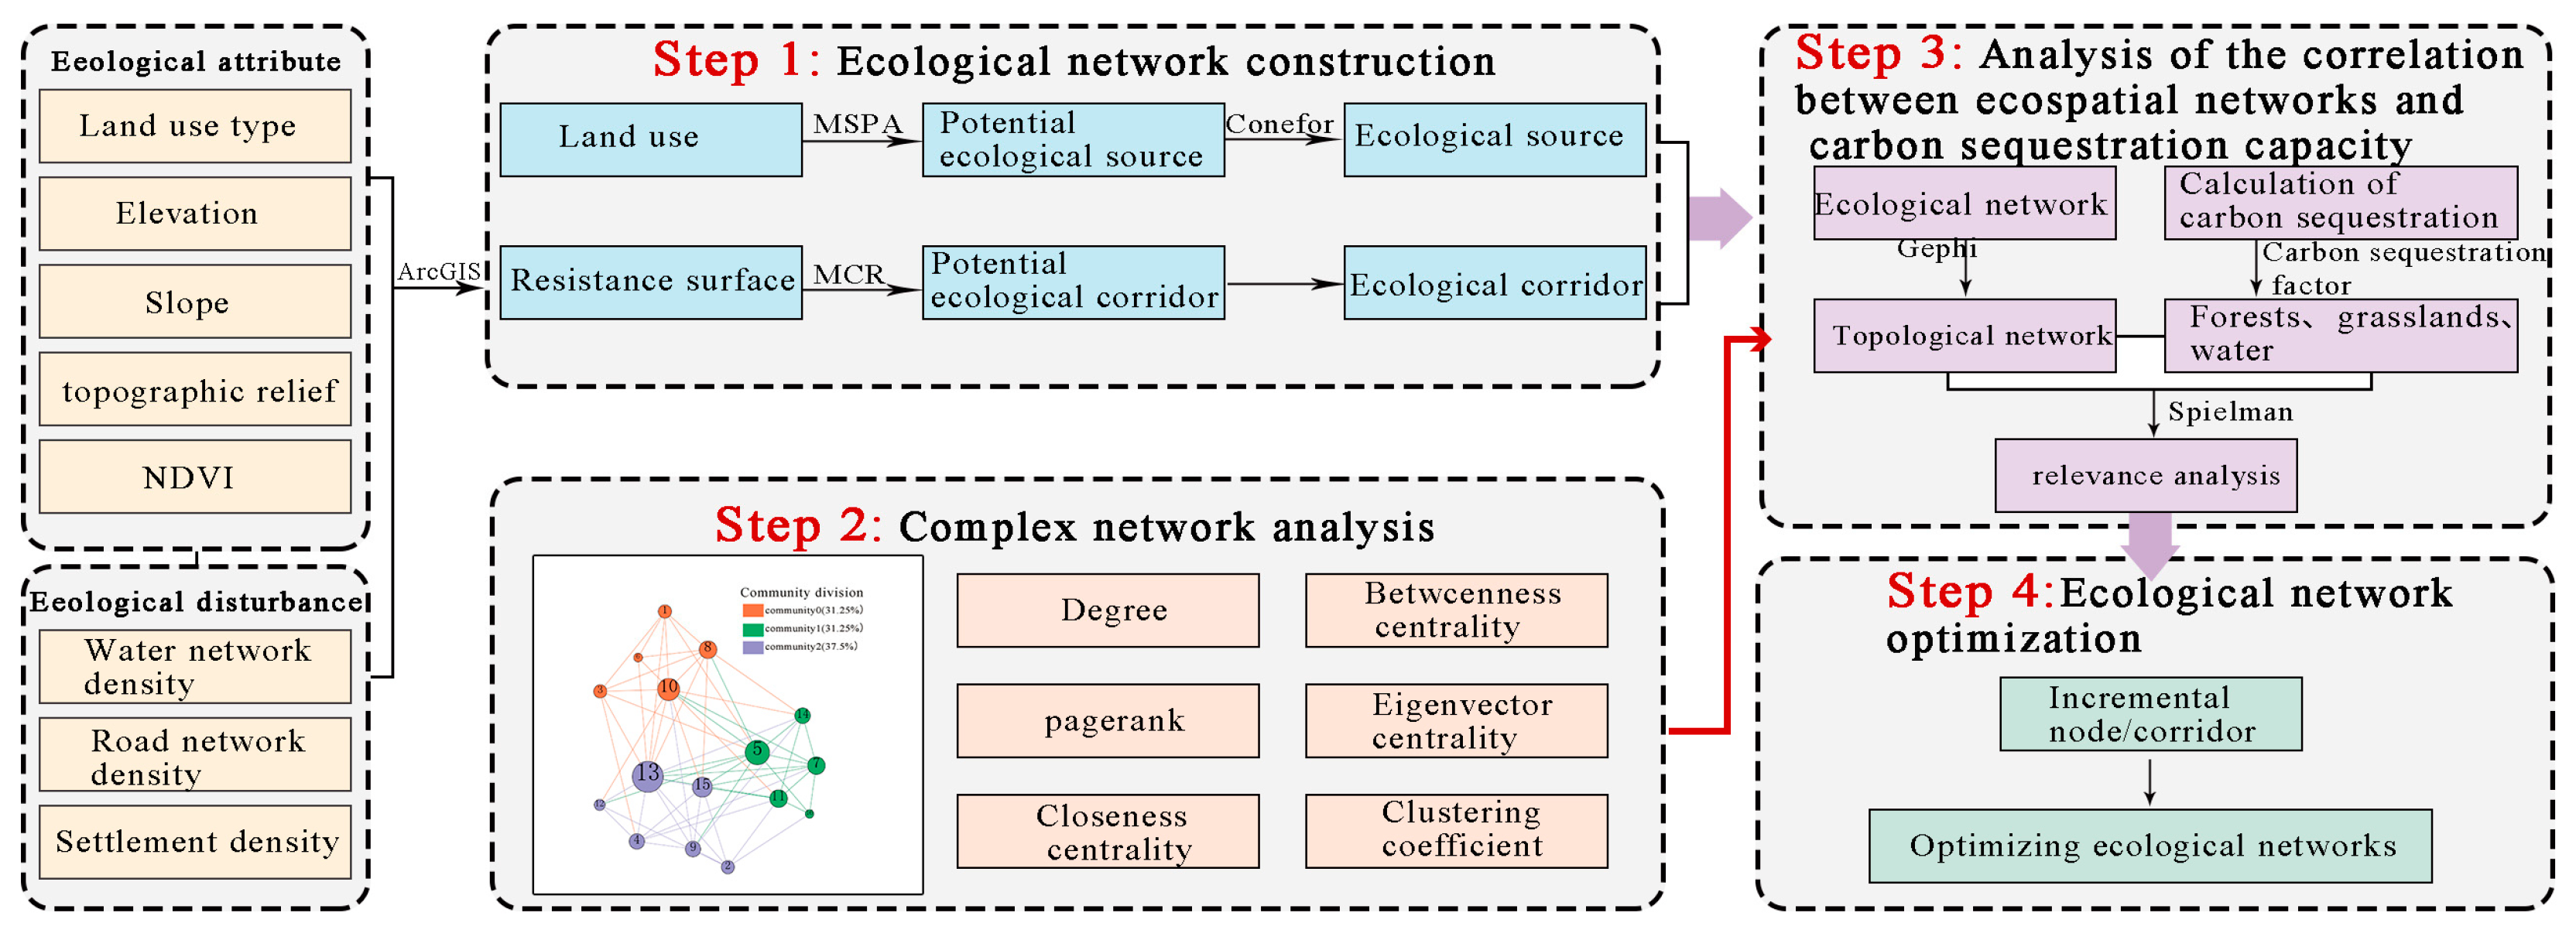
This study employed datasets spanning 2000 to 2020, all standardized to a 30 m × 30 m resolution to ensure consistency and comparability. The data included land use and land cover change (LUCC), Digital Elevation Model (DEM), slope, topographic relief, Normalized Difference Vegetation Index (NDVI), water bodies, roads, and population (Figure 2). LUCC data were derived from Landsat imagery and categorized into six classes. Slope and topographic relief were extracted from DEM data, while NDVI was calculated using spectral bands. Vector data for roads and water bodies were rasterized, and population data were interpolated. All datasets were resampled to match the resolution of land use data, ensuring spatial accuracy and analytical reliability (Table 1).

2.3. Methods

The research framework (Figure 3) begins by identifying ecological sources through MSPA and Conefor, integrating ecological importance and redline data. Potential corridors were delineated using the MCR model and further refined with the gravity model to construct the ecological security pattern. The network was then abstracted into a topological structure, with sources and corridors represented as nodes and edges, respectively. Carbon sequestration was estimated based on sequestration coefficients and correlated with network topology. Finally, key nodes exhibiting degraded ecological function or low carbon capacity were identified, and an optimization strategy involving edge augmentation and stepping-stone insertion was proposed.

2.3.1. Ecological Security Pattern Construction

(1)
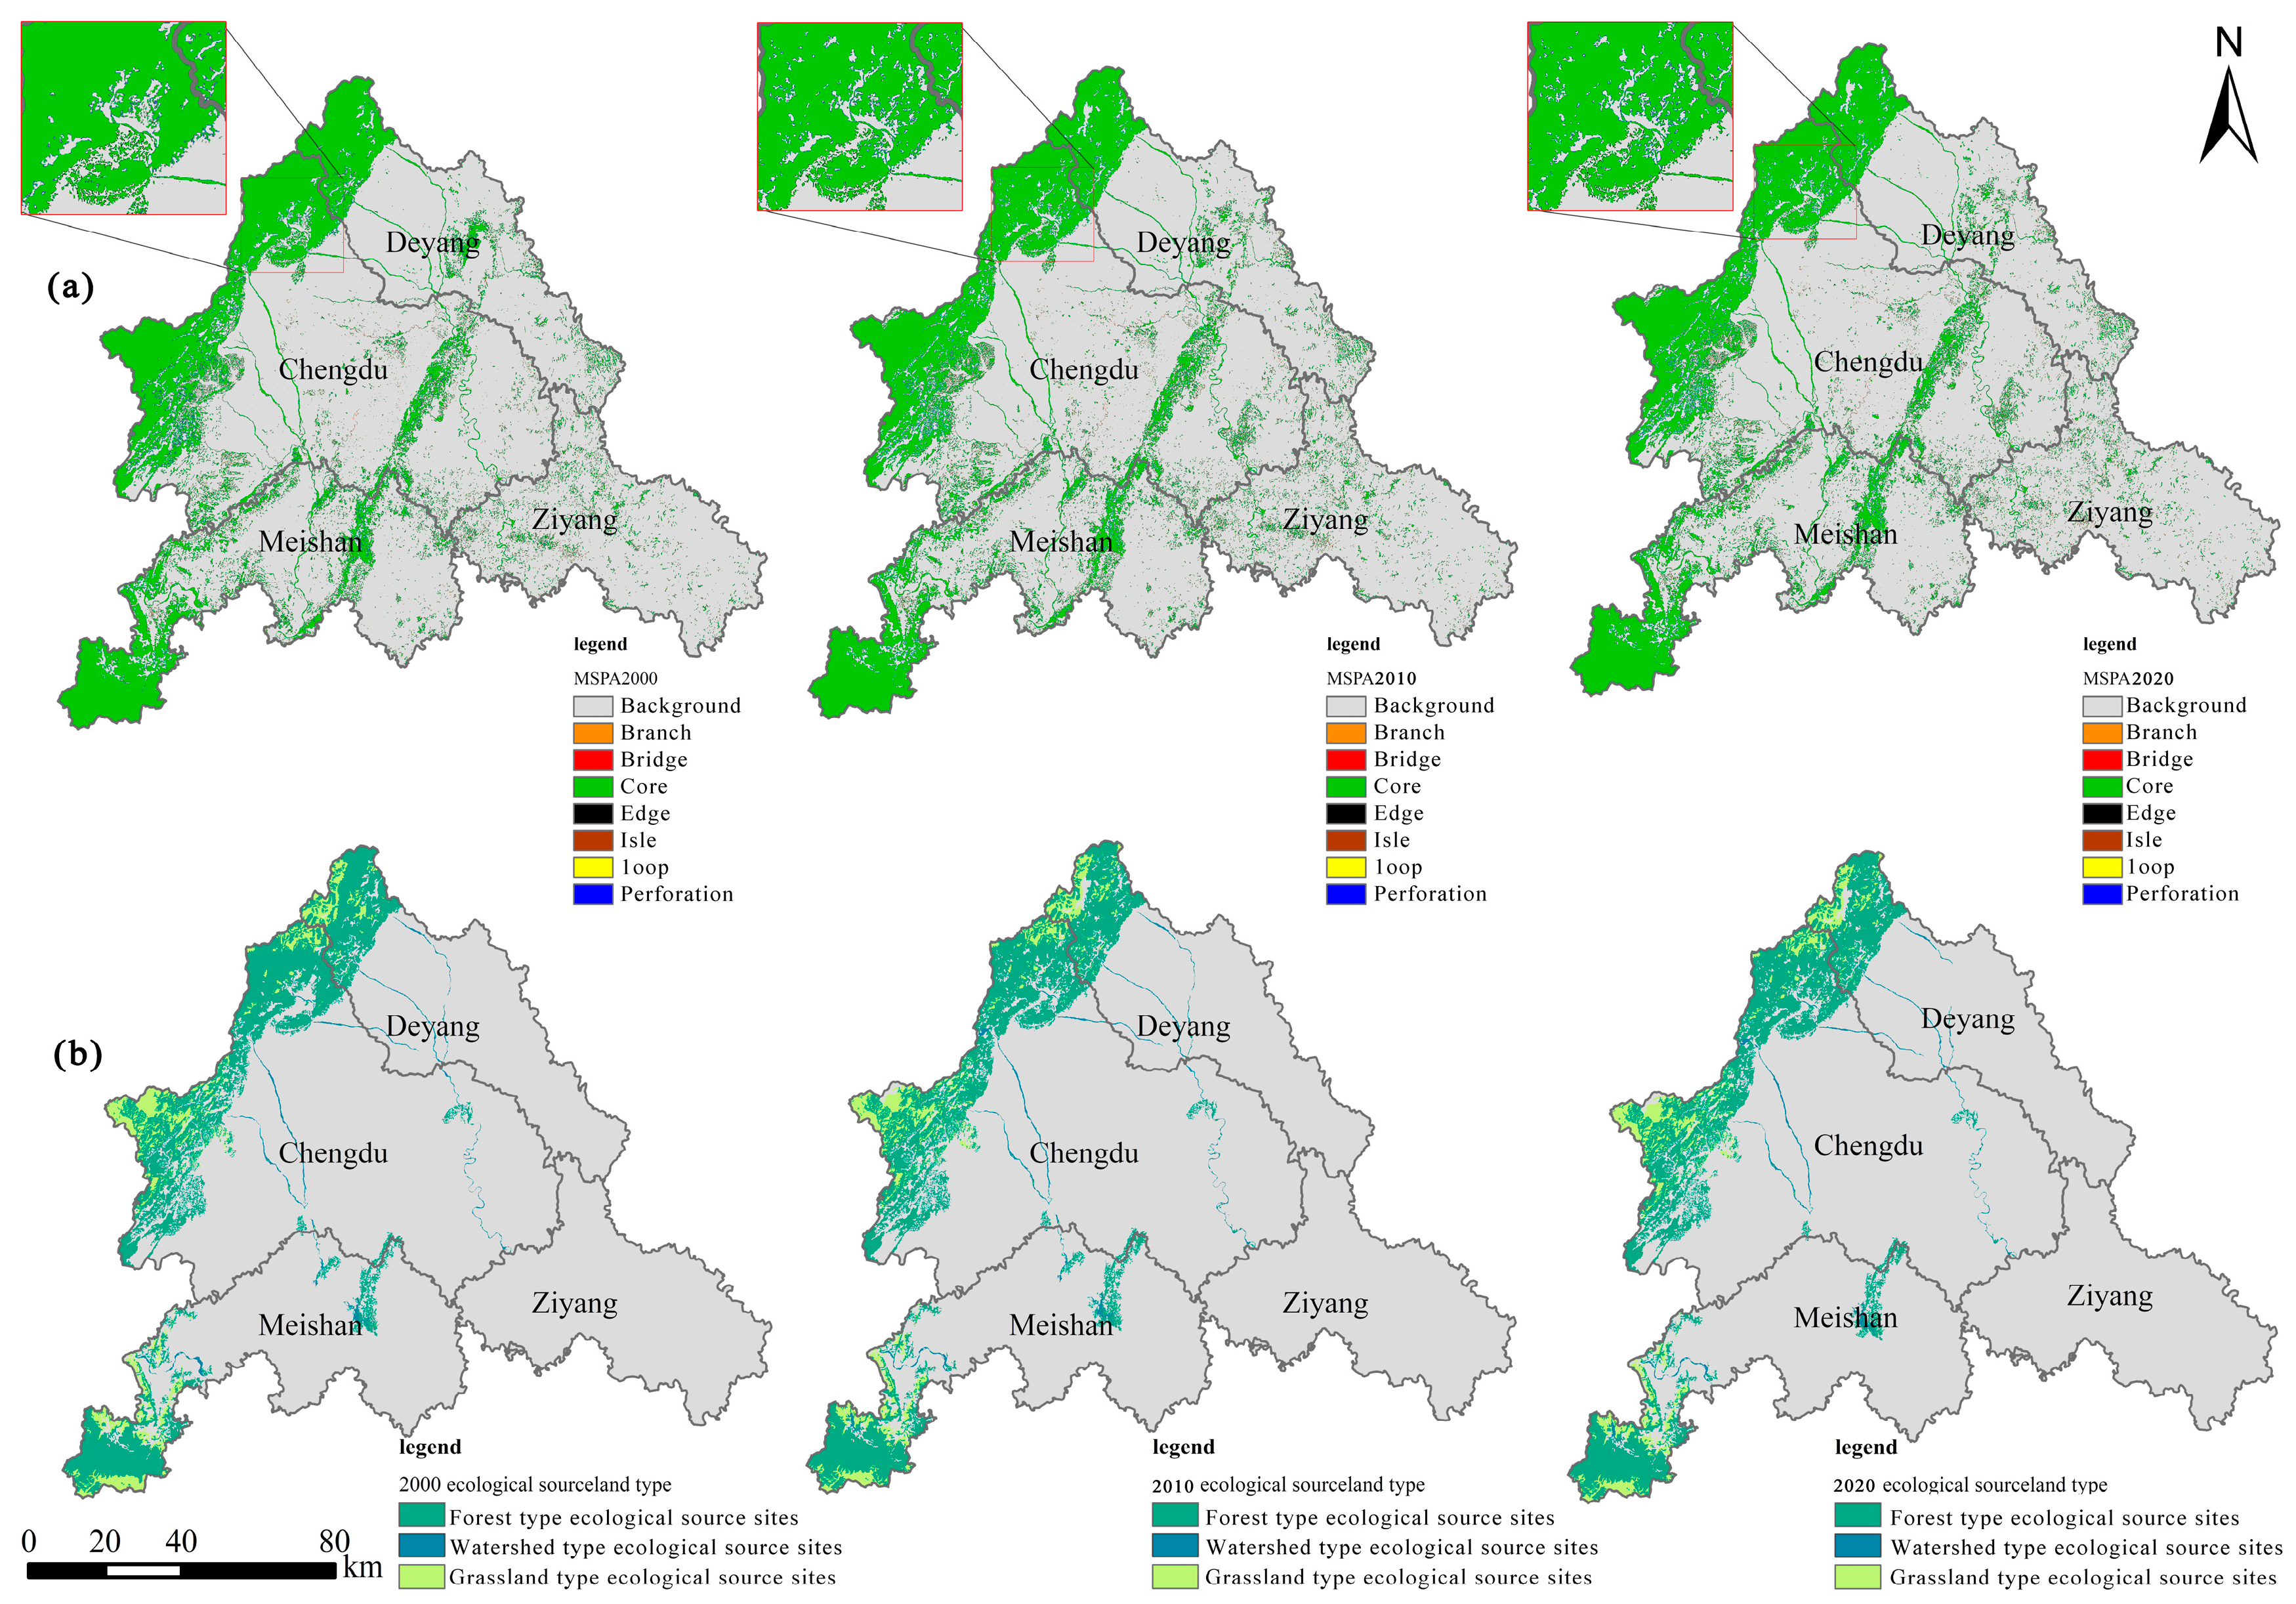
Identification of ecological sources based on MSPA
The Morphological Spatial Pattern Analysis (MSPA) method identifies ecologically significant patches within a study area using morphological algorithms [12]. Binary classification was performed in ArcGIS [5], and the data were processed in Guidos Toolbox 2.8, with forests, grasslands, and watersheds set as foreground, and cropland, unused land, and built-up areas as a background [37]. Landscape elements were classified into seven structural categories, including core, bridge, edge, and island. Given the extensive study area and high fragmentation, core patches larger than 2.5 km2 were selected as candidate ecological sources using the eight-neighborhood method. MSPA results were supplemented by calculating potential connectivity (PC) and patch importance index (dPC) in Conefor 2.6 [38], with a 1000 m threshold and 0.5 connectivity probability. Patches with dPC > 0.20 were intersected with ecological redline zones to identify final ecological sources, classified into forest, grassland, and water categories. The formula is as follows [39].
P C = i = 1 n j = 1 n a i a j p i j A L 2
d P C = P C P C r e m o v e P C × 100
where n is the number of patches, aᵢ and aⱼ represent the areas of patches i and j, Pᵢⱼ denotes the maximum dispersal probability between them, AL is the total landscape area, and PCremove is the connectivity index after patch removal.
(2)
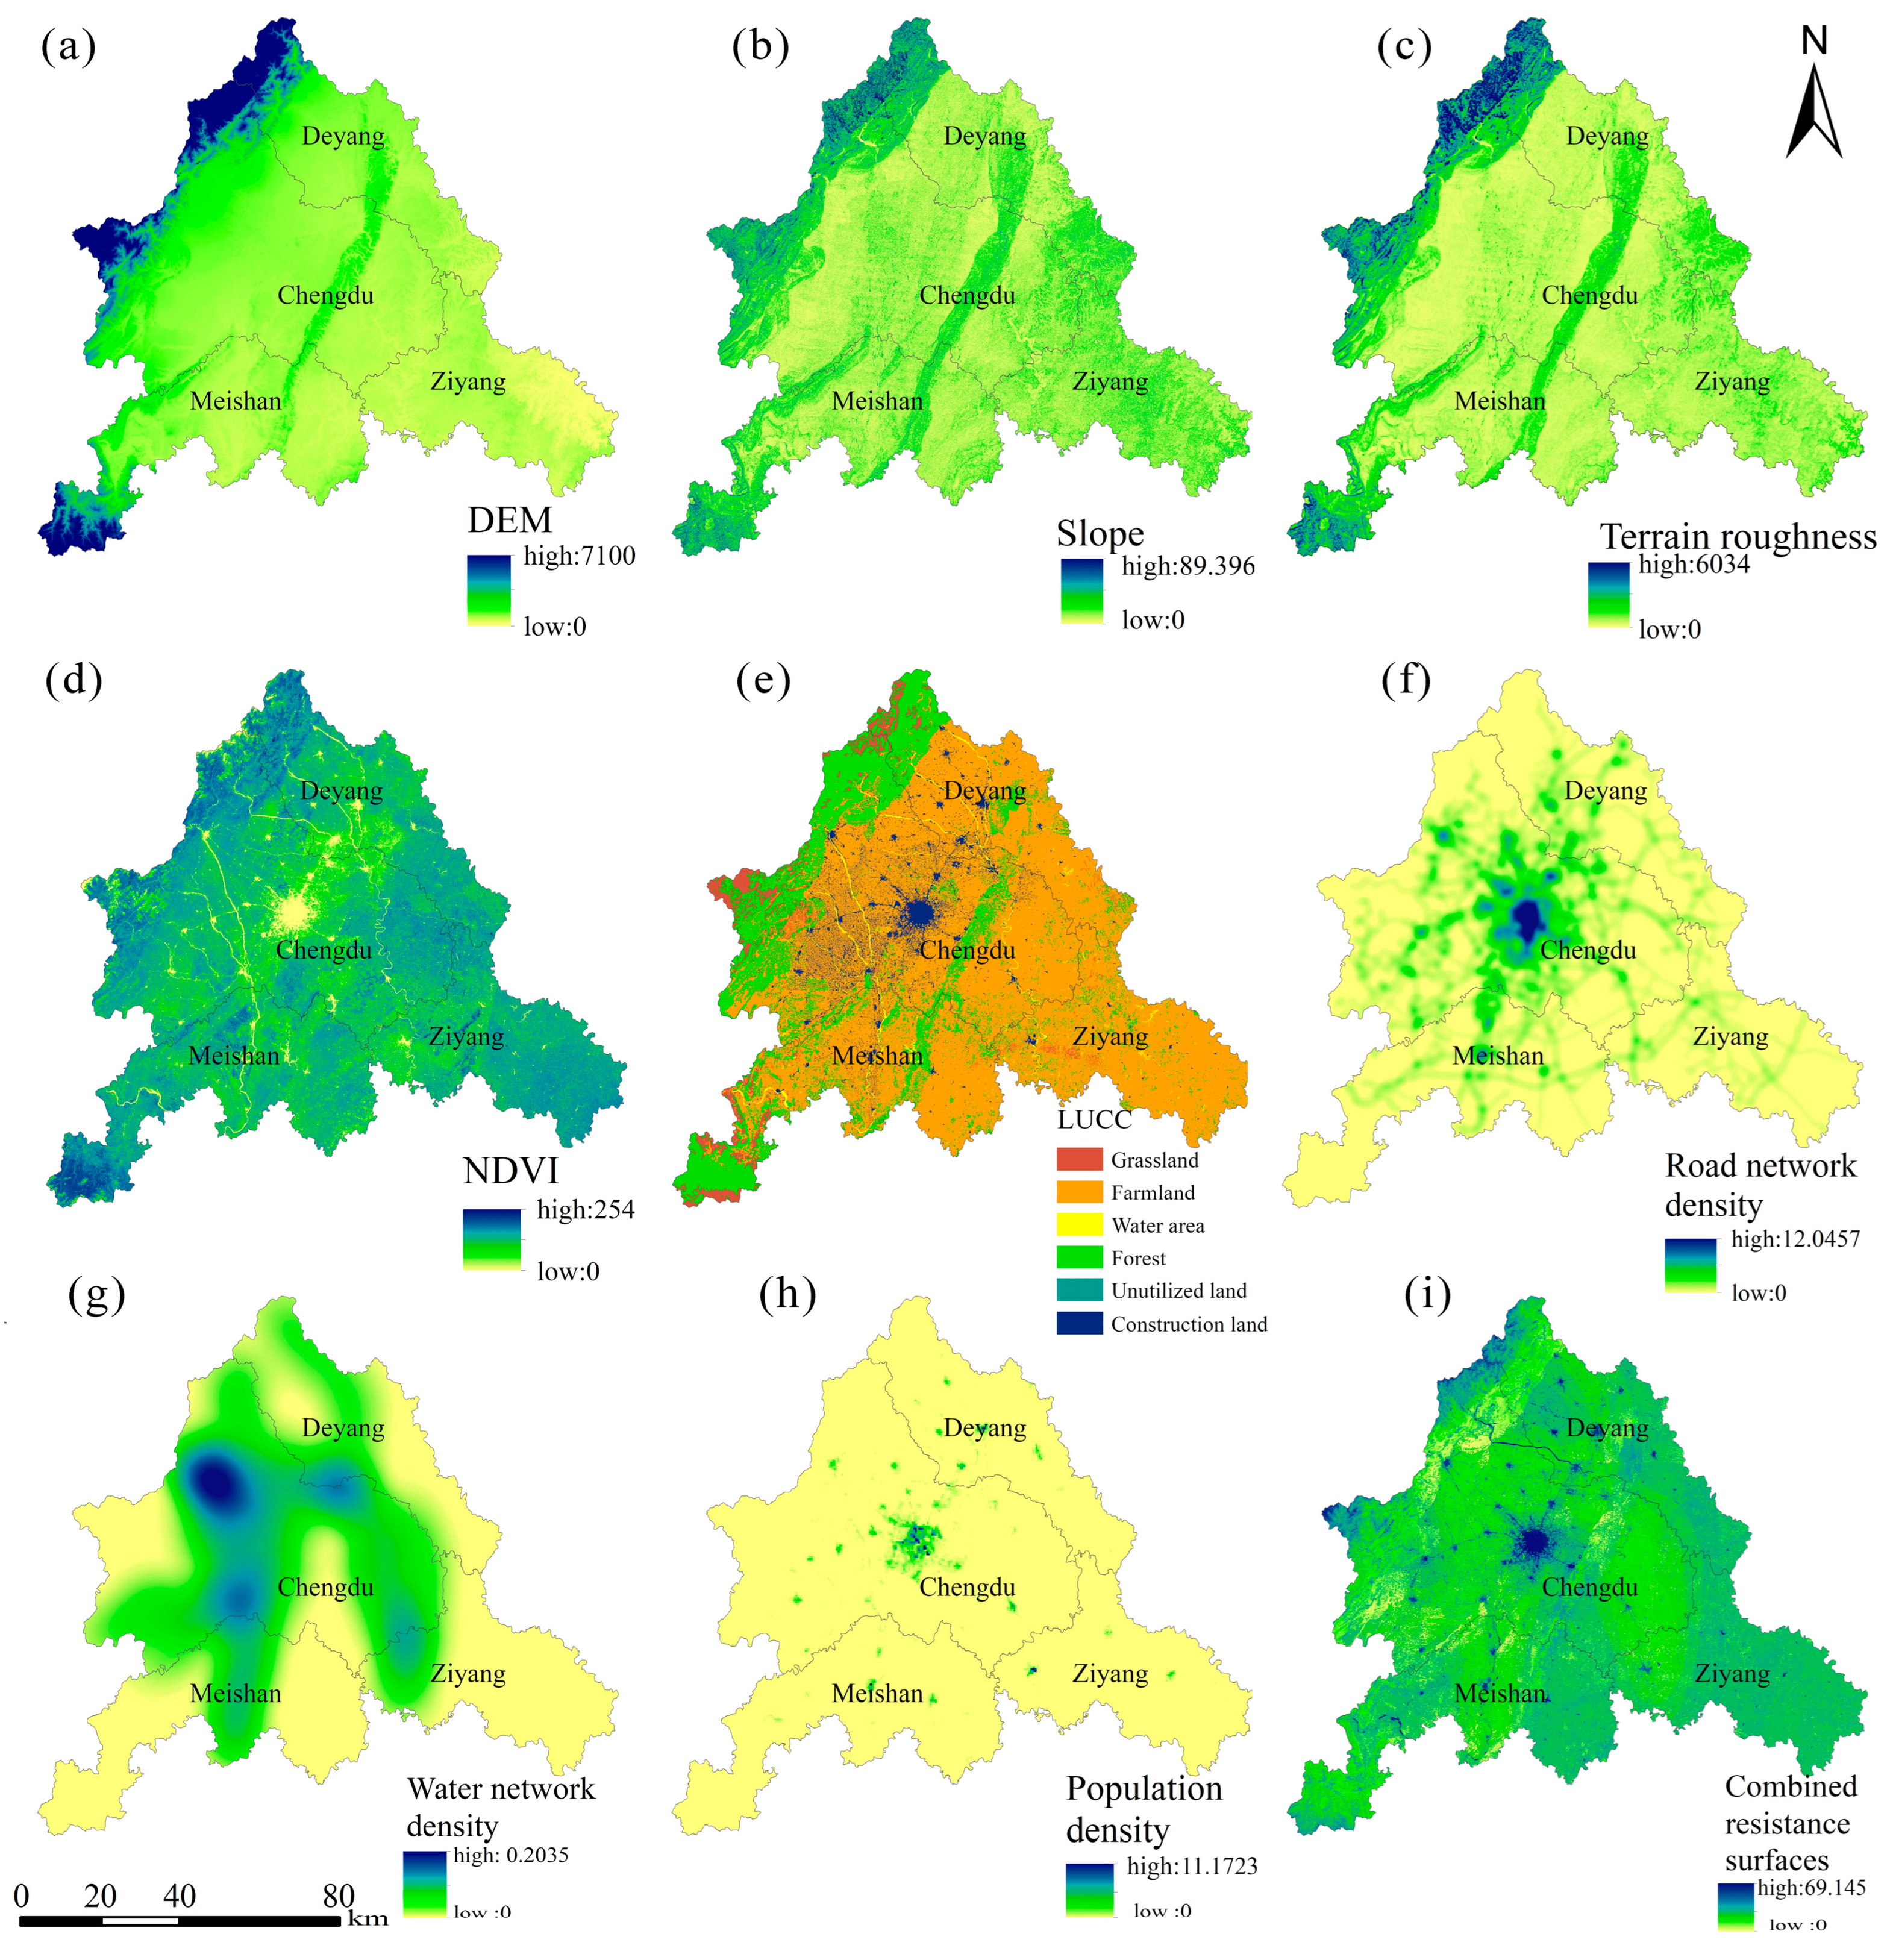
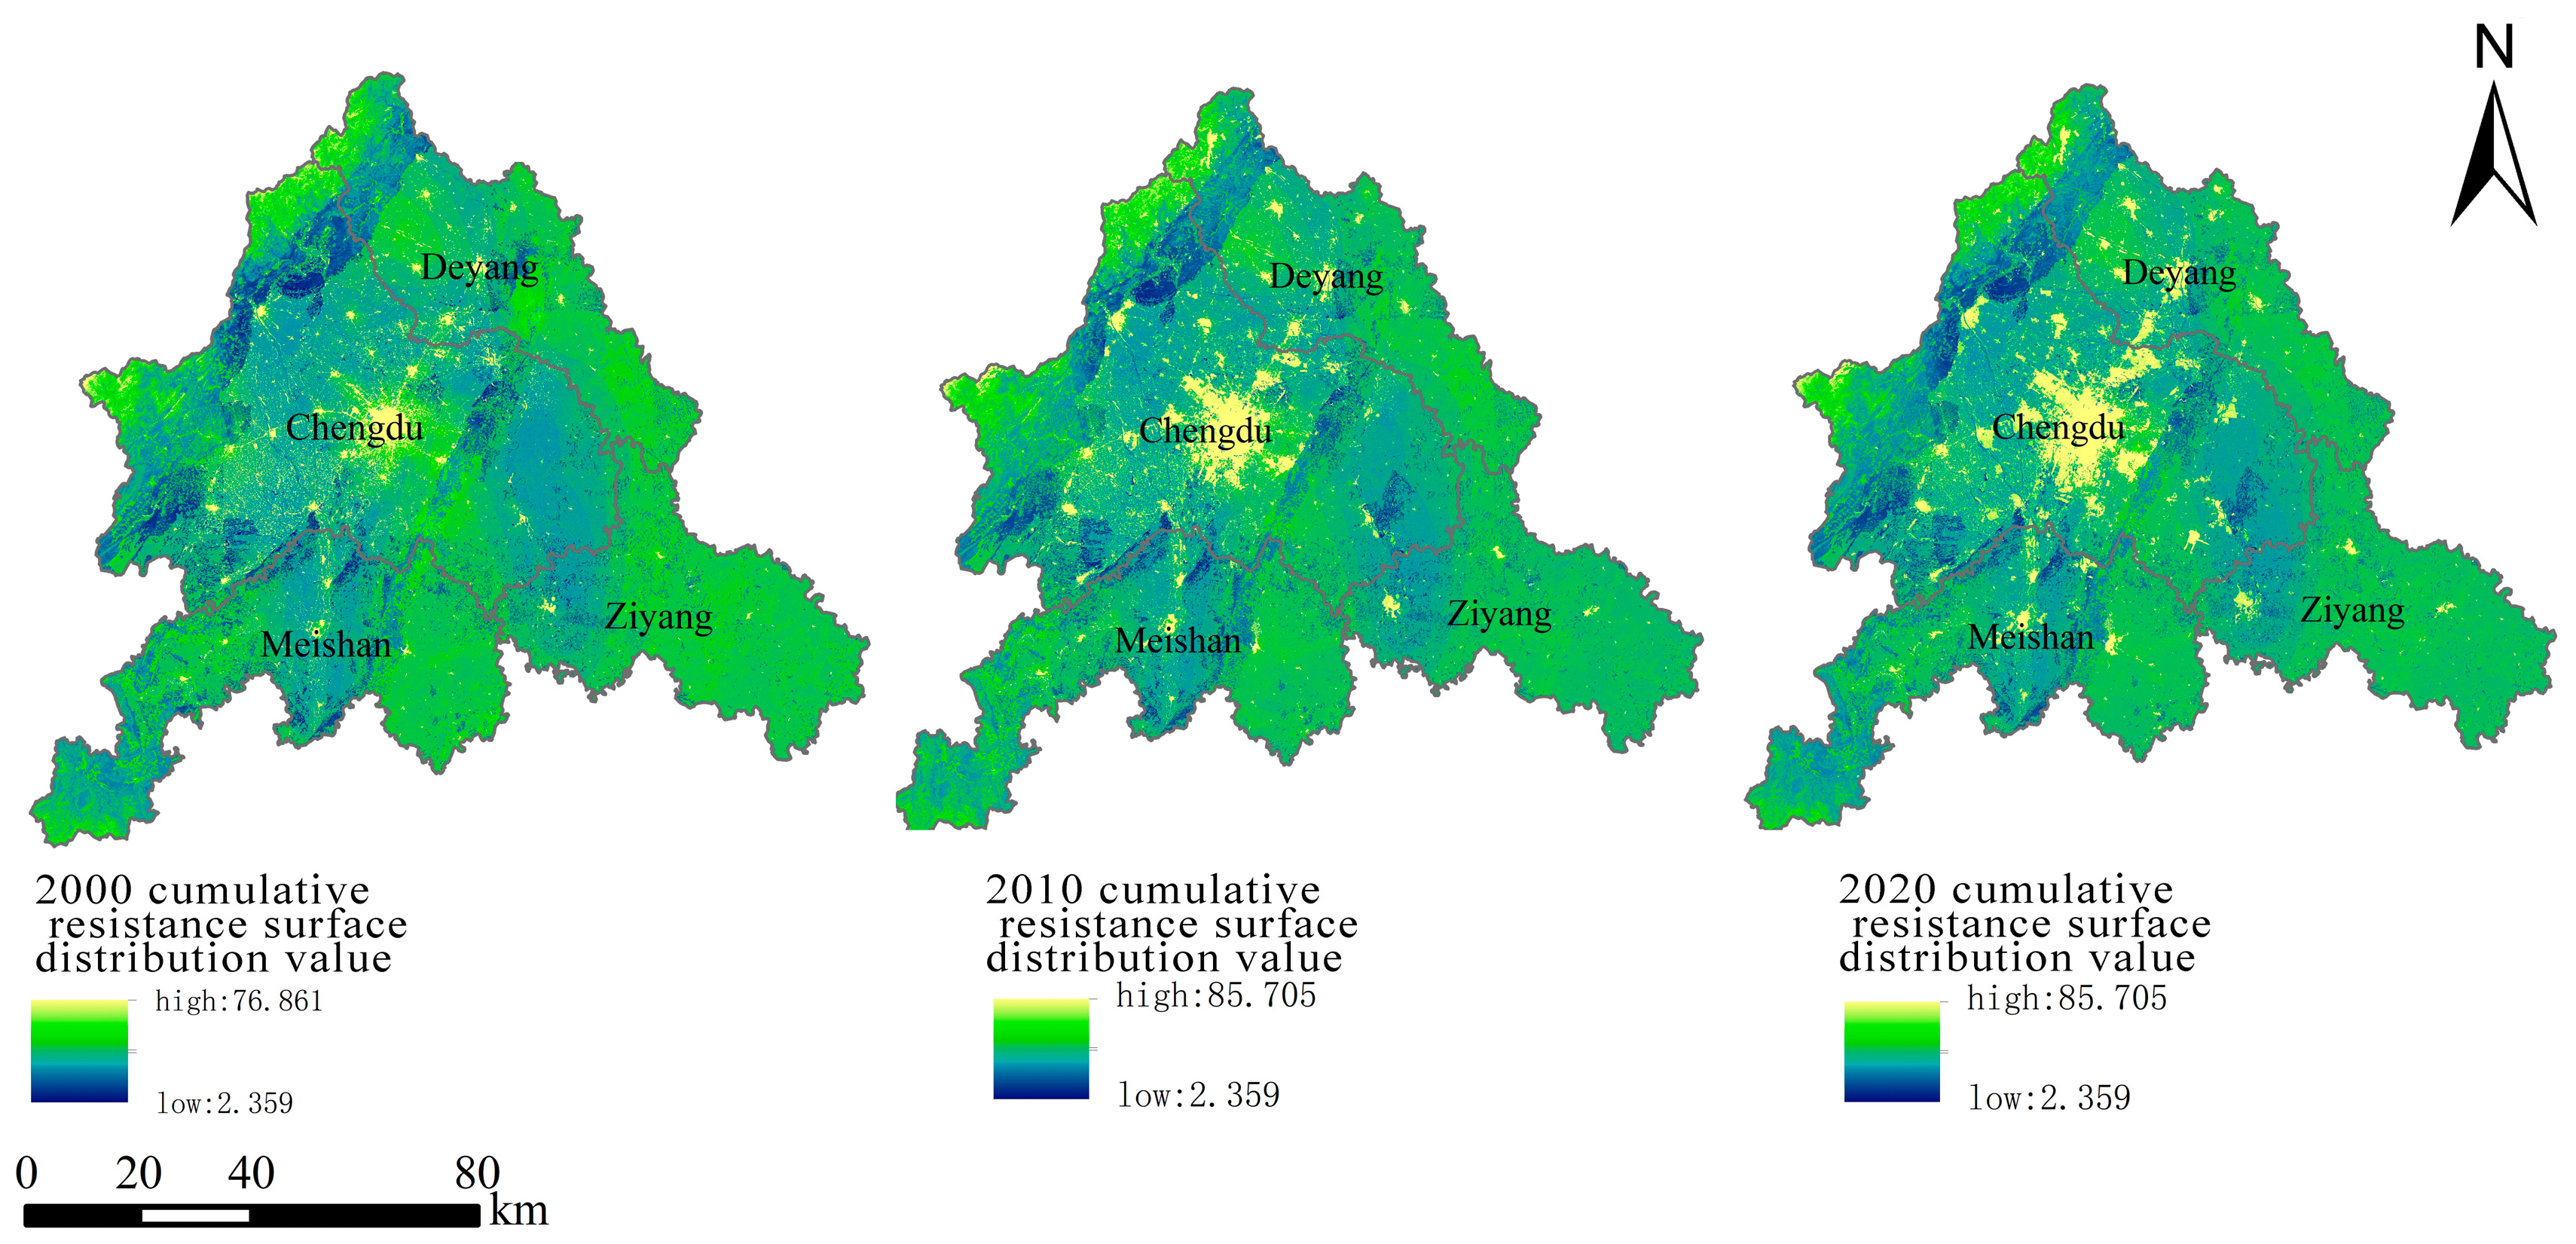
Constructing resistance surfaces
Resistance surfaces quantify the barriers to species and energy flows during horizontal migration [40]. Considering the specific characteristics of the Chengdu Metropolitan Area and prior studies, eight resistance factors were selected: DEM, slope, topographic relief, NDVI, LUCC, population density, water network density, and road network density. Each factor was classified and assigned values based on ecological sensitivity, combining expert judgment with literature review. The Analytic Hierarchy Process (AHP) was employed to determine the relative weights of these factors [18]. Subsequently, a weighted overlay analysis in ArcGIS 10.2 was performed to generate the composite ecological resistance surface (Table 2).
(3)
Extraction of potential ecological corridors
The minimum cumulative resistance (MCR) model, originally proposed by Dutch ecologist Knaapen [41], quantifies the least-cost path required for material or species flow between ecological sources. It is widely applied in ecological corridor design to enhance connectivity and ecosystem functionality [42]. In this study, ecological sources and resistance surfaces were utilized to calculate minimum resistance paths, thereby identifying potential corridors within the Chengdu Metropolitan Area. These calculations were conducted using the Cost Path tool in ArcGIS 10.2 [25]. The MCR formula is presented as follows [43]:
V M C R = f m i n j = n t = m D t j × R t
where f represents a positive function indicating the cumulative resistance from a spatial unit to all ecologically favorable source patches. Dtj is the distance between landscape unit t and source patch j, Rt denotes the resistance of unit t, and min is the minimum cumulative resistance to any ecological source patch.
(4)
Screening ecological corridors
The Gravity Model (GM) is widely utilized to identify ecological corridors by quantifying the interaction strength between landscape patches [44]. Higher gravity values indicate lower ecological resistance and greater connectivity, underscoring the importance of corridors linking ecological sources [45]. By applying the GM, key corridors can be prioritized to maintain ecological integrity and enhance landscape-scale connectivity. The GM formula is presented as follows [46]:
G a b = N a N b D a b 2 = L m a x 2 l n S a l n S b L a b 2 P a P b
Gab denotes the interaction force between patches a and b. Na and Nb represent the weight coefficients of these patches. Dab represents the standardized resistance of the ecological corridor between them, while Lmax denotes the highest resistance observed in the study area. Sa, Sb, Pa, and Pb represent the area and resistance of patches a and b, respectively. Lab indicates cumulative corridor resistance.

2.3.2. Ecospatial Network Topology

The ecological spatial network integrates ecological network and complex network theories, abstracting ecological sources and corridors as nodes and edges [47]. Network modeling was conducted using Gephi 0.10.0, a Java-based visualization tool. The landscape was transformed into an undirected ecological network and analyzed through six topological indicators: degree, betweenness centrality, closeness centrality, clustering coefficient, eigenvector centrality, and PageRank [39]. These metrics reveal interactions between ecological sources and network nodes, supporting spatial structure characterization [48]. Moreover, by linking network topology with carbon sequestration capacity, this method facilitates the identification of optimization strategies for ecological restoration and carbon enhancement (Table S1).

2.3.3. Calculation of Carbon Sequestration Capacity

Different land use types exhibit varying carbon sequestration potentials within the carbon cycle (Table 3). Natural ecosystems such as forests, shrublands, grasslands, lakes, and wetlands are widely recognized as major carbon sinks [20,49]. In this study, the carbon sink capacity of ecological sources was estimated using carbon sequestration coefficients derived from land use classifications and previous studies conducted in China [50]. The primary land types in this study: forests, grasslands, and watersheds play a vital role in regulating the regional carbon cycle. To quantify their contributions, carbon sequestration coefficients for each land type were calculated based on established methodologies [51].
C t = i = 1 n A i S i
where Ct is the total amount of sequestered carbon; i is the land use type; A is the land area; and S is the sequestration factor.

3. Results

3.1. Ecological Security Pattern Construction and Analysis

3.1.1. Identification and Analysis of Ecological Source Site

The core area, identified as potential ecological source land through MSPA, covered 6762.18 km2 in 2000, 6780.32 km2 in 2010, and 6740.11 km2 in 2020, reflecting a slight increase followed by a decline over the 20-year period. This trend suggests localized degradation of ecological patterns under continued urbanization. These core ecological sources are primarily located in the Longmen, Qionglai, and Longquan mountain ranges, as well as the Minjiang and Tuojiang river basins. They substantially overlap with ecological redline areas and function as key zones for maintaining regional ecological security and supporting carbon sequestration. In contrast, ecological patches in the central and eastern CMA are highly fragmented. Some ecological sources fall outside the redline boundaries and are mainly situated on the urban fringe, where severe patch fragmentation forms potential blind spots in ecological protection. Rapid urban expansion has disrupted ecological corridors, weakened landscape connectivity, constrained ecosystem carbon sink capacity, and created spatial ecological gaps, resulting in stronger ecological performance in the west and weaker in the east (Figure 4).
Using Conefor 2.6, woodlands, grasslands, and water bodies larger than 0.25 km2 were selected, resulting in 16, 15, and 14 key patches (dPC > 0.2) across the three periods. These patches are primarily located in the southwestern part of the metropolitan area and serve as core ecological nodes that make the greatest contributions to landscape connectivity and carbon sink functionality. Based on dPC values and spatial characteristics, ecological sources were categorized into three levels: important, general, and secondary.

3.1.2. Analysis of Resistance Surfaces

The ecological resistance surface of the CMA for 2000, 2010, and 2020 was modeled using eight factors, including LUCC, DEM, and slope (Figure 5). Results indicated that overall ecological resistance increased between 2000 and 2010 due to rapid urban expansion and intensified human activities. From 2010 to 2020, resistance changes stabilized, suggesting a saturation of development intensity. Ecological resistance exhibited a distinct “high-center, low-edge” spatial pattern. High ecological resistance is primarily observed in the urban core of Chengdu and adjacent cities, including southern Deyang and central Ziyang. In these areas, high population density, extensive transportation infrastructure, and concentrated industrial activities collectively contribute to elevated resistance levels. Medium-resistance areas were located in urban–rural transition zones, including northeastern Deyang and southeastern Meishan, where development and natural landscapes are interwoven, and ecological risk remains uncertain. Low-resistance zones were primarily found in the forested Longmen, Qionglai, and Longquan Mountains, and in wetland and river valley regions around the Minjiang and Tuojiang Rivers, where ecological connectivity remains strong.

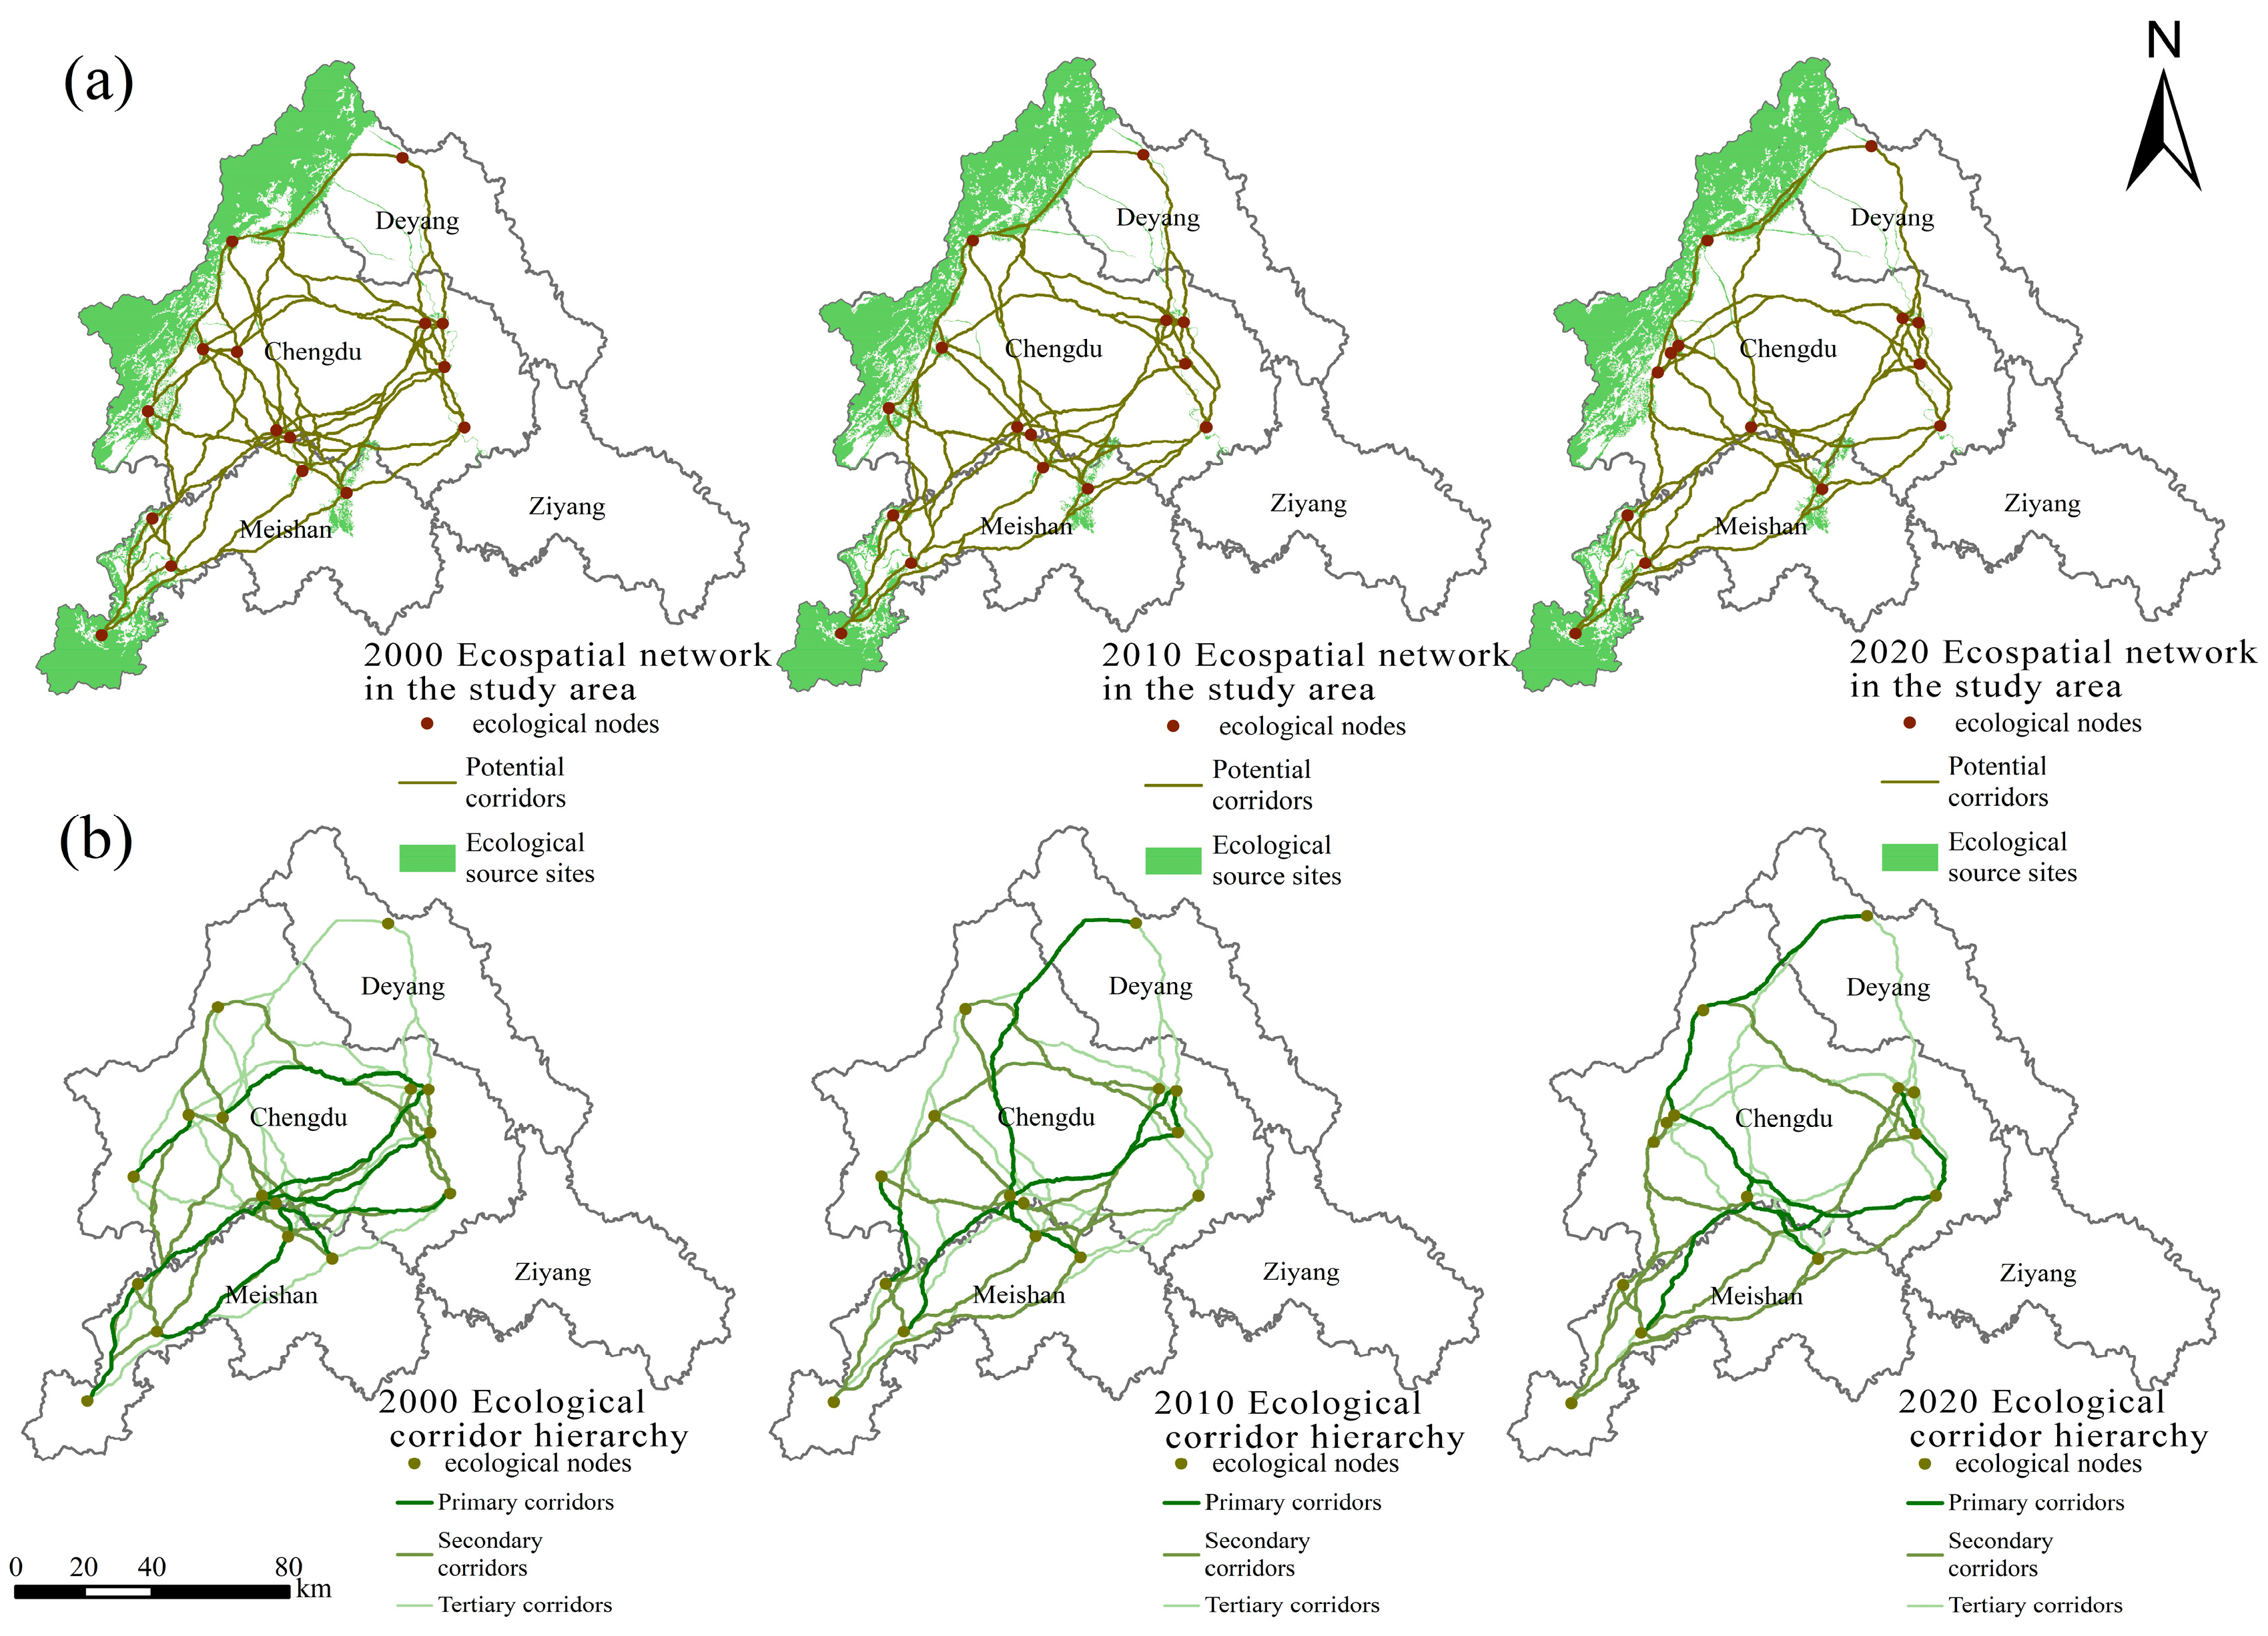
3.1.3. Ecological Corridor Analysis

Using the cost-path model and the iterative tool in ArcGIS, 120 potential ecological corridors were identified in 2000, 105 in 2010, and 91 in 2020, indicating a significant downward trend (Figure 6). This decline is primarily attributed to the reduction in ecological source areas and increased landscape fragmentation driven by urban expansion. Ecological corridors are primarily distributed in the Longmen and Qionglai Mountains to the west, and in Longquanshan Forest Park to the east, forming a spatial pattern characterized by edge concentration and central sparsity. The central city of Chengdu, eastern Deyang, Ziyang, and southeastern Meishan exhibited sparse corridor distributions and fragmented networks with weak connectivity. The significance of each ecological corridor was assessed using the GM. Corridors were categorized into primary, secondary, and general levels (Tables S2–S4). The number of primary corridors remained relatively stable (8–10), while secondary and general corridors decreased, reflecting a trend of increasing simplification and reduced redundancy. Priority should be given to restoring ruptured areas and establishing “stepping-stone” nodes to enhance network connectivity and carbon sink capacity.

3.2. Topological Characteristics of the Ecospatial Network

3.2.1. Topological Network Structure Overview

Ecological sources identified between 2000 and 2020 were represented as nodes, while ecological corridors connecting these sources were modeled as edges, thereby constructing the topological structure of the ecological network. The resulting network topology was analyzed and visualized using Gephi 0.10.0. The results revealed that the ecological network in the study area experienced significant structural transformations over the 20-year period (Figure 7). At a resolution of 1.0, the network consisted of three ecological communities in both 2000 and 2010, which decreased to two in 2020, indicating a decline in landscape heterogeneity and a weakening of ecological connectivity. This change is largely attributed to the loss of ecological corridors due to expanding construction land, which has diminished the region’s carbon sink capacity. Further analysis showed that the spatial distribution of ecological communities aligns with the ecological resilience pattern of the Chengdu metropolitan area: the network remained relatively stable in the central and western regions, whereas ecological degradation in the eastern and southeastern areas disrupted energy and material flows, reducing the potential for ecological restoration.

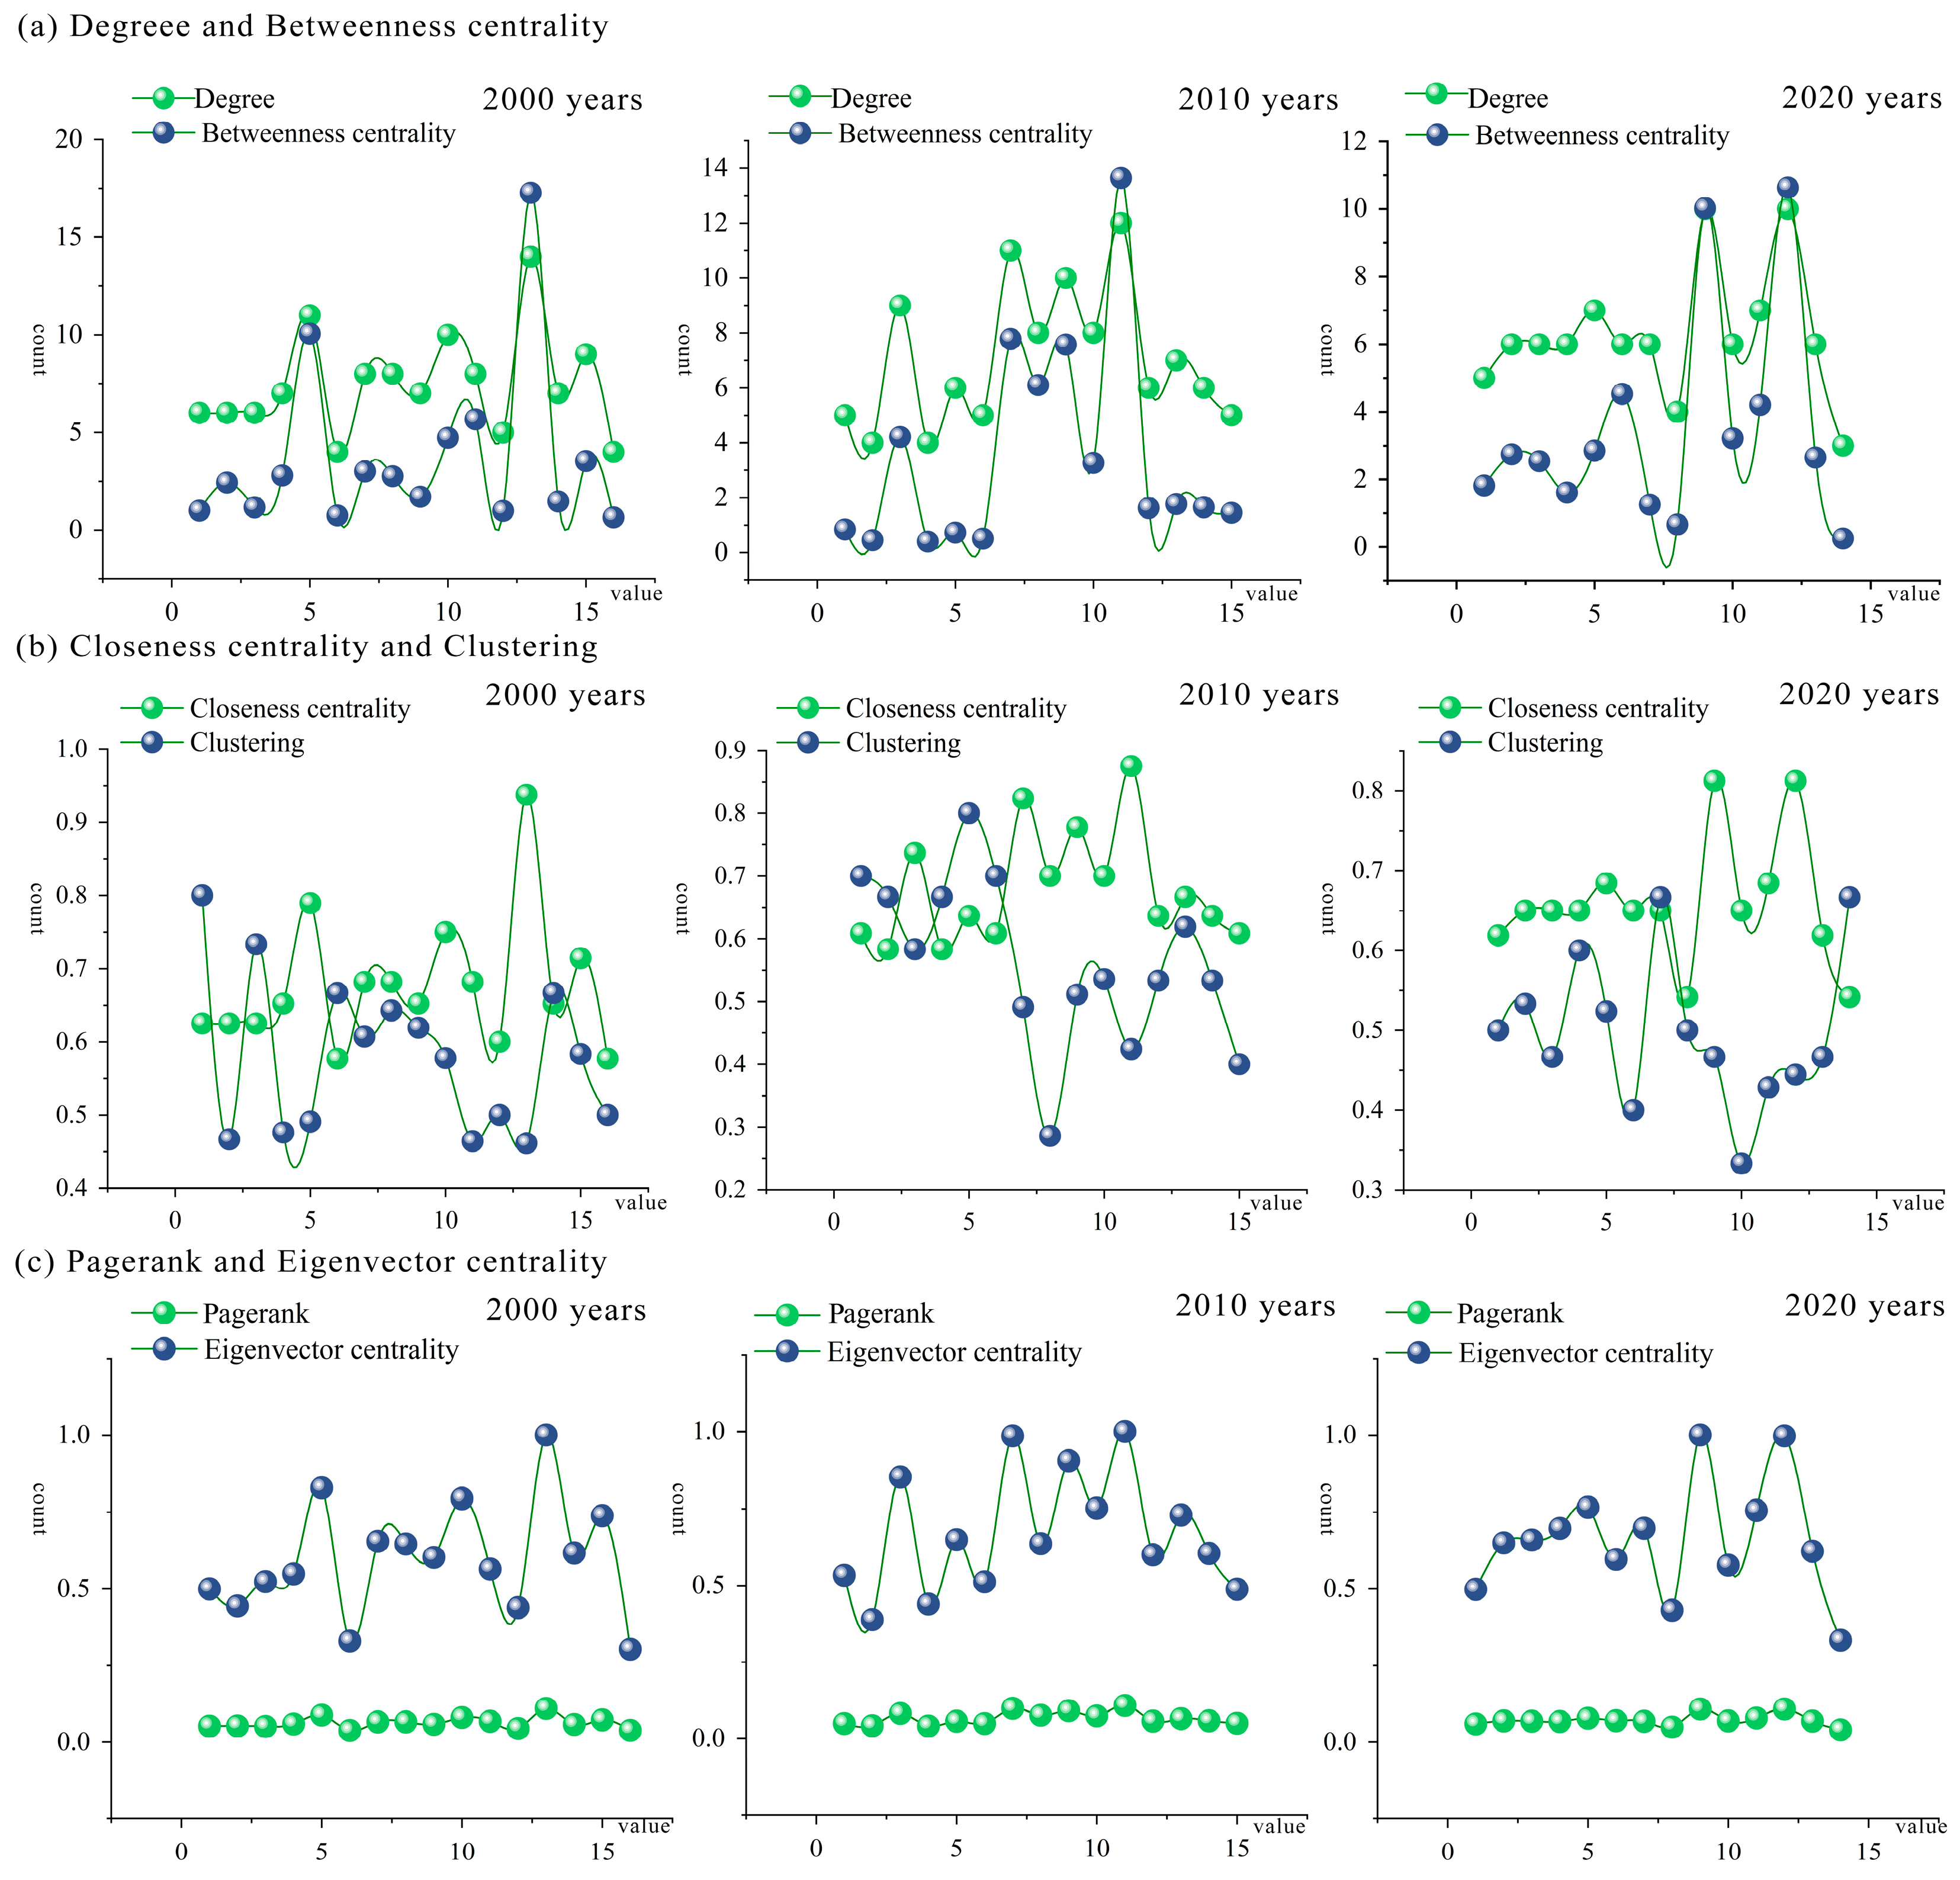
3.2.2. Degree and Betweenness Centrality

Degree centrality reflects the number of direct connections a node has with surrounding nodes, while betweenness centrality indicates its role as a bridge within the network. Analysis conducted using Gephi 0.10.0 revealed a consistent decrease in the average values of both metrics from 2000 to 2020 (Table 4), indicating weakened connectivity, diminished structural redundancy, and increased ecological vulnerability (Figure 8a). Nodes 5, 10, and 14 in 2000, and nodes 9 and 12 in 2020, showed high values in both metrics, serving as crucial bridges for ecological flow and carbon transfer. The degradation of these nodes could diminish the carbon sequestration capacity of adjacent ecological sources.
Therefore, optimizing the ecological network should emphasize the preservation of these structurally vital nodes and incorporate them into Chengdu’s “Carbonwise Tianfu” carbon credit mechanism through targeted compensation and incentive policies to channel resources toward high carbon sink potential areas [57].

3.2.3. Proximity Centrality and Clustering Coefficients

Closeness centrality measures the average shortest path from a node to all other nodes, reflecting its spatial accessibility, while the clustering coefficient indicates the degree of local aggregation around a node. From 2000 to 2020, both indicators showed an overall declining trend (Table 4), suggesting increased distances between ecological sources and a more fragmented local structure (Figure 8b). Nodes 5, 11, and 13 (2000); 7, 9, and 15 (2010); and 6 and 10 (2020) exhibited low clustering coefficients, indicating weak local connectivity, limited carbon sequestration efficiency, and reduced system stability.
It is recommended to prioritize corridor construction in these areas to enhance local connectivity and designate them as priority restoration zones under Chengdu’s “Carbonwise Tianfu” mechanism, promoting resource investment through market-based carbon incentives.

3.2.4. Eigenvector Centrality and PageRank

Eigenvector centrality measures a node’s connection to other influential nodes, while PageRank indicates its importance in a random walk process. Both indicators peaked in 2010 and had slightly declined by 2020 (Table 4), suggesting a weakening of the network’s structural hierarchy under external disturbances (Figure 8c). Nodes 5, 10, 13, and 15 in 2000, and nodes 5, 9, 11, and 12 in 2020, had high PageRank values, functioning as key components for maintaining structural integrity and carbon linkages. In contrast, peripheral nodes 8 and 14 in 2020 showed low values, indicating limited contributions to carbon sinks.
Therefore, conservation efforts should prioritize high-impact nodes while also enhancing the functional role of low-centrality nodes. It is recommended to incorporate this approach into Chengdu’s “Carbonwise Tianfu” initiative by establishing a mechanism that couples carbon value with network topological influence.

3.3. Correlation Analysis Between Carbon Sequestration Calculations and Ecological Network Structure

3.3.1. Calculation of Carbon Sequestration

Ecological source areas were categorized into forest, grassland, and water bodies based on their corresponding land use types. Carbon sequestration was estimated for 16, 15, and 14 source sites within the CMA in the years 2000, 2010, and 2020, respectively, by applying land use-specific carbon coefficients (Table 2), with corresponding proportions shown in (Table 5). The results indicate a decline in both the total number of ecological source sites and the overall carbon sequestration capacity over the past two decades, primarily due to the reduction in source area numbers. Despite some variation in the carbon uptake of grasslands and aquatic systems, forests consistently contributed more than 87% of total sequestration, maintaining a dominant role. Spatially, ecological assets were concentrated in forested and grassland-covered zones such as the Longmen Mountains, Qionglai Range, Longquanshan Forest Park, and the Tuojiang River Basin. In contrast, areas such as central Chengdu, southeastern Deyang, and Ziyang exhibited limited ecological land, thus constraining regional sequestration potential. Strengthening both the quantity and quality of ecological source areas is critical to enhancing the carbon sink capacity of the metropolitan area.

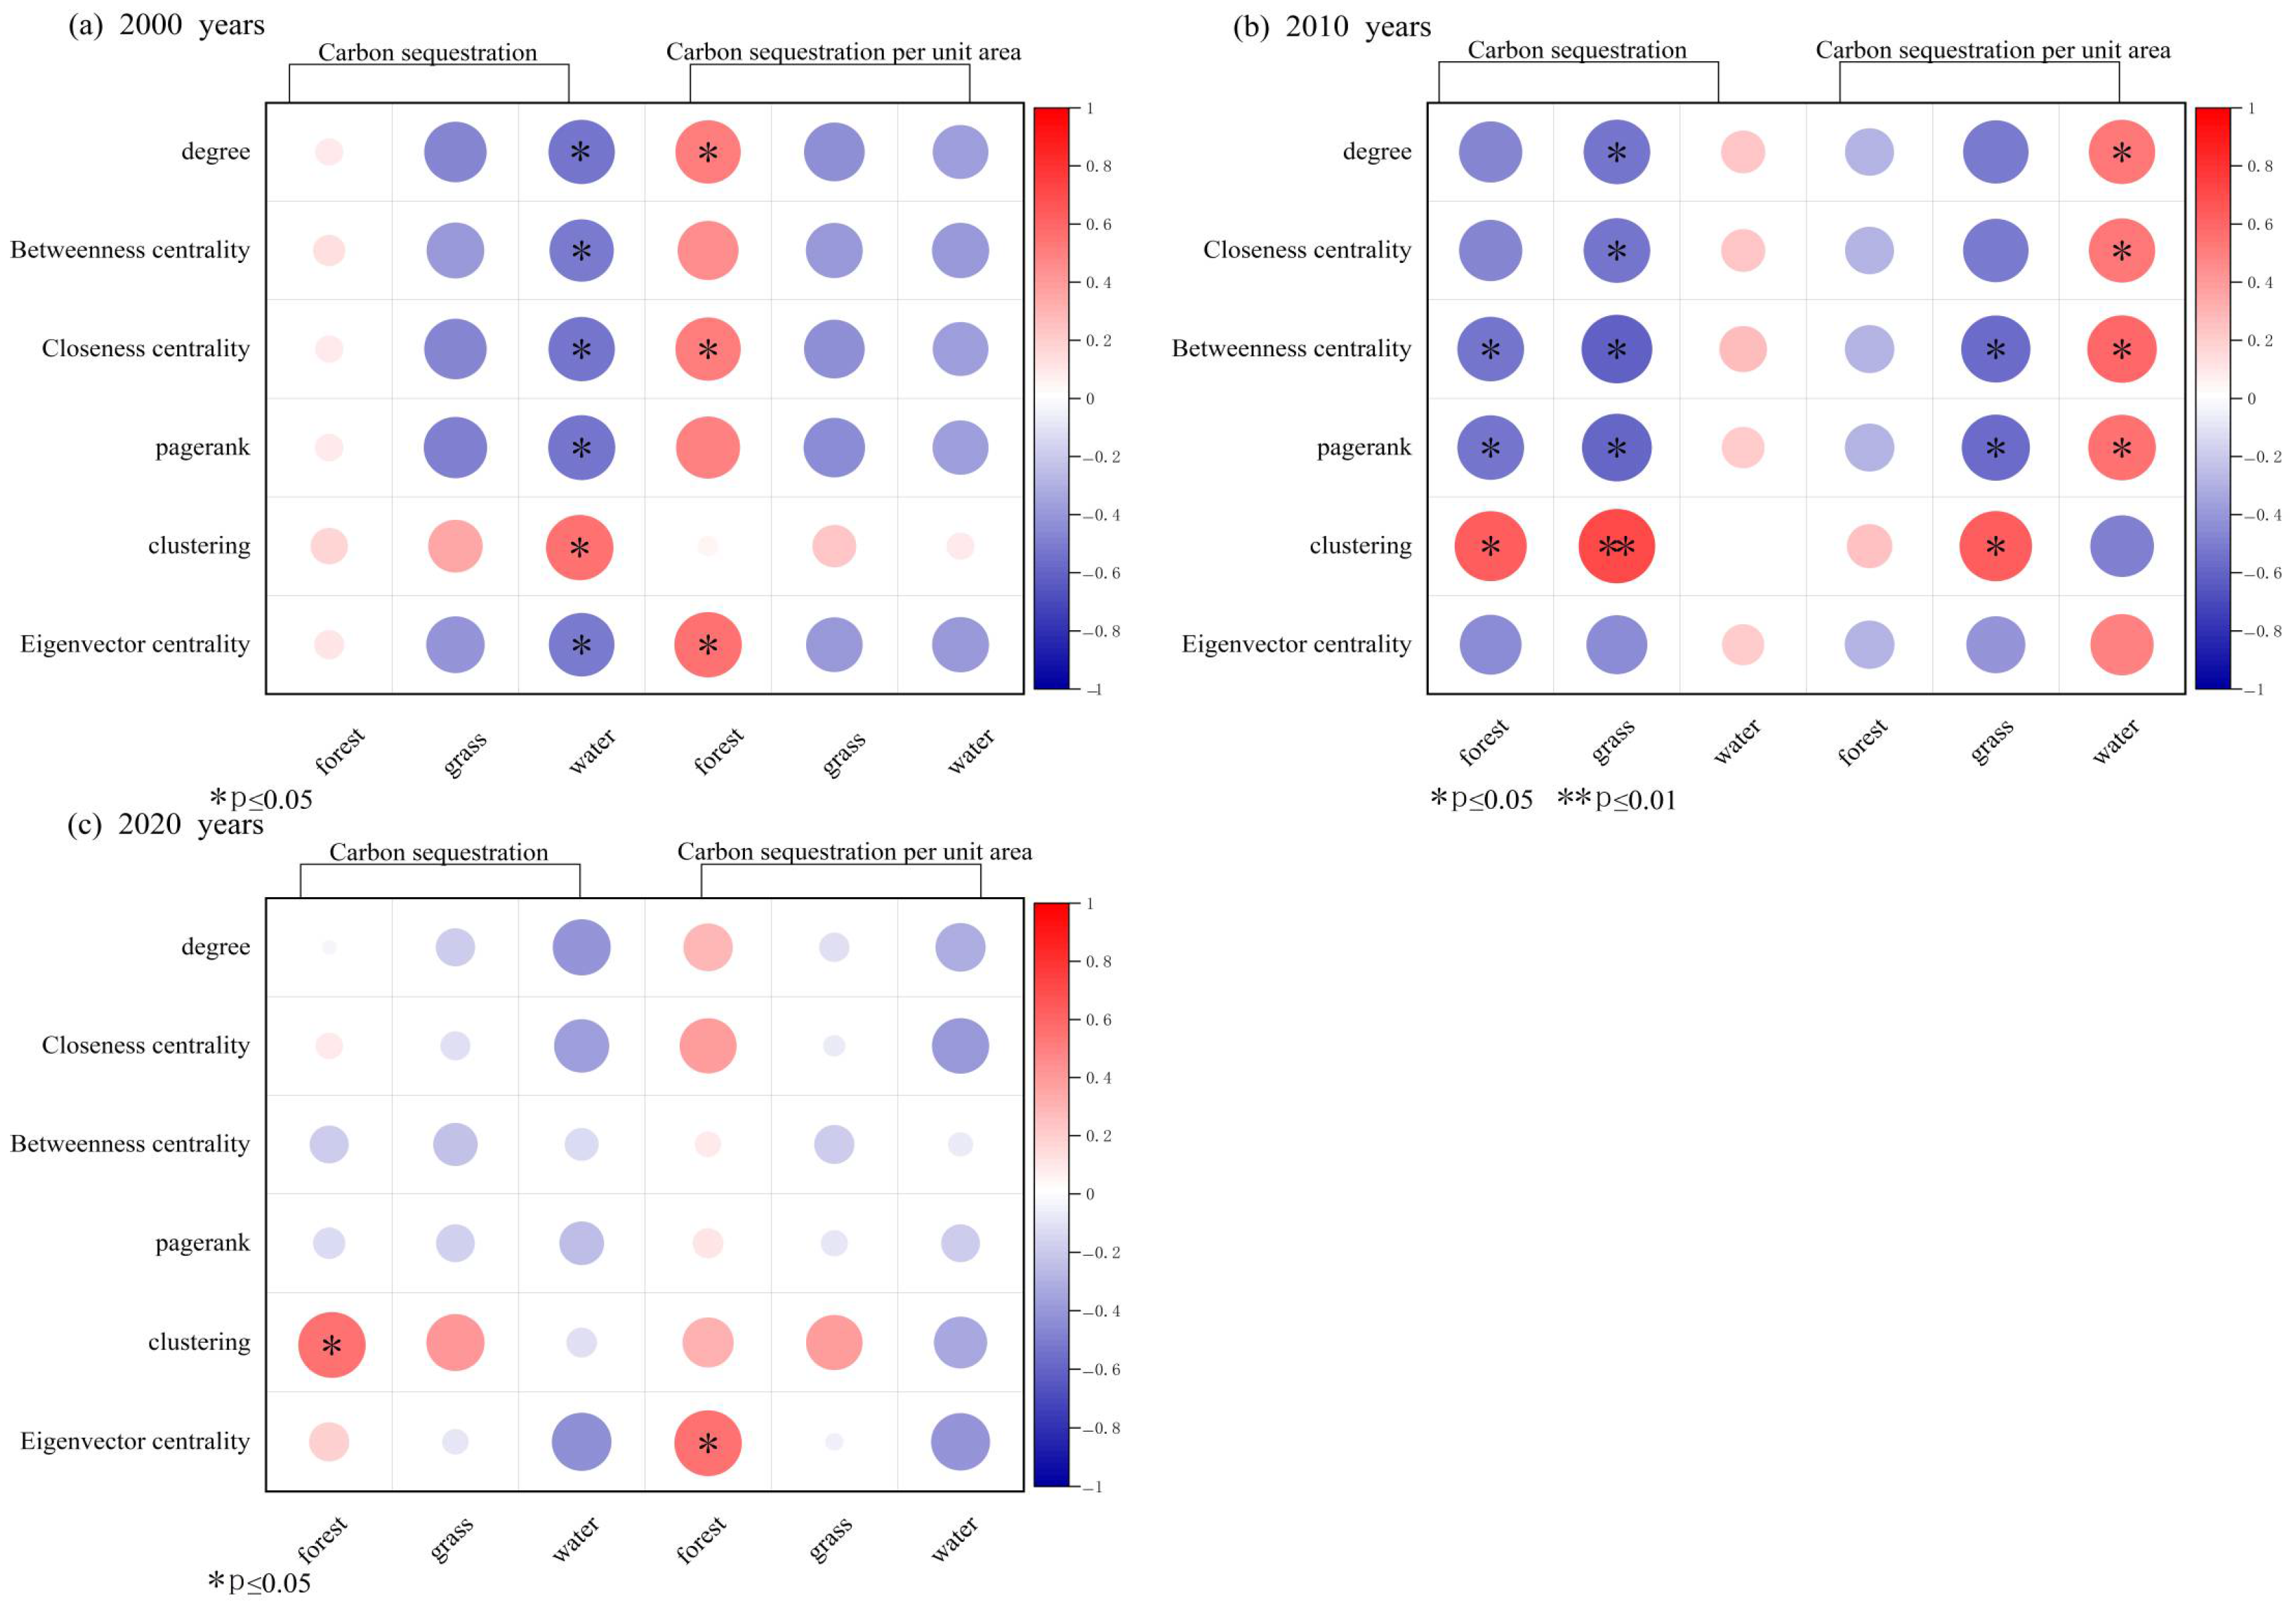
3.3.2. Analysis of the Relationship Between Ecological Network Structure and Carbon Sequestration Capacity

To examine the relationship between carbon sink performance and ecological network structure, this study utilized Spearman’s rank correlation to assess how total and per-unit-area carbon sequestration correlate with six topological metrics across different ecological land types (Figure 9). In 2000, water-related ecological sources showed a positive correlation with the clustering coefficient (p < 0.05, r = 0.50), while other indicators displayed negative correlations. Per-unit carbon sequestration in forested areas was positively associated with node degree, closeness centrality, and eigenvector centrality (p < 0.05), with a mean r value of 0.51. By 2010, clustering coefficients remained significantly positively correlated with total carbon in both forest (p < 0.05, r = 0.62) and grassland (p < 0.01, r = 0.70) areas. However, forest carbon showed negative correlations with betweenness centrality, closeness centrality, PageRank, and eigenvector centrality. Grassland per-unit carbon was positively correlated with the clustering coefficient (p < 0.05, r = 0.63), while its negative correlations with betweenness and PageRank were not statistically significant. In water ecosystems, per-unit carbon was positively associated with degree, betweenness, closeness, and PageRank (p < 0.05), although the average r value of 0.54 indicated moderate rather than strong correlations. By 2020, forest areas continued to exhibit a positive correlation with the clustering coefficient (p < 0.05, r = 0.49), and their per-unit carbon sequestration also showed a positive association with eigenvector centrality (p < 0.05, r = 0.48).
Forest ecosystems are the primary contributors to carbon sequestration and exhibit strong correlations with various topological indicators of the ecological network. In contrast, grassland ecosystems show strong positive correlations mainly with clustering coefficients, while their negative associations with centrality indicators suggest a relatively decentralized role in the network. Aquatic ecosystems, on the other hand, display positive correlations between carbon sequestration intensity and several centrality metrics, highlighting their localized importance in the network structure. These findings underscore that carbon sequestration capacity varies significantly with ecological network topology. Accordingly, improving network structure—especially by increasing the number and quality of corridors connected to low-efficiency sources such as specific grasslands and aquatic zones near expanding urban areas—can enhance both connectivity and carbon sink performance. Strengthening corridor linkages between key ecological sources can also generate positive externalities that support adjacent economic development. This integrated approach is essential for enhancing carbon sink functions in metropolitan regions and provides a sound foundation for land use planning and unlocking the value of regional land resources.

4. Discussion

4.1. Optimizing Regional Ecological Security Patterns to Enhance Regional Carbon Sequestration

This study reveals the key ecological challenges facing the Chengdu metropolitan area amid rapid urban expansion between 2000 and 2020 (Figure 10), including fragmentation of ecological source sites, reduction in ecological corridors, declining spatial connectivity, and weakening carbon sink capacity. These transformations have undermined the structural integrity and ecological functionality of regional systems, thereby constraining the realization of China’s national “dual-carbon” strategy. Empirical evidence shows a significant positive relationship between ecological network topology and carbon sequestration performance, indicating that higher spatial connectivity enhances both ecological energy flow and carbon sink efficiency. Therefore, constructing a well-connected ecological spatial network is essential for improving carbon sequestration potential.
Using the 2020 optimization scenario as a case study and drawing on the framework proposed by Qiu et al. [50] network enhancement can be achieved by increasing ecological corridors and inserting “stepping-stone” nodes to shorten paths between low-efficiency nodes. These stepping stones serve as relay habitats, reducing migration risks and enhancing species movement success rates. Based on this approach, this study optimized structurally weak nodes (e.g., nodes 6, 10, 11, and 15), resulting in the addition of 10 new ecological nodes and 45 corridors, significantly improving network accessibility and topological balance. Compared to the baseline scenario, total carbon sequestration increased by approximately 4.16 million tons, with marked improvements in both structural stability and operational efficiency of the ecological network. Structural analysis based on carbon sink contributions revealed that forest land accounted for 94.8% of the increase, confirming its dominant role. Grassland and water bodies contributed 1.0% and 4.2%, respectively, further underscoring the critical role of forests in enhancing connectivity and carbon sequestration performance.
Newly added corridors were concentrated in areas previously lacking ecological sources, such as eastern Deyang, northwestern Ziyang, and southern Meishan. The optimization process not only enhanced ecological integrity but also unlocked considerable spatial potential for land value transformation. This paves the way for developing a synergistic model integrating ecology, carbon sinks, and economic growth. These findings align with similar studies conducted in Yunnan and the Jiaodong Peninsula, validating both the theoretical underpinnings and regional adaptability of the methodology [26,27]. Overall, the optimized ecological security pattern in the Chengdu metropolitan area not only improves carbon sink capacity and spatial connectivity but also provides a strategic interface between ecological restoration and the pursuit of carbon neutrality.

4.2. Strengths and Recommendations

This study constructs the ecological security pattern of the CMA from a time-series perspective (2000–2020), addressing the previous lack of dynamic analyses on ecosystem evolution in metropolitan regions. Comparative analysis across different periods reveals the interrelated evolution of ecological source fragmentation, declining network connectivity, and the degradation of carbon sink capacity. Methodologically, this study adopts complex network topology analysis to quantitatively assess the relationship between ecological network structure and regional carbon sequestration capacity through the application of relevant topological indicators [30].
Moreover, ecological source areas were overlaid with ecological redlines to identify both high-value ecological patches and conservation gaps, thereby providing a scientific basis for formulating differentiated protection and restoration strategies. It is recommended that areas already designated within the ecological redline be strictly protected; buffer zones should be established for source areas located outside the redline but possessing high ecological value; and regions that are highly fragmented yet exhibit significant restoration potential should be designated as priority zones for ecological restoration [58]. At the practical level, the study suggests implementing carbon compensation mechanisms in ecologically fragmented, low-centrality marginal areas through platforms such as “CarbonSmart Tianfu” to incentivize societal participation in restoration. It further recommends developing a carbon sink evaluation framework based on network optimization to foster synergies among policies related to carbon sink evaluation, ecological conservation, and carbon trading. Overall, this research provides scientific support for optimizing ecological security patterns and offers theoretical guidance for institutional design and policy innovation toward carbon neutrality in future metropolitan areas.

4.3. Limitations and Challenges

This study employs Spearman correlation analysis to explore the relationship between ecological network topology and carbon sink capacity. As a non-parametric method, it is suitable for detecting monotonic relationships and handling non-normal data. However, compared to Pearson or partial correlation, it offers limited precision in quantifying network effects on carbon stocks. Future research should consider integrating multiple correlation methods for validation. Additionally, land use classification in this study is relatively coarse; although forests, grasslands, and water bodies are included, ecosystems like wetlands, shrublands, and agroforestry also store significant carbon. A more detailed classification could improve assessments of ecosystem contributions to carbon balance. Moreover, future work should simulate carbon sink dynamics under different ecological security scenarios—such as urban growth, restoration, and policy changes—by combining spatial optimization models (e.g., PLUS or FLUS) with carbon accounting frameworks to support adaptive carbon neutrality strategies.

5. Conclusions

This study explores how optimizing the ecological spatial structure of the CMA influences carbon sink enhancement. It also proposes an ecological network optimization framework based on the ESP. Based on the analysis of the structure, function, and dynamic characteristics of the ecological network from 2000 to 2020, key topological indicators were employed to quantify their relationship with carbon sink capacity, and optimization strategies were derived through Spearman correlation analysis. The main conclusions are as follows:
(1)
Between 2000 and 2020, the area of ecological source sites first expanded and then declined, indicating an increase in regional ecological fragmentation. Ecological resistance displayed a spatial pattern of “high in the center and low at the edges”, with ecological networks concentrated in the west, while ecological foundations in the central and eastern areas remained weak and urgently require enhancement.
(2)
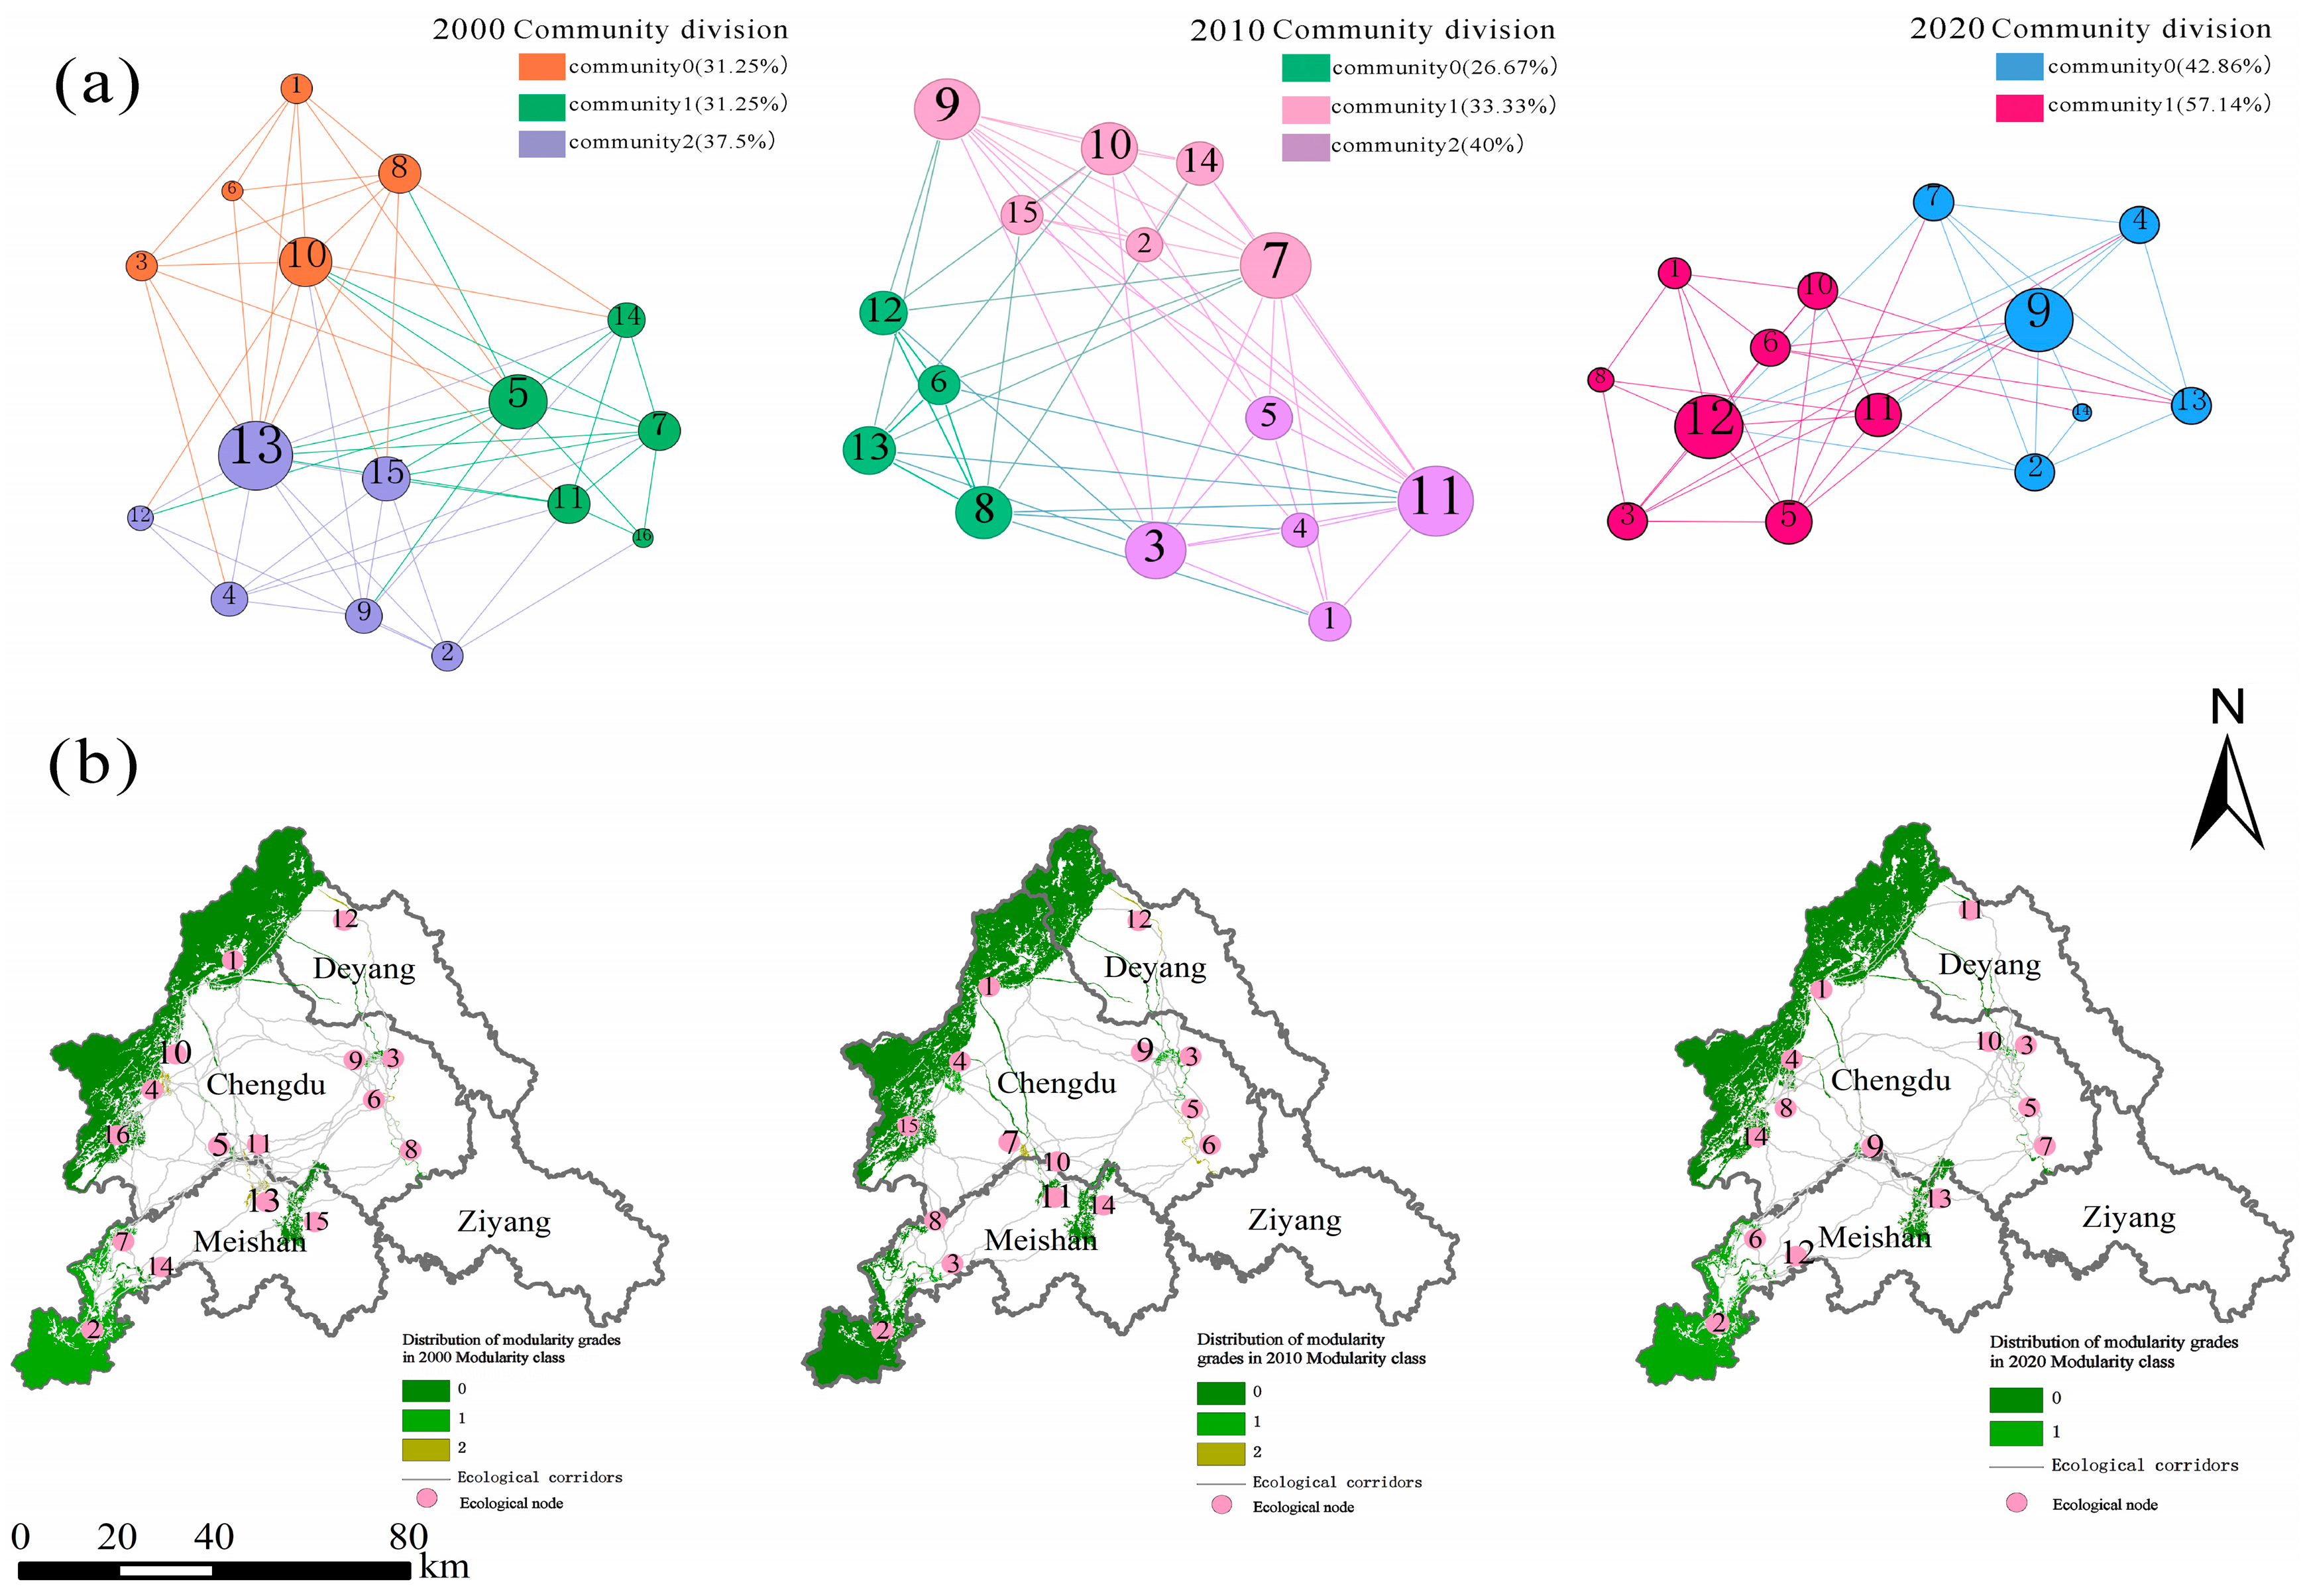
The ecological spatial network exhibited signs of degradation, with network modules decreasing from three to two. Although the core area remained stable, the southeastern region became marginalized due to corridor disruptions, and key topological indicators declined, reflecting diminished connectivity.
(3)
Forests consistently served as the primary carbon sink (>70%) and exhibited significant correlations with multiple network metrics. Grassland sinks were influenced by clustering coefficients, while water bodies showed positive associations with centrality, highlighting their role in localized connectivity.
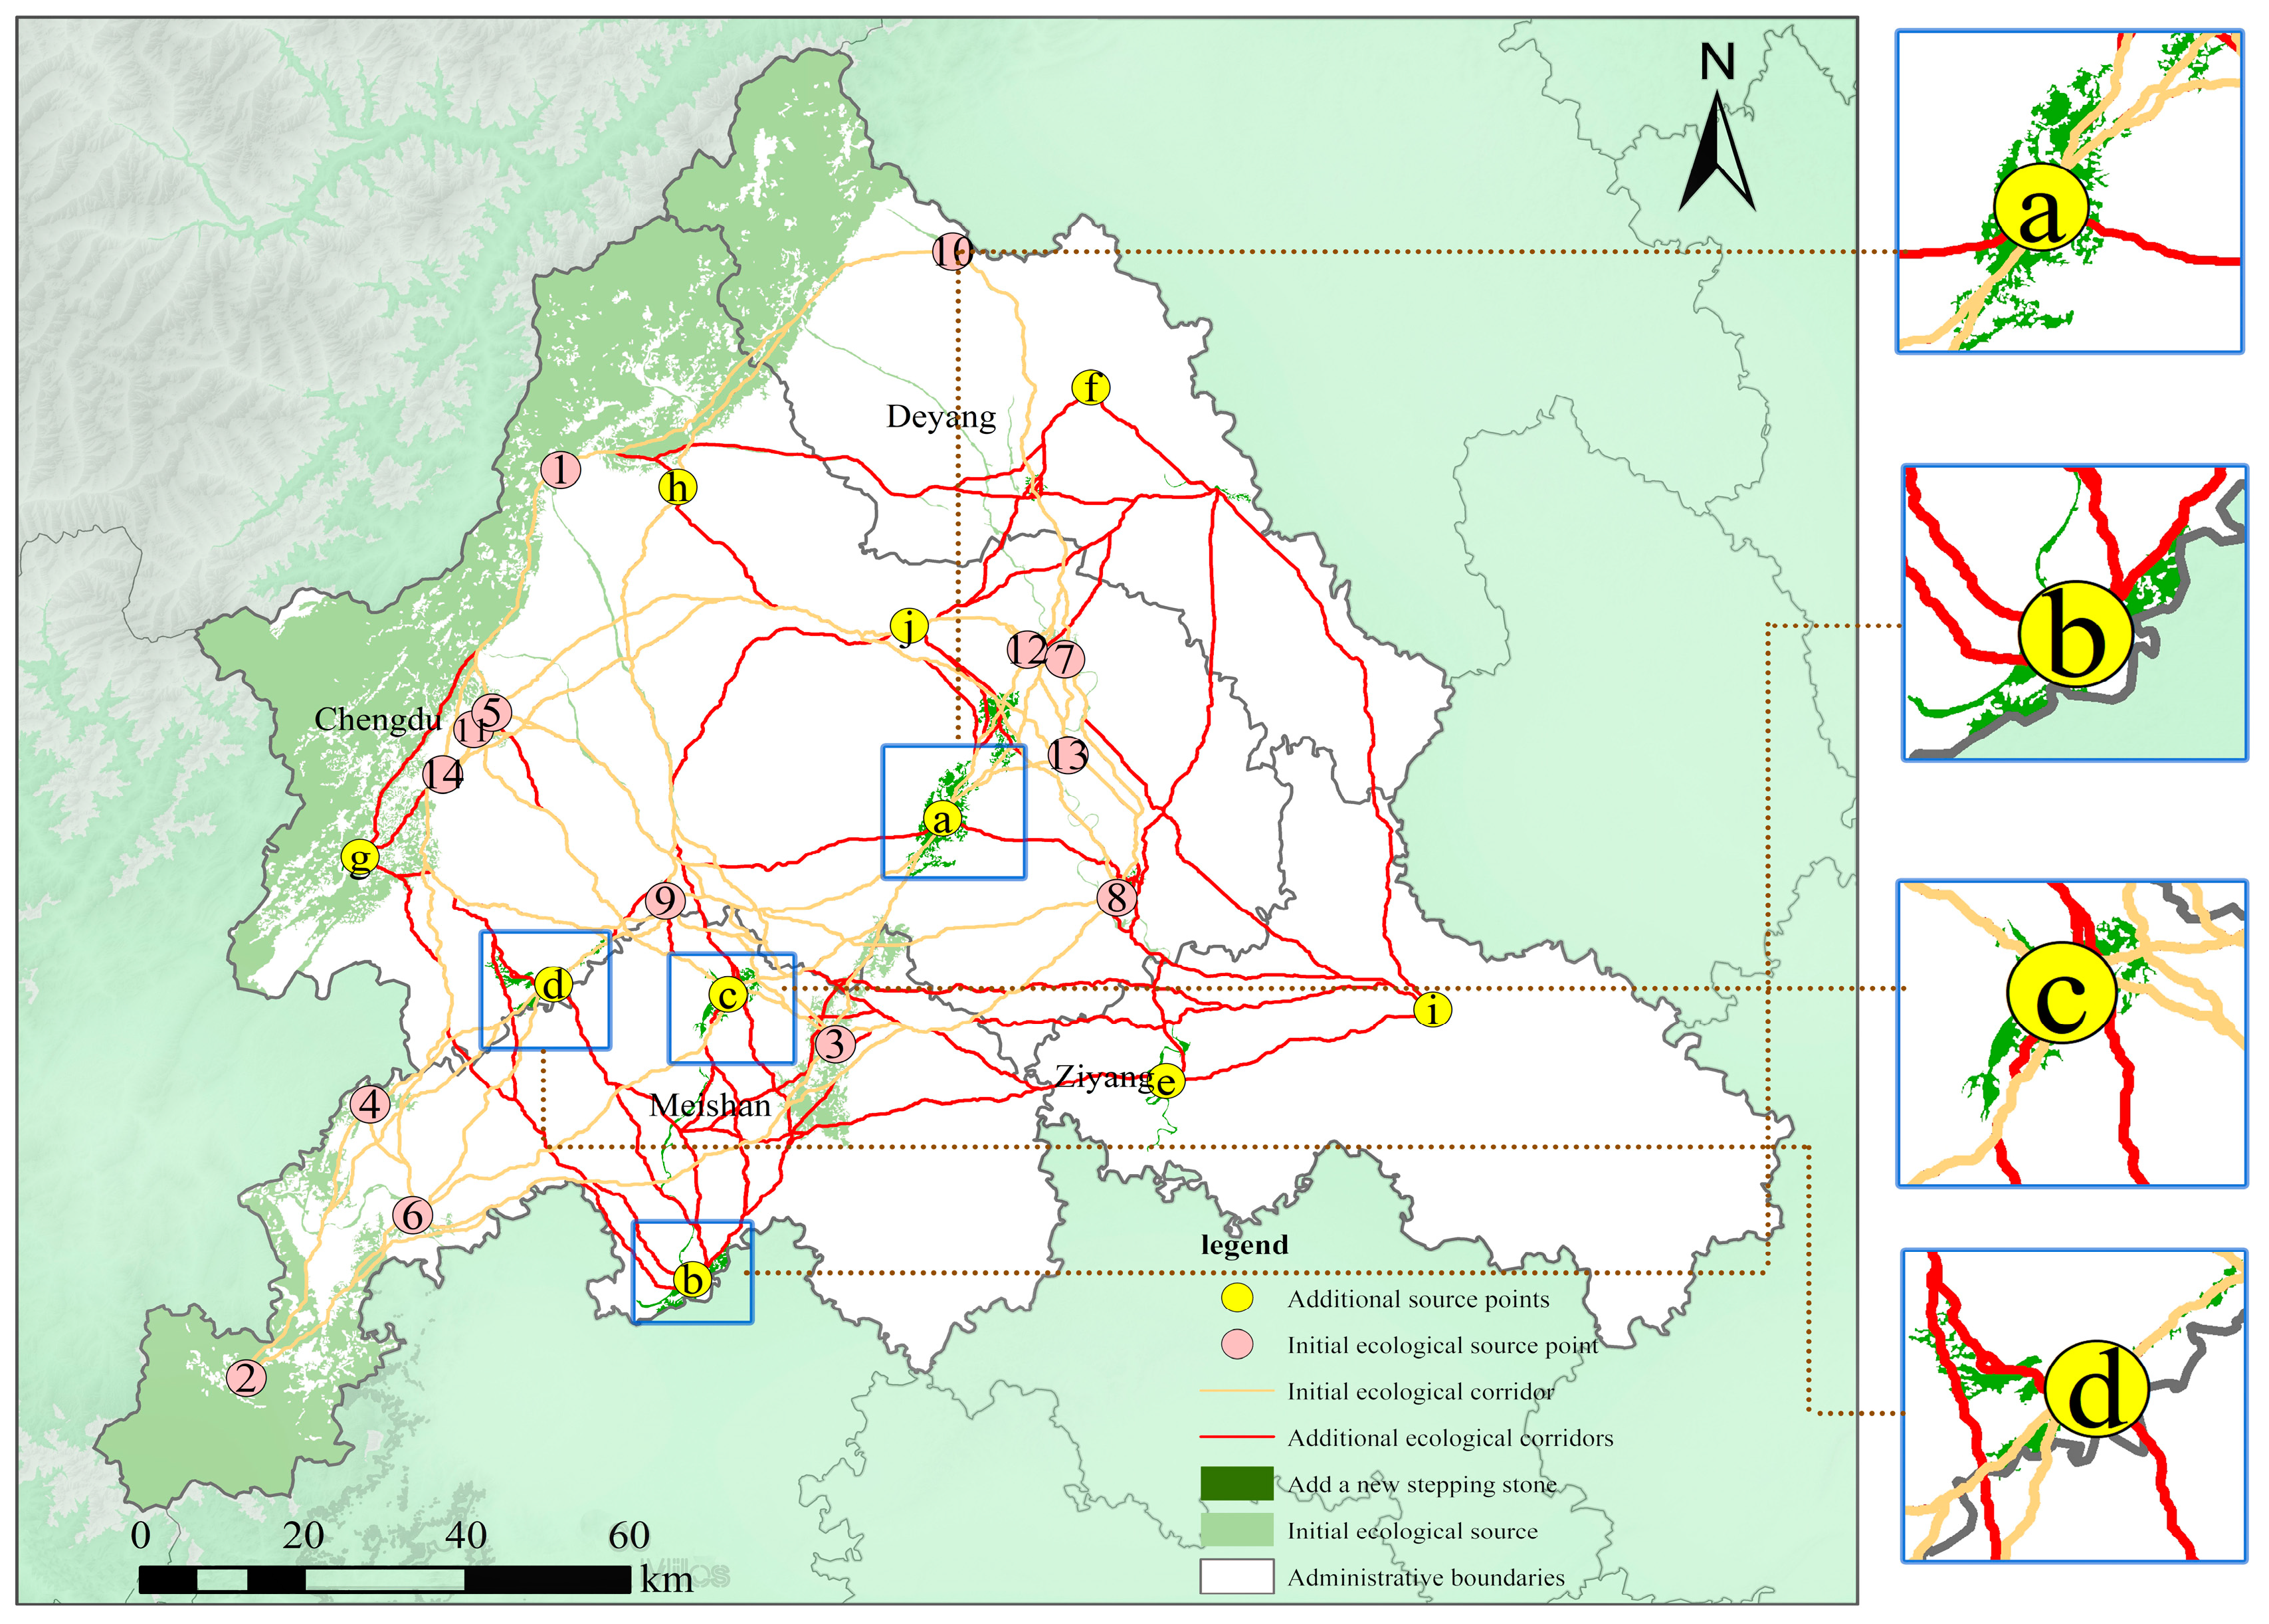
(4)
The addition of 10 new stepping stones and 45 ecological corridors in 2020 increased the annual carbon sink capacity by 4.16 million C yr−1, with forest ecosystems contributing up to 94.8%, significantly enhancing network connectivity and supporting regional carbon neutrality goals.
Although this study focuses on the CMA as a case study, many metropolitan regions and urban agglomerations face similar challenges. By emphasizing ecological restoration, carbon sink enhancement, and the optimization of ecological security patterns, this research provides both theoretical foundations and practical guidance for the formulation of carbon sequestration policies.

Supplementary Materials

The following supporting information can be downloaded at: https://www.mdpi.com/article/10.3390/su17104483/s1, Table S1: Topology metrics; Table S2: Gravity model 2000; Table S3: Gravity model 2010; Table S4: Gravity model 2020. References [59,60,61,62,63,64,65] are cited in the Supplementary Materials.

Author Contributions

Conceptualization: L.H., H.H. and T.L.; data curation, H.H.; formal analysis, T.L.; funding acquisition, L.H.; investigation, H.H.; methodology, H.H., T.L. and C.M.; project administration, L.H.; resources, T.L. and C.M.; software, H.H.; supervision, L.H.; validation, H.H.; visualization, H.H. and C.M.; writing—original draft, H.H.; writing—review and editing, L.H., T.L. and C.M. All authors have read and agreed to the published version of the manuscript.

Funding

This research was supported by the Postgraduate Innovation Fund Project at Southwest University of Science and Technology, grant number (24ycx1116).

Institutional Review Board Statement

Not applicable.

Informed Consent Statement

Not applicable.

Data Availability Statement

All relevant data are included within this article.

Conflicts of Interest

The authors declare no conflicts of interest.

Abbreviations

The following abbreviations are used in this manuscript:
ESPEcological Security Pattern
CMAChengdu Metropolitan Area
MSPAMorphological Spatial Pattern Analysis
MCRMinimum Cumulative Resistance
NDVINormalized Difference Vegetation Index
ENVIEnvironment for Visualizing Images
PCPotential connectivity
DPCDelta Probability of Connectivity
ArcGISGeographic Information System
DEMDigital Elevation Model
LUCCLand Use and Land Cover Change
AHPAnalytic Hierarchy Process
GMGravity Model

References

  1. AghaKouchak, A.; Chiang, F.; Huning, L.S.; Love, C.A.; Mallakpour, I.; Mazdiyasni, O.; Moftakhari, H.; Papalexiou, S.M.; Ragno, E.; Sadegh, M. Climate Extremes and Compound Hazards in a Warming World. Annu. Rev. Earth Planet. Sci. 2020, 48, 519–548. [Google Scholar] [CrossRef]
  2. Yang, T.; Dong, Q.; Du, Q.; Du, M.; Dong, R.; Chen, M. Carbon Dioxide Emissions and Chinese OFDI: From the Perspective of Carbon Neutrality Targets and Environmental Management of Home Country. J. Environ. Manag. 2021, 295, 113120. [Google Scholar] [CrossRef] [PubMed]
  3. Sun, L.-L.; Cui, H.-J.; Ge, Q.-S. Will China Achieve Its 2060 Carbon Neutral Commitment from the Provincial Perspective? Adv. Clim. Change Res. 2022, 13, 169–178. [Google Scholar] [CrossRef]
  4. Lai, S.; Lu, J.; Luo, X.; Ge, J. Carbon Emission Evaluation Model and Carbon Reduction Strategies for Newly Urbanized Areas. Sustain. Prod. Consum. 2022, 31, 13–25. [Google Scholar] [CrossRef]
  5. Zhang, X.; Cui, X.; Liang, S. Evolution and Optimization of an Ecological Network in an Arid Region Based on MSPA-MCR: A Case Study of the Hexi Corridor. Sustainability 2024, 16, 1704. [Google Scholar] [CrossRef]
  6. Huo, J.; Shi, Z.; Zhu, W.; Li, T.; Xue, H.; Chen, X.; Yan, Y.; Ma, R. Construction and Optimization of an Ecological Network in Zhengzhou Metropolitan Area, China. Int. J. Environ. Res. Public Health 2022, 19, 8066. [Google Scholar] [CrossRef]
  7. Wu, S.; Shi, S.; Zhang, J. Evolution Analysis of Ecological Security Pattern in Forest Areas Coupling Carbon Storage and Landscape Connectivity: A Case Study of the Xiaoxing’an Mountains, China. Forests 2025, 16, 331. [Google Scholar] [CrossRef]
  8. Xu, W.; Wang, J.; Zhang, M.; Li, S. Construction of Landscape Ecological Network Based on Landscape Ecological Risk Assessment in a Large-Scale Opencast Coal Mine Area. J. Clean. Prod. 2021, 286, 125523. [Google Scholar] [CrossRef]
  9. Yan, Y.; Jarvie, S.; Zhang, Q.; Zhang, S.; Han, P.; Liu, Q.; Liu, P. Small Patches Are Hotspots for Biodiversity Conservation in Fragmented Landscapes. Ecol. Indic. 2021, 130, 108086. [Google Scholar] [CrossRef]
  10. Zhang, F.; Jia, Y.; Liu, X.; Li, T.; Gao, Q. Application of MSPA-MCR Models to Construct Ecological Security Pattern in the Basin: A Case Study of Dawen River Basin. Ecol. Indic. 2024, 160, 111887. [Google Scholar] [CrossRef]
  11. Chen, J.; Wang, S.; Zou, Y. Construction of an Ecological Security Pattern Based on Ecosystem Sensitivity and the Importance of Ecological Services: A Case Study of the Guanzhong Plain Urban Agglomeration, China. Ecol. Indic. 2022, 136, 108688. [Google Scholar] [CrossRef]
  12. Wei, Q.; Halike, A.; Yao, K.; Chen, L.; Balati, M. Construction and Optimization of Ecological Security Pattern in Ebinur Lake Basin Based on MSPA-MCR Models. Ecol. Indic. 2022, 138, 108857. [Google Scholar] [CrossRef]
  13. Lin, J.; Yang, W.; Yu, K.; Geng, J.; Liu, J. Identification and Construction of Ecological Nodes in the Fuzhou Ecological Corridors. Forests 2022, 13, 1837. [Google Scholar] [CrossRef]
  14. Wang, T.; Huang, Y.; Cheng, J.; Xiong, H.; Ying, Y.; Feng, Y.; Wang, J. Construction and Optimization of Watershed-Scale Ecological Network Based on Complex Network Method: A Case Study of Erhai Lake Basin in China. Ecol. Indic. 2024, 160, 111794. [Google Scholar] [CrossRef]
  15. Wu, X.; Pan, J.; Zhu, X. Optimizing the Ecological Source Area Identification Method and Building Ecological Corridor Using a Genetic Algorithm: A Case Study in Weihe River Basin, NW China. Ecol. Inform. 2024, 80, 102519. [Google Scholar] [CrossRef]
  16. Zhao, J.; Li, Z.; Wu, J.; Xu, Z.; Ja, B. Ecological Spatial Network Optimization of Carbon Sink Patches for Enhanced Carbon Sink in Wuhan Metropolitan Area, China. Ecol. Indic. 2024, 165, 112177. [Google Scholar] [CrossRef]
  17. Liang, X.; Liu, Z.; Zhai, L.; Ji, L.; Feng, Y.; Sang, H. Spatial Terrestrial Carbon Emissions/Sequestrations Evolution Based on Ecological Network Analysis in Beijing-Tianjin-Hebei Urban Agglomeration. Ecol. Eng. 2023, 189, 106914. [Google Scholar] [CrossRef]
  18. Zhu, N.; Ai, J.; Zeng, Z.; Zhou, C. Exploring the Spatial Relationship between the Ecological Topological Network and Carbon Sequestration Capacity of Coastal Urban Ecosystems: A Case Study of Yancheng City, China. Remote Sens. 2023, 15, 4007. [Google Scholar] [CrossRef]
  19. Guo, H.; Yu, Q.; Pei, Y.; Wang, G.; Yue, D. Optimization of Landscape Spatial Structure Aiming at Achieving Carbon Neutrality in Desert and Mining Areas. J. Clean. Prod. 2021, 322, 129156. [Google Scholar] [CrossRef]
  20. Qiu, S.; Fang, M.; Yu, Q.; Niu, T.; Liu, H.; Wang, F.; Xu, C.; Ai, M.; Zhang, J. Study of Spatial temporal Changes in Chinese Forest Eco-Space and Optimization Strategies for Enhancing Carbon Sequestration Capacity through Ecological Spatial Network Theory. Sci. Total Environ. 2023, 859, 160035. [Google Scholar] [CrossRef]
  21. Fang, M.; Si, G.; Yu, Q.; Huang, H.; Huang, Y.; Liu, W.; Guo, H. Study on the Relationship between Topological Characteristics of Vegetation Ecospatial Network and Carbon Sequestration Capacity in the Yellow River Basin, China. Remote Sens. 2021, 13, 4926. [Google Scholar] [CrossRef]
  22. Wan, Y.; Wang, Y.; Gao, M.; Jin, L. An Empirical Assessment of Whether Urban Green Ecological Networks Have the Capacity to Store Higher Levels of Carbon. Sci. Rep. 2024, 14, 3132. [Google Scholar] [CrossRef] [PubMed]
  23. Chen, H.; Yan, W.; Li, Z.; Wende, W.; Xiao, S. A Framework for Integrating Ecosystem Service Provision and Connectivity in Ecological Spatial Networks: A Case Study of the Shanghai Metropolitan Area. Sustain. Cities Soc. 2024, 100, 105018. [Google Scholar] [CrossRef]
  24. Huang, K.; Peng, L.; Wang, X.; Deng, W.; Liu, Y. Incorporating Circuit Theory, Complex Networks, and Carbon Offsets into the Multi-Objective Optimization of Ecological Networks: A Case Study on Karst Regions in China. J. Clean. Prod. 2023, 383, 135512. [Google Scholar] [CrossRef]
  25. Huang, L.; Wang, J.; Cheng, H. Spatiotemporal Changes in Ecological Network Resilience in the Shandong Peninsula Urban Agglomeration. J. Clean. Prod. 2022, 339, 130681. [Google Scholar] [CrossRef]
  26. Wang, L.; Zhao, J.; Lin, Y.; Chen, G. Exploring Ecological Carbon Sequestration Advantage and Economic Responses in an Ecological Security Pattern: A Nature-Based Solutions Perspective. Ecol. Model. 2024, 488, 110597. [Google Scholar] [CrossRef]
  27. Kang, J.; Zhang, X.; Zhu, X.; Zhang, B. Ecological Security Pattern: A New Idea for Balancing Regional Development and Ecological Protection. A Case Study of the Jiaodong Peninsula, China. Glob. Ecol. Conserv. 2021, 26, e01472. [Google Scholar] [CrossRef]
  28. Shi, Q.; Lu, J.; Han, J. Studying the Spatiotemporal Variations of the Ecological Network and Carbon Utilization Efficiency in Southeast Tibet Based on Complex Network Theory. Ecol. Indic. 2024, 166, 112521. [Google Scholar] [CrossRef]
  29. Shuai, N.; Hu, Y.; Gao, M.; Guo, Z.; Bai, Y. Construction and Optimization of Ecological Networks in Karst Regions Based on Multi-Scale Nesting: A Case Study in Guangxi Hechi, China. Ecol. Inform. 2023, 74, 101963. [Google Scholar] [CrossRef]
  30. Men, D.; Pan, J. Incorporating Network Topology and Ecosystem Services into the Optimization of Ecological Network: A Case Study of the Yellow River Basin. Sci. Total Environ. 2024, 912, 169004. [Google Scholar] [CrossRef]
  31. Yang, W.; Pan, J. The Role of Vegetation Carbon Sequestration in Offsetting Energy Carbon Emissions in the Yangtze River Basin, China. Environ. Dev. Sustain. 2024, 26, 22689–22714. [Google Scholar] [CrossRef]
  32. Wang, F.; Guo, H.; Zhang, Q.; Yu, Q.; Xu, C.; Qiu, S. Optimizing Ecological Spatial Network Topology for Enhanced Carbon Sequestration in the Ecologically Sensitive Middle Reaches of the Yellow River, China. Remote Sens. 2023, 15, 2308. [Google Scholar] [CrossRef]
  33. Meng, B.; Wang, X.; Zhang, Z.; Huang, P. Spatio-Temporal Pattern and Driving Force Evolution of Cultivated Land Occupied by Urban Expansion in the Chengdu Metropolitan Area. Land 2022, 11, 1458. [Google Scholar] [CrossRef]
  34. Chengdu Bureau of Statistics. Chengdu Statistical Yearbook 2023; Chengdu Bureau of Statistics: Chengdu, China, 2023. Available online: https://www.stats.gov.cn/sj/ndsj/2023/indexeh.htm (accessed on 30 January 2025).
  35. Ministry of Ecology and Environment of the People’s Republic of China. Annual Report on China’s Policies and Actions for Addressing Climate Change 2022; Ministry of Ecology and Environment of the People’s Republic of China: Beijing, China, 2022.
  36. Xia, X.; Zhang, Y.; Shi, X.; Chen, J.; Rao, T. Simulation of Dynamic Urban Growth Boundary Combining Urban Vitality and Ecological Networks: A Case Study in Chengdu Metropolitan Area. Land 2022, 11, 1793. [Google Scholar] [CrossRef]
  37. Shen, J.; Zhu, W.; Peng, Z.; Wang, Y. Improving Landscape Ecological Network Connectivity in Urbanizing Areas from Dual Dimensions of Structure and Function. Ecol. Model. 2023, 482, 110380. [Google Scholar] [CrossRef]
  38. Huang, X.; Wang, H.; Shan, L.; Xiao, F. Constructing and Optimizing Urban Ecological Network in the Context of Rapid Urbanization for Improving Landscape Connectivity. Ecol. Indic. 2021, 132, 108319. [Google Scholar] [CrossRef]
  39. Luo, Y.; Wu, J.; Wang, X.; Zhao, Y.; Feng, Z. Understanding Ecological Groups under Landscape Fragmentation Based on Network Theory. Landsc. Urban Plan. 2021, 210, 104066. [Google Scholar] [CrossRef]
  40. Li, J.; Liang, L.; Chao, Y.; Wang, X.; Qiu, M.; Luo, P.; Zhu, Y. Construction of the Ecological Security Pattern of Mu Us Sandy Land on the Basis of the “Source−Resistance−Corridor” Theory. Ecol. Indic. 2025, 171, 113162. [Google Scholar] [CrossRef]
  41. Knaapen, J.P.; Scheffer, M.; Harms, B. Estimating Habitat Isolation in Landscape Planning. Landsc. Urban Plan. 1992, 23, 1–16. [Google Scholar] [CrossRef]
  42. Nie, W.; Shi, Y.; Siaw, M.J.; Yang, F.; Wu, R.; Wu, X.; Zheng, X.; Bao, Z. Constructing and Optimizing Ecological Network at County and Town Scale: The Case of Anji County, China. Ecol. Indic. 2021, 132, 108294. [Google Scholar] [CrossRef]
  43. Fu, Y.; Shi, X.; He, J.; Yuan, Y.; Qu, L. Identification and Optimization Strategy of County Ecological Security Pattern: A Case Study in the Loess Plateau, China. Ecol. Indic. 2020, 112, 106030. [Google Scholar] [CrossRef]
  44. Feng, M.; Zhao, W.; Zhang, T. Construction and Optimization Strategy of County Ecological Infrastructure Network Based on MCR and Gravity Model—A Case Study of Langzhong County in Sichuan Province. Sustainability 2023, 15, 8478. [Google Scholar] [CrossRef]
  45. Xu, X.; Wang, S.; Rong, W. Construction of Ecological Network in Suzhou Based on the PLUS and MSPA Models. Ecol. Indic. 2023, 154, 110740. [Google Scholar] [CrossRef]
  46. Wanghe, K.; Guo, X.; Wang, M.; Zhuang, H.; Ahmad, S.; Khan, T.U.; Xiao, Y.; Luan, X.; Li, K. Gravity Model Toolbox: An Automated and Open-Source ArcGIS Tool to Build and Prioritize Ecological Corridors in Urban Landscapes. Glob. Ecol. Conserv. 2020, 22, e01012. [Google Scholar] [CrossRef]
  47. Guan, H.; Bai, Y.; Tang, Y.; Zhang, C.; Zou, J. Spatial Identification and Optimization of Ecological Network in Desert-Oasis Area of Yellow River Basin, China. Ecol. Indic. 2023, 147, 109999. [Google Scholar] [CrossRef]
  48. Liu, H.; Niu, T.; Yu, Q.; Yang, L.; Ma, J.; Qiu, S.; Wang, R.; Liu, W.; Li, J. Spatial and Temporal Variations in the Relationship between the Topological Structure of Eco-Spatial Network and Biodiversity Maintenance Function in China. Ecol. Indic. 2022, 139, 108919. [Google Scholar] [CrossRef]
  49. Woodbury, P.B.; Smith, J.E.; Heath, L.S. Carbon Sequestration in the U.S. Forest Sector from 1990 to 2010. For. Ecol. Manag. 2007, 241, 14–27. [Google Scholar] [CrossRef]
  50. Qiu, S.; Yu, Q.; Niu, T.; Fang, M.; Guo, H.; Liu, H.; Li, S.; Zhang, J. Restoration and Renewal of Ecological Spatial Network in Mining Cities for the Purpose of Enhancing Carbon Sinks: The Case of Xuzhou, China. Ecol. Indic. 2022, 143, 109313. [Google Scholar] [CrossRef]
  51. Qiu, S.; Yu, Q.; Niu, T.; Fang, M.; Guo, H.; Liu, H.; Li, S. Study on the Landscape Space of Typical Mining Areas in Xuzhou City from 2000 to 2020 and Optimization Strategies for Carbon Sink Enhancement. Remote Sens. 2022, 14, 4185. [Google Scholar] [CrossRef]
  52. Zhu, J.; Hu, H.; Tao, S.; Chi, X.; Li, P.; Jiang, L.; Ji, C.; Zhu, J.; Tang, Z.; Pan, Y.; et al. Carbon Stocks and Changes of Dead Organic Matter in China’s Forests. Nat. Commun. 2017, 8, 151. [Google Scholar] [CrossRef]
  53. Huang, L.; Liu, J.; Shao, Q.; Xu, X. Carbon Sequestration by Forestation across China: Past, Present, and Future. Renew. Sustain. Energy Rev. 2012, 16, 1291–1299. [Google Scholar] [CrossRef]
  54. Batjes, N.H. Technologically Achievable Soil Organic Carbon Sequestration in World Croplands and Grasslands. Land Degrad. Dev. 2019, 30, 25–32. [Google Scholar] [CrossRef]
  55. Wang, Y.; Li, M.; Jin, G. Exploring the Optimization of Spatial Patterns for Carbon Sequestration Services Based on Multi-Scenario Land Use/Cover Changes in the Changchun-Jilin-Tumen Region, China. J. Clean. Prod. 2024, 438, 140788. [Google Scholar] [CrossRef]
  56. Xiong, Z.; Zhang, Y.; Liang, J.; Chen, Z.; He, L.; Yin, K. A New Method of Estimating Carbon Sequestration and Its Efficiency in Coastal Waters. Prog. Oceanogr. 2024, 226, 103289. [Google Scholar] [CrossRef]
  57. Chen, J.; Sun, Y.; Liu, H. Survey and Research on Carbon Inclusion Mechanisms in Sichuan Province—The Case of Chengdu’s “Carbon Inclusion Tianfu”. Low Carbon World 2022, 12, 40–42. [Google Scholar]
  58. Liu, Y.; Wang, L.; Lu, Y.; Zou, Q.; Yang, L.; He, Y.; Gao, W.; Li, Q. Identification and Optimization Methods for Delineating Ecological Red Lines in Sichuan Province of Southwest China. Ecol. Indic. 2023, 146, 109786. [Google Scholar] [CrossRef]
  59. Cárdenas, J.P.; Santiago, A.; Tarquis, A.M.; Losada, J.C.; Borondo, F.; Benito, R.M. Soil porous system as heterogeneous complex network. Geoderma 2010, 160, 13–21. [Google Scholar] [CrossRef]
  60. Costa, L.D.F.; Rodrigues, F.A.; Travieso, G.; Boas, P.R.V. Characterization of complex networks: A survey of measurements. Adv. Phys. 2007, 56, 167–242. [Google Scholar] [CrossRef]
  61. Brandes, U. A faster algorithm for betweenness centrality. J. Math. Sociol. 2001, 25, 163–177. [Google Scholar] [CrossRef]
  62. Lancichinetti, A.; Fortunato, S. Consensus clustering in complex networks. Sci. Rep. 2012, 2, 336. [Google Scholar] [CrossRef]
  63. Tandon, A.; Albeshri, A.; Thayananthan, V.; Alhalabi, W.; Fortunato, S. Fast consensus clustering in complex networks. Phys. Rev. E 2019, 99, 042301. [Google Scholar] [CrossRef] [PubMed]
  64. Huang, X.; Xiu, L.; Lu, Z.; Wang, J. Ecological Networks Construction and Optimization in the Longdong Loess Plateau: The Advantages of Self-Organizing Map and Complex Networks. Ecol. Indic. 2025, 170, 113138. [Google Scholar] [CrossRef]
  65. Newman, M.E.J. Modularity and community structure in networks. Proc. Natl. Acad. Sci. USA 2006, 103, 8577–8582. [Google Scholar] [CrossRef] [PubMed]
Figure 1. Location of the study area. (a) Indicates the location of Sichuan in China. (b) Indicates the location of the study area in Sichuan. (c) Indicates the specific location of the study area.
Sustainability 17 04483 g001
Figure 2. Comprehensive resistance surface elements constructed based on the dataset. (a) DEM/m; (b) Slope/°; (c) Topographic relief; (d) LUCC; (e) NDVI; (f) Population density/per; (g) Road density; (h) Water network density, (i) Combined resistance surface.
Sustainability 17 04483 g002
Figure 3. Technical route and research methodology.
Sustainability 17 04483 g003
Figure 4. Ecological source distribution maps in the CMA: (a) Maps illustrating eight landscape categories identified through MSPA; (b) Screened ecological source types for the years 2000, 2010, and 2020.
Sustainability 17 04483 g004
Figure 5. Combined resistance surfaces in the CMA, 2000–2020.
Sustainability 17 04483 g005
Figure 6. Ecological networks from 2000 to 2020 in CMA. (a) Distribution maps of ecological networks for the years 2000, 2010, and 2020. (b) Hierarchical distribution of ecological corridors during the same periods.
Sustainability 17 04483 g006
Figure 7. (a) Community networks. The numbers represent ecological nodes, and the size of each circle indicates the degree centrality of the corresponding node. (b) Geospatial and modular relationships. The numbers correspond to the spatial positions of the same ecological nodes shown on the map.
Sustainability 17 04483 g007
Figure 8. Analysis of topological indicators 2000–2020. (a) Statistical analysis of topological metrics of centrality and mediacy centrality. (b) Proximity centrality and clustering coefficient topological metrics. (c) Statistical analysis of topological metrics of eigenvector centrality and PageRank topological metrics for 2000–2020.
Sustainability 17 04483 g008
Figure 9. Correlation analysis of carbon sequestration from ecological sources with topological indicators (0.01 < * p < 0.05, 0.001 < ** p < 0.01).
Sustainability 17 04483 g009
Figure 10. Optimized ecological spatial network of Chengdu metropolitan area. The numbered circles represent the original ecological sources, while the lettered circles denote the newly added ecological sources.
Sustainability 17 04483 g010
Table 1. The list of data used in this study.
CategoryDataResolutionData Source
EnvironmentLUCC30 mGlobe Land global surface coverage data (https://www.webmap.cn/commres.do?method=globeIndex, accessed on 30 January 2025)
DEM, slope, topographic relief30 mGeo spatial data cloud (https://www.gscloud.cn/, accessed on 30 January 2025)
NDVI30 mResource and Environmental Science Data Center of the Chinese Academy of Sciences (https://www.resdc.cn/, accessed on 30 January 2025)
SocioeconomicRoad network-Open Street Map (https://www.openhistoricalmap.org/, accessed on 30 January 2025)
Water net
Demographic data-Data from World Pop website (https://hub.worldpop.org, accessed on 30 January 2025)
Table 2. Assignment of resistance factor.
Resistance FactorWeight110204070100
DEM/m0.15216–553553–936936–15391539–22352235–30643064–7100
Slope/°0.110–6.636.634–13.6213.62–22.7022.70–34.5734.57–54.8354.83–89.40
Degree of topographic relief0.060.57–10.43–0.570.33–0.430.26–0.330.20–0.260–0.20
NDVI0.10201–254186–201169–186145–169109–1450–109
LUCC0.37ForestGrasslandWaterFarmlandUnutilized landConstruction land
Water network density0.090–0.0150.015–0.040.041–0.0680.068–0.0990.099–0.1430.143–0.203
Road density0.070–0.380.38–1.181.18–2.452.45–4.284.28–7.397.39–12.05
Population density0.050–19.5619.56–88.0188.01–244.46244.46–586.70586.701–1271.19271.19–2503.27
Table 3. Carbon sequestration coefficients for different land use types.
Land Use TypeCarbon Sequestration Factor (t/hm2a)Bibliography
Forest283.9[52,53]
Grassland143.8[54]
Watershed67.1[55,56]
Table 4. Ecological network topology indicators.
Indicators/Years200020102020
Degree7.57.0676.286
Pagerank0.0630.0660.071
Closeness centrality0.6760.6790.658
Betweenness centrality3.753.513.50
Eigenvector centrality0.6010.6710.662
Clustering coefficient0.5790.5630.50
Table 5. Calculation of carbon sequestration for each ecological source.
Particular YearMain Land Use TypesArea (ha)Total Source Area (ha)Proportion of Total Ecological ResourcesCarbon Fixed (Mg C yr−1)Proportion of Total Carbon SequestrationTotal Carbon Sequestration (Mg C yr−1)
2000Forest411,951.8541,959.576.01%116,953,116.687.17%134,174,061.8
Grass110,787.820.44%15,931,289.3411.87%
Water19,219.913.60%1,289,655.840.96%
2010Forest414,045.6541,757.576.43%117,547,537.187.53%134,296,416.5
Grass106,641.619.68%15,335,060.0511.42%
Water21,070.333.89%1,413,819.281.05%
2020Forest410,771.3536,894.776.51%116,617,96587.51%133,264,170
Grass106,692.619.87%15,342,399.4811.51%
Water19,430.783.62%1,303,805.5220.98%
Disclaimer/Publisher’s Note: The statements, opinions and data contained in all publications are solely those of the individual author(s) and contributor(s) and not of MDPI and/or the editor(s). MDPI and/or the editor(s) disclaim responsibility for any injury to people or property resulting from any ideas, methods, instructions or products referred to in the content.

