Article

Variability in the Carbon Management Index and Enzymatic Activity Under Distinct Altitudes in the Alpine Wetlands of Lesotho

by
Knight Nthebere
1,*,
Dominic Mazvimavi
2,
Makoala Marake
1,
Mosiuoa Mochala
1,
Tebesi Raliengoane
1,
Behrooz Mohseni
3,
Krasposy Kujinga
4 and
Jean Marie Kileshye Onema
4
1
Department of Soil Science and Resource Conservation, National University of Lesotho, Maseru 180, Lesotho
2
Department of Earth Science, University of the Western Cape, Bellville 7535, South Africa
3
Research Department of Natural Resources, Golestan Agricultural and Natural Resources Research and Education Center, AREEO, Gorgan 4915677555, Iran
4
Unit of Environmental Sciences and Management, North West University, Mahikeng Campus, Mmabatho 2790, South Africa
*
Author to whom correspondence should be addressed.
Sustainability 2025, 17(19), 8571; https://doi.org/10.3390/su17198571
Submission received: 21 July 2025 / Revised: 18 September 2025 / Accepted: 19 September 2025 / Published: 24 September 2025
(This article belongs to the Special Issue Innovations in Environment Protection and Sustainable Development)

Abstract

Alpine wetlands, key carbon sinks and biodiversity hubs, remain understudied, especially under climate change pressures. Hence, the present study was conducted to assess the variability in soil enzyme activity (SEA) and the carbon management index (CMI) and to utilize principal component analysis (PCA) to explore the variation and correlation between SEA and CMI as influenced by altitudinal gradients in alpine wetlands. This information is essential for exploring the impacts of soil degradation and guiding restoration efforts. The study was designed in blocks (catchments) with six altitudinal variations (from 2500 to 3155 m a.s.l), equivalent to alpine wetlands from three catchments (Senqunyane, Khubelu and Sani) as follows: Khorong and Tenesolo in Senqunyane; Khamoqana and Khalong-la-Lichelete in Sani; and Lets’eng-la-Likhama and Koting-Sa-ha Ramosetsana in Khubelu. The soil samples were collected in February 2025 (autumn season, i.e., wet season) at depths of 0–15 and 15–30 cm and analyzed for bulk density, texture, pH, electrical conductivity (EC), soil organic carbon (SOC), SEA, and carbon pools, and the CMI was computed following standard procedures. The results demonstrated that the soil was loam to sandy loam and was slightly acidic and non-saline in nature in the 0–15 cm layer across the wetlands. The significant decreases in SEA were 45.33%, 32.20% and 15.11% (p < 0.05) for dehydrogenase, fluorescein di-acetate and β-Galactosidase activities, respectively, in KSHM compared with those in Khorong (lower elevated site). The passive carbon pool (CPSV) was dominant over the active carbon pool (CACT) and contributed 76–79% of the SOC to the total organic carbon, with a higher CPSV (79%) observed at KSHM. The CMI was also greater (91.05 and 75.88) under KSHM at the 0–15 cm and 15–30 cm soil depths, respectively, than in all the other alpine wetlands, suggesting better carbon management at higher altitudinal gradients and less enzymatic activity. These trends shape climate change outcomes by affecting soil carbon storage, with high-altitude regions serving as significant, though relatively less active, carbon reservoirs. The PCA-Biplot graph revealed a negative correlation between the CMI and SEA, and these variables drove more variation across sites, highlighting a complex interaction influenced by higher altitude with its multiple ecological drivers, such as temperature variation, nutrient dynamics, and shifts in microbial communities. Further studies on metagenomics in alpine soils are needed to uncover altitude-driven microbial adaptations and their role in carbon dynamics.

1. Introduction

Alpine wetlands serve as vital, long-term carbon reservoirs, holding substantial amounts of organic matter that play a key role in water conservation, biodiversity maintenance, climate regulation and maintaining the global carbon cycle [1,2]. However, these high-altitude systems are extremely sensitive to climate change, where increasing temperatures and shifting rainfall patterns threaten their stability. Such changes may trigger wetland degradation, diminish wetland capacity to capture carbon, and release previously stored carbon back into the atmosphere [3]. By the year 2030, Lesotho has pledged to achieve land degradation neutrality (LDN) [4]. This commitment involves enhancing soil organic carbon (SOC) across various land categories, with special attention given to wetland areas [4]. The national target includes a 5% improvement in land health and the rehabilitation of degraded zones. According to a study supported by the FAO [5], more than 30% of the country’s wetlands are experiencing soil degradation, underscoring the urgency for effective restoration measures.
The multi-functionality of wetlands is significantly interlinked with the rich biodiversity of soil microbes, and enzymatic activities are important components of the ecosystem [6]. However, wetlands in high-elevation and mountainous areas are more susceptible to climate change, and their ecosystem functions are altered with climate change [7,8,9]. Essential natural resources such as soil and water, which sustain agroecosystems and other agriculture-related activities, are being depleted as soil degradation processes intensify across all land uses, including wetlands [10]. The major drivers of the degree of soil degradation in alpine wetlands are soil erosion, overgrazing, climate change, invasive species, etc. [11], thus affecting soil enzyme activity, carbon pools, storage and its indices necessary to maintain wetland ecosystem services [12]. Therefore, the following question arises: how do soil carbon pools (CPs), associated indices, the carbon management index (CMI), and enzyme activity (SEA) respond to altitudinal variation in alpine wetlands? One suitable way to understand and respond to this question is through analysis of SEA, CMI, CPs and their related indices in the alpine environment.
Evaluating the CMI and SEA within wetland environments is essential for comprehending their contributions to climate stabilization and for supporting targeted conservation and rehabilitation measures [13]. As wetlands function as important reservoirs of carbon, the CMI serves to measure both their carbon storage potential and their susceptibility to disruption [13]. Analyzing the CMI provides a scientific foundation for making strategic choices about land management, ecosystem restoration, and approaches to mitigating climate change. Estimating soil enzyme activity offers a crucial understanding of how wetland ecosystems operate, particularly in relation to their roles in nutrient cycling and water purification [14]. The activity of enzymes in soil serves as a critical measure of soil health, soil microbial diversity, and ecological restoration and reflects the influence of different land management approaches [14]. Enzymes are more susceptible to instant turnover and respond rapidly to elevation variations, changes in soil management practices and natural environmental conditions [15,16]. Although previous studies have examined how elevation influences either the CMI or soil enzyme activity independently [17], few studies have evaluated these factors jointly within alpine wetland environments. In Lesotho’s alpine wetlands, significant research gaps remain concerning soil enzyme dynamics and the carbon management index. Few studies have focused specifically on these ecosystems, especially those under the combined pressures of altitudinal effects, climate change, overgrazing, and soil degradation. The results of the study conducted by Wu et al. [18] in the Helan Mountains, Northwest China, indicated that the relative abundance of nitrogen-acquiring enzymes, specifically N-acetyl-β-D-glucosaminidase and dehydrogenase, in the soil initially increased but then decreased as the altitude increased. Munoz et al. [19] reported a higher content of organic matter, likely a result of slow decomposition due to lower temperatures and soil pH in high-altitude ecosystems on the Andean Plateau.
A combined assessment of the CMI and enzyme dynamics across altitudinal gradients can offer valuable understanding of the particular carbon cycling mechanisms driven by various soil enzymes, as well as their cumulative impact on the carbon management capacity of these fragile ecosystems. Hence, the present study was performed to investigate the impact of altitudinal variation on the CMI and enzyme activities and to utilize principal component analysis (PCA) to explore the variation and correlation between SEA and CMI as influenced by altitudinal gradients in alpine wetlands. This study contributes to the establishment of baseline data on soil organic carbon content and stocks and the evaluation of the sequestration potential of these high-elevation wetlands to guide sustainable management strategies. We hypothesize that soil enzyme activity (SEA) decreases with altitude due to lower temperatures, leading to a higher CMI.

2. Materials and Methods

2.1. Description of the Study Area

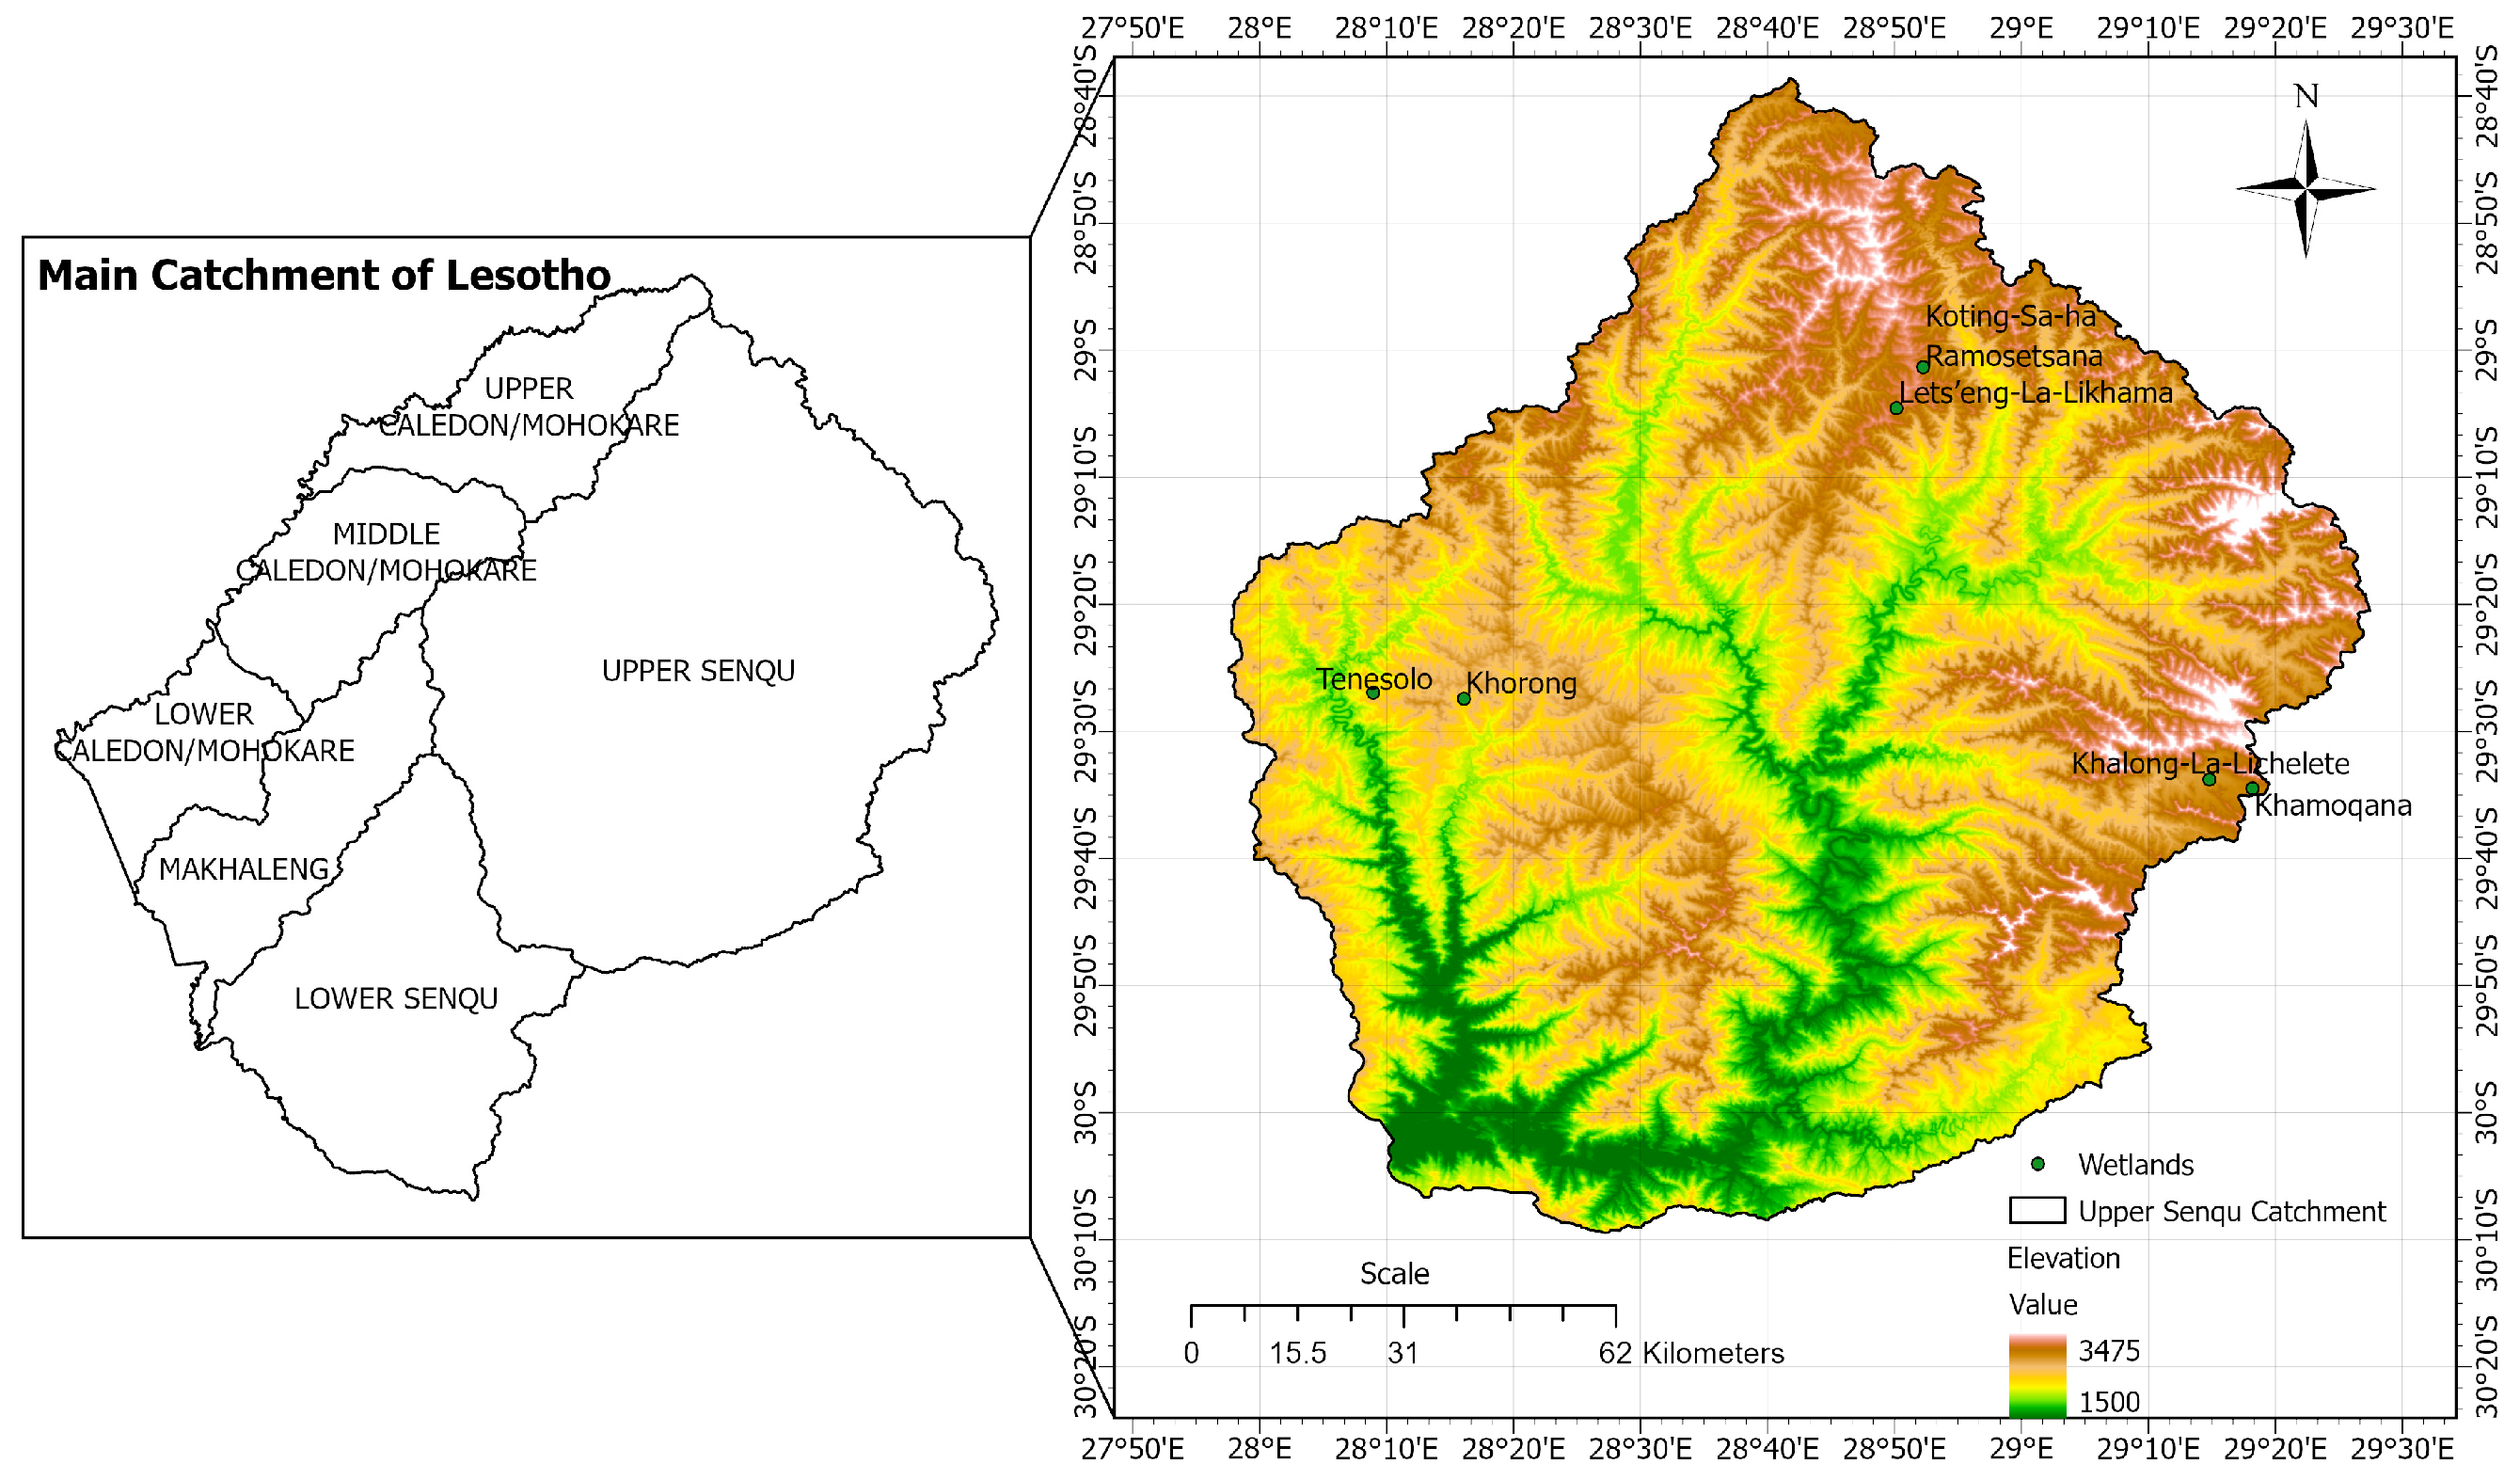
The present study was undertaken within Lesotho at elevations ranging from 2500 to 3089 m above sea level in the mountain agro-ecological zones (AEZs) of Mokhotlong and Ha-Mohale in three sub-catchments, namely, Khubelu, Senqunyane and Sani with the Upper Senqu main catchment in Lesotho. In each catchment, the two alpine wetlands were deemed for the current research, resulting in six alpine wetlands. In the Khubelu catchment, the Lets’eng-la-Likhama and Koting-sa-ha Ramosetsana wetlands were selected, whereas in the Senqunyane catchment, the Khorong and Tenesolo wetlands were chosen, whereas in the Sani catchment, the Khamoqana and Khalong-la-Lichelete wetlands were selected. The geographical map of Lesotho with ten districts within the African continent and the study sites (alpine wetlands) is illustrated in Figure 1. The GPS map showing the main catchment (Upper Senqu) in which the three sub-catchments (Khubelu, Senqunyane and Sani) falls under and wetlands is shown in Figure 2.

2.2. The Alpine Wetland Features

The population across all alpine wetland areas is minimal, with the human presence largely limited to cattle post settlements. In Lesotho’s mountainous agro-ecological regions, shrubs and grasses dominate as the primary vegetation types thrive at relatively high elevations. The geological composition of these wetlands is characterized by formations identified as Lesotho Genesis [20]. In Tenesolo, the wetland experienced significant degradation, which was caused primarily by vegetation burning, historical overgrazing, and burrowing by ice rats (Supplementary Figure S1a). Around Khorong, land use was dominated by cropping practices (Supplementary Figure S1b). In Khamoqana, ice rat burrowing led to the formation of holes, soil erosion from surface runoff, and the prevalence of sparse, shallow-rooted vegetation (Supplementary Figure S1c). The key diagnostic feature in Khalong-La-Lichelete was the presence of deep-rooted shrubs (Supplementary Figure S1d). At Lets’eng-La-Likhama, sparse grass cover, soil erosion due to limited vegetation, and overgrazing by sheep were the major forms of disturbance within the wetland (Supplementary Figure S1e). In Koting-Saha Ramosetsana, shrubs were the dominant vegetation surrounding the wetland, whereas grasses prevailed within it (Supplementary Figure S1f). The extent of soil degradation across the wetlands was evaluated via WET-Health version 2.0—a refined suite of tools designed to assess the present ecological conditions of wetland ecosystems—as described by Kleynhans [21] and Macfarlane et al. [22], with the results summarized in Table 1, with further descriptions in Supplementary Table S1.

2.3. Climate

Lesotho’s climate is shaped primarily by its location at the heart of the southern African Plateau. It can be described as sub-humid to temperate-cool, characterized by warm, rainy summers and cold, dry winters [18]. During winter, the average minimum temperature typically hovers at approximately 0 °C in June, which is the coldest month. In lowland regions, winter temperatures often fall between −1 °C and −3 °C, whereas in highlands, they can drop further to approximately −6 °C to −8.5 °C [23]. The mean annual temperatures are approximately 15.2 °C in lowlands and approximately 7 °C in highlands.
January usually records the country’s highest average maximum temperatures, with values reaching 32 °C in the lowlands and approximately 20 °C in the highlands. Annual rainfall varies across the country, ranging from approximately 500 mm to 1200 mm, and is particularly high in the northern and eastern areas. Most precipitation is approximately 85% and falls between October and April. In mountainous regions, winter frequently results in frost and snowfall. The average annual rainfall often recorded in the Tenesolo and Khorong wetlands is approximately 1000 mm, whereas in the Khamoqana, Khalong-La-Lichelete, Lets’eng-La-Likhama, and Koting-Sa-ha Ramosetsana wetlands, it averages approximately 1044 mm [23].

2.4. Design of the Study

A block design was employed in which altitudinal variation across alpine wetlands was grouped into blocks (catchments) with comparable features, particularly regarding their condition (degraded versus healthy) and elevation range, to minimize variability. By accounting for these characteristics, the treatment effects (altitudinal variation equivalent to alpine wetlands) were accurately measured. The altitude range was treated as a factor, represented by six alpine wetlands selected from three sub-catchments: Khubelu, Senqunyane, and Sani, i.e., two wetlands from each catchment. The treatment details (altitude equivalent to alpine wetlands are shown in Table 2.

2.5. Wetland Selection Criteria

The selection was performed at altitudes of ≥3000 m, ≥2500 m and ≥2800 m in the Khubelu, Senqunyane and Sani catchment areas, respectively, considering one degraded and healthy alpine wetland, assessed with WET HEALTH version 2.0 [21,22].

2.6. Selection of Sampling Points

The sampling points in each wetland were selected via a stratified random sampling method, and the points within each wetland were selected via a grid line pattern to select a representative sample that met the soil sampling objectives [24]. Each wetland was subdivided into four equal grids to obtain four replications.

2.7. Soil Sampling and Standard Analytical Procedures

Soil sampling was carried out in February 2025 (autumn season, i.e., wet season) in each wetland by collecting soil from 0 to 15 cm depth at multiple locations to make 10 sub-samples, for each replication resulting in a composite mixture. There were four replications taken per site. The soil was sampled at depths of 0–15 cm and 15–30 cm since organic carbon and biological activity are mainly concentrated in these upper horizons. The contrast between topsoil and subsoil reflects differences in root biomass, organic matter input, and microbial processes. This two-layer approach offers clearer insights into carbon pools, their stability, and how management practices influence both surface and shallow subsurface soils. The gathered soil samples were combined to form composites, air-dried in the shade, gently ground, and sieved through 2.0 mm and 0.5 mm mesh screens. After proper labeling, the samples were stored in polyethylene bags. Subsequent analyses of their physical and physico-chemical properties (Table 3), soil organic carbon pools and soil enzymatic activity were performed via established standard methods.

2.8. Soil Enzyme Activities

Composite rhizosphere soil samples were obtained from each wetland site at a uniform depth of 0–15 cm. Sampling involved carefully uprooting shrubs along with their roots and then gently shaking them to detach the soil adhering to the root zone. Approximately 1 g of rhizosphere soil was collected in sterile polyethylene zip bags, ensuring that bulk soil was excluded to prevent contamination. The samples were transported to the laboratory, sieved through a 2 mm mesh, and analyzed immediately on the day of collection. The soil moisture content was determined following the procedure outlined by Wu et al. [29], and these data were used for calculating enzyme activity. Dehydrogenase activity (DHA) was assessed via the method of Casida et al. [30], with the results expressed as μg TPF g−1 dry soil day−1. The formation of red triphenyl formazan (TPF) was quantified spectrophotometrically at 485 nm. Fluorescein di-acetate (FDA) hydrolysis was evaluated according to the methods of Green et al. [31] and expressed as μg fluorescein g−1 dry soil for 3 h−1, with fluorescence measured at 490 nm. β-Galactosidase (β-GaA) activity was determined via the method of Eivazi and Tabatabai [32], expressed as nmol p-nitrophenol g−1 dry soil h−1, and the absorbance was recorded at 420 nm.
In alpine wetland soils, FDA, DHA, and β-GaA serve as crucial markers of microbial processes and nutrient turnover. DHA and β-GaA play central roles in carbon (C) and nitrogen (N) cycling by driving the breakdown of organic matter [33]. In contrast, FDA offers a more general indication of microbial vitality and community abundance, as it reflects the activity of diverse living microorganisms [33]. Because these enzyme functions respond strongly to shifts in temperature, moisture levels, and organic matter content, they are widely regarded as reliable bioindicators for evaluating the ecological functionality and resilience of alpine wetland environments [34].

2.9. Soil Organic Carbon Pools and Carbon Management Index

Different fractions of organic carbon (OC) were quantified via a modified version of the Walkley and Black procedure, as outlined by Chan et al. [35]. The estimation of total organic carbon (TOC) was performed following the formula provided by Jha et al. [36] (Equation (1)):
Log10 TOC = 0.725 × log10 (Walkley-black carbon) + 0.198 × log10 (silt + clay) − 0.0759 × log10 (mean annual rainfall) + 0.015
The lability index (LI) and the carbon management index (CMI) were derived via Equations (2) and (3), following the approach outlined by [37].
Lability index (LI) = (CVL × 3 ÷ SOC) + (CL × 2 ÷ SOC) + (CLL × 1÷ SOC)
CPI = SOC of the sample (g kg−1) ÷ SOC in the reference (g kg−1)
where CPI = the carbon pool index.
The reference SOC values were derived from intact forested alpine wetland soils located beside the six chosen alpine wetland sites, which measured 112.20 g kg−1 at 0–15 cm depth and 82.50 g kg−1 at 15–30 cm depth. To estimate the reference SOC, soils were taken from undisturbed alpine forest soils adjacent to the study wetlands, with samples collected at two depths (0–15 cm and 15–30 cm). Four random samples from each depth were combined to form composite samples, ensuring that they represented the soil conditions accurately. The carbon management index (CMI) was subsequently determined via the equation proposed by Blair et al. [37].
CMI = CPI × LI × 100

3. Statistical Analysis

The data were analyzed statistically via analysis of variance, following the ANOVA for one-way factor analysis for block design as described by Panse and Sukhatme [38]. The critical variances for testing the means for statistical significance were computed at the 5 percent probability level. Tukey’s HSD test was applied to separate the means of the soil organic carbon (SOC) fractions and total organic carbon (TOC) at the 5% significance level. To evaluate the interrelationships among the soil properties, Pearson’s correlation and principal component analysis (PCA) were carried out via the SQI CAL software [39], which was designed for soil quality evaluation. This tool (available at https://nishantsinha51.shinyapps.io/SQICAL/ accessed on 28 October 2020) was used to explore the relationships among enzyme activity, the carbon management index, and altitudinal variation in alpine wetlands, as well as to identify key indicators for improving soil health. The PCA within the SQI CAL reduces data dimensionality by creating uncorrelated principal components (PCs) that retain most of the variability in the dataset. Components with eigenvalues exceeding one were retained, as these accounted for the dominant patterns in soil variation. Each soil property received a factor loading within its respective PC, reflecting its contribution. Only variables with high loadings were selected for further consideration. In cases where multiple variables clustered within a single PC, multivariate correlation analysis was conducted to assess redundancy. Noncorrelated variables were treated as independent and therefore retained. Variable weighting was based on the proportion of variance explained by each PC, standardized to unity. Eigenvalues and PCA contributions were derived directly from the analysis, and variables were selected on the basis of both eigenvalue thresholds and factor loadings (±10%). The SQI CAL also generated biplots and scree plots to assist in visualization and interpretation.

4. Results and Discussion

4.1. Impact of Altitudinal Variations on the Soil Bulk Density, Particle Size Distribution and Texture

The predominant soil texture identified was sandy loam in Khorong, Tenesolo and Lets’eng-La-Likhama (Table 4), which reflects favorable drainage soil conditions. In wetland areas situated at higher elevations, the soils were classified as loam (Table 4) according to the USDA soil taxonomy, suggesting a more balanced composition capable of enhanced water and nutrient retention. The clay content was significantly greater (25.19%) in Koting-Sa-ha Ramosetsana than in all the other wetlands. These findings align with observations by Eyayu et al. [40], who documented a greater proportion of clay in loam soils at elevated sites, which was likely attributable to increased organic carbon levels. Similarly, Reichert et al. [41] reported a gradual reduction in the sand fraction accompanied by a relatively high clay content as the altitude increased. The bulk density (BD) is an indicator of soil compaction and porosity [42]. Lower values generally indicate better soil structure and higher porosity [42]. A significantly lower BD value (1.09 Mg m−3) (Table 4) was recorded in Koting-Sa-ha Ramosetsana, indicating loosely packed soil with optimum porosity, which was probably due to higher soil organic carbon (SOC) contents at that altitude than at any other altitude in the wetlands, whereas Tenesolo had a significantly higher BD, suggesting more compacted soil.
Generally, BD decreases with increasing altitude, which aligns with the findings of a number of studies [43], in which they reported that relatively high altitudes often present low BD and relatively high SOC contents. Therefore, it may be assumed that lower temperatures and reduced microbial activity at higher altitudes lead to slower organic matter decomposition and better soil aggregation, thus reducing BD.
Soils with lower BD values have better connected pores that enhance water transmission and entry into the soil. Koting-Sa-ha Ramosetsana also exemplifies this pattern, reinforcing the idea that porous soils at higher altitudes are more permeable. Conversely, compacted soils such as those in Tenesolo restrict water movement. Soils rich in SOC with finer particles (clay, silt) hold more water. Loose and porous soils with lower BDs also enhance water retention. However, one limitation of this study is that bulk density and particle size distribution were assessed only during the wet season. Seasonal differences, particularly under dry conditions, may alter soil compaction, porosity, and microbial dynamics, potentially producing different trends.

4.2. Impact of Altitudinal Variations on Soil Physico-Chemical Attributes

Soil pH was significantly impacted by altitude in the alpine wetlands. The pH varied from 5.53 to 6.04, with the lower unit (5.53) and higher unit (6.04) under Lets’eng-la- Likhama (LLL): 3040–3080 m a.s.l. and Khorong (KRN): 2500–2550 m a.s.l. (Table 5). The pH values indicated slightly acidic soil conditions across all the wetlands (Table 5). The soil electrical conductivity (EC) was not significantly influenced by the variation in altitude of the alpine wetlands (Table 5). However, the EC varied from 0.29 to 0.35 dS m−1 across the wetlands, indicating low salinity in all the selected wetland soils. The status of soil organic carbon (SOC) varied significantly with altitudinal variation in the alpine wetlands at the 0–15 cm soil depth, ranging from 69.14 to 95.80 g kg−1, being significantly greater (95.80 g kg−1) at Koting-Sa-ha Ramosetsana (KSHM): 3087–3155 m a.s.l. than all other alpine wetlands at different elevations. Tenesolo (TNL): A value of 2552–2600 m a.s.l. was observed, with the lowest SOC (69.14 g kg−1) among all the wetlands. In general, the observations indicated that SOC increased with increasing altitude and decreased with increasing soil depth (15–30 cm) across the wetlands (Table 5).
The trend for slightly acidic pH across the wetlands is consistent with several other studies [44,45], which reported that soils at higher altitudes exhibit acidity, likely due to increased leaching of base cations and greater accumulation of organic matter. The studies of Ramesh et al. [46] and Wang et al. [47] also revealed lower pH values (<5.5) at high elevations in mountain topsoil. This pattern is likely the result of lower microbial activity and slower decomposition in cooler regions, especially at higher elevations, which results in organic acid accumulation, thus increasing acidity. Slight acidity may influence nutrient availability (especially P, Ca, and Mg), which may require liming to optimize the pH for productive vegetation.
Soil organic carbon (SOC) plays a crucial role in maintaining and enhancing the health of wetland soils. In general, the higher SOC recorded in the present study in all the wetlands is attributed to the acidic conditions of the soil and lower temperatures prevailing at higher elevations, as in the mountainous regions, slowing the rate of mineralization and hence increasing the SOC content. Similar results were reported by Nozari and Borůvka [48] in the Czech Republic, who reported increased leaching and reduced microbial activity at relatively high altitudes, contributing to increased leaching, reduced microbial activity and SOC accumulation. Olaleye et al. [49] also reported SOC concentrations in the higher-altitude wetlands of Lesotho, reinforcing this finding from a regional perspective. Higher SOC is critical for wetland health, as it enhances water retention, nutrient supply, and soil structure, which support biodiversity and ecosystem services.
Higher SOC at higher altitudes suggests better nutrient retention and organic matter content, which are beneficial for wetland productivity. Slightly acidic soils may affect nutrient availability; thus, liming could be recommended for the correction of the soil pH. Lower electrical conductivity (EC) values indicate minimal salinity stress on wetland vegetation. It should be noted, however, that other environmental factors not explored here, such as land use history, vegetation cover, and hydrological regimes, can also influence pH, SOC levels, and nutrient availability. These unaccounted variables may partly explain the variation observed between wetlands such as Tenesolo, which presented a lower SOC despite its altitudinal setting.

4.3. Impact of Altitudinal Variants on Soil Enzyme Activity

Soil dehydrogenase activity (DHA), β-galactosidase activity (β-GaA) and fluorescein diacetate activity (FDA) were significantly influenced by altitudinal variation in the alpine wetlands (Table 6). A significant declining pattern of DHA, β-GaA and FDA was observed with increasing altitude, suggesting that lower temperatures, reduced vegetation cover, and limited substrate inputs at higher elevations dampen microbial functioning. Even though the activity of these alpine wetlands decreased, significantly greater DHA, β-GaA and FDA activities were detected with Khorong (2500–2550 m a.s.l.), whereas the lowest activity was pronounced under Lets’eng-la-Likhama (3040–3080 m a.s.l.), followed by Koting-sa-ha Ramosetsana (3087–3155 m a.s.l.) among all the alpine wetlands, suggesting robust microbial respiration and metabolic activity in the Khorong wetland.
Lets’eng-La-Likhama (3040–3080 m a.s.l.), along with Tenesolo (2552–2600 m a.s.l.) and Khamoqana (2839–2880 m a.s.l.), presented significantly lower DHA values, indicating reduced microbial metabolism, likely due to harsher environmental conditions or lower organic matter inputs. This pattern aligns with the outcomes of Fan et al. [50], who reported that higher altitudes with lower temperatures (~2.5 °C) suppress microbial activity, which results in a reduction in DHA and promotes organic carbon accumulation due to slower decomposition rates.
β-Galactosidase activity (β-GaA) reflects the microbial capacity to degrade carbohydrates, particularly lactose and structurally similar polysaccharides. Khorong presented increased β-GaA, indicating the possibility for active microbial populations and increased organic matter turnover. Lets’eng-La-Likhama had lower β-GaA, and there was an overall decline in β-GaA with increasing elevation, suggesting that microbial carbohydrate decomposition is altitude-sensitive. Similarly, Fan et al. [50] reported a decline in β-enzymatic activity due to wetland degradation and lower nutrient inputs at high altitudes, whereas Ekenler and Tabatabai [51] reported that β-GaA is interlinked with soil organic matter (SOM) and is environmentally sensitive.
Although Koting-Sa-ha Ramosetsana has conducive biophysical conditions, it has a lower FDA, indicating that good physical traits do not always predict greater biological functionality. These findings point to other limitations, such as temperature stress, low organic inputs, or restricted microbial diversity. Khalong-La-Lichelete defined the trend with a higher FDA despite the altitude, suggesting unique local conditions that may buffer against elevation effects. Wang et al. [47] and Wu et al. [18] both reported altitude-dependent enzymatic shifts, reinforcing the findings of this study.
The FDA is highly sensitive to management practices, environmental shifts, and restoration efforts, making it an essential tool for ecological monitoring. Nevertheless, the present findings must be interpreted with caution since vegetation type, productivity, and cover factors known to strongly influence microbial communities and enzymatic activities were not included in this study. Additionally, because soil sampling was restricted to the wet season, seasonal microbial fluctuations that affect enzyme activity were not captured.

4.4. Impact of Altitudinal Variations in Soil Organic Carbon (SOC) Pools and Total Organic Carbon (TOC)

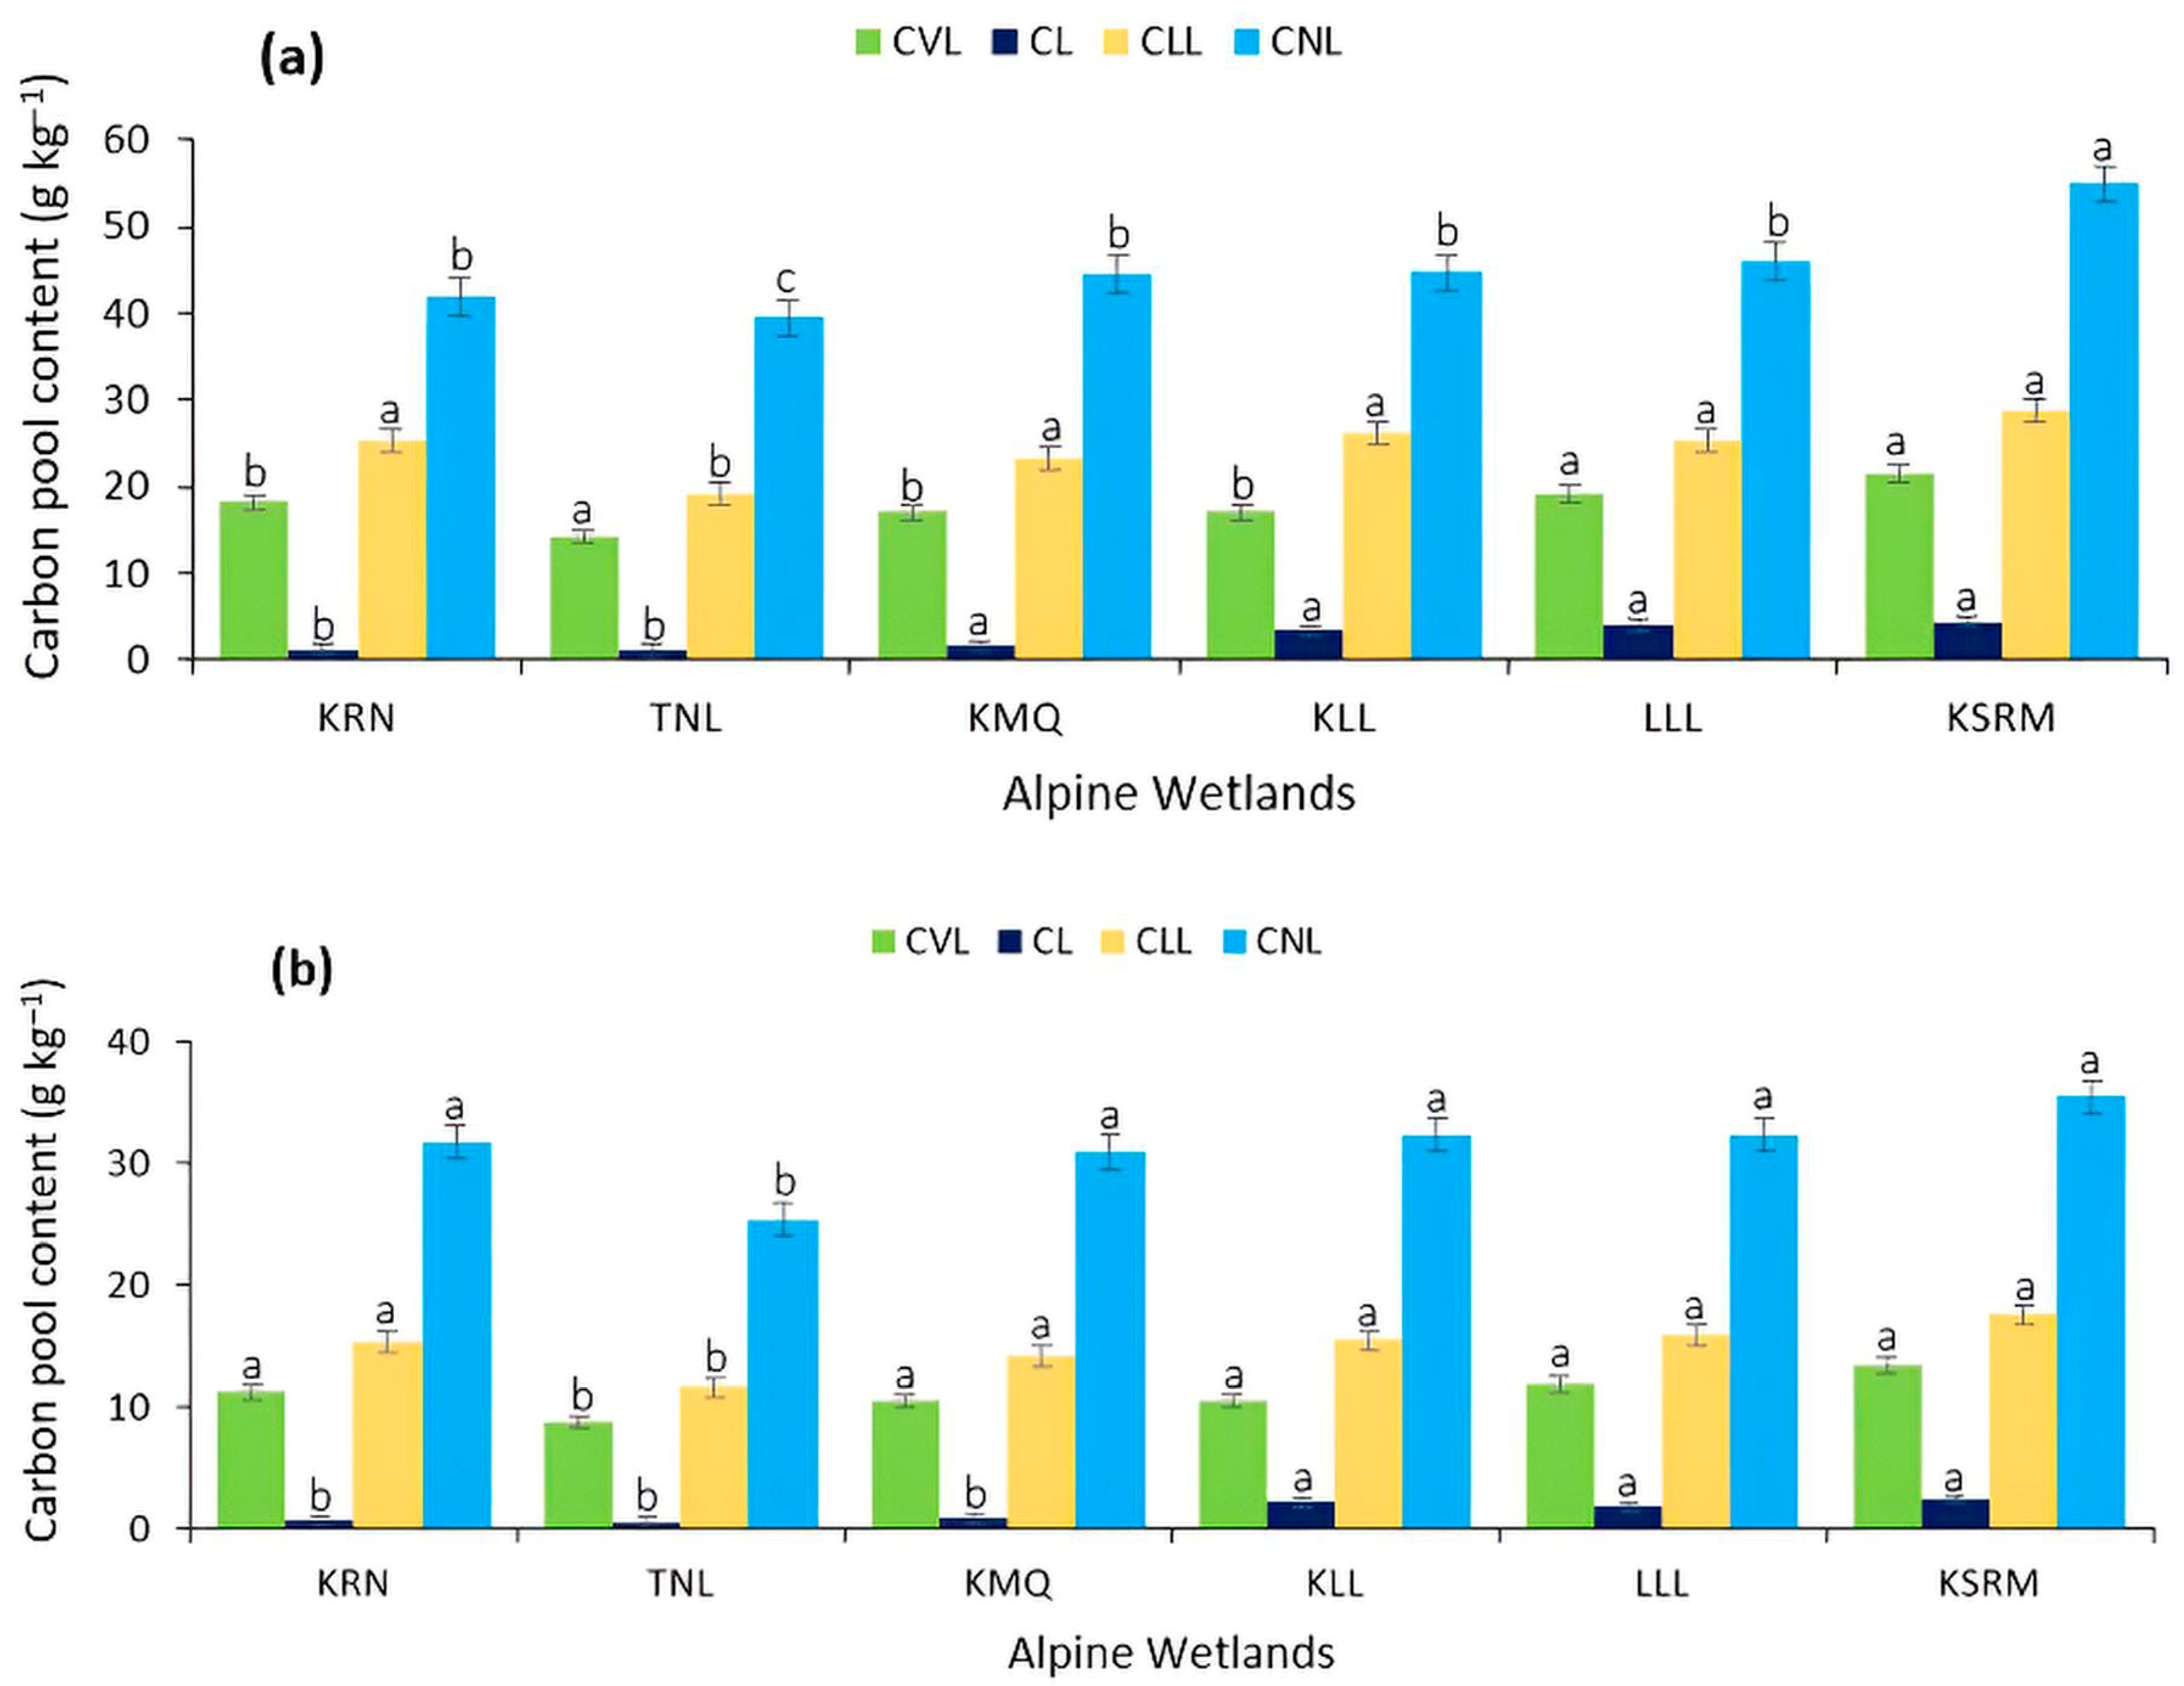
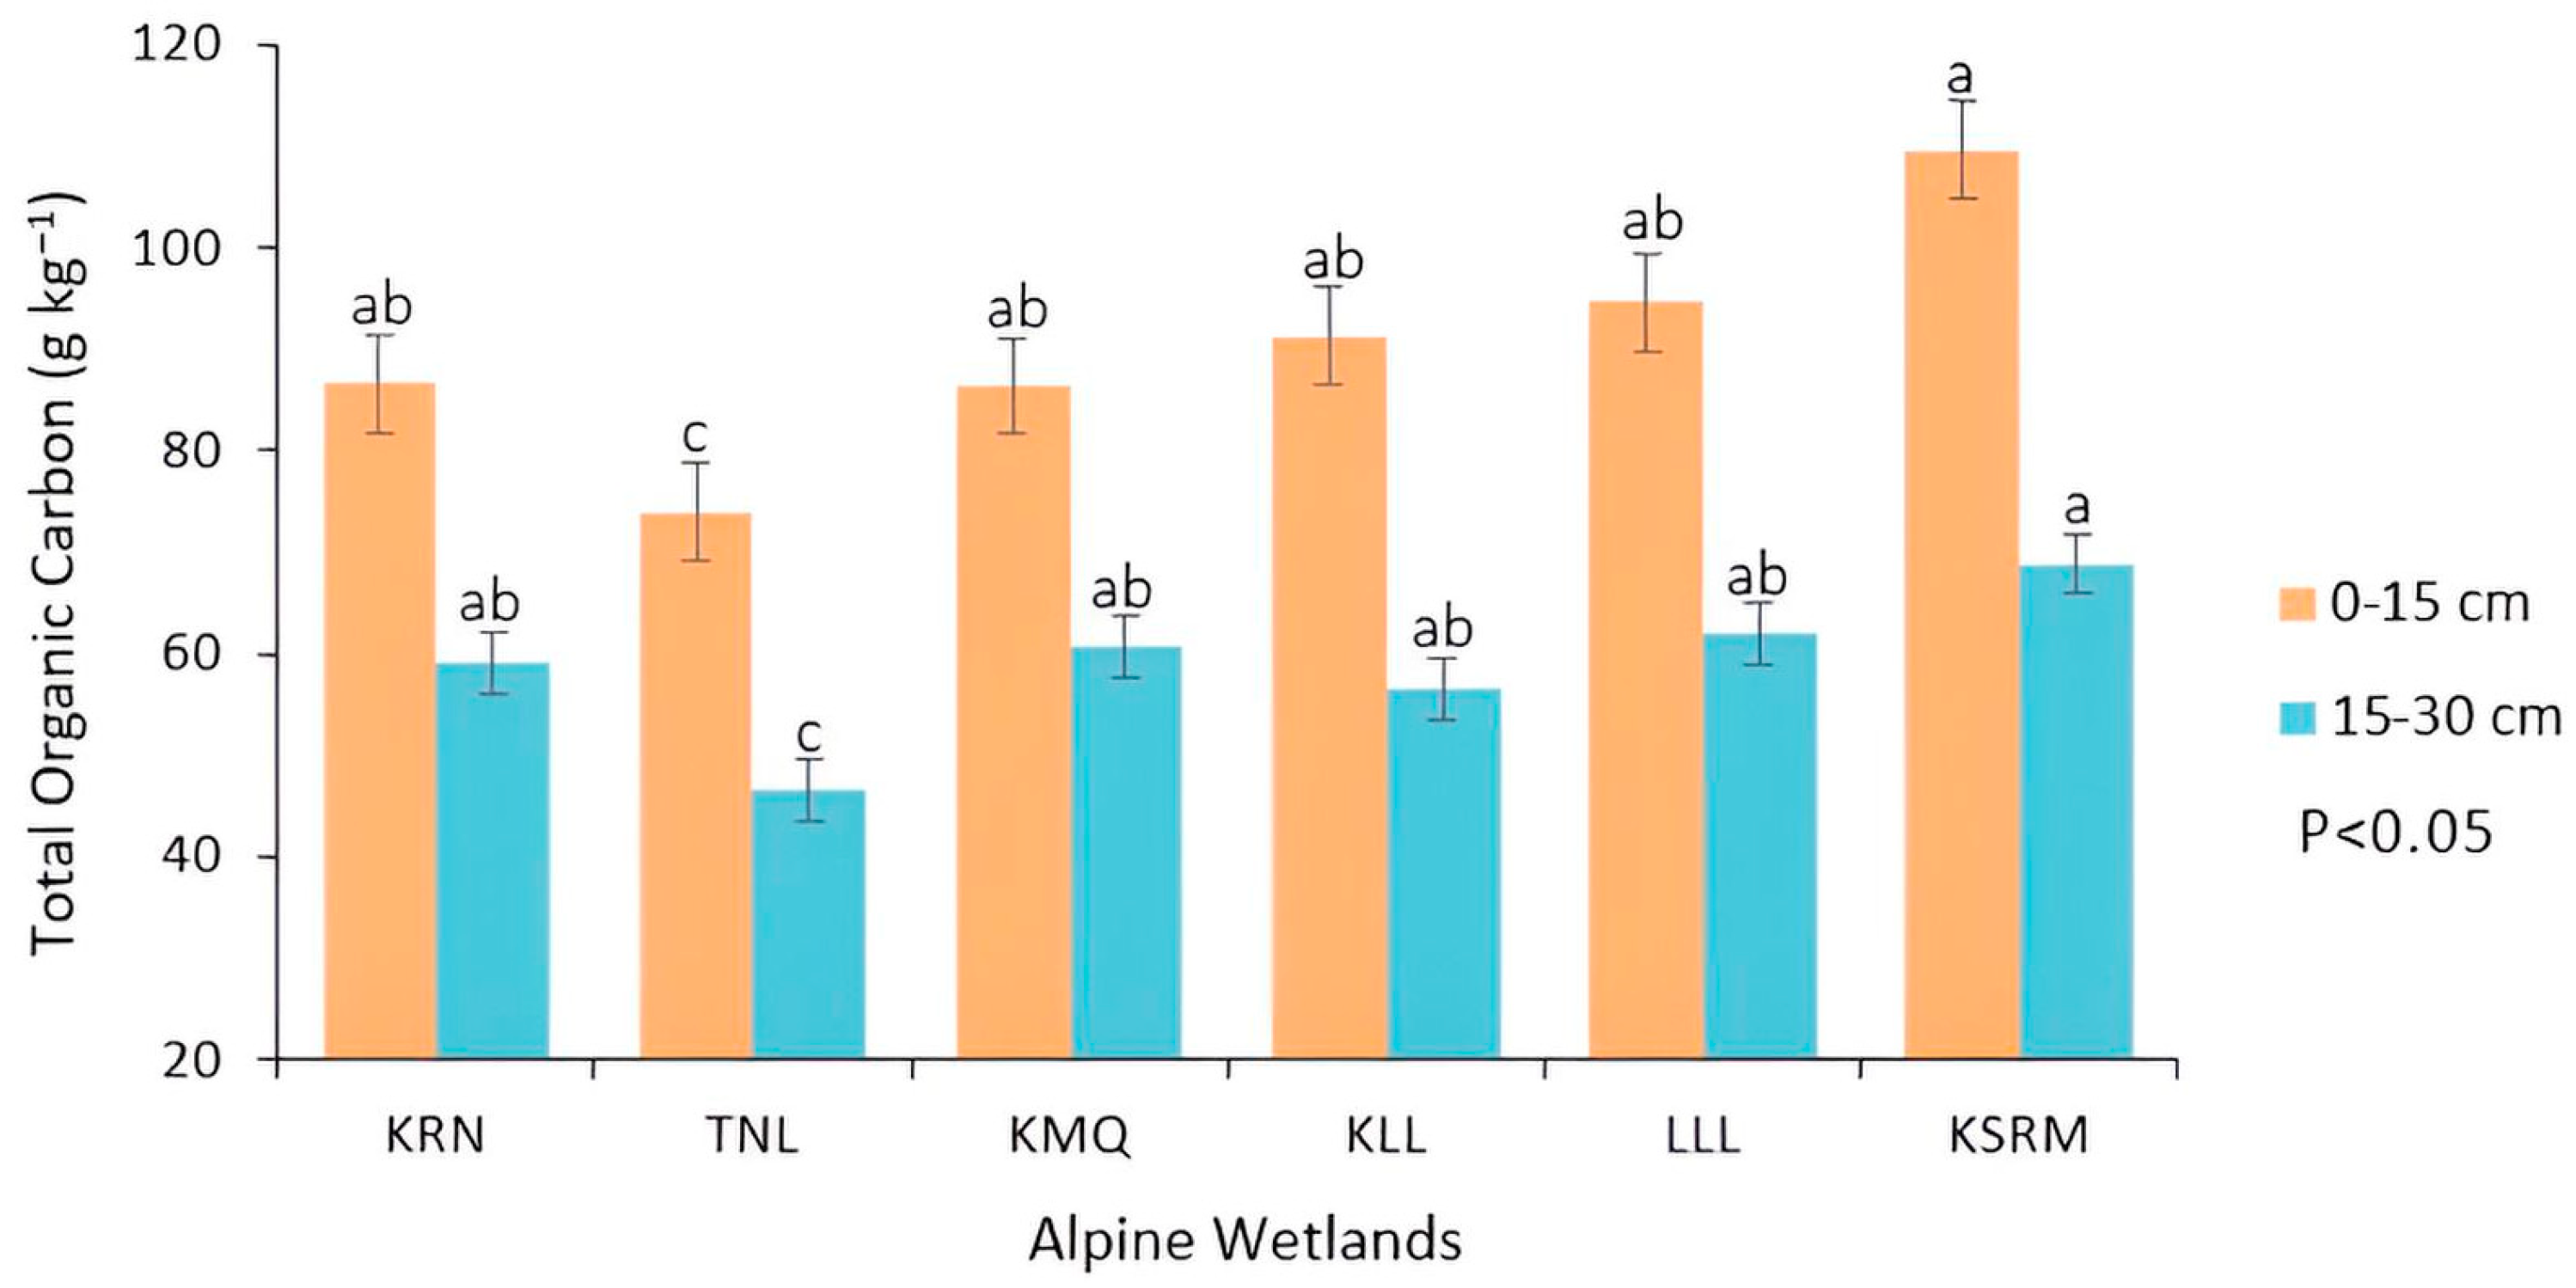
The very labile carbon (CVL), labile carbon (CL), less labile (CLL), and non-labile (CNL) pools and total TOC were significantly influenced by altitudinal variation in the alpine wetlands at both the 0–15 cm and 15–30 cm soil depths (Figure 3a,b and Figure 4). Significantly higher CVL, CL, CLL, CLL and TOC values were observed under Koting-sa ha Ramosetsana (3087–3155 m a.s.l.), whereas lower CVL, CL, CLL, CLL and TOC values were recorded under Tenesolo (2552–2600 m a.s.l.) at both soil depths, among all the other treatments (Figure 3a,b and Figure 4). All the SOC pools and TOC contents tended to decrease with increasing soil depth from 15 to 30 cm. Although CVL and CL were significantly greater in wetlands positioned at higher elevations (Koting-sa-ha Ramosetsana and Lets’eng-la-Likhama), there was no consistent trend because Khorong (2500–2550 m a.s.l.) recorded significantly greater CVL and CL values than did Khalong-la-Lichelete (2891–2995 m a.s.l.) and Khamoqana (2839–2880 m a.s.l.) (Figure 3a,b), indicating that better biophysical conditions occurred in Khorong (KRN) wetlands, probably because of the natural health status of the wetland assessed with the Wet Health version 2.0 assessment tool, regardless of altitude, in KRN. These SOC pools followed the ascending order of CNL < CLL < CVL < CL at the 0–15 cm and 15–30 cm soil depths (Figure 3a,b). The observed increase in very labile carbon (CVL), i.e., coarse visible litter and total organic carbon (TOC), with altitude, which peaked in the Koting-sa-ha Ramosetsana wetland, suggests a strong positive correlation between altitude and the accumulation of SOC in wetland soils. Conversely, the less labile (CLL) and nonlabile (CNL) fractions fluctuated across wetlands but generally presented higher values at greater elevations. The trend of increasing CVL and TOC with elevation may be attributed to several ecological and environmental factors associated with higher altitudes.
The decrease in temperature with increasing altitude slows microbial decomposition rates, allowing more organic residues (such as leaf litter and root biomass) to accumulate [52,53]. This reduces the turnover of organic matter and contributes to higher TOC and CVL contents. The greater SOC at higher altitudes is attributed to reduced decomposition, probably due to lower temperatures, alongside increased leaching and soil acidity [48]. These processes inhibit the microbial breakdown of organic inputs, leading to greater SOC accumulation in the soil. High-altitude wetlands typically support unique alpine vegetation with slower decomposition rates and greater litter inputs [54], which aligns with the findings of Olaleye et al. [49], who reported significantly greater soil organic matter (SOM) in mountainous agro-ecological zones in Lesotho than in lower-lying wetlands, confirming that elevation is a key driver of organic carbon enrichment. This could explain the consistency of higher CVL values at more elevated sites. However, soil parent material and land use pressure, both not considered in the present work, may also account for differences in SOC pools between wetlands. For example, the degraded conditions and lower SOC recorded in Tenesolo may reflect historical land use pressure and soil degradation rather than solely elevation effects.
The TOC content significantly varied among the wetlands, with relatively high values recorded at relatively high altitudes, e.g., Koting-Sa-ha Ramoseletsana and Letseng-La-Likhama. The results were unexpected because Koting-Sa-Ha ramoseletsane was initially scored as 85% healthy, whereas Letséng-La-Likhama scored 40% on the basis of the soil degradation level, which could be due to more SOC in the form of a passive pool of carbon and carbon stored in soils being accumulated over centuries. Therefore, altitude influenced the SOC pools, with more elevated wetlands having greater SOC pools, suggesting that wetland conservation and management strategies should consider altitudinal gradients for better soil health maintenance and carbon sequestration.

4.5. Active and Passive Pools of Carbon as Influenced by Altitudinal Variations in Alpine Wetlands

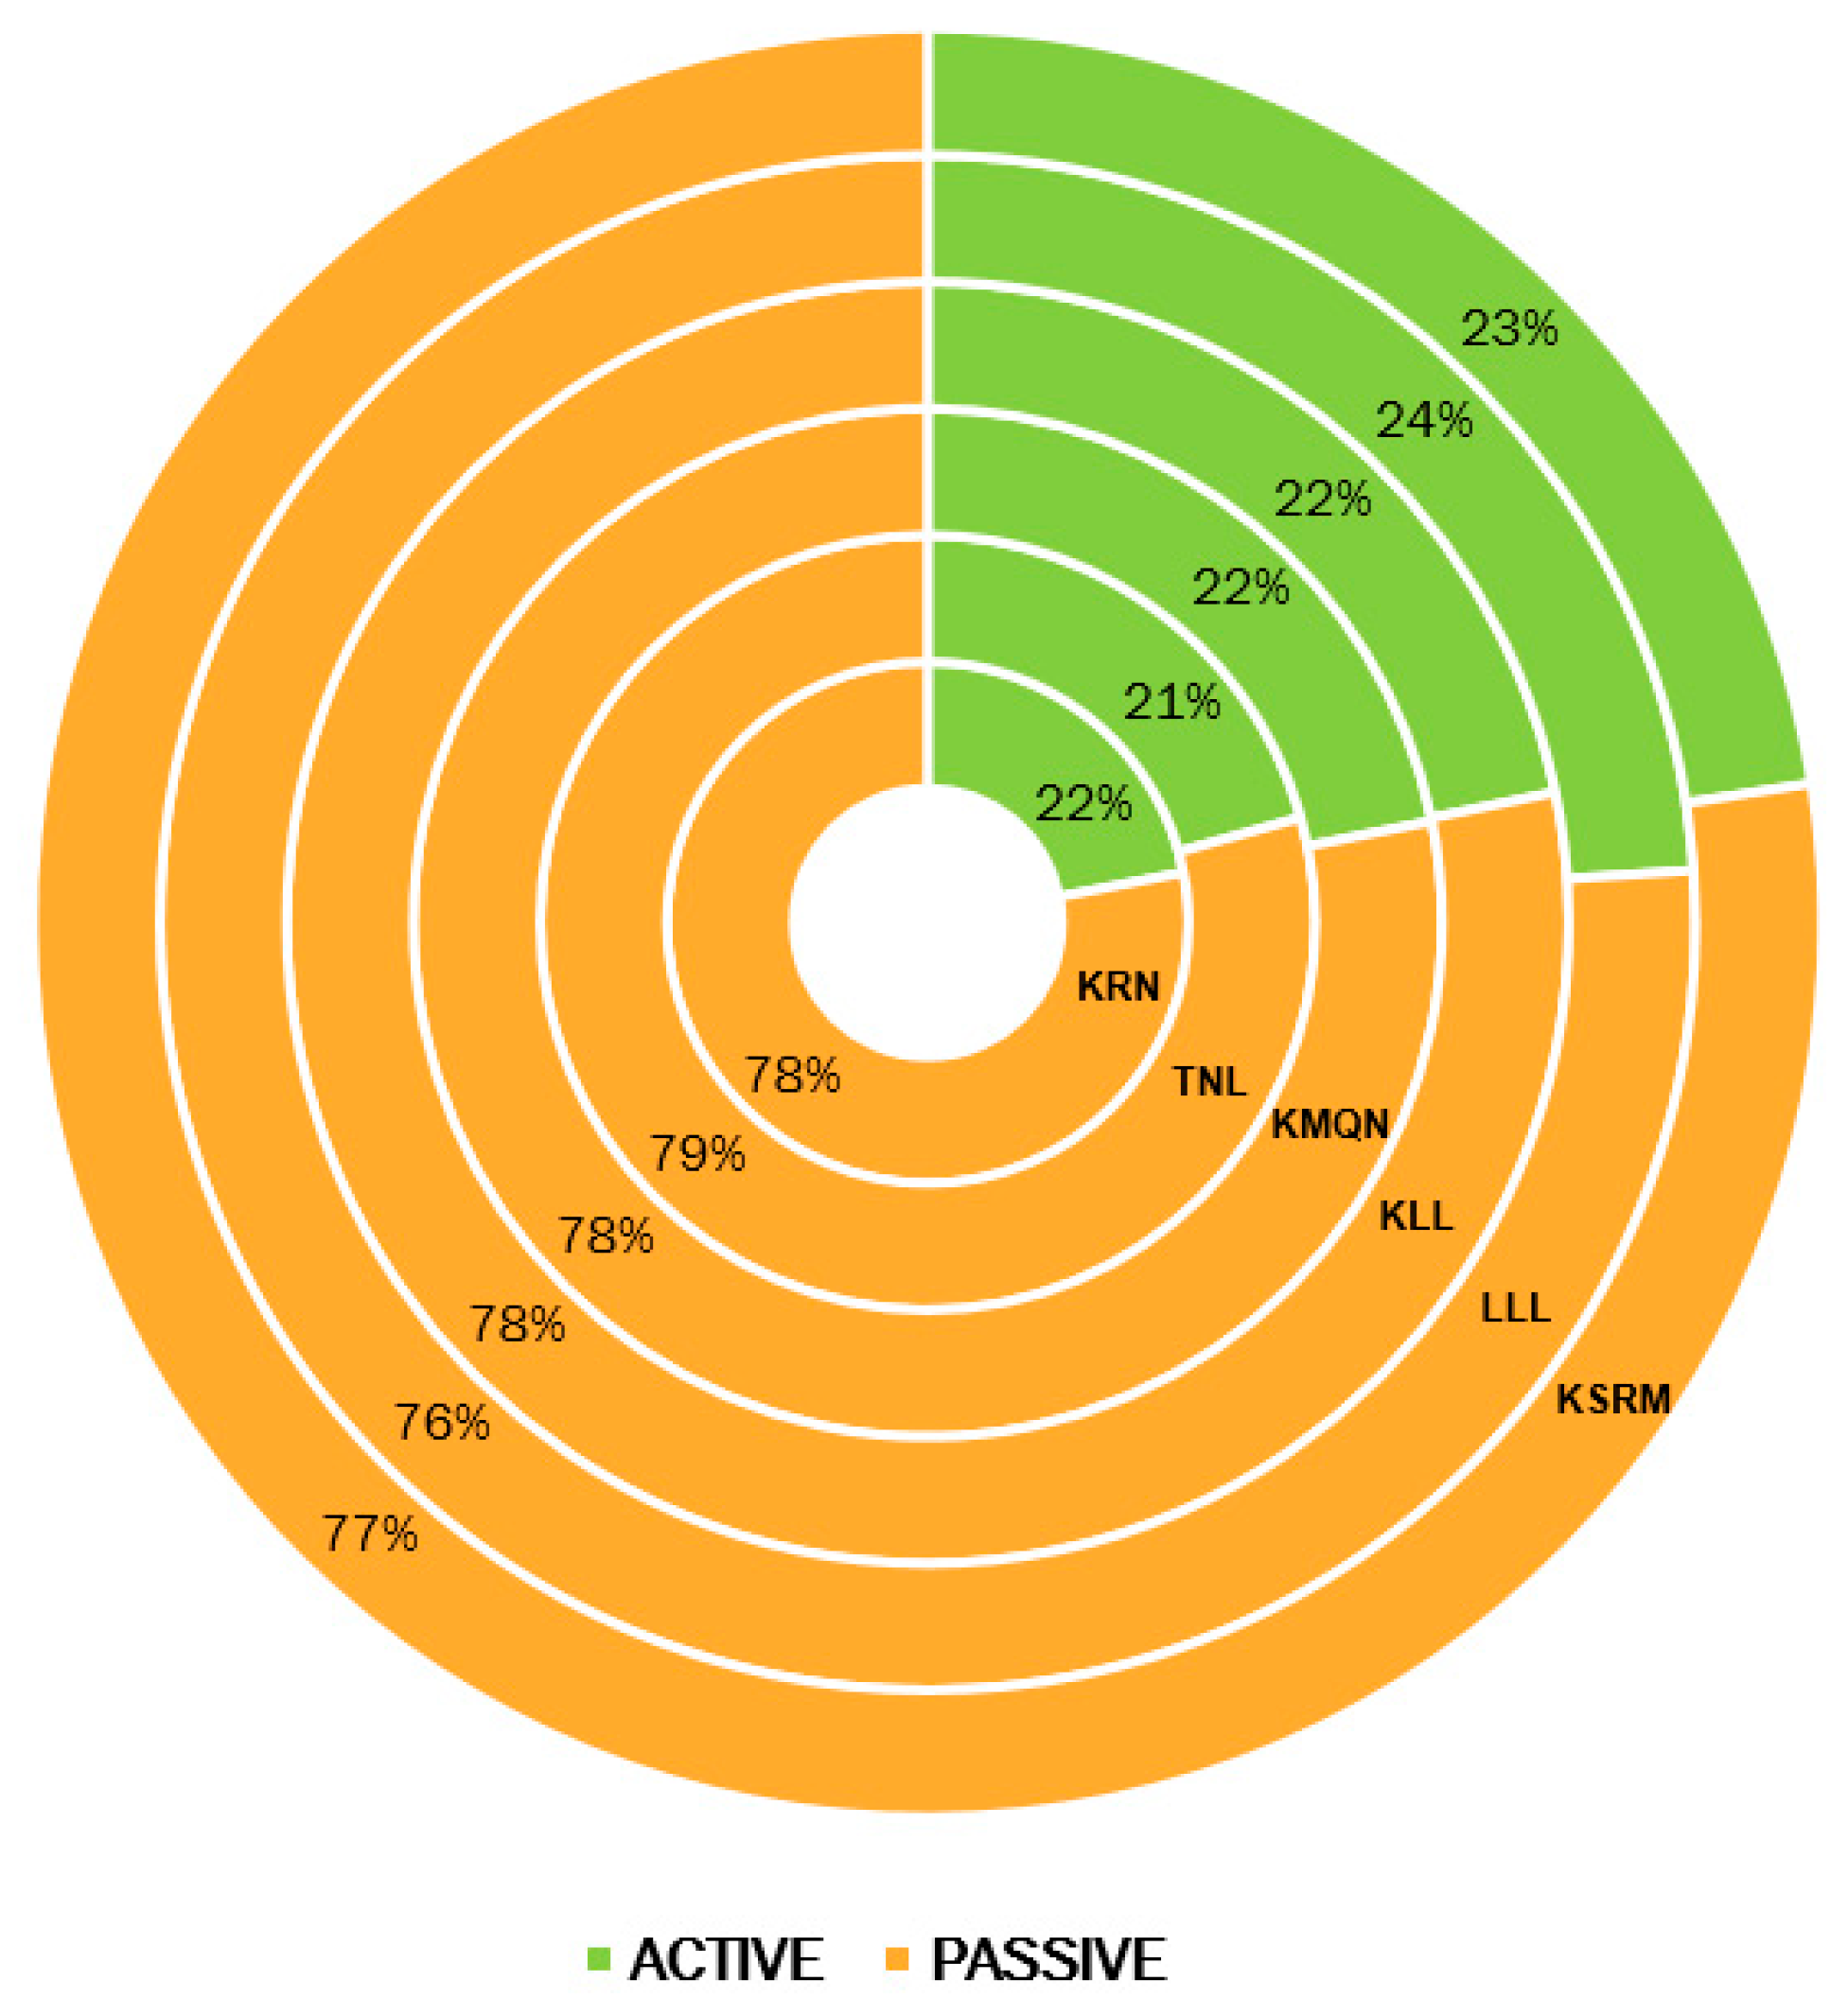
The active carbon (CACT) and passive carbon (CPSV) pools were greater (26.04 and 83.66 g kg−1) in Koting-Sa-ha Ramosetsana (3087–3155 m a.s.l.), respectively, and lower (15.48 and 58.53 g kg−1) in Tenesolo (2552–2600 m a.s.l.) (Figure 5). The CPSV increased with altitude across the wetlands and was the dominant contributor to total organic carbon, probably because of its recalcitrance coupled with the lack of treatment imposition in the wetland environment (Figure 5).
The CACT pool is the most responsive pool and is readily influenced by management practices and environmental changes, i.e., CACT pools disintegrate rapidly and oxidize readily with changes in management practices [55,56]. The CPSV pools are recalcitrant, form organic-mineral compounds, and breakdown at a slow pace through microbiological activities [56]. In the present study, the significantly greater CACT proportion in the Koting-Sa-ha Ramosetsana wetland was attributed to the naturally undisturbed nature of the wetland and increased soil organic matter (SOM), which likely increased biomass production. These CACT pools have been recognized as early indicators of soil quality because of their rapid response to management techniques [56]. The extent of the CACT and CPSV pools in this study may also be linked to vegetation inputs, hydrological dynamics, and disturbance history, which were not explored but could strongly influence carbon partitioning in alpine wetlands.

4.6. Percent Contribution of Active and Passive Pools of Carbon to Total Organic Carbon as Influenced by Altitudinal Variations in Alpine Wetlands

Compared with the active carbon (CACT) pool, the passive carbon (CPSV) pool was the main contributor to total organic carbon (TOC) (Figure 5). This could be due to the recalcitrance and slow sensitivity of nonlabile carbon pools to changes in the alpine environment, as this carbon pool is involved in the build-up of soil organic carbon stocks. The CPSV and CACT pools contributed 76–79% and 21–24%, respectively, to the total organic carbon (TOC) content.
The higher percentage contribution of CACT pools to the total organic carbon (TOC) content was 23–24% for Lets’eng-La-Likhama (3040–3080 m a.s.l.) and Koting-Sa-ha Ramosetsana (3087–3155 m a.s.l.) among all other wetlands, indicating that wetlands at high elevations can act as carbon sinks and store. CACT is the prime source of nutrients and can be easily harnessed by soil microbes; thus, the content of the CACT pool fluctuates rapidly in comparison with that of the CPSV pool [57]. Nevertheless, the CPSV pool is very resistant to microbial attack and can be preserved as organic-mineral complexes and difficult to access [58], which may increase its relative fraction within the TOC [57]. The better biophysical conditions because of little or no disturbance and lower temperatures at higher altitudes (Koting-Sa-ha Ramosetsana wetland) coupled with the complete natural conditions of the wetland with few modifications, a slight change in ecosystem processes and a small loss of natural habitats and biota might have influenced the decomposition rates, resulting in higher CACT turnover.

4.7. Impact of Altitudinal Variations on the Lability Index, Carbon Pool Index and Carbon Management Index

The lability index (LI) was significantly greater at the 0–15 cm soil depth than at the 15–30 cm soil depth. However, there was no significant effect of altitude on the LI (Table 7). The LI was elucidated by Hazra et al. [59] as the sum of the corresponding weights of the CL pool; thus, a greater LI signifies productive soil with the highest CACT. The carbon pool index (CPI) is used to represent the accrual of carbon (C) with respect to the reference C (C drawn from virgin soils adjacent to the six forested alpine wetlands). Parihar et al. [60] reported that a greater CPI signifies the accrual of SOC in the soil relative to a lower CPI. In the present study, the CPI was significantly greater (0.85) under Koting-Sa-ha Ramosetsana (higher elevated alpine wetland) at 0–15 cm, whereas a lower CPI (0.58) was observed under Tenesolo at 0–15 cm, i.e., lower elevated alpine wetland in comparison with all other alpine wetlands (Table 7). The CPI decreased with increasing soil depth (from 15 to 30 cm), exhibiting a trend similar to that of the 0–15 cm soil depth (Table 7).
Soil organic carbon (SOC) under elevated forested wetlands, particularly from virgin soils, is well established and documented to be greater than that of any other land use type [10]. The CMI is acquired from SOC pools and is essential for promoting soil quality, enhancing SOC sequestration [37,61,62] and assessing the magnitude of sequestration in different ecosystems, such as wetland regions. A relatively high CMI value signifies an environment conducive to increasing SOC and increasing soil health and quality [63]. In the present study, the CMI was significantly influenced by altitudinal variation in the selected alpine wetlands at the 0–15 and 15–30 cm soil depths. The decrease in CMI with increasing soil depth (from 15 to 30 cm) was notable. On the basis of the treatment comparison, the Koting-Sa-ha Ramosetsana alpine wetland was observed to have a significantly greater CMI (91.05 and 75.88) at soil depths of 0–15 and 15–30 cm, respectively, than all the wetlands did, suggesting that wetlands at higher elevations have the potential to store SOC, probably because of less susceptibility to soil disturbance as a result of human activities. Nonetheless, since sampling was limited to one season and excluded key variables such as vegetation productivity, hydrological processes, and disturbance history, the interpretation of CMI patterns should be made cautiously. A more holistic analysis that integrates both dry and wet season conditions, vegetation attributes, and site history would provide a clearer understanding of carbon management dynamics across altitudinal gradients.

4.8. Principal Component Analysis (PCA) and Variable Selection

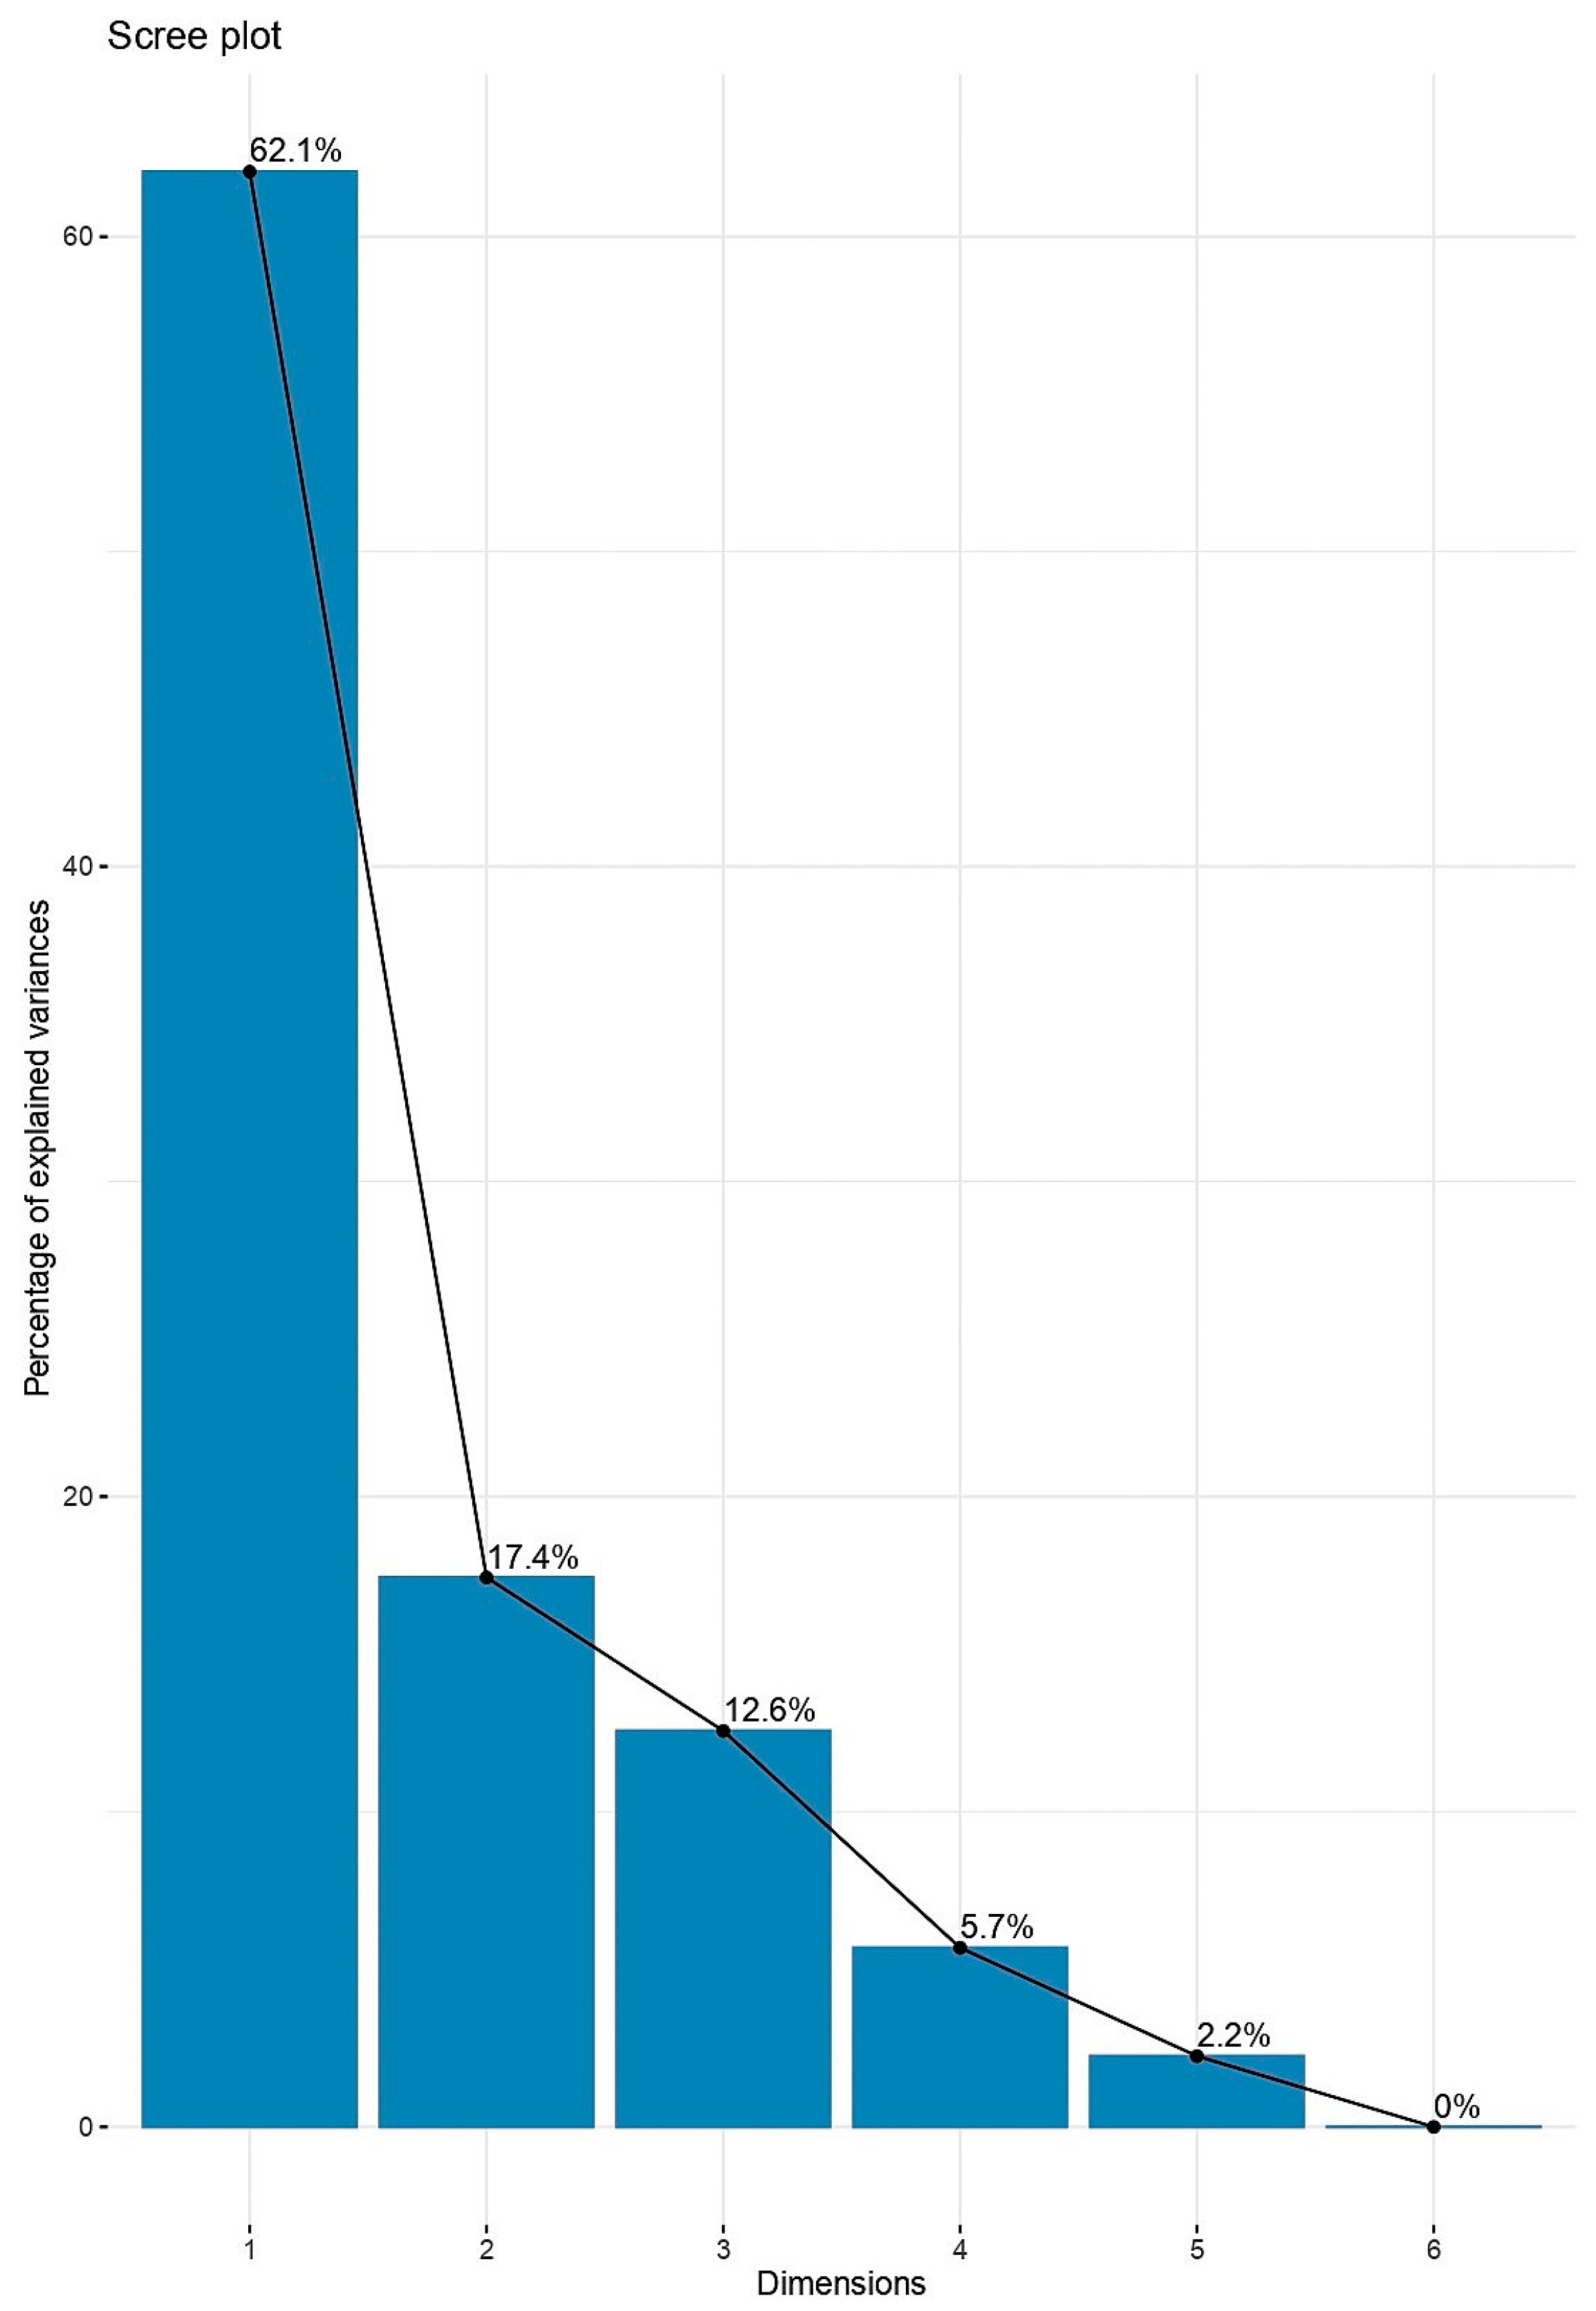
PCA was used to analyze and ascertain the associations among soil physical, physico-chemical, active and passive pools of carbon; the lability index; the carbon pool index; the carbon management index; and enzyme activity as impacted by altitudinal variation, which is equivalent to that of the respective alpine wetlands. The associations of the soil physical, physico-chemical, active and passive pools of carbon, lability index, carbon pool index, and carbon management index with enzyme activity were negative and non-significant (Supplementary Table S2). In alpine wetlands and higher elevations, these negative and non-significant correlations with elevation are a result of the complex interplay of various factors and the potential for local variations, limiting the understanding of these relationships [64]. In high-altitude regions, a negative correlation between the carbon management index (CMI) and enzyme activity is often observed, probably due to factors such as low temperatures, limited nutrient availability, and changes in microbial communities [64]. These conditions can slow decomposition processes, leading to increased soil organic carbon (SOC) storage (higher CMI) but reduced enzyme activity (which typically indicates decomposition). Hence, a detailed analysis of local conditions and specific soil attributes is necessary in alpine environments. The PCA clustered all the observations into 6 principal components (PCs) (Figure 6). PC1 contributed 62.1% of the explained variance, with an eigenvalue(s) of 11.15, suggesting overfitting, as validated by the scree plot (Figure 6).
As numerous datasets are dependent, the indicators or variables were selected on the basis of PCA and correlations among the soil parameters (Supplementary Table S3). The variables selected from PC1 at both soil depths (0–15 cm and 15–30 cm) were soil organic carbon (SOC), the carbon pool index (CPI) and the carbon management index (CMI), whereas clay and sand were selected at the 0–15 cm soil depth (Supplementary Table S3). The active pool of carbon (CACT) and the passive pool of carbon (CPSV) were also selected as variables in PC1 at the 0–30 cm soil depth (Supplementary Table S3).
Soil organic carbon (SOC), along with its pool indices and active versus passive fractions, often contributes heavily to the first principal component (PC1) because these variables are closely related as indicators of soil health and carbon storage potential. Texture-related properties such as clay and sand are included since they influence SOC distribution and stabilization by shaping water retention, aggregation, and physical protection of organic matter [65]. The carbon management index (CMI) and carbon pool index are derived from the labile (active) and stable (passive) pools of SOC. PC1 therefore reflects the main source of variation in these soil attributes, representing the combined effects of soil texture alongside chemical processes regulating organic matter dynamics in the alpine soil.
In the biplot, the indicators CMI.1 (0–15 cm), CMI.2 (15–30 cm), CPI.1 (0–15 cm), CPI.2 (15–30 cm), CACT (0–30 cm), CPSV (0–30 cm), SOC1 (0–15 cm), and SOC2 (15–30 cm) exhibited strong positive associations. These variables were the main contributors to site-to-site variation and loaded heavily on PC1, as indicated by their extended vector lengths (Figure 7).
In contrast, fluorescein diacetate activity (FDA), dehydrogenase activity (DHA), and β-galactosidase activity (β-GaA) clustered together with strong positive correlations and presented high loadings on PC2 (Figure 6). Notably, the variables aligned with PC1 (CMI.1, CMI.2, CPI.1, CPI.2, CACT, CPSV, SOC1, and SOC2) displayed negative correlations with those projecting strongly on PC2 (FDA, DHA, and β-GaA) (Figure 7).
The observed negative relationships between soil organic carbon and its pools (such as the carbon pool index and active/passive fractions) and enzyme activity in alpine wetlands are likely linked to the stabilization of organic matter into forms that are less readily available for microbial use under suboptimal environmental conditions. Elevated values of the carbon pool index (CPI) and CMI often reflect a greater proportion of resistant or passive carbon, which demands greater enzymatic effort for decomposition. Alternatively, constraints such as low temperatures or excessive moisture in the alpine environment may suppress enzyme performance, even when carbon substrates are present. Research in alpine wetlands of the Tibetan Plateau and the Himalayan region has shown that soil enzyme activity and carbon pools often exhibit an inverse relationship [66]. For example, enzyme activities linked to the breakdown of plant-derived materials were found to decline as soil organic carbon (SOC) levels increased, a trend attributed to peatland degradation and lowered water tables under changing climatic conditions [66].

5. Conclusions

Understanding how soil physical, chemical, and biological properties vary with altitude is key to indirectly predicting the effects of climate change on alpine wetlands. Higher elevations, particularly at Koting-Sa-ha Ramosetsana (KSHM), presented increased clay contents, soil organic carbon (SOC), active (CACT) and passive carbon pools (CPSVs), carbon pool indices (CPIs), and CMIs. These trends suggest stronger carbon retention and adaptation potential in high-altitude areas. However, the activity of enzymes (SEAs), including dehydrogenase, fluorescein diacetate, and β-galactosidase, decreased markedly with increasing elevation, with KSHM recording the lowest values compared with those at lower sites such as Tenesolo and Khorong. This reduction in SEA implies slower nutrient turnover, diminished microbial functioning, and possible nutrient shortages for vegetation and a less sensitive ecosystem to environmental changes, which are driven primarily by colder conditions, fluctuations in soil moisture, repeated freeze–thaw events, and alterations in soil characteristics such as organic carbon and nitrogen levels, all of which regulate the enzymes involved in organic matter decomposition and nutrient release. The carbon pools followed the ascending order of non-labile carbon (CNL) < less labile carbon (CLL) < very labile carbon (CVL) < labile carbon (CL), with CPSV contributing 76–79% of the total organic carbon. These findings emphasize the need for altitude-specific soil management strategies in alpine wetland conservation. These findings support Lesotho’s LDN goals by prioritizing high altitude wetland protection. To preserve and enhance ecological function, alpine zones should be formally recognized as priority areas for conservation. Practices such as promoting native vegetation cover, minimizing anthropogenic disturbances, and implementing sustainable land use strategies, such as rotational grazing, can help maintain or even improve soil carbon stocks. In contrast, wetlands such as the Tenesolo alpine wetland demonstrated poor performance across multiple soil variables, highlighting the urgent need for targeted restoration interventions, including erosion control, soil enrichment, and re-establishment of vegetation to restore the ecological balance and improve soil functionality.

6. Future Line of Work

Metagenomic research in alpine soils is necessitated to fill key knowledge gaps by generating detailed profiles of microbial communities and their functions, beyond the scope of conventional techniques. This can give insights into how microbes adapt to harsh conditions such as climate change and uncovers novel genes and enzymes with biotechnological potential. Coupling high-throughput sequencing with soil analyses can also clarify the relationship between microbial composition and function, offering insights into ecosystem resilience and responses to environmental shifts. There is a need for further research to explore multi-seasonal data in as to understand temporal changes in enzyme activity and SOC.

Supplementary Materials

The following supporting information can be downloaded at: https://www.mdpi.com/article/10.3390/su17198571/s1, Figure S1: Overview of Tenesolo; Table S1: Ecological class utilized for percentage score (PES) evaluations of inland aquatic ecosystems in South Africa, along with the applicable range of PESs for each class; Table S2: Pearson correlation matrix of soil physical, physico-chemical, enzymatic, active and passive pools of carbon; lability index; carbon pool index; and carbon management index as influenced by altitudinal variation in alpine wetlands; Table S3: Principal component analysis and selection of potential variables for improving soil health in alpine wetlands;

Author Contributions

Research conceptualization, methodology, discussion and figure preparation, supervision and editing of the main manuscript text, supervision of field investigations: K.N., D.M., M.M. (Mosiuoa Mochala) and M.M. (Makoala Marake), investigation, data collection and extraction, interpretation of results and review of literature evaluation: K.N., T.R. and K.K., statistical analysis of data and draft writing, design and supervision: K.N. and J.M.K.O., investigation, data collection and processing: K.N. and B.M. All authors have read and agreed to the published version of the manuscript.

Funding

The research project was funded by the Deutsche Gesellschaft für Internationale Zusammenarbeit (GIZ) and the German Government. The funds were managed by the WaterNet Trust.

Data Availability Statement

Data are provided within the manuscript or Supplementary Materials.

Acknowledgments

The authors are extremely thankful to the Government of Lesotho, in general, and the ReNOKA movement in particular, which initiated and coordinated the implementation of the Integrated Catchment Management Programme in Lesotho, the EU, Deutsche Gesellschaft für Internationale Zusammenarbeit (GIZ) and the German Government for providing funds for the implementation of this study, as well as WaterNet for managing the research fund.

Conflicts of Interest

The authors declare that they have no competing interests.

References

  1. Chen, S.Y.; Wei, P.J.; Wu, T.H.; Wu, Q.B.; Luo, F.D. Effect of permafrost degradation on carbon sequestration of alpine ecosystems. Sci. Total Environ. 2023, 899, 165642. [Google Scholar] [CrossRef]
  2. Zhao, R.; Wang, J.; Li, L.; Zhang, L.; Lu, H.; Jiang, X.; Chen, X.; Han, Z.; Dang-zhi, C.; Wang, H.; et al. Evaluation of alpine wetland ecological degradation based on alpine wetland degradation index: A case study in the first meander of the yellow river. Ecol. Indic. 2024, 158, 111414. [Google Scholar] [CrossRef]
  3. Reza Maddahi. 2015. Carbon Capture and Storage Under the Paris Agreement: A Legal Appraisal of Compatibility and Opportunities. Available online: https://unfccc.int/process/the-paris-agreement/long-term-strategies (accessed on 19 December 2020).
  4. UNCCD. The Multiple Impacts of Conflict on Land Degradation. 2019. Available online: https://knowledge.unccd.int/publications/multiple0impacts-conflict-land-degradation (accessed on 1 July 2025).
  5. FAO. Soil Erosion Key Driver of Wetland Degradation in Lesotho; FAO: Rome, Italy, 2022. [Google Scholar]
  6. Ogola, H.J.O.; Ijoma, G.N.; Edokpayi, J.N. Exploring the dichotomy: Shotgun metagenomics reveals diversity of beneficial and pathogenic protist community in arid wetlands of northeastern South Africa. Sci. Total Environ. 2024, 946, 174306. [Google Scholar] [CrossRef]
  7. Bentley, L.K.; Robertson, M.P.; Barker, N.P. Range contraction to a higher elevation: The likely future of the montane vegetation in South Africa and Lesotho. Biodivers. Conserv. 2019, 28, 131–153. [Google Scholar] [CrossRef]
  8. Lee, S.Y.; Ryan, M.E.; Hamlet, A.F.; Palen, W.J.; Lawler, J.J.; Halabisky, M. Projecting the hydrologic impacts of climate change on montane wetlands. PLoS ONE 2015, 10, e0136385. [Google Scholar] [CrossRef] [PubMed]
  9. Mofutsanyana, S.S.; Collins, N.B.; Adelabu, S.A.; Chatanga, P.; Sieben, E.J. Changes in plant functional composition of wetland vegetation along an aridity gradient on the Highveld plateau of South Africa. Appl. Veg. Sci. 2020, 23, 622–634. [Google Scholar] [CrossRef]
  10. Nthebere, K.; Tata, R.; Bhimireddy, P.; Chandran, L.P.; Gudapati, J.; Admala, M.; Sinha, N.K.; Srikanth, T.B.; Prasad, K. Impact of Conservation Agriculture on Soil Quality and Cotton–Maize System Yield in Semi-Arid India. Sustainability 2025, 17, 978. [Google Scholar] [CrossRef]
  11. Kumar, S.; David-Raj, A.; Kalambukattu, J.G.; Chatterjee, U. Climate change impact on land degradation and soil erosion in hilly and mountainous landscape: Sustainability issues and adaptation strategies. In Ecological Footprints of Climate Change: Adaptive Approaches and Sustainability; Springer International Publishing: Cham, Switzerland, 2023; pp. 119–155. [Google Scholar]
  12. Padbhushan, R.; Kumar, U.; Sharma, S.; Rana, D.S.; Kumar, R.; Kohli, A.; Kumari, P.; Parmar, B.; Kaviraj, M.; Sinha, A.K. Impact of land-use changes on soil properties and carbon pools in India: A meta-analysis. Front. Environ. Sci. 2022, 9, 794866. [Google Scholar] [CrossRef]
  13. Sainepo, B.M.; Gachene, C.K.; Karuma, A. Assessment of soil organic carbon fractions and carbon management index under different land use types in Olesharo Catchment, Narok County, Kenya. Carbon Balance Manag. 2018, 13, 4. [Google Scholar] [CrossRef]
  14. Hill, B.H.; Elonen, C.M.; Herlihy, A.T.; Jicha, T.M.; Serenbetz, G. Microbial ecoenzyme stoichiometry, nutrient limitation, and organic matter decomposition in wetlands of the conterminous United States. Wetl. Ecol. Manag. 2018, 26, 425–439. [Google Scholar] [CrossRef]
  15. Wu, Y.; Li, Y.; Fu, X.; Liu, X.; Shen, J.; Wang, Y.; Wu, J. Three-dimensional spatial variability in soil microorganisms of nitrification and denitrification at a row-transect scale in a tea field. Soil Biol. Biochem. 2016, 103, 452–463. [Google Scholar] [CrossRef]
  16. Martín-Sanz, A.; Rueda, S.; García-Carneros, A.B.; González-Fernández, S.; Miranda-Fuentes, P.; Castuera-Santacruz, S.; Molinero-Ruiz, L. Genetics, host range, and molecular and pathogenic characterization of Verticillium dahliae from sunflower reveal two differentiated groups in Europe. Front. Plant Sci. 2018, 9, 288. [Google Scholar] [CrossRef]
  17. Cui, Q.; Yang, H.; Wang, G.; Ma, J.; Feng, L.; Liu, J. Response of soil carbon fractions and enzyme activities to mowing management on in a coastal wetland of the yellow river delta. Front. Mar. Sci. 2022, 9, 993181. [Google Scholar] [CrossRef]
  18. Wu, Z.; Liu, Y.; Li, G.; Han, Y.; Li, X.; Chen, Y. Influences of environmental variables and their interactions on Chinese farmland soil organic carbon density and its dynamics. Land 2022, 11, 208. [Google Scholar] [CrossRef]
  19. Munoz, M.A.; Faz, A.; Mermut, A.R. Soil carbon reservoirs at high-altitude ecosystems in the Andean plateau. In Climate Change Impacts on High-Altitude Ecosystems; Springer International Publishing: Cham, Switzerland, 2015; pp. 135–153. [Google Scholar]
  20. Schmitz, G.; Rooyani, F. Lesotho Geology, Geomorphology, Soils; National University of Lesotho: Roma, Lesotho, 1987; p. 204. [Google Scholar]
  21. Kleynhans, C.J. A qualitative procedure for the assessment of the habitat integrity status of the Luvuvhu River (Limpopo system, South Africa). J. Aquat. Ecosyst. Health 1996, 5, 41–54. [Google Scholar] [CrossRef]
  22. Macfarlane, D.; Kotze, D.; Ellery, W.; Walters, D.; Koopman, V.; Goodman, P.; Goge, M. WET-Health: A Technique for Rapidly Assessing Wetland Health; Water Research Commission: Pretoria, South Africa, 2009; pp. 235–247. [Google Scholar]
  23. Malebajoa, M. Climate Change Impacts on Crop Yields and Adaptive Measures for Agricultural Sector in the Lowlands of Lesotho. Master’s Thesis, Department of Physical Geography and Ecosystem Analysis, Lund University, Lund, Sweden, 2010. Available online: https://lup.lub.lu.se/student-papers/search/publication/2438787 (accessed on 1 July 2025).
  24. Paulsen, S.G.; Larsen, D.P.; Kaufmann, P.R.; Whittier, T.R.; Baker, J.R. EMAP-Surface Waters Monitoring and Research Strategy (No. PB-91-168518/XAB.; EPA-600/3-91/022); Environmental Protection Agency, Environmental Research Lab: Corvallis, OR, USA, 1991; p. 91. [Google Scholar]
  25. Gee, W.G.; Or, D. Particle-Size Analysis. In Methods of Soil Analysis; Dane, J., Topp, G.C., Eds.; Book Series: 5. Part 4; Soil Science Society of America: Madison, WI, USA, 2002; pp. 255–293. [Google Scholar]
  26. Jackson, M.L. Soil Chemical Analysis. In An Advanced Course, 2nd ed.; University of Wisconsin: Madison, WI, USA, 1973. [Google Scholar]
  27. Blake, G.R.; Hartge, K.H. Bulk Density. In Methods of Soil Analysis: Part 1 Physical and Mineralogical Methods; American Society of Agronomy, Inc.: Madison, WI, USA, 1986; Volume 5, pp. 363–375. [Google Scholar]
  28. Walkley, A.; Black, C.A. Estimation of organic carbon by chromic acid titration method. Soil Sci. 1934, 37, 29–38. [Google Scholar] [CrossRef]
  29. Wu, X.; Yao, Z.; Brüggemann, N.; Shen, Z.Y.; Wolf, B.; Dannenmann, M.; Butterbach-Bahl, K. Effects of soil moisture and temperature on CO2 and CH4 soil–atmosphere exchange of various land use/cover types in a semiarid grassland in Inner Mongolia, China. Soil Biol. Biochem. 2010, 42, 773–787. [Google Scholar] [CrossRef]
  30. Casida, L.; Klein, D.A.; Santoro, T. Soil dehydrogenase activity. Soil Sci. 1964, 98, 371–376. [Google Scholar] [CrossRef]
  31. Green, V.S.; Stott, D.E.; Diack, M. Assay for fluorescein diacetate hydrolytic activity: Optimization for soil samples. Soil Biol. Biochem. 2006, 38, 693–701. [Google Scholar] [CrossRef]
  32. Eivazi, F.; Tabatabai, M.A. Glucosidases and galactosidases in soils. Soil Biol. Biochem. 1988, 20, 601–606. [Google Scholar] [CrossRef]
  33. Bueis, T.; Turrión, M.B.; Bravo, F.; Pando, V.; Muscolo, A. Factors determining enzyme activities in soils under Pinus halepensis and Pinus sylvestris plantations in Spain: A basis for establishing sustainable forest management strategies. Ann. For. Sci. 2018, 75, 34. [Google Scholar] [CrossRef]
  34. Daunoras, J.; Kačergius, A.; Gudiukaitė, R. Role of soil microbiota enzymes in soil health and activity changes depending on climate change and the type of soil ecosystem. Biology 2024, 13, 85. [Google Scholar] [CrossRef]
  35. Chan, K.Y.; Bowman, A.; Oates, A. Oxidizible organic carbon fractions and soil quality changes in an oxic paleustalf under different pasture leys. Soil Sci. 2001, 166, 61–67. [Google Scholar] [CrossRef]
  36. Jha, P.; Biswas, A.K.; Lakaria, B.L.; Saha, R.; Singh, M.; Rao, A.S. Predicting total organic carbon content of soils from Walkley and Black analysis. Commun. Soil Sci. Plant Anal. 2014, 45, 713–725. [Google Scholar] [CrossRef]
  37. Blair, G.J.; Lefroy, R.D.; Lisle, L. Soil carbon fractions based on their degree of oxidation, and the development of a carbon management index for agricultural system. Aust. J. Agric. Res. 1995, 46, 1459–1466. [Google Scholar] [CrossRef]
  38. Panse, V.G.; Sukhatme, P.V. Statistical Methods for Agricultural Works; ICAR: New Delhi, India, 1978. [Google Scholar]
  39. Mohanty, M. SQI CAL Software—A Tool for Soil Health Assessment; Division of Soil Physics, Indian Institute of Soil Science: Bhopal, India, 2020. [Google Scholar]
  40. Eyayu, M.; Heluf, G.; Tekalign, M.; Mohammed, A. Effects of land-use change on selected soil properties in the Tera Gedam Catchment and adjacent agroecosystems, north–west Ethiopia. Ethiop. J. Nat. Resour. 2009, 11, 35–62. [Google Scholar]
  41. Reichert, J.M.; Gubiani, P.I.; dos Santos, D.R.; Reinert, D.J.; Aita, C.; Giacomini, S.J. Soil properties characterization for land-use planning and soil management in watersheds under family farming. Int. Soil Water Conserv. Res. 2022, 10, 119–128. [Google Scholar] [CrossRef]
  42. Håkansson, I.; Lipiec, J. A review of the usefulness of relative bulk density values in studies of soil structure and compaction. Soil Tillage Res. 2000, 53, 71–85. [Google Scholar] [CrossRef]
  43. Teron, G.; Bordoloi, R.; Paul, A.; Singha, L.B.; Tripathi, O.P. Effect of Altitude on Soil Physico-Chemical Properties and Microbial Biomass Carbon in the Eaglenest Wildlife Sanctuary of Arunachal Pradesh. Geol. Ecol. Landsc. 2024, 1–19. [Google Scholar] [CrossRef]
  44. Charan, G.; Bharti, V.K.; Jadhav, S.E.; Kumar, S.; Acharya, S.; Kumar, P.; Srivastava, R.B. Altitudinal variations in soil physico-chemical properties at cold desert high altitude. J. Soil Sci. Plant Nutr. 2013, 13, 267–277. [Google Scholar] [CrossRef]
  45. Kamal, A.; Mian, I.A.; Akbar, W.A.; Rahim, H.U.; Irfan, M.; Ali, S.; Alrefael, A.F.; Zaman, W. Effects of Soil Depth and Altitude on Soil Texture and Soil Quality Index. Appl. Ecol. Environ. Res. 2023, 21, 4135–4142. [Google Scholar] [CrossRef]
  46. Ramesh, T.; Bolan, N.S.; Kirkham, M.B.; Wijesekara, H.; Kanchikerimath, M.; Rao, C.S.; Sandeep, S.; Rinklebe, J.; Ok, Y.S.; Choudhury, B.U.; et al. Soil organic carbon dynamics: Impact of land use changes and management practices: A review. Adv. Agron. 2019, 156, 1–107. [Google Scholar]
  47. Wang, J.; Xiao, S.; Hayat, K.; Liao, X.; Chen, J.; Zhang, L.; Xie, Y. Investigating the Effects of Elevation on Microbial Communities and Soil Properties at Fanjing Mountain, China. Forests 2024, 15, 1980. [Google Scholar] [CrossRef]
  48. Nozari, S.; Borůvka, L. The effects of slope and altitude on soil organic carbon and clay content in different land-uses: A case study in the Czech Republic. Soil Water Res. 2023, 18, 204–218. [Google Scholar] [CrossRef]
  49. Olaleye, A.; Mating, R.; Nkheloane, T.; Samuel, T.K.; Akande, T.Y. Wetland Health in Two Agro-Ecological Zones of Lesotho: Soil Physico-Chemical Properties, Nutrient Dynamics and Vegetation Isotopic N-15; IntechOpen: London, UK, 2022. [Google Scholar]
  50. Fan, S.; Sun, H.; Yang, J.; Qin, J.; Shen, D.; Chen, Y. Variations in soil enzyme activities and microbial communities along an altitudinal gradient on the eastern Qinghai–Tibetan plateau. Forests 2021, 12, 681. [Google Scholar] [CrossRef]
  51. Ekenler, M.; Tabatabai, M.A. Effects of liming and tillage systems on microbial biomass and glycosidases in soils. Biol. Fertil. Soils 2003, 39, 51–61. [Google Scholar] [CrossRef]
  52. Kumar, D.; Bhardwaj, D.R.; Sharma, P.; Bharti; Sankhyan, N.; Al-Ansari, N.; Linh, N.T.T. Population dynamics of Juniperus macropoda Bossier forest ecosystem in relation to soil physico-chemical characteristics in the cold desert of North-Western Himalaya. Forests 2022, 13, 1624. [Google Scholar] [CrossRef]
  53. Imtimongla, A.M.; Saya, D.; Phuncho, T. Properties of soil in relation to altitude. Just Agric. 2021, 12, 1–13. [Google Scholar]
  54. Feyissa, A.; Raza, S.T.; Cheng, X. Soil carbon stabilization and potential stabilizing mechanisms along elevational gradients in alpine forest and grassland ecosystems of Southwest China. Catena 2023, 229, 107210. [Google Scholar] [CrossRef]
  55. Dinesh, G.K.; Sharma, D.K.; Jat, S.L.; Bandyopadhyay, K.; Srinivasa Rao, C.; Venkatramanan, V.; Boomiraj, K. Effect of Conservation Agriculture Practices on Carbon Pools in a Sandy Loam Soil of Indo-Gangetic Plains. Commun. Soil Sci. Plant Anal. 2023, 54, 2845–2862. [Google Scholar] [CrossRef]
  56. Sahoo, U.K.; Singh, S.L.; Gogoi, A.; Kenye, A.; Sahoo, S.S.; Wu, F. Active and passive soil organic carbon pools as affected by different land use types in Mizoram, Northeast India. Public Libr. Sci. One 2019, 14, 21–32. [Google Scholar] [CrossRef]
  57. Zhou, J.; Zhang, J.; Lambers, H.; Wu, J.; Qin, G.; Li, Y.; Wang, F. Intensified rainfall in the wet season alters the microbial contribution to soil carbon storage. Plant Soil 2022, 476, 337–351. [Google Scholar] [CrossRef]
  58. Von-Lützow, M.; Kögel-Knabner, I.; Ekschmitt, K.; Flessa, H.; Guggenberger, G.; Matzner, E.; Marschner, B. SOM fractionation methods: Relevance to functional pools and to stabilization mechanisms—A review. Soil Biol. Biochem. 2007, 39, 2183–2207. [Google Scholar] [CrossRef]
  59. Hazra, K.K.; Ghosh, P.K.; Venkatesh, M.S.; Nath, C.P.; Kumar, N.; Singh, M.; Nadarajan, N. Improving soil organic carbon pools through inclusion of summer mungbean in cereal–cereal cropping systems in Indo-Gangetic plain. Arch. Agron. Soil Sci. 2018, 64, 1690–1704. [Google Scholar] [CrossRef]
  60. Parihar, C.M.; Jat, S.L.; Singh, A.K.; Datta, A.; Parihar, M.D.; Varghese, E.; Jat, M.L. Changes in carbon pools and biological activities of a sandy loam soil under medium-term conservation agriculture and diversified cropping systems. Eur. J. Soil Sci. 2018, 69, 902–912. [Google Scholar] [CrossRef]
  61. Babu, S.; Mohapatra, K.P.; Das, A.; Yadav, G.S.; Tahasildar, M.; Singh, R.; Chandra, P. Designing energy-efficient, economically sustainable and environmentally safe cropping system for the rainfed maize–fallow land of the Eastern Himalayas. Sci. Total Environ. 2020, 722, 137874. [Google Scholar] [CrossRef]
  62. Vieira, F.C.B.; Bayer, C.; Zanatta, J.A.; Dieckow, J.; Mielniczuk, J.; He, Z.L. Carbon management index based on physical fractionation of soil organic matter in an Acrisol under long-term no-till cropping systems. Soil Tillage Res. 2007, 96, 195–204. [Google Scholar] [CrossRef]
  63. Parihar, C.M.; Singh, A.K.; Jat, S.L.; Ghosh, A.; Dey, A.; Nayak, H.S.; Jat, M.L. Dependence of temperature sensitivity of soil organic carbon decomposition on nutrient management options under conservation agriculture in a subtropical Inceptisol. Soil Tillage Res. 2019, 190, 50–60. [Google Scholar] [CrossRef]
  64. Mangral, Z.A.; Islam, S.U.; Tariq, L.; Kaur, S.; Ahmad, R.; Malik, A.H.; Dar, T.U.H. Altitudinal gradient drives significant changes in soil physico-chemical and eco-physiological properties of Rhododendron anthopogon: A case study from Himalaya. Front. For. Glob. Change 2023, 6, 1181299. [Google Scholar] [CrossRef]
  65. Behera, M.C.; Sahoo, U.K.; Mohanty, T.L. Soil organic carbon pools and carbon management index of the tropical moist deciduous forests in Indian Eastern Ghats. Sci. Rep. 2025, 15, 12640. [Google Scholar] [CrossRef] [PubMed]
  66. Xiong, M.; Jiang, W.; Zou, S.; Kang, D.; Yan, X. Microbial carbohydrate-active enzymes influence soil carbon by regulating plant-and fungal-derived biomass decomposition in plateau peat wetlands under differing water conditions. Front. Microbiol. 2023, 14, 1266016. [Google Scholar] [CrossRef] [PubMed]
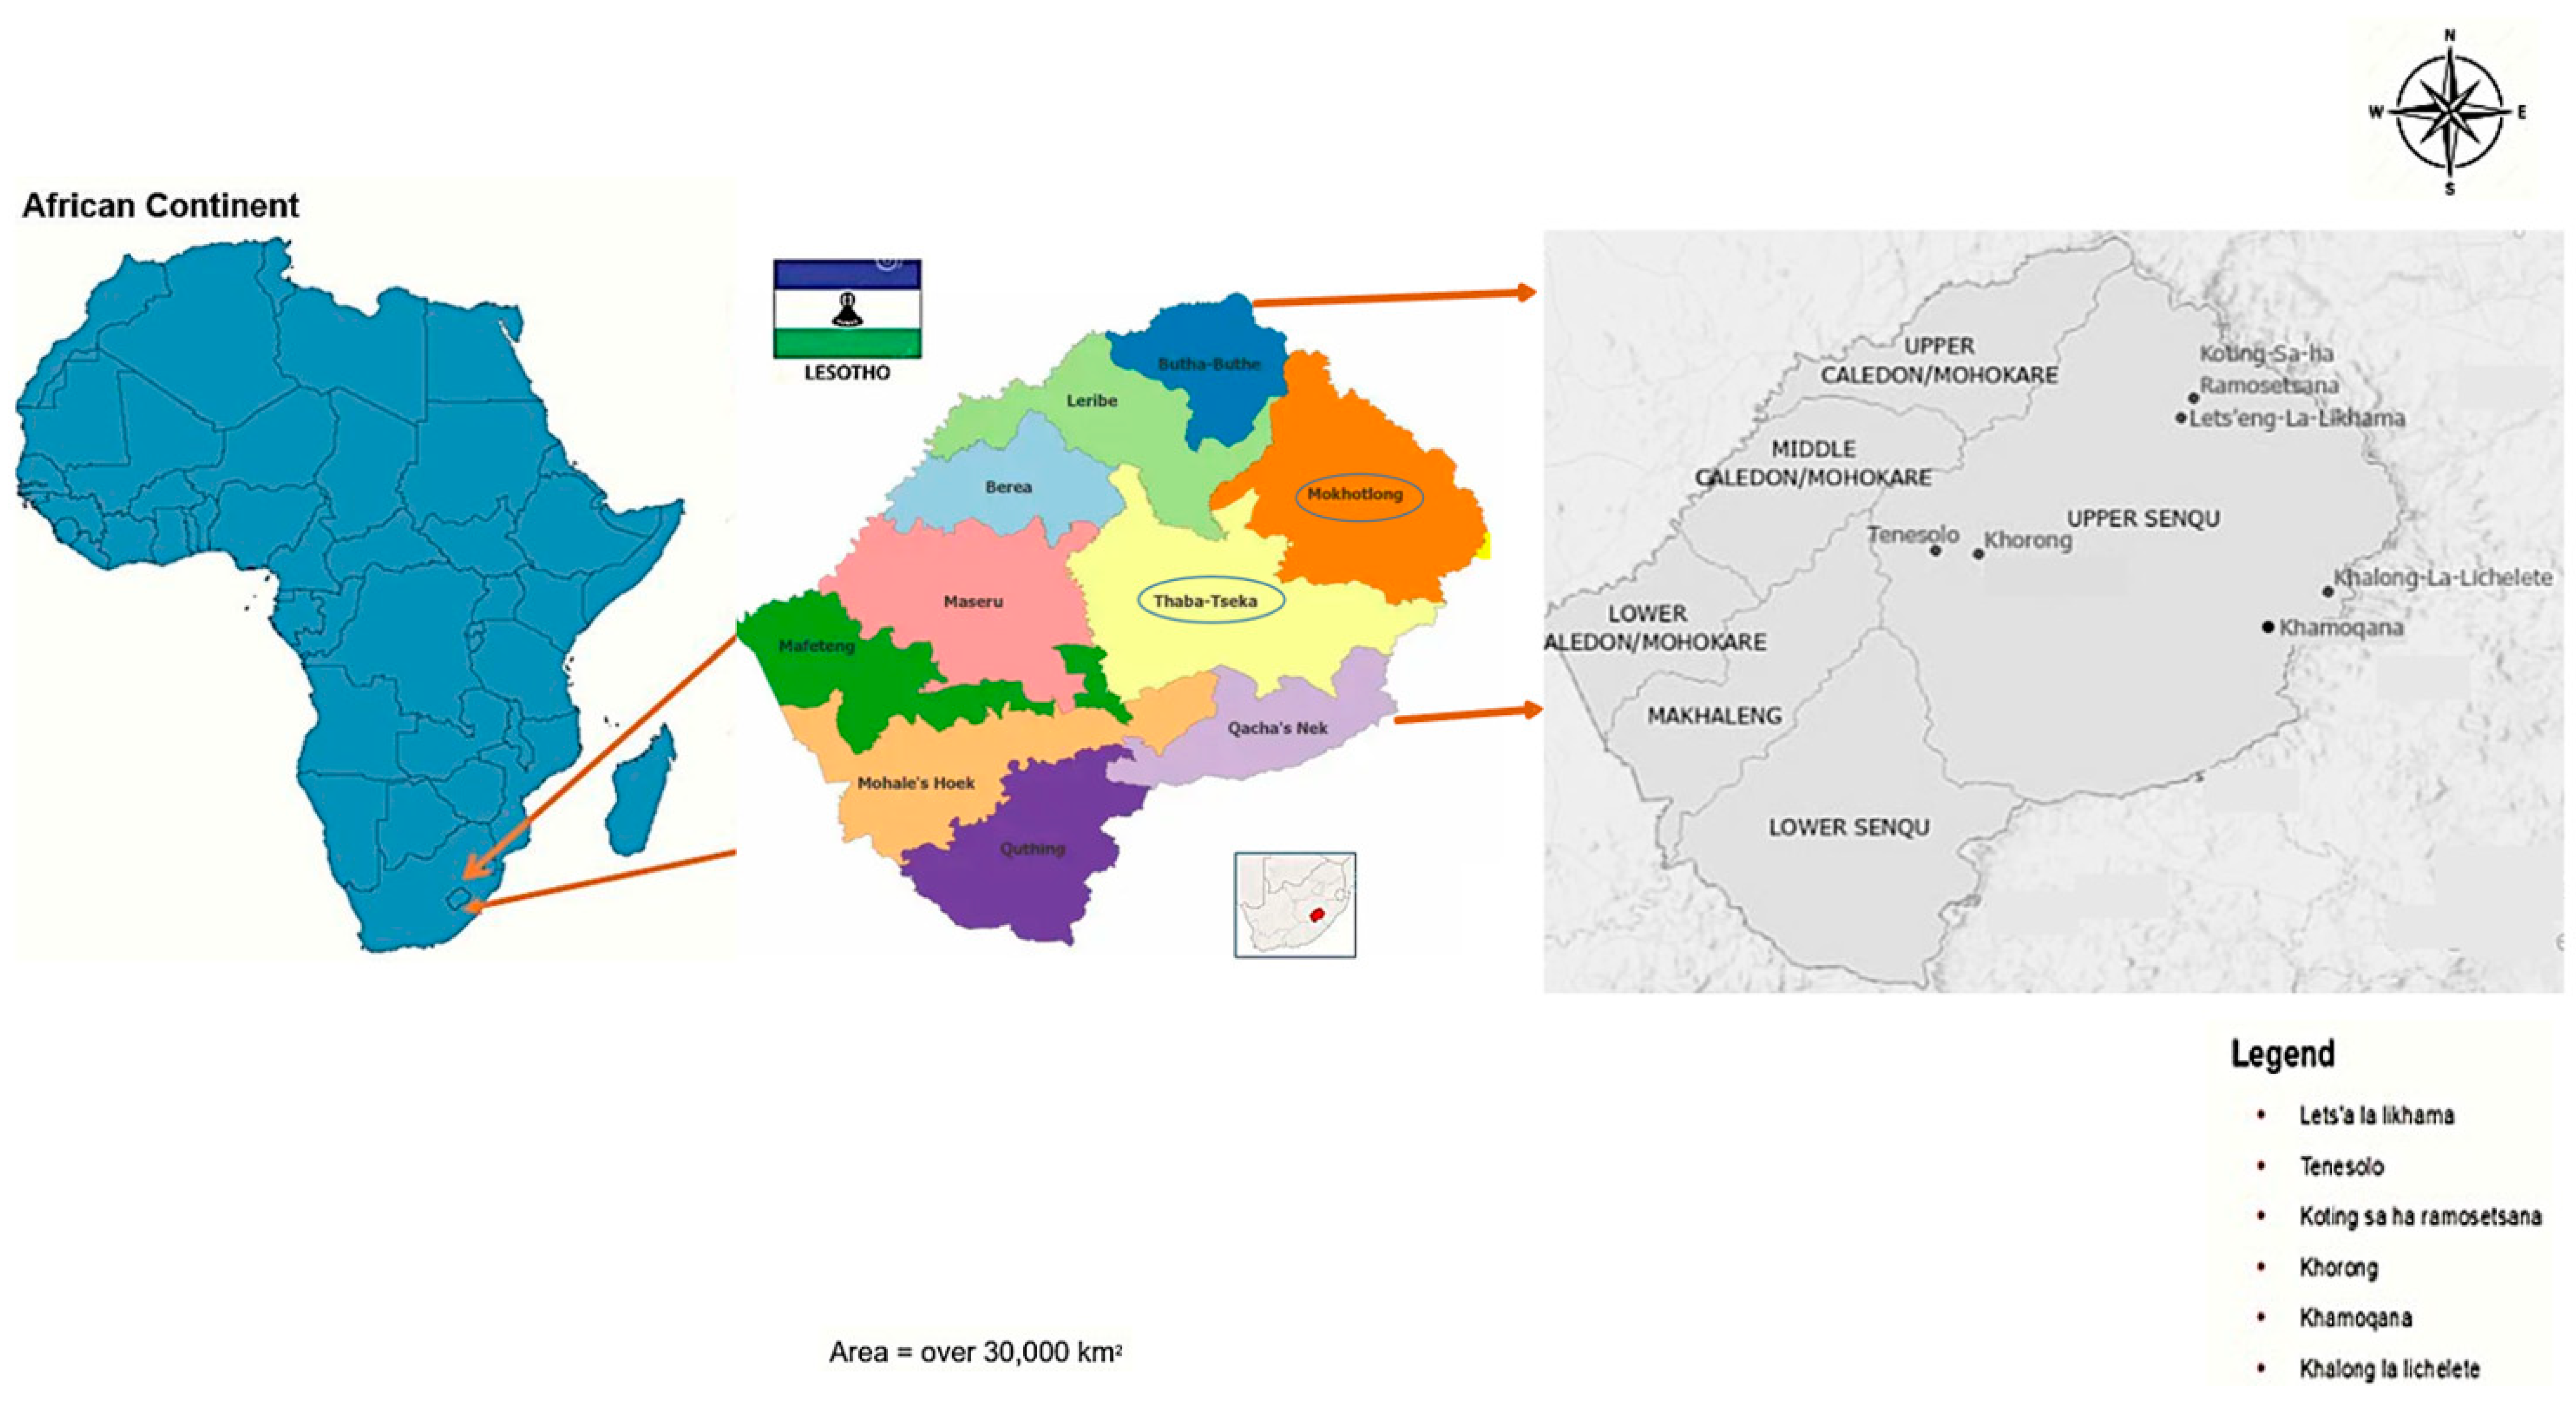
Figure 1. Geographical map of Lesotho with ten districts within the African continent and the study sites (alpine wetlands). The circled districts (Mokhotlong and Thaba-Tseka) were the districts where the study was undertaken. The black dots indicate the alpine wetland.
Sustainability 17 08571 g001
Figure 2. The GPS map showing the main catchment (Upper Senqu) in which the three sub-catchments (Khubelu, Senqunyane and Sani) falls under and wetlands. The map is generated in Arc GIS software (Version 3.5.x).
Sustainability 17 08571 g002
Figure 3. Impact of altitudinal variation on soil organic carbon pools, viz., CVL = very labile carbon; CL = labile carbon; CLL = less labile carbon; CNL = nonlabile carbon at 0–15 cm (a) and 15–30 cm (b) soil depths (p < 0.05). KRN = Khorong (2500–2550 m asl); TNL = Tenesolo (2552–2600 m asl); KMQN = Khamoqana (2839–2880 m asl); KLL = Khalong–la–Lichelete (2891–2995 m asl); LLL = Lets’eng–la–Likhama (3040–3080 m asl); KSRM = Koting-sa–ha Ramosetsana (3087–3155 m asl). The means with distinct letters demonstrate significant variances between the treatments at the 5% probability level (Tukey’s HSD test), and means with the same letters indicate no significant variances among the treatment means at the 5% probability level.
Sustainability 17 08571 g003
Figure 4. Impact of altitudinal variation on total organic carbon at 0–15 cm (df = 5, F = 3.55, P = 0.03) and 15–30 cm soil (df = 5, F = 2.89, P = 0.04) depths. KRN = Khorong (2500–2550 m asl); TNL = Tenesolo (2552–2600 m asl); KMQN = Khamoqana (2839–2880 m asl); KLL = Khalong–la–Lichelete (2891–2995 m asl); LLL = Lets’eng–la–Likhama (3040–3080 m asl); KSRM = Koting-sa–ha Ramosetsana (3087–3155 m asl). The means with distinct letters demonstrate significant variances between the treatments at the 5% probability level (Tukey’s HSD test), and means with the same letters indicate no significant variances among the treatment means at the 5% probability level.
Sustainability 17 08571 g004
Figure 5. Impact of altitudinal variation on active and passive pools of carbon at the 0–30 cm soil depth (p < 0.05). KRN = Khorong (2500–2550 m asl); TNL = Tenesolo (2552–2600 m asl); KMQN = Khamoqana (2839–2880 m asl); KLL = Khalong–la–Lichelete (2891–2995 m asl); LLL = Lets’eng–la–Likhama (3040–3080 m asl); KSRM = Koting–sa–ha Ramosetsana (3087–3155 m asl).
Sustainability 17 08571 g005
Figure 6. Scree plot showing the percentage of explained variance for the respective principal components. Dimensions = principal components.
Sustainability 17 08571 g006
Figure 7. Variable PCA-Biplot graph showing the relationships among the soil attributes and the patterns in the alpine wetlands. BD = bulk density, EC = electrical conductivity, SOC 1 = soil organic carbon at 0–15 cm depth, SOC 2 = soil organic carbon at 15–30 cm depth, DHA = dehydrogenase activity, β-GaA = β-galactosidase activity, FDA = fluorescein diacetate activity, CACT = active pool of carbon, CPSV = passive pool of carbon, LI.1 = lability index at 0–15 cm, CPI.1 = carbon pool index at 0–15 cm, CMI 1 = carbon management index at 0–15 cm, LI. 2 = lability index at 15–30 cm, CPI 2 = carbon pool index at 15–30 cm, CMI 2 = carbon management index at 15–30 cm.
Sustainability 17 08571 g007
Table 1. Alpine wetland characteristics.
Alpine WetlandsLatitude NLongitude ESoil Degradation Level Assessed with WET Health According to Kleynhans [21] and Macfarlane et al. [22].
PES Score (%)Description
Khorong−29.45716828.26808280Largely natural with few modifications. A slight change in ecosystem processes is discernible, and a small loss of natural habitats and biota may have taken place.
Tenesolo−29.44925628.14921445Extensively altered and alterations in ecological functions accompanied by the disappearance of natural habitats and native species.
Khamoqana−29.45717828.26809430Seriously modified, the change in ecosystem processes, great loss of natural habitat and biota but some remaining natural habitat features are still being recognized.
Khalong-La-Lichelete−29.56355229.24720790Unmodified natural wetland
Lets’eng-La-Likhama−29.07635528.83609540Largely modified with a large change in ecosystem processes and loss of natural habitat, and biota has occurred.
Koting-Sa-ha Ramosetsana−29.02268628.87132485Largely natural with few modifications and a slight change in ecosystem processes being discernible and a small loss of natural habitats and biota may have taken place.
N = North; E = East; PES = Percentage.
Table 2. Treatment details.
Treatment(s)
Alpine WetlandsAltitude (m) asl
Khorong2500–2550
Tenesolo2552–2600
Khamoqana2839–2880
Khalong-La-Lichelete2891–2995
Lets’eng-La-Likhama3040–3080
Koting-Sa-ha Ramosetsana3087–3155
Table 3. Methodology and terms of the references adopted for the analysis of soil physical and physicochemical properties at the 0–15 cm soil depth.
S.NoSoil PropertyMethodReference
2Mechanical separatesHydrometer methodBouyoucos [25]
Sand (%)
Silt (%)
Clay (%)
3Soil reaction (pH)Soil: water suspension (1:2.5)Jackson [26]
4Electrical conductivity (dS m−1)
5Bulk density (Mg m−3)Core samplerBlake and Hartge [27]
6Soil organic carbon (g kg−1)Wet oxidationWalkley
and Black [28]
Table 4. Impact of altitudinal variation on soil bulk density (BD) particle size distribution and texture.
Treatment(s)BD
(Mg m−3)
SandSiltClayTextural Class
WetlandsAltitude (m) asl(%)
Khorong2500–25501.3064.9823.6711.36Sandy loam
Tenesolo2552–26001.5260.6328.9210.45Sandy loam
Khamoqana2839–28801.2852.8234.0413.14Loam
Khalong-La-Lichelete2891–29951.2664.4321.9213.65Sandy loam
Lets’eng-La-Likhama3040–30801.2746.3835.7217.90Loam
Koting-Sa-ha Ramosetsana3087–31551.0939.7935.0225.19Loam
SEM± 0.0160.2790.1400.245
CD (p < 0.05)0.0490.8680.3070.764
CD (p < 0.05) = critical difference at less than the 5% probability level; SEM = standard error of the mean.
Table 5. Impact of altitudinal variation on physicochemical properties of the soil.
Treatment(s)pHEC
(dS m−1)
SOC
(g kg−1)
WetlandsAltitude
(m) asl
0–15 cm15–30 cm
Khorong2500–25505.760.3484.6753.34
Tenesolo2552–26006.040.3569.1443.56
Khamoqana2839–28805.980.3573.2446.14
Khalong-La-Lichelete2891–29955.800.3380.2750.57
Lets’eng-La-Likhama3040–30805.530.2994.3459.43
Koting-Sa-ha Ramosetsana3087–31556.010.3295.8060.35
SEM± 0.0720.0148.283.69
CD (p < 0.05)0.223NS18.2411.48
CD (p < 0.05) = critical difference at less than the 5% probability level; SEM = standard error of the mean; asl = above sea level; EC = electrical conductivity; SOC = soil organic carbon; NS = nonsignificant.
Table 6. Impact of altitudinal variation on dehydrogenase (DHA), β-galactosidase (β-GaA) and fluorescein diacetate (FDA) activity.
Treatment(s)DHA
(μg TPF g−1 Dry Soil Day−1)
β-GaA
(nmol p-Nitrophenol g−1 Dry Soil hr−1)
FDA
(µg.Fluorescein g−1 Dry Soil 3 hr−1)
WetlandsAltitude
(m) asl
Khorong2500–255049.63173.22227.72
Tenesolo2552–260035.49153.23188.27
Khamoqana2839–288036.70140.00187.60
Khalong-La-Lichelete2891–299539.82151.44220.64
Lets’eng-La-Likhama3040–308029.03126.49119.01
Koting-Sa-ha Ramosetsana3087–315534.15150.48172.26
SEM± 2.0687.63316.157
CD (p < 0.05)6.44223.77950.335
CD (p < 0.05) = critical difference at less than the 5% probability level; SEM = standard error of the mean; asl = above sea level; EC = electrical conductivity; SOC = soil organic carbon; NS = nonsignificant.
Table 7. Impact of altitudinal variation on the lability index (LI), carbon pool index (CPI) and carbon management index (CMI) at the 0–15 cm and 15–30 cm soil depths.
Treatment(s)LICPICMILICPICMI
WetlandsAltitude
(m) asl
0–15 cm15–30 cm
Khorong2500–25500.980.7573.130.960.6561.32
Tenesolo2552–26000.960.5857.240.930.5347.97
Khamoqana2839–28801.060.7175.361.020.6162.72
Khalong-La-Lichelete2891–29951.060.6569.011.040.5657.79
Lets’eng-La-Likhama3040–30801.000.8480.370.940.7267.07
Koting-Sa-ha Ramosetsana3087–31551.070.8591.051.040.7375.88
SEM± 0.0930.1394.8010.0950.0454.002
CD (p < 0.05)NS0.04514.597NS0.14012.467
CD (p < 0.05) = critical difference at less than the 5% probability level; SEM = standard error of the mean; asl = above sea level; NS = nonsignificant.
Disclaimer/Publisher’s Note: The statements, opinions and data contained in all publications are solely those of the individual author(s) and contributor(s) and not of MDPI and/or the editor(s). MDPI and/or the editor(s) disclaim responsibility for any injury to people or property resulting from any ideas, methods, instructions or products referred to in the content.