Abstract
The object of the research is the process of intelligent monitoring and diagnosis of animal health using IoT technology in the context of a digital farm. The problem lies in the absence of an integrated approach that can provide near-real-time assessment of an animal’s physiological and behavioral state, predict potential health risks, and adapt decision-making algorithms to specific species and environmental conditions. Traditional monitoring methods rely heavily on periodic manual inspection and limited sensor data, which reduces the timeliness and accuracy of diagnostics, especially for large-scale farms. To address this issue, a comprehensive model is proposed that integrates an IoT-based tag device for livestock, a data collection and transmission system, and an intelligent analysis module. The system utilizes statistical profiling to create baseline health parameters for each animal, applies anomaly detection methods to identify deviations, and leverages machine learning algorithms to predict health deterioration. The novelty of the approach lies in the combination of individualized baseline modeling, continuous sensor-based monitoring, and adaptive decision-making for early intervention. The approach scales across farm sizes and multi-sensor setups, making it practical for precision livestock farming. From a sustainability perspective, the approach enables earlier and more targeted interventions that can reduce unnecessary treatments, avoid preventable productivity losses, and support animal welfare. The design uses energy-aware IoT practices (on-device 60 s aggregation with one-minute uplinks) and lightweight analytics to limit device power use and network load, aligning the system with resource-efficient livestock operations.
1. Introduction
1.1. Motivation
Modern livestock farming is increasingly integrating Internet of Things (IoT) technologies to improve herd management efficiency and enable early detection of health issues. We combine individual baselines, herd context, and simple time-series dependence measures with a machine-learning model to produce a wellness score. Traditional observation methods, based on visual assessment by farm personnel, are limited in their timeliness, accuracy, and objectivity, especially in large-scale operations.
The use of wearable sensor devices and cloud computing services opens up opportunities for continuous monitoring of each animal’s behavioral and physiological activity. This, in turn, enables automated diagnostics, early detection of pathological signs, and prediction of health condition dynamics. However, building a reliable forecasting system requires addressing a number of scientific and technical challenges, including:
- -
- High variability of individual behavior. Behavioral patterns of animals depend on age, physiological state, season, and housing conditions, making it difficult to apply uniform global thresholds for health assessment.
- -
- Impact of collective dynamics. Behavioral changes may be caused not only by individual factors but also by external conditions affecting the entire herd. For example, heat stress quantified by the Temperature–Humidity Index is associated with herd-wide reductions in rumination and changes in drinking/locomotion, and cows show pronounced lying synchrony around routine events (e.g., feeding/milking), so group-level shifts can reflect shared environmental drivers rather than individual pathology.
- -
- Need for combining different types of analytics. Linear and nonlinear time series analysis methods, fractal characteristics, and statistical indicators must be integrated into a single computational model.
We combine three complementary descriptors of short-horizon behavior: a robust within-animal deviation (the absolute deviation from the herd median scaled by IQR), the Hurst exponent, and the BDS statistic. The robust deviation term captures short-term shifts while remaining resistant to sensor noise and outliers typical of on-farm IoT data. The Hurst exponent summarizes long-range temporal correlations that can change with altered physiological state and routine; such effects are reported in physiological and animal-behavior time series. The BDS statistic complements this by indicating departures from i.i.d. behavior due to nonlinear serial dependence, providing a compact “complexity” cue.
Sustainable livestock farming benefits from early detection of health risks, which often appear as small changes in feeding and activity before clinical signs. Existing approaches typically rely on aggregate activity or fixed thresholds and do not combine individual baselines with herd context and the temporal structure of behavior.
We study an integrated approach that joins individual baselines to track within-animal change, herd-level context to distinguish individual issues from farm-wide shifts, and simple measures of serial dependence in time series. We then use a machine-learning model to produce a wellness score and provide clear explanations of the outputs. In experiments, this combination improves accuracy over a simple baseline on a publicly available dataset and is compatible with on-farm IoT deployments.
The relevance of this research is determined by the need to develop systems capable of providing objective, continuous, and scalable health assessment of animals based on multi-source data generated in near-real time.
These elements are motivated not only by accuracy but also by sustainability goals: earlier alerts can lower unnecessary interventions and losses, while energy-aware data collection reduces the resource footprint of long-running deployments.
1.2. State of the Art
For a systematic review of current research in the field of intelligent models for animal health monitoring and diagnostics using IoT technology, a classification based on the thematic directions of scientific works was carried out. This classification helps structure the existing approaches and identify key gaps for the further development of innovative solutions:
- -
- Analytical articles [1,2,3,4,5] confirming the relevance of the problem and substantiating the need for the development of IoT solutions for animal health monitoring.
- -
- Publications [6,7,8,9,10,11] presenting and describing various technical and conceptual directions for implementing IoT in veterinary diagnostics.
- -
- Studies [12,13,14,15,16] applying artificial intelligence algorithms within IoT platforms to assess and predict animal health.
- -
- Scientific works [17,18,19] dedicated to identifying key physiological and behavioral features relevant to AI-based diagnostic models.
- -
- Scientific works [20,21,22,23,24] integrating approaches from the theory of dynamic chaos, fractal analysis, and other complex systems methods to detect anomalies in biological and technical systems.
Below is a detailed analysis of representative works.
In paper [1], a comprehensive review of global developments in IoT systems in agriculture is conducted with a focus on digital sensors, behavior monitoring, and cloud platforms. Key markets, technological barriers, and economic benefits are outlined. Among the positive factors, the systematization of international experience and the identification of critical success factors (energy efficiency of sensors, integration with mobile services) should be noted. At the same time, the lack of consideration of algorithmic approaches to the integration of behavioral and physiological signs and the lack of analytics for anomaly detection reduce the scientific value of this work.
Article [2] discusses the concept of precision livestock farming and the role of IoT in increasing animal productivity and well-being, providing examples of the use of RFID, GPS, and accelerometers in combination with analytical dashboards. The work has a clear structuring of technological components, supported by real cases. But unfortunately, a detailed methodology for converting sensor data into an integral health status indicator is missing.
In the scientific paper [3], a prototype of an IoT system with wireless biosensors that transmit temperature, heart rate, and activity data to a cloud server for real-time analysis was developed. It should be noted that the authors of the article described the full cycle of data collection and transmission. However, the algorithmic part is limited to simple threshold rules; machine learning was not used for prediction or early detection of deviations.
Article [4] provides an analytical review of precision livestock farming technologies, including sensor networks, visual monitoring systems, and automated feed control stations. The interconnections between technological solutions and animal welfare indicators are implemented. The importance of individualized monitoring is emphasized. At the same time, methods for combining data of a different nature (physiology, behavior, environment) are not sufficiently disclosed. In addition, there is no toolkit for the explainability of the results.
The authors of article [5] presented a comprehensive review of the role of IoT in the livestock industry by categorizing and synthesizing existing research papers in this field. For this purpose, a detailed discussion of the IoT network infrastructure, topologies, and platforms used for livestock management was provided. In addition, a list of communication protocols and connections of IoT-based livestock systems with relevant technologies was investigated. Furthermore, numerous IoT-based livestock monitoring, control, and tracking applications were discussed. In addition, the article also analyzes specific security issues in the IoT-based livestock industry and develops a collaborative security model to detect and minimize security risks. Unfortunately, the issue of using artificial intelligence algorithms and other methods for anomaly detection is not considered in the article. This once again emphasizes the relevance of the chosen research direction.
The authors of article [6] presented an overview of IoT solutions for monitoring the health of livestock, including sensor nodes for tracking activity, temperature, heart rate, and behavioral patterns, as well as communication protocols and data storage. The system architecture is described with cloud analytics and mobile interfaces for farmers. A comprehensive description of the components of the IoT ecosystem allowed for the investigation of factors such as energy consumption, the use of renewable energy sources, scalability, and security. At the same time, the article is only conceptual in nature and does not provide quantitative results regarding diagnostic accuracy.
Article [7] appears to be a review of IoT solutions for virtual fencing, which allow for controlling the movement of livestock without physical barriers, using GPS and wearable devices. The article shows that virtual fencing systems can perform not only movement control functions but also monitor the condition of animals (for example, by analyzing activity and changes in behavior). The main focus of the article is on territory management, while the diagnostic aspect of animal health is covered superficially. However, it is necessary to integrate full-fledged behavioral and physiological indicators, going beyond simple location tracking.
Article [8] provides a systematic review of IoT technologies for assessing the welfare of livestock, including sensor networks, computer vision, and automated data collection systems. The article describes the key areas of development of IoT in animal husbandry and provides a comparative analysis of various sensor technologies from the point of view of sensitivity, specificity, and cost. But unfortunately, the generalized nature of the article does not provide an opportunity to consider complex algorithmic models that combine several types of features into a single health metric.
Article [9] provides an opportunity to review wireless sensor technologies, their architecture, and data transmission standards for agriculture. The article provides a technical basis for communication technologies that allow for the creation of scalable and energy-efficient IoT solutions. But, unfortunately, the article lacks algorithmic examples of the analysis of collected data for diagnostics. At the same time, not only the collection of data through an IoT network but also their intelligent processing provides an opportunity to solve many tasks of diagnosing the condition of monitored objects and subjects.
Article [10] discusses the scope of application of various technologies for animals, nanobiosensors, and advanced methods of molecular biological diagnostics for detecting various infectious diseases in cattle, as well as efforts to list and compare these technologies, taking into account their disadvantages and advantages in the field of animal health management. The article reviews all the latest developments in the field of biosensors and their application for animal health to provide an idea of the appropriate approach that should be used in the future to improve animal welfare. However, the article does not pay attention to the possibilities of using artificial intelligence algorithms to detect anomalies in animal behavior.
The authors of article [11] proposed a mathematical model of the process of offloading mobile computations from IoT devices to a fog-cloud environment in order to reduce energy consumption and ensure time constraints for transactions. A clear multi-level architecture reflects the real-world scenarios of IoT systems. A quantitative assessment of response time and energy consumption allows for optimizing system settings. Unfortunately, the optimization model is based on general parameters of computing resources, without the integration of specific composite metrics.
Article [12] is a systematic review of the application of Deep Learning in precision livestock farming systems, in particular for the detection and localization of animals using unmanned aerial vehicles (UAVs). The authors classify existing approaches to processing images and videos collected from UAVs, including CNN, R-CNN, YOLO architectures, and other modern computer vision models. The review also analyzes the features of data collection and annotation, hardware requirements, and limitations associated with working in real farm conditions. The article focuses mainly on the processing of visual data, without integrating physiological or behavioral indicators that are critically important for the early diagnosis of diseases. Also, the article lacks an assessment of combined IoT architectures where UAVs interact with ground-based sensors in a single analytical system. In addition, the authors of the article did not consider the possibility of using complex composite metrics.
The authors of article [13] proposed a method for detecting anomalies in computer systems, based on a comprehensive preprocessing of highly correlated and unbalanced data. The method combines the SMOTEENN class balancing algorithm with the SP_PCA feature correlation reduction procedure and the screening of low-variance characteristics using VarianceThreshold. For classification, ensemble methods (Random Forest, Bagging, Gradient Boosting, AdaBoost) and basic models (SVM, KNN, Naive Bayes, Perceptron) were studied, parameter tuning was performed, and the impact of each preprocessing stage on accuracy and performance was evaluated. Unfortunately, the article does not consider aspects specific to IoT data, in particular, working with time series and sensor streams, and does not take into account the limitations of the computing resources of IoT devices, which is important for field monitoring systems.
In article [14], a new architecture of a dynamic neural network with blocks that can be disabled using “gate modules” depending on the input data is proposed, as well as a meta-learning method aimed at increasing resistance to disturbances (adversarial attacks, error injections, task changes) while saving computing resources. The study was conducted on ResNet-110 and DeiT-S architectures using the CIFAR-10 and CIFAR-100 datasets. The method shows versatility and can be applied in real-time monitoring systems, including in IoT devices for livestock farming. But the article does not consider the specifics of the biological and behavioral characteristics of animals. In addition, there is no integration with IoT sensors and streaming data, which is critical for animal health diagnostic systems.
Article [15] is an example of a modern integrated IoT + ML approach. The authors of the article propose the implementation of both real-time monitoring and forecasting (for example, disease risk), with an automatic response through actuators (feeding control, microclimate). However, the article lacks a detailed analysis of specific animal welfare indicators (wellness score), and there is no justification for the choice of key features. In addition, composite or fractal metrics (for example, Deviation Score, Hurst exponent) were not used, which increases the sensitivity of detecting anomalies in behavioral patterns.
In paper [16], an integrated IoT platform for monitoring the health of cattle is presented using wearable sensors (temperature, heart rate, activity) and machine learning to predict the state of the animals. A behavior recognition model was created using the K-nearest neighbors (KNN) algorithm to monitor behavior during feeding and movement, including standing, lying, walking, resting, feeding, and chewing, with a high accuracy of over 80%. Based on the recognized behavior from leg and collar sensors, a health classification model was additionally developed using a support vector machine (SVM) based machine learning algorithm, which achieves an accuracy of up to 70%. However, the model works mainly with “clean” data, without taking into account the problem of noise and instability of sensor signals, which is typical in field conditions. In addition, there is no use of composite metrics to increase sensitivity to abnormal changes in behavior.
Among the articles dedicated to identifying key physiological and behavioral signs relevant for AI diagnostic models, the scientific work [17] can be highlighted, in which the relationship between behavioral indicators (milk consumption, drinking speed, visits to the feeder, compound feed consumption, activity, and lying position) and the state of recovery of calves after antibiotic treatment for bronchopneumonia (BRD) was analyzed. The results of this article directly confirm that physiological and behavioral signs (motor activity, feeding patterns) can be key predictors in AI models for the early detection of disease relapses.
Another article [18] demonstrates the possibility of long-term continuous monitoring without human intervention; the validity of measurements in 6-week-old calves was confirmed. This scientific work shows that accelerometric sensors can reliably record basic behavioral signs (chewing, activity), which can be easily integrated into ML systems for diagnosing health status.
Article [19] focuses on the application of automated monitoring systems for feeding and behavior to detect early signs of diseases in calves. Patterns of milk consumption, drinking speed, frequency of visits to the feeder, and activity were analyzed as markers of hidden pathologies. The results support the choice of key physiological and behavioral signs for AI models and demonstrate the value of continuous automatic monitoring.
One of the most effective approaches to detecting anomalies in the behavior of subjects and objects of study is the use of the theory of dynamic chaos. Many scientific works are devoted to this direction. For example, article [20] presents a new concept for detecting anomalies in complex dynamic systems using tools of symbolic dynamics, finite automata, and pattern recognition, where time series data of observed variables on a fast time scale are analyzed on slow time scale epochs for early detection of (possible) anomalies.
In article [21], it is proposed to use the Hurst exponent to detect certain deviations from the normal state of an object. This work is devoted to the detection of such deviations in a technical system, so its use for our practical cases is possible only with certain limitations and in combination with other indicators.
Similarly, in work [22], the authors emphasize that the Hurst exponent is an important metric for characterizing time series with the property of long-term memory, and it is found in many fields, such as physics, engineering, mathematics, statistics, economics, psychology, etc. This can once again emphasize the possibility of synthesizing this indicator into a general composite metric, the Deviation Score.
The authors of article [23] conducted research and came to positive conclusions about the possibility of assessing the state of systems using BDS statistics. This is another effective method for detecting dynamic chaos in the behavior of control objects and determining abnormal behavior in the event of external disturbances.
In article [24], a method of multiscale entropy analysis (MSE) was developed to assess the complexity of physiological signals. This allows for the detection of the degradation of physiological regulation in diseases; it is resistant to short data losses. At the same time, it requires sufficiently long time series for correct results; it is difficult to adjust the scale parameters. However, MSE can be used as an additional component in the Deviation Score for the quantitative assessment of the complexity of animal behavior in different states.
Long-term digital-farm deployments require energy-aware communication and scheduling. Recent smart-agriculture studies [25] analyze energy-throughput trade-offs and optimization of sensor placement and communication to extend device lifetime in the field. In broader IoT networks, deep reinforcement learning has been used to schedule resources and balance energy with latency constraints. At the radio/physical layer, DRL has also been applied to maximize energy efficiency in integrated sensing-and-communication systems, offering a perspective for future farm-scale networks. These directions complement our on-device aggregation and low-duty-cycle design.
Thus, the analysis of modern scientific works in the field of intelligent IoT systems for monitoring and diagnosing animal health has shown that, despite significant progress in the development of sensor technologies, data processing architectures, and artificial intelligence algorithms, significant gaps remain. In particular, there is a lack of comprehensive approaches that would combine multichannel physiological and behavioral signs into integrated composite metrics capable of adaptively responding to individual and group deviations. The limited application of methods from complex systems, such as the Hurst exponent, BDS statistics, or multiscale entropy analysis, restrains the potential for increasing the sensitivity and explainability of diagnostics.
The obtained conclusions determine the need to create a new model that synthesizes sensor data, AI algorithms, and indicators from the theory of dynamic chaos into a single computational system for the timely detection of pathological changes.
1.3. Objectives and Contribution
The goal of this research is to develop an integrated model for intelligent monitoring and diagnostics of animal health based on IoT technology for the digital farm. Unlike other models, this one integrates provisions from the theory of complex systems analysis, machine learning algorithms, and the capabilities of IoT technology for collecting and processing multi-source sensory data on animal behavior. The proposed approach aims to increase the accuracy of early detection of health deviations, as well as to improve the decision-making process in animal husbandry, enabling timely intervention and supporting sustainable agricultural production.
To achieve this goal, the following objectives were set:
- -
- To define the structure of interaction between the IoT sensor network, machine learning modules, and components for complex systems analysis.
- -
- To develop a composite metric, the Deviation Score, which combines traditional statistical indicators (absolute deviation from the herd median, normalized by the interquartile range) with indicators from the theory of dynamic chaos and fractal analysis (Hurst exponent, BDS-statistic).
- -
- To implement Explainable AI methods for interpreting the model’s decisions, identifying the most significant predictors, and increasing user trust.
- -
- To integrate individual animal baseline profiles with group behavioral indicators for a two-stage anomaly detection process.
- -
- To validate the model on data from farms, comparing its accuracy, sensitivity, and resilience to anomalies with traditional health monitoring methods.
- -
- To relate the technical design to sustainability objectives by explaining how earlier, interpretable alerts and energy-aware IoT practices (on-device 60 s aggregation and one-minute uplinks) support animal welfare and resource-efficient farm operations.
The object of the study is the process of near-real-time assessment of animal health in a digital farm environment, characterized by heterogeneous and high-dimensional sensor data, the presence of noise, with the need for timely anomaly detection.
The main hypothesis of the research is that the integration of multimodal data from IoT sensors, composite metrics like the Deviation Score, and explainable machine learning algorithms will allow for the creation of a more sensitive and interpretable system for monitoring animal health compared to traditional threshold-based or single-metric approaches.
Within the scope of the research, the following assumptions have been made:
- -
- Physiological and behavioral indicators collected from wearable and ambient sensors are reliable and periodically calibrated.
- -
- Statistical and chaotic metrics can be calculated under the limited resource conditions of edge or fog computing systems used in digital farms.
- -
- Data transmission latency is sufficiently low to ensure decision-making in a near-real-time mode.
The simplifications adopted include the following:
- -
- Experimental validation is focused on cattle, but the model’s architecture allows for adaptation to other types of farm animals.
- -
- Environmental variables (temperature, humidity) are considered as external input parameters without a feedback effect on the animal health model.
- -
- The stability of the IoT infrastructure is assumed, and missing data are compensated for using imputation methods.
These simplifications do not diminish the overall scientific significance of the results, as the main focus is on the key contribution of the work—the integration of modern analytical methods with IoT platforms to create a scalable and sustainable model for animal health monitoring.
The research utilized analytical, numerical, and experimental methods. The theoretical foundation is based on the development of the Deviation Score metric, its integration with machine learning algorithms (Random Forest, anomaly detection models), and the application of Explainable AI methods for interpreting the results. The system was tested on sensor data from farms to evaluate its effectiveness in practical operational conditions.
2. Materials and Methods
2.1. IoT System Architecture
The article presents the architecture of an intelligent animal health monitoring system. The proposed system is built on the principles of a distributed IoT architecture, which ensures continuous collection, transmission, storage, and analysis of data in near-real time. The system architecture has four layers, as in Figure 1: (1) End Device (Tracker), (2) Gateway (LoRaWAN), (3) Network and cloud messaging based on AWS IoT Core with an IoT Rule and Amazon SNS, and (4) Application and Storage. The Application and Storage layer includes the Tracker Data Handler, the Wellness Score Service on Amazon SageMaker with data in Amazon S3 and an hourly CRON trigger, the Anomaly Detector Service with an hourly CRON trigger, the data stores Amazon DynamoDB and Amazon ElastiCache, and the client services Data Retriever Service and Wellness Indicator Service. Each level has corresponding subsystems, as shown in Figure 1, namely: the sensor level includes trackers with sensors, the communication level—LoRaWAN gateways, the network level—AWS processing services, and the application level—mobile interfaces for the user.
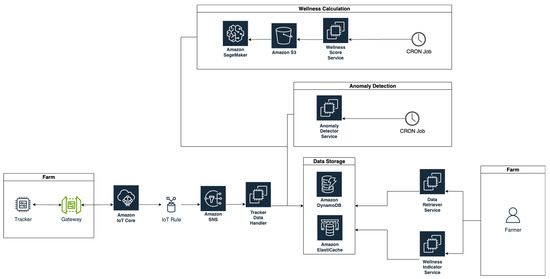
Figure 1.
Architecture of the intelligent animal health monitoring system.
As can be seen from Figure 1, at the center of the proposed architecture is a wearable tracker attached to the animal’s ear. It records physiological and behavioral indicators using built-in sensors and forms structured messages in the TLV (Type–Length–Value) format [26], which are sent at one-minute intervals. To reduce energy consumption on end devices, we compute one-minute summaries on the tag and limit the uplink duty cycle to one message per minute, in line with energy-aware IoT practices reported for smart agriculture. The TLV message format is presented in Table 1. The TLV format allows for the transmission of structurally flexible data packets in a compact form.

Table 1.
TLV message format.
The ear-tag tracker uses an ultra-low-power MCU (STM32L072 (STMicroelectronics, Geneva, Switzerland) with a 3-axis accelerometer (ST LIS3DH (STMicroelectronics, Geneva, Switzerland) configured at 25 Hz, ±8 g, 12-bit resolution. A digital temperature sensor (TI TMP117 (Texas Instruments Incorporated, Dallas, TX, USA)) is sampled every 2 min. On-device aggregation produces 60 s summaries (state durations, mean/variance, zero-crossings); one TLV message per minute is sent. The radio is a Semtech SX1276 LoRa (EU868) (Semtech Corporation: Camarillo, CA, USA) with SF9/BW 125 kHz/CR 4/5; confirmed uplinks are enabled. The gateway is Dragino LPS8 (EU868) (Dragino Technology Co., Limited, Shenzhen, China). Average RSSI at the pen is −92 dBm (range −105–−80 dBm). Power is a 3.6 V Li-SOCl2 1200 mAh cell; estimated lifetime 6–9 months at a 1 min duty cycle [27].
Table 2 summarizes the sensors used and their key technical characteristics, including measurement accuracy. Values are from device datasheets; practical accuracy can depend on mounting and calibration.
Table 2.
Sensors used in the system and their key technical characteristics.
While our deployment uses LoRa chirp spread spectrum for farm-scale coverage, we note that alternative short-range, low-power modulations have been proposed; for example, the MC-ICI-DCSK scheme reports improved BER and energy/spectral efficiency under multipath fading [28].
To monitor hardware health, the tag appends battery voltage and internal temperature to the TLV payload once per hour. A watchdog task runs an automatic accelerometer offset check during detected rest and stores per-device offset shifts. These diagnostics feed server-side quality control: windows with ‘low battery’ or ‘sensor drift’ flags are down-weighted or excluded, and a maintenance alert is issued if thresholds are exceeded.
TLV messages are transmitted to a gateway located on the farm premises via the LoRaWAN protocol [29]. The data then goes to Amazon IoT Core, the central element of the cloud platform, which handles message reception from devices [30]. Thanks to an IoT Rule, each incoming message is routed to the Amazon SNS (Simple Notification Service) system, which, in turn, forwards them to a processing queue. If missing data is detected or for receipt confirmation, an ACK (acknowledgement) mechanism is used, which is sent from the server to the tracker via the LoRaWAN Gateway. The process is schematically shown in Figure 2.
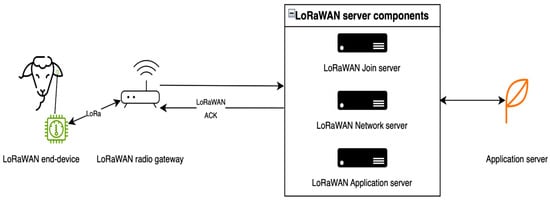
Figure 2.
Message flow in the LoRaWAN system between the tracker and the application server.
As can be seen from Figure 2, data from the tracker is transmitted via a LoRaWAN radio Gateway. Its role is to decode uplink radio packets from the air and forward them unprocessed to the network server. In response, the server initiates the transmission of a downlink message with an acknowledgement (ACK). This model allows for minimizing data loss and maintaining effective device interaction even in complex radio conditions.
The LoRaWAN Join Server manages the end-device activation process.
The LoRaWAN Application Server processes all application-level payloads from the end-devices and also generates all downlink application-level payloads.
The Network Server (LoRaWAN Network Server) provides for:
- -
- Deduplication of uplink messages from devices in case multiple gateways within the device’s reach receive and forward the message to it.
- -
- Forwarding of uplink application payloads to the respective application servers.
- -
- Queuing of downlink application payloads.
- -
- Interaction with the Join Server during the join procedure.
After the messages are received by the LoRaWAN Network Server, they are transmitted for cloud processing, where the Tracker Data Handler service plays a key role. This service is responsible for unpacking messages, analyzing the TLV structure, detecting violations in time intervals, and verifying the sequence and the presence of missing data. In addition, the handler computes rolling device baselines (e.g., static acceleration and hourly activity counts) and assigns data-quality flags for suspected sensor drift or low battery. Flagged windows are filtered or imputed, and, if needed, the device duty cycle is reduced via downlink to prolong lifetime. In case of detecting massive losses or the need for remote control of the indicator, this module initiates the formation of corresponding downlink commands. A structural diagram of the TLV message processing process in the Tracker Data Handler is presented in Figure 3.
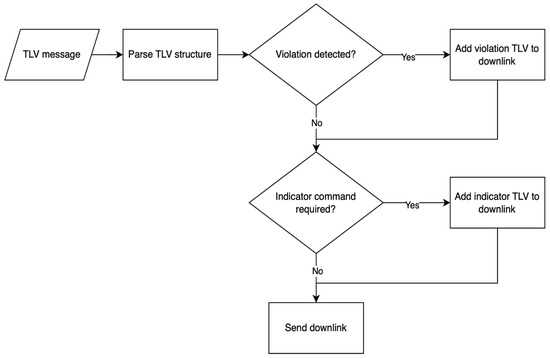
Figure 3.
Structural diagram of the TLV message processing in the Tracker Data Handler.
The processing results are sent to a storage system that includes two layers: an Amazon DynamoDB database, which serves as the main storage for aggregated data on animal status, and Amazon ElastiCache, which provides operational access to real-time information, particularly for rapid response and visualization systems.
Two analytical services operate based on the data stored in DynamoDB. The first, the Wellness Score Service (Figure 4), implements the algorithm for calculating the animal health index. It runs on a CRON schedule, initiating the hourly collection of aggregated historical data in CSV format, which is stored in Amazon S3. A deep learning model, implemented in the Amazon SageMaker environment, is used to calculate the index.
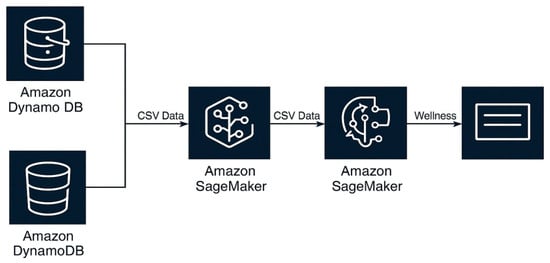
Figure 4.
The sequence of Wellness Score calculation using the AWS cloud infrastructure.
As presented in Figure 4, the Wellness Score calculation process is implemented as an automated pipeline with several stages. First, aggregated data on the behavioral states of animals are collected from Amazon DynamoDB and stored as CSV files in the Amazon S3 cloud storage. This data covers a period of at least 7 days for each animal and includes features such as the average duration of individual states, the frequency of behavioral changes, and individual time rhythms. Next, the data is transferred to the Amazon SageMaker service, where it is processed using a Random Forest Regressor [31], previously trained on historical profiles. The result is a Wellness Score index, a numerical value from 0 to 100, which is returned to DynamoDB and becomes available to application services and the user.
The second service (Anomaly Detector Service) is also activated on a CRON schedule. It analyzes time series of animal behavioral parameters, detects abnormal patterns, and stores the results in the database. Both services operate independently but use a common data store and interact through a standardized event model.
The user interface is represented by two application services. The Data Retriever Service provides access to aggregated data and analytics results through mobile or web applications, giving the farmer the ability to view the status of individual animals and receive notifications about anomalies or a decrease in the health index. The Wellness Indicator Service implements mechanisms for controlling the tracker’s indicator, allowing the farmer to remotely activate a light signal to identify a specific animal on the farm.
Thus, the system architecture provides a complete functional cycle, from data collection in the field to automated decision-making based on intelligent analysis, with the subsequent display of results in a user-friendly format.
2.2. Representation of Behavioral States (Classification, Encoding)
For the systematic analysis of animal behavior within the proposed system, a unified state model is used. This model is based on high-frequency accelerometer data (from the ActBeCalf dataset) and allows for the interpretation of sensor signals in the form of categorical changes. Each behavioral state is encoded by a single byte, which consists of two logical parts: the four most significant bits denote the type of behavior (classifier), and the four least significant bits form the duration of stay in this state.
Such encoding is not only compact for data transmission in the limited LoRaWAN channel but also unified for use in analytical modules.
The system has a fixed list of six diagnostically significant states, which allows for a detailed analysis of the behavioral patterns of animals. A special “Unclassified” state is also used. The complete list of behavioral states and their HEX encoding is summarized in Table 3.
Table 3.
A complete list of animal behavioral states and their HEX encoding.
We form the state sequence by dividing each minute into events and mapping them to Active Locomotion, Ingestion, and Rest. This process classifies each label, such as “walking,” “eating,” or “rumination,” into the corresponding group (Active Locomotion, Ingestion, Ruminating). The resulting sequence is standardized into a TLV message at one-minute intervals. Each such message is a compact representation of the animal’s state over the last minute and serves as the basis for further analysis.
For each animal, a set of numerical features is formed, which are the input parameters for machine learning models. These features are calculated for different time windows (6, 12, 24 h) and include the following: the relative duration of each state, the frequency of transitions between states, and other diagnostic metrics. Illustrative examples of the engineered numerical features derived from the one-minute TLV messages are listed in Table 4.
Table 4.
Examples of numerical features formed based on the tracker’s TLV messages.
Each feature is formed based on TLV messages received from the tracker at one-minute intervals. Thus, the system’s feature space covers not only the current state but also the historical behavior of the animal in the context of time, with a special emphasis on critically important physiological processes, such as rumination.
2.3. Wellness Score Formation Model
2.3.1. Generalized Model for Wellness Score Formation
After completing the stage of building aggregated features based on TLV sequences, the system initiates the process of calculating the animal’s health index (Wellness Score). This index is a generalized numerical indicator that reflects the current physiological and behavioral state of the animal based on its individual activity profile.
The process of forming the Wellness Score includes several stages. First of all, the system selects aggregated features from the DynamoDB database for the last observation periods (for example, 6 h, 24 h, 3 days, 7 days) and forms an input feature vector for each animal.
Next, the formed vector is transferred to a computing module, implemented on the basis of the AWS SageMaker cloud service, where a pre-trained model is called. The model is built on the basis of the Random Forest Regressor ensemble method, which effectively works with tabular data and is capable of detecting complex, nonlinear dependencies between behavioral features. A key feature is the model’s ability to learn complex dependencies between behavioral features to reproduce a reference health index, determined on the basis of pre-defined physiological rules (for example, duration of rumination and feed consumption). Thus, the model automates and generalizes the expert assessment of the animal’s condition.
The output of the model is a numerical Wellness Score value in the range from 0 to 100, where 100 is the ideal state, and a value below a threshold level (usually 70) signals a potential violation in behavior or physiology. The obtained value is stored in the database and becomes available for application services, in particular for the user’s mobile interface, API integrations, or the indication system on the animal.
Hourly generation of the Wellness Score enables early alerts at the animal and herd levels.
In order to increase accuracy and diagnostic value, the Wellness Score formation model is supplemented with a mechanism for an individual baseline profile. For each animal, the system automatically determines a period of stable physiological state (without signs of stress or abnormal behavior), on the basis of which its individual “norm” of key indicators is calculated. In the future, it is the deviation from this personalized baseline, and not from generalized thresholds, that serves as an indicator of potential risk. This approach allows for taking into account inter-individual variability and significantly reduces the number of false positive signals.
In addition to the personal profile, the context of collective behavior is also integrated into the index calculation. For example, if an individual animal shows a significant deviation from the average values of activity or rumination within the herd, its Wellness Score is automatically lowered. This allows the system to detect both individual and epizootic risks that arise at the group level.
To increase the transparency of decision-making, the model is supplemented with a results explanation module (Explainable AI). By using the SHAP values method, it is possible to identify which features (for example, a decrease in the proportion of intense activity or the absence of rumination episodes) had the greatest impact on the current Wellness Score value. This provides farmers and veterinarians with a better interpretation of the results and supports making informed decisions in the field of animal care.
The formed features (both standard and generalizing from the baseline, group behavior, and series stability modules) are combined into an input vector for the prediction model. To build the Wellness Score index, a Random Forest Regressor ensemble machine learning model, implemented in the AWS SageMaker environment, is used. This algorithm was chosen due to its high resistance to noise, its ability to work with a limited amount of data, and its effective processing of tabular features with different measurement scales. The model is trained on historical data in which the animal’s health index is assessed by experts or formed on the basis of a retrospective analysis of behavior in stable periods.
2.3.2. Building an Individual Reference Profile
After training, the model receives an aggregated feature vector for each animal and generates a numerical Wellness Score value in the range from 0 to 100.
The calculation of the Wellness Score index was improved by introducing an individualized reference profile (baseline), which reflects the typical behavioral activity of each animal during a period of physiological stability. To form the profile, the system automatically selects at least a seven-day interval with the least variability of key features. Based on this data, a vector of mean values and confidence limits is calculated, which serves as an adaptive norm for further calculations.
The analysis of current aggregated indicators is carried out in the form of a deviation from the individual baseline. For example, if the ruminating_ratio_24h indicator falls below two standard deviations from the reference value, the system lowers the Wellness Score regardless of global thresholds. This allows for a more sensitive detection of personal deviations that might have gone unnoticed in a population context.
A fragment of the baseline profile for an animal is given in Table 5.
Table 5.
Fragment of the baseline profile for the animal with ID = 017.
It is expected that the inclusion of a personalized profile reduces the number of false positive signals compared to a model based only on global thresholds, especially in conditions of high inter-individual variability.
2.3.3. Contextualization Within Group Behavior (Herd-Level Scoring)
As part of increasing the sensitivity and contextual accuracy of the Wellness Score, a mechanism for taking into account the group behavior of animals has been implemented. The main idea is that physiological or behavioral changes may be relevant only in the context of the population norm. For example, a general decrease in activity in the entire herd may indicate an external stress factor (heat, noise, feeding), and not an individual pathology [32].
For a more sensitive and reliable detection of individual anomalies in the context of group behavior, a combined approach was developed that combines traditional statistical characteristics with methods of nonlinear time series analysis. Each animal is evaluated not only by the deviation of key behavioral features from the population norm but also by the dynamic properties of these series.
The composite metric Deviation Score is determined by the formula:
where
- —the absolute deviation of the feature value from the herd median, normalized by the interquartile range [33];
- xi—the value of the feature for the animal;
- —the corresponding feature in the entire herd;
- IQR—interquartile range;
- H—the Hurst exponent, which reflects the degree of persistence in a time series (the lower it is, the higher the level of randomness) [34];
- —the normalized value of the BDS statistic, which detects the presence of nonlinear dependencies in the signal [35];
- w1, w2, w3—weighting coefficients that can be set empirically or optimized through a model training procedure.
The metrics that form the composite Deviation Score describe different aspects of behavioral dynamics. However, their partial correlation or functional redundancy is possible, which requires a thorough justification for the inclusion of each of them in the final formula.
We chose the three components of the Deviation Score to target distinct and practically relevant aspects of short-window behavior. First, the deviation from the herd median scaled by IQR acts as a robust effect size: it responds to within-animal shifts in feeding and activity while down-weighting outliers and heavy-tailed noise common in high-frequency sensor data [3]. Second, the Hurst exponent (estimated via detrended fluctuation analysis) measures long-range temporal correlations; changes in persistence have been reported in physiological and animal-behavior time series under stress or disease, indicating reorganized control and altered routine structure. Third, the BDS statistic is a non-parametric test of i.i.d.; we use its standardized absolute value as a compact indicator of nonlinear serial dependence that emerges when behavior becomes more patterned or erratic than usual. Together, the three signals—scale shift, correlation structure, and nonlinearity—offer complementary sensitivity to early deviations while remaining lightweight and interpretable for farm IoT pipelines [22].
In particular, the Hurst exponent (H) and the BDS statistic may simultaneously react to an increase in instability, although they originate from different analytical approaches—fractal and statistical-empirical, respectively. At the same time, the deviation from the median is a traditional and stable marker for an anomalous individual pattern in relation to the group, but it does not take into account the internal structure of the changes.
To avoid redundancy and improve the accuracy of the assessment, it was decided to apply an adaptive weighting strategy, in which the coefficients w1, w2, w3 in the Deviation Score formula are subject to optimization at the model training or validation stage. This allows for reducing the influence of a less informative metric in specific conditions or even excluding it if its contribution to the accuracy of the Wellness Score prediction is insignificant.
Features with the highest Deviation Score (DS) values automatically receive a greater influence in the formation of the Wellness Score or activate a local notification mechanism about a possible violation. This makes it possible to detect not only absolute deviations of behavior from the population norm but also violations of the internal structure of the animal’s activity, for example, an increase in randomness, a loss of regularity, or the appearance of nonlinear instability.
The proposed approach allows the model to take into account both vertical deviations (from the individual baseline) and horizontal violations (relative to the behavioral structure of the herd), thereby increasing sensitivity to early signs of pathological dynamics.
Table 6 provides an example of calculating the components of the Deviation Score for three animals based on the ruminating_ratio_24h feature.
Table 6.
An example of calculating the components of the Deviation Score for three animals based on the ruminating_ratio_24h feature.
In the given example, animal 021 has not only a significant absolute deviation from the herd median (|δ| = 4.00) but also a significant drop in behavioral regularity (Hurst exponent H = 0.44) and signs of nonlinear instability (elevated BDS value). This leads to the formation of a high Deviation Score = 2.80, which automatically lowers the Wellness Score and may trigger a system warning. Meanwhile, animal 017 has a positive deviation from the median but demonstrates stable dynamics according to other criteria.
Figure 5 shows histograms of the Deviation Score for three animals.
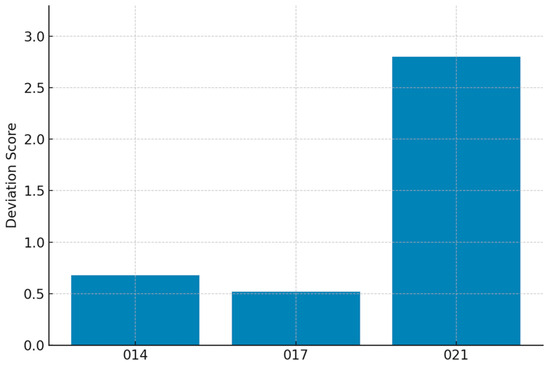
Figure 5.
Histograms of the Deviation Score for three animals.
Figure 5 allows for a comparison of the Deviation Score values for three selected animals and illustrates the degree of deviation of their behavior from the collective norm of the herd. As can be seen from the graph, animal 021 demonstrates a critically high Deviation Score (2.80), which indicates not only a significant deviation in feature values but also a disruption in the structure of their dynamics.
The proposed approach complements the individual baseline and allows the model to take into account both vertical (personal) and horizontal (population) deviations in the behavioral profile.
2.3.4. Results Explanation Module (Explainable AI)
To increase the transparency of decision-making and user trust in the system, a results explainability module was implemented, which allows for the interpretation of the impact of individual features on the final Wellness Score value. For this, the Explainable AI (XAI) approach is used, specifically the SHAP (SHapley Additive exPlanations) method [36], which is based on cooperative game theory and allows for assessing the contribution of each feature to the model’s decision.
SHAP values are calculated for each Wellness Score prediction in real-time using an optimized version for tree-based models (TreeSHAP, v0.46.0, Python) [37,38], which is supported by the SageMaker framework. The obtained values allow for identifying which features (e.g., a decrease in the proportion of rumination or an increase in randomness) had the greatest impact on the current assessment.
Table 7 provides an example of the top 5 features by SHAP influence for animal 021.
Table 7.
An example of the top-5 features by SHAP influence for animal 021.
The explainability results can be displayed in the user interface as interactive graphs or text reports. This provides the farmer or veterinarian not only with a numerical assessment of the animal’s condition but also with a detailed justification of why the Wellness Score decreased, indicating the most influential indicators.
Figure 6 shows an example of a histogram of the Wellness Score model prediction for an animal with ID = 021 using the SHAP method.
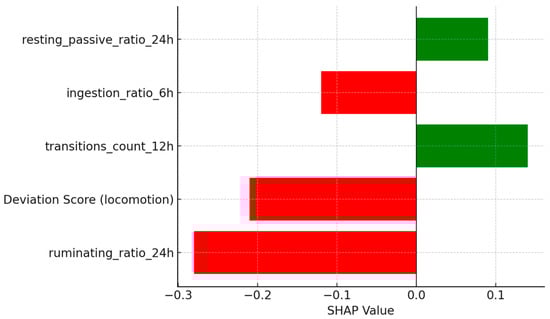
Figure 6.
Example of a histogram of the Wellness Score model prediction for an animal with ID = 021 using the SHAP method. Green bars indicate features that increase the predicted Wellness Score (positive SHAP value), while red bars indicate features that decrease it (negative SHAP value). Bar length reflects the absolute contribution magnitude; features are sorted by |SHAP|.
The histogram in Figure 6 illustrates the five most influential features that form the final assessment of the animal’s condition. The direction and color of the bar reflect the sign and strength of the influence. Green bars indicate a positive contribution of the feature to increasing the index, while red bars indicate a negative one. In particular, a decrease in the proportion of time in the ruminating_ratio_24h state and a high Deviation Score were the main reasons for the decrease in the Wellness Score for animal 021.
The graph illustrates the model’s explainability and allows for interpreting the reasons for the change in the health index in real time.
Furthermore, SHAP analysis allows for the detection of systemic model errors, the identification of uninformative or excessively correlated features, and the verification of the model’s behavior consistency with domain expertise. Such diagnostics are critically important for maintaining quality in complex multidimensional environments where both normal behavioral variations and pathological conditions are observed.
Thus, the integration of Explainable AI into the Wellness Score calculation module contributes to improving both the model’s interpretability and the convenience of decision-making in the real conditions of farm monitoring.
3. Results
Evaluating the Effectiveness of the Wellness Score Prediction Model
To evaluate the effectiveness of the Wellness Score prediction model, testing was conducted on data split by individual animals (split by calfId). This approach allows for assessing the model’s ability to generalize and its transferability to new animals that were not present during training.
In the experiment, data from 16 animals were used for training the model, and data from 8 other animals were used for testing. The total volume of the training sample was 359,228 records, and the test sample was 112,668 records, which ensures the reliability of the statistical evaluation.
According to the test results, the model demonstrated accuracy corresponding to the following characteristics:
- -
- Mean Absolute Error (MAE): 1.09 points;
- -
- Coefficient of Determination (R2): 0.84.
These results indicate that the predicted values correspond well with the actual values. Overall, the results show the model’s ability to effectively reproduce the target health index based on behavioral features, including the individual baseline, herd context, and time series instability.
The evaluation of feature importance in the Random Forest model showed that the most influential parameters were those listed in Table 8.
Table 8.
Global feature importance in the baseline Random Forest model.
As can be seen from the data in Table 7, there is a certain dominance of the ingestion_ratio_6h indicator. This fact points to the key role of feeding activity in assessing animal health, while parameters related to rumination play a secondary role.
Additionally, an anomaly detector (Isolation Forest) was trained, which identified 10% of suspicious records among all behavioral data. A summary of anomalies by animal showed significant variability: from 0% to 100% of detected anomalies for individual calfId.
This allows for the following:
- -
- Identifying individuals with increased behavioral instability;
- -
- Localizing potential risks without lowering the Wellness Score for all animals;
- -
- Analyzing population risks (epizootics).
To improve the model’s informativeness and enhance its sensitivity to individual behavioral changes, an additional composite feature, Deviation Score, was integrated into the model.
According to the test results, the new model evaluation results correspond to the following characteristics:
- -
- Mean Absolute Error (MAE): 1.05 points;
- -
- Coefficient of Determination (R2): 0.87.
After including the Deviation Score in the feature space, the model demonstrates a moderate but stable improvement in accuracy metrics. The Mean Absolute Error (MAE) decreased from 1.09 to 1.05 points, and the coefficient of determination (R2) increased from 0.84 to 0.87, which indicates a better correspondence between the predicted and actual values.
The structure of feature importance in the Random Forest model also changed. The new deviation_score parameter rose into the top 10 most influential features, entering the top three and taking second place in importance after ingestion_ratio_6h, surpassing all other features related to rumination or transitions. The evaluation of feature importance in the new Random Forest model showed that the most influential parameters were those listed in Table 9. This indicates the ability of the Deviation Score to detect atypical behavioral dynamics that are not captured by classical aggregations.
Table 9.
Evaluation of feature importance in the improved Random Forest model.
The provided data indicates that the Deviation Score is a complementary indicator that not only enriches the model space but also provides higher sensitivity to deviations without duplicating information from other features.
Figure 7 presents a histogram illustrating the proportion of anomalous records according to the Isolation Forest algorithm for different animals.
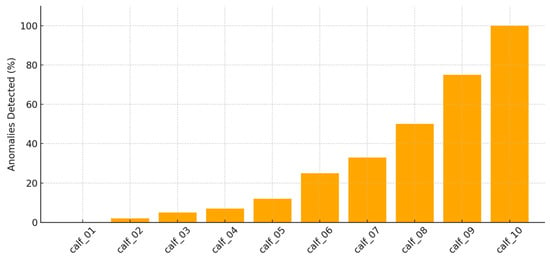
Figure 7.
Distribution of the proportion of anomalous behavioral patterns detected by the Isolation Forest algorithm for different animals.
The graph demonstrates significant inter-individual variability in behavioral stability: some animals (e.g., calf_01–calf_04) show almost no deviations, while others (calf_09–calf_10) have up to 100% of their records marked as suspicious. This suggests the possible presence of chronic problems or the intensive influence of external stressors.
Such analysis allows not only for localizing risk sources without lowering the overall index for the entire herd but also for applying a differentiated approach in veterinary support, focusing on the individual needs of the animals.
Thus, the conducted analysis has shown that integrating the Deviation Score module into the system increases sensitivity to internal structural changes, while the Wellness Score model remains the main composite indicator of health, with high prediction accuracy and the possibility of a detailed explanation of feature influence thanks to SHAP.
4. Discussion
The research results confirmed that the proposed integrated model for intelligent monitoring and diagnostics of animal health based on IoT technology is capable of ensuring high accuracy in predicting the condition of animals in a digital farm environment. The achieved values of MAE = 1.05 and R2 = 0.87 testify to the effectiveness of combining classic aggregated behavioral features with the new composite metric, Deviation Score, which takes into account the statistical and nonlinear characteristics of dynamics.
The components of the Deviation Score are consistent with observed physiology and farm practice. Short-term reductions in feeding and changes in rumination/locomotion typically precede clinical diagnosis in calves and dairy cattle; in our pipeline, these appear as larger, robust deviations. Altered routine structure and persistence (captured by the Hurst exponent) and increased nonlinear serial dependence (captured by BDS) are plausible markers of stress or early disease. Prior sensor-based studies relating feeding/rumination changes to recovery status and health events support the practical value of such signals for early alerts.
A comparison with the baseline version of the model, which used only aggregated indicators, revealed a stable improvement in accuracy after the integration of the Deviation Score. This confirms the hypothesis that combining traditional statistical indicators (deviation from the median, normalized by the interquartile range) with indicators from the theory of dynamic chaos (Hurst exponent, BDS statistic) allows for the detection of more subtle deviations that might be ignored by one-dimensional approaches.
An important advantage of the developed architecture is its multi-level analysis: from an individual baseline profile to the collective patterns of the herd. This approach has made it possible to reduce the number of false positives and increase sensitivity to local changes that are relevant only in the context of a specific animal. At the same time, taking into account group anomalies creates an additional level of protection against systemic risks associated with external factors.
Additionally, the integration of the Explainable AI module (SHAP analysis) has increased the interpretability of the results, allowing for the identification of the most influential features in predicting the Wellness Score. This not only facilitates decision-making for farmers and veterinarians but also increases trust in automated diagnostic systems.
At the same time, the results showed a certain dominance of individual features, particularly ingestion_ratio_6h, which may indicate the need for additional balancing of the feature space. Also, although the model demonstrates resistance to noise, its performance may decline with significant amounts of missing data or in cases where the sensor infrastructure operates unstably.
This pilot did not include a formal study of implementation cost or power consumption. In future work, we will quantify per-animal hardware and infrastructure costs and analyze operational costs, including tag battery life under different duty cycles, gateway coverage, and cloud usage across housing types and radio conditions. These results will inform design trade-offs and deployment guidelines for larger herds.
Our deployment follows an energy-aware design (on-device 60 s aggregation, one-minute uplinks, stateless cloud processing). The tag firmware logs hourly battery voltage and internal temperature, and the server can downlink a reduced duty cycle when the voltage falls. A formal energy audit, per-device mAh/day, gateway power draw, and cloud compute/storage usage, and a derived monthly operating-cost estimate by herd size were outside the present scope and will be reported in future work. The instrumentation described in Section 2.1 enables these measurements.
In this paper, “scalable” refers to the computational and operational capacity of the pipeline rather than demonstrated cross-farm generalization. The data plane relies on stateless, managed services and one-minute on-device summaries, so throughput and cost grow roughly linearly with herd size, and components scale out automatically. At the same time, multi-scenario validation (multiple farms, breeds, climates, and housing systems) was outside the present scope and is planned as future work.
Gradual accelerometer offset shifts or reduced supply voltage can bias short-window features and increase packet loss. We mitigate this in three ways. First, features that drive the Deviation Score use robust normalization (median/IQR), which reduces sensitivity to scale/offset changes. Second, device diagnostics (hourly battery voltage, internal temperature, auto-zero checks) generate data-quality flags that trigger filtering or down-weighting of affected windows. Third, the server can reduce the uplink duty cycle when the voltage falls, trading temporal resolution for stability until maintenance. Future work will quantify drift sensitivity more formally and report thresholds for farm-side alerts.
Compared to existing approaches, the proposed model provides:
- -
- Comprehensive integration of different types of data (physiological, behavioral, contextual) into a single composite assessment;
- -
- The use of indicators from complex systems to increase sensitivity to anomalies;
- -
- Real-time explainability of results to support decision-making.
Further development of the research involves scaling the model to other types of agricultural animals, testing it in different climatic and production conditions, and integrating additional sensory channels (biochemical indicators, microclimate conditions, etc.). Special attention is planned to be given to adapting the algorithms to conditions with unstable communication and limited resources of edge-level computing devices.
5. Conclusions
This article develops and validates a model for the intelligent monitoring and diagnostics of animal health based on IoT technology for a digital farm, which integrates multisensory data with machine learning algorithms and methods for analyzing complex systems.
Key findings of the work include the following:
- An integrated architecture combines multisensory data collection devices, machine-learning modules, and tools for analyzing complex systems. The structure ensures coordinated interaction between hardware and software components and is designed for scalability and adaptability via per-minute on-device summarization and stateless, managed cloud services; the present evaluation used a single-farm dataset, and multi-scenario/large-scale validation will be addressed in future work.
- A composite metric, Deviation Score, has been formulated, which combines the absolute deviation from the herd median (normalized by the interquartile range) with the Hurst exponent, BDS statistics, and indicators of fractal complexity. It has been shown that its use increases the model’s sensitivity to detecting behavioral and physiological anomalies.
- Mechanisms of explainable artificial intelligence (Explainable AI) have been implemented, which ensure the interpretability of the decisions made and allow for the identification of the most significant features that influence the prediction of animal health status. This increases trust in the system and facilitates its practical implementation.
- Individual and group levels of analysis have been integrated, allowing for the detection of both deviations in the behavior of an individual animal from its own baseline profile and systemic changes within the entire herd. This approach increases the effectiveness of early disease risk detection.
- Testing on real farm data has been conducted, which confirmed the model’s effectiveness. The MAE and R2 estimates showed the competitiveness of the proposed approach compared to traditional monitoring methods, as well as its high sensitivity to anomalies, including hidden patterns not detected by standard systems.
Thus, the developed model creates a foundation for building universal and adaptive digital solutions in the field of animal husbandry, which contribute to increasing the efficiency of herd management, reducing the risks of productivity loss, and ensuring the sustainable development of the agricultural sector.
Future Work
We will extend validation across multiple farms, breeds, housing systems, and climates; quantify operational aspects and costs (device power consumption under different duty cycles, gateway coverage, and cloud usage); and perform ablation and sensitivity studies of the Deviation Score components. We also plan to integrate additional sensing (e.g., rumination microphones, body temperature, and microclimate) and to evaluate adaptive duty-cycle strategies for long deployments. Finally, prospective on-farm trials will measure alert lead time, false positives, and user actions to assess real-world impact.
Author Contributions
Conceptualization, S.S.; methodology, S.S. and D.K.; software, D.K. and M.S.; validation, S.S., I.R. and A.K.; formal analysis, D.K. and O.P.; investigation, S.S. and D.K.; data curation, D.K. and M.S.; writing—original draft preparation, D.K.; writing—review and editing, S.S.; visualization, D.K. and M.S.; supervision, I.R., A.K. and O.P. All authors have read and agreed to the published version of the manuscript.
Funding
This research received no external funding.
Institutional Review Board Statement
Not applicable.
Informed Consent Statement
Not applicable.
Data Availability Statement
The original contributions presented in this study are included in the article. Further inquiries can be directed to the corresponding authors.
Conflicts of Interest
The authors declare no conflicts of interest.
References
- Wolfert, S.; Ge, L.; Verdouw, C.; Bogaardt, M.-J. Big data in smart farming—A review. Agric. Syst. 2017, 153, 69–80. [Google Scholar] [CrossRef]
- Akhigbe, B.I.; Munir, K.; Akinade, O.; Akanbi, L.; Oyedele, L.O. IoT Technologies for Livestock Management: A Review of Present Status, Opportunities, and Future Trends. Big Data Cogn. Comput. 2021, 5, 10. [Google Scholar] [CrossRef]
- Tangorra, F.M.; Buoio, E.; Calcante, A.; Bassi, A.; Costa, A. Internet of Things (IoT): Sensors Application in Dairy Cattle Farming. Animals 2024, 14, 3071. [Google Scholar] [CrossRef] [PubMed]
- Norton, T.; Chen, C.; Larsen, M.L.V.; Berckmans, D. Precision livestock farming: Building “digital representations” to bring the animals closer to the farmer. Animal 2019, 13, 3009–3017. [Google Scholar] [CrossRef] [PubMed]
- Farooq, M.S.; Sohail, O.O.; Abid, A.; Rasheed, S. A Survey on the Role of IoT in Agriculture for the Implementation of Smart Livestock Environment. IEEE Access 2022, 10, 9483–9505. [Google Scholar] [CrossRef]
- Terence, S.; Immaculate, J.; Raj, A.; Nadarajan, J. Systematic Review on Internet of Things in Smart Livestock Management Systems. Sustainability 2024, 16, 4073. [Google Scholar] [CrossRef]
- Umstatter, C. The evolution of virtual fences: A review. Comput. Electron. Agric. 2011, 75, 10–22. [Google Scholar] [CrossRef]
- Ozger, Z.; Cihan, P.; Gokce, E. A Systematic Review of IoT Technology and Applications in Animals. Kafkas Univ. Vet. Fak. Derg. 2024, 30, 411–431. [Google Scholar] [CrossRef]
- Ruiz-Garcia, L.; Lunadei, L.; Barreiro, P.; Robla, I. A Review of Wireless Sensor Technologies and Applications in Agriculture and Food Industry: State of the Art and Current Trends. Sensors 2009, 9, 4728–4750. [Google Scholar] [CrossRef]
- Neethirajan, S. Recent advances in wearable sensors for animal health management. Sens. Bio-Sens. Res. 2017, 12, 15–29. [Google Scholar] [CrossRef]
- Kuchuk, H.; Husieva, Y.; Novoselov, S.; Lysytsia, D.; Krykhovetskyi, H. Load balancing of the layers IoT fog-cloud support network. Adv. Inf. Syst. 2025, 9, 91–98. [Google Scholar] [CrossRef]
- Yousefi, D.B.M.; Rafie, A.S.M.; Al-Haddad, S.A.R.; Azrad, S. A Systematic Literature Review on the Use of Deep Learning in Precision Livestock Detection and Localization Using Unmanned Aerial Vehicles. IEEE Access 2022, 10, 80071–80091. [Google Scholar] [CrossRef]
- Semenov, S.; Krupska-Klimczak, M.; Czapla, R.; Krzaczek, B.; Gavrylenko, S.; Poltorazkiy, V.; Vladislav, Z. Intrusion Detection Method Based on Preprocessing of Highly Correlated and Imbalanced Data. Appl. Sci. 2025, 15, 4243. [Google Scholar] [CrossRef]
- Moskalenko, V.; Kharchenko, V.; Semenov, S. Model and Method for Providing Resilience to Resource-Constrained AI-System. Sensors 2024, 24, 5951. [Google Scholar] [CrossRef]
- Yamsani, N.; Muthukumaran, K.; Kumar, D.; Asha, V.; Singh, N.; Arockia Dhanraj, J. IoT-Based Livestock Monitoring and Management System Using Machine Learning Algorithms. In Proceedings of the 2024 International Conference on Science Technology Engineering and Management (ICSTEM), Coimbatore, India, 26–27 April 2024; pp. 1–6. [Google Scholar] [CrossRef]
- Shi, Z.; Zhang, A.; Jia, Y.; Li, J.; Wang, X.; Qiu, Y. Internet-of-Things Behavior Monitoring System Based on Wearable Inertial Sensors for Classifying Dairy Cattle Health Using Machine Learning. In Proceedings of the 2023 IEEE International Conference on Artificial Intelligence in Engineering and Technology (IICAIET), Kota Kinabalu, Malaysia, 12–14 September 2023; pp. 277–282. [Google Scholar] [CrossRef]
- Cantor, M.C.; Renaud, D.L.; Neave, H.W.; Costa, J.H.C. Feeding behavior and activity levels are associated with recovery status in dairy calves treated with antimicrobials for Bovine Respiratory Disease. Sci. Rep. 2022, 12, 4854. [Google Scholar] [CrossRef] [PubMed] [PubMed Central]
- Hill, T.M.; Suarez-Mena, F.X.; Hu, W.; Dennis, T.S.; Schlotterbeck, R.L.; Timms, L.L.; Hulbert, L.E. Technical Note: Evaluation of an ear-attached movement sensor to record rumination, eating, and activity behaviors in 1-month-old calves. Prof. Anim. Sci. 2017, 33, 743–747. [Google Scholar] [CrossRef]
- Costa, J.H.C.; Cantor, M.C.; Neave, H.W. Symposium review: Precision technologies for dairy calves and management applications. J. Dairy Sci. 2021, 104, 1203–1219. [Google Scholar] [CrossRef]
- Ray, A. Symbolic dynamic analysis of complex systems for anomaly detection. Signal Process. 2004, 84, 1115–1130. [Google Scholar] [CrossRef]
- Semyonov, S.G.; Gavrilenko, S.Y.; Chelak, V.V. Information processing on the computer system state using probabilistic automata. In Proceedings of the 2017 2nd International Ural Conference on Measurements (UralCon), Chelyabinsk, Russia, 16–19 October 2017; pp. 11–14. [Google Scholar] [CrossRef]
- Zhang, H.-Y.; Feng, Z.-Q.; Feng, S.-Y.; Zhou, Y. Typical Algorithms for Estimating Hurst Exponent of Time Sequence: A Data Analyst’s Perspective. IEEE Access 2024, 12, 185528–185556. [Google Scholar] [CrossRef]
- Kostenko, P.Y.; Barsukov, A.N.; Vasiuta, K.S.; Symonenko, S.N. Detection of the chaotic process distorted by the white noise using BDS statistics. Radioelectron. Commun. Syst. 2009, 52, 599–605. [Google Scholar] [CrossRef]
- Costa, M.; Healey, J.A. Multiscale entropy analysis of complex heart rate dynamics: Discrimination of age and heart failure effects. In Proceedings of the Computers in Cardiology, 2003, Thessaloniki, Greece, 21–24 September 2003; pp. 705–708. [Google Scholar] [CrossRef]
- Ma, Z.; Zhang, R.; Ai, B.; Lian, Z.; Zeng, L.; Niyato, D. Deep Reinforcement Learning for Energy Efficiency Maximization in RSMA-IRS-Assisted ISAC System. IEEE Trans. Veh. Technol. 2025, 1–6. [Google Scholar] [CrossRef]
- Huang, Z.; Wu, K.; Huang, S.; Zhou, Y.; Giagone, R.S. Automatic Field Extraction of Extended TLV for Binary Protocol Reverse Engineering. In Proceedings of the 2022 International Conference on Computer Communications and Networks (ICCCN), Honolulu, HI, USA, 25–28 July 2022; pp. 1–10. [Google Scholar] [CrossRef]
- Yu, Q.; He, D.; Lu, Z.; Wang, H. Layered Group-Based Chirp Spread Spectrum Modulation: Waveform Design and Performance Analysis. IEEE Trans. Commun. 2025, 73, 5051–5064. [Google Scholar] [CrossRef]
- Ma, H.; Tao, Y.; Fang, Y.; Chen, P.; Li, Y. Multi-carrier initial-condition-index-aided DCSK scheme: An efficient solution for multipath fading channel. IEEE Trans. Veh. Technol. 2025; early access. [Google Scholar] [CrossRef]
- Almuhaya, M.A.M.; Jabbar, W.A.; Sulaiman, N.; Abdulmalek, S. A Survey on LoRaWAN Technology: Recent Trends, Opportunities, Simulation Tools and Future Directions. Electronics 2022, 11, 164. [Google Scholar] [CrossRef]
- Bonilla, V.; Campoverde, B.; Yoo, S.G. A Systematic Literature Review of LoRaWAN: Sensors and Applications. Sensors 2023, 23, 8440. [Google Scholar] [CrossRef]
- Chakrabarti, A.; Sadhu, P.; Pal, P. AWS IoT Core and Amazon DeepAR-based predictive real-time monitoring framework for industrial induction heating systems. Microsyst. Technol. 2023, 29, 441–456. [Google Scholar] [CrossRef]
- Crump, A.; Jenkins, K.; Bethell, E.J.; Ferris, C.P.; Arnott, G. Pasture Access Affects Behavioral Indicators of Wellbeing in Dairy Cows. Animals 2019, 9, 902. [Google Scholar] [CrossRef]
- Kok, A.; van Knegsel, A.; Bokkers, E.A.M.; Kemp, B.; Thorup, V. Exploring synchrony of lying on commercial dairy farms in relation to management. Appl. Anim. Behav. Sci. 2023, 262, 105906. [Google Scholar] [CrossRef]
- Meleshko, Y.; Yakymenko, M.; Semenov, S. A Method of Detecting Bot Networks Based on Graph Clustering in the Recommendation System of Social Network. In Proceedings of the CEUR Workshop Proceedings, 5th International Conference on Computational Linguistics and Intelligent Systems, Lviv, Ukraine, 22–23 April 2021; Volume I, pp. 1249–1261. Available online: https://ceur-ws.org/Vol-2870/paper92.pdf (accessed on 3 July 2025).
- Pernagallo, G. Random walks, Hurst exponent, and market efficiency. Qual. Quant. 2025, 59 (Suppl. S2), S1097–S1119. [Google Scholar] [CrossRef]
- Semenov, S.G.; Gavrylenko, S.Y.; Chelak, V.V. Developing parametrical criterion for registering abnormal behavior in computer and telecommunication systems on the basis of economic tests. Actual Probl. Econ. Kyiv. 2016, 4, 451–459. [Google Scholar]
- Santos, M.R.; Guedes, A.; Sanchez-Gendriz, I. SHapley Additive exPlanations (SHAP) for Efficient Feature Selection in Rolling Bearing Fault Diagnosis. Mach. Learn. Knowl. Extr. 2024, 6, 316–341. [Google Scholar] [CrossRef]
- Gorokhovatskyi, O.; Peredrii, O.; Teslenko, O. Multiple recursive division explanations for image classification problems. Adv. Inf. Syst. 2025, 9, 5–13. [Google Scholar] [CrossRef]
Disclaimer/Publisher’s Note: The statements, opinions and data contained in all publications are solely those of the individual author(s) and contributor(s) and not of MDPI and/or the editor(s). MDPI and/or the editor(s) disclaim responsibility for any injury to people or property resulting from any ideas, methods, instructions or products referred to in the content. |
© 2025 by the authors. Licensee MDPI, Basel, Switzerland. This article is an open access article distributed under the terms and conditions of the Creative Commons Attribution (CC BY) license (https://creativecommons.org/licenses/by/4.0/).