Article

Integrating Rainwater Harvesting and Solar Energy Systems for Sustainable Water and Energy Management in Low Rainfall Agricultural Region: A Case Study from Gönyeli, Northern Cyprus

by
Youssef Kassem
1,2,3,4,*,
Hüseyin Gökçekuş
2,3,
Aşkın Kiraz
5 and
Abdalla Hamada Abdelnaby Abdelnaby
2
1
Department of Mechanical Engineering, Engineering Faculty, Near East University, via Mersin 10, Nicosia 99138, Cyprus
2
Department of Civil Engineering, Civil and Environmental Engineering Faculty, Near East University, via Mersin 10, Nicosia 99138, Cyprus
3
Energy, Environment, and Water Research Center, Near East University, via Mersin 10, Nicosia 99138, Cyprus
4
Research Center for Science, Technology, and Engineering (BILTEM), Near East University, via Mersin 10, Nicosia 99138, Cyprus
5
Ataturk Faculty of Education, Near East University, via Mersin 10, Nicosia 99138, Cyprus
*
Author to whom correspondence should be addressed.
Sustainability 2025, 17(18), 8508; https://doi.org/10.3390/su17188508
Submission received: 1 August 2025 / Revised: 6 September 2025 / Accepted: 8 September 2025 / Published: 22 September 2025
(This article belongs to the Special Issue Green Technology and Biological Approaches to Sustainable Agriculture)

Abstract

The primary objective of this study is to assess the techno-economic feasibility of an innovative solar energy generation system with a rainwater collection feature to generate electrical energy and meet irrigation needs in agriculture. The proposed system is designed for an agricultural area (Gonyeli, North Cyprus) with high solar potential and limited rainfall. In the present study, global rainfall datasets are utilized to assess the potential of rainwater harvesting at the selected site. Due to the lack of the measured rainfall data at the selected site, the accuracy of rainfall of nine global reanalysis and analysis datasets (CHIRPS, CFSR, ERA5-LAND, ERA5, ERA5-AG, MERRA2, NOAA CPC CMORPH, NOAA CPC DAILY GLOBAL, and TerraClimate) are evaluated by using data from ground-based observations collected from the Meteorological Department located in Lefkoşa, Northern Cyprus from 1981 to 2023. The results demonstrate that ERA5 outperformed the other datasets, yielding a high R-squared value along with a low mean absolute error (MAE) and root mean square error (RMSE). Based on the best dataset, the potential of the rainwater harvesting system is estimated by analyzing the monthly and seasonal rainfall patterns utilizing 65 different probability distribution functions for the first time. Three goodness-of-fit tests are utilized to identify the best-fit probability distribution. The results show that the Johnson and Wakeby SB distributions outperform the other models in terms of fitting accuracy. Additionally, the results indicate that the rainwater harvesting system could supply between 31% and 38% of the building’s annual irrigation water demand (204 m3/year) based on average daily rainfall and between 285% and 346% based on maximum daily rainfall. Accordingly, the system might be able to collect a lot more water than is needed for irrigation, possibly producing an excess that could be stored for non-potable uses during periods of heavy rainfall. Furthermore, the techno-economic feasibility of the proposed system is evaluated using RETScreen software (version 9.1, 2023). The results show that household energy needs can be met by the proposed photovoltaic system, and the excess energy is transferred to the grid. Furthermore, the cash flow indicates that the investor can expect a return on investment from the proposed PV system within 2.4 years. Consequently, the findings demonstrate the significance of this system for promoting resource sustainability and climate change adaptation. Besides, the developed system can also help reduce environmental impact and enhance resilience in areas that rely on water and electricity.

1. Introduction

1.1. Background

Water scarcity has become a major issue worldwide, particularly in semi-arid and arid regions, due to population expansion and climate change [1]. Furthermore, high temperatures and insufficient rainfall are expected to exacerbate water shortages in the near future as a result of climate change [2]. According to Shemer et al. [3], more than 40% of the world’s population experiences water scarcity, and more than 700 million people lack access to clean drinking water. Besides, water scarcity affects 80% of the world’s population, according to the fifth evaluation from the Intergovernmental Panel on Climate Change (IPCC) [4]. Additionally, 1.8 billion people are predicted to reside in regions with severe water scarcity by 2025 [5]. By 2050, two-thirds of the world’s population is expected to be impacted by water stress [6]. Therefore, there are significant challenges to social and economic growth due to the serious scarcity of water, especially in arid and semi-arid regions [6]. According to Lepcha et al. [6] and Ritchie and Roser [7], agriculture consumes the most water worldwide (69%), followed by industry (23%) and domestic consumption (8%). The world’s freshwater supply is continually declining as a result of rising urbanization, rapid industrialization, and overexploitation of groundwater. Freshwater is a vital natural resource for the existence and growth of all living organisms around the globe. Thus, effective techniques and the management of water resources are necessary for sustainability [8,9]. The Sustainable Development Goals (SDGs) and sustainability strategies need to be integrated. Velis et al. [10] demonstrated that policies that prioritize the environment should meet both the SDGs and current water demands without endangering the needs of future generations.
Besides, energy scarcity is a significant issue that impacts sustainable development in regions with arid or semi-arid climates [11]. Energy demand management has recently been recognized in both developed and developing countries as a significant global concern [12]. The traditional strategy for supplying the energy demands of urbanization and industrialization has been to increase the consumption of fossil fuels. Fossil fuel combustion produces toxic NOX, SOX, and COX gases that are harmful to both the environment and human health [13]. Fuel demand has increased due to recent population growth. Concerning levels of environmental contamination have been brought on by the rising use of fossil fuels [14,15]. The primary source of climate change, which is harmful to the environment, is CO2 emissions from the burning of fossil fuels. Therefore, reducing the amount of CO2 and other harmful gases in the atmosphere is necessary for addressing climate change. Increasing the usage of renewable energy, such as solar energy, as a power source is the most efficient approach to achieve this [16]. Renewable energy has the potential to help with ongoing challenges with energy security and cost; however, its current generating capacity remains significantly below that needed to reach net-zero goals by 2050, according to Belaïd et al. [17]. In 2021, renewable energy made up just 29% of the world’s electrical generation, with solar and wind accounting for 10% of the entire electricity mix [17]. Additionally, the percentage of renewable energy in the world’s total electricity generation should rise from 29% in 2020 to over 60% in 2030 and over 90% in 2050 under a net-zero CO2 emissions route [18].

1.2. Rainwater Harvesting (RWH) System

Rainwater harvesting (RWH) is arguably the most traditional method of providing water [19]. According to Rahman [19] and Zhang et al. [20], RWH is an important tool for meeting the growing demand for water and addressing climate change and variability. RWH is a technique for generating, collecting, storing, and preserving local surface runoff for future usage [21,22]. In addition to representing one of the options for water resources, RWH can lower the price and utilization of water that has been treated [23,24]. The RWH system collects rainfall from natural land surfaces or impervious surfaces such as rooftops, terraces, courtyards, and road surfaces and stores it in tanks, cisterns, and underground dams [25,26].
RWH can be described by numerous techniques for collecting rainfall and distributing it as treated or untreated water that can be suitable for potable or non-potable applications [27]. This can vary from small-scale collection in externally mounted tanks for individual untreated garden supply or treated household consumption to neighborhood-scale collection, treatment, and pressurized distribution systems [27,28,29]. Recently, rooftop RWH has become more significant, particularly in urban and rural regions, due to water scarcity, deteriorating infrastructure, and rising water delivery costs [30,31]. Water that has been gathered and preserved by RWH systems can be utilized for both drinking and non-drinking purposes [32]. Moreover, according to previous studies [32,33,34,35,36,37,38,39,40,41], the additional advantages of RWH systems include lowering water stress, reducing the need for chemicals to treat rainwater for non-potable uses, reducing soil erosion, preventing floods in urban basins, lowering runoff peak flow, extending the lifespan of centralized water distribution infrastructure due to lower demand, increasing the flexibility and robustness of water supply systems, and lowering the amount of electricity utilized by sewage and water supply systems. Additionally, RWH is becoming more popular as a sustainable water alternative to supplement some freshwater requirements, thereby mitigating water scarcity problems to a certain extent, according to Nandi and Gonela [42].

1.3. Solar Energy

Generally, developing and developed countries have accelerated the transition from fossil fuels to renewable energy sources to encourage sustainability and minimize the serious impacts of climate change. Renewable energy, such as solar energy, is the key element of sustainable, environmentally friendly, and cost-effective electricity generation. One of the important natural resources for decarbonization and long-term, sustainable growth of human society is solar energy [43].
Solar energy is abundant, free, and non-polluting. Solar has the greatest potential to produce inexpensive electrical power compared to other renewable energy sources [44,45]. Moreover, PV generation costs have been decreasing quickly as a result of ongoing developments in technology [46]. Solar energy is a clean energy source that is widely available and has been utilized for a variety of purposes [47]. For instance, innovative solar-powered water treatment technologies, such as solar disinfection and solar-powered desalination systems, are crucial for addressing water scarcity in arid regions and remote areas [48,49]. Besides, solar-powered irrigation systems provide an environmentally friendly method of optimizing agricultural water usage. Also, solar pumps for groundwater extraction offer a practical substitute for remote agricultural regions, reducing operating expenses and enhancing food security. Therefore, solar-powered water pumping systems have emerged as an affordable alternative to diesel-powered water pumps, particularly in remote regions, as a result of the rising cost of fossil fuels [50]. Additionally, solar home systems raise living standards in rural areas by supplying consistent electricity for small appliances [51].
Consequently, countries can become more robust to water and energy shortages by using solar energy. Solar systems promote sustainable development by minimizing greenhouse gas emissions and reducing the consumption of fossil fuels (limited resources).

1.4. Importance of the Study

Based on the above literature review, the combination of solar energy and other sustainable methods provides a potential solution for minimizing the effects of climate change and achieving sustainable development goals (SDGs). Also, combining renewable energy, such as solar energy, with rainwater collection systems can be an alternative solution to address these issues (water and energy scarcity) for achieving SDGs. According to the authors’ review of the current study, few studies [52,53,54,55,56] have been designed to evaluate the economic viability of the integration of renewable energy systems (solar or wind) with the RWH system. Table 1 lists previous studies related to the hybrid renewable energy–RWH system. In contrast to previous studies (Table 1), this study does not include wind turbines, but rather focuses solely on the integration of solar and rainwater systems for agricultural households. There is a clear gap in the literature, because no previous work has addressed this particular mix designed to meet the needs of farming households.
The primary objective of this paper is to carry out a technical, environmental, and financial feasibility analysis for a patented hybrid solar–RWH system for irrigation purposes. The proposed system is designed for farming families to increase water and energy self-sufficiency. This system can be installed on the rooftops of residential buildings to save rainwater and generate electricity from renewable sources. In light of the aforementioned, the current study emphasizes three significant issues.
  • First, to design an RWH system to meet North Cyprus’s rainfall characteristics. RWH was designed to be utilized for irrigation. The RWH design is based on historical daily rainfall data from 1981 to 2023. Obtaining detailed and suitable rainfall data to have a good design of the RWH system is a challenge in developing countries like Cyprus. Therefore, nine satellite precipitation products were selected for this study’s evaluation of their accuracy in comparison to ground-based gauge rainfall data. Based on the best dataset, finding the distribution function that best fits rainfall data is crucial to designing a successful rainwater harvesting system. It enables accurate projections of both typical and atypical rainfall occurrences, which helps with overflow management and tank size selection. By simulating the frequency of rainfall, the system may be adapted to local patterns, ensuring sufficient capacity for heavy rain while reducing costs. This statistical knowledge supports a reliable, sustainable design that maximizes water availability and system resilience. According to the authors’ review, only a few scientific studies [57,58,59,60,61] have statistically examined the rainfall time series in several Cyprus regions. Michaelides et al. [57] utilized a gamma distribution function to investigate the characteristics of Cyprus’s annual rainfall frequency distribution. Stamatatou et al. [58] examined the characteristics of the annual maximum rainfall depth and storm duration at the Limassol station in Cyprus employing a variety of distribution functions, including generalized extreme value (GEV), Gumbel, and generalized Pareto, gamma, exponential, and log-normal. The findings showed that the generalized extreme value distribution was chosen to describe the storm duration and yearly maximum rainfall depth at the chosen station. Zaifoglu et al. [59] conducted a regional frequency analysis of the annual maximum daily precipitation in Northern Cyprus using traditional cluster analysis and time series clustering techniques. Generalized logistic, generalized normal, and Pearson Type III distributions were determined to be the best fits for the various Northern Cyprus subregions. Besides, in the Güzelyurt region of Northern Cyprus, Kassem et al. [60] determined the best distribution model for monthly and total rainfall. The findings demonstrated that the Nakagami and Wakeby distributions provided the best fit for the actual total and monthly rainfall data. Furthermore, the best-fit probability distribution for monthly rainfall in seven Northern Cyprus locations was identified by Kassem et al. [61]. The findings show that the Gumbel Max best distribution and the generalized extreme value distribution performed effectively in examining the characteristics of average rainfall data. Therefore, 65 frequency distributions and three goodness-of-fit test statistics were applied in this study to determine the best-fit probability distributions in the case of average and maximum daily rainfall.
  • Second, to evaluate the potential of water savings from the use of the solar system for irrigation purposes and generating electricity for the building.
  • Third, to evaluate the technical performance, environmental impact, and economic feasibility of patented hybrid systems using RETScreen Expert software (version 9.1, 2023) to provide a comprehensive understanding of the system’s performance and financial feasibility.

2. Materials and Methods

2.1. Study Area

Cyprus is an island in the Mediterranean Sea, with a total land area of 9251 km2 and a coastline of 1364 km2 [62]. Cyprus is an island that is mostly dominated by the Troodos and Kyrenia Mountains. About half of the island is covered by the 1952-m-tall Troodos Mountain in the west and south [63]. In comparison to Troodos, Kyrenia Mountain is smaller in size and has a narrower shape, since it extends along the northern coastline [64]. Due to its limited surface water resources, Cyprus relies primarily on groundwater as its main source for domestic supply, industries, and crop production [65,66]. Cyprus has a Mediterranean climate, which is defined by hot, dry summers and cool, rainy winters. Rainfall primarily occurs from October through April [67]. The highest rainfall intensity was recorded on the Besparmak Mountain and the North Sea side [68]. Moreover, the average temperature and relative humidity are within the range of 12.9–21.3 °C and 50–70%, respectively [69]. Besides, the global horizontal irradiation and wind speed vary from 4.80 kWh/m2 to 5.44 kWh/m2 and from 2.0 m/s to 9.3 m/s, respectively, according to the global atlas map.
The study’s chosen location is a household-farm unit situated in Gönyeli, Lefkoşa, Northern Cyprus. The monthly variation in electricity consumption and cost for one year (2024) is illustrated in Figure 1. It was found that the average electricity consumption of the chosen location is 664 kWh, ranging from 562 kWh (March) to 741 kWh (August). Furthermore, according to the data, the cost of electricity for energy demand ranges from USD 140 to 185. It should be noted that electricity consumption and costs were collected from the bills provided by the electricity company.
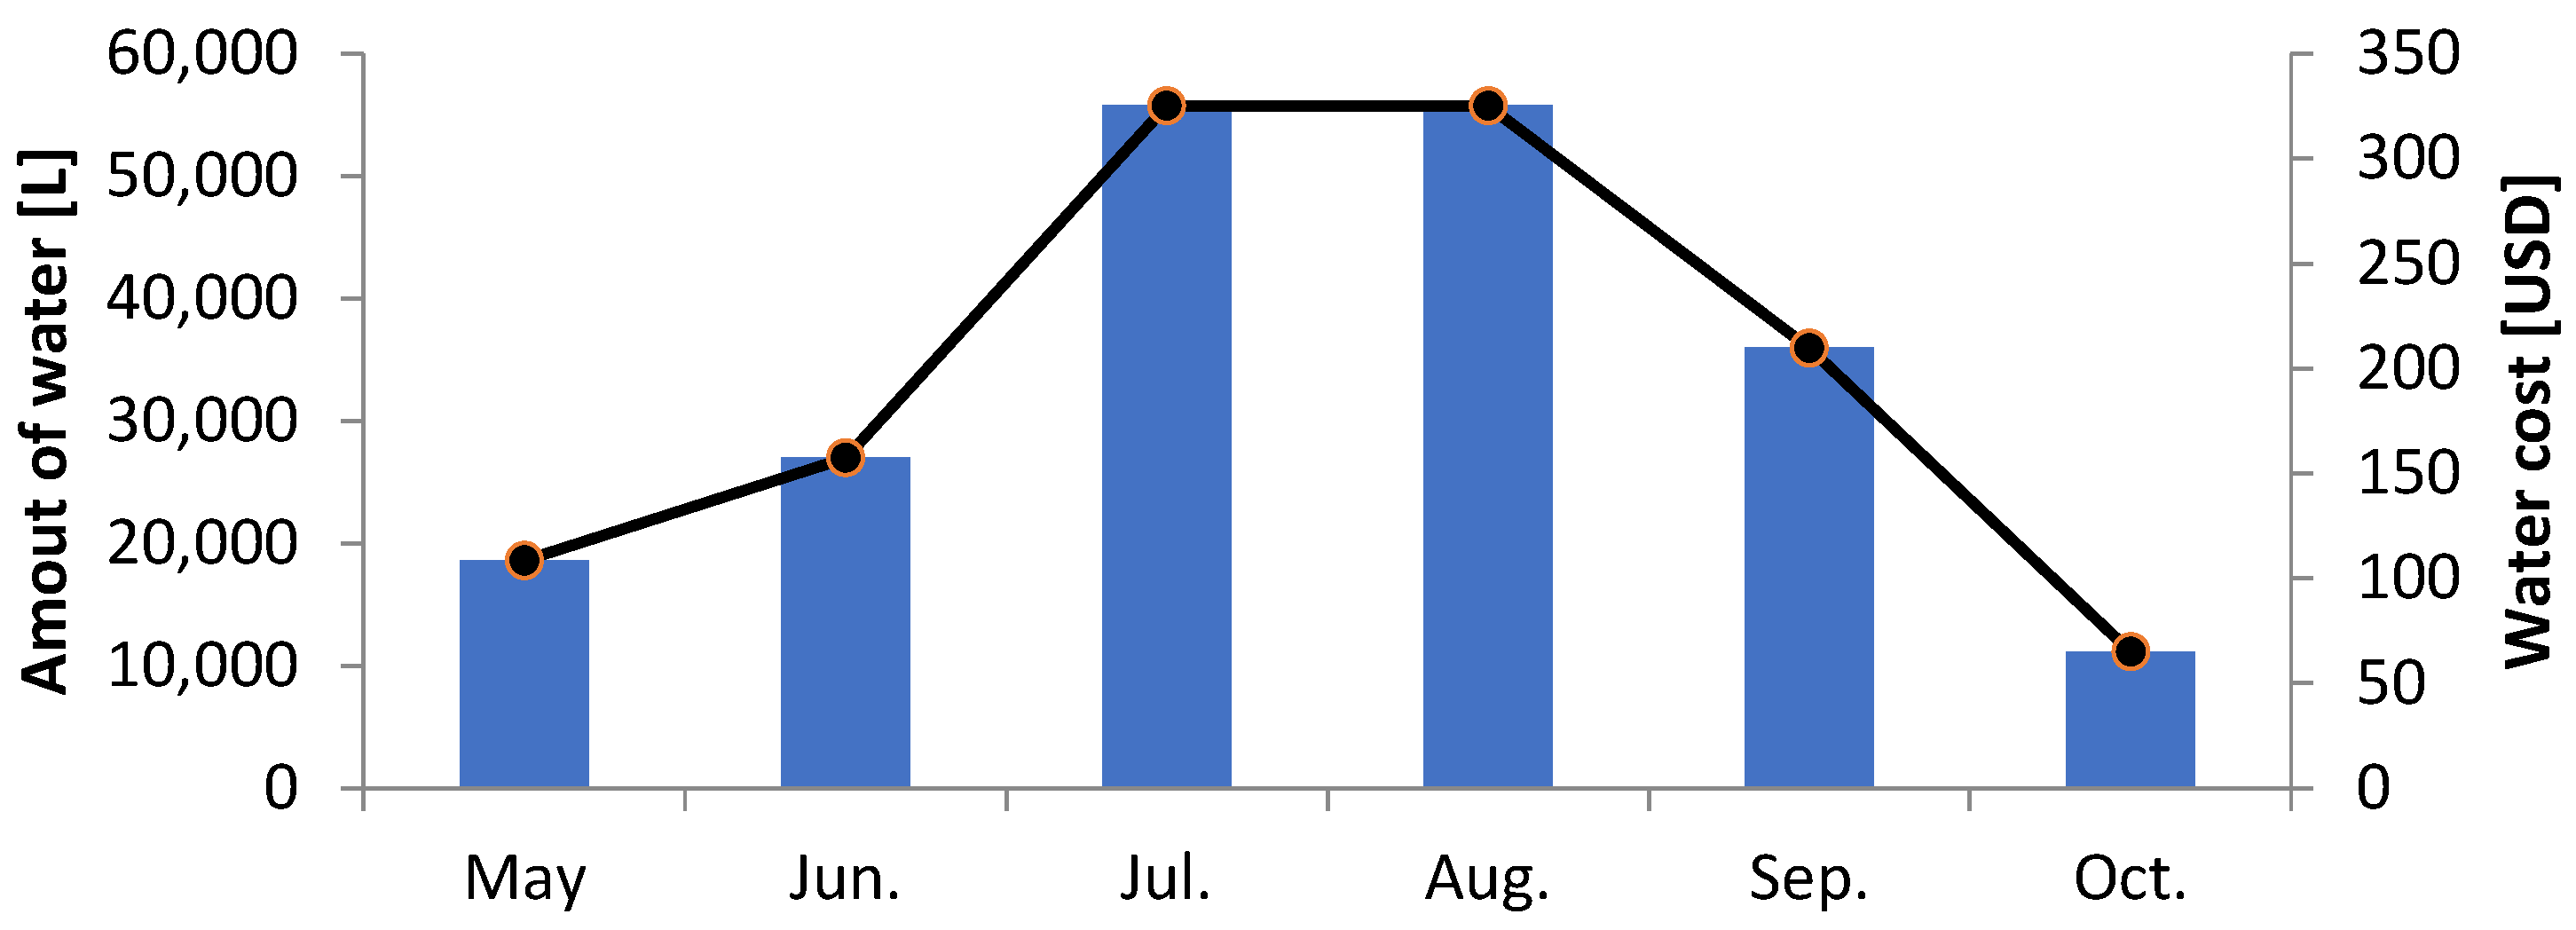
The farm cultivates water-demanding summer crops, including tomatoes, peppers, and cucumbers, on an area that is about 1000 m2 in size. Particularly during Northern Cyprus’s hottest summer months of July and August, when evapotranspiration is at its maximum, they need heavy and frequent irrigation. In this study, the amount of water and cost were obtained from the monthly bills issued by the local water supplier. Therefore, the monthly water requirements for the selected site were determined for May to October 2024, as shown in Figure 2. They are particularly important during these months because the family farm relies on water for irrigation. Figure 2 illustrates the gradual increase in irrigation level from May to a peak of over 57,000 L in July and August, after which it drops to roughly 12,000 L in October. The pattern correctly depicts the crop’s growth cycle and the climate season, with water requirement rising during the droughty summer months when the crop is fully developed. In addition to vegetable crops, there are also fruit trees such as grapevines and orange, lemon, and olive trees, which increase the need for water, especially when they are in fruit. These fruit trees and summer crops are grown to form a diverse farming system that requires proper water management. In an effort to increase productivity and decrease waste, the irrigation system utilized is probably a drip or hose system that offers spot watering. Additionally, a tiny chicken house is located on the farm, indicating a mixed-use, integrated farming operation. This offers benefits in dung for fertilizer and increases a sustainable approach through the inclusion of crop agriculture, fruit development, and chicken farming.

2.2. Dataset

2.2.1. Ground-Based Gauge Rainfall Data

The monthly measurement of rainfall data was collected from the Meteorological Department located in Lefkoşa, Northern Cyprus, from 1981 to 2023. The rain gauge was used to measure the rainfall at a height of 0.3 m above the ground level. The specifications of the rain gauge are listed in Table 2.

2.2.2. Satellite-Based Rainfall Data

In Northern Cyprus, the number of stations and data is limited. This is considered a major problem for working with the observed rainfall records. Thus, it is necessary to evaluate satellite precipitation products (SPPs) with local rain gauge data before utilizing these products as a source for understanding the rainfall distribution in Northern Cyprus. SPPs are based on data derived from various sensors and satellites [70,71,72]. They can also include other data sources, such as ground radar, gauge networks, or forecasts from models or reanalysis [64,65,66]. Therefore, nine SPPs were selected for this study’s evaluation of their accuracy in comparison to ground-based gauge rainfall data because of their high spatial resolution, coverage domain, and availability periods, as shown in Table 3.
It should be noted that the study used 43 years (1981–2023) of monthly rainfall measurements from the Meteorological Department of Lefkoşa, North Cyprus, as a reference dataset. The accuracy and reliability of satellite-based sources were evaluated by comparing measured data with these databases to determine the most reliable and representative satellite source. The selected satellite dataset was then used to estimate the potential of the rainwater harvesting system and ensure water availability.
Various statistical metrics, including Mean Absolute Error (MAE), Root Mean Squared Error (RMSE), and Coefficient of Determination (R2), are used to evaluate the performance of these datasets.
R 2 = 1 i = 1 n a a , i a p , i 2 i = 1 n a p , i a a , a v e 2
R M S E = 1 n i = 1 n a a , i a p , i 2
M A E = 1 n i = 1 n a a , i a p , i
where   n is the number of data, a p , i is the predicted value, a a , i is the actual value, a a ,   a v e is the average actual value, and i is the number of input variables.

2.2.3. Solar Radiation Dataset

Designing solar energy systems in a place lacking measuring data is challenging. Additionally, Northern Cyprus has an insufficient number of stations for measuring the data. Moreover, according to the literature [73,74,75], NASA, the leader in space technology, offers satellite and model-based products through its network of satellite systems, which are needed to investigate climate dynamics, improve energy efficiency, and meet agricultural needs. The POWER (Prediction of Worldwide Energy Resources) Project of the NASA Earth Science Research Program may have enabled this. This global grid provides solar and meteorological data from 1981 onwards and covers regions lacking surface weather observations with a geographical resolution of 0.5° × 0.5° [73,74,75]. Several studies have utilized the NASA database to assess the potential for solar energy in various locations [76,77,78]. Furthermore, previous studies [79,80,81] concluded that there is a strong correlation between the NASA database and observed data (global solar irradiation). Bhatia also argued that by disregarding the impact of cloud absorption, solar radiation can be presumed to be constant across wide regions [82]. Therefore, the NASA POWER dataset was used to gather monthly solar irradiation for the selected location for the period 1982–2022.

2.3. System Design

2.3.1. Shading Distance Calculations

The PV arrays’ output can be decreased by shading. PV arrays should be positioned in an area that lacks shade for that purpose. Nonetheless, grid-connected systems are typically found in cities, and the modules are typically mounted on roofs, where some shade is occasionally unavoidable. To position as many panels as possible in a specific area and to optimize the solar installation’s performance. Orientation and row spacing, often known as shading distance, are two primary elements that are frequently taken into account.
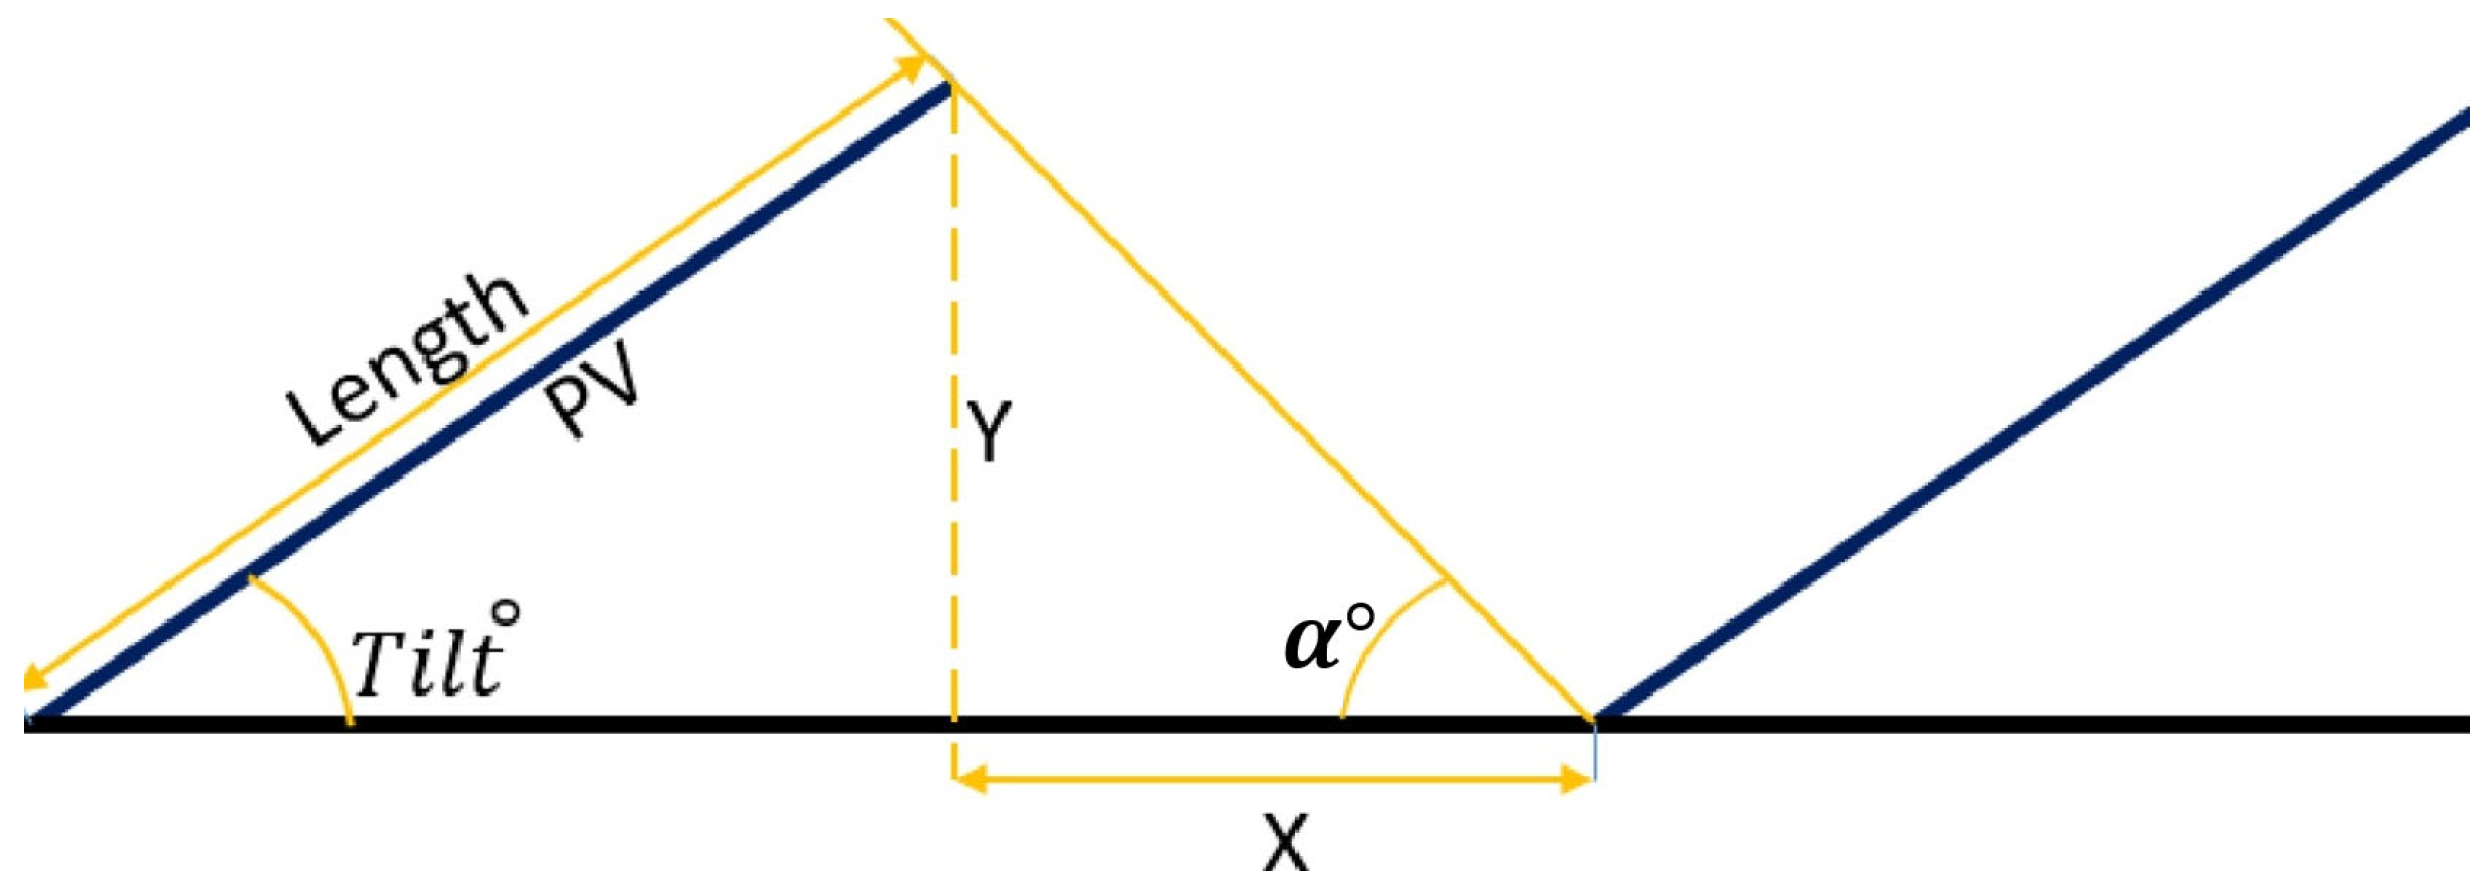
To compute the shading distance, as shown in Figure 3, Equation (4) is used [83,84].
X = Y c o s γ t a n α
α = a r c s i n s i n δ · s i n ϕ + c o s δ · c o s ϕ · c o s ω
δ = 23.44 ° · s i n 360 365 · n + 10
ω = 15 12 L A T
L A T = s t a n d a r d   t i m   c l o c k   t i m e ± 4 s t a n d a r d   t i m e   l o n g i t u d e l o n g i t u d e   o f   l o c a t i o n + E O T
E O T = 229.18 0.000075 + 0.001868 · c o s 360 · n 1 365 0.032077 · s i n 360 · n 1 365 0.014615 · c o s 2 360 · n 1 365 0.04089 · s i n 2 360 · n 1 365
where X is the shading distance [m], Y is the tilted PV panel height [m], γ is the azimuth angle [ ° ],   α is the solar altitude at cerain solar time [ ° ],   δ is the solar declintion, ϕ is the latitude of the location, ω is the solar hour angle, and n is the day of the year.
It should be noted that the first correction for L A T applies to the eastern hemisphere with a negative sign, while the western hemisphere applies to the positive sign.
Considering that Jinko Solar’s mono-Si JKM360M-66H module, with dimensions of 1841 × 1002 × 30 mm, an efficiency of 19.52%, and capacity of 360 W, is an efficient PV module that is currently on the market, it was chosen for the proposed system. The specifications of the selected module are listed in Table 4.
Using Equations (2)–(6), the mean solar altitude at the selected locations was found to be 47.16° at solar noon. The values of shading distance with various tilt angles are listed in Table 5.

2.3.2. Description of System

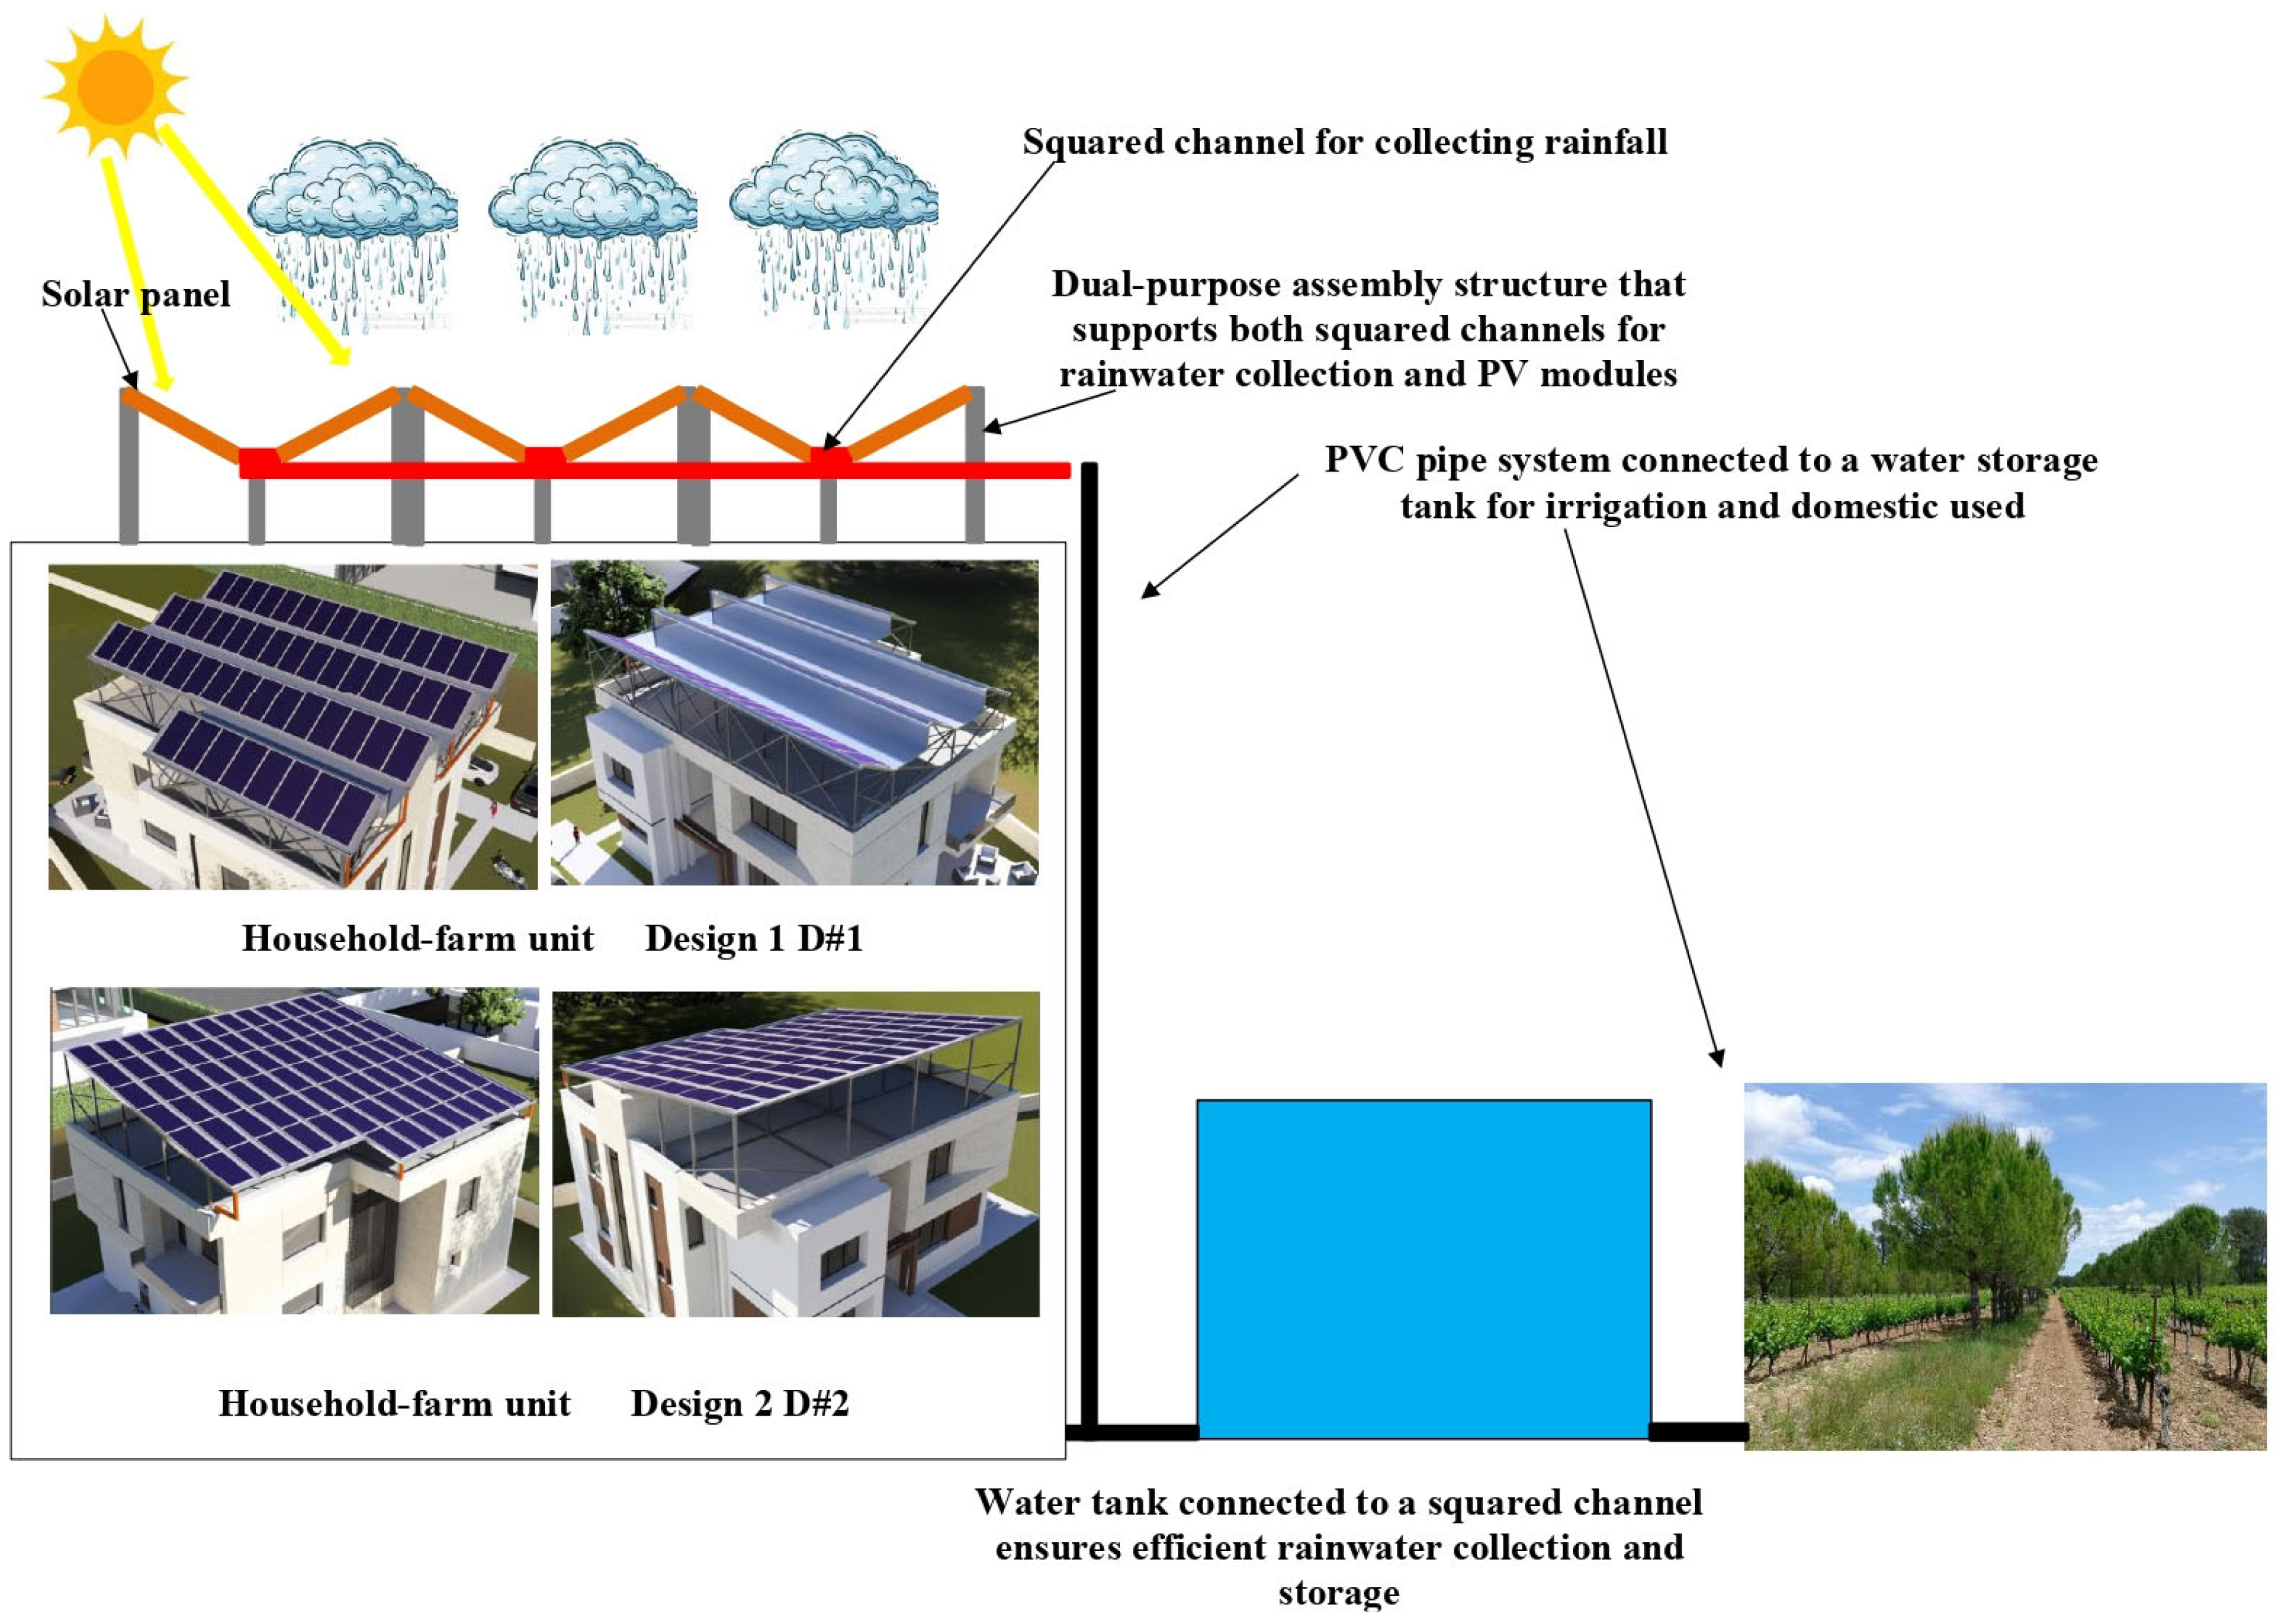
Figure 4 displays a clever dual-use system that combines solar energy generation and rainwater collection on the rooftop of a residential building. In design D#1, the panels are mounted on an elevated platform and organized in rows with a slope. In order to get the most solar energy during the day, this arrangement is oriented to face the sun. To increase the overall effectiveness of the system, spaces are also provided between the rows so that the adjacent panels cannot shadow them. As an alternative, the second configuration (D#2) has a design in which the panels create a continuous layer without any interstices, bringing the entire roof surface to a slightly sloping condition. Theoretically, this method can accommodate more panels and produce more energy overall, but it may lead to less-than-ideal tilt angles, which could lower each panel’s performance in comparison to a tilted array.
Utilizing photovoltaic (PV) panels to generate electricity in conjunction with a rainwater collection system effectively utilizes renewable resources. With reduced energy use and the ability to collect water for irrigation, this technology will contribute to thermal gain, enhance indoor comfort, and promote sustainability. Solar panels are mounted on the rooftop of a residential building to gather sunlight and generate electricity. The system is grid-connected, meaning that the solar-generated electricity is directly used by the household and irrigation equipment, and excess energy is routed back into the public electrical grid. When solar power is not enough, electricity is drawn from the grid. This approach eliminates the requirement for on-site electrical energy accumulation and simplifies the system architecture. In addition to generating power, the panels serve as a roof covering, providing shade and reducing heat gain in the summer to improve the indoor environment. The structure of the system distributes rainwater flowing on the solar panels into particular channels for collection.
As shown in Figure 4, the rainwater collected in square channels at the base of the PV modules emerges from the solar panels. These channels are designed to efficiently gather and channel water so that it flows toward a central outlet without overflowing. The channels help reduce water waste by channeling all collected rainwater into a connected piping system. Moreover, a dual-purpose assembly framework supports both PV modules and rainfall collection channels. In order to promote effective water movement, the height of this assembly structure changes by 5 cm, providing a slight slope that focuses water flow on a single spot. This smooth incline minimizes water stagnation and increases collection efficiency by concentrating water from all the channels into one single pipe.
Rainwater collected is transferred via a series of PVC pipes to the storage tank of the system. This water storage tank ensures the efficient and secure storage of the collected rainwater for future use. In regions where water availability varies, this storage device becomes essential for water conservation initiatives, helping to reduce dependency on outside water sources. Besides, rainwater can be utilized to irrigate gardens, plants, and crops through the use of PVC pipes that connect the storage tank to an irrigation system. By using less potable water for irrigation, this method promotes sustainable water management, particularly in areas with limited water resources.
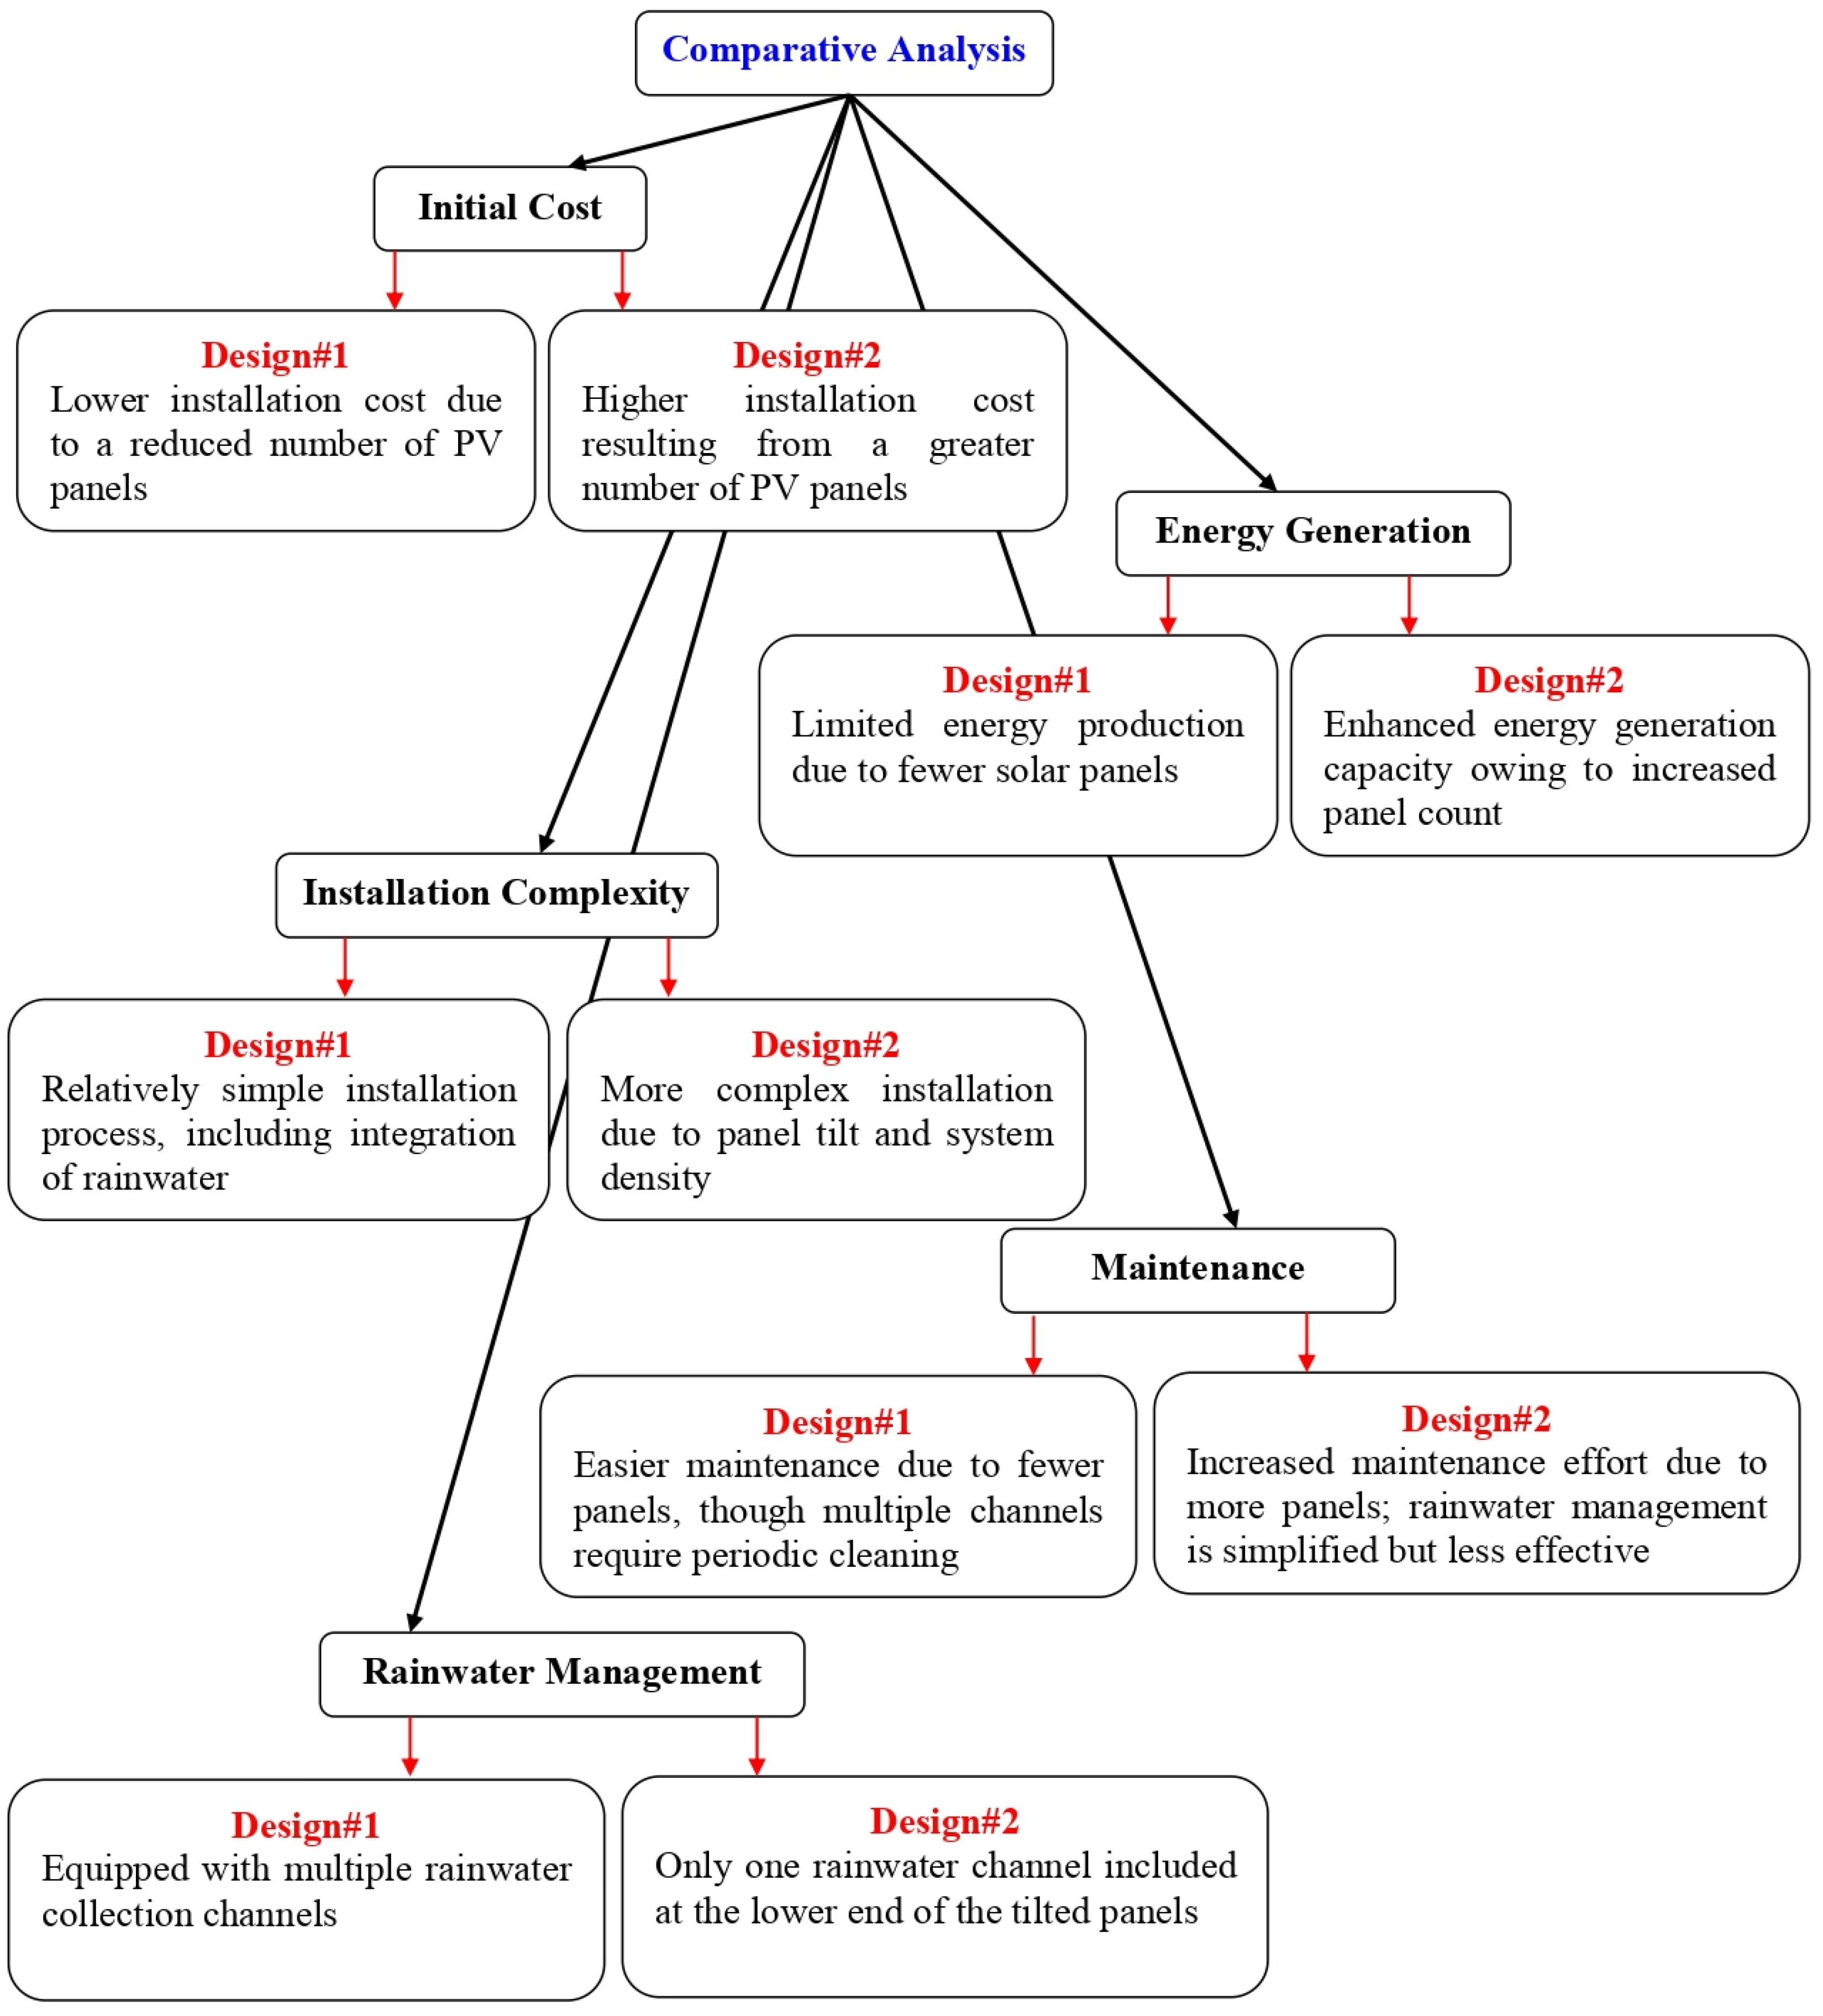
This integrated system provides numerous benefits to residential buildings. Solar panels reduce electricity use, while the rainwater collection system ensures a consistent supply of water for irrigation needs. The system uses less water, reduces heat gain, and produces renewable energy simultaneously, thus providing an attractive option for both urban and rural settings. Figure 5 shows the advantages and disadvantages of both designs (D#1 and D#2).

2.4. Analyzing the Distribution of Rainfall

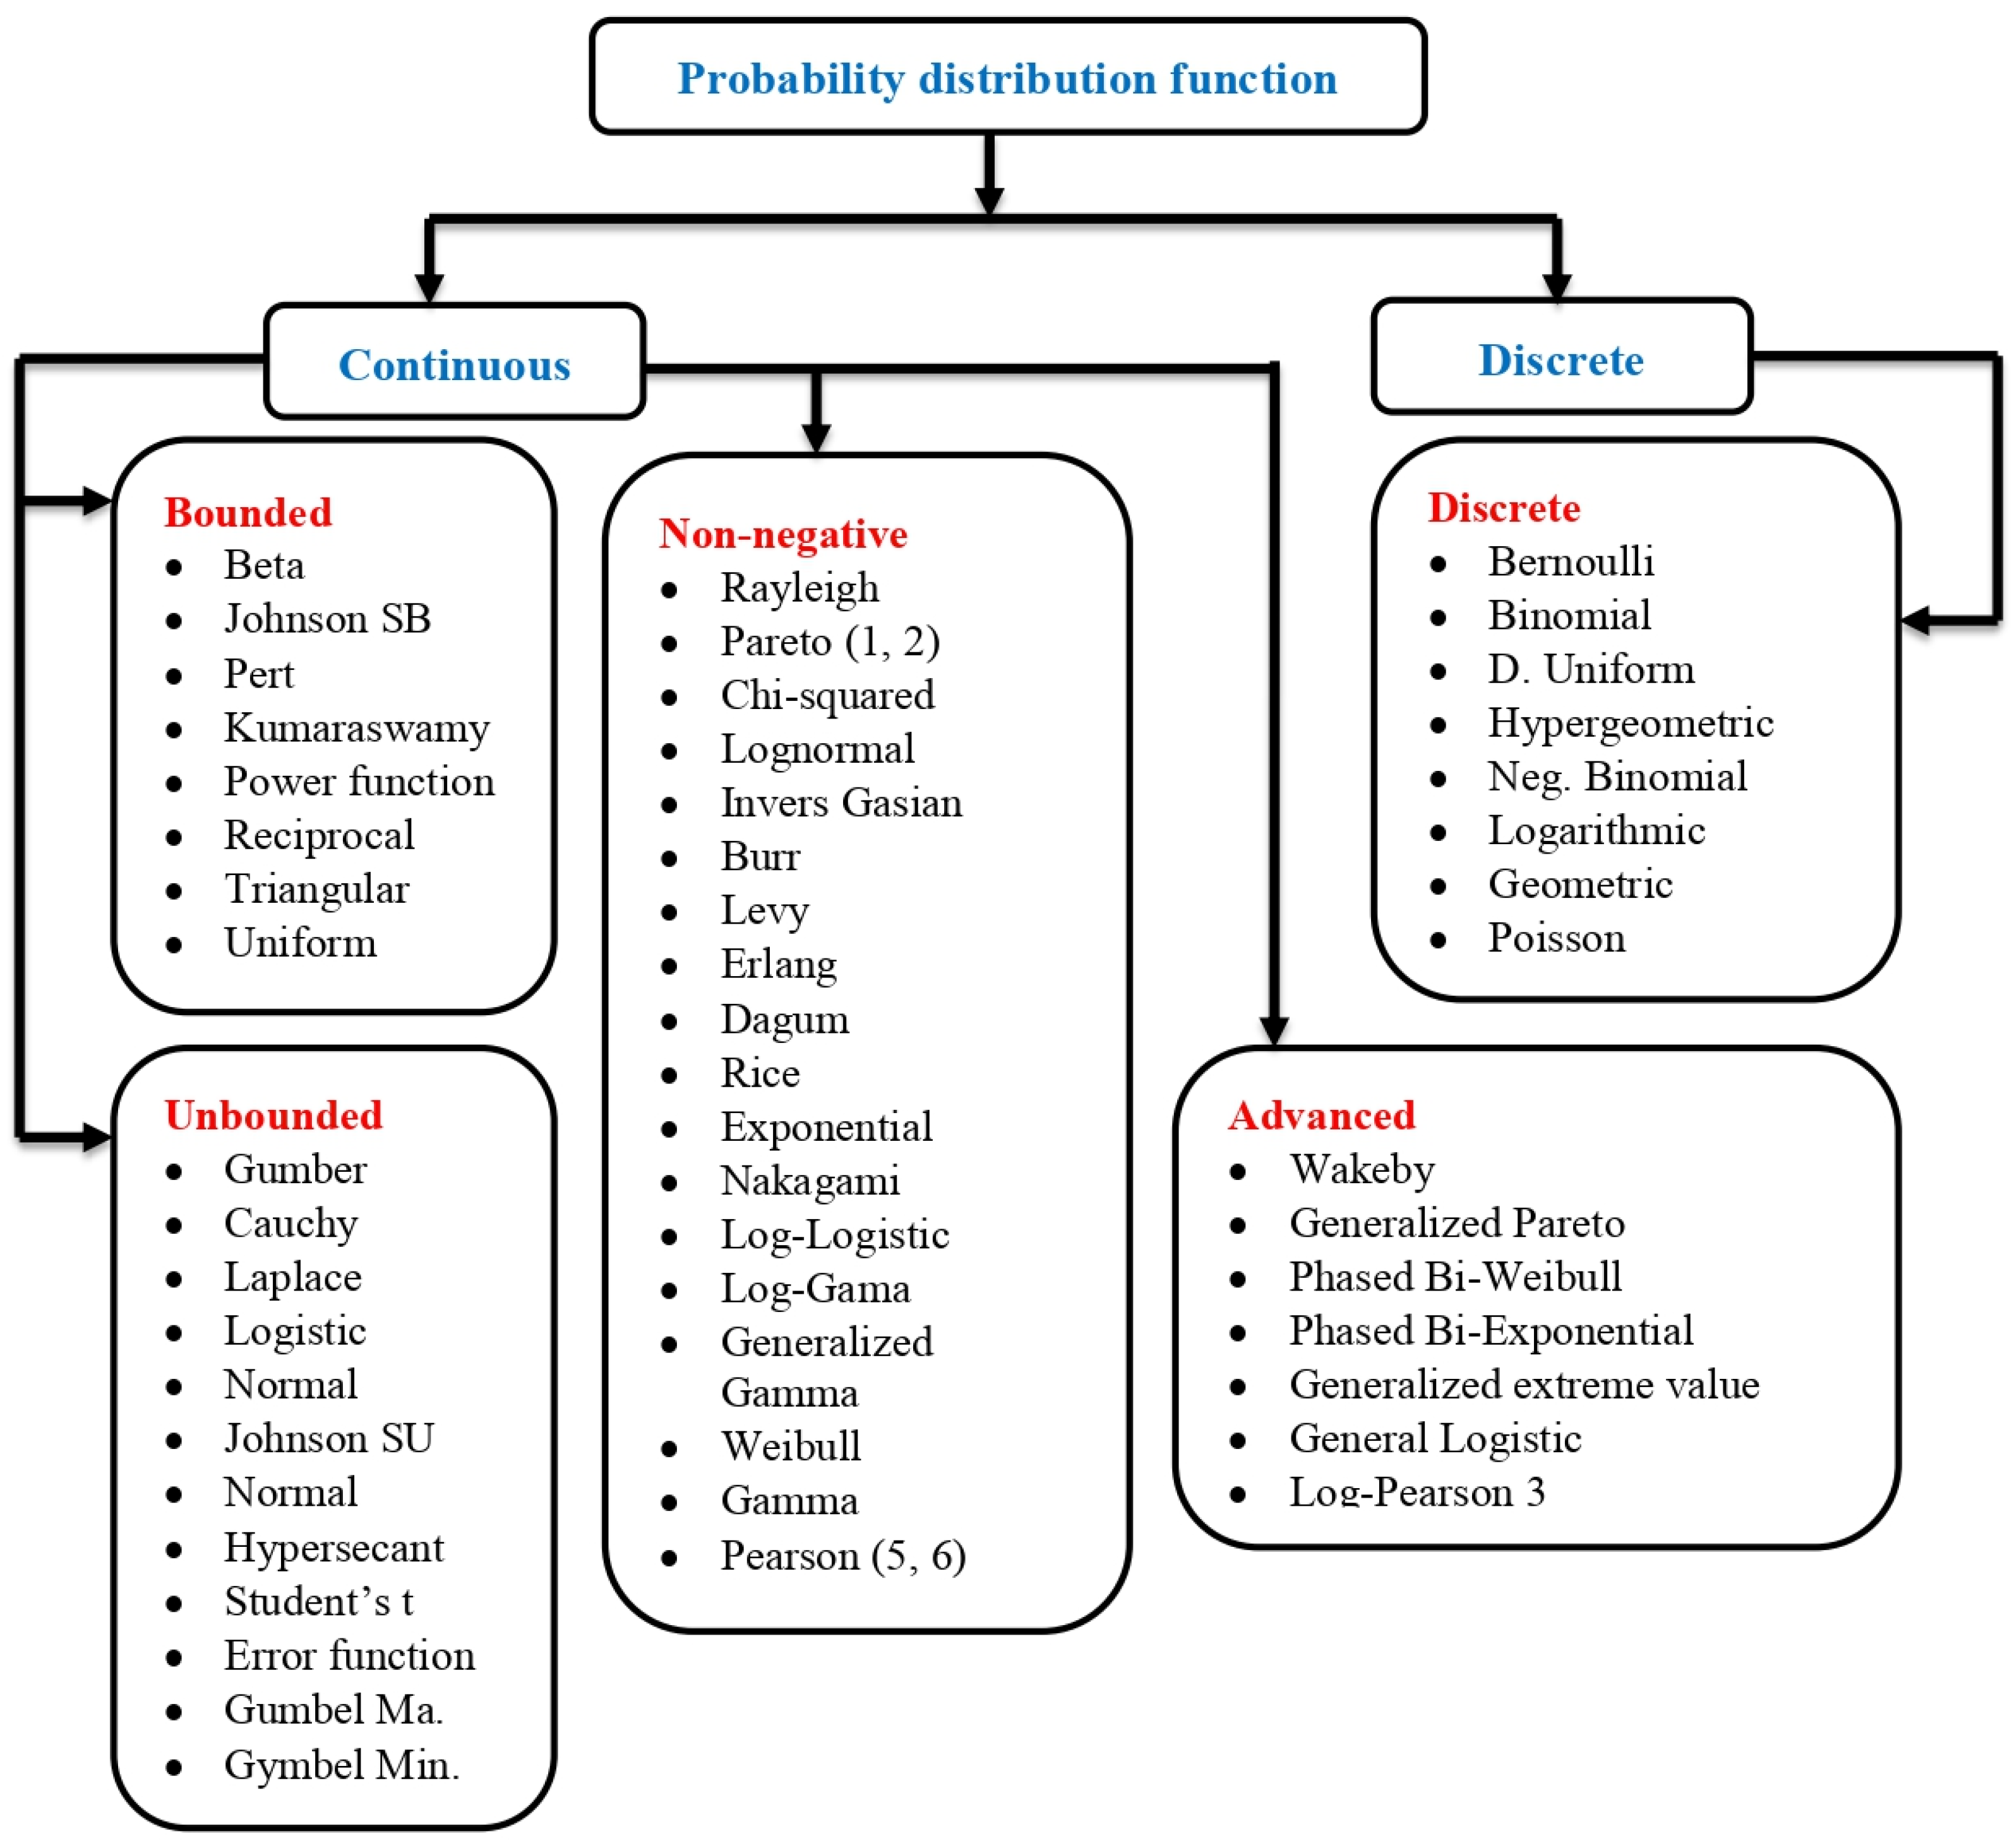
Accurate modeling and evaluation of the empirical rainfall distributions are crucial initial steps toward obtaining extensive knowledge of rainfall patterns and distribution. For this purpose, probability distribution functions (PDFs) can be used and applied to study the distribution of rainfall at different locations around the globe [85,86]. PDFs can be classified as either discrete or continuous distributions, contingent upon whether they define probabilities associated with discrete variables or continuous variables [87]. In addition, continuous distribution functions consist of four classifications: bounded, unbounded, non-negative, and advanced [87]. Numerous scientific studies have been conducted worldwide on the selection of probability distributions in rainfall frequency analyses [88,89,90,91,92,93,94,95,96,97,98,99,100,101,102,103,104,105,106,107,108,109,110,111,112,113,114,115,116,117,118]. For instance, Parchure and Gedam [85] determined the best-fit probability distribution for extreme storms using two-parameter and three-parameter distribution functions. The results indicated that a three-parameter generalized extreme value was considered the best distribution function for studying the extreme storm series in the Mumbai region, India. Yuan et al. [111] utilized the Expanded Automated Meteorological Data Acquisition System (EA) weather data of 20 years (1981–2000) to analyze the annual maximum hourly rainfall characteristics for 15 locations in Japan. The results showed that the Log-Pearson type 3 distribution provided the best fit to the actual data for most locations in Japan. Kassem and Gökçekuş [116] utilized four distribution functions to analyze the characteristics of rainfall in the Beirut region, Lebanon, using daily rainfall of 25 years (1991–2015). The results showed that Gumbel maximum and logistic distributions were able to provide the best fit to the actual data for the selected region.
Based on the above, in the current analysis, in order to determine the optimum statistical distribution, which best describes the characteristics of rainfall of the studied site, a comprehensive range of probability distribution functions, including 65 models covering all continuous types and discrete types of PDFs outlined in the flow diagram of Figure 6, are evaluated.
In this study, the Kolmogorov–Smirnov (K–S), Anderson–Darling (A–D), and chi-squared (C–s) tests are employed for evaluating the performance of the selected distributions. The mathematical expressions for these tests are provided below.
Kolmogorov–Smirnov (K–S)
D = max 1 i n F x i i 1 n ,   i n F x i
F n x = 1 n × N u m b e r   o f   o b s e r v a t i o n x
Anderson–Darling (A–D)
A 2 = n 1 n i = 1 n 2 i 1 × l n F X x i + l n 1 F X x n i + 1
where F X x i is the cumulative distribution function of the proposed distribution at x i , for i = 1, 2, …, n.
Chi-squared (C-s)
X 2 = i = 1 k O i E i 2 E i
E i = F x 2 F x 1
where   O i is the observed frequency for bin i, F is the cumulative distribution function of the probability distribution being tested, and x 1 , x 2 are the limits for bin i.
Furthermore, one of the simplest and most effective methods for choosing the best-fit model is to employ a graphical test. The P-P and Q-Q plots of the observed and estimated values are displayed in this study.

2.5. Assessment of Rainwater Harvesting Potential

The potential volume of rainwater ( P V R ) available for harvesting is calculated using Equation (15) [119].
P V R = R × A P V   + A c h e n n e l × C 1000
A P V   = N u m b e r   o f   m o d u l e × A r a a   o f   o n e   m o d u l e
A c h e n n e l = W i d t h   o f   t h e   s q u a r e d   c h a n n e l × H e i g h t   o f   t h e   c h a n n e l × L e n g t h   o f   t h e   c h a n n e l
where R is the amount of rainfall, A is the rooftop area, and C is the runoff coefficient.   C   is considered to be 0.85, since the PV panels are well-designed to optimize runoff.
Moreover, the potential volume of harvested rainfall is then divided by the yearly domestic demand using the following formula to determine the potential saving percentage (PSP), as given below [119].
P S P = P V R t o t a l   a n n u a l   w a t e r   u s e d  

2.6. Economic Model

The performance of renewable power plants can be estimated using a variety of simulation tools, such as the RETScreen simulation tool. Natural Resources Canada developed the RETScreen, which is a widely used tool for evaluating the feasibility of different renewable energy systems [120]. Assessing the risk, expenses, economic feasibility, emissions reduction, energy production, and savings of various renewable energy options constitutes the goal. For a specific region, the RETScreen retrieves meteorological data from long-term monthly average meteorological data in the National Aeronautics and Space Administration (NASA) database [121]. It is an effective and rapid method to evaluate the renewable energy system’s energy efficiency and environmental impact reduction. Therefore, this study utilizes RETScreen software to evaluate the technical, financial, and environmental aspects of the proposed systems. Financial analysis and evaluation are essential to provide investors, policymakers, and the government with a precise understanding of the feasibility of grid-connected solar projects. In order to assess the profitability of the proposed PV power plant and the returns on investment, this study employed a variety of important economic metrics, including net present value (NPV), levelized cost of energy (LCOE), simple payback (SP), equity payback (EP), annual life cycle savings (ALCS), annual greenhouse gas emissions (A-GHG), the cost of reducing GHG emissions (GHG-E-RC), and benefit–cost ratio (BCR). The mathematical expressions of the capacity factor (CF) and important economic metrics are given below.
C F = P o u t P × 8760
N P V = n = 0 N C n 1 + r n
L C O E = s u m   o f   c o s t s   o v e r   t h e   l i f e t i m e   o f   e l e c t r i c i t y   g e n e r a t e d
S P = C I G C e n e r + C c a p a + C R E + C G H G C o & M + C f u e l
E P = n = 0 N C n
A L C S = N P V 1 r 1 1 1 + r N
B C = N P V + 1 f d C 1 f d C
A G H G = B a s e   c a s e   G H G   e m i s s i o n   f a c t o r P r o p o s e d     c a s e   G H G   e m i s s i o n   f a c t o r ×   E n d   u s e   e n e r g y   d e l i v e r e d    
G H G E R C = A L C S G H G
where P o u t is energy generated per year,   P is installed capacity, N is the project life in years, C n is the after-tax cash flow in year n, and r is the discount rate. C is the total initial cost of the project, f d is the debt ratio, B is the total benefit of the project, I G is the incentives and grants, and C e n e r is the annual energy savings or income. C c a p a is the annual capacity savings or income, C R E is the annual renewable energy (RE) production credit income, C G H G is the GHG reduction income, and C o & M is the yearly operation and maintenance costs incurred by the clean energy project. C f u e l is the annual cost of fuel, which is zero for renewable projects, and G H G is the annual GHG emission reduction.
Moreover, Table 6 summarizes the economic parameters that were used in the RETscreen financial study. Table 6 also displays the cost of the developed system. It should be mentioned that the system’s financial and economic parameters are based on current market data and are in line with the cost prices found in the literature.

3. Results and Discussion

3.1. Comparison of Nine Satellite Rainfall Products

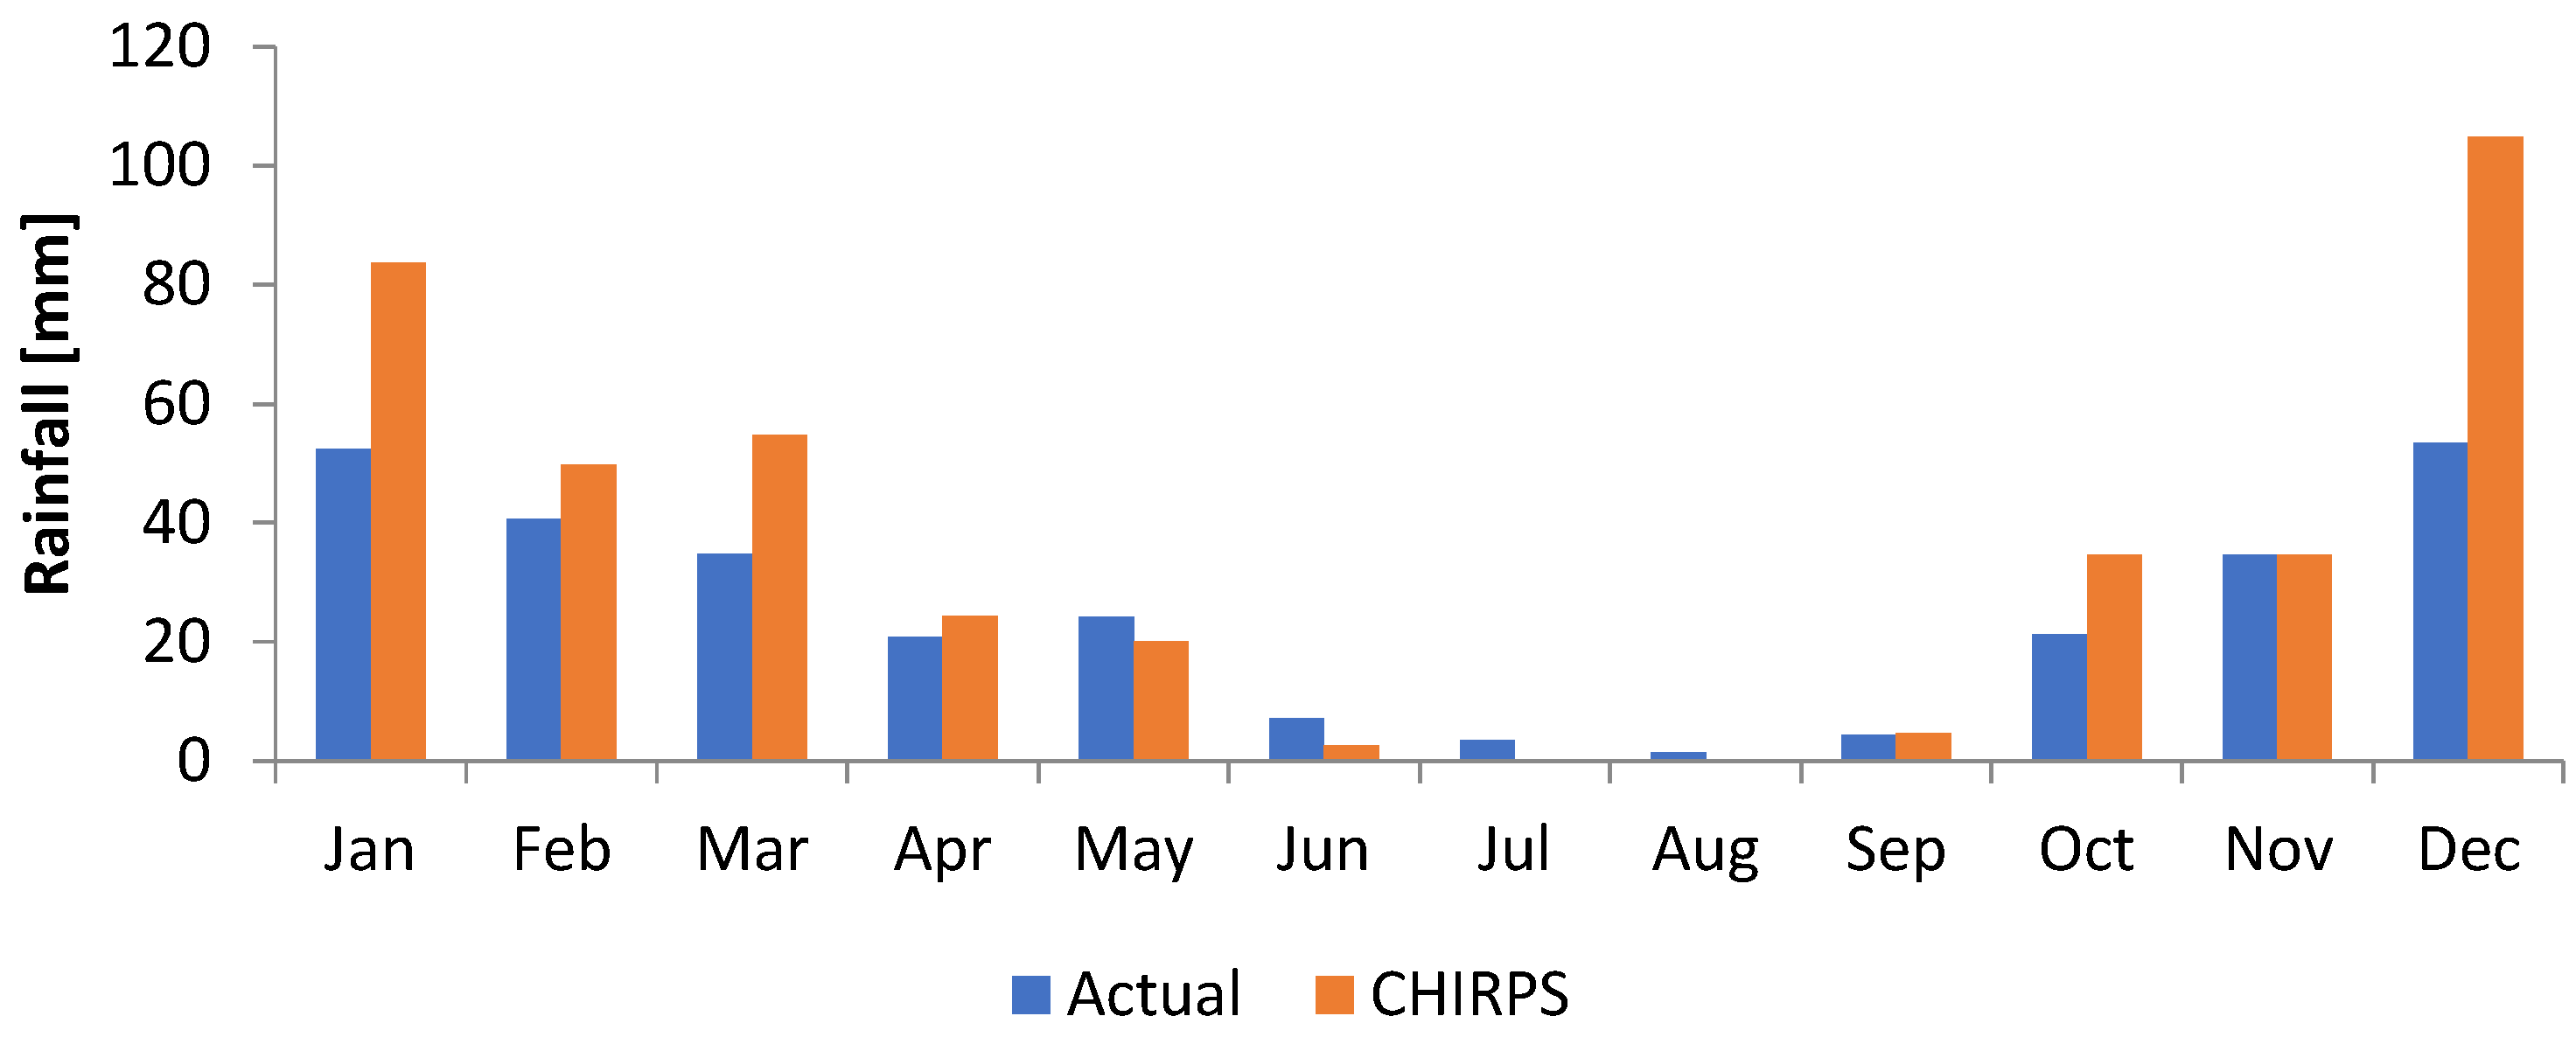
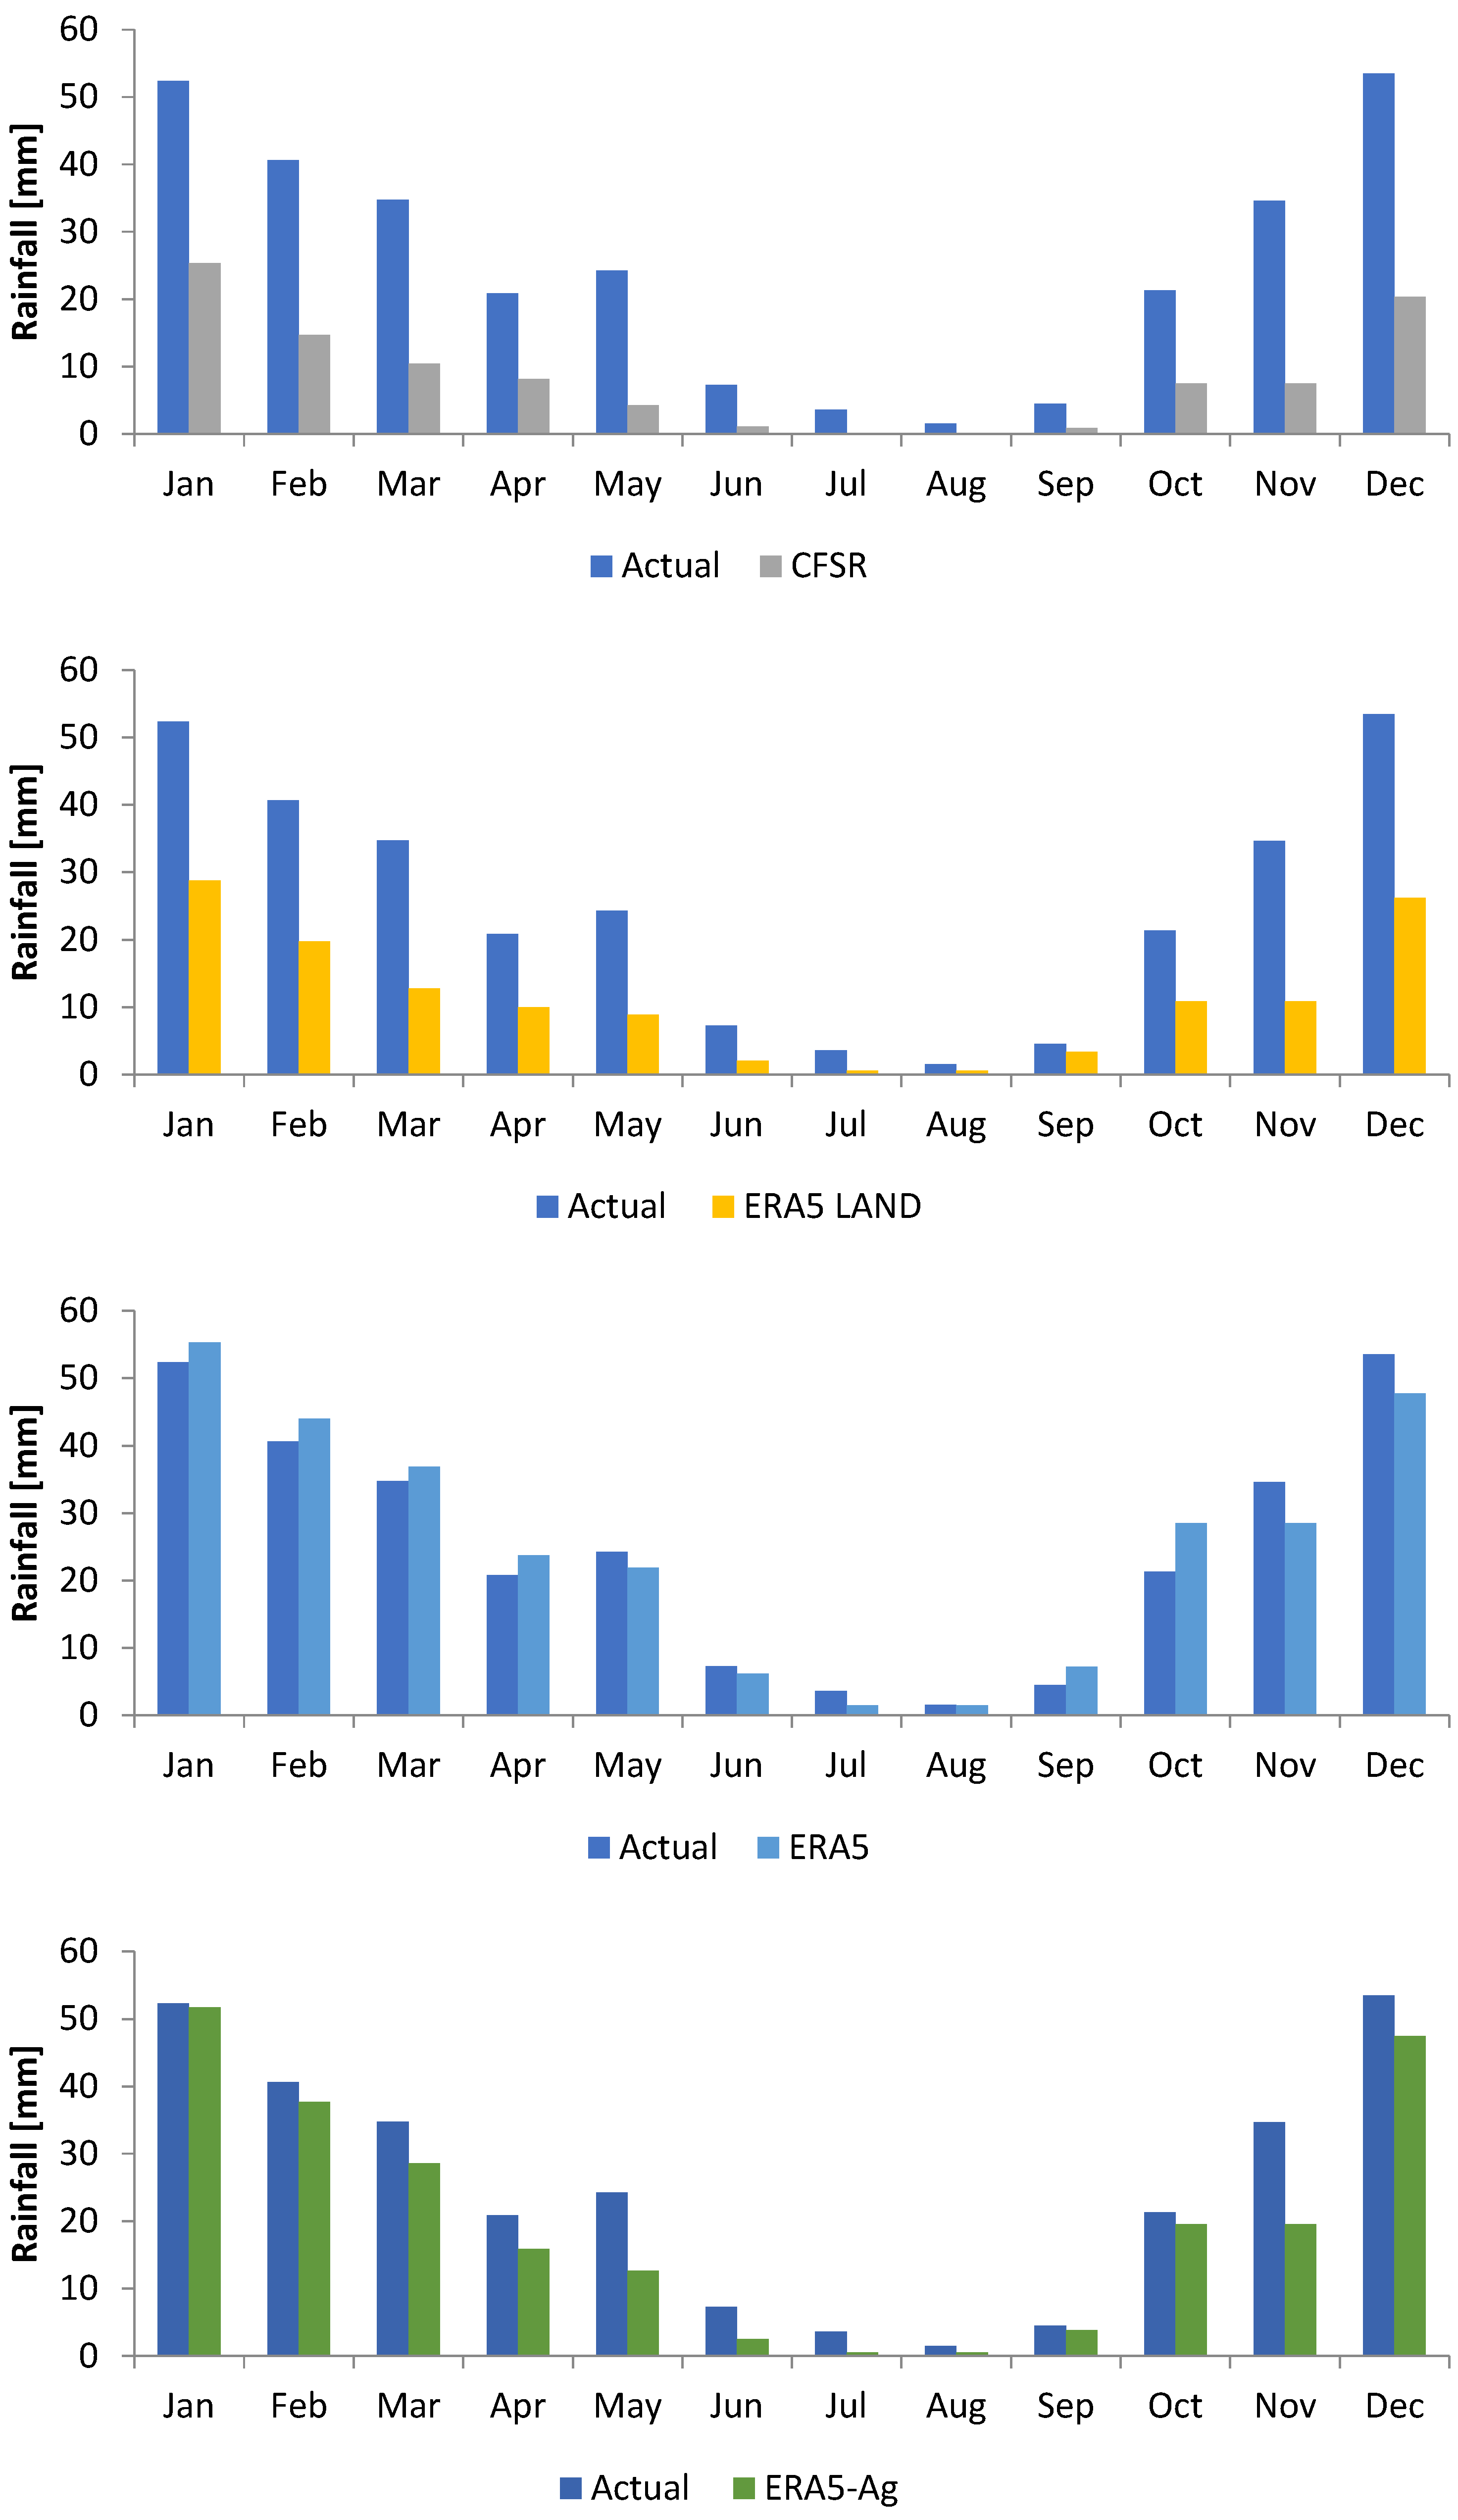
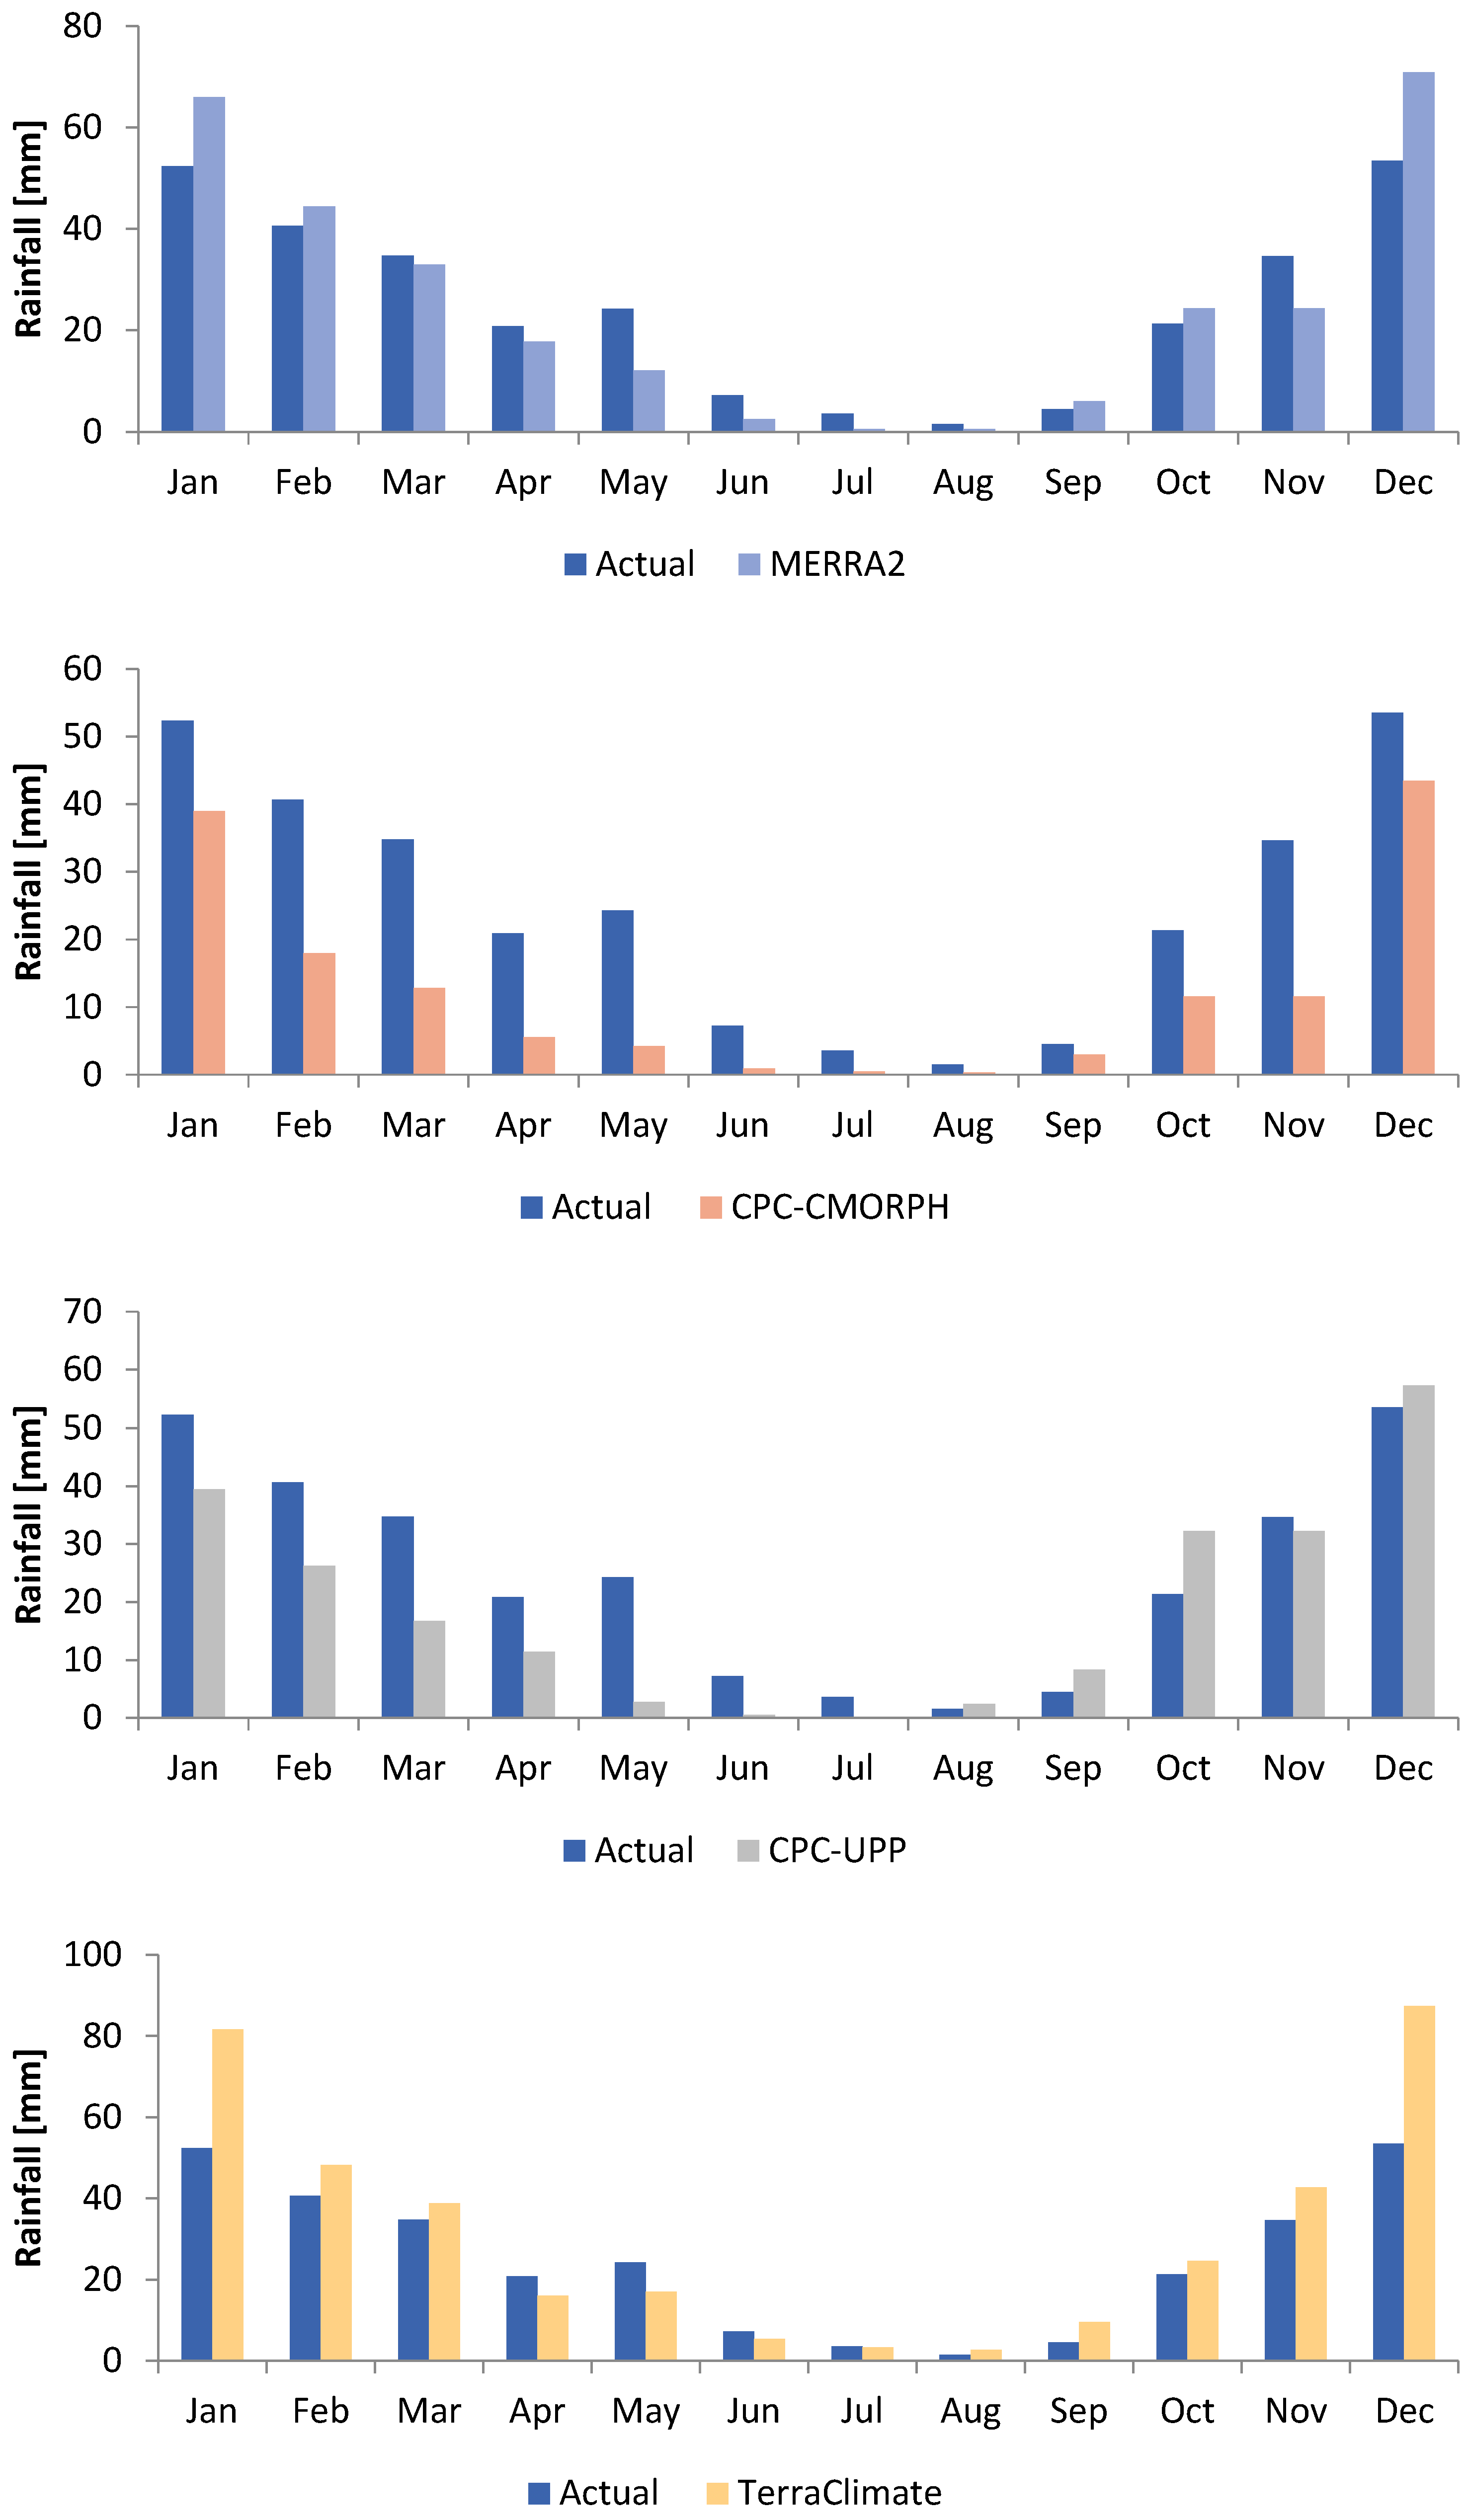
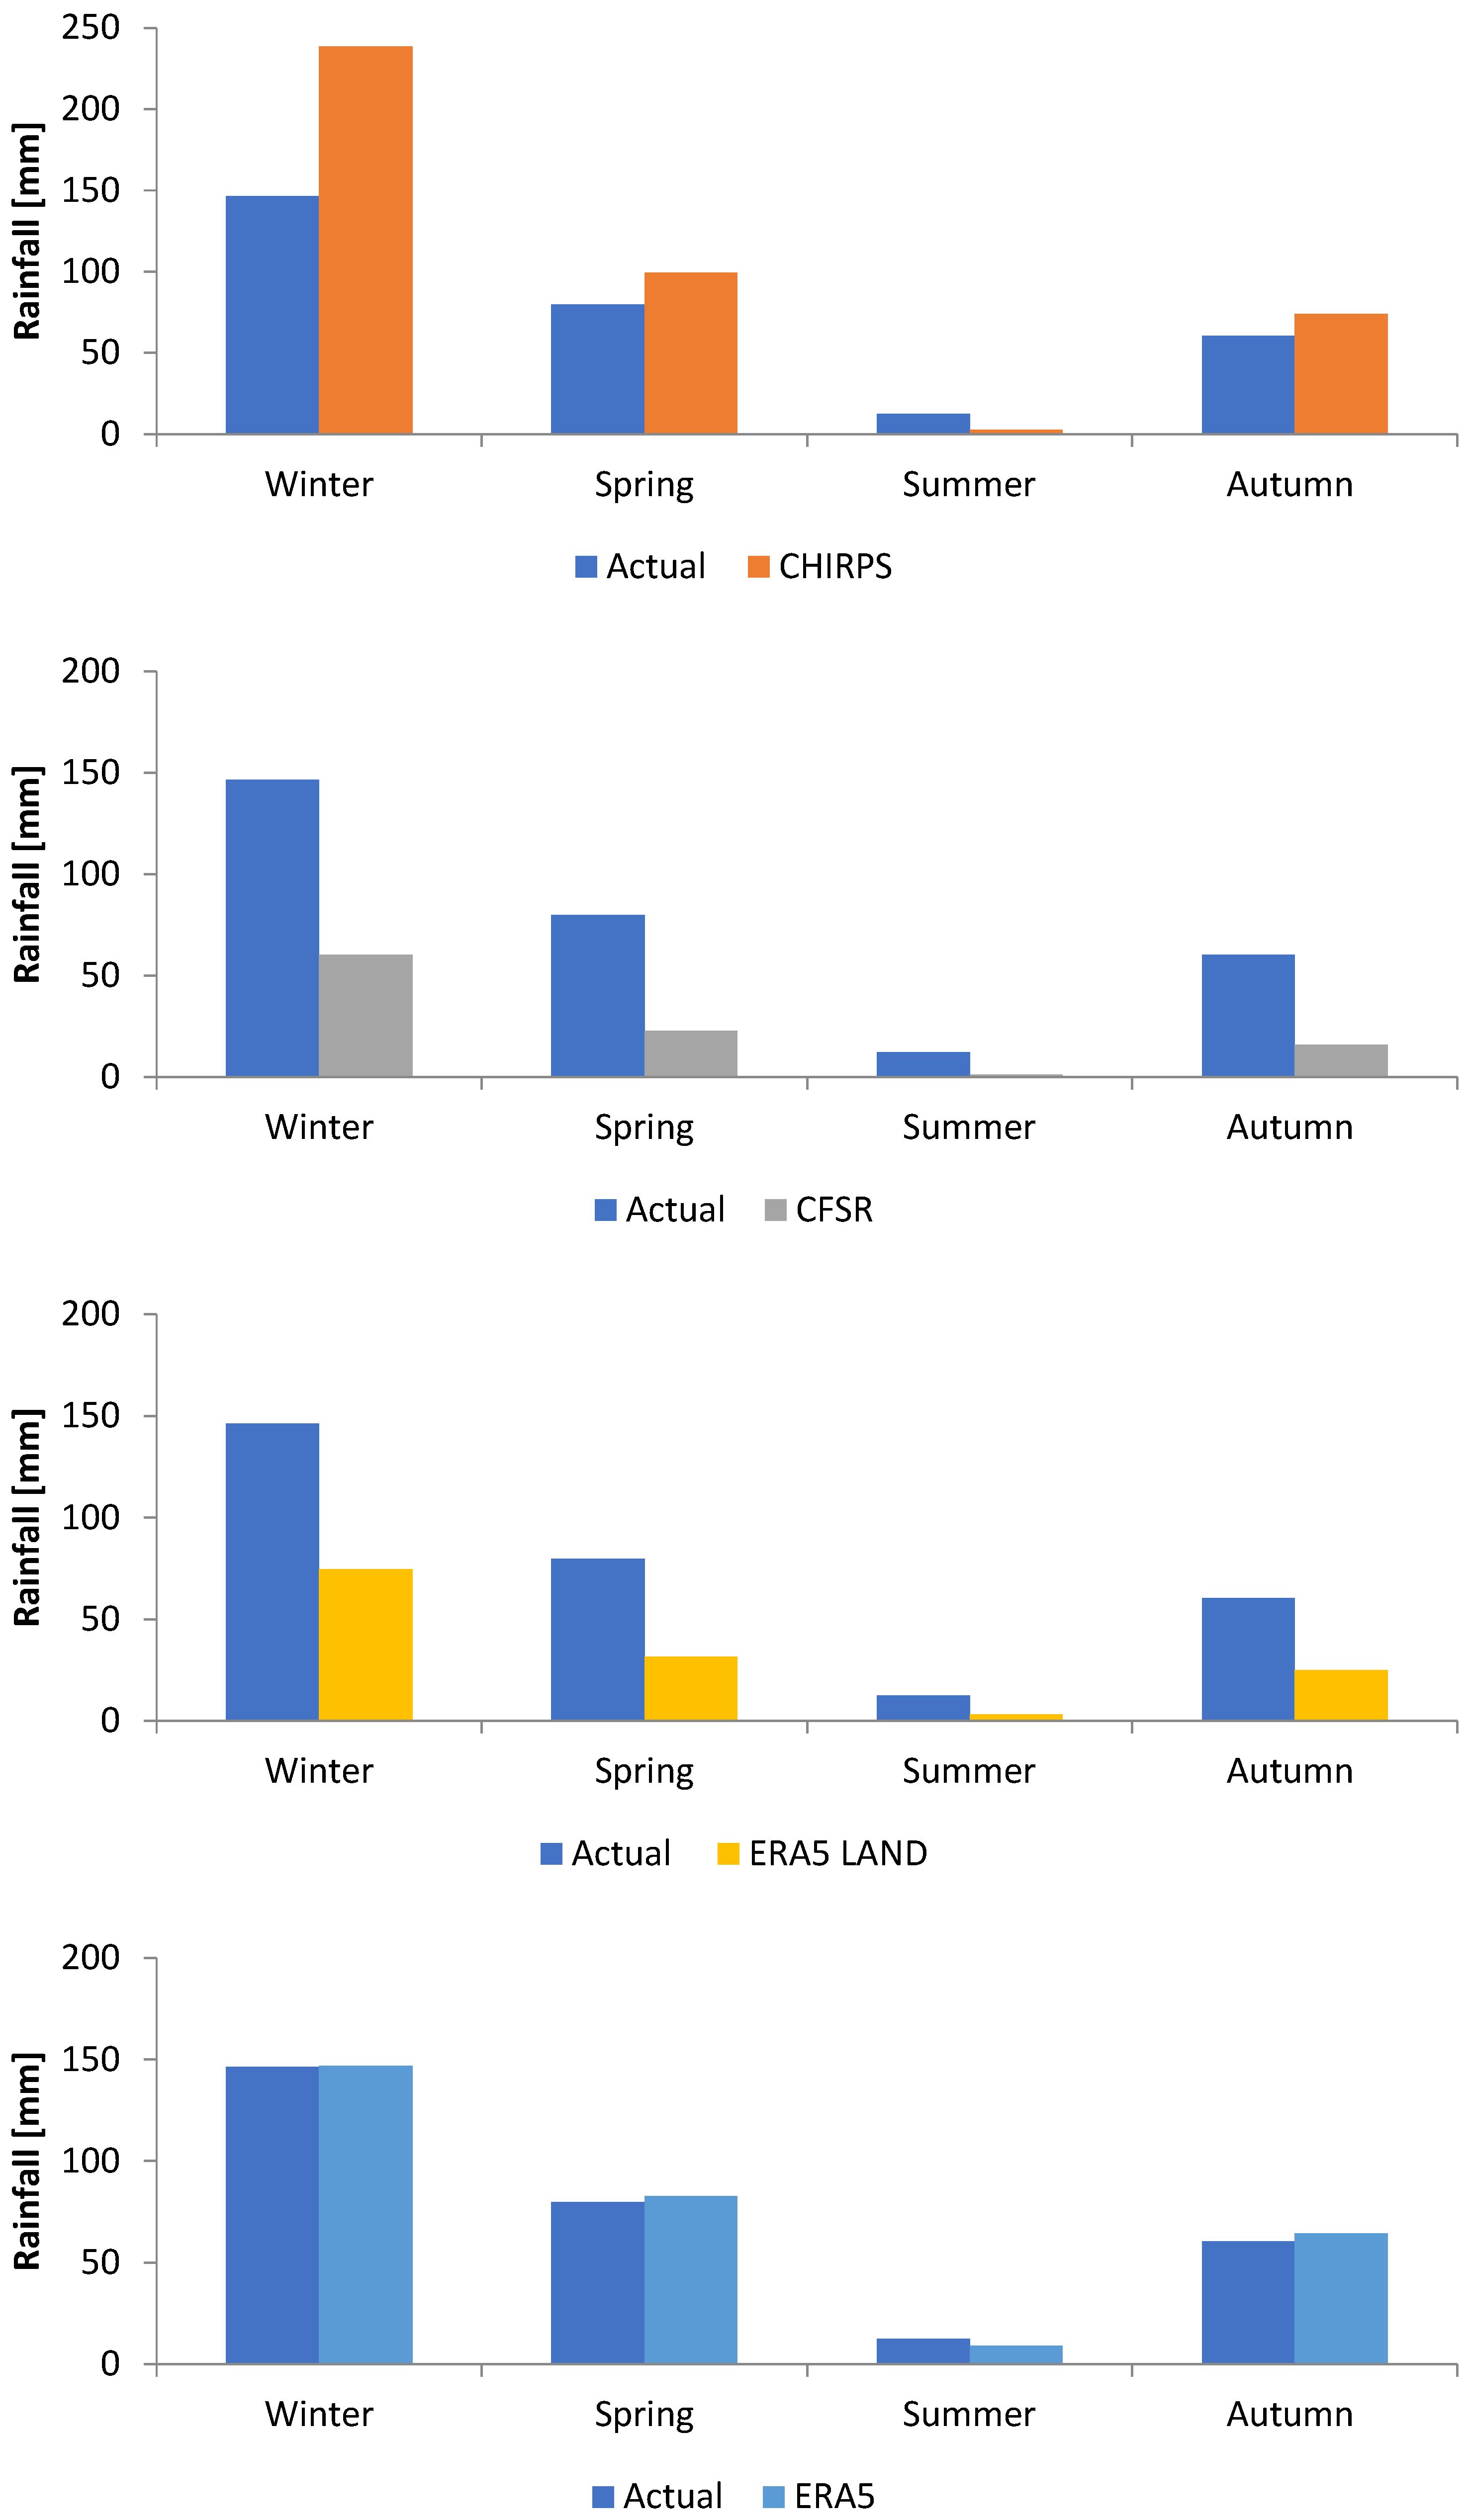
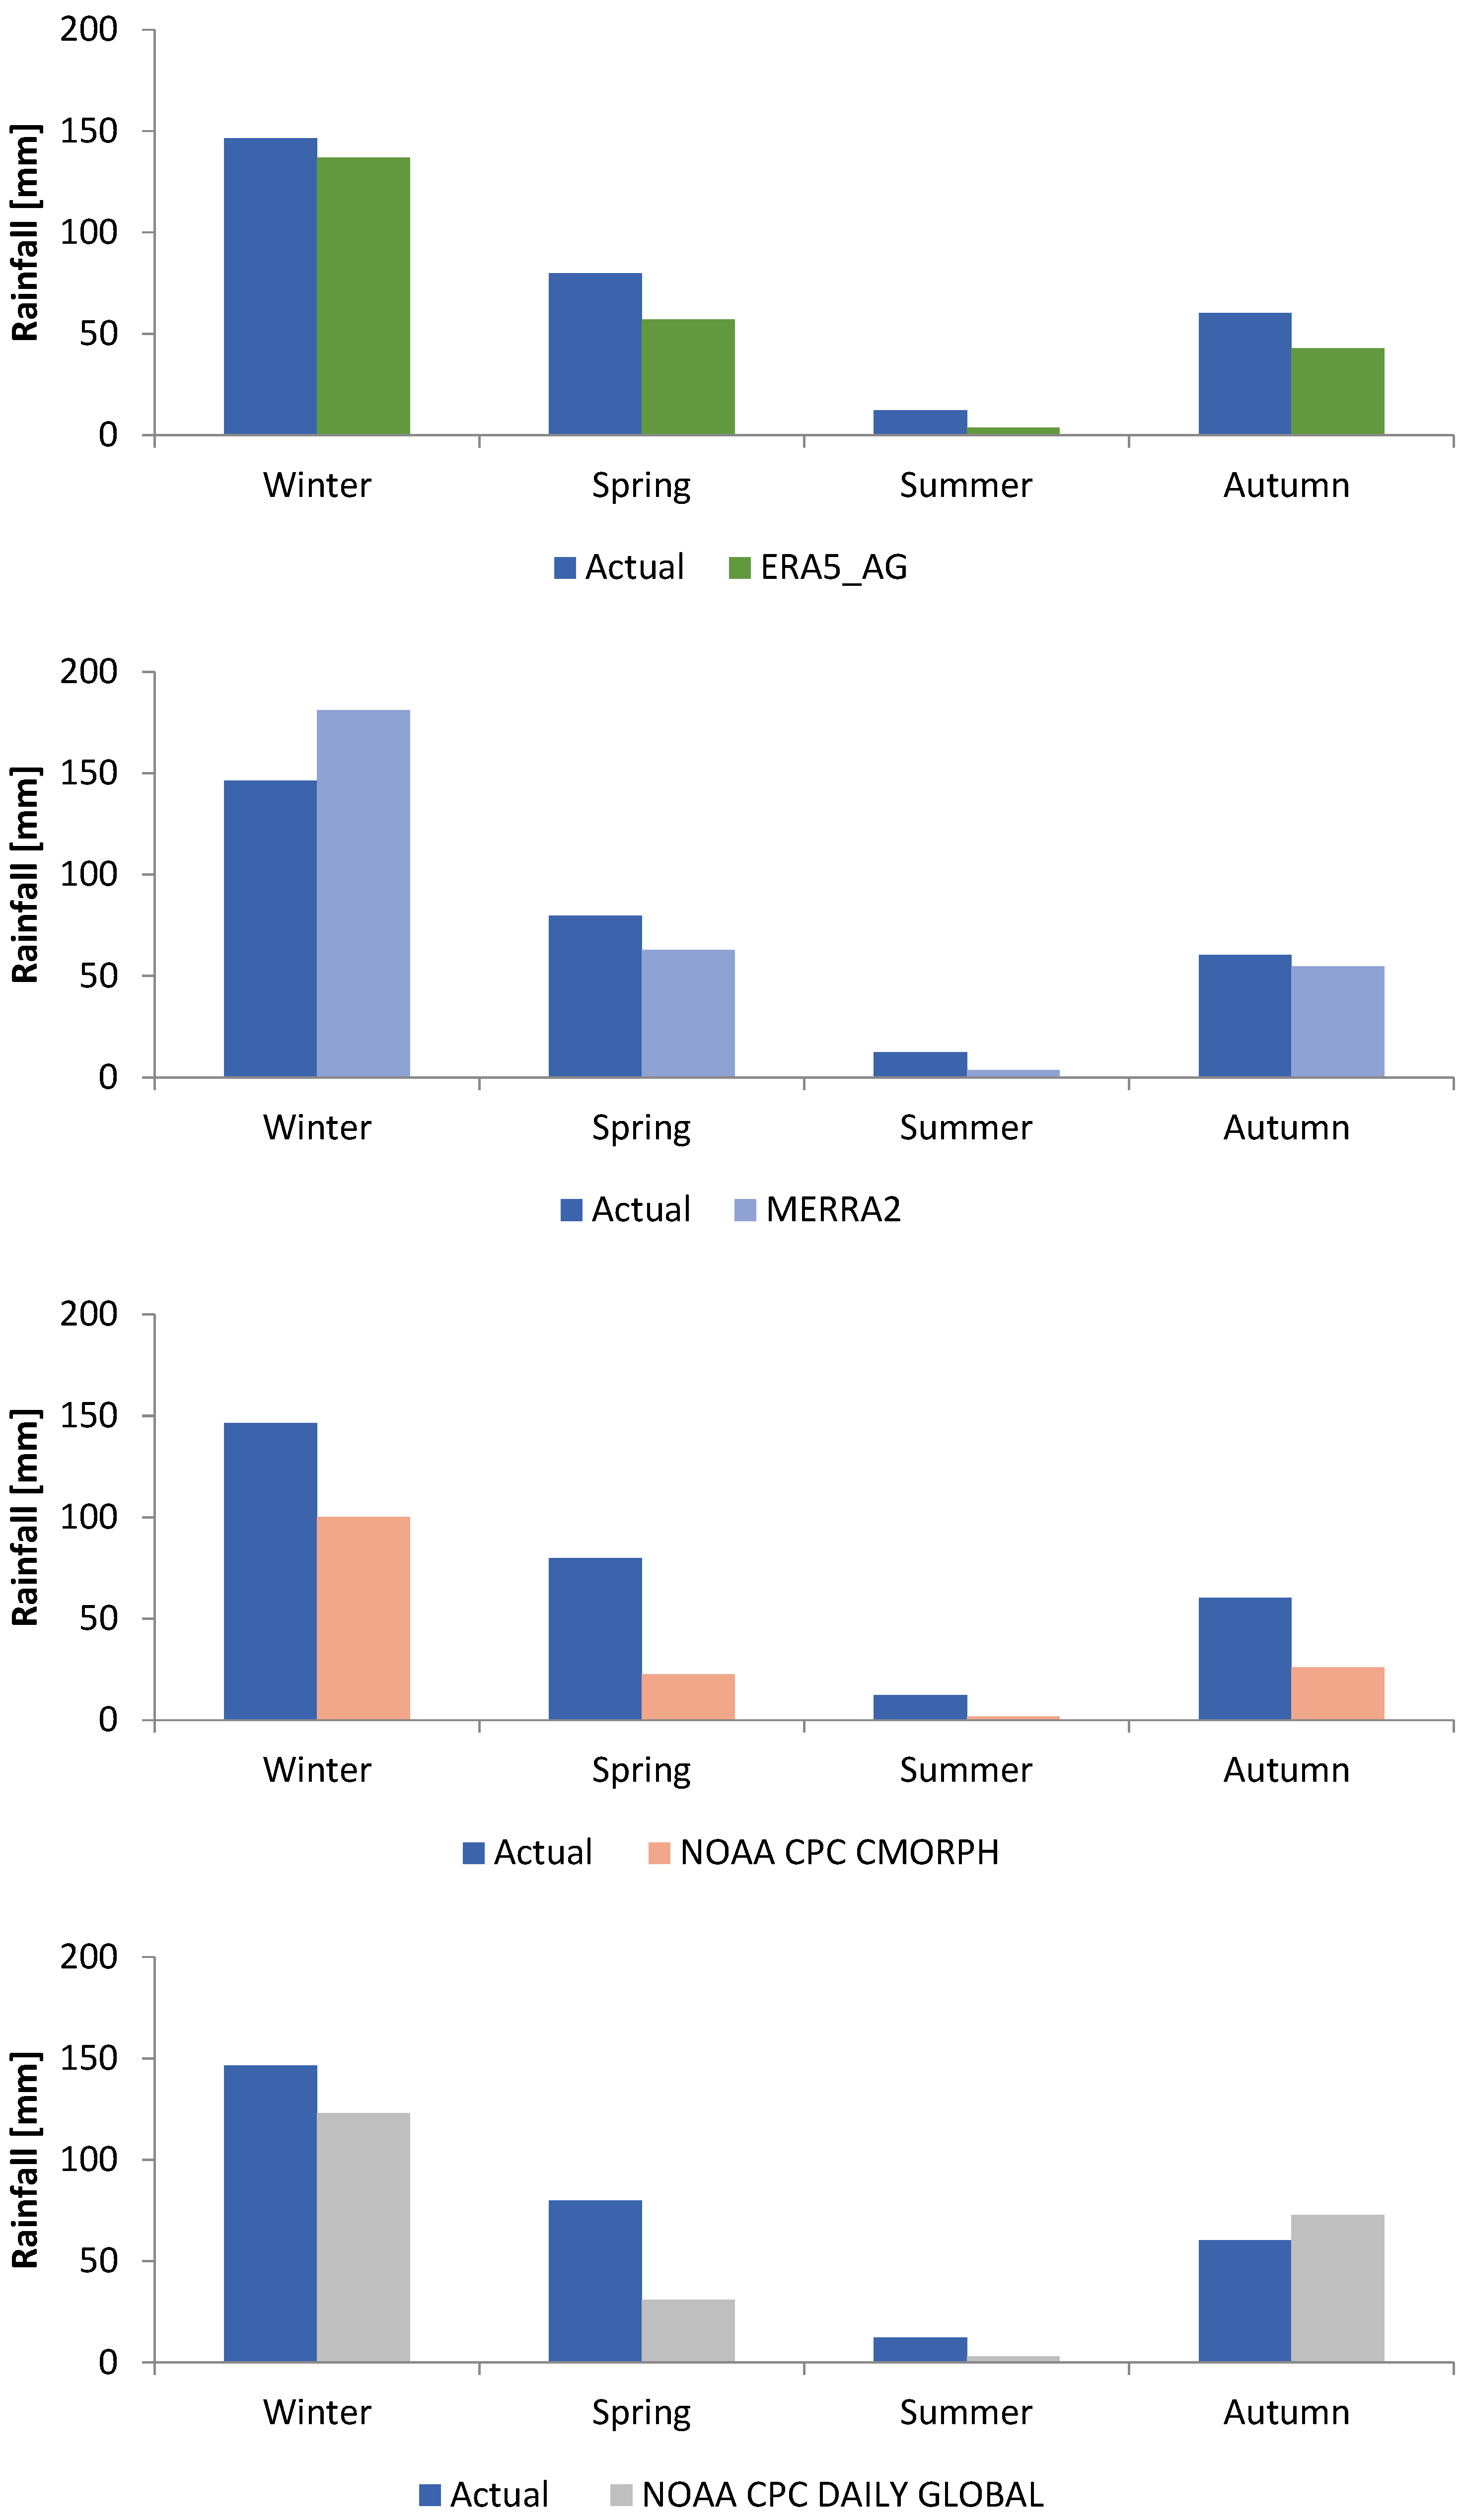
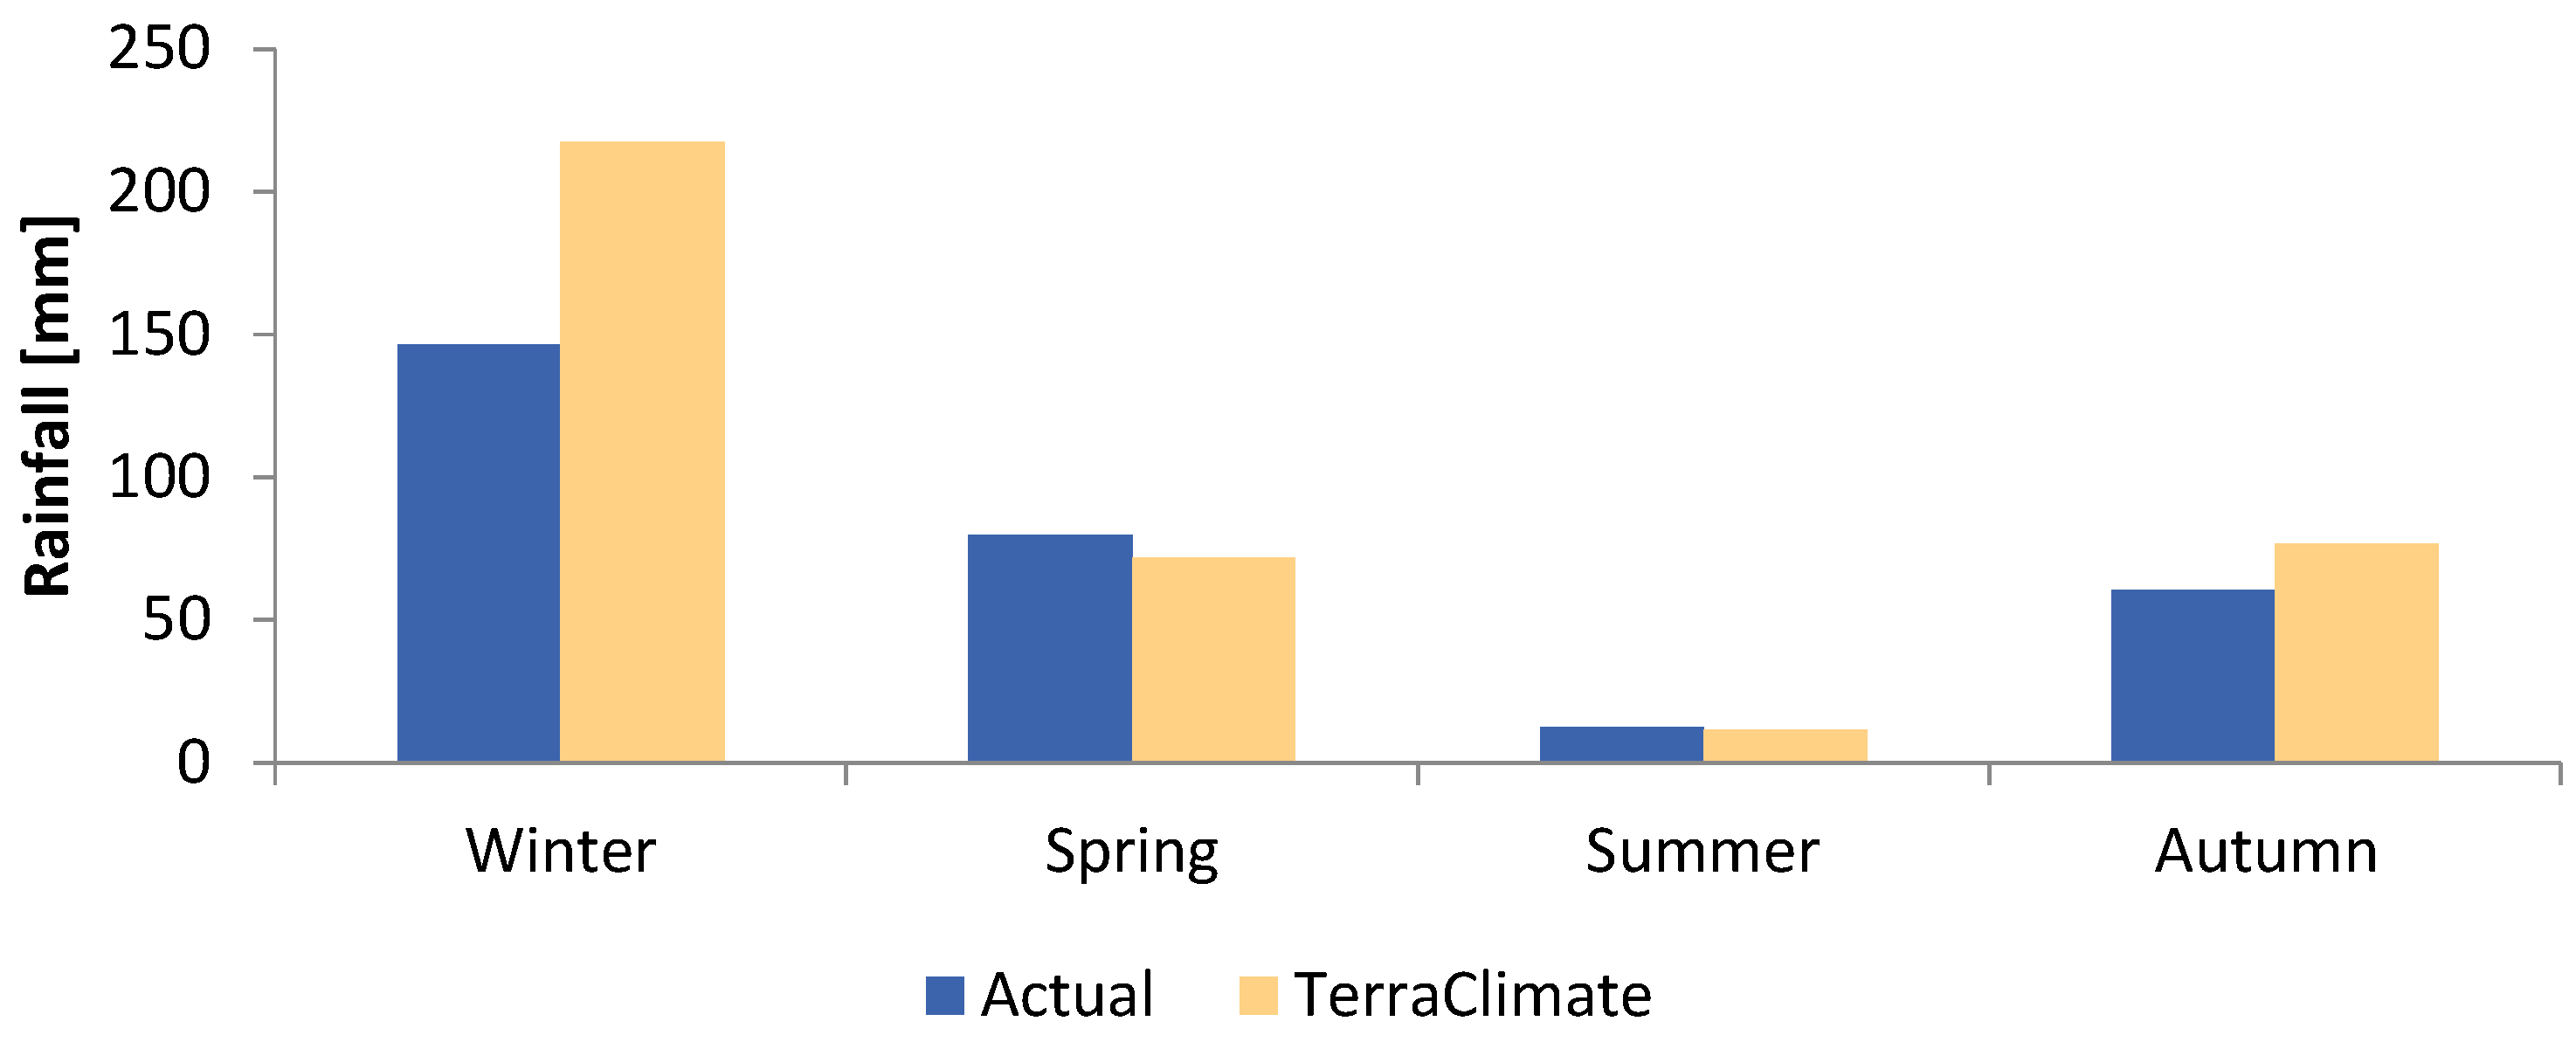
The monthly gauge observation from Lefkoşa, Northern Cyprus, was used to assess the accuracy of the nine global precipitation datasets (see Table 3). Data regarding gauge observations were gathered between 1981 and 2023. Table 7 displays the statistical metrics employed for evaluating the performance of global precipitation datasets. The R2 values were found to be high, with monthly rainfall datasets ranging from 0.74 to 0.95 and seasonal rainfall datasets ranging from 0.79 to 1.00. R2’s highest and lowest values were identified for ERA5 and CPC-UPP, respectively. According to Santhi et al. [122] and Van et al. [123], an R-squared value greater than 0.5 is acceptable. All rainfall products demonstrated excellent performance and accuracy for monthly and seasonal rainfall analysis based on R2 values. Moreover, the results indicate that the EAR5 produced the lowest values of RMSE (3.81 mm) and MAE (3.23 mm), followed by ERA5-Ag (RMSE = 6.50 mm and MAE = 4.89 mm) based on the monthly rainfall dataset. Besides, the seasonal analysis showed that EAR5 had better performance compared to the other datasets.
According to the results, ERA5 performed the best compared to the other datasets. Previous scientific studies [124,125,126,127] support the results presented in this study. For instance, Kokkalis et al. [124] found that ERA5 is a promising alternative data source, especially in areas with limited weather station coverage, as it has demonstrated high predictive ability under both frontal and convective precipitation conditions. Salih et al. [126] concluded that ERA5 was highly accurate in predicting the Tensift basin’s extreme precipitation. Hassler and Lauer [127] concluded that ERA5 has a good correlation with observed rainfall data in the South Asian and Central European monsoon regions, but underestimates very low rainfall rates in the tropics. According to Tarek et al. [128] and Lavers et al. [129], ERA5’s high geographical resolution of 24 km and daily interval temporal precision allow it to better capture localized precipitation events than poorer datasets. This resolution is particularly important for accurately simulating convective rainfall, as it is often missed by lower-resolution models. According to previous studies [130,131,132,133], high-resolution datasets are necessary for more accurately capturing extreme rainfall occurrences, which are critical for hydrological applications and agricultural planning. ERA5 is based on atmospheric physics, modeling precipitation processes using fluid dynamics and thermodynamics. This model’s resilience is demonstrated by its capacity to capture the basic mechanics of rainfall generation. Besides, Dee et al. [134] pointed out that reanalysis models that effectively reproduce atmospheric processes yield more accurate precipitation outputs. This physical basis ensures that rainfall estimates are statistically correlated with observations and are based on sound meteorological principles.
Furthermore, the monthly and seasonal variations in rainfall for the observations and global precipitation datasets for the study’s chosen location are depicted in Figure 7 and Figure 8, respectively. It can be seen that ERA5 and ERA5-Ag rainfall are generally similar to the observation data.

3.2. Characteristics of Rainfall in the Selected Location

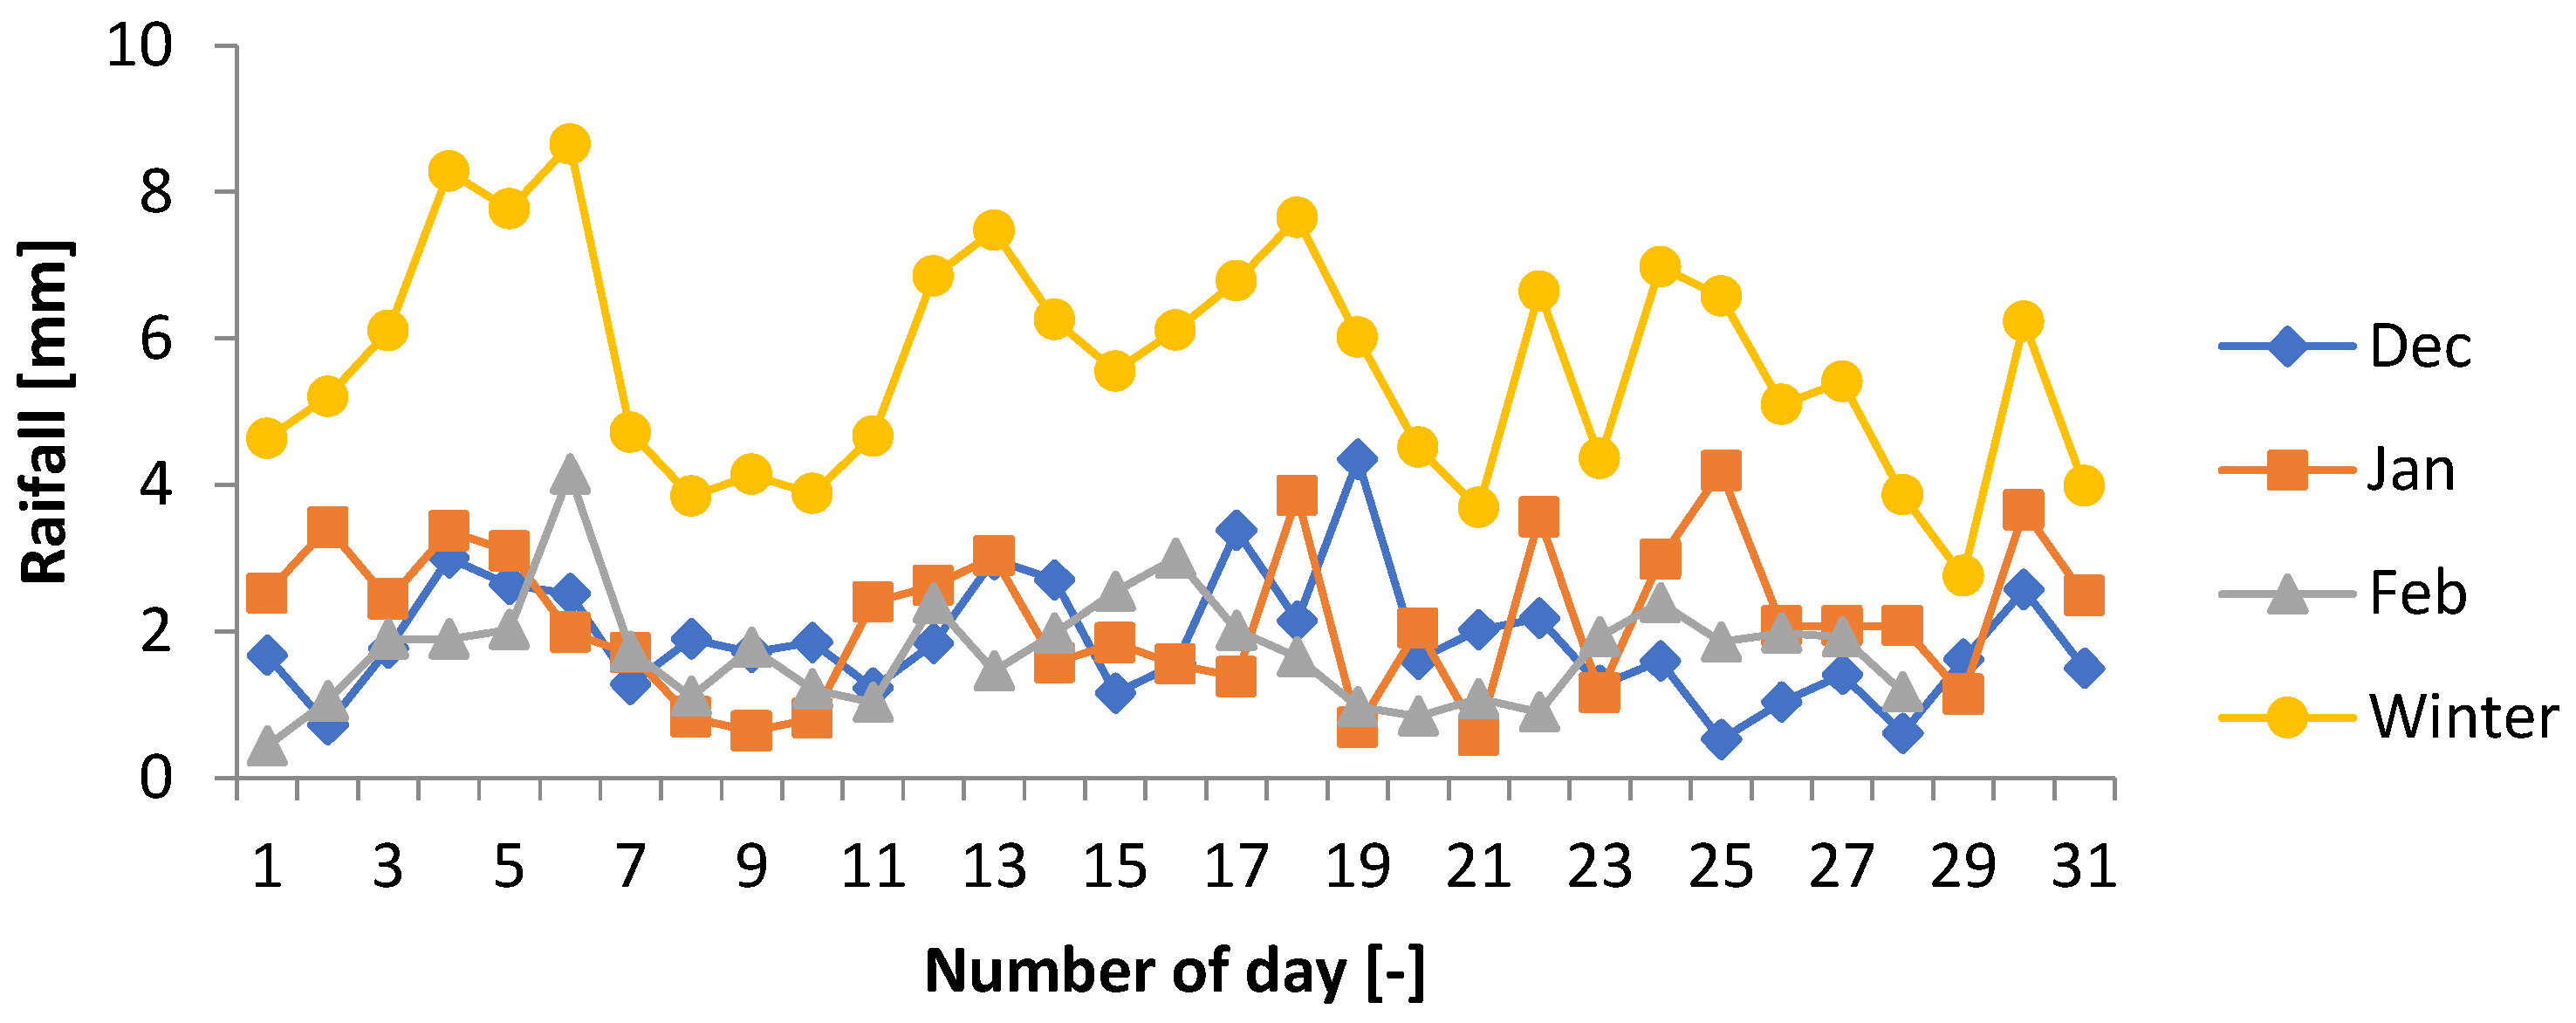
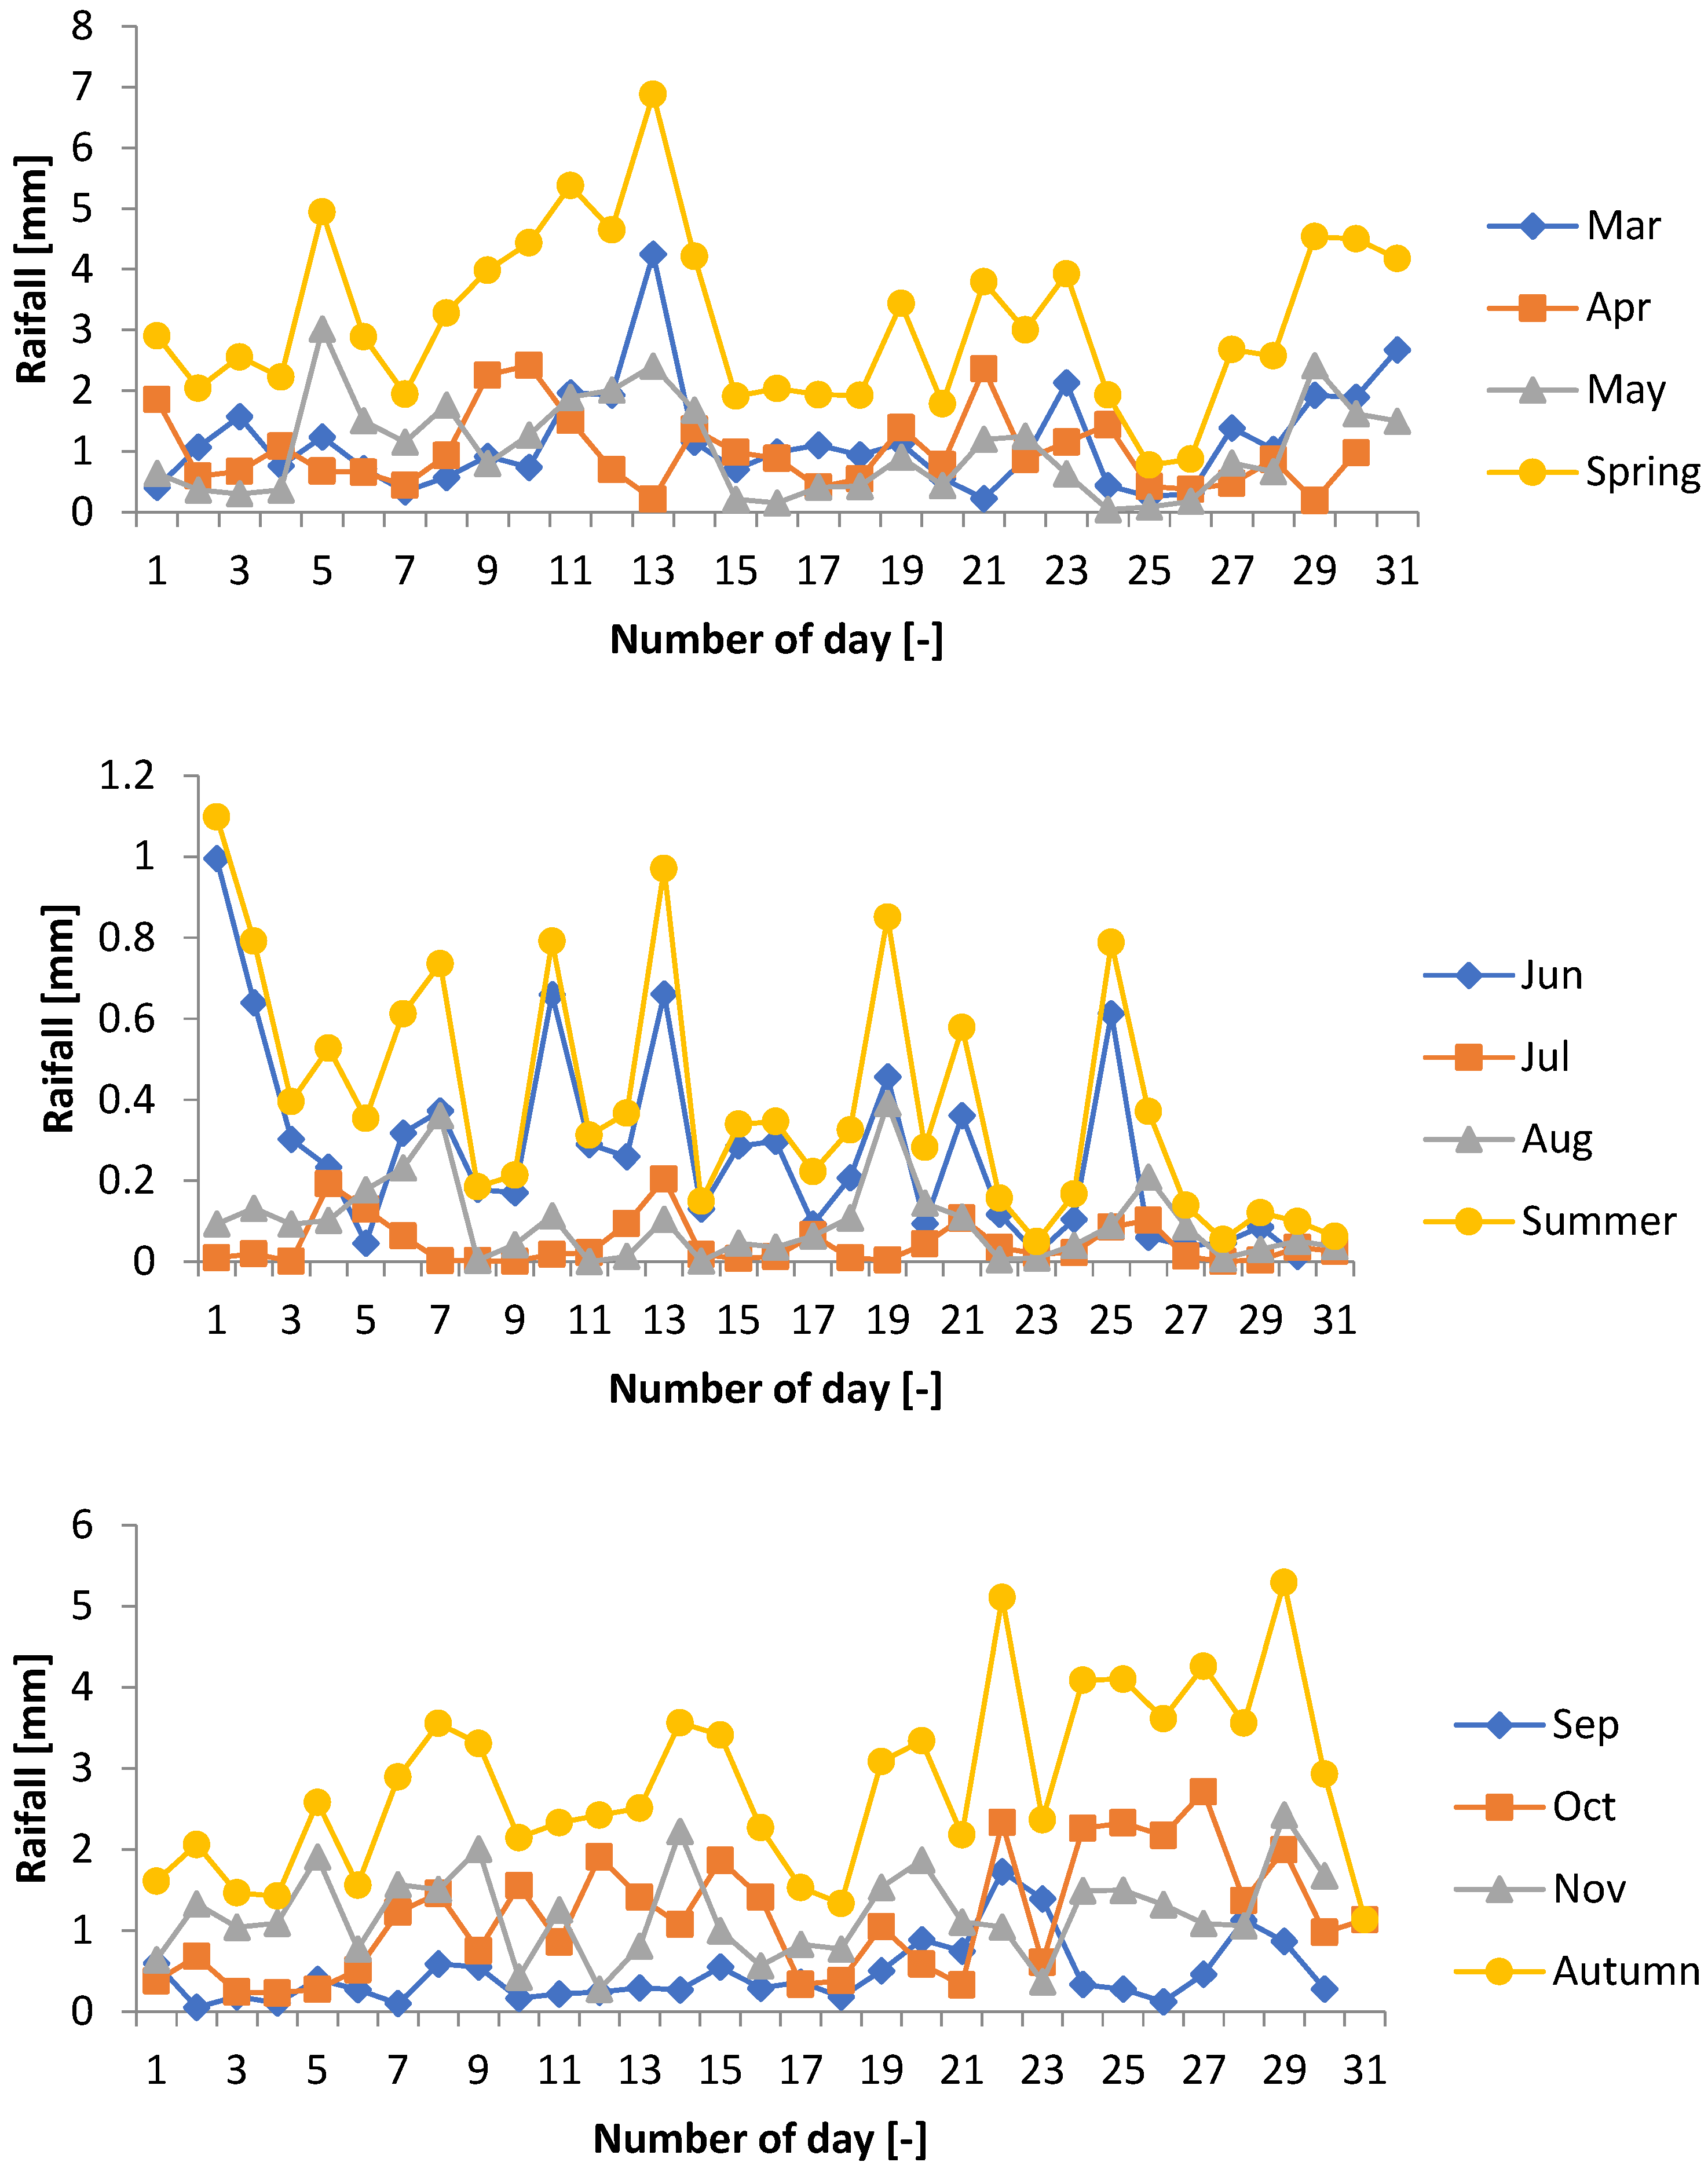
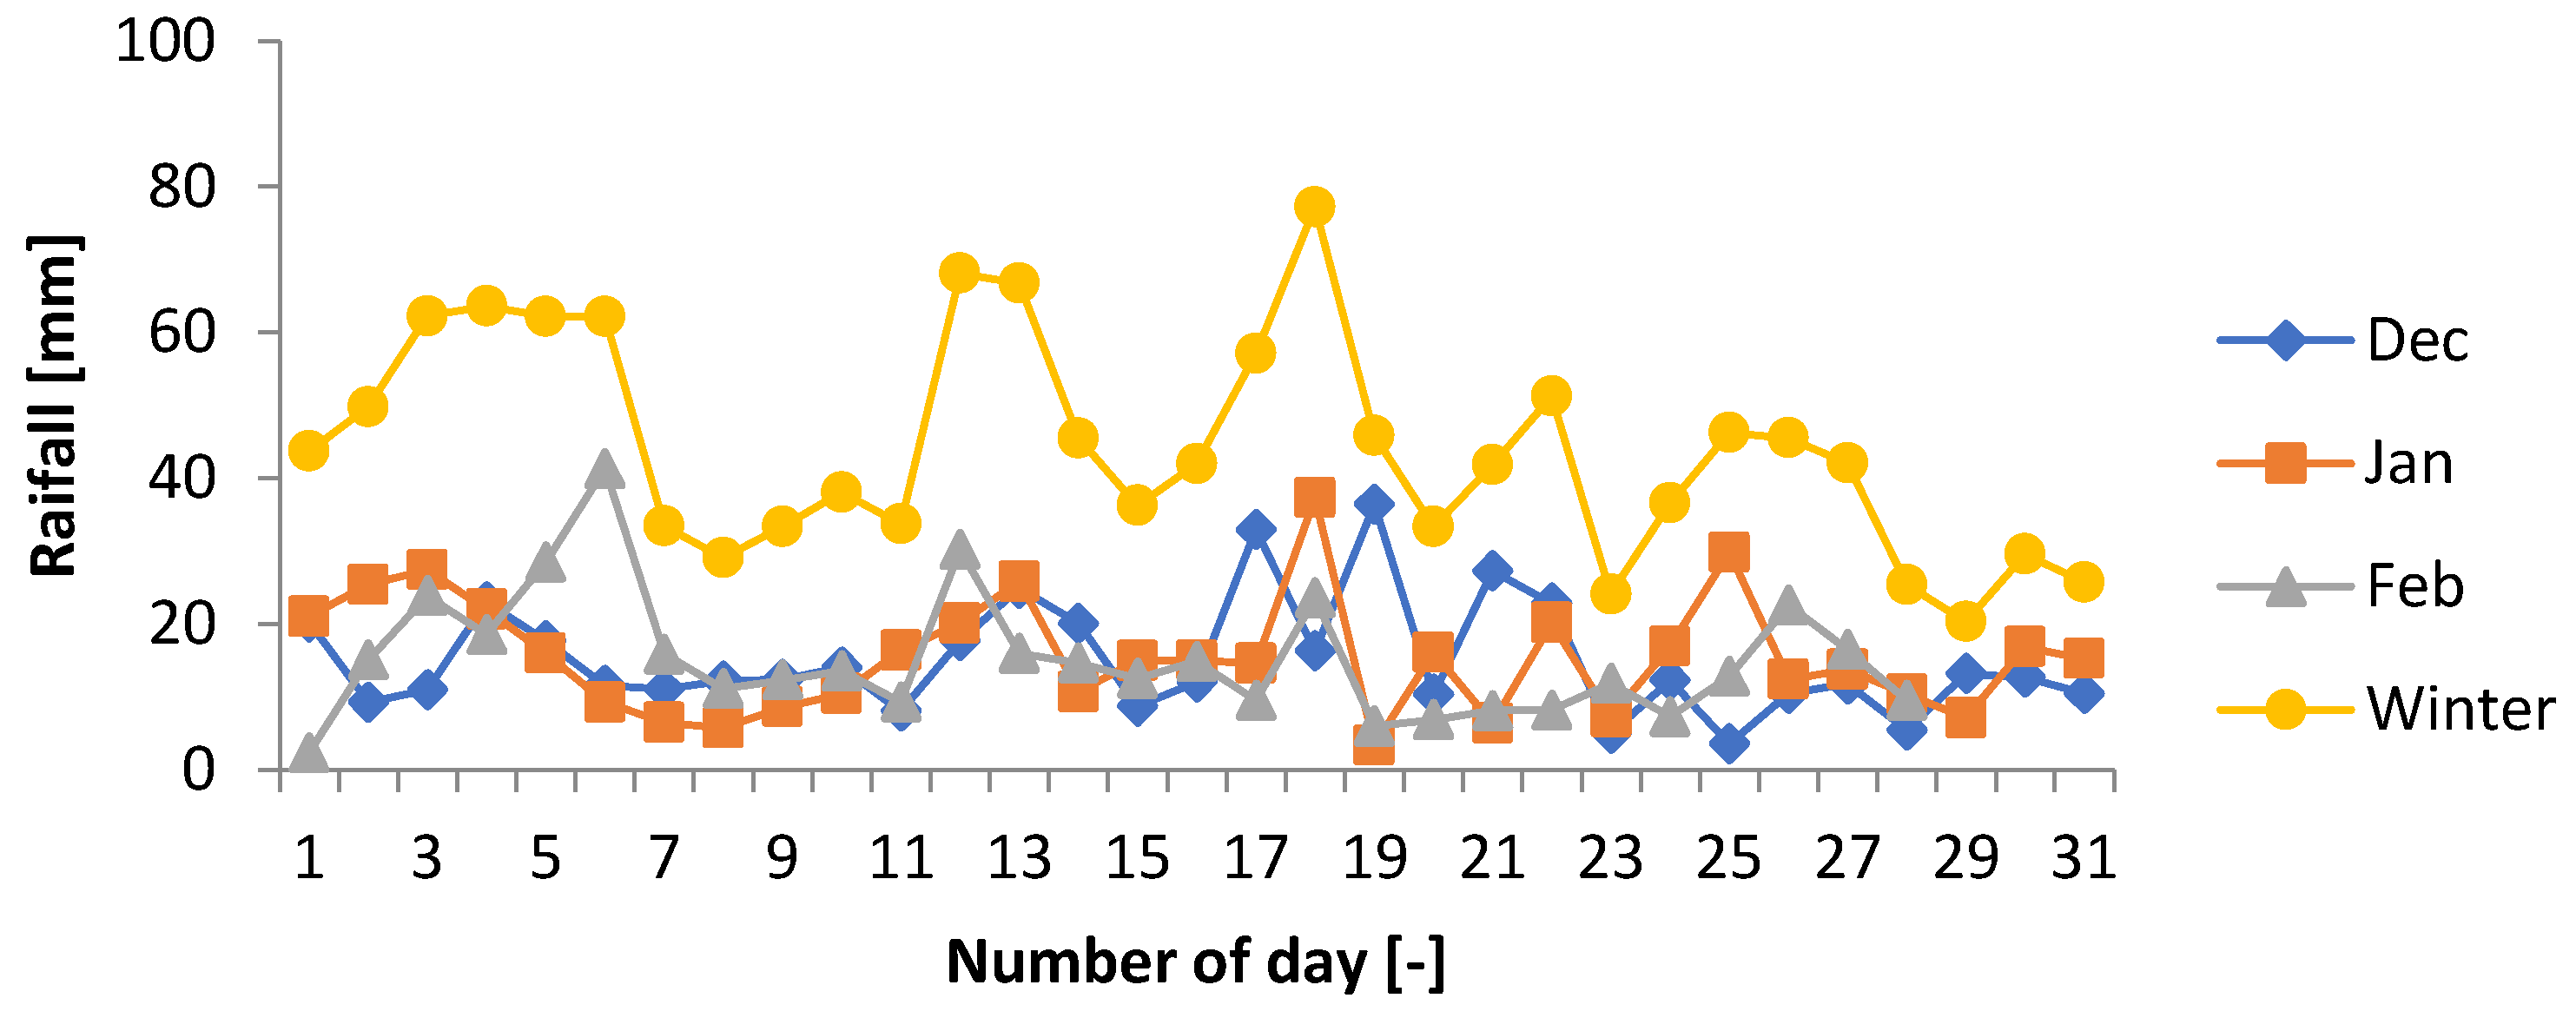
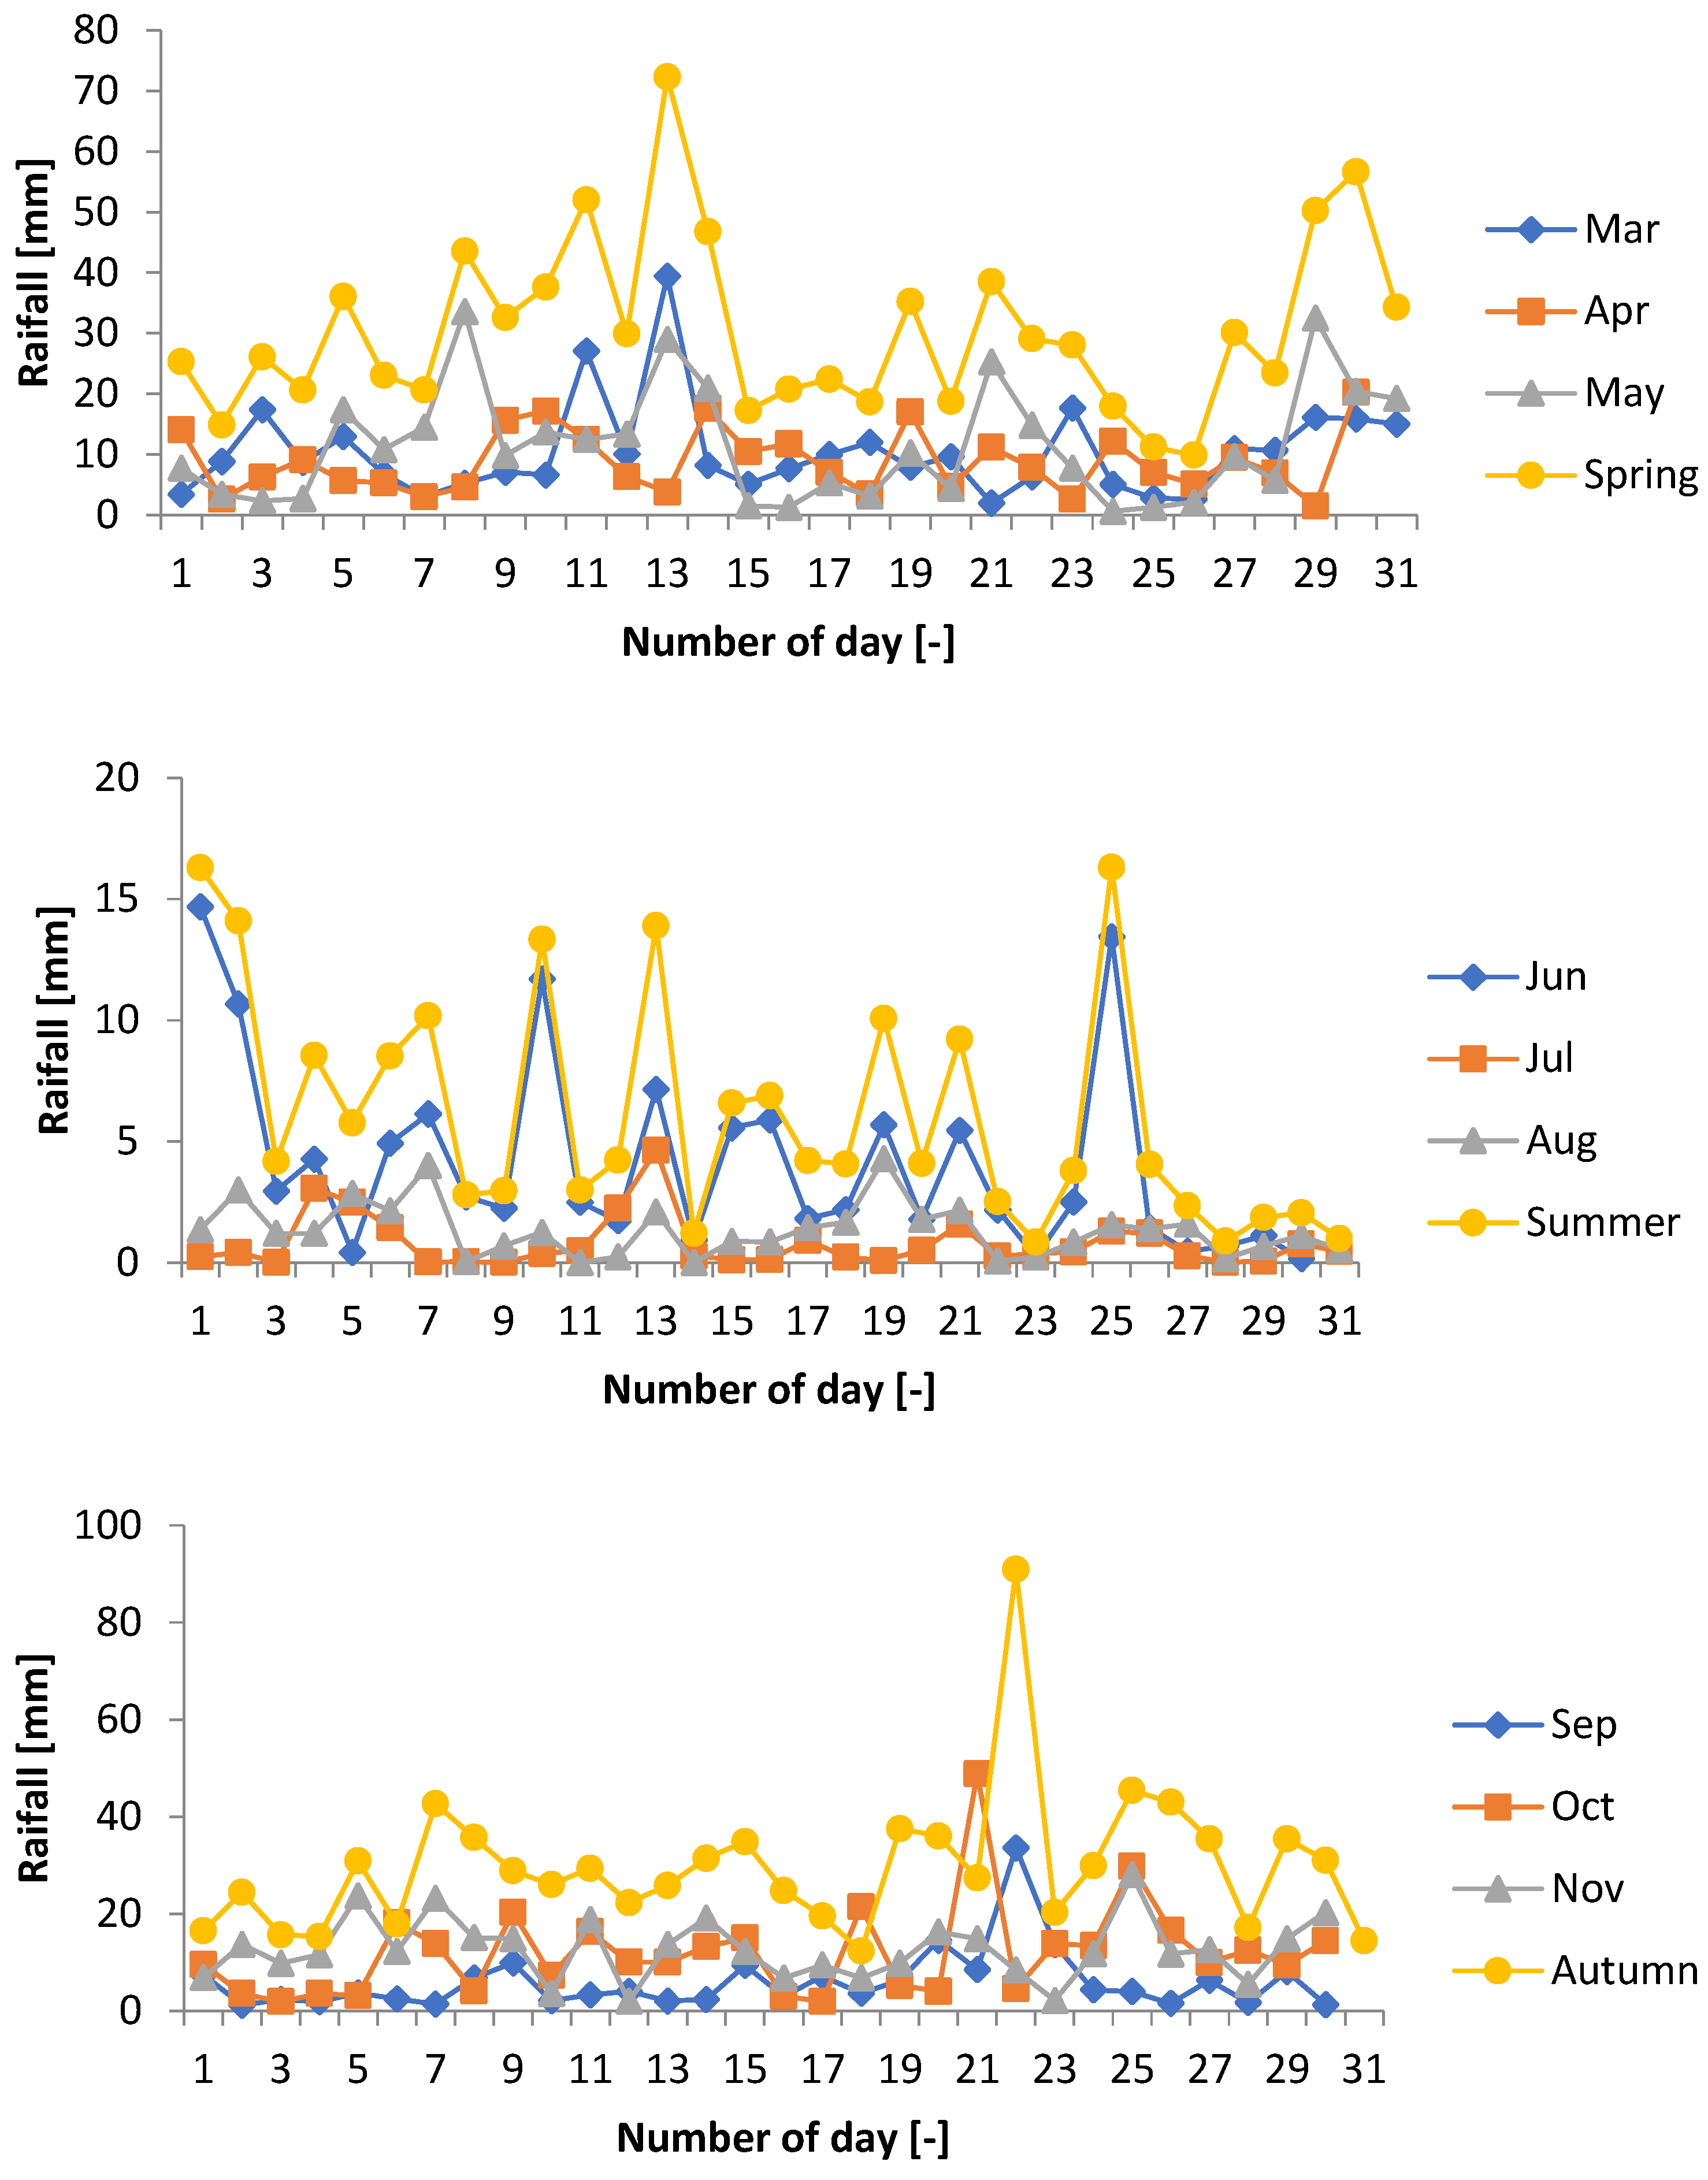
As mentioned above, the number of stations and data are limited. This is considered a major problem for working with the observed rainfall records in Northern Cyprus. Based on the results (Section 3.1), EAR5 has given the highest value of R-squared and the lowest value of RMSE and MAE. Therefore, ERA5 reanalysis was employed in this study and proposed as an alternative dataset for developing RWH systems at the selected location. The data was gathered for the period 2000–2023. The average and maximum daily variations in rainfall are illustrated in Figure 9 and Figure 10, respectively. It was found that the maximum and lowest daily rainfall values, 4.35 mm and 0.00035 mm, respectively, occurred in December and August (see Figure 9). Moreover, it was found that the highest and lowest daily rainfall occurred in October 2012 and August 2004, with values of 48.89 mm and 0.0061 mm, respectively, as shown in Figure 10. It should be noted that the maximum value of rainfall for each month between 2000 and 2023 was utilized as the parameter for analyzing the location’s extreme rainfall estimation. The amount of maximum daily/monthly rainfall influences design features such as tank size, filtering needs, and so on. Besides, the maximum monthly rainfall data over long periods helps ensure that storage is appropriate for peak usage [135]. Imteaz et al. [135] concluded that size based on extremes enhances water availability during dry periods.
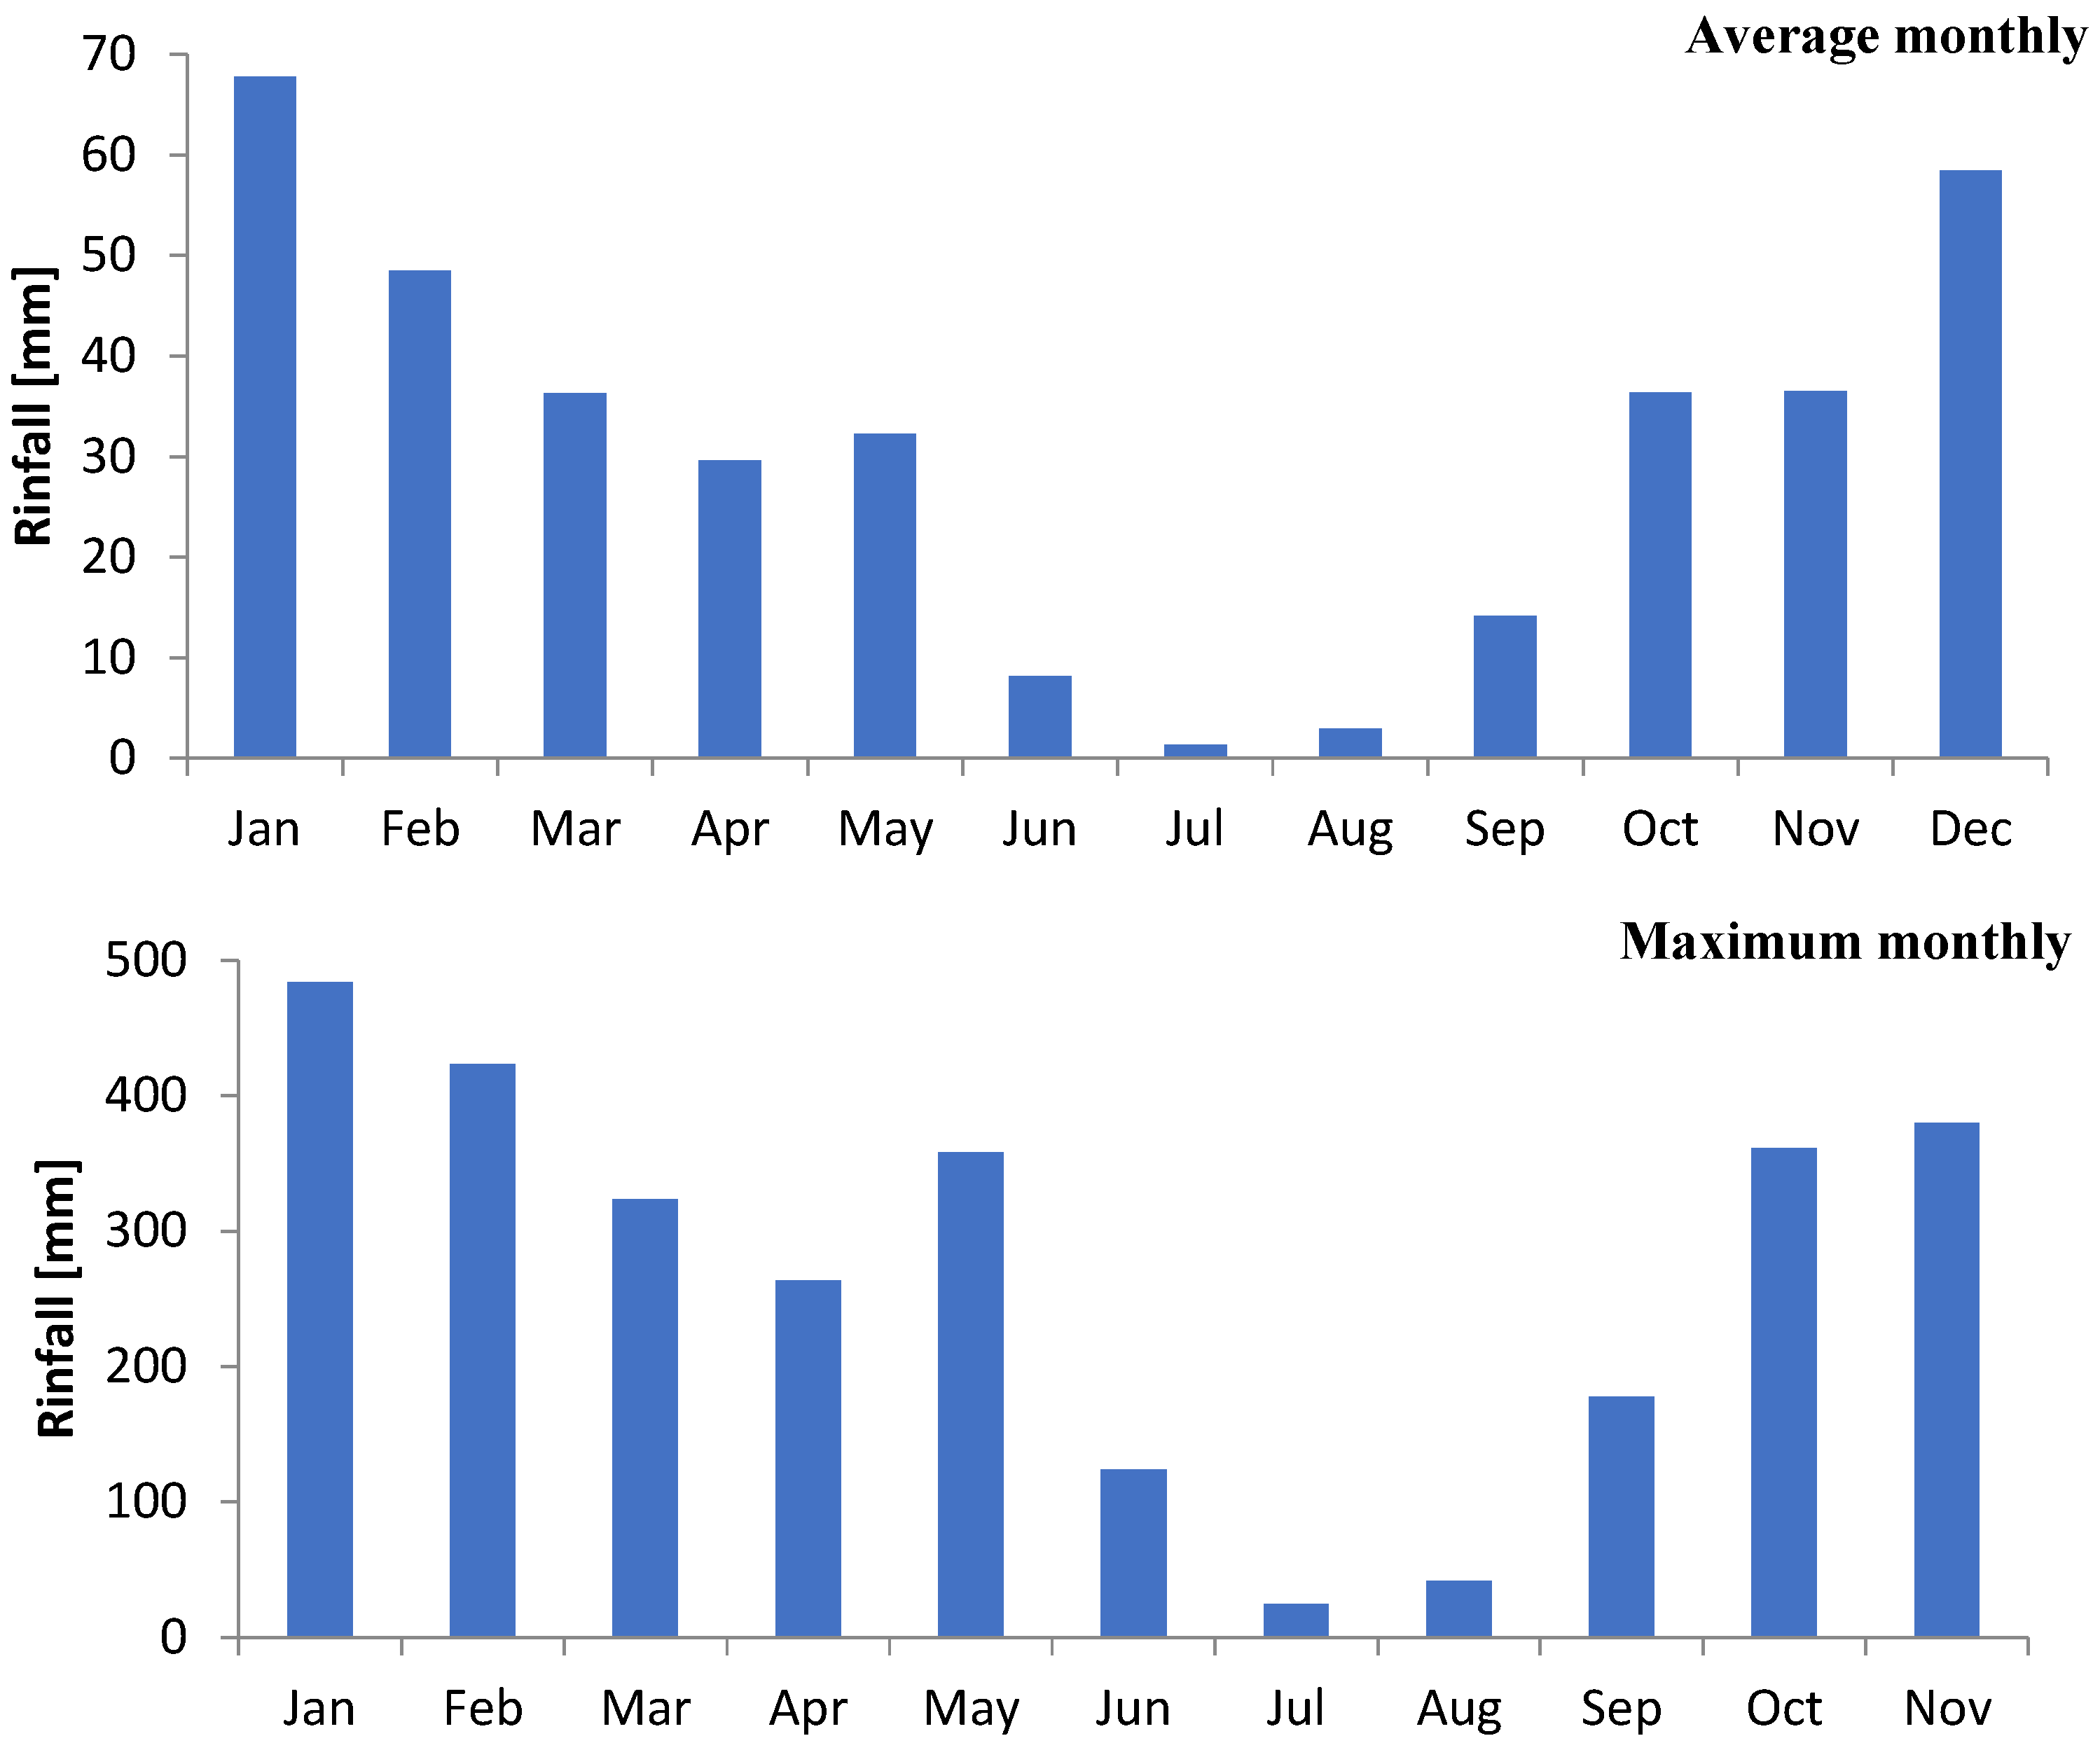
Additionally, as illustrated in Figure 11, the highest monthly rainfall value was recorded in January (67.76 mm for average monthly and 483.43 mm for maximum monthly rainfall data), while the lowest value was recorded in July (1.37 mm and 24.67 mm for average and maximum monthly rainfall, respectively).

3.2.1. Selecting the Best-Fit Results for Average Daily and Seasonally Rainfall

The maximum likelihood approach was utilized to compute the distribution parameters based on the mean daily rainfall. Anderson-Darling (A-D), chi-squared (C-s), and Kolmogorov-Smirnov (K-S) tests were used to determine which of the 65 distribution functions for the chosen location had the best distribution. Table 8 and Table 9 list the best distribution function for average and seasonally daily rainfall, respectively, based on the K-S, A-D, and C-s tests. The best-fit result is defined as the smallest goodness-of-fit result among all the probability distributions developed.
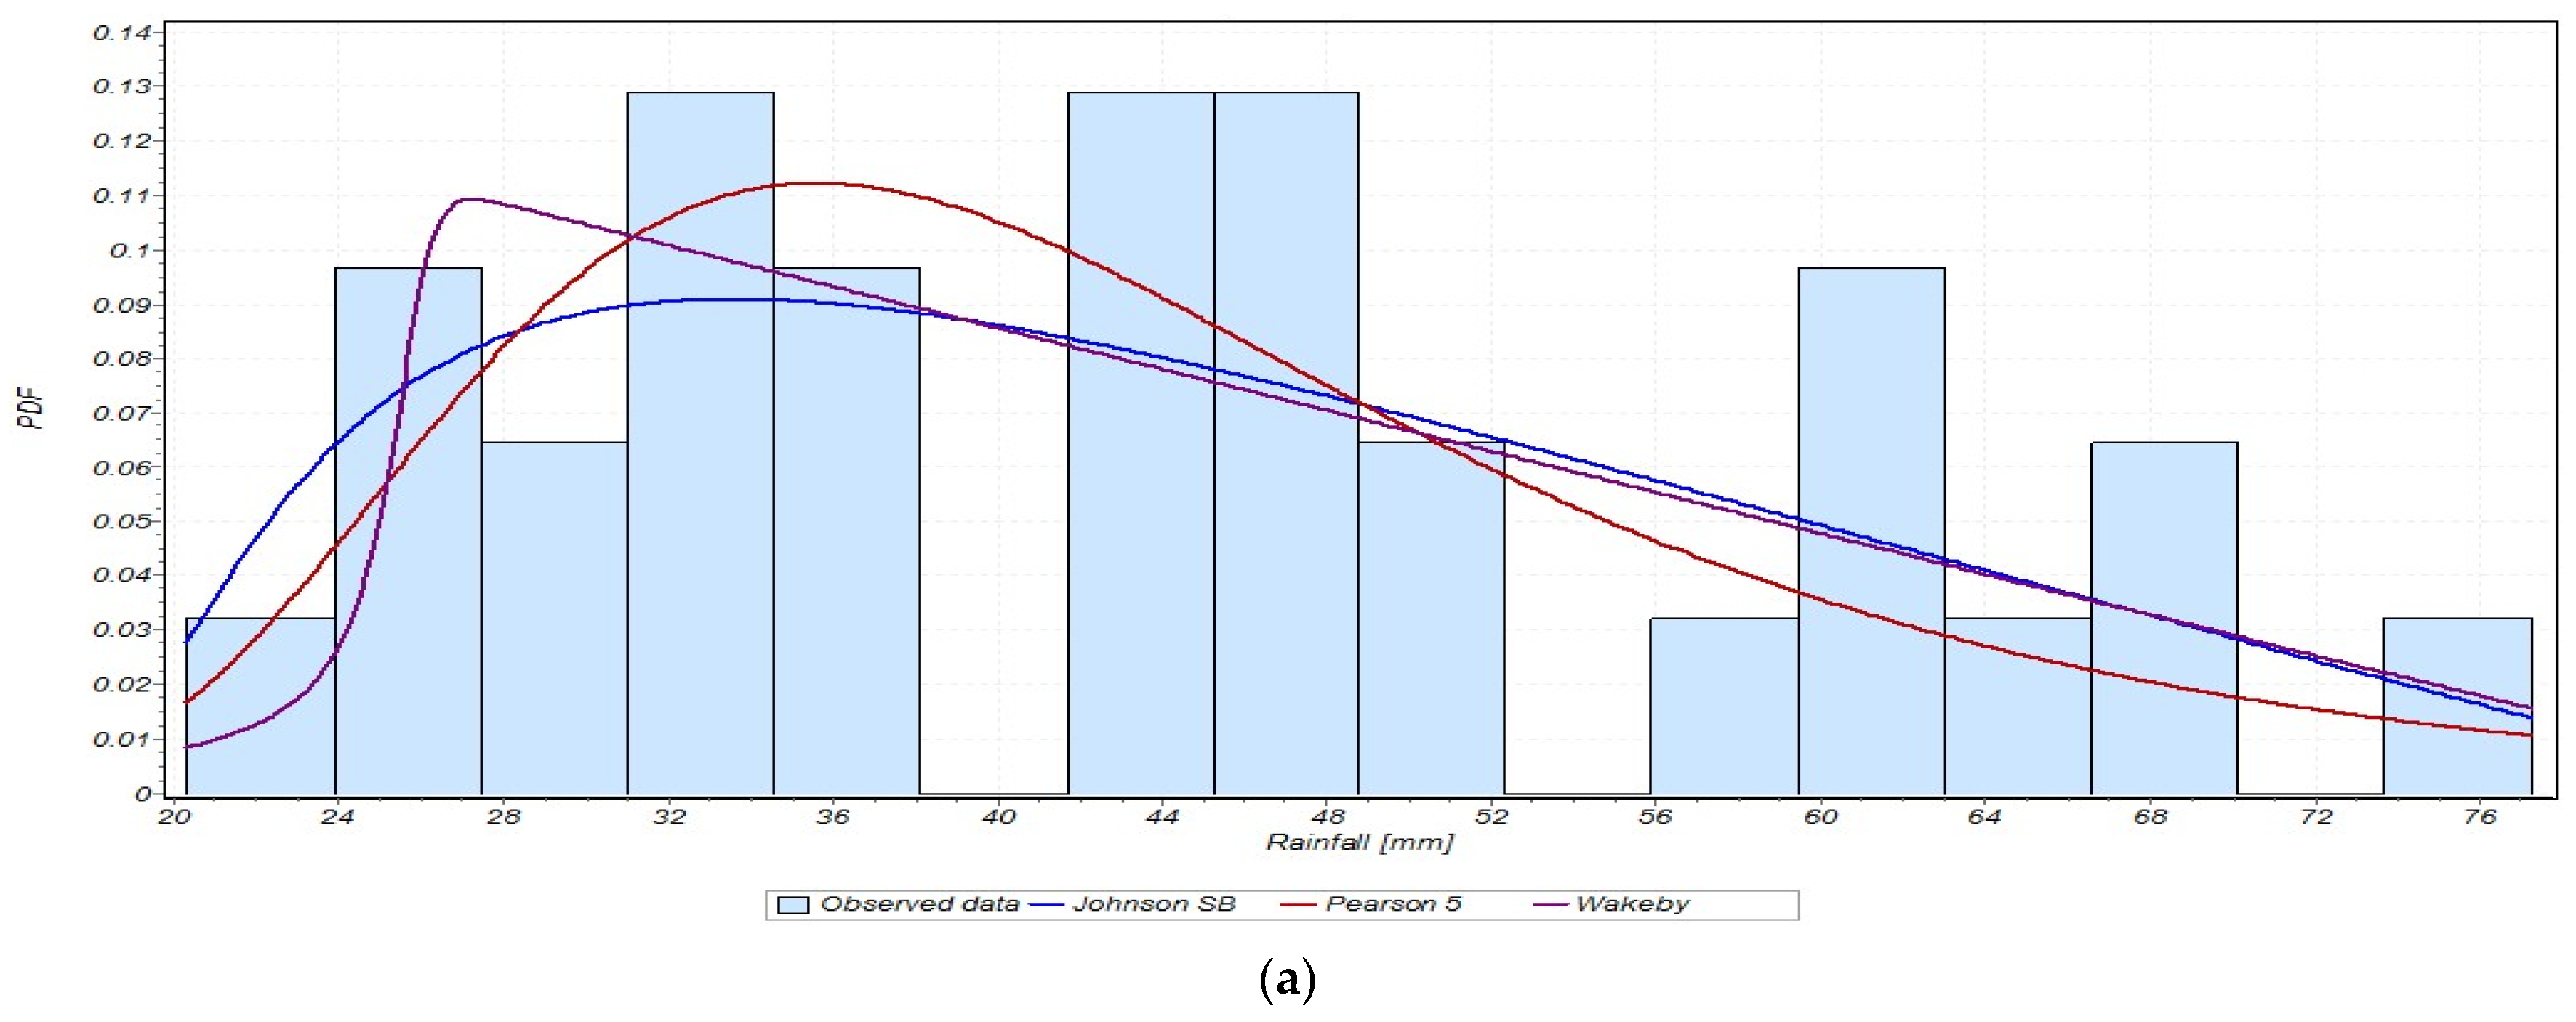
It was found that the Johnson SB distribution was selected as the best fit in January based on both the Anderson-Darling (AD) and Kolmogorov-Smirnov (KS) tests, classifying it as a continuous-bounded distribution, while the normal distribution was the best fit according to the chi-squared (CS) test, classifying it as a continuous-unbounded distribution. When non-negative distributions were seen in February and March, it was found that the Dagum (4P) and Log-Logistic (3P) distributions suited the data the best. Additionally, the Wakeby distribution, which falls under the continuous-advanced category, was frequently suitable, particularly from April to December. It was often mixed with other deliveries, depending on the month. Moreover, the summer season was shown to be a suitable time for continuous distribution. The KS test indicated that the Log-Pearson 3 distribution was continuous and that it performed best in July and August. For July, the Phased Bi-Weibull distribution was a particularly complex choice. In several months (May, June, and December), the Wakeby distribution was especially robust throughout the year, periodically matching with advanced rainfall trends. Additionally, the Burr (4P), general extreme value, and Weibull distributions appeared in the months that followed, including October and November, in response to the fluctuation of rainfall.
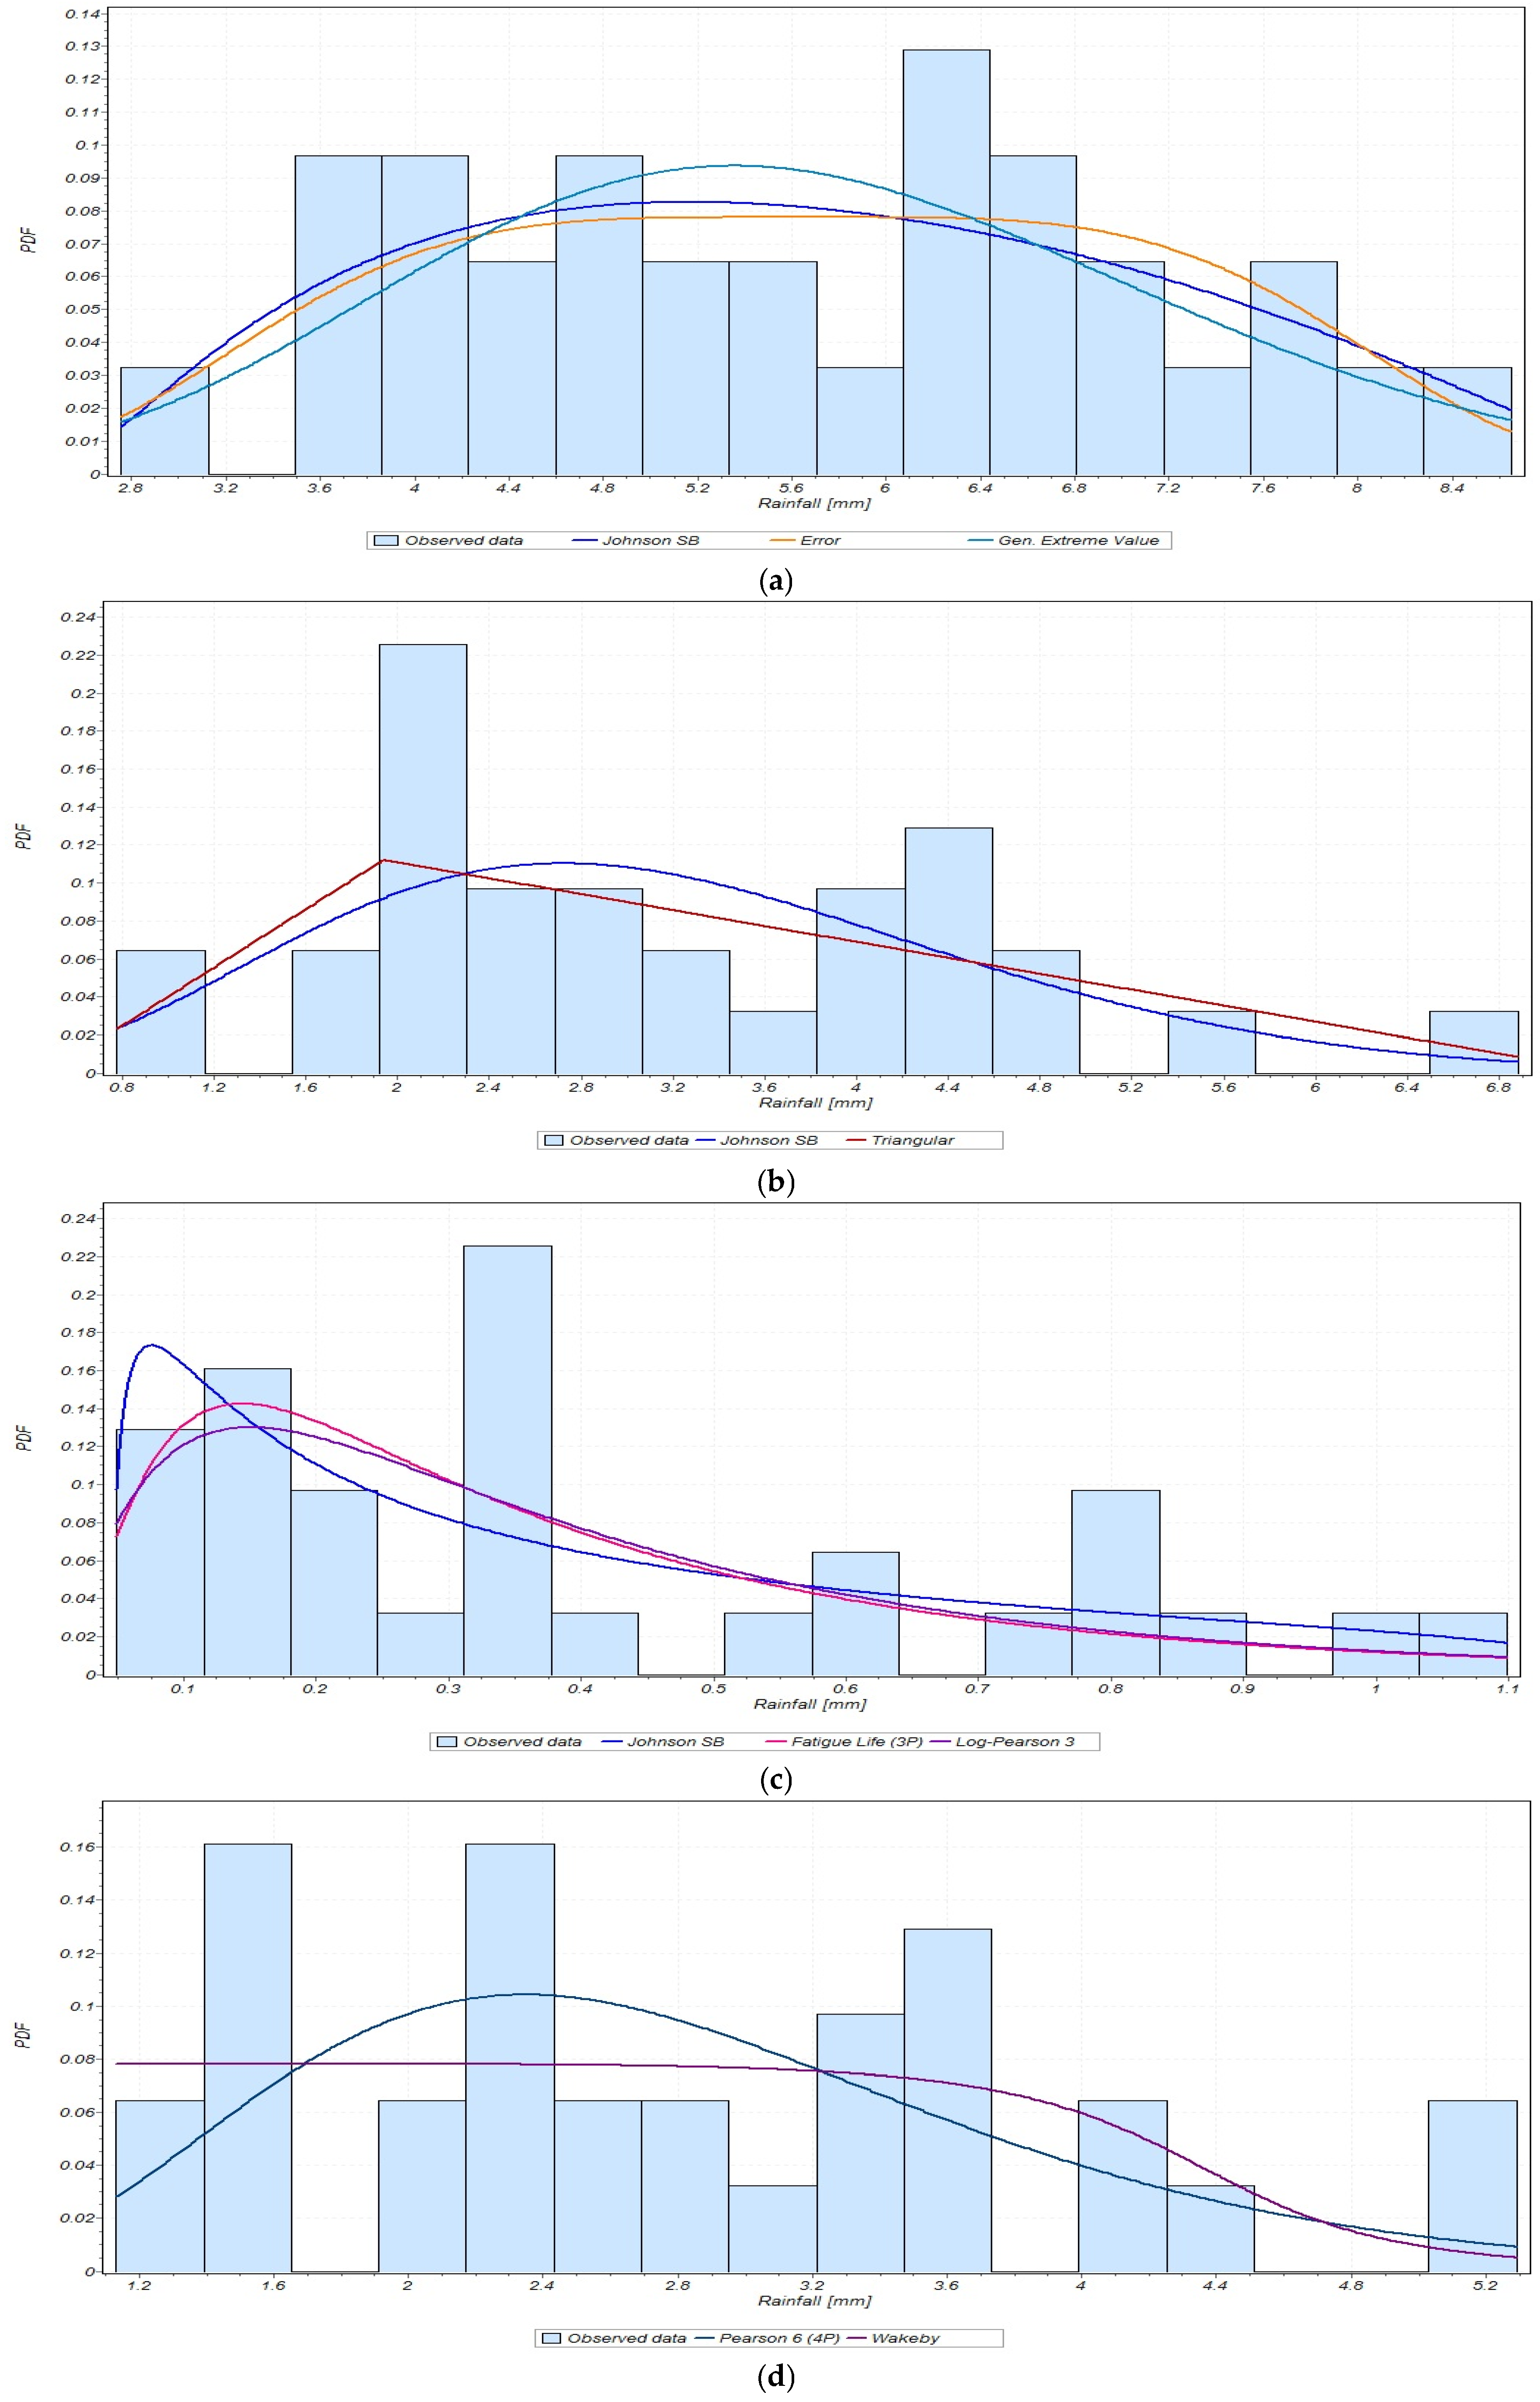
Figure 12 illustrates the frequency histograms and probability plots of seasonal rainfall, respectively.

3.2.2. Selecting the Best-Fit Results for Maximum Daily and Seasonal Rainfall

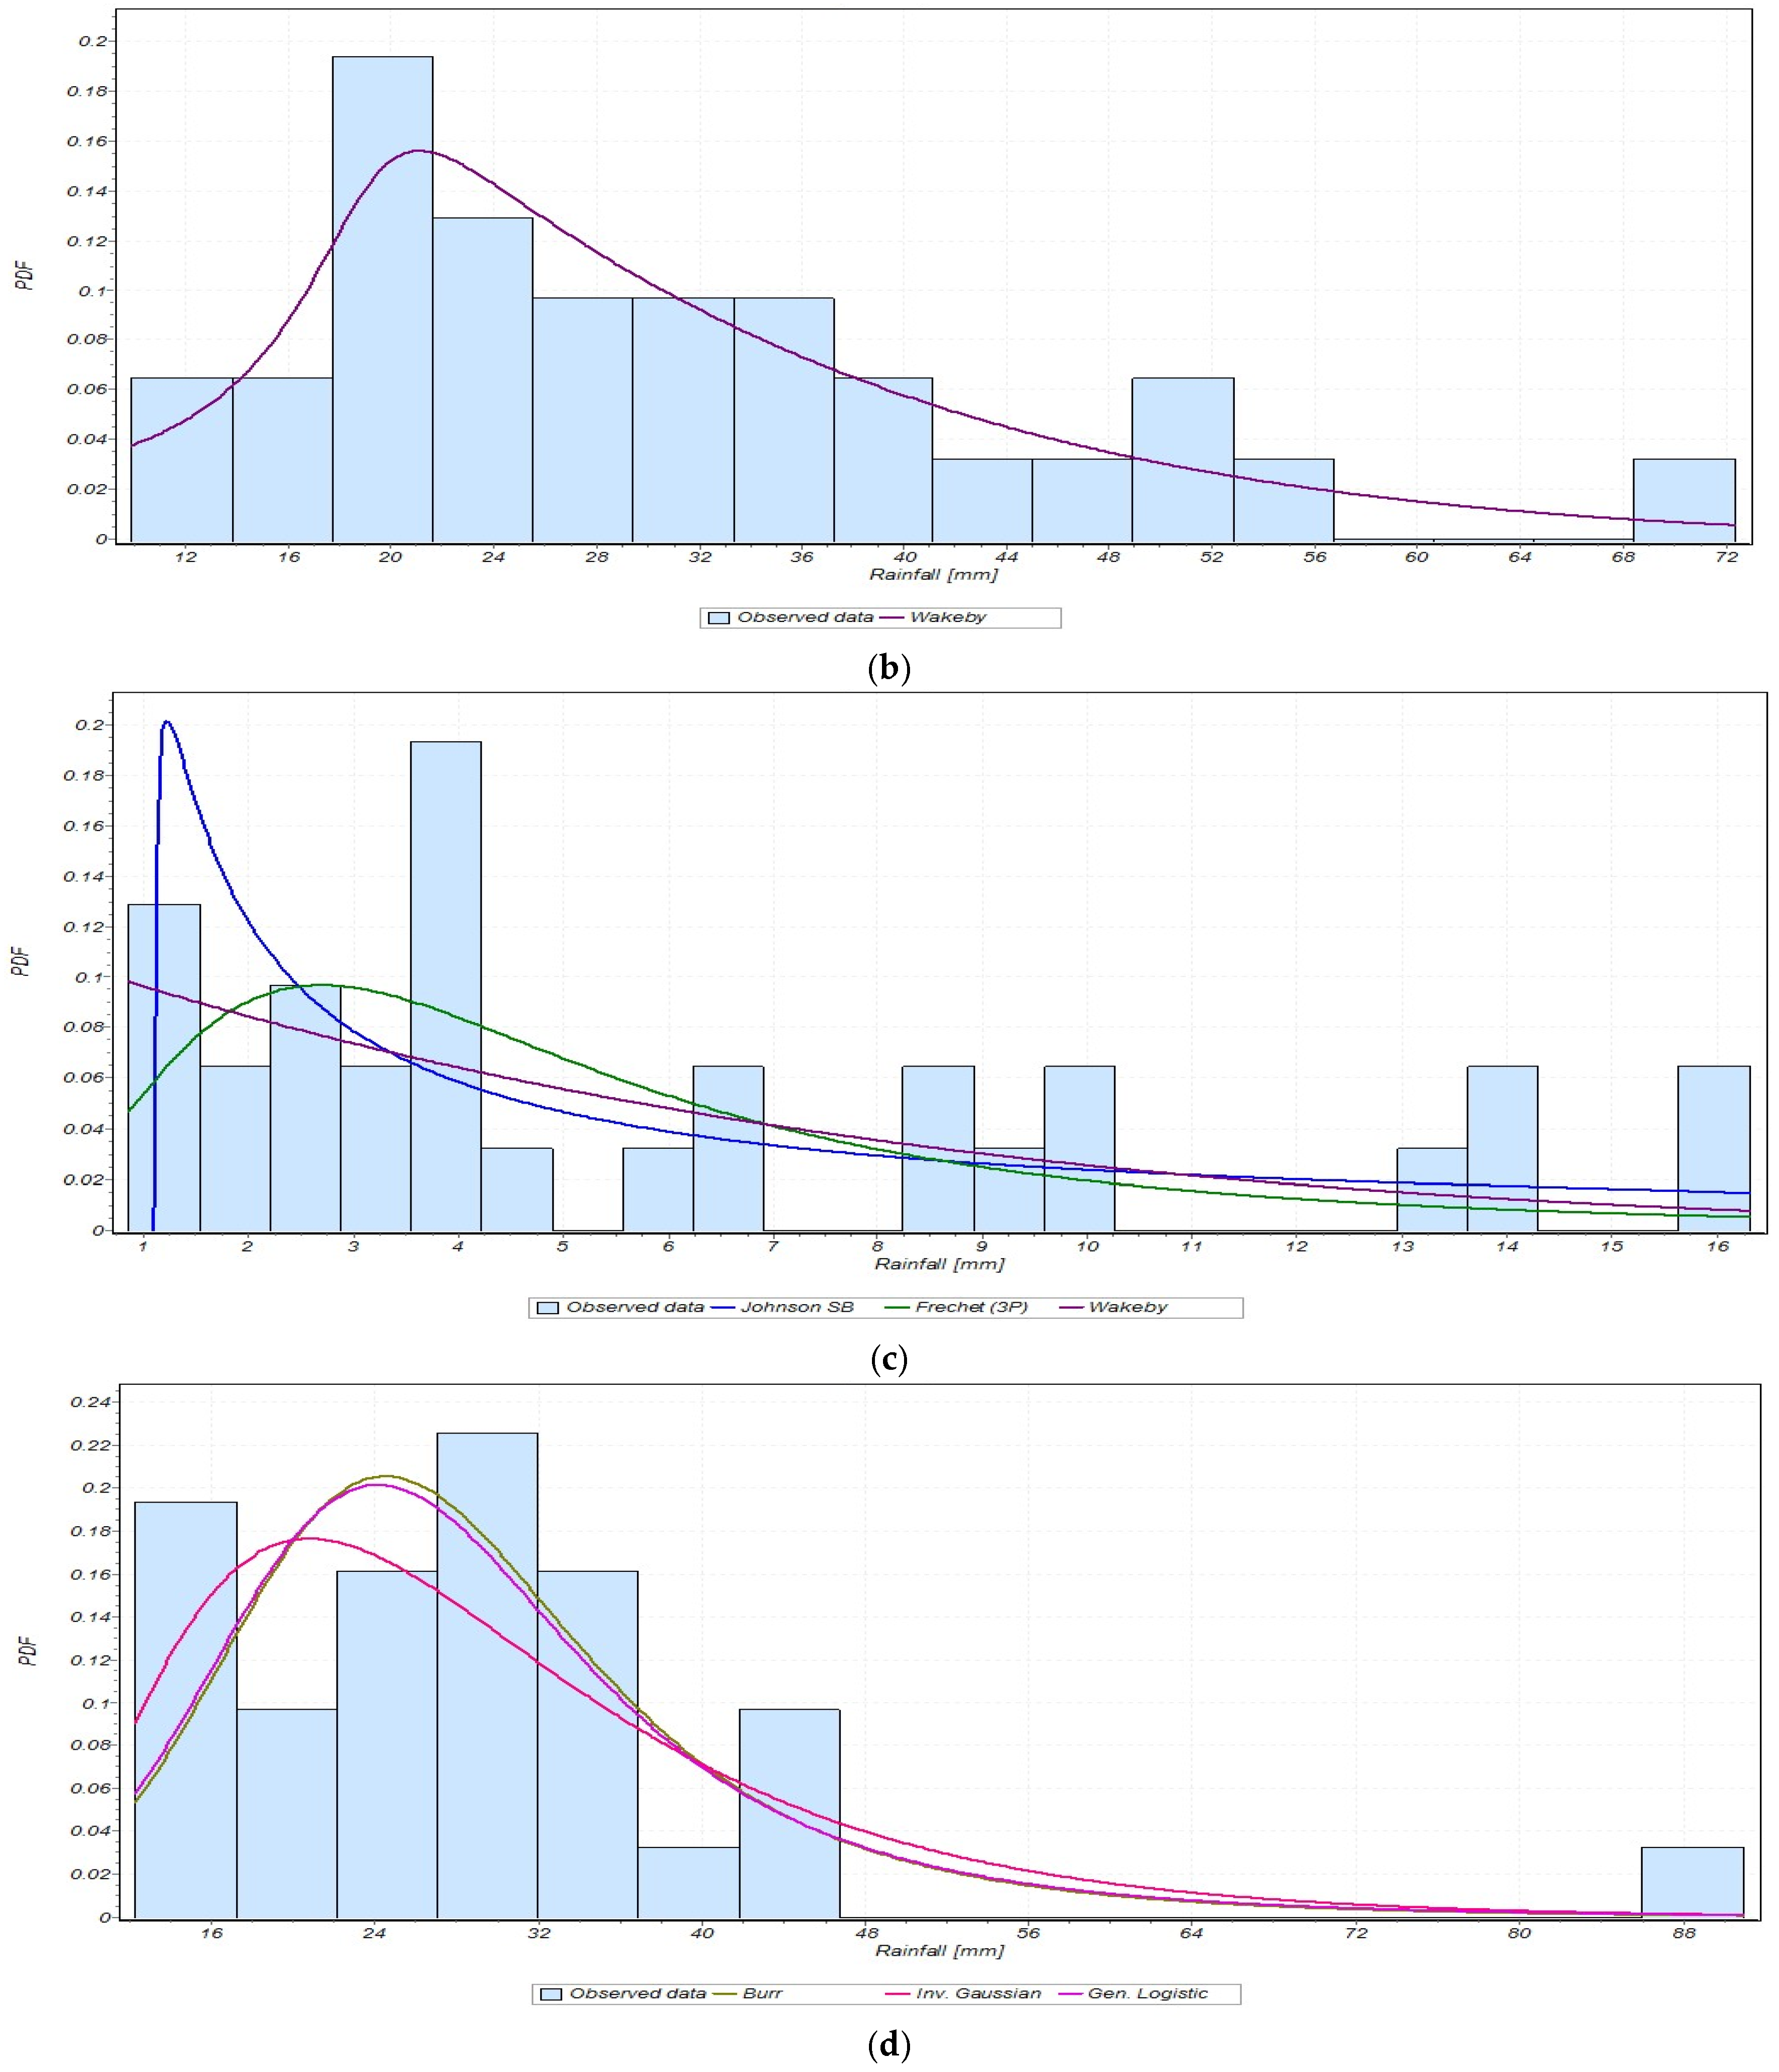
The distribution parameters based on the mean daily rainfall were calculated using the maximum likelihood method. Using the A-D, C-s, and K-S tests, the most suitable distribution was identified among the 65 distribution functions for the selected site. Based on the K-S, A-D, and C-s tests, the optimal distribution function for average and seasonal daily rainfall is listed in Table 10 and Table 11, respectively. The lowest goodness-of-fit result among all the probability distributions developed was referred to as the best-fit result. It was found that the Wakeby distribution promises frequently over several months and seasons; therefore, it appears to be an excellent fit for characterizing a range of rainfall data patterns. The Johnson SB, Log-Pearson 3, Frechet (3P), and General Logistic distributions further demonstrate their ability to capture various rainfall trends by appearing frequently. Additionally, the probability plots and frequency histograms of the maximum seasonally daily rainfall are shown in Figure 13. According to previous studies, these functions are often used due to their adaptability in fitting skewed and restricted data [136,137]. As a result, they are ideal for assessing rainfall, which often exhibits sharp seasonal variations [136,137].

3.3. Potential Rainwater Harvesting

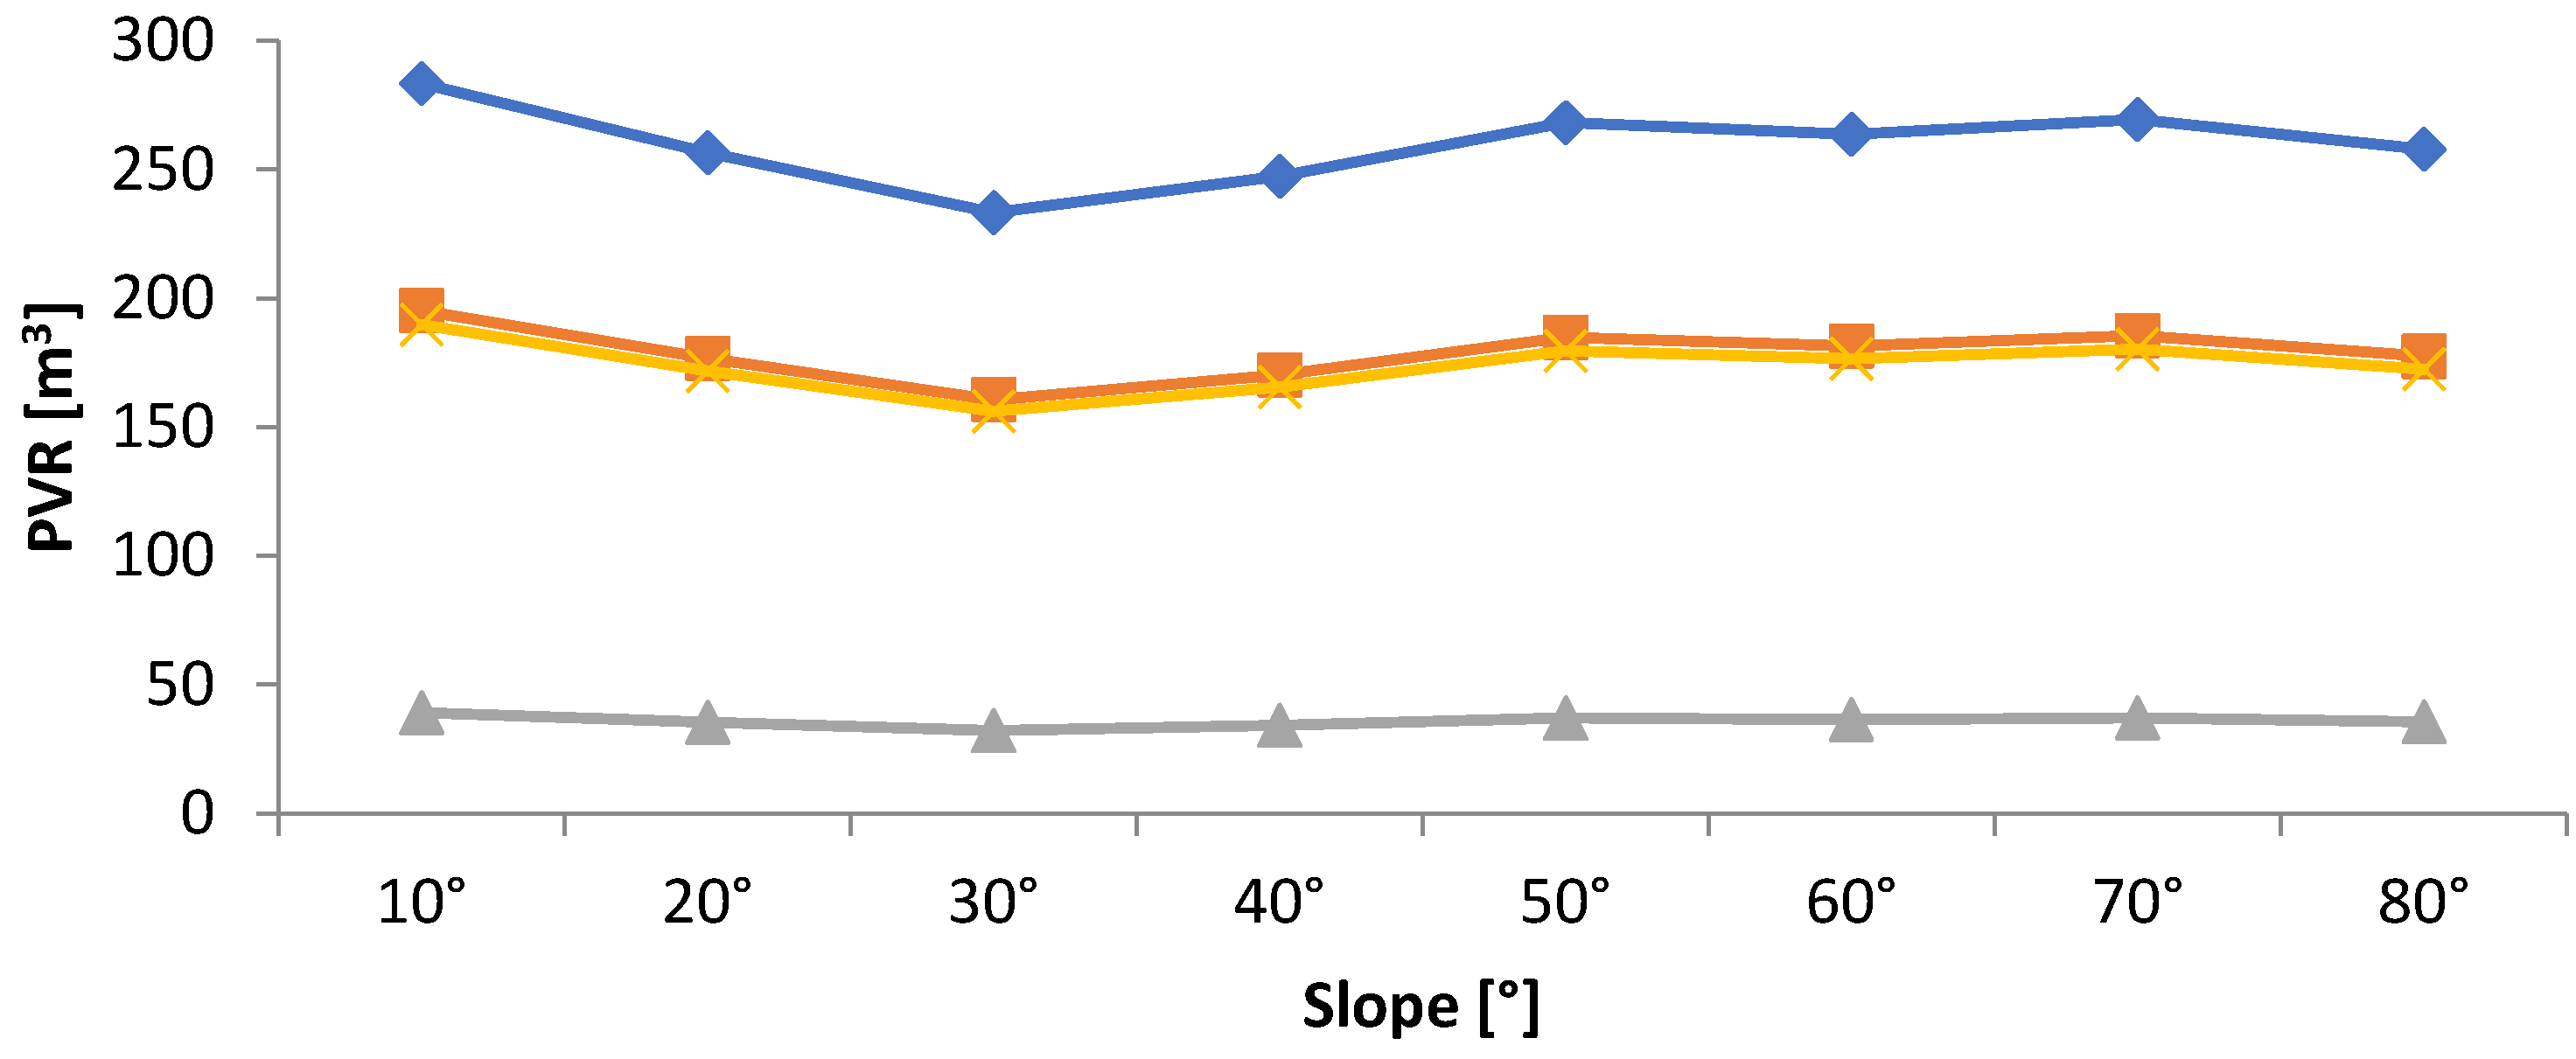
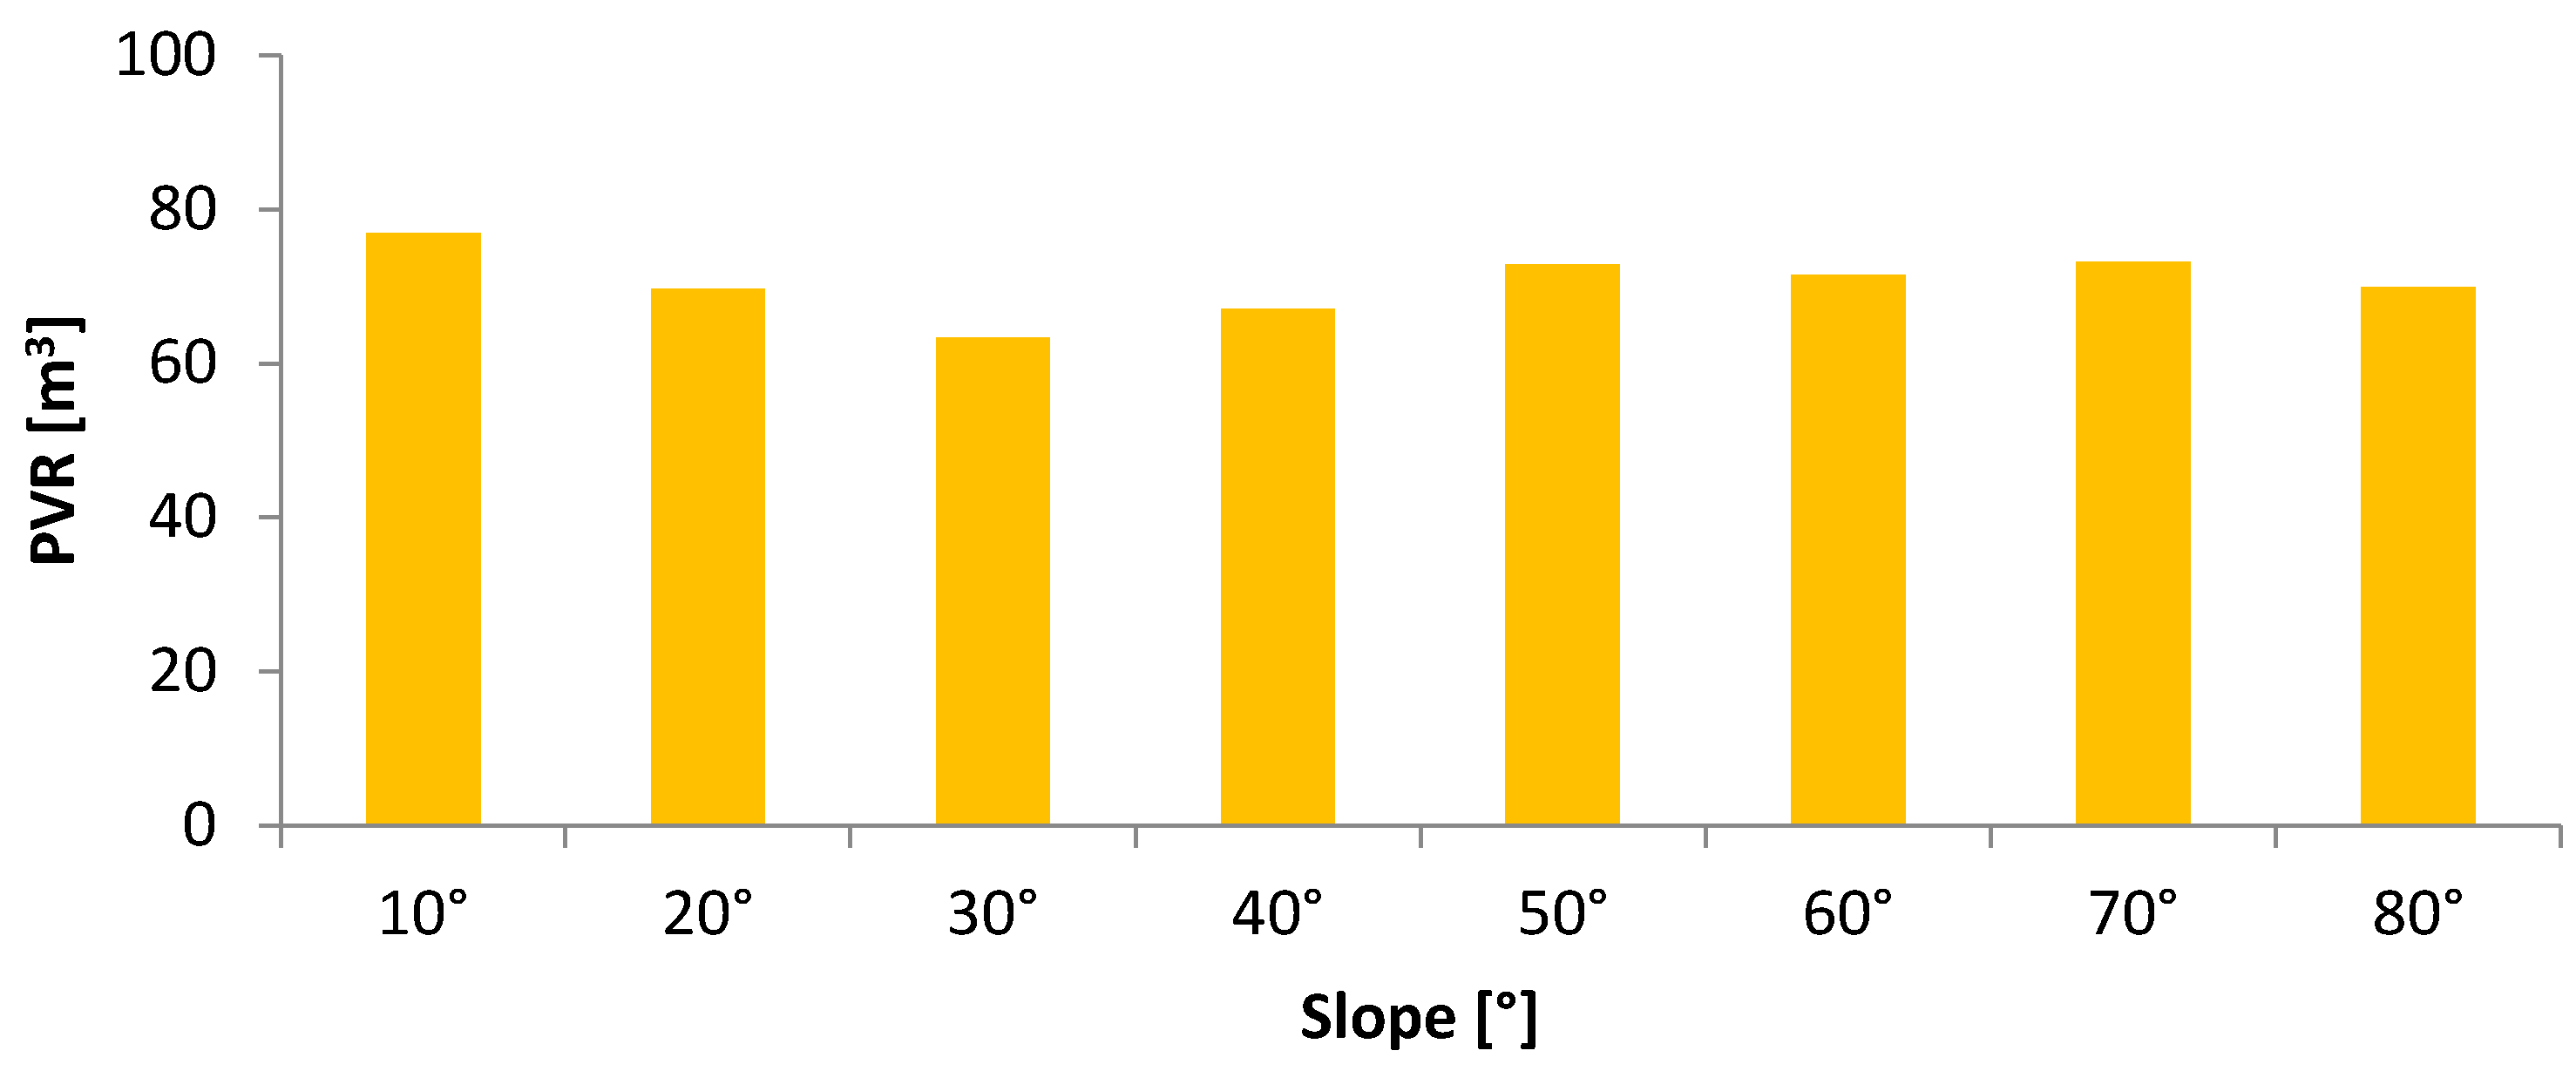
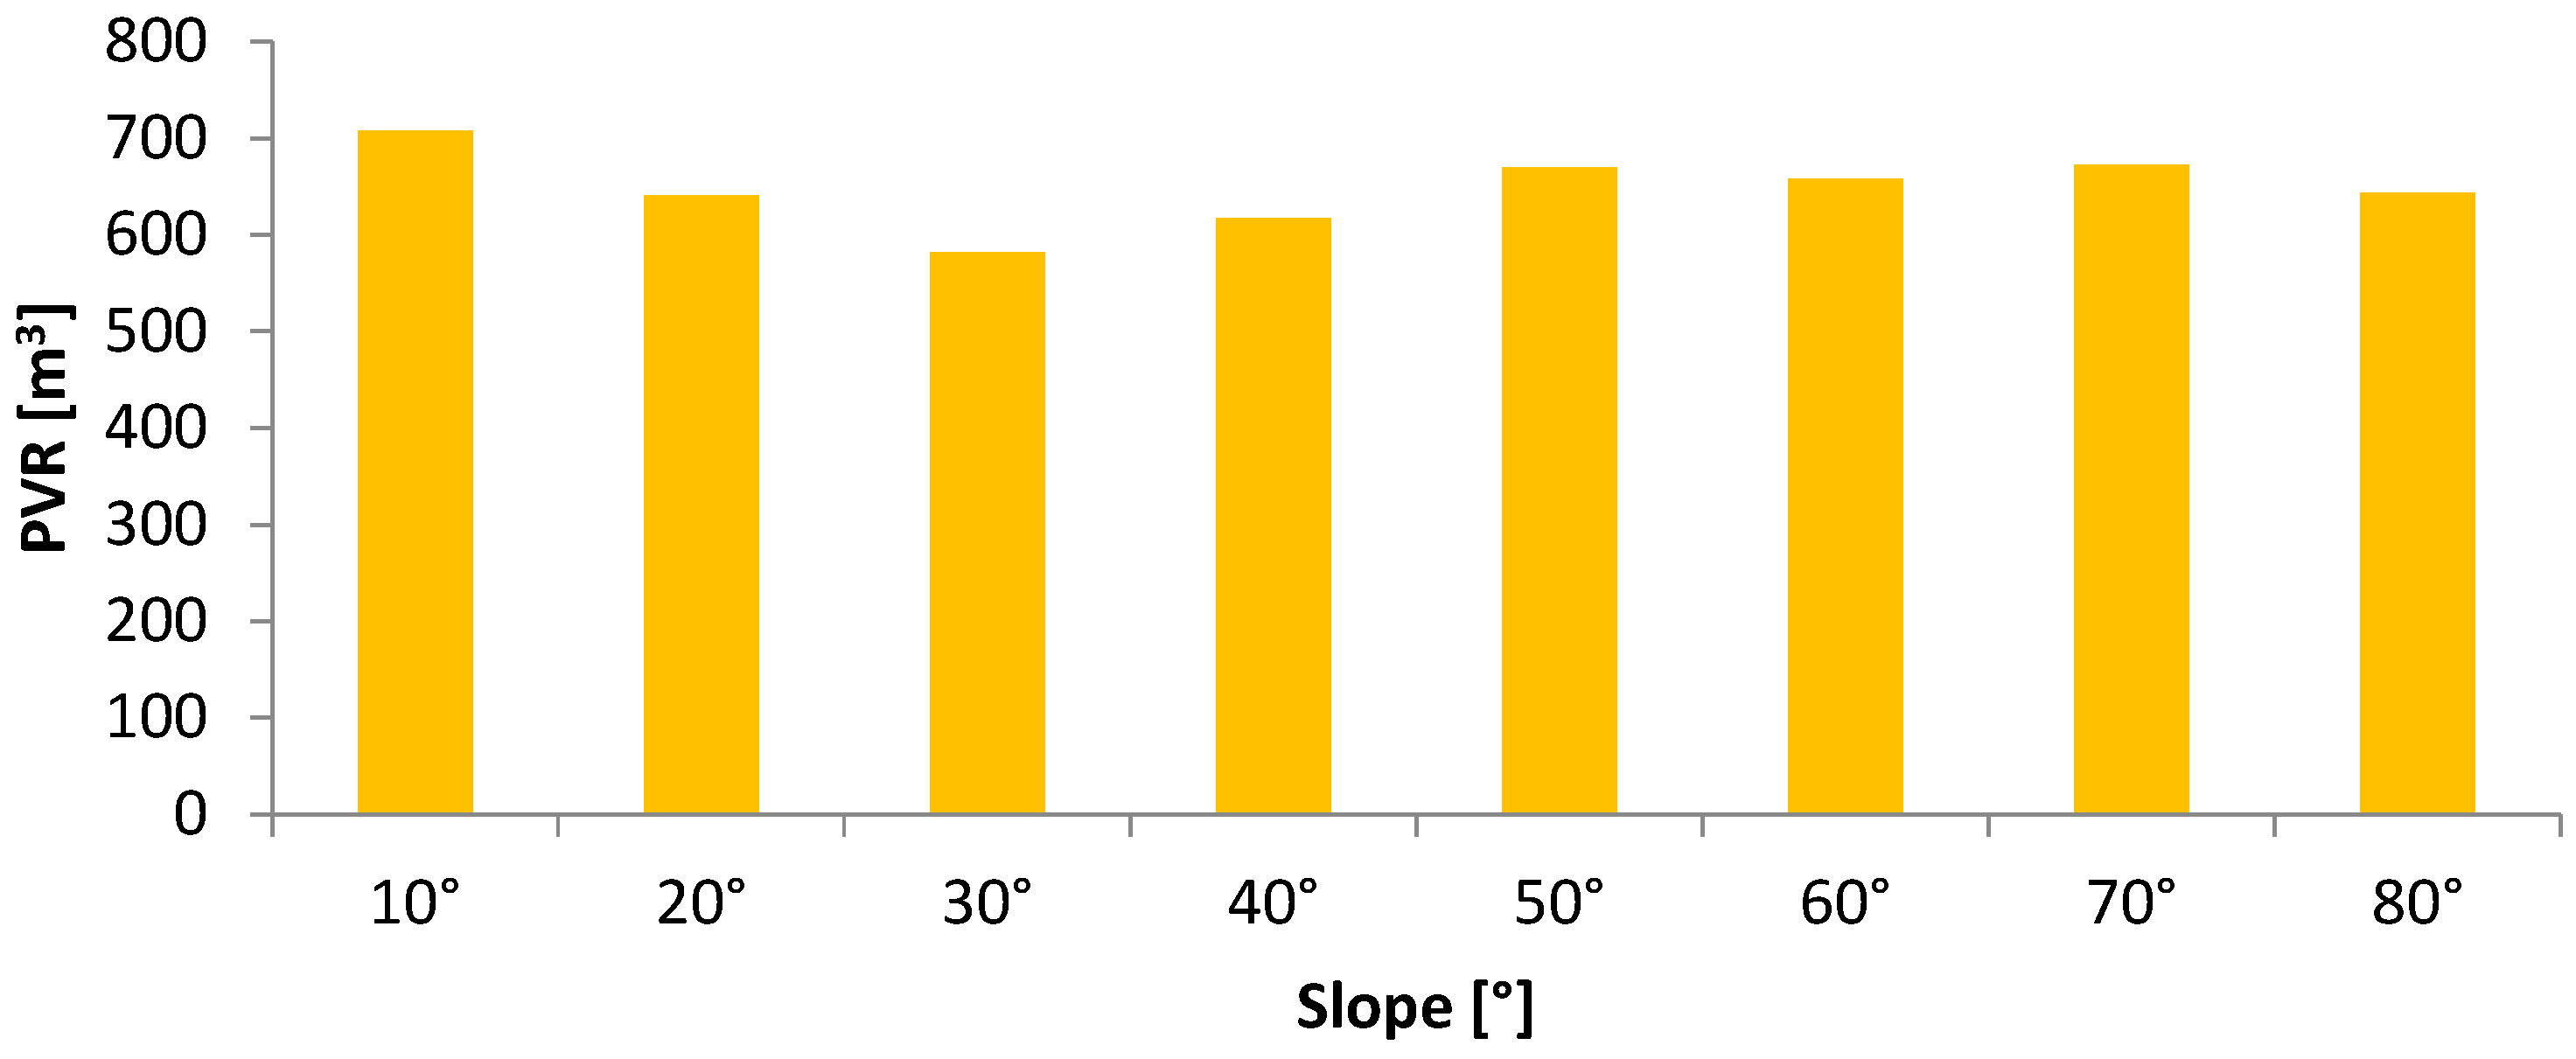
The P V R is determined by utilizing Equation (15). Figure 14 and Figure 15 show the potential water that could be harvested at the selected location based on the average and maximum daily rainfall with various tilt angles of PV panels, respectively. The annual rainwater that can be gathered from the rooftop of the selected building is shown in Figure 16 and Figure 17 based on the average and maximum daily rainfall with various tilt angles of PV panels, respectively. These figures provide the following results:
  • It is found that the value of rainwater that can be collected from the roof of the selected building is 30–36 m3, 17–20m3, 2–3 m3, and 15–18m3 for winter, spring, summer, and autumn, respectively, based on the average daily data.
  • Based on the maximum daily statistics, it is determined that the amount of rainwater that can be gathered from the rooftop of the building selected is 283–233 m3, 195–161 m3, 39–32 m3, and 190–156 m3 for winter, spring, summer, and fall, respectively.
  • Besides, the highest of 36 m3 and 283 m3 of rainwater that can be collected from the roof of the selected buildings at the tilt angle of 10° is found in the winter season.
  • Moreover, the annual rainwater that can be gathered from the rooftop is estimated to vary from 77 m3 to 63 m3, with an average of 71 m3, based on the average daily data and from 708 m3 to 582 m3, with an average of 649 m3, based on the maximum daily data.
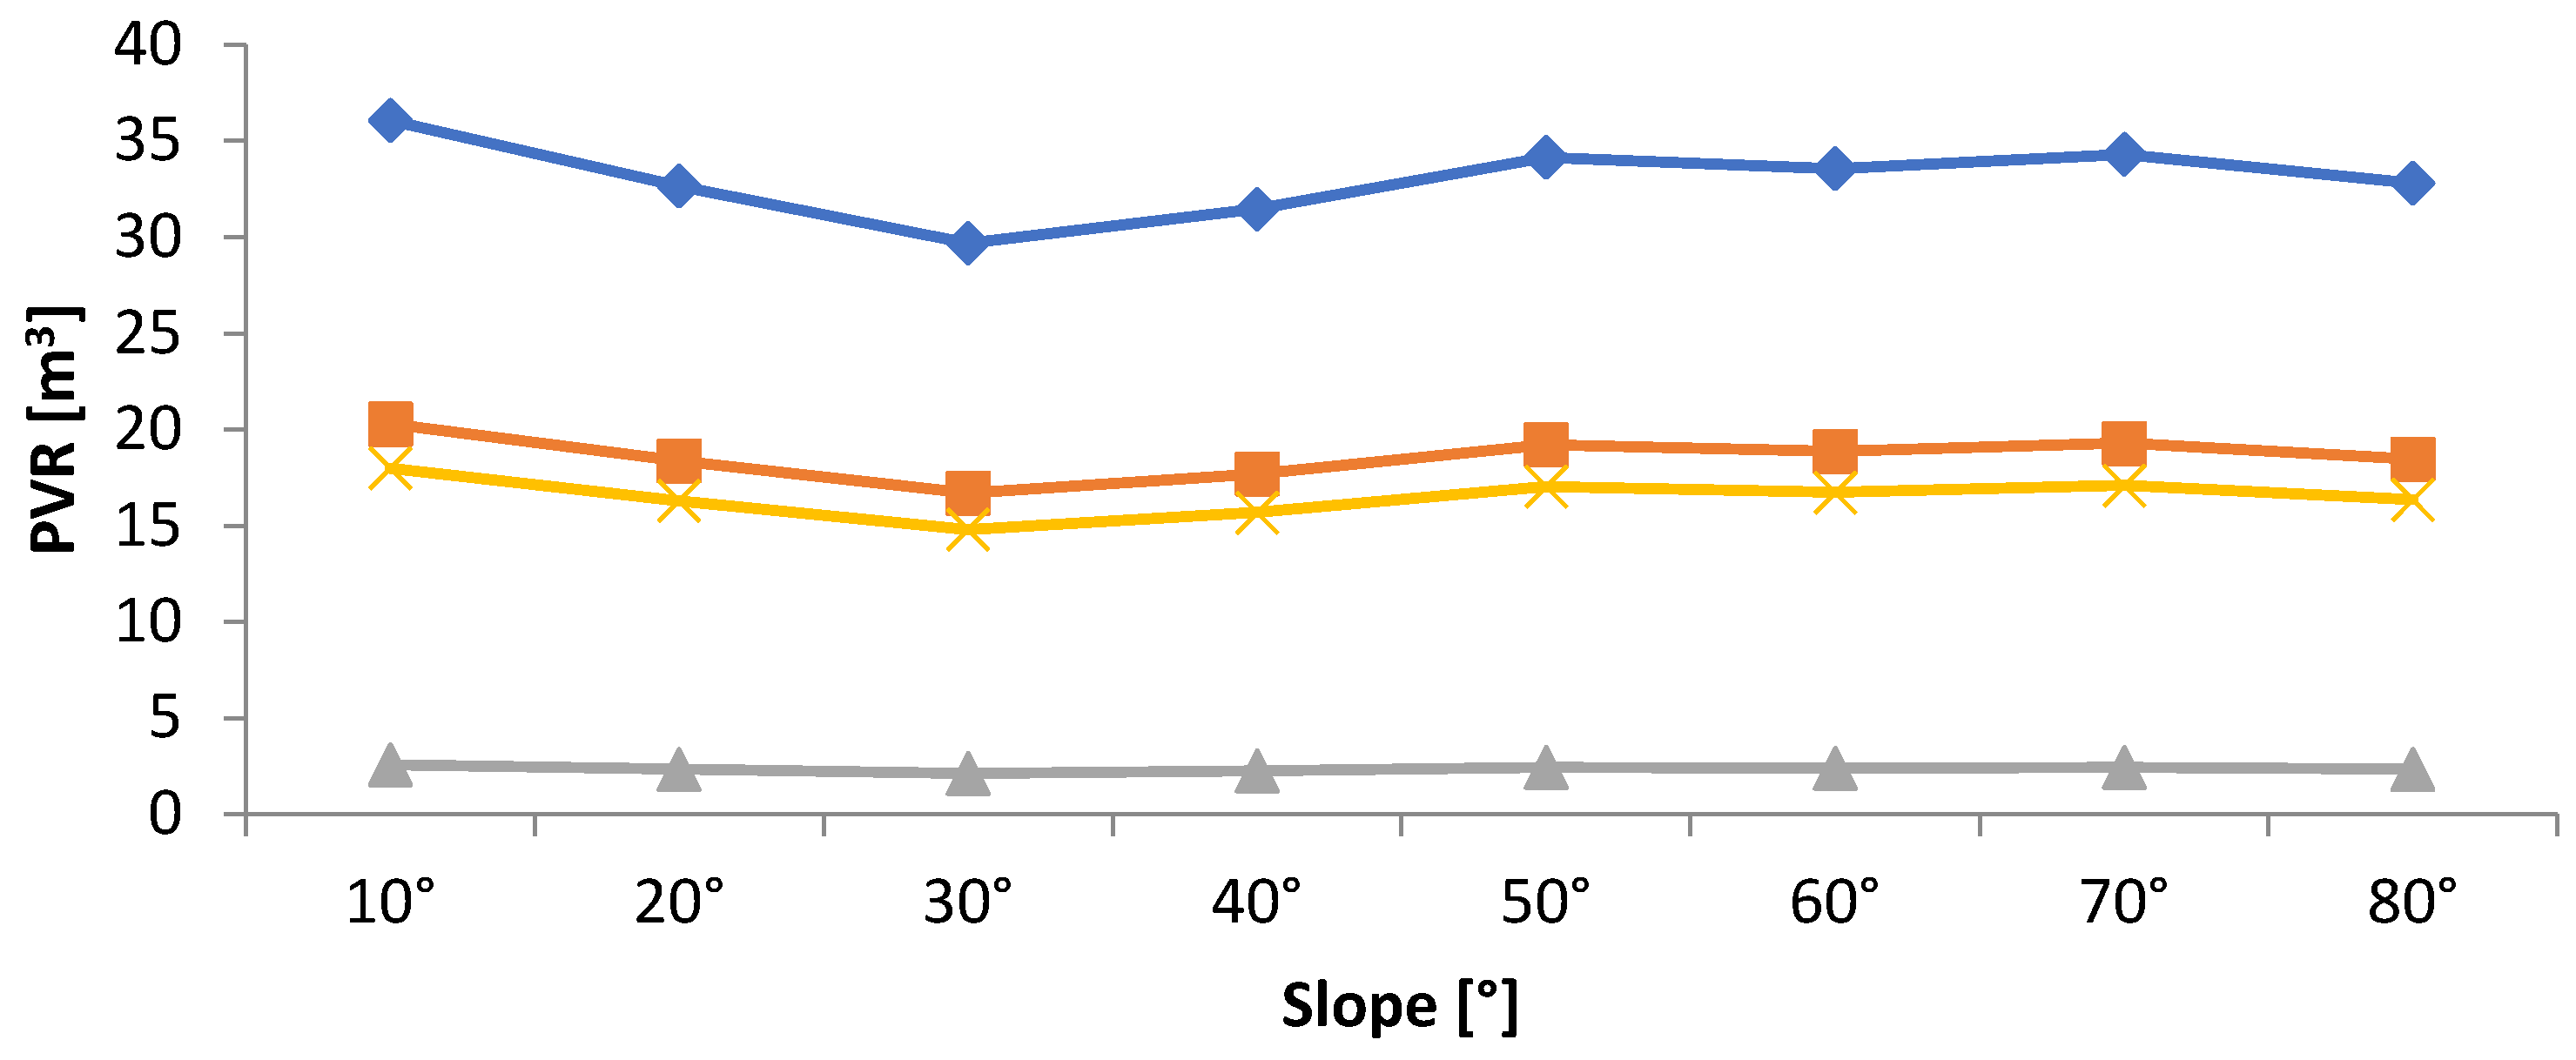
Figure 14. Seasonal variation in potential water that could be harvested in the selected locations with various tilt angles based on average daily rainfall data.
Sustainability 17 08508 g014
Figure 15. Seasonal variation in potential water that could be harvested in the selected locations with various tilt angles based on the maximum daily rainfall data.
Sustainability 17 08508 g015
Figure 16. Annual value of potential water that could be harvested at the selected location with various tilt angles based on average daily rainfall data.
Sustainability 17 08508 g016
Figure 17. Annual value of potential water that could be harvested at the selected location with various tilt angles based on the maximum daily rainfall data.
Sustainability 17 08508 g017
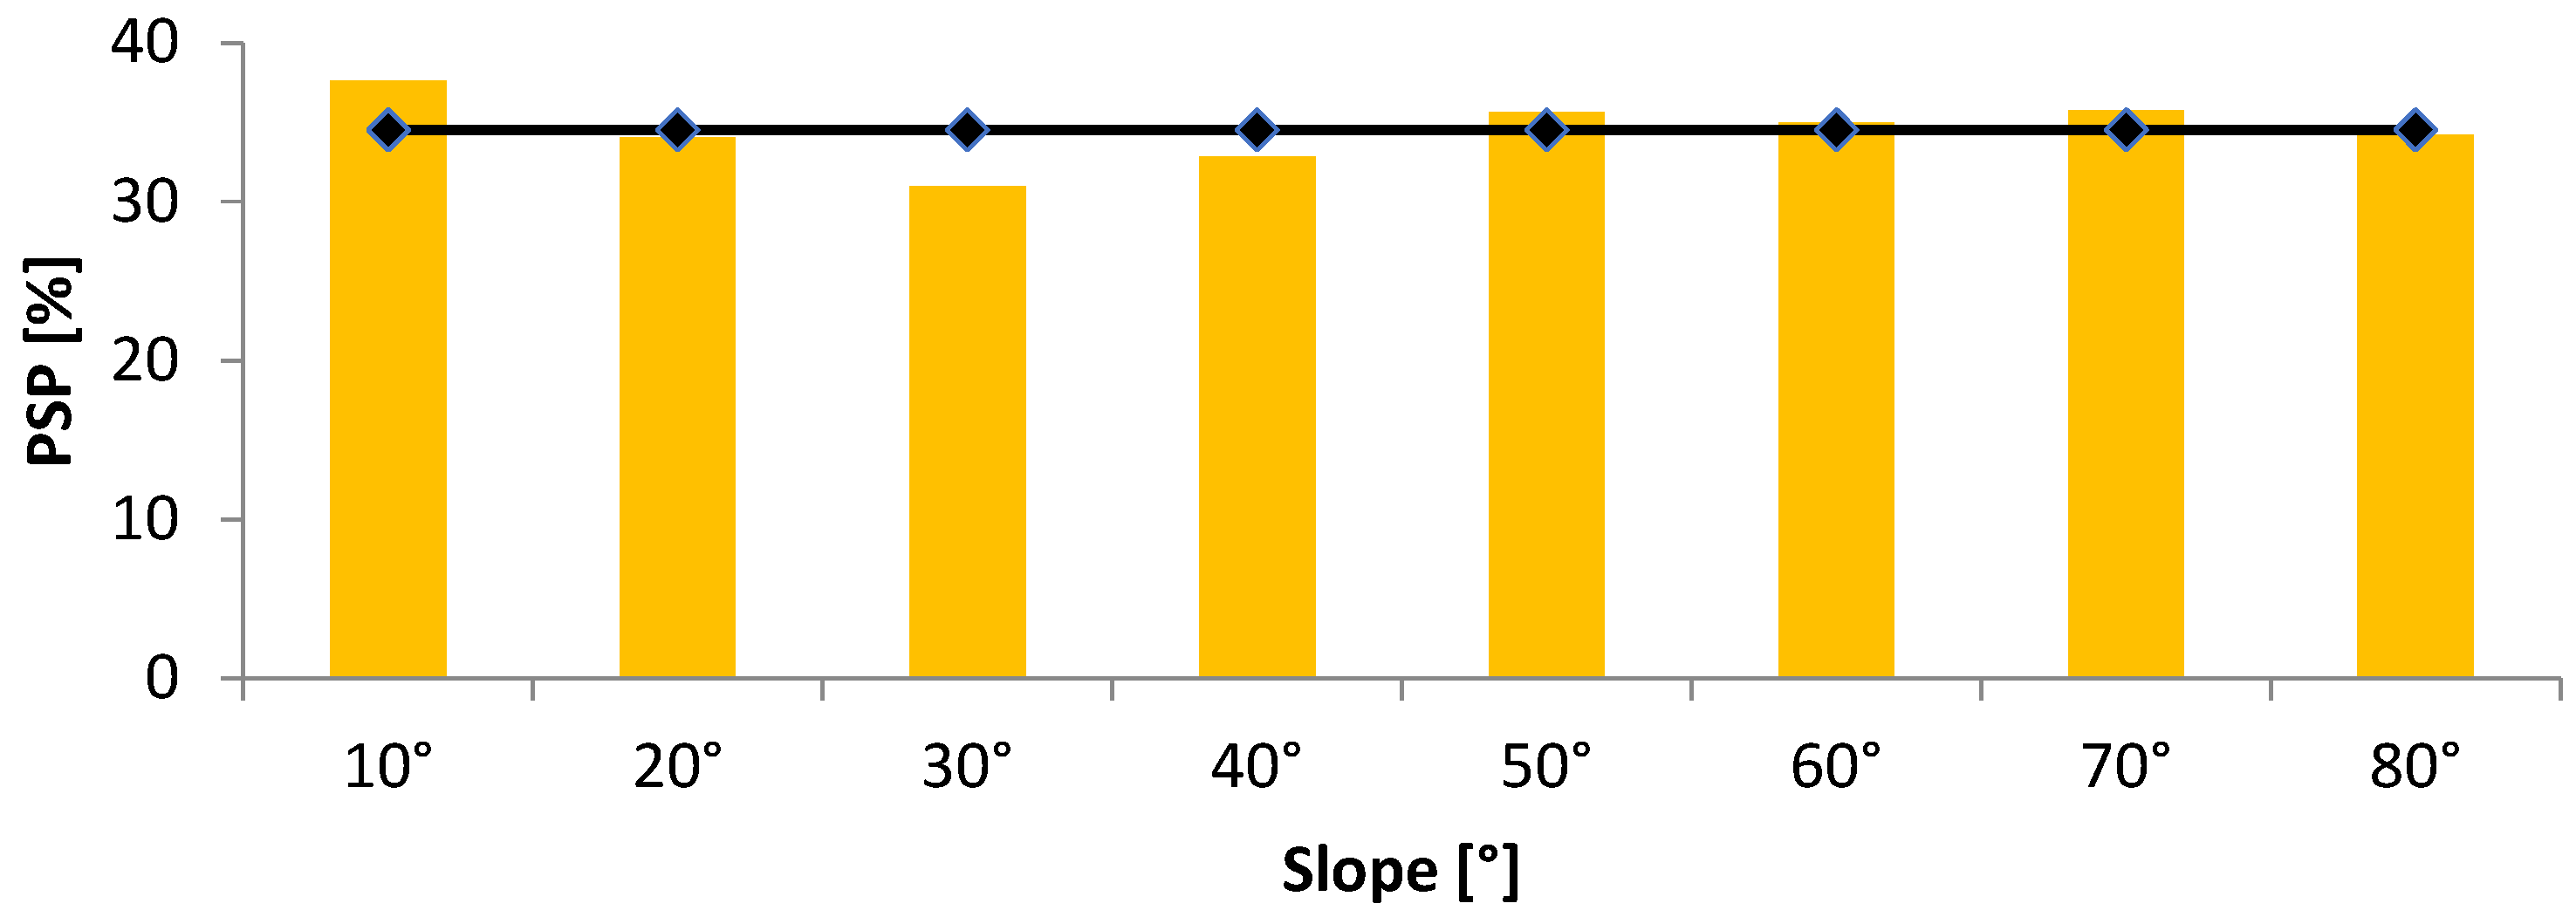
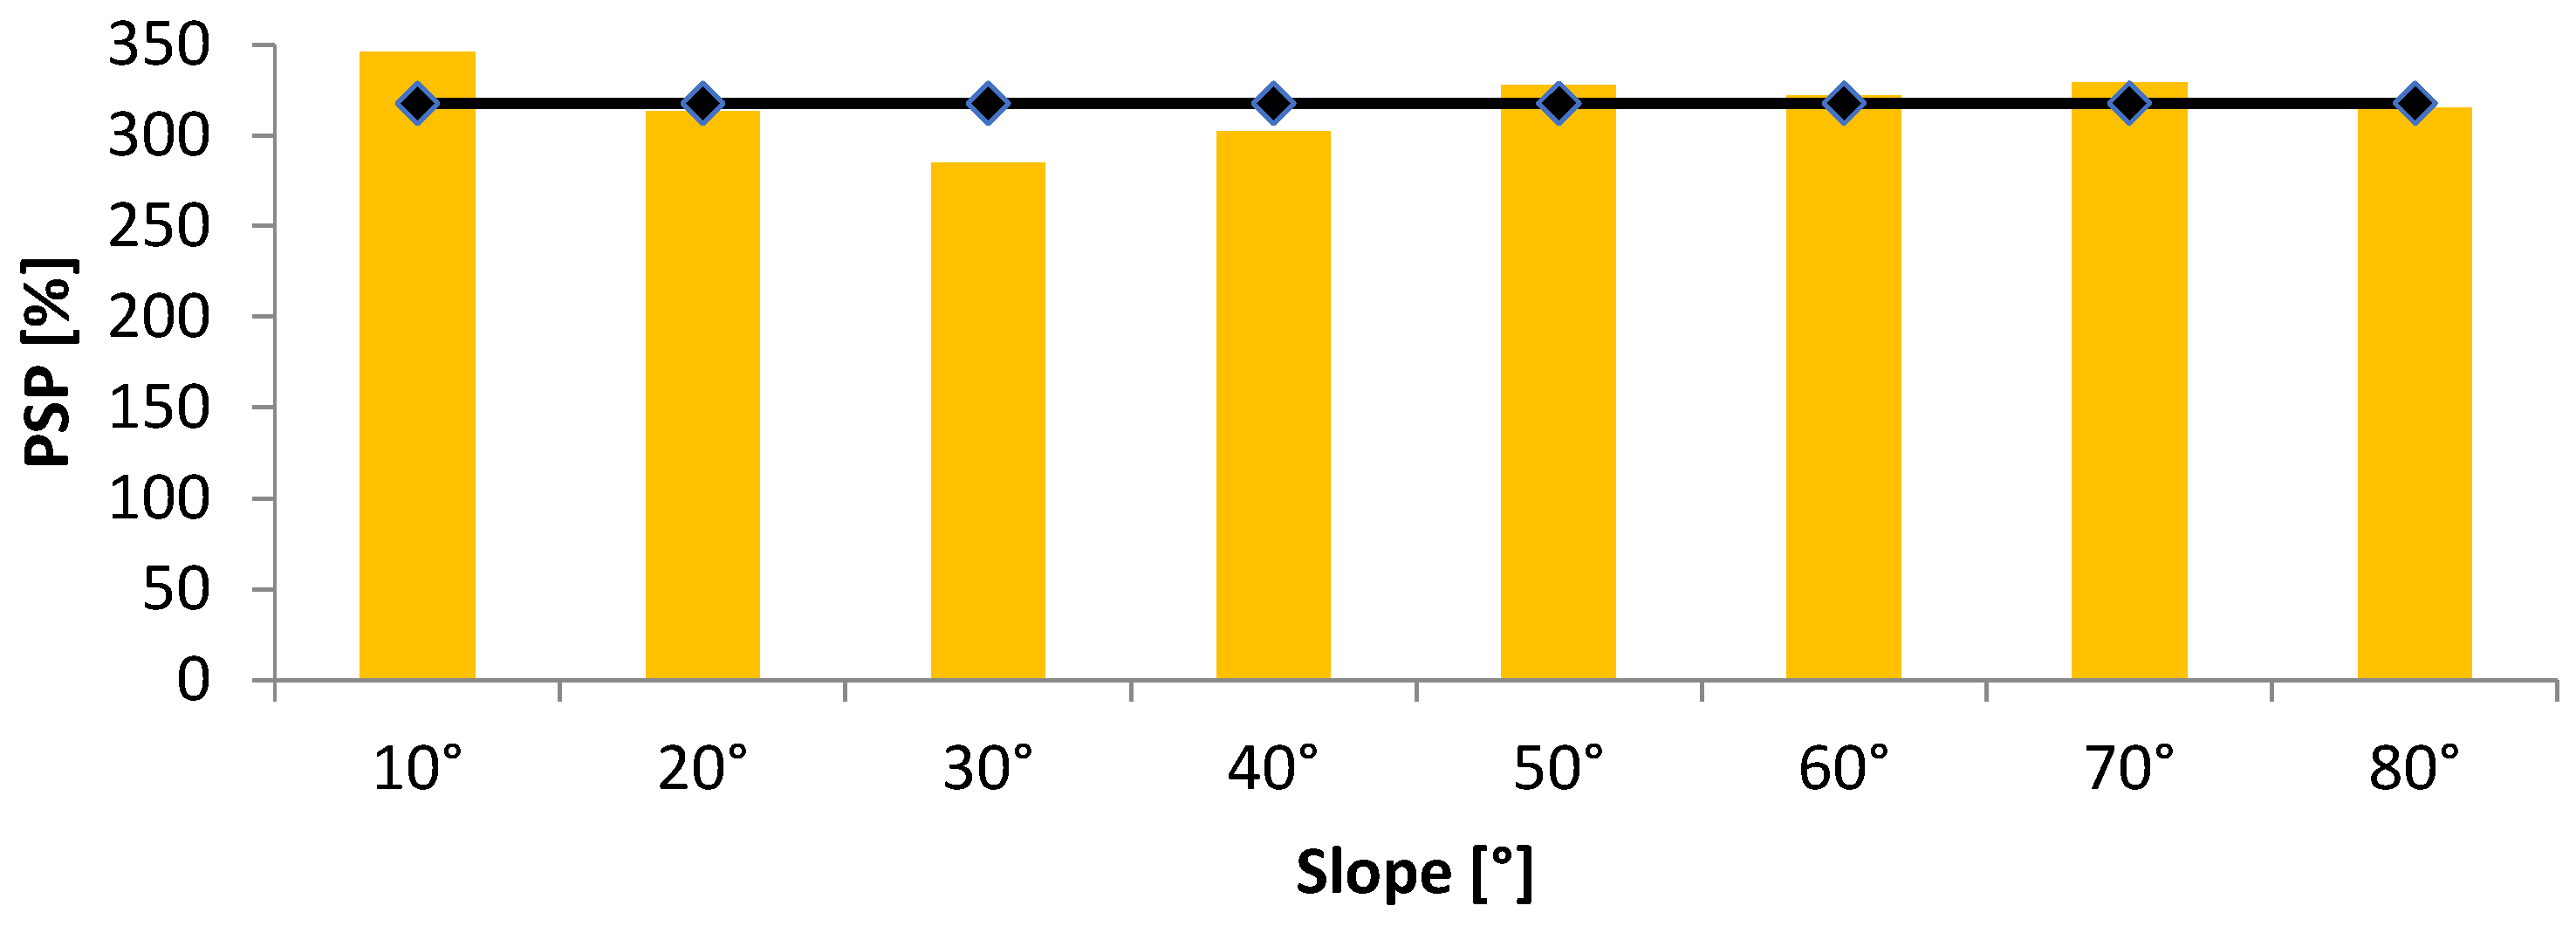
Furthermore, as mentioned previously, the total amount of water needed for irrigation is estimated to be 204 m3/year for the selected building. Based on average versus maximum daily rainfall data, the results show considerable variation in the rainwater harvesting (RWH) system’s potential supply performance (PSP), particularly for residential buildings. The RWH system may supply 31% to 38% of the chosen building’s yearly irrigation water demand (204 m3/year), taking into account the average daily rainfall (Figure 18). This implies that the system contributes somewhat, but significantly, to the irrigation requirements under normal rainfall conditions. On the other hand, a significantly larger PSP, ranging from 285% to 346%, is seen when maximum daily rainfall data is used (Figure 19). This suggests that the RWH system may be able to gather far more water during periods of high rainfall than the yearly requirement for irrigation, possibly creating an excess that could be saved for later use or put to other non-potable uses.
These results demonstrate the need to install rainwater harvesting systems, especially in urban areas, where water resources are often needed for the irrigation of green spaces. By capturing rainfall, RWH systems can reduce dependency on conventional water sources and provide a sustainable alternative for meeting irrigation requirements. According to previous studies [138,139,140,141], the reviewed literature emphasizes the importance of RWH in urban settings in promoting sustainable water management and reducing reliance on municipal water supply. For instance, RWH can mitigate the negative impacts of urbanization on hydrology, particularly in regions with limited water supplies [138]. In Barcelona’s single-family and multi-family buildings, Domènech and Saurí [139] found that RWH was both economically viable and provided significant drinking water savings. Ndeketeya and Dundu [140] demonstrated that RWH can enhance water security and promote sustainable urban growth in South African cities. RWH is particularly helpful for low-demand applications and lowers the quantity of potable water utilized for non-drinking purposes, according to Fernandes et al. [141].

3.4. Techno-Economic Feasibility of the Proposed System

3.4.1. Optimum Tilt and Azimuth Angle of the Proposed System

To optimize their exposure to sunlight, the panels are arranged in rows, depending on the structure’s location. These angled rows allow for efficient solar absorption, which could lead to increased energy production. Therefore, RETScreen is used to estimate the optimal azimuth and tilt angle.
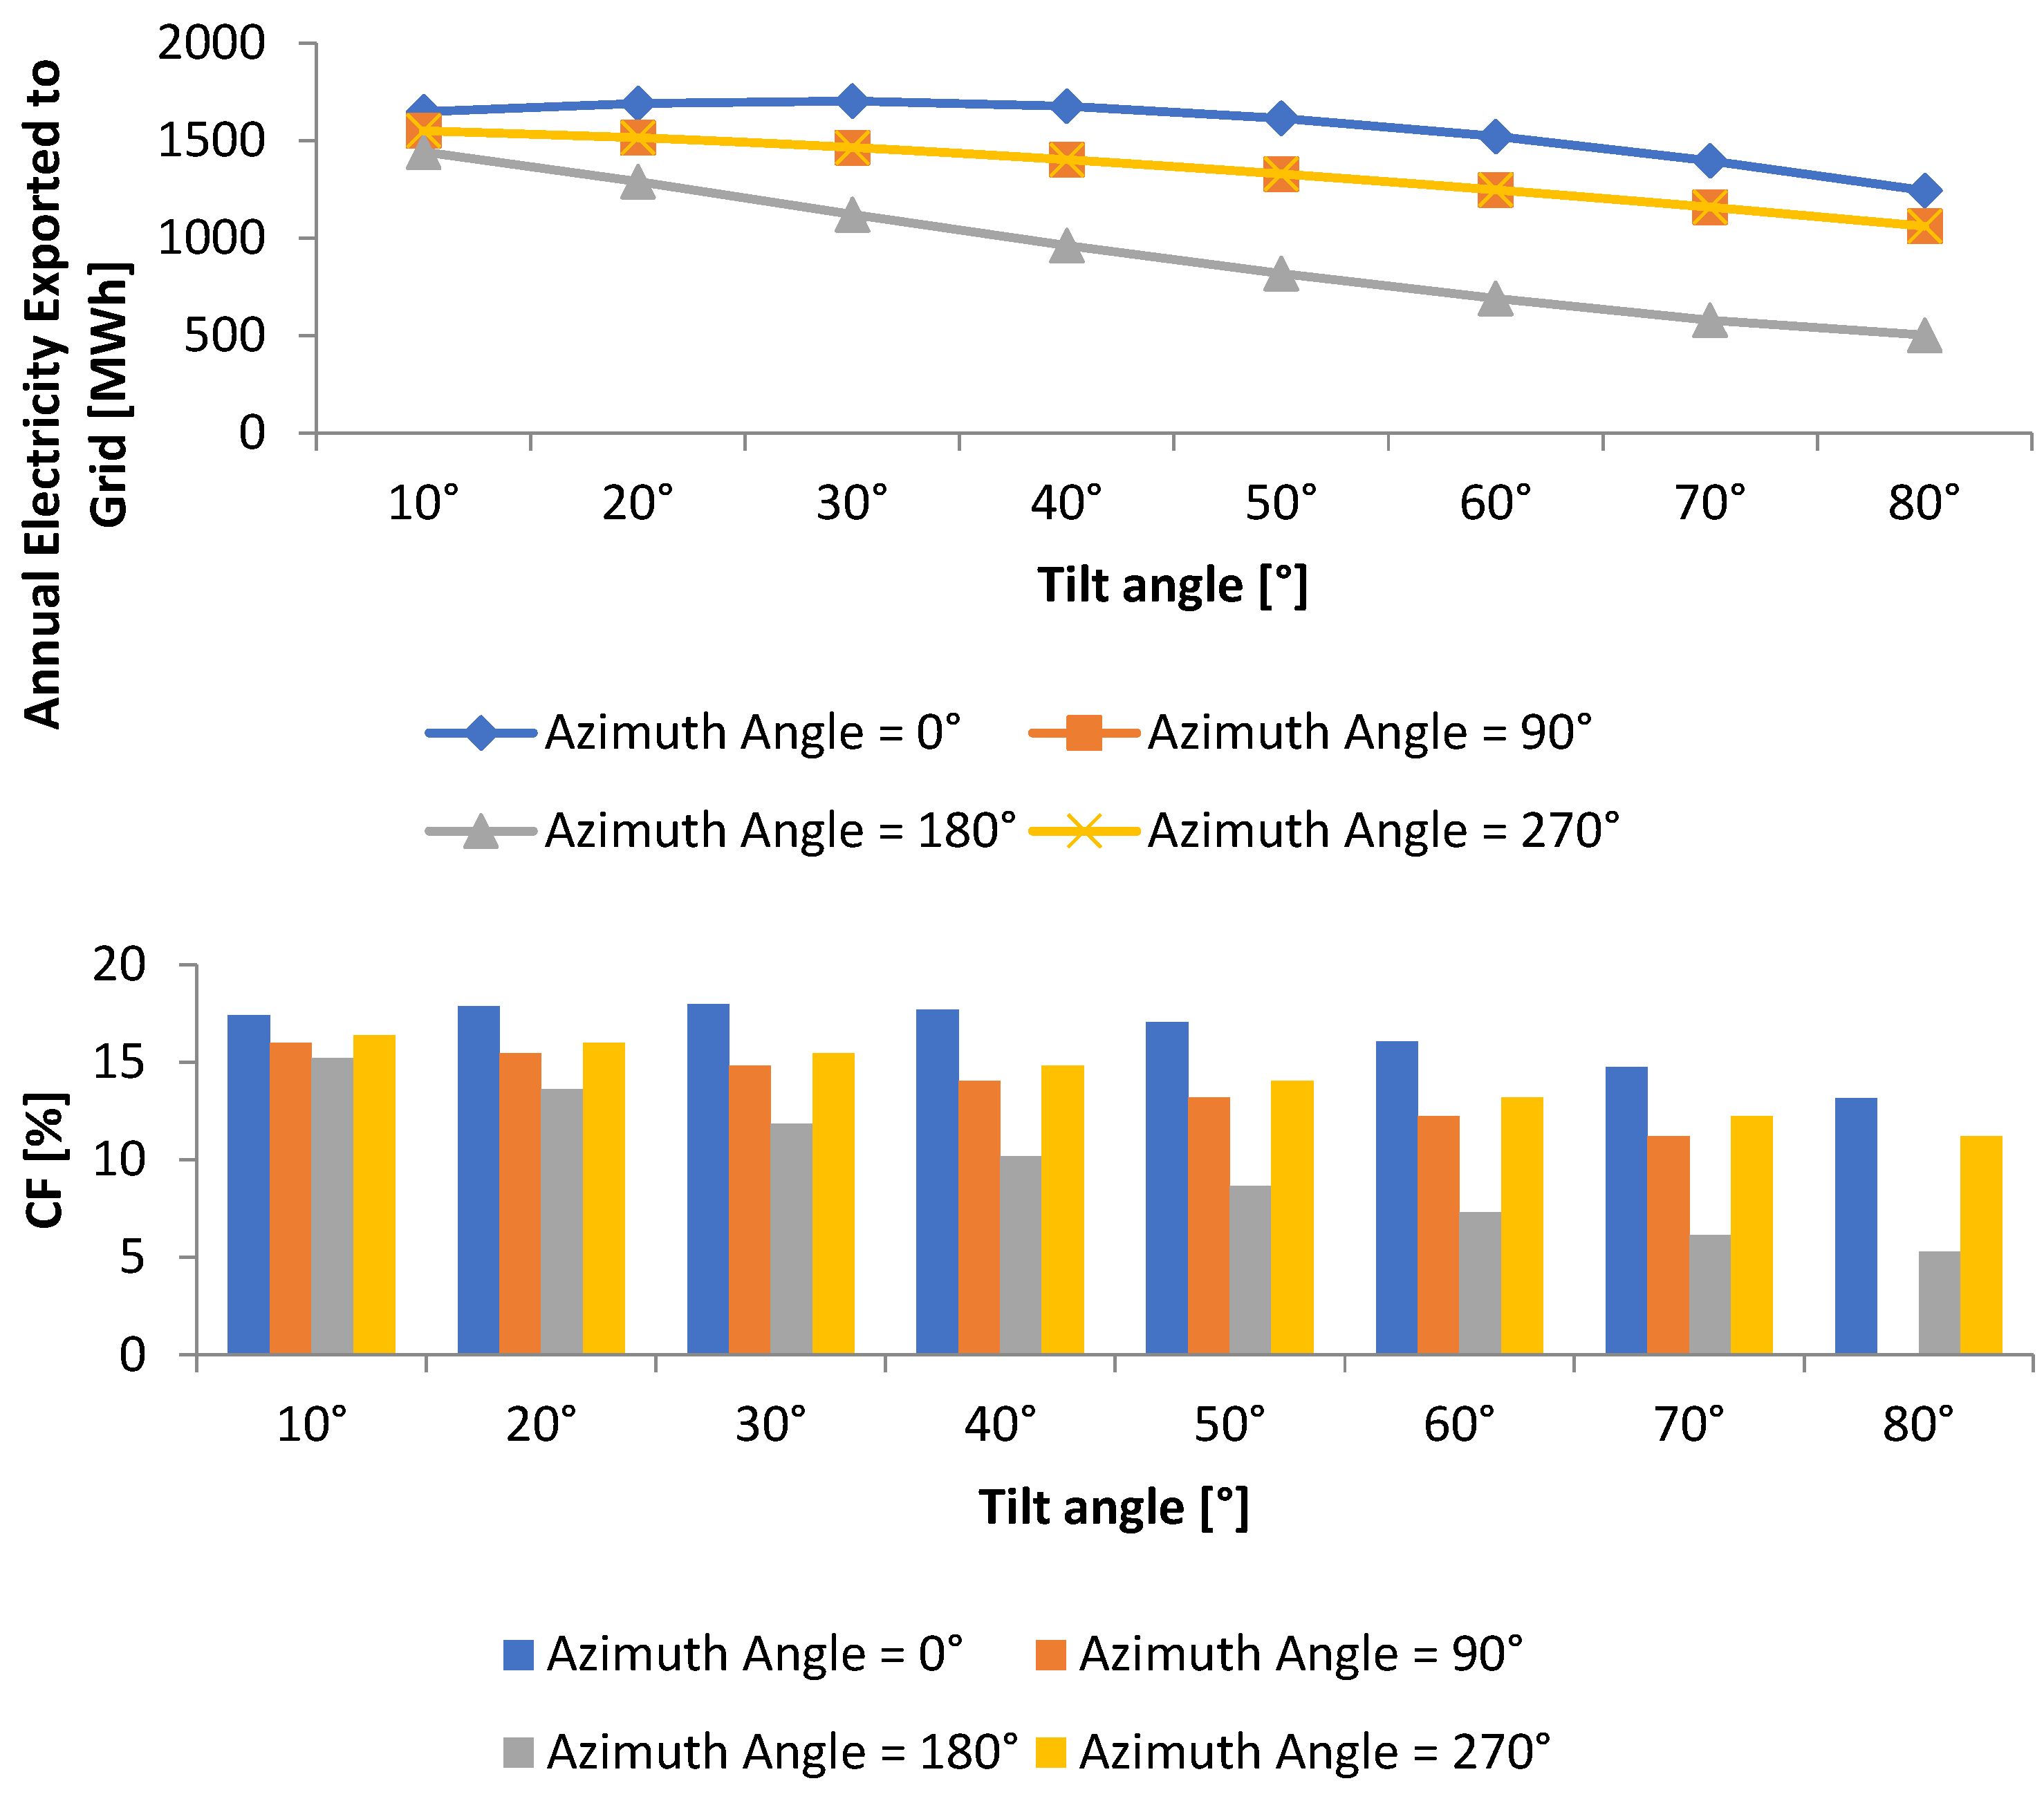
Moreover, it should be noted that as the tilt degree increases, the roof may accommodate additional solar panels, boosting the system’s energy-generating potential. However, the optimal tilt angle is determined based on the annual electricity exported to the grid. It was determined that the highest values of capacity factor (CF) and maximum amount of power were generated at an optimal tilt angle of 30° and 10°, respectively, when the azimuth angle was 0° (north-facing) and 180° (south-facing), as shown in Figure 20. The best tilt angle for generating the most electricity in east–west orientations was also 10° for azimuth angles of 90° (east-facing) and 270° (west-facing), as shown in Figure 20.
These results are supported by previous studies related to grid-connected PV systems. According to Imam and Al-Turki [142], a grid-connected photovoltaic system with a capacity of 12.25 kW had a CF of 22%. Kebede [143] found that the average CF value of 5 MW grid-connected PV installations was 19.8%. Furthermore, Mohammadi et al. [144] found that the CF value of a 5 MW grid-connected PV plant with varying sun-tracking varied between 17.54% and 27.42%. Based on the findings, it can be concluded that the value gained from the current study is consistent with the accepted values according to previous studies. Thus, it is technically sustainable to install grid-connected PV systems at the selected location.

3.4.2. Techno-Economic Feasibility of the Proposed System

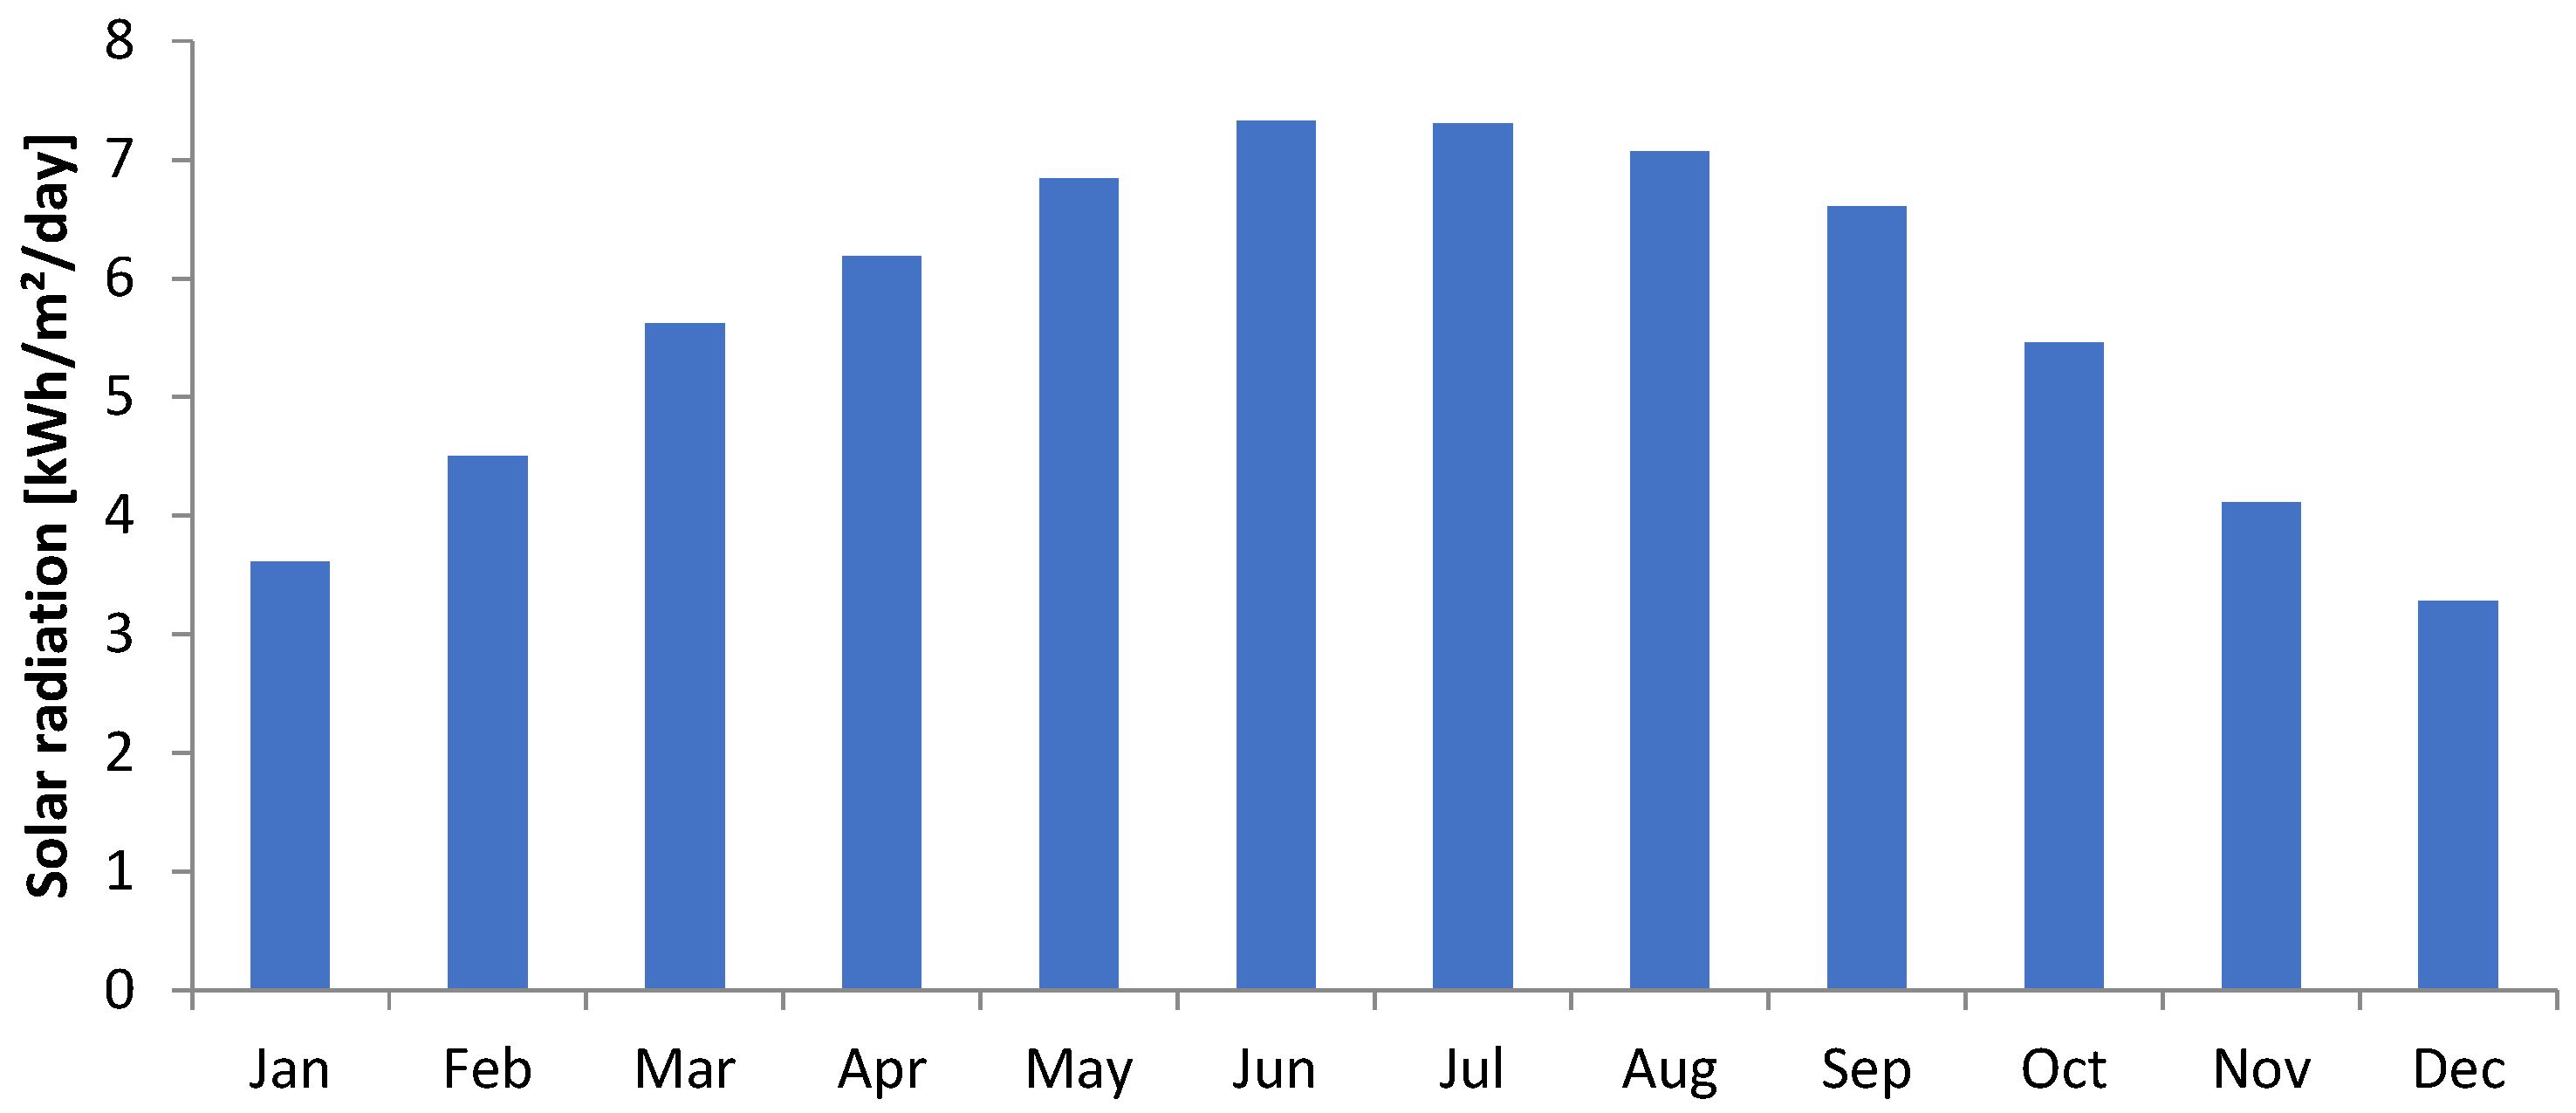
Notably, the minimum global solar irradiation value of 3.28 kWh/m2/day was recorded in December (Figure 21), and the highest daily electricity usage for selected households was recorded in August, with a value of 24 kWh/day. Using Equation (28) [121], the size of the PV system is estimated to be 11 kW.
P m a x = E A C P i G S R f P V η i n v
where P m a x is the maximum power,   P i is the solar radiation at STC in kW/m2, G S R is the global solar radiation (kWh/m2/d), f P V is the PV derating factor (0.8), E A C is the daily power consumption in kWh/d, and η i n v is the inverter yield.
As previously mentioned, the optimum orientation angles (tilt and azimuth angles) are 30 ° and 0 ° , respectively. Hence, the system capacity is estimated to be 19.08 kW for D#1 and 28.44 kW for D#2. It should be noted that mono-Si JKM360M-76 PV modules with an efficiency of 18.55% and a capacity of 360 W were selected for the proposed system. Moreover, a 10 kW FroniusSymo Advanced 10.0-3 208-240 V 3-Phase String Inverter was utilized in this study.
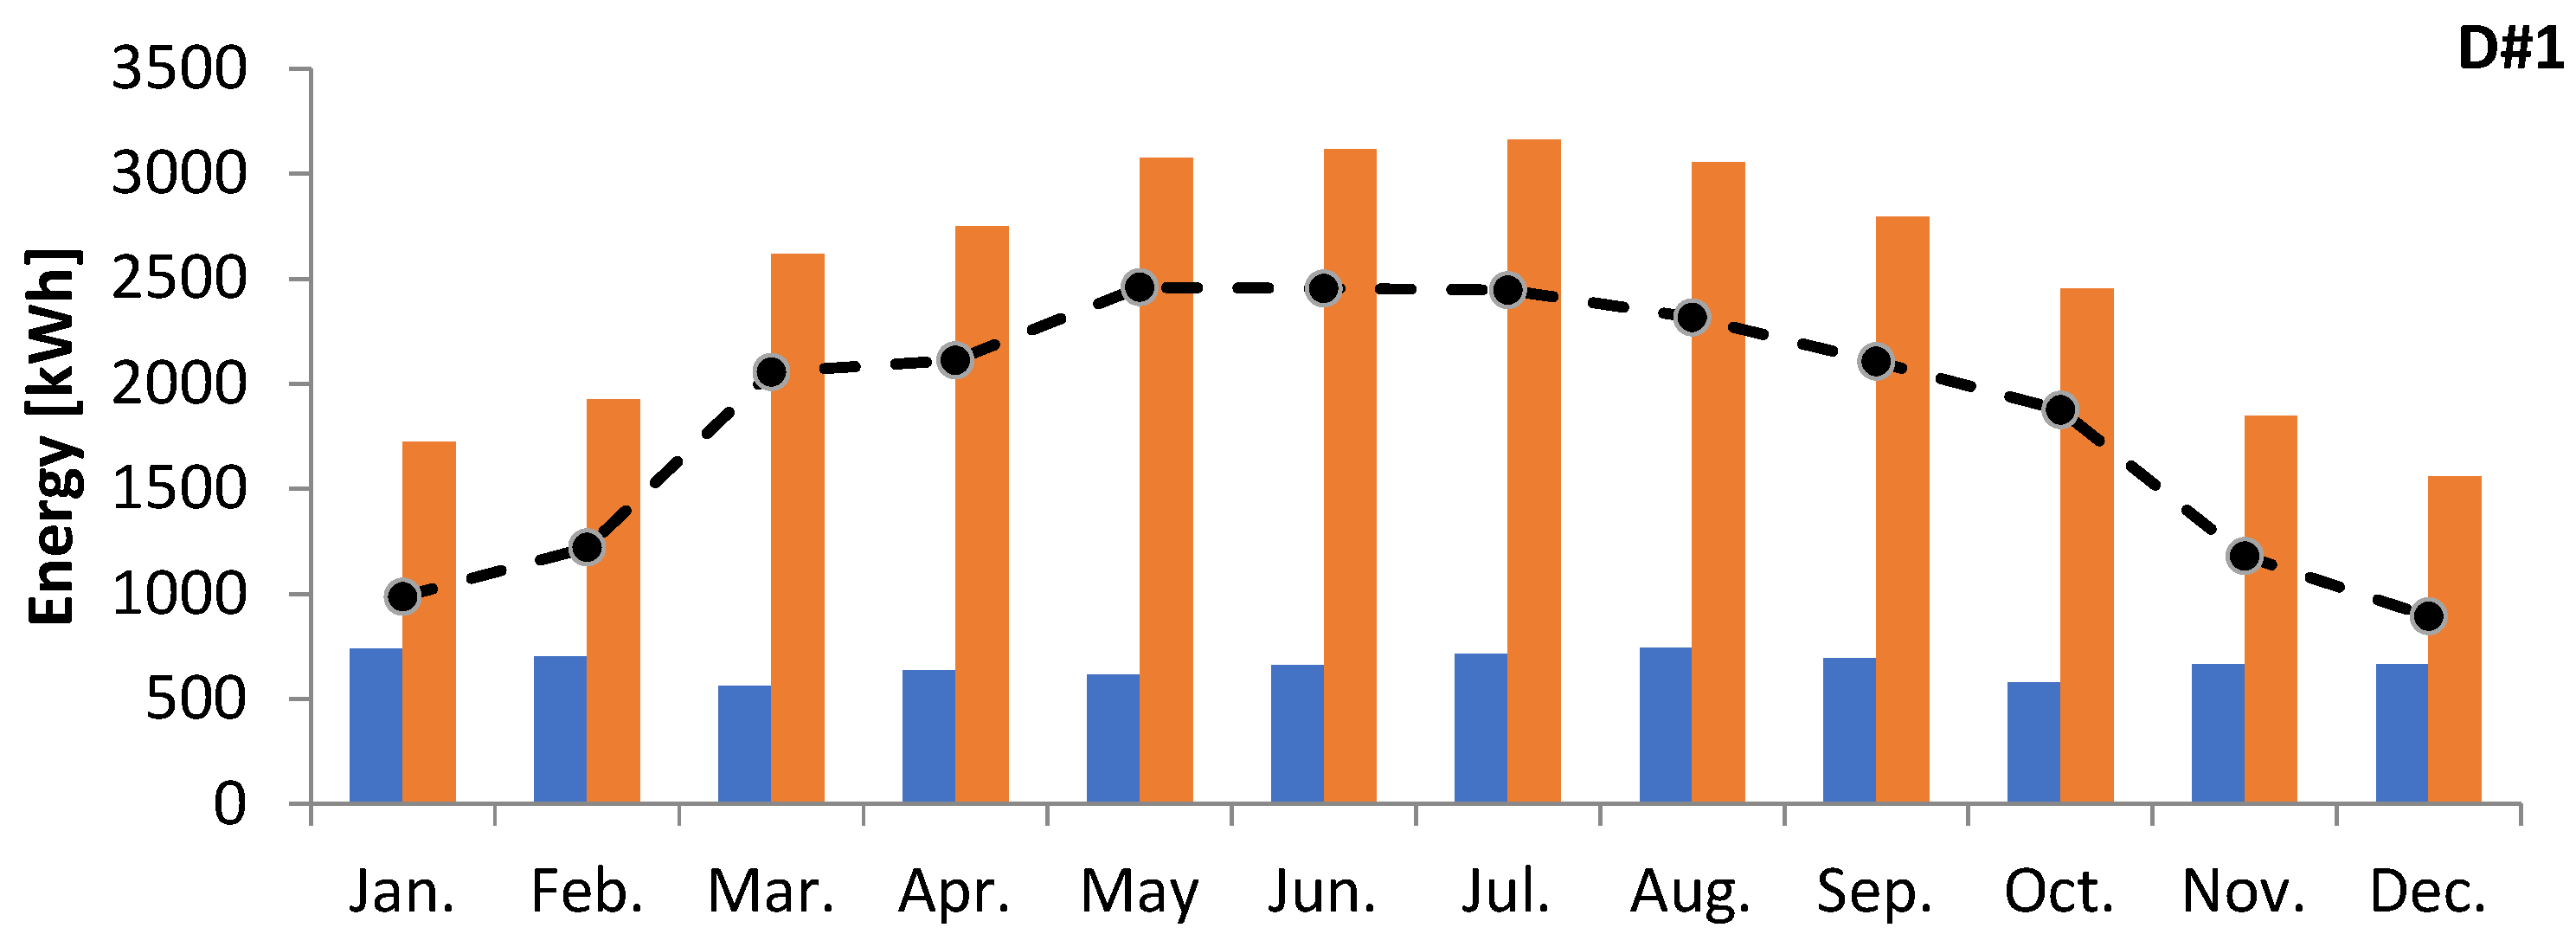
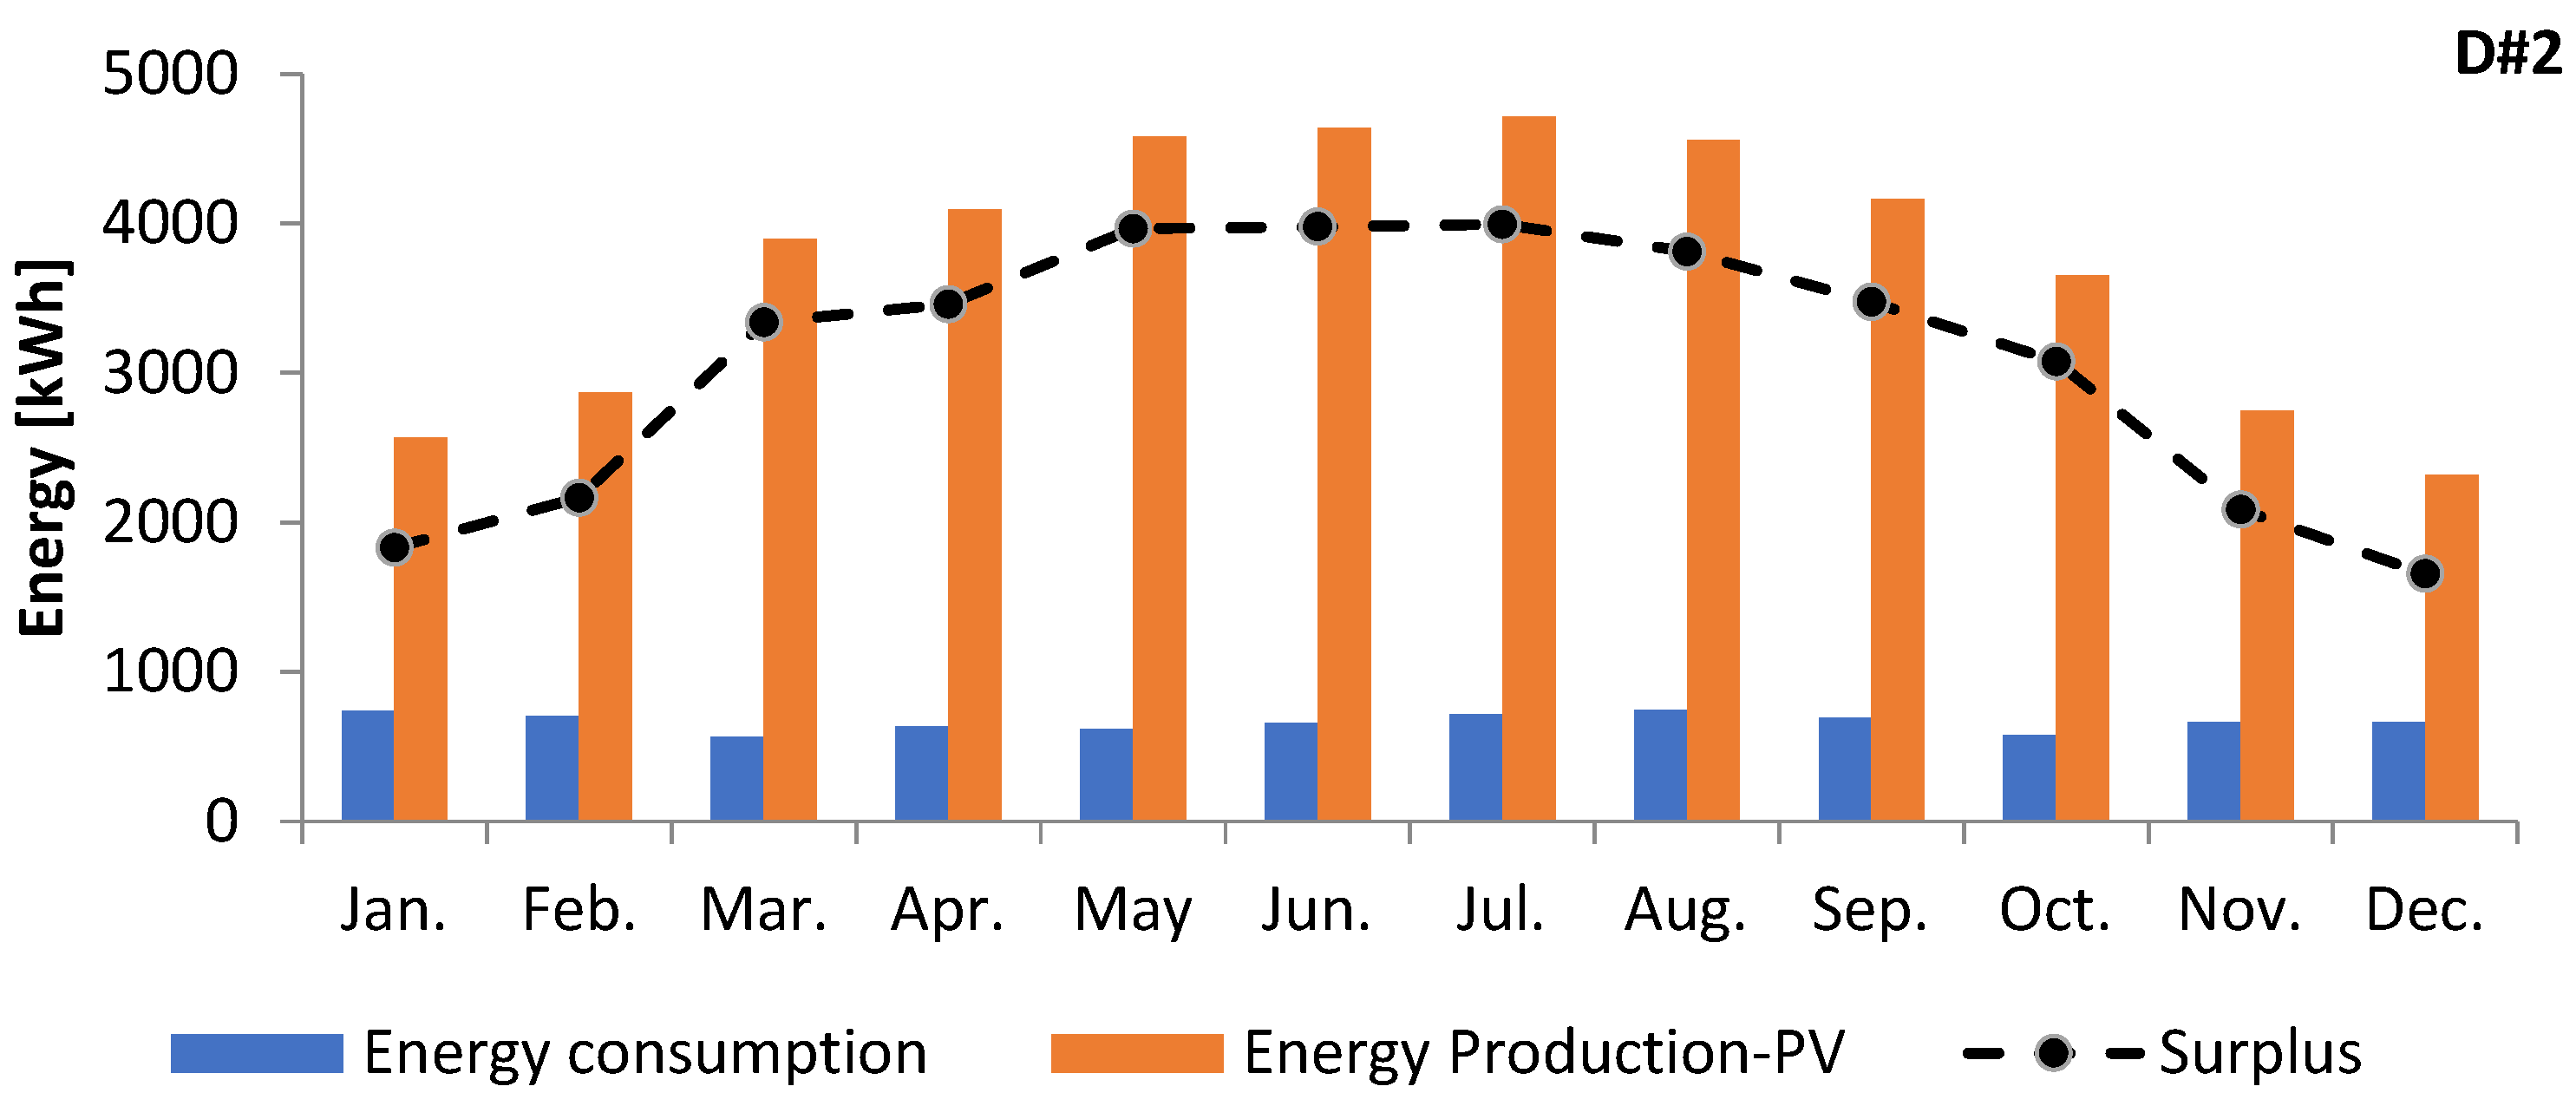
The monthly energy profile of system D#1 and D#2, which includes energy consumption, solar energy generation, and the energy surplus, is depicted in Figure 22. It is found that the highest and lowest energy production from the solar systems was recorded in July and December, respectively. This variation aligns with typical solar irradiance trends, where output peaks in summer due to longer days and high solar intensity. Every month, the PV system produces significantly more energy than is regularly used, which leads to a steady surplus.
When D#2 is used, for instance, the excess can range from 1656 kWh in December to as much as 3996 kWh in July. This cyclical overproduction demonstrates that the system can satisfy energy resilience and sustainability requirements by not only supplying on-site energy demands but also returning extra energy to the grid or storing it for later use. The significant surplus during the production months, especially March to September, indicates that there is a great deal of room for energy export or integration with other energy-demanding applications, such as electric vehicle charging, water heating, or battery storage. Additionally, the system’s ability to generate more than three times the necessary energy, even during December, when production is at its lowest, showcases the resilience and effectiveness of the installed PV capacity.
RETScreen software is used to calculate the economic feasibility indicators. Prior research has shown that NPV and payback period are crucial considerations when assessing economic feasibility [144,145,146]. Therefore, Table 12 presents the most important findings on the economic performance of the 24 kW grid-connected photovoltaic system for north–south orientation with a tilt angle of 30°. Based on the NPV value and Refs. [144,145,146], the results show that the proposed plant is financially and economically feasible. Additionally, the cash flow shows that the investor could expect positive cash flow from the solar plant project starting in 1.8 years. Additionally, the feasibility of cash flows from the proposed system can be estimated using the benefit-cost ratio (B-C). A project is considered profitable when the value of B-C is more than one, according to Abdur-Rehman and Al-Sulaiman [147]. Thus, the B-C value (see Table 12) of all the proposed systems indicates the feasibility of the projects. Furthermore, as indicated in Table 12, the results reveal that utilizing the PV project greatly lowers GHG emissions.

4. Conclusions

Investigating alternative energy and water sources has always been an important issue in water resources and environmental management. Therefore, the current study investigated a novel 2-in-1 system that combines renewable solar energy and rainwater harvesting as an alternative solution to address energy and water challenges. This system is designed for family farms. It is installed on the roof of an existing farm building, where it generates electricity from solar energy and collects rainwater for irrigation. To this end, the study addressed the lack of locally observed rainfall data by comparing the available actual data with global satellite databases. The most precise satellite dataset was then utilized to estimate the potential of the rainwater harvesting system. The results demonstrate that the mean amount of rainwater gathered from the rooftop was 71 m3/year and 649 m3/day based on the average and maximum daily rainfall data. Furthermore, the results indicated that the rainwater harvesting system can meet between 31% and 38% of the building’s annual irrigation water demand (204 cubic meters per year) based on average daily rainfall, and between 285% and 346% based on maximum daily rainfall. Consequently, the system may be able to collect much larger quantities of water than is required for irrigation, potentially producing a surplus that can be stored for non-potable uses during periods of heavy rainfall.
Moreover, this study evaluated the feasibility of hybrid solar–RWH systems providing a sustainable alternative to conventional energy sources and water use for purposes other than drinking. It was found that the family’s energy requirements were met by the proposed PV system, and the remaining energy could be transmitted into the grid. Furthermore, the cash flow indicates that the investor can expect a return on investment from the proposed PV system after 2.4 years.
This study concluded that implementing rainwater harvesting in buildings has several advantages, such as lower monthly water bills and compatibility with green building concepts. Besides, it provides a significant reference for sustainable water and environmental management, and this approach can be efficiently applied, especially for a region with a water and electricity crisis like Northern Cyprus. In addition, the results illustrate the system’s significance in climate change adaptation and resource sustainability by showing how it can reduce environmental impact while increasing resilience in water-scarce and energy-dependent places.

5. Limitations and Future Work

Although this study’s primary goal was to evaluate the preliminary techno-economic feasibility of innovative hybrid systems (solar and rainfall harvesting), this research has some limitations that should be addressed in the future to ensure the practicality, safety, and performance of the rooftop solar and rainwater collection system.
First, high temperatures can have an impact on long-term energy yield, increase system degradation, and reduce solar panel efficiency, particularly in Northern Cyprus. The impact of thermal management on solar panel performance and the structural safety of the system under various weather conditions, including wind loads, should be discussed in the future.
Second, the reliability and efficiency of the system are significantly affected by the materials utilized. The system’s effectiveness, resilience, and cost may be improved by selecting the most suitable material. Therefore, the material selections should be examined in the future. To address these challenges, future studies will employ structural analysis and simulation tools such as ANSYS 2021 and SolidWorks 2021. ANSYS or SolidWorks’ finite element analysis (FEA) is a helpful tool for evaluating factors, including material fatigue, wind loads, and the effects of thermal expansion on PV mounting structures.
Third, the shading effects were not examined, since the primary goal of this study was to assess the system’s overall capacity for energy generation rather than to maximize the performance of individual panels. Furthermore, a prior study shows that shading has a significant impact on PV system efficiency [148,149]. Therefore, future studies should conduct an in-depth shade analysis using PVsyst software (7.4.8 2024) to increase the reliability of performance assessments. PVsyst software allows for more precise simulation of shading effects and facilitates the implementation of optimization techniques, such as power optimizers and improved panel arrangement [150,151,152]. This approach will address the study’s limitations and offer a more comprehensive understanding of how shading impacts system performance. Besides, the symmetrical installations might complicate the inverter design due to potential variations in panel performance. If panels with different roof orientations receive varied amounts of sunshine, this could result in inefficiencies. To minimize mismatched performance and enhance overall system efficiency, future research will address particular design issues, such as optimum inverter designs—particularly string inverters with numerous Maximum Power Point Trackers (MPPTs)—using PVsyst software based on previous studies [151,152].
Fourth, the effects of heavy rainfall were not investigated in this study. However, previous studies [153,154,155,156] have highlighted the importance of considering heavy rainfall conditions in the design and maintenance of rainwater harvesting systems. Moreover, the efficiency of solar panels can be reduced by heavy rain due to the limited sunlight, which causes moisture-related damage, such as corrosion and electrical issues [157,158,159,160]. Hence, future research should focus on developing robust system designs and adaptive strategies to improve resilience and ensure reliable performance under extreme conditions.
Finally, the practical performance of the proposed system will be assessed in future studies by means of experimental validation in real-world field environments. Among the important operational parameters that will be examined are water pumping rates, energy efficiency, and the effectiveness of system automation. Additionally, the collected rainwater’s quality will be evaluated to ensure that it meets relevant agricultural standards for irrigation. In order to improve the water’s quality, the project will also investigate the design and testing of basic water treatment parts, such filter units and first-flush systems.
In the end, this study provides a first exploration of the hybrid system’s viability and potential for solving important issues (water and energy). The limits indicated will be considered and resolved in future work to enhance the robustness and usability of the proposed system. These constraints include structural concerns, inverter design, cost optimization, and shade analysis.

Author Contributions

Conceptualization, Y.K. and H.G.; methodology, Y.K. and A.H.A.A.; software, Y.K. and A.H.A.A.; validation, Y.K. and A.H.A.A.; formal analysis, Y.K.; investigation, Y.K.; resources, Y.K. and H.G.; writing—original draft preparation, Y.K.; writing—review and editing, Y.K., H.G. and A.K.; supervision, Y.K. and H.G. All authors have read and agreed to the published version of the manuscript.

Funding

This research received no external funding.

Institutional Review Board Statement

The study did not require ethical approval.

Informed Consent Statement

Informed consent was obtained from all subjects involved in the study.

Data Availability Statement

The data that support the findings of this study are available from the corresponding author.

Conflicts of Interest

The authors declare no conflicts of interest.

References

  1. Morante-Carballo, F.; Montalván-Burbano, N.; Quiñonez-Barzola, X.; Jaya-Montalvo, M.; Carrión-Mero, P. What do we know about water scarcity in semi-arid zones? A global analysis and research trends. Water 2022, 14, 2685. [Google Scholar] [CrossRef]
  2. Jha, M.K.; Dev, M. Impacts of climate change. In Smart Internet of Things for Environment and Healthcare; Springer Nature: Cham, Switzerland, 2024; pp. 139–159. [Google Scholar]
  3. Shemer, H.; Wald, S.; Semiat, R. Challenges and solutions for global water scarcity. Membranes 2023, 13, 612. [Google Scholar] [CrossRef] [PubMed]
  4. Elhassnaoui, I.; Moumen, Z.; Tvaronavičienė, M.; Ouarani, M.; Ben-Daoud, M.; Serrari, I.; Hasnaoui, M.D. Management of water scarcity in arid areas: A case study (Ziz Watershed). Insights Reg. Dev. 2021, 3, 80–103. [Google Scholar] [CrossRef] [PubMed]
  5. Biswas, A.; Sarkar, S.; Das, S.; Dutta, S.; Choudhury, M.R.; Giri, A.; Bera, B.; Bag, K.; Mukherjee, B.; Banerjee, K.; et al. Water scarcity: A global hindrance to sustainable development and agricultural production–A critical review of the impacts and adaptation strategies. Camb. Prism. Water 2025, 3, e4. [Google Scholar] [CrossRef]
  6. Lepcha, R.; Patra, S.K.; Ray, R.; Thapa, S.; Baral, D.; Saha, S. Rooftop rainwater harvesting a solution to water scarcity: A review. Groundw. Sustain. Dev. 2024, 26, 101305. [Google Scholar] [CrossRef]
  7. Ritchie, H.; Roser, M. Water use and stress. Our World in Data. 2018. Available online: https://ourworldindata.org/water-use-stress?utm_source=gonpath-newsletter.beehiiv.com&utm_medium=referral&utm_campaign=economias-hidricas (accessed on 3 September 2025).
  8. Tiwari, K.; Goyal, R.; Sarkar, A. GIS-based methodology for identification of suitable locations for rainwater harvesting structures. Water Resour. Manag. 2018, 32, 1811–1825. [Google Scholar] [CrossRef]
  9. Ezzeldin, M.; Konstantinovich, S.E.; Igorevich, G.I. Determining the suitability of rainwater harvesting for the achievement of sustainable development goals in WadiWatir, Egypt using GIS techniques. J. Environ. Manag. 2022, 313, 114990. [Google Scholar] [CrossRef]
  10. Velis, M.; Conti, K.I.; Biermann, F. Groundwater and human development: Synergies and trade-offs within the context of the sustainable development goals. Sustain. Sci. 2017, 12, 1007–1017. [Google Scholar] [CrossRef]
  11. Mperejekumana, P.; Shen, L.; Zhong, S.; Muhirwa, F.; Gaballah, M.S.; Nsigayehe, J.M.V. Integrating climate change adaptation into water-energy-food-environment nexus for sustainable development in East African Community. J. Clean. Prod. 2024, 434, 140026. [Google Scholar] [CrossRef]
  12. Hoang, A.T.; Nguyen, X.P. Integrating renewable sources into energy system for smart city as a sagacious strategy towards clean and sustainable process. J. Clean. Prod. 2021, 305, 127161. [Google Scholar] [CrossRef]
  13. Ghadami, N.; Gheibi, M.; Kian, Z.; Faramarz, M.G.; Naghedi, R.; Eftekhari, M.; Fathollahi-Fard, A.M.; Dulebenets, A.A.; Tian, G. Implementation of solar energy in smart cities using an integration of artificial neural network, photovoltaic system and classical Delphi methods. Sustain. Cities Soc. 2021, 74, 103149. [Google Scholar] [CrossRef]
  14. Kumar, C.M.S.; Singh, S.; Gupta, M.K.; Nimdeo, Y.M.; Raushan, R.; Deorankar, A.V.; Ananda Kumar, T.M.; Rout, P.K.; Chanotiya, C.S.; Nannaware, A.D.; et al. Solar energy: A promising renewable source for meeting energy demand in Indian agriculture applications. Sustain. Energy Technol. Assess. 2023, 55, 102905. [Google Scholar] [CrossRef]
  15. Kanwal, S.; Mehran, M.T.; Hassan, M.; Anwar, M.; Naqvi, S.R.; Khoja, A.H. An integrated future approach for the energy security of Pakistan: Replacement of fossil fuels with syngas for better environment and socio-economic development. Renew. Sustain. Energy Rev. 2022, 156, 111978. [Google Scholar] [CrossRef]
  16. Yu, J.; Tang, Y.M.; Chau, K.Y.; Nazar, R.; Ali, S.; Iqbal, W. Role of solar-based renewable energy in mitigating CO2 emissions: Evidence from quantile-on-quantile estimation. Renew. Energy 2022, 182, 216–226. [Google Scholar] [CrossRef]
  17. Belaïd, F.; Al-Sarihi, A.; Al-Mestneer, R. Balancing climate mitigation and energy security goals amid converging global energy crises: The role of green investments. Renew. Energy 2023, 205, 534–542. [Google Scholar] [CrossRef]
  18. Bouckaert, S.; Pales, A.F.; McGlade, C.; Remme, U.; Wanner, B.; Varro, L.; D’Ambrosio, D.; Spencer, T. Net Zero by 2050: A Roadmap for the Global Energy Sector; The National Academies of Sciences, Engineering, and Medicine: Washington, DC, USA, 2021. [Google Scholar]
  19. Rahman, A. Recent advances in modelling and implementation of rainwater harvesting systems towards sustainable development. Water 2017, 9, 959. [Google Scholar] [CrossRef]
  20. Zhang, S.; Zhang, J.; Jing, X.; Wang, Y.; Wang, Y.; Yue, T. Water saving efficiency and reliability of rainwater harvesting systems in the context of climate change. J. Clean. Prod. 2018, 196, 1341–1355. [Google Scholar] [CrossRef]
  21. Harka, A.E.; Roba, N.T.; Kassa, A.K. Modelling rainfall runoff for identification of suitable water harvesting sites in Dawe River watershed, Wabe Shebelle River basin, Ethiopia. J. Water Land Dev. 2020, 47, 186–195. [Google Scholar] [CrossRef]
  22. Elewa, H.H.; Zelenakova, M.; Nosair, A.M. Integration of the analytical hierarchy process and GIS spatial distribution model to determine the possibility of runoff water harvesting in dry regions: WadiWatir in Sinai as a case study. Water 2021, 13, 804. [Google Scholar] [CrossRef]
  23. Rahmat, S.N.; Al-Gheethi, A.A.S.; Ayob, S.; MohdShahli, F. Development of dual water supply using rooftop rainwater harvesting and groundwater systems. SN Appl. Sci. 2020, 2, 85. [Google Scholar] [CrossRef]
  24. Leong, J.Y.C.; Chong, M.N.; Poh, P.E.; Hermawan, A.; Talei, A. Longitudinal assessment of rainwater quality under tropical climatic conditions in enabling effective rainwater harvesting and reuse schemes. J. Clean. Prod. 2017, 143, 64–75. [Google Scholar] [CrossRef]
  25. Wartalska, K.; Grzegorzek, M.; Bełcik, M.; Wdowikowski, M.; Kolanek, A.; Niemierka, E.; Jadwiszczak, P.; Kaźmierczak, B. The potential of rainwater harvesting systems in Europe–Current state of Art and future perspectives. Water Resour. Manag. 2024, 38, 4657–4683. [Google Scholar] [CrossRef]
  26. Lasage, R.; Verburg, P.H. Evaluation of small scale water harvesting techniques for semi-arid environments. J. Arid Environ. 2015, 118, 48–57. [Google Scholar] [CrossRef]
  27. Snelling, A.M.; Lamond, J.; Everett, G.; O’Donnell, E.C.; Ahilan, S.; Thorne, C. Public perceptions of rainwater harvesting (RWH): Comparing users and non-users of RWH systems. Urban Water J. 2024, 21, 181–189. [Google Scholar] [CrossRef]
  28. Lee, K.E.; Mokhtar, M.; Hanafiah, M.M.; Halim, A.A.; Badusah, J. Rainwater harvesting as an alternative water resource in Malaysia: Potential, policies and development. J. Clean. Prod. 2016, 126, 218–222. [Google Scholar] [CrossRef]
  29. Raimondi, A.; Quinn, R.; Abhijith, G.R.; Becciu, G.; Ostfeld, A. Rainwater harvesting and treatment: State of the art and perspectives. Water 2023, 15, 1518. [Google Scholar] [CrossRef]
  30. Crosson, C.; Tong, D.; Zhang, Y.; Zhong, Q. Rainwater as a renewable resource to achieve net zero urban water in water stressed cities. Resour. Conserv. Recycl. 2021, 164, 105203. [Google Scholar] [CrossRef]
  31. Alim, M.A.; Rahman, A.; Tao, Z.; Samali, B.; Khan, M.M.; Shirin, S. Suitability of roof harvested rainwater for potential potable water production: A scoping review. J. Clean. Prod. 2020, 248, 119226. [Google Scholar] [CrossRef]
  32. Alim, M.A.; Rahman, A.; Tao, Z.; Samali, B.; Khan, M.M.; Shirin, S. Feasibility analysis of a small-scale rainwater harvesting system for drinking water production at Werrington, New South Wales, Australia. J. Clean. Prod. 2020, 270, 122437. [Google Scholar] [CrossRef]
  33. de Sá Silva, A.C.R.; Bimbato, A.M.; Balestieri, J.A.P.; Vilanova, M.R.N. Exploring environmental, economic and social aspects of rainwater harvesting systems: A review. Sustain. Cities Soc. 2022, 76, 103475. [Google Scholar] [CrossRef]
  34. Jiang, Z.Y.; Li, X.Y. Water and energy conservation of rainwater harvesting system in the Loess Plateau of China. J. Integr. Agric. 2013, 12, 1389–1395. [Google Scholar] [CrossRef]
  35. Vargas-Parra, M.V.; Villalba, G.; Gabarrell, X. Applying exergy analysis to rainwater harvesting systems to assess resource efficiency. Resour. Conserv. Recycl. 2013, 72, 50–59. [Google Scholar] [CrossRef]
  36. Corrêa, J.D.P.; Fernandes, L.L.; Blanco, C.J.C.; Neves, R.R. Proposal of rainwater harvesting coefficient (RWHC) for determination of effectively usable rainfall depth, relevant to rainwater harvesting systems design. RBRH 2018, 23, e15. [Google Scholar] [CrossRef]
  37. Rahman, A. Rainwater harvesting for sustainable developments: Non-potable use, household irrigation and stormwater management. Water 2021, 13, 3460. [Google Scholar] [CrossRef]
  38. Campisano, A.; Butler, D.; Ward, S.; Burns, M.J.; Friedler, E.; DeBusk, K.; Fisher-Jeffes, L.N.; Ghisi, E.; Rahman, A.; Furumai, H.; et al. Urban rainwater harvesting systems: Research, implementation and future perspectives. Water Res. 2017, 115, 195–209. [Google Scholar] [CrossRef] [PubMed]
  39. Lopes, V.A.; Marques, G.F.; Dornelles, F.; Medellin-Azuara, J. Performance of rainwater harvesting systems under scenarios of non-potable water demand and roof area typologies using a stochastic approach. J. Clean. Prod. 2017, 148, 304–313. [Google Scholar] [CrossRef]
  40. Malinowski, P.A.; Stillwell, A.S.; Wu, J.S.; Schwarz, P.M. Energy-water nexus: Potential energy savings and implications for sustainable integrated water management in urban areas from rainwater harvesting and gray-water reuse. J. Water Resour. Plan. Manag. 2015, 141, A4015003. [Google Scholar] [CrossRef]
  41. Gokcekus, H.; Kassem, Y.; Alijl, N. Enhancing Co-Benefits and reducing Flood Risks through Nature-based Solutions and Assessments: A Case Study in the Dead Sea Region of Jordan. Eng. Technol. Appl. Sci. Res. 2024, 14, 16450–16459. [Google Scholar] [CrossRef]
  42. Nandi, S.; Gonela, V. Rainwater harvesting for domestic use: A systematic review and outlook from the utility policy and management perspectives. Util. Policy 2022, 77, 101383. [Google Scholar] [CrossRef]
  43. Prăvălie, R.; Patriche, C.; Bandoc, G. Spatial assessment of solar energy potential at global scale. A geographical approach. J. Clean. Prod. 2019, 209, 692–721. [Google Scholar] [CrossRef]
  44. Hosseini, S.E.; Wahid, M.A. Hydrogen from solar energy, a clean energy carrier from a sustainable source of energy. Int. J. Energy Res. 2020, 44, 4110–4131. [Google Scholar] [CrossRef]
  45. Fang, H.; Li, J.; Song, W. Sustainable site selection for photovoltaic power plant: An integrated approach based on prospect theory. Energy Convers. Manag. 2018, 174, 755–768. [Google Scholar] [CrossRef]
  46. Yan, J.; Yang, Y.; EliaCampana, P.; He, J. City-level analysis of subsidy-free solar photovoltaic electricity price, profits and grid parity in China. Nat. Energy 2019, 4, 709–717. [Google Scholar] [CrossRef]
  47. Hao, D.; Qi, L.; Tairab, A.M.; Ahmed, A.; Azam, A.; Luo, D.; Pan, Y.; Zhang, Z.; Yan, J. Solar energy harvesting technologies for PV self-powered applications: A comprehensive review. Renew. Energy 2022, 188, 678–697. [Google Scholar] [CrossRef]
  48. Ahmadi, E.; McLellan, B.; Mohammadi-Ivatloo, B.; Tezuka, T. The role of renewable energy resources in sustainability of water desalination as a potential fresh-water source: An updated review. Sustainability 2020, 12, 5233. [Google Scholar] [CrossRef]
  49. Kassem, Y.; Gokcekus, H.; AbAlbakoush, I.A.; Abdullah, K.S.B. Solar-Powered Solutions for the Water and Energy Shortage Problem: The Case Study of Nahr El Bared, Lebanon. Eng. Technol. Appl. Sci. Res. 2023, 13, 10861–10869. [Google Scholar] [CrossRef]
  50. Verma, S.; Mishra, S.; Chowdhury, S.; Gaur, A.; Mohapatra, S.; Soni, A.; Verma, P. Solar PV powered water pumping system–A review. Mater. Today Proc. 2021, 46, 5601–5606. [Google Scholar] [CrossRef]
  51. Saim, M.A.; Khan, I. Problematizing solar energy in Bangladesh: Benefits, burdens, and electricity access through solar home systems in remote islands. Energy Res. Soc. Sci. 2021, 74, 101969. [Google Scholar] [CrossRef]
  52. Chong, W.T.; Naghavi, M.S.; Poh, S.C.; Mahlia, T.M.I.; Pan, K.C. Techno-economic analysis of a wind–solar hybrid renewable energy system with rainwater collection feature for urban high-rise application. Appl. Energy 2011, 88, 4067–4077. [Google Scholar] [CrossRef]
  53. Chong, W.T.; Fazlizan, A.; Poh, S.C.; Pan, K.C.; Ping, H.W. Early development of an innovative building integrated wind, solar and rain water harvester for urban high rise application. Energy Build. 2012, 47, 201–207. [Google Scholar] [CrossRef]
  54. Chong, W.T.; Wang, X.H.; Wong, K.H.; Mojumder, J.C.; Poh, S.C.; Saw, L.H.; Lai, S.H. Performance assessment of a hybrid solar-wind-rain eco-roof system for buildings. Energy Build. 2016, 127, 1028–1042. [Google Scholar] [CrossRef]
  55. Wang, X.; Chong, W.; Wong, K.; Lai, S.; Saw, L.; Xiang, X.; Wang, C.T. Preliminary techno–environment–economic evaluation of an innovative hybrid renewable energy harvester system for residential application. Energies 2019, 12, 1496. [Google Scholar] [CrossRef]
  56. Cao, H.; Zeng, X.; Wu, L.; Wu, X.; Zhang, Z. A hybrid wind and rainwater energy harvesting system for applications in sea-crossing bridges. Ocean Eng. 2021, 234, 109267. [Google Scholar] [CrossRef]
  57. Michaelides, S.; Tymvios, F.; Michaelidou, T. Spatial and temporal characteristics of the annual rainfall frequency distribution in Cyprus. Atmos. Res. 2009, 94, 606–615. [Google Scholar] [CrossRef]
  58. Stamatatou, N.; Vasiliades, L.; Loukas, A. The effect of sample size on bivariate rainfall frequency analysis of extreme precipitation. Proceedings 2018, 7, 19. [Google Scholar] [CrossRef]
  59. Zaifoglu, H.; Akintug, B.; Yanmaz, A.M. Regional frequency analysis of precipitation using time series clustering approaches. J. Hydrol. Eng. 2018, 23, 05018007. [Google Scholar] [CrossRef]
  60. Kassem, Y.; Gökçekuş, H.; Gökçekuş, R. Identification of the most suitable probability distribution models for monthly and annual rainfall series in Güzelyurt Region, Northern Cyprus. Desalination Water Treat. 2021, 215, 427–451. [Google Scholar] [CrossRef]
  61. Kassem, Y.; Gökçekuş, H.; Çamur, H.; Esenel, E. Statistical analysis and determination of best-fit probability distribution for monthly rainfall in Northern Cyprus. Desalination Water Treat. 2021, 215, 347–379. [Google Scholar] [CrossRef]
  62. Elkiran, G.; Dahiru, A.; Gokcekus, H. Water resources management and trend of water use in North Cyprus. Desalination Water Treat. 2020, 177, 264–274. [Google Scholar] [CrossRef]
  63. Ilseven, S. The edaphic, topographic, climatologic and lithologic factors that affect plant endemism on Troodos (Cyprus) Mountain. In Proceedings of the ICGE-2023, Antalya, Turkey, 5–8 October 2023; pp. 509–517. [Google Scholar]
  64. Saner, S. Geotectonic Evolution of the Island of Cyprus. In Climate Change and Natural Resources: Environmental Management and Sustainable Development; Springer: Berlin/Heidelberg, Germany, 2025; p. 287. [Google Scholar]
  65. Papadaskalopoulou, C.; Giannakopoulos, C.; Lemesios, G.; Zachariou-Dodou, M.; Loizidou, M. Challenges for water resources and their management in light of climate change: The case of Cyprus. Desalination Water Treat. 2015, 53, 3224–3233. [Google Scholar] [CrossRef]
  66. Gökçekuş, H.; Kassem, Y.; Rizza, T. Groundwater quality assessment for irrigation in coastal region (Güzelyurt), Northern Cyprus and importance of empirical model for predicting groundwater quality (electric conductivity). Environ. Earth Sci. 2025, 84, 224. [Google Scholar] [CrossRef]
  67. Delipetrou, P.; Makhzoumi, J.; Dimopoulos, P.; Georghiou, K. Cyprus. In Mediterranean Island Landscapes: Natural and Cultural Approaches; Springer: Dordrecht, The Netherlands, 2008; pp. 170–203. [Google Scholar]
  68. Lentini, A. The biodiversity of Cyprus Island. J. Environ. Sci. Engneering 2015, 4, 125–131. [Google Scholar]
  69. Kassem, Y.; Gökçekuş, H.; Çamur, H.; Esenel, E. Application of artificial neural network, multiple linear regression, and response surface regression models in the estimation of monthly rainfall in Northern Cyprus. Desalination Water Treat. 2021, 215, 328–346. [Google Scholar] [CrossRef]
  70. Hisam, E.; Mehr, A.D.; Alganci, U.; Seker, D.Z. Comprehensive evaluation of Satellite-Based and reanalysis precipitation products over the Mediterranean region in Turkey. Adv. Space Res. 2023, 71, 3005–3021. [Google Scholar] [CrossRef]
  71. Macharia, J.M.; Ngetich, F.K.; Shisanya, C.A. Comparison of satellite remote sensing derived precipitation estimates and observed data in Kenya. Agric. For. Meteorol. 2020, 284, 107875. [Google Scholar] [CrossRef]
  72. Sun, S.; Shi, W.; Zhou, S.; Chai, R.; Chen, H.; Wang, G.; Shen, H. Capacity of satellite-based and reanalysis precipitation products in detecting long-term trends across Mainland China. Remote Sens. 2020, 12, 2902. [Google Scholar] [CrossRef]
  73. Setiya, P.; Singh, M.; Nain, A.S. Evaluating the performance of Grid IMD, NASA POWER, and MarkSimtimeseries weather dataset for Uttarakhand Climatic Condition. Theor. Appl. Climatol. 2024, 155, 2657–2668. [Google Scholar] [CrossRef]
  74. Kassem, Y.; Camur, H.; Ghoshouni, E.G. Assessment of a Hybrid (Wind-Solar) System at High-Altitude Agriculture Regions for achieving Sustainable Development Goals. Eng. Technol. Appl. Sci. Res. 2024, 14, 12595–12607. [Google Scholar] [CrossRef]
  75. Kassem, Y.; Camur, H.; Adamu, M.T.; Chikowero, T.; Apreala, T. Prediction of Solar Irradiation in Africa using Linear-Nonlinear Hybrid Models. Eng. Technol. Appl. Sci. Res. 2023, 13, 11472–11483. [Google Scholar] [CrossRef]
  76. Kassem, Y.; Abdalla, M.H.A. Modeling predictive suitability to identify the potential of wind and solar energy as a driver of sustainable development in the Red Sea state, Sudan. Environ. Sci. Pollut. Res. 2022, 29, 44233–44254. [Google Scholar] [CrossRef]
  77. Hamad, J.; Ahmad, M.; Zeeshan, M. Solar energy resource mapping, site suitability and techno-economic feasibility analysis for utility scale photovoltaic power plants in Afghanistan. Energy Convers. Manag. 2024, 303, 118188. [Google Scholar] [CrossRef]
  78. Bandira, P.N.; Tan, M.L.; Teh, S.Y.; Samat, N.; Shaharudin, S.M.; Mahamud, M.A.; Tangang, F.; Juneng, L.; Chung, J.X.; Samsudin, M.S. Optimal solar farm site selection in the george town conurbation using GIS-based multi-criteria decision making (MCDM) and NASA POWER data. Atmosphere 2022, 13, 2105. [Google Scholar] [CrossRef]
  79. Kassem, Y.; Çamur, H.; Alhuoti, S.M.A. Solar energy technology for Northern Cyprus: Assessment, statistical analysis, and feasibility study. Energies 2020, 13, 940. [Google Scholar] [CrossRef]
  80. Almorox, J.; Voyant, C.; Bailek, N.; Kuriqi, A.; Arnaldo, J.A. Total solar irradiance’s effect on the performance of empirical models for estimating global solar radiation: An empirical-based review. Energy 2021, 236, 121486. [Google Scholar] [CrossRef]
  81. Gairaa, K.; Bakelli, Y. Solar energy potential assessment in the Algerian south area: Case of Ghardaïa region. J. Renew. Energy 2013, 2013, 496348. [Google Scholar] [CrossRef]
  82. Bhatia, S.C. Advanced Renewable Energy Systems; Woodhead: New Delhi, India, 2014. [Google Scholar]
  83. Al-Najideen, M.I.; Alrwashdeh, S.S. Design of a solar photovoltaic system to cover the electricity demand for the faculty of Engineering-Mu’tah University in Jordan. Resour.-Effic. Technol. 2017, 3, 440–445. [Google Scholar] [CrossRef]
  84. Kassem, Y.; Gökçekuş, H.; Gökçekuş, R. Towards Sustainable Energy Solutions: Evaluating the Impact of Floating PV Systems in Reducing Water Evaporation and Enhancing Energy Production in Northern Cyprus. Energies 2024, 17, 5300. [Google Scholar] [CrossRef]
  85. Parchure, A.S.; Gedam, S.K. Probability distribution analysis of extreme rainfall events in a flood-prone region of Mumbai, India. Arab. J. Geosci. 2019, 12, 369. [Google Scholar] [CrossRef]
  86. Bajirao, T.S. Comparative performance of different probability distribution functions for maximum rainfall estimation at different time scales. Arab. J. Geosci. 2021, 14, 2138. [Google Scholar] [CrossRef]
  87. Nedaei, M.; Assareh, E.; Walsh, P.R. A comprehensive evaluation of the wind resource characteristics to investigate the short term penetration of regional wind power based on different probability statistical methods. Renew. Energy 2018, 128, 362–374. [Google Scholar] [CrossRef]
  88. Phien, H.N.; Ajirajah, T.J. Applications of the log Pearson type-3 distribution in hydrology. J. Hydrol. 1984, 73, 359–372. [Google Scholar] [CrossRef]
  89. Tortorelli, R.; Asquith, W.; Alan, R. Depth-Duration Frequency of Precipitation for Oklahoma; Water Resources Investigation Report 99-4232; US Geological Survey: Reston, VA, USA, 1999. [Google Scholar]
  90. Şen, Z.; Eljadid, A.G. Rainfall distribution function for Libya and rainfall prediction. Hydrol. Sci. J. 1999, 44, 665–680. [Google Scholar] [CrossRef]
  91. Ogunlela, A. Stochastic Analysis of Rainfall Events in Ilorin, Nigeria. J. Agric. Res. Dev. 2001, 1, 36–50. [Google Scholar] [CrossRef]
  92. Zalina, M.; Desa, M.; Nguyen, V.-T.-A.; Kassim, A. Selecting a probability distribution for extreme rainfall series in Malaysia. Water Sci. Technol. 2002, 45, 63–68. [Google Scholar] [CrossRef]
  93. Tao, D.Q.; Nguyen, V.T.; Bourque, A. On selection of probability distributions for representing extreme precipitations in Southern Quebec. In Proceedings of the Annual conference of the Canadian Society for Civil Engineering, Montreal, QC, Canada, 5–8 June 2002; pp. 1–8. [Google Scholar]
  94. Lee, C. Application of rainfall frequency analysis on studying rainfall distribution characteristics of Chia-nan plain in Southern Taiwan. J. Crops Environ. Bioinform. 2005, 2, 31–38. [Google Scholar]
  95. Fadhilah, Y.; Md, Z.; Vâ, N.; Suhaila, S.; Zulkifli, Y. Fitting The Best–Fit Distribution For The Hourly Rainfall Amount In The Wilayah Persekutuan. J. Teknol. 2012, 46, 49–58. [Google Scholar] [CrossRef]
  96. Kwaku, X.; Duke, O. Characterization and frequency analysis of one day annual maximum and two to five consecutive days maximum rainfall of Accra, Ghana. ARPN J. Eng. Appl. Sci. 2007, 2, 27–31. [Google Scholar]
  97. Hanson, L.S.; Vogel, R. The Probability Distribution of Daily Rainfall in the United States. In Proceedings of the World Environmental and Water Resources Congress 2008, Honolulu, HI, USA, 12–16 May 2008. [Google Scholar] [CrossRef]
  98. Sharma, M.; Singh, J. Use of probability distribution in rainfall analysis. N. Y. Sci. J. 2010, 3, 40–49. [Google Scholar]
  99. Johnson, F.; Haddad, K.; Rahman, A.; Green, J. Application of Bayesian GLSR to estimate sub-daily rainfall parameters for the IDF revision project. In Proceedings of the Hydrology and Water Resources Symposium, Sydney, Australia, 19–22 November 2012. [Google Scholar]
  100. Green, J.; Xuereb, K.; Johnson, F.; Moore, G. The revised intensity–frequency–duration (IFD) design rainfall estimates for Australia—An overview. In Proceeding of the 34th Hydrology and Water Resources Symposium, Sydney, Australia, 19–22 November 2012. [Google Scholar]
  101. Khudri, M.; Sadia, F. Determination of the Best Fit Probability Distribution for Annual Extreme Precipitation in Bangladesh. Eur. J. Sci. Res. 2013, 103, 391–404. [Google Scholar]
  102. Mamoon, A.A.; Joergensen, N.E.; Rahman, A.; Qasem, H. Derivation of new design rainfall in Qatar using L-moment based index frequency approach. Int. J. Sustain. Built Environ. 2014, 3, 111–118. [Google Scholar] [CrossRef]
  103. Montaseri, M.; Amirataee, B.; Rezaei, H. Assessment of Goodness of Fit Methods in Determining the Best Regional Probability Distribution of Rainfall Data. Int. J. Eng. 2014, 27, 1537–1546. [Google Scholar] [CrossRef]
  104. Mandal, S.; Choudhury, B.U. Estimation and prediction of maximum daily rainfall at Sagar Island using best fit probability models. Theor. Appl. Climatol. 2014, 121, 87–97. [Google Scholar] [CrossRef]
  105. Subyani, A.M.; Al-Amri, N.S. IDF curves and daily rainfall generation for Al-Madinah city, western Saudi Arabia. Arab. J. Geosci. 2015, 8, 11107–11119. [Google Scholar] [CrossRef]
  106. Hassan, Z.; Shamsudin, S.; Harun, S. Choosing The Best Fit Distribution For Rainfall Event Characteristics Based On 6H-Ietd Within Peninsular Malaysia. J. Teknol. 2015, 75, 145–157. [Google Scholar] [CrossRef]
  107. Mamoon, A.A.; Rahman, A. Selection of the best fit probability distribution in rainfall frequency analysis for Qatar. Nat. Hazards 2016, 86, 281–296. [Google Scholar] [CrossRef]
  108. Amin, M.T.; Rizwan, M.; Alazba, A.A. A best-fit probability distribution for the estimation of rainfall in northern regions of Pakistan. Open Life Sci. 2016, 11, 432–440. [Google Scholar] [CrossRef]
  109. Mohamed, T.; Ibrahim, A. Fitting Probability Distributions of Annual Rainfall in Sudan. SUST J. Eng. Comput. Sci. 2016, 17, 35–39. [Google Scholar]
  110. Agbonaye, A.I.; Izinyon, O.C. Best-Fit Probability Distribution Model for Rainfall Frequency Analysis of Three Cities in South Eastern Nigeria. Niger. J. Environ. Sci. Technol. 2017, 1, 34–42. [Google Scholar] [CrossRef]
  111. Yuan, J.; Emura, K.; Farnham, C.; Alam, M.A. Frequency analysis of annual maximum hourly precipitation and determination of best fit probability distribution for regions in Japan. Urban. Clim. 2018, 24, 276–286. [Google Scholar] [CrossRef]
  112. Alam, M.; Farnham, C.; Emura, K. Best-Fit Probability Models for Maximum Monthly Rainfall in Bangladesh Using Gaussian Mixture Distributions. Geosciences 2018, 8, 138. [Google Scholar] [CrossRef]
  113. Alam, M.; Emura, K.; Farnham, C.; Yuan, J. Best-Fit Probability Distributions and Return Periods for Maximum Monthly Rainfall in Bangladesh. Climate 2018, 6, 9. [Google Scholar] [CrossRef]
  114. Meena, R.K.; Dubey, S.; Basak, S.M. Use of Different Probability Distribution in Rainfall Analysis for RRS, Pundiari, Cooch Behar. Int. J. Curr. Microbiol. Appl. Sci. 2019, 8, 1325–1337. [Google Scholar] [CrossRef]
  115. Yadav, K.; Jain, S. Frequency Analysis of Rainfall Data Using Probability Distribution Models. Int. J. Curr. Microbiol. Appl. Sci. 2019, 8, 1390–1396. [Google Scholar] [CrossRef]
  116. Kassem, Y.; Gökçekuş, H. Water resources and rainfall distribution function: A case study in Lebanon. Desalination Water Treat. 2020, 177, 306–321. [Google Scholar] [CrossRef]
  117. Kassem, Y.; Gökçekuş, H.; Hassan, M.E.E.E. Daily Rainfall Characteristics in Sudan: Statistical Analysis and Modeling. In International Conference on Water Problems in Mediterranean Countries; Springer Nature: Cham, Switzerland, 2023; pp. 145–156. [Google Scholar]
  118. Sukrutha, A.; Dyuthi, S.; Desai, S. Probability distribution for monthly precipitation data in India. arXiv 2017, arXiv:1708.03144. [Google Scholar]
  119. Abdulla, F. Rainwater harvesting in Jordan: Potential water saving, optimal tank sizing and economic analysis. Urban. Water J. 2020, 17, 446–456. [Google Scholar] [CrossRef]
  120. Asamoah, S.S.; Parbey, J.; Yankey, I.K.; Awuah, A. Techno-economic assessment of a central grid-connected wind farm in Ghana using RETScreen® Expert. Heliyon 2023, 9, e12902. [Google Scholar] [CrossRef]
  121. Kassem, Y.; Gökçekuş, H.; Güvensoy, A. Techno-economic feasibility of grid-connected solar PV system at Near East University hospital, Northern Cyprus. Energies 2021, 14, 7627. [Google Scholar] [CrossRef]
  122. Santhi, C.; Arnold, J.; Williams, J.R.; Dugas, W.A.; Srinivasan, R.; Hauck, L.M. Validation of the SWAT Model on a Large River Basin with Point and Nonpoint Sources. JAWRA 2001, 37, 1169–1188. [Google Scholar]
  123. Van Liew, M.W.; Arnold, J.G.; Garbrecht, J.D. Hydrologic simulation on agricultural watersheds: Choosing between two models. Trans. ASAE 2003, 46, 1539. [Google Scholar] [CrossRef]
  124. Kokkalis, P.; Al Jassar, H.K.; Al Sarraf, H.; Nair, R.; Al Hendi, H. Evaluation of ERA5 and NCEP reanalysis climate models for precipitation and soil moisture over a semi-arid area in Kuwait. Clim. Dyn. 2024, 62, 4893–4904. [Google Scholar] [CrossRef]
  125. Ntagkounakis, G.; Nastos, P.T.; Kapsomenakis, Y. Creating High-Resolution Precipitation and Extreme Precipitation Indices Datasets by Downscaling and Improving on the ERA5 Reanalysis Data over Greece. Eng 2024, 5, 1885–1904. [Google Scholar] [CrossRef]
  126. Salih, W.; Epule, T.E.; EL Khalki, E.M.; Ouatiki, H.; Erraki, S.; Achli, S.; Chehbouni, A. A comprehensive assessment of satellite precipitation products over a semi-arid region: Focus on extreme events. Nat. Hazards 2024, 120, 3037–3065. [Google Scholar] [CrossRef]
  127. Hassler, B.; Lauer, A. Comparison of reanalysis and observational precipitation datasets including ERA5 and WFDE5. Atmosphere 2021, 12, 1462. [Google Scholar] [CrossRef]
  128. Tarek, M.; Brissette, F.P.; Arsenault, R. Evaluation of the ERA5 reanalysis as a potential reference dataset for hydrological modelling over North America. Hydrol. Earth Syst. Sci. 2020, 24, 2527–2544. [Google Scholar] [CrossRef]
  129. Lavers, D.A.; Hersbach, H.; Rodwell, M.J.; Simmons, A. An improved estimate of daily precipitation from the ERA5 reanalysis. Atmos. Sci. Lett. 2024, 25, e1200. [Google Scholar] [CrossRef]
  130. Gosset, M.; Viarre, J.; Quantin, G.; Alcoba, M. Evaluation of several rainfall products used for hydrological applications over West Africa using two high-resolution gauge networks. Q. J. R. Meteorol. Soc. 2013, 139, 923–940. [Google Scholar] [CrossRef]
  131. Panagos, P.; Borrelli, P.; Meusburger, K.; Yu, B.; Klik, A.; Jae Lim, K.; Ballabio, C. Global rainfall erosivity assessment based on high-temporal resolution rainfall records. Sci. Rep. 2017, 7, 4175. [Google Scholar] [CrossRef]
  132. Peng, J.; Liu, T.; Huang, Y.; Ling, Y.; Li, Z.; Bao, A.; Chen, X.; Kurban, A.; De Maeyer, P. Satellite-based precipitation datasets evaluation using gauge observation and hydrological modeling in a typical arid land watershed of Central Asia. Remote Sens. 2021, 13, 221. [Google Scholar] [CrossRef]
  133. Wang, Q.; Xia, J.; She, D.; Zhang, X.; Liu, J.; Zhang, Y. Assessment of four latest long-term satellite-based precipitation products in capturing the extreme precipitation and streamflow across a humid region of southern China. Atmos. Res. 2021, 257, 105554. [Google Scholar] [CrossRef]
  134. Dee, D.P.; Uppala, S.M.; Simmons, A.J.; Berrisford, P.; Poli, P.; Kobayashi, S.; Andrea, U.; Balmaseda, M.A.; Balsamo, G.; Bauer, P.; et al. The ERA-Interim reanalysis: Configuration and performance of the data assimilation system. Q. J. R. Meteorol. Soc. 2011, 137, 553–597. [Google Scholar] [CrossRef]
  135. Imteaz, M.A.; Ahsan, A.; Naser, J.; Rahman, A. Reliability analysis of rainwater tanks in Melbourne using daily water balance model. Resour. Conserv. Recycl. 2011, 56, 80–86. [Google Scholar] [CrossRef]
  136. Ahmad, M.I.; Sinclair, C.D.; Spurr, B.D. Assessment of flood frequency models using empirical distribution function statistics. Water Resour. Res. 1988, 24, 1323–1328. [Google Scholar] [CrossRef]
  137. Tasker, G. Regional frequency analysis: An approach based on L-moments. J. Am. Stat. Assoc. 1998, 93, 1233. [Google Scholar] [CrossRef]
  138. Gwenzi, W.; Nyamadzawo, G. Hydrological impacts of urbanization and urban roof water harvesting in water-limited catchments: A review. Environ. Process. 2014, 1, 573–593. [Google Scholar] [CrossRef]
  139. Domènech, L.; Saurí, D. A comparative appraisal of the use of rainwater harvesting in single and multi-family buildings of the Metropolitan Area of Barcelona (Spain): Social experience, drinking water savings and economic costs. J. Clean. Prod. 2011, 19, 598–608. [Google Scholar] [CrossRef]
  140. Ndeketeya, A.; Dundu, M. Maximising the benefits of rainwater harvesting technology towards sustainability in urban areas of South Africa: A case study. Urban Water J. 2019, 16, 163–169. [Google Scholar] [CrossRef]
  141. Fernandes, L.F.S.; Terêncio, D.P.; Pacheco, F.A. Rainwater harvesting systems for low demanding applications. Sci. Total Environ. 2015, 529, 91–100. [Google Scholar] [CrossRef]
  142. Imam, A.A.; Al-Turki, Y.A.; R., S.K. Techno-Economic Feasibility Assessment of Grid-Connected PV systems for residential buildings in Saudi Arabia—A case Study. Sustainability 2019, 12, 262. [Google Scholar] [CrossRef]
  143. Kebede, K.Y. Viability study of grid-connected solar PV system in Ethiopia. Sustain. Energy Technol. Assess. 2015, 10, 63–70. [Google Scholar] [CrossRef]
  144. Mohammadi, K.; Naderi, M.; Saghafifar, M. Economic feasibility of developing grid-connected photovoltaic plants in the southern coast of Iran. Energy 2018, 156, 17–31. [Google Scholar] [CrossRef]
  145. Owolabi, A.B.; Nsafon, B.E.K.; Roh, J.W.; Suh, D.; Huh, J.S. Validating the techno-economic and environmental sustainability of solar PV technology in Nigeria using RETScreen Experts to assess its viability. Sustain. Energy Technol. Assess. 2019, 36, 100542. [Google Scholar] [CrossRef]
  146. Rehman, S.; Ahmed, M.A.; Mohamed, M.H.; Al-Sulaiman, F.A. Feasibility study of the grid connected 10 MW installed capacity PV power plants in Saudi Arabia. Renew. Sustain. Energy Rev. 2017, 80, 319–329. [Google Scholar] [CrossRef]
  147. Abd-ur-Rehman, H.M.; Al-Sulaiman, F.A. Optimum selection of solar water heating (SWH) systems based on their comparative techno-economic feasibility study for the domestic sector of Saudi Arabia. Renew. Sustain. Energy Rev. 2016, 62, 336–349. [Google Scholar] [CrossRef]
  148. Eke, R.; Demircan, C. Shading effect on the energy rating of two identical PV systems on a building façade. Sol. Energy 2015, 122, 48–57. [Google Scholar] [CrossRef]
  149. Bernadette, D.; Twizerimana, M.; Bakundukize, A.; Pierre, B.J.; Theoneste, N. Analysis of shading effects in solar PV system. Int. J. Sustain. Green Energy 2021, 10, 47–62. [Google Scholar] [CrossRef]
  150. Zomer, C.; Rüther, R. Simplified method for shading-loss analysis in BIPV systems–Part 1: Theoretical study. Energy Build. 2017, 141, 69–82. [Google Scholar] [CrossRef]
  151. Kader, K.A.; Rahman, F.; Nahid, N.I.; Abedin, Z.; Mannan, M.A. Design and Analysis of an On-Grid Solar System Using PVsyst Software for Commercial Application. Int. J. Sci. Eng. Res. 2021, 12, 8. [Google Scholar]
  152. Mishra, P.R.; Rathore, S.; Jain, V. PVSyst enabled real time evaluation of grid connected solar photovoltaic system. Int. J. Inf. Technol. 2024, 16, 745–752. [Google Scholar] [CrossRef]
  153. Saha, A.; Setu, S.; Das, S.; Hossain, M.I.; Rahman, A.K.; Rahman, M.M. Decision support system for community managed rainwater harvesting: A case study in the salinity-prone coastal region of Bangladesh. Heliyon 2024, 10, e30455. [Google Scholar] [CrossRef]
  154. Li, R.; Zhang, S.; Guo, Y.; Zhang, F.; Zhang, W.; Yan, J.; Li, H. Impacts of compatibility between rainwater availability and water demand on water saving performance of rainwater harvesting systems. J. Environ. Manag. 2024, 370, 122722. [Google Scholar] [CrossRef] [PubMed]
  155. Pacheco, G.C.R.; Alves, C.D.M.A. The performance of rainwater harvesting systems in the context of deep uncertainties. Proc. IAHS 2024, 385, 11–16. [Google Scholar] [CrossRef]
  156. Haque, M.M.; Rahman, A.; Samali, B. Evaluation of climate change impacts on rainwater harvesting. J. Clean. Prod. 2016, 137, 60–69. [Google Scholar] [CrossRef]
  157. Ali, S.; Zhang, S.; Chandio, F.A. Impacts of rainfall change on stormwater control and water saving performance of rainwater harvesting systems. J. Environ. Manag. 2021, 280, 111850. [Google Scholar] [CrossRef]
  158. Del Pero, C.; Aste, N.; Leonforte, F. The effect of rain on photovoltaic systems. Renew. Energy 2021, 179, 1803–1814. [Google Scholar] [CrossRef]
  159. Bošnjaković, M.; Stojkov, M.; Katinić, M.; Lacković, I. Effects of extreme weather conditions on pv systems. Sustainability 2023, 15, 16044. [Google Scholar] [CrossRef]
  160. Jackson, N.D.; Gunda, T. Evaluation of extreme weather impacts on utility-scale photovoltaic plant performance in the United States. Appl. Energy 2021, 302, 117508. [Google Scholar] [CrossRef]
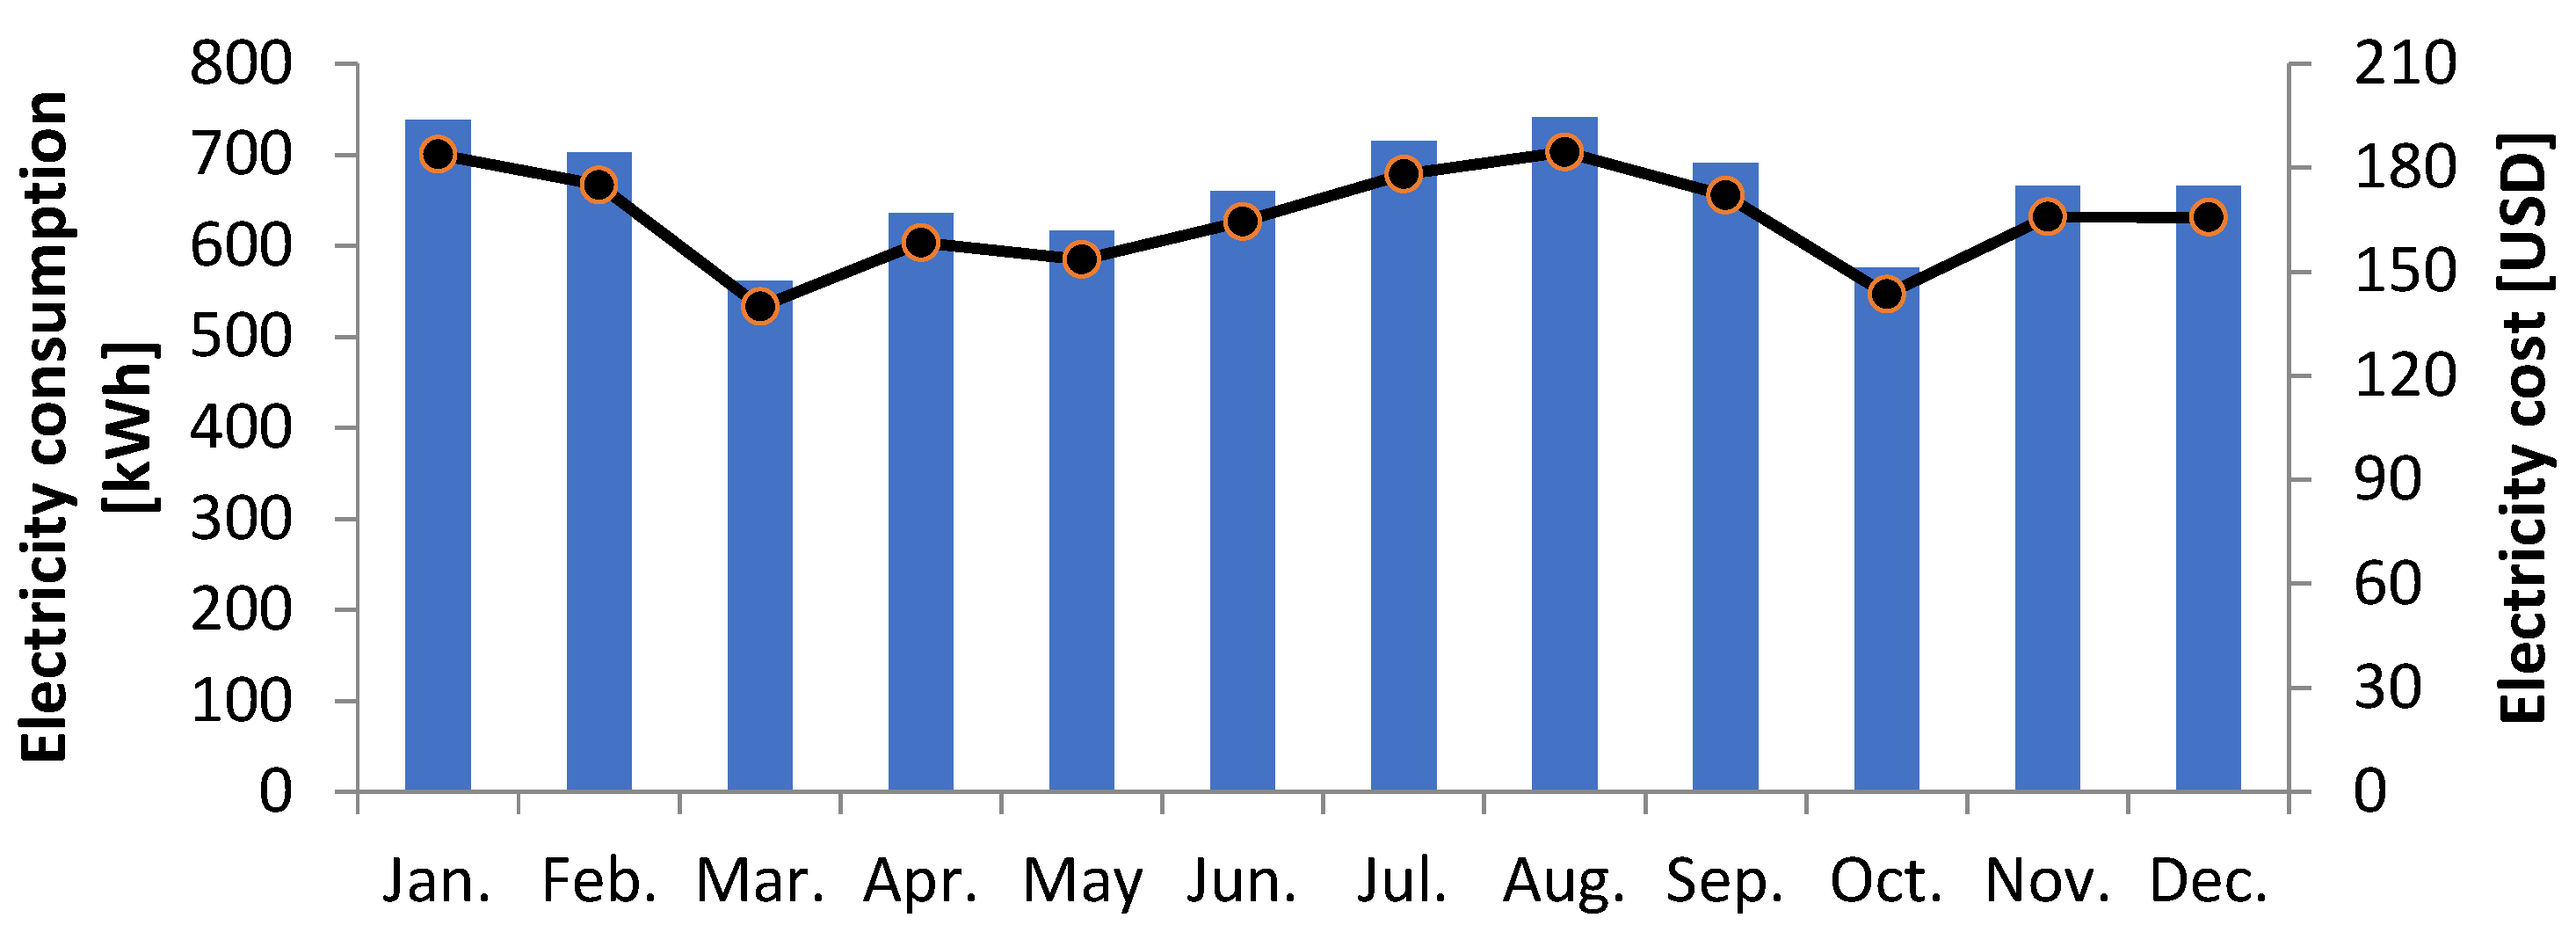
Figure 1. Monthly variation in energy demand and cost for the selected household.
Sustainability 17 08508 g001
Figure 2. Monthly water requirement and cost for both irrigation and domestic use.
Sustainability 17 08508 g002
Figure 3. A value illustration for shading distance calculations based on Equation (1).
Sustainability 17 08508 g003
Figure 4. Visual design for a system that harvests rainfall and solar energy simultaneously using SketchUp software Pro 2023.
Sustainability 17 08508 g004
Figure 5. Comparative analysis of both designs.
Sustainability 17 08508 g005
Figure 6. The selected distribution function applied in this study.
Sustainability 17 08508 g006
Figure 7. Monthly variation of rainfall data using various datasets.
Sustainability 17 08508 g007aSustainability 17 08508 g007bSustainability 17 08508 g007c
Figure 8. Seasonal variation in rainfall/precipitation using various datasets.
Sustainability 17 08508 g008aSustainability 17 08508 g008bSustainability 17 08508 g008c
Figure 9. Average daily variation of rainfall data for different seasons.
Sustainability 17 08508 g009aSustainability 17 08508 g009b
Figure 10. Maximum daily variation in rainfall data for different seasons.
Sustainability 17 08508 g010aSustainability 17 08508 g010b
Figure 11. Monthly variation of rainfall data.
Sustainability 17 08508 g011
Figure 12. Frequency histograms and best probability density function plots of average daily seasonal rainfall: (a) winter, (b) spring, (c) summer, and (d) autumn.
Sustainability 17 08508 g012
Figure 13. Frequency histograms and best probability density function plots of maximum daily seasonal rainfall: (a) winter, (b) spring, (c) summer, and (d) autumn.
Sustainability 17 08508 g013aSustainability 17 08508 g013b
Figure 18. Annual value of potential water that could be harvested at the selected locations with various tilt angles based on average daily rainfall data.
Sustainability 17 08508 g018
Figure 19. Annual value of potential water that could be harvested at the selected locations with various tilt angles based on maximum daily rainfall data.
Sustainability 17 08508 g019
Figure 20. Annual electricity exported to the grid and capacity factor of a 1 kW grid-connected PV system with various orientation angles.
Sustainability 17 08508 g020
Figure 21. Mean monthly variation of solar radiation during the period 1981–2023.
Sustainability 17 08508 g021
Figure 22. Monthly energy profile for D#1 and D#2.
Sustainability 17 08508 g022aSustainability 17 08508 g022b
Table 1. Summary of previous studies related to the hybrid renewable energy–RWH system.
ReferenceYearDescription of the StudyA Schematic of the Proposed SystemMain Findings
[52]2011Present the techno-economic feasibility of a wind–solar hybrid renewable energy generation system with a rainwater collection feature for electrical energy generation. Sustainability 17 08508 i001A building’s energy consumption can be mainly fulfilled by a developed system, which helps to make the building independent (or partially independent) from the urban electricity grid.
[53]2012Design a 3-in-1 wind–solar hybrid renewable energy and rainwater harvester. Sustainability 17 08508 i002The Power-Augmentation-Guide-Vane improved wind turbine performance by 73.2% at low wind speed (3 m/s). Combining solar panels with rainwater collection improved resource efficiency and energy capture.
[54]2016Present a technical feasibility study of a hybrid solar–wind–rain eco-roof system with natural ventilation and skylight for electrical energy generation and saving.Sustainability 17 08508 i003The hybrid eco-roof technology increased wind turbine efficiency by implementing a V-shaped roof that accelerated airflow via the Venturi effect. An automated water-based system enhanced solar PV performance by cooling and cleaning. Skylighting and integrated ventilation improved the performance of sustainable buildings, reduced the demand for artificial lighting, and improved interior comfort.
[55]2019Conduct a technical, environmental, and economic feasibility study for a hybrid renewable energy harvester system for residential applications. Sustainability 17 08508 i004The developed system can help partially meet a building’s energy needs. Besides, wind turbine performance is significantly enhanced by the hybrid energy harvesting system’s integration of a V-shaped roof guiding vane, which speeds up wind flow.
[56]2021Propose a hybrid wind and rainfall energy harvesting system that would be mounted on the sea-crossing bridge’s pipe to capture both types of energy.Sustainability 17 08508 i005By combining piezoelectric and electromagnetic phenomena, the hybrid wind and rainwater energy harvesting achieves efficient dual energy harvesting. The S-rotor and water wheel operate independently, enabling real-time wind energy capture and delayed rainfall energy generation, allowing the sea-crossing bridge’s sensors to operate continuously under a range of weather conditions.
Table 2. Specifications of the rain gauge.
PropertyDescription/Value
Sensor/transducer typeTipping bucket/reed switch
Precipitation typeLiquid
Accuracy±2%
Sensitivity0.2 mm
Closure time<100 ms (for 0.2 mm of rain)
CapacityUnlimited
Funnel diameter225 mm
Standard400 cm2
With the expander unit1000 cm2
Max. current rating500 mA
Breakdown voltage400 VDC
Capacity open contacts0.2 pF
Life (operations)108 closures
MaterialNon-corrosive aluminum alloy LM25
Dimensions390 (h) × 300 (Ø) mm
Weight2.5 kg
Temperature range (operating)0   ±   85 °C
Table 3. Summary of specifications of satellite precipitation products.
ProductDescription/Full Name of the DatasetResolutionPeriod
ERA5Fifth-generation reanalysis product of the European Centre for Medium-Range Weather Forecasts0.05°/1 d1979–present
ERA5-LandERA5-Land has been produced by replaying the land component of the ECMWF ERA5 climate reanalysis0.125° × 0.125°1963–present
ERA5 -AgAgriculture-specific dataset of the ECMWF ERA5 0.1°   ×   0.1°1979–present
MERRA-2Second-generation Modern-ERA Retrospective Analysis for Research and Applications0.5° × 0.625°1980–present
TerraClimateGlobal gridded dataset of meteorological and water balance for global terrestrial surfaces0.042 ° ×   0.042°1958–present
CHIRPSA new land-only climatic database for precipitation, obtained through the Climate Hazards Group of the University of California at Santa Barbara (UCSB)0.05°   ×   0.05°1981–present
CFSRNCEP (NOAA NWS National Centers for Environmental Prediction) Climate Forecast System Reanalysis dataset1/5°1979–present
CPC-CMORPHThe Satellite Precipitation—CMORPH Climate Data Record (CDR) consists of satellite precipitation estimates that have been bias-corrected and reprocessed using the Climate Prediction Center (CPC) Morphing Technique (MORPH) to form a global, high-resolution precipitation analysis0.5°   ×   0.5°1998–present
CPC-UPPThis data set is part of the products suite from the Climate Prediction Center (CPC) Unified Precipitation Project (UPP) that is underway at NOAA CPC0.5°   ×   0.5°1979–present
Table 4. Specifications of the selected module.
SpecificationValue
Mechanical Characteristics
Module typeJKM360M-66H
Cell typeMono PERC 158.75 × 158.75mm
Number of cells132 (6 × 22)
Weight20.0 kg
Electrical CharacteristicsSTCNOCT
Maximum power (Pmax)360 Wp268 Wp
Maximum power voltage (Vmp)36.97 V33.78 V
Maximum power current (Imp)9.74 A7.93 A
Open-circuit voltage (Voc)43.58 V41.04 V
Short-circuit current (Isc)10.48 A8.46 A
Module efficiency STC (%)19.52%
Operating temperature (°C)−40 °C~+85 °C
Temperature coefficients of Pmax−0.35%/°C
Temperature coefficients of Voc−0.28%/°C
Temperature coefficients of Isc0.048%/°C
Nominal operating cell temperature (NOCT)45 ± 2 °C
STC: standard test conditions; NOCT: nominal operating cell temperature.
Table 5. Values of shading distance with various tilt angles.
Tilt Angle [°]Shading Distance [M]
100.3
200.6
300.9
401.1
501.3
601.5
701.6
801.7
Table 6. Economic and financial parameters used in this study.
ParameterUnitValue
PV module costUSD/Watt0.30
The lifetime of the PV moduleYear25
Cost of the inverterUSD2600
Cost of plastic tankUSD792
Support structure for solar panelUSD/kW150
Rainwater collection channelUSD/m225
Miscellaneous/contingency fund% of the total initial cost3
Installation and spare parts% of the total initial cost8.6
The lifetime of the inverterYear10
Feasibility study, development, and engineering cost% of the total initial cost0.6
Inverter replacement periodic costEvery ten yearsEqual to the inverter’s cost
Inflation rate%8
Discount rate%6
Project lifeYear25
Energy cost increase rate%5
Reinvestment rate%9
Debt ratio%70
Debt interest rate%0
Debt termYear20
Table 7. Performance of global precipitation datasets.
DatasetMonthly Seasonally
R-SquaredRMSE [mm]MAE [mm]R-SquaredRMSE [mm]MAE [mm]
CHIRPS0.9119.0611.900.9947.7233.62
CFSR0.8919.6716.570.9756.4949.71
ERA5 LAND0.9316.5613.720.9946.9541.16
ERA50.953.813.231.002.872.60
ERA5-Ag0.946.504.890.9915.7514.66
MERRA20.918.226.280.9620.0316.54
CPC-CMORPH0.8114.7012.360.9040.9237.08
CPC-UPP0.7411.029.010.7928.2023.49
TerraClimate0.9213.748.890.9436.5924.06
Table 8. The best distribution function for average daily rainfall (Rank #1).
MonthDFTestClassificationParameter
JanJohnson SBKSContinuous-Boundedγ = 0.18753 δ = 0.92797 λ = 4.6823 ξ = 0.03519
Johnson SBADContinuous-Boundedγ = 0.18753 δ = 0.92797 λ = 4.6823 ξ = 0.03519
NormalC-sContinuous-Unboundedσ = 1.0229 μ = 2.1858
FebDagum (4P)KSContinuous-Non-negativek = 0.30979 α = 5.685 β = 1.9334 γ = 0.32815
Dagum (4P)ADContinuous-Non-negativek = 0.30979 α = 5.685 β = 1.9334 γ = 0.32815
LevyC-sContinuous-Non-negativeσ = 1.4103
MarLog-Logistic (3P)KSContinuous-Non-negativeα = 2.3899 β = 0.90586 γ = 0.04141
WakebyADContinuous-Advancedα = 1.6205 β = 3.0465 γ = 0.51091 δ = 0.19898 ξ = 0.13324
Log-Logistic (3P)C-sContinuous-Non-negativeα = 2.3899 β = 0.90586 γ = 0.04141
AprInv. Gaussian (3P)KSContinuous-Non-negativeλ = 3.6049 μ = 1.1232 γ = −0.1355
WakebyADContinuous-Advancedα = 8.3601 β = 26.197 γ = 0.75358 δ = −0.10774 ξ = 0
Weibull (3P)C-sContinuous-Non-negativeα = 1.3339 β = 0.88001 γ = 0.17673
MayWakebyKSContinuous-Advancedα = 1.4478 β = 0.37189 γ = 0 δ = 0 ξ = −0.01538
WakebyADContinuous-Advancedα = 1.4478 β = 0.37189 γ = 0 δ = 0 ξ = −0.01538
Johnson SBC-sContinuous-Boundedγ = 0.91051 δ = 0.89552 λ = 3.9419 ξ = −0.16837
JunJohnson SBKSContinuous-Boundedγ = 1.572 δ = 0.91146 λ = 1.534 ξ = −0.02936
WakebyADContinuous-Advancedα = 0.29902 β = 0.10448 γ = 0 δ = 0 ξ = 9.5636 × 10⁻⁴
Erlang (3P)C-sContinuous-Non-negativem = 1 β = 0.25206 γ = 0.0135
JulLog-Pearson 3KSContinuous-Advancedα = 18.887 β = −0.35822 γ = 2.7703
Phased Bi-WeibullADContinuous-Advancedα1 = 0.99972 β1 = 0.01554 γ1 = 0 α2 = 0.67204 β2 = 0.03706 γ2 = 0.00261
Log-LogisticC-sContinuous-Non-negativeα = 1.0305 β = 0.01698
AugLog-Pearson 3KSContinuous-Advancedα = 2.2362 β = −1.0863 γ = −0.67154
DagumADContinuous-Non-negativek = 0.21083 α = 3.154 β = 0.18395
Gen. LogisticC-sContinuous-Advancedk = 0.33186 σ = 0.04097 μ = 0.06905
SepLognormalKSContinuous-Non-negativeσ = 0.79939 μ = −1.057
Lognormal (3P)ADContinuous-Non-negativeσ = 0.77923 μ = −1.0317 γ = −0.00649
WakebyC-sContinuous-Advancedα = 2.4861 β = 24.442 γ = 0.32909 δ = 0.11924 ξ = 0
OctJohnson SBKSContinuous-Boundedγ = 0.42553 δ = 0.64897 λ = 2.7761 ξ = 0.09971
Johnson SBADContinuous-Boundedγ = 0.42553 δ = 0.64897 λ = 2.7761 ξ = 0.09971
WeibullC-sContinuous-Non-negativeα = 1.505 β = 1.2768
NovBurr (4P)KSContinuous-Non-negativek = 410.35 α = 2.2025 β = 19.348 γ = 0.10019
Gen. Extreme ValueADContinuous-Advancedk = −0.16419 σ = 0.51505 μ = 0.99221
DagumC-sContinuous-Non-negativek = 0.30935 α = 6.5299 β = 1.6691
DecWakebyKSContinuous-Non-negativeα = 15.39 β = 14.166 γ = 0.89436 δ = −0.07454 ξ = 0.03718
WakebyADContinuous-Advancedα = 15.39 β = 14.166 γ = 0.89436 δ = −0.07454 ξ = 0.03718
WakebyC-sContinuous-Advancedα = 15.39 β = 14.166 γ = 0.89436 δ = −0.07454 ξ = 0.03718
Table 9. The best distribution function for seasonally daily rainfall (Rank #1).
SeasonDFTestClassificationParameter
WinterErrorKSContinuous-Unboundedk = 4.0395 σ = 1.511 μ = 5.6338
Johnson SBADContinuous-Boundedγ = 0.23375 δ = 1.004 λ = 7.3287 ξ = 2.3215
Gen. Extreme ValueC-sContinuous-Advancedk = −0.20079 σ = 1.4778 μ = 5.03
SpringJohnson SBKSContinuous-Boundedγ = 2.0689 δ = 2.1565 λ = 15.213 ξ = −1.1827
Johnson SBADContinuous-Boundedγ = 2.0689 δ = 2.1565 λ = 15.213 ξ = −1.1827
TriangularC-sContinuous-Boundedm = 1.9374 a = 0.47754 b = 7.2821
SummerLog-Pearson 3KSContinuous-Advancedα = 20.475 β = −0.18999 γ = 2.6709
WakebyADContinuous-Advancedα = 0.47551 β = 0.27013 γ = 0 δ = 0 ξ = 0.02749
Fatigue Life (3P)C-sContinuous-Non-negativeα = 0.77395 β = 0.33182 γ = −0.03038
AutumnWakebyKSContinuous-Advancedα = 3.2617 β = 1.0513 γ = 0.07273 δ = 0.53543 ξ = 1.0616
WakebyADContinuous-Advancedα = 3.2617 β = 1.0513 γ = 0.07273 δ = 0.53543 ξ = 1.0616
Pearson 6 (4P)C-sContinuous-Non-negativeα1 = 6.2001 α2 = 133.47 β = 56.203 γ = 0.17101
Table 10. The best distribution function for maximum daily rainfall (Rank #1).
MonthDFTestClassification Parameter
JanDagumKSContinuous-Non-negativek = 0.47664 α = 4.5829 β = 19.002
Johnson SBADContinuous-Boundedγ = 1.9767 δ = 1.599 λ = 72.121 ξ = −1.8612
Log-Pearson 3C-sContinuous-Advancedα = 17.449 β = −0.13141 γ = 4.9063
FebGen. LogisticKSContinuous-Advancedk = 0.25388 σ = 4.0656 μ = 13.288
Burr (4P)ADContinuous-Non-negativek = 0.95673 α = 3.9551 β = 15.408 γ = −2.3151
Gen. LogisticC-sContinuous-Advancedk = 0.25388 σ = 4.0656 μ = 13.288
MarGen. LogisticKSContinuous-Advancedk = 0.31917 σ = 3.2124 μ = 8.5246
WakebyADContinuous-Advancedα = 18.346 β = 3.4325 γ = 3.4914 δ = 0.32051 ξ = 1.1552
Frechet (3P)C-sContinuous-Non-negative/Unboundedα = 4.4227 β = 18.71 γ = −11.865
AprGamma (3P)KSContinuous-Non-negativeα = 1.9461 β = 3.9671 γ = 1.0613
TriangularADContinuous-Boundedm = 2.6375 a = 1.0479 b = 22.451
Log-Logistic (3P)C-sContinuous-Non-negativeα = 2.7315 β = 7.6946 γ = −0.19962
MayJohnson SBKSContinuous-Boundedγ = 0.95882 δ = 0.76586 λ = 44.446 ξ = −0.82892
Johnson SBADContinuous-Boundedγ = 0.95882 δ = 0.76586 λ = 44.446 ξ = −0.82892
Levy (2P)C-sContinuous-Non-negativeσ = 3.7662 γ = 0.15548
JunLog-Pearson 3KSContinuous-Advancedα = 12.186 β = −0.32963 γ = 4.922
Log-Pearson 3ADContinuous-Advancedα = 12.186 β = −0.32963 γ = 4.922
Frechet (3P)C-sContinuous-Non-negative/Unboundedα = 2.0452 β = 3.8148 γ = −1.9001
JulPareto 2KSContinuous-Non-negativeα = 2.1788 β = 1.0299
BurrADContinuous-Non-negativek = 38.604 α = 0.76293 β = 78.059
LognormalC-sContinuous-Non-negativeσ = 1.5801 μ = −1.1549
AugWakebyKSContinuous-Advancedα = 2.5662 β = 1.3486 γ = 0.25904 δ = 0.41054 ξ = −0.19362
WakebyADContinuous-Advancedα = 2.5662 β = 1.3486 γ = 0.25904 δ = 0.41054 ξ = −0.19362
Gen. ParetoC-sContinuous-Non-negative/Unboundedk = −0.3155 σ = 1.8361 μ = −0.05725
SepGen. Gamma (4P)KSContinuous-Non-negativek = 0.81775 α = 0.92604 β = 5.0817 γ = 1.1591
Gen. ParetoADContinuous-Non-negative/Unboundedk = 0.25254 σ = 3.6722 μ = 1.0147
WakebyC-sContinuous-Advancedα = 51.126 β = 44.732 γ = 3.489 δ = 0.27459 ξ = 0
OctPhased Bi-WeibullKSContinuous-Advancedα1 = 1.0577 β1 = 13.578 γ1 = 1 α2 = 1.7341 β2 = 13.127 γ2 = 12.453
Gen. ParetoADContinuous-Non-negative/Unboundedk = −0.11597 σ = 11.494 μ = 1.3564
ReciprocalC-sContinuous-Boundeda = 1.8756 b = 48.89
NovWakebyKSContinuous-Advancedα = 51.208 β = 5.7024 γ = 5.5576 δ = −0.04698 ξ = −0.29588
WakebyADContinuous-Advancedα = 51.208 β = 5.7024 γ = 5.5576 δ = −0.04698 ξ = −0.29588
Error functionC-sContinuous-Unboundedk = 1.8886 σ = 6.3089 μ = 12.653
DecWakebyKSContinuous-Advancedα = 174.22 β = 23.352 γ = 7.8323 δ = 0.00332 ξ = 0
WakebyADContinuous-Advancedα = 174.22 β = 23.352 γ = 7.8323 δ = 0.00332 ξ = 0
NakagamiC-sContinuous-Non-negativem = 0.85455 Ω = 284.19
Table 11. Best distribution function for seasonally maximum daily rainfall (Rank #1).
SeasonDFTestClassification Parameter
WinterWakebyKSContinuous-Advancedα = 2105.9 β = 87.559 γ = 30.657 δ = −0.49652 ξ = 0
Johnson SBADContinuous-Boundedγ = 0.59032 δ = 0.95127 λ = 71.693 ξ = 17.303
Pearson 5C-sContinuous-Non-negativeα = 8.9676 β = 355.01
SpringWakebyKSContinuous-Advancedα = 119.98 β = 13.908 γ = 17.447 δ = −0.1198 ξ = 6.8618
WakebyADContinuous-Advancedα = 119.98 β = 13.908 γ = 17.447 δ = −0.1198 ξ = 6.8618
WakebyC-sContinuous-Advancedα = 119.98 β = 13.908 γ = 17.447 δ = −0.1198 ξ = 6.8618
SummerJohnson SBKSContinuous-Boundedγ = 0.77046 δ = 0.53354 λ = 17.666 ξ = 1.0915
WakebyADContinuous-Advancedα = 6.5362 β = 0.16191 γ = 0 δ = 0 ξ = 0.50184
Frechet (3P)C-sContinuous-Non-negative/Unboundedα = 2.7693 β = 7.4869 γ = −4.0114
AutumnBurrKSContinuous-Non-negativek = 1.082 α = 4.2353 β = 27.892
Gen. LogisticADContinuous-Advancedk = 0.23139 σ = 6.4346 μ = 27.028
Inv. GaussianC-sContinuous-Non-negativeλ = 123.57 μ = 29.637
Table 12. Economic performance and a net annual reduction in GHG emissions.
Economic Performance of D#1
NPV [USD]EP [year]SP [year]LCOE [USD/kWh]B-CALCS [USD/year]
317442.87.40.0415.752483
Net annual reduction of GHG emissions of D#1
Net annual GHG emission reduction [tCO2]Cars and light trucks are not usedPeople are reducing energy use by 20%Hectares of forest absorbing carbon
19.43.619.41.8
Economic Performance of D#2
NPV [USD]EP [year]SP [year]LCOE [USD/kWh]B-CALCS [USD/year]
548271.85.00.0289.104289
Net annual reduction of GHG emissions of D#2
Net annual GHG emission reduction [tCO2]Cars and light trucks are not usedPeople are reducing energy use by 20%Hectares of forest absorbing carbon
29.05.329.010.0
Disclaimer/Publisher’s Note: The statements, opinions and data contained in all publications are solely those of the individual author(s) and contributor(s) and not of MDPI and/or the editor(s). MDPI and/or the editor(s) disclaim responsibility for any injury to people or property resulting from any ideas, methods, instructions or products referred to in the content.