Article

Improving the Thermal Environment of Abuja’s Affordable Housing Through Passive Design Solutions

by
Mahmood Abdulkareem
1 and
Sura Al-Maiyah
2,*
1
Core Architects Inc., Toronto, ON M5A 0P6, Canada
2
School of Architecture, Building, and Civil Engineering, Loughborough University, Loughborough LE11 3TU, UK
*
Author to whom correspondence should be addressed.
Sustainability 2025, 17(18), 8435; https://doi.org/10.3390/su17188435
Submission received: 19 July 2025 / Revised: 27 August 2025 / Accepted: 5 September 2025 / Published: 19 September 2025
(This article belongs to the Special Issue Analysis on Real-Estate Marketing and Sustainable Civil Engineering)

Abstract

West Africa is increasingly becoming more vulnerable to extreme heat due to climate change intensification with forecasts predicting hazardous heat days to double by 2060 affecting all societal classes and life sectors. This study examines the relationship between urbanisation, energy-efficient building design, and government guidelines within the Nigerian context. The review of the current national building codes and energy efficiency regulations revealed an alarming gap regarding the abandonment of basic sustainable design practices when addressing the needs of low-income housing. Validated simulations were used to assess the thermal performance of six distinct residential prototypes for low- and middle-income mass housing, which were previously developed by the government and are still used today as development blueprints. The effectiveness of incorporating passive design solutions into the selected prototypes was examined, providing insights into their thermal performance and practical recommendations for improving occupants’ comfort. The findings highlight the value of utilising a combination of passive design methods to achieve occupant thermal comfort, suggesting a reduction of up to 20% in the frequency of thermal discomfort during the hottest period of the year. The study advocates for more comprehensive guidelines to facilitate sustainable housing design that prioritises low-cost passive approaches to enhance indoor comfort and reduce reliance on conventional energy sources, ultimately fostering resilience in the face of climate change.

1. Introduction

The rising exposure of African populations, including Nigerian communities, to extreme heat is concerning, with projections indicating an increase of 225% by 2060 [1]. The frequency of heat waves in Africa’s western region, where Nigeria is located, is also expected to rise from nearly 60 to 130 days per year in the next 35 years. These accelerating trends and the overall future intensification of climate change in the region are likely to lead to a greater dependence on conventional energy sources for mechanical cooling, which will, in turn, contribute to global greenhouse gas emissions.
Africa’s 300 million households make up over 56% of the continent’s total energy demand, despite 120 million households still lacking access to electricity [2]. While the region’s abundant solar irradiation presents significant opportunities for the continent, the higher initial costs of renewable energy technologies make these options unaffordable for households with limited disposable income and more constrained access to financing [3]. Nigeria has the largest population in Africa, with over 215 million citizens [4]. There are several problems associated with trying to improve thermal comfort in the Nigerian housing sector through conventional energy sources. The primary issue is the inconsistent and irregular supply of electricity across the country. Only 15% of metered customers are likely to receive up to 20 h of electricity daily with the majority receiving as little as 4 h, while more than 25% of households still lack access to a grid-based power supply. Moreover, the increasing demand for electricity places further strain on the capacity of the power grid, making it more vulnerable to outages, particularly during heat waves [3,5]. Additionally, the use of backup power generators, a common practice in Nigeria, is becoming both environmentally and financially unsustainable, given the rising fuel prices in recent years. Between May 2023 and April 2024, the cost of petrol and diesel in Nigeria rose by 223% and 166%, respectively [6].
All these problems disproportionately affect Nigerian society, particularly low-income households. Yet the contemporary residential building design practice in the country has largely overlooked the needs of low-income households, contributing to inefficient energy use in the housing sector. In affordable housing development, integrating passive design solutions to adapt to increasing heatwaves is highly beneficial to occupants as they are cost-effective and do not require energy use for operation [7]. However, the value of their use within the current housing development does not seem to be understood.

2. A Missed Opportunity to Passively Elevate Abuja’s Affordable Housing Design

The Nigerian government planned the capital city of Abuja in the late 1970s, and development commenced in the 1980s [8]. Consequently, large sections of the urban fabric of the city, including mass housing estates, were created by the public sector. Over the first three decades of the developmental phases, the government constructed most of the residential buildings based on similar architectural prototypes. Between 1975 and 1995, over 100,000 houses were built in urban areas in Nigeria by both state and federal governments [9]. In addition to the residential building ‘prototypes’ produced by the government, which make up a significant portion of the urban housing stock in Nigeria, the codes and standards for residential building development favoured the architectural typology adopted by the government [10].
However, over the past two decades, the government has made concerted efforts towards meeting Nigeria’s housing needs by creating policies encouraging private sector involvement in mass housing development [11]. This was particularly notable in Abuja, which has experienced an upsurge in mass housing constructions driven by private developers [12]. Despite these efforts, the latest housing policies and programmes have largely overlooked the need for sustainable housing development, focusing mainly on the number of housing units delivered. Affordable housing estates often feature low design standards and construction quality [13], while houses developed for middle and high-income groups (Figure 1) place more emphasis on desired aesthetics, often requiring mechanical cooling systems to maintain thermal comfort. This narrative highlights a missed opportunity in the country’s recent housing policies, which could have been better utilised to improve the design and construction of affordable housing, thereby enhancing their environmental performance. Several factors have contributed to the current construction practice and the missed opportunity to elevate the design quality of Abuja’s residential buildings.
Many developers, architects, and engineers in Nigeria have limited awareness and knowledge of climatic response design and the application of passive design principles. Training and education on sustainable design practices are not widely integrated into professional curricula or mainstream construction practices [14]. In addition, the misconception that alternative solutions to established practices will result in higher upfront costs discourages developers who are interested in turning a profit. This assumption is solely based on the cost of materials and products [15]. When constructing buildings, both public and private sector developments prioritise short-term affordability rather than the long-term benefits of energy efficiency and enhanced building performance. Moreover, developers of luxury residential buildings for high-income groups often prioritise aesthetics that follow foreign trends of elegance [16] over sustainable aspects. All these issues are inherently linked to the government’s lack of policies that encourage or incentivise green building development and its weak regulatory framework for energy-efficient building construction. Kawuwa [17] suggests that developers are reluctant to follow the existing building codes due to their limitations and ambiguity, making it difficult for architects and developers to translate them into practice. In interviews with construction professionals, Dahiru et al. [18] found that many thought the National Building Code evolved from foreign regulations, which are mostly unsuitable for Nigeria.
Section 3 provides a brief overview of the content of the national building code, including the types of technical requirements. This is followed by Section 4, which explains the motivation behind the study, its aim and focus.

3. Nigeria’s National Building Code (NBC) and Building Energy Efficiency Code (BEEC)

The current requirements for residential building development in Nigeria are set in a single document named the National Building Code (NBC). The specifications for residential buildings in the code include considerations of natural ventilation, occupancy, and building materials. The code specifies that habitable rooms within a dwelling unit shall be provided with natural ventilation using exterior openings that can be opened, with an area of not less than 5% of the floor area. Also, any mechanical ventilation system used instead of an exterior opening should be able to provide two air changes per hour (ACH) in the room [19]. The building code provides specifications for the durability and structural strength of a variety of building materials, from glass to reinforced concrete; however, there are no standards set for the thermal properties of materials (i.e., thermal resistance and thermal transmittance). Seeking to rectify these gaps, a National Building Energy Efficiency Code (BEEC) was developed in 2016 based on research conducted in Abuja.
The new code sought to set minimum energy efficiency requirements for buildings and offer guidelines for their proper implementation, control, and enforcement [20]. Nevertheless, the requirements created are imprecise. For instance, the code specifies that the window-to-wall ratio (WWR) should not exceed 20% per floor area, and adequate horizontal shading must be provided if the WWR exceeds 20%. The code seemingly overlooks the need for adjustments based on different orientations, room properties, and the contrasting climatic conditions between the hot-humid southern region and the hot-dry northern region of the country. Effectively, only four thermal performance requirements are outlined: a 20% maximum overall WWR, 1.25 m2K/W minimum roof insulation, 5.8 W/m2K single glazing, and air conditioners with 2.8 EER/COP cooling [21]. To clarify further, Table 1 illustrates how these requirements compare to those specified in other relevant standards, such as the South African National Building Standards (SANS) and the American Society of Heating, Refrigerating and Air-Conditioning Engineers (ASHRAE) Standards. Both SANS and ASHRAE provide more variable guidelines for building designers to implement sustainable solutions, particularly regarding openings in the building envelope.
The limited range of standards specified in the codes for architectural design, planning and development control does not reflect the awareness of the need for region-specific, climate-conscious building design in Nigeria. This issue is highlighted by other researchers. Ochedi and Taki [22], for instance, pointed out that there is a lack of effort to promote and enforce energy-efficient building design standards within the Nigerian building sector. Macaulay et al. [23] evaluated the compliance of estate buildings with BEEC requirements by surveying architects, engineers, planners, and developers involved in the construction of housing estates in Abuja. The investigation revealed that, on average, 38.5% of the professionals were unaware of the various BEEC guidelines, and 43.5% did not apply them in the construction of housing estates.

4. Thermal Comfort in Nigeria’s Residential Buildings: Literature Review

Several studies investigated the thermal environment in houses in Nigeria. Adaji et al. [24] evaluated occupants’ comfort in four residential buildings in Abuja using a survey of nearly 170 households, on-site measurements and simulations. Over 75% of the participants were dissatisfied with the thermal conditions in their homes, where the temperatures recorded exceeded 30 °C for 70–90% of the period assessed. Odimegwu [25] investigated the thermal performance of over 80 households in Abia, revealing that 70% of the buildings performed poorly. Poor ventilation, thermal mass, overdevelopment, and inadequate building setbacks were identified as partial causes of the thermal discomfort experienced in the buildings. Jegede and Taki [13] used simulation modelling to explore the possibility of optimising the thermal performance of a residential building in Abuja by using indigenous materials and passive design solutions. The optimised model showed a 36% reduction in cooling load as compared to a base-case model. Abbakyari and Taki [26] studied different passive design methods to improve the energy efficiency of existing mass housing in Abuja. They found that a combination of passive design measures, including using compressed earth bricks, optimising orientation, wall colour, window-to-wall ratio, and shading, could lead to a 30% reduction in the house’s cooling load. Onyenokporo and Ochedi [27] proposed a range of affordable retrofit options for improving thermal comfort in residential buildings in Lagos. They predicted that these interventions could reduce indoor temperatures by 3 °C and lower household energy consumption by 46%. Okonta [28] explored the influence of building materials on interior cooling of a typical three-bedroom apartment in three distinct climatic zones of Nigeria: Lagos, Minna, and Maiduguri. The use of insulations in the building envelope and shading elements resulted in reductions of over 30% in annual cooling in two cities. Usman [29] evaluated the effect of roof configurations on indoor thermal comfort in Bauchi. Incorporating insulation and ventilation in the roof design, along with using bright colours, improved the frequency of thermal comfort by up to 45%.
Despite the shared emphasis on occupant comfort and building design, very few of these studies focused on evaluating the thermal performance of low-income houses in Abuja [13,22,24]. This identified gap was the primary motivation for this study. Consequently, the study aims to examine the effectiveness of using basic passive design methods in enhancing the thermal environment in Abuja’s low-income housing development. Perera et al. investigated the possible energy savings from incorporating various passive design elements in a typical high-rise residential building in three tropical sub-climates in Sri Lanka. The study found that the use of various passive design elements such as low emissivity glazing, window shading elements, and low conducting exterior walls can reduce energy consumption by over 30% [30]. Other recent studies have identified the potential benefits of utilising passive design strategies solution for improving indoor thermal comfort in tropical regions [31,32,33,34]. It is noteworthy, that these studies provide a guide for the incorporation of low-cost passive design elements that are a feasible solution for improving the thermal performance of future housing developments. The study presents the results of assessing the thermal performance of a range of typical housing prototypes in Abuja, aiming to offer evidence on how passive design solutions affect the thermal environment of existing low-income residential buildings to guide future design practices.

5. Climatic Context of Abuja

Located in the central region of Nigeria at latitude 9°06′ N and longitude 7°49′ E, Abuja has a tropical savannah climate with two prevalent seasons, namely the dry season and the rainy season. The former begins in November and continues through April, while the latter starts in May and ends around October [35]. The dry season is marked by clear skies and intense solar radiation (5.9–6.3 kWh/m2/day), which causes daytime temperatures to rise to around 37 °C [36]. The difference between day and night temperatures in the city is wide owing to the dissipation of daily solar radiation beyond the atmosphere. Temperatures around dawn can be 15–17 °C cooler than those recorded during midday. During the rainy season, the combination of solar radiation (4.2–5.6 kWh/m2/day) and high humidity results in the formation of dense clouds, leading to torrential rain, which has a cooling effect. Nevertheless, day temperatures can still rise above 28 °C [37]. Another significant difference between the dry and rainy seasons is the relative humidity. The average relative humidity during the dry season is around 38%, while during the rainy season, it increases to about 82% peaking at around 87% in August [38]. The findings reported in this study focus primarily on the dry season, given the high temperatures in Abuja at this time of year and the negative effects on indoor environmental quality.

6. Case Study Housing Prototypes

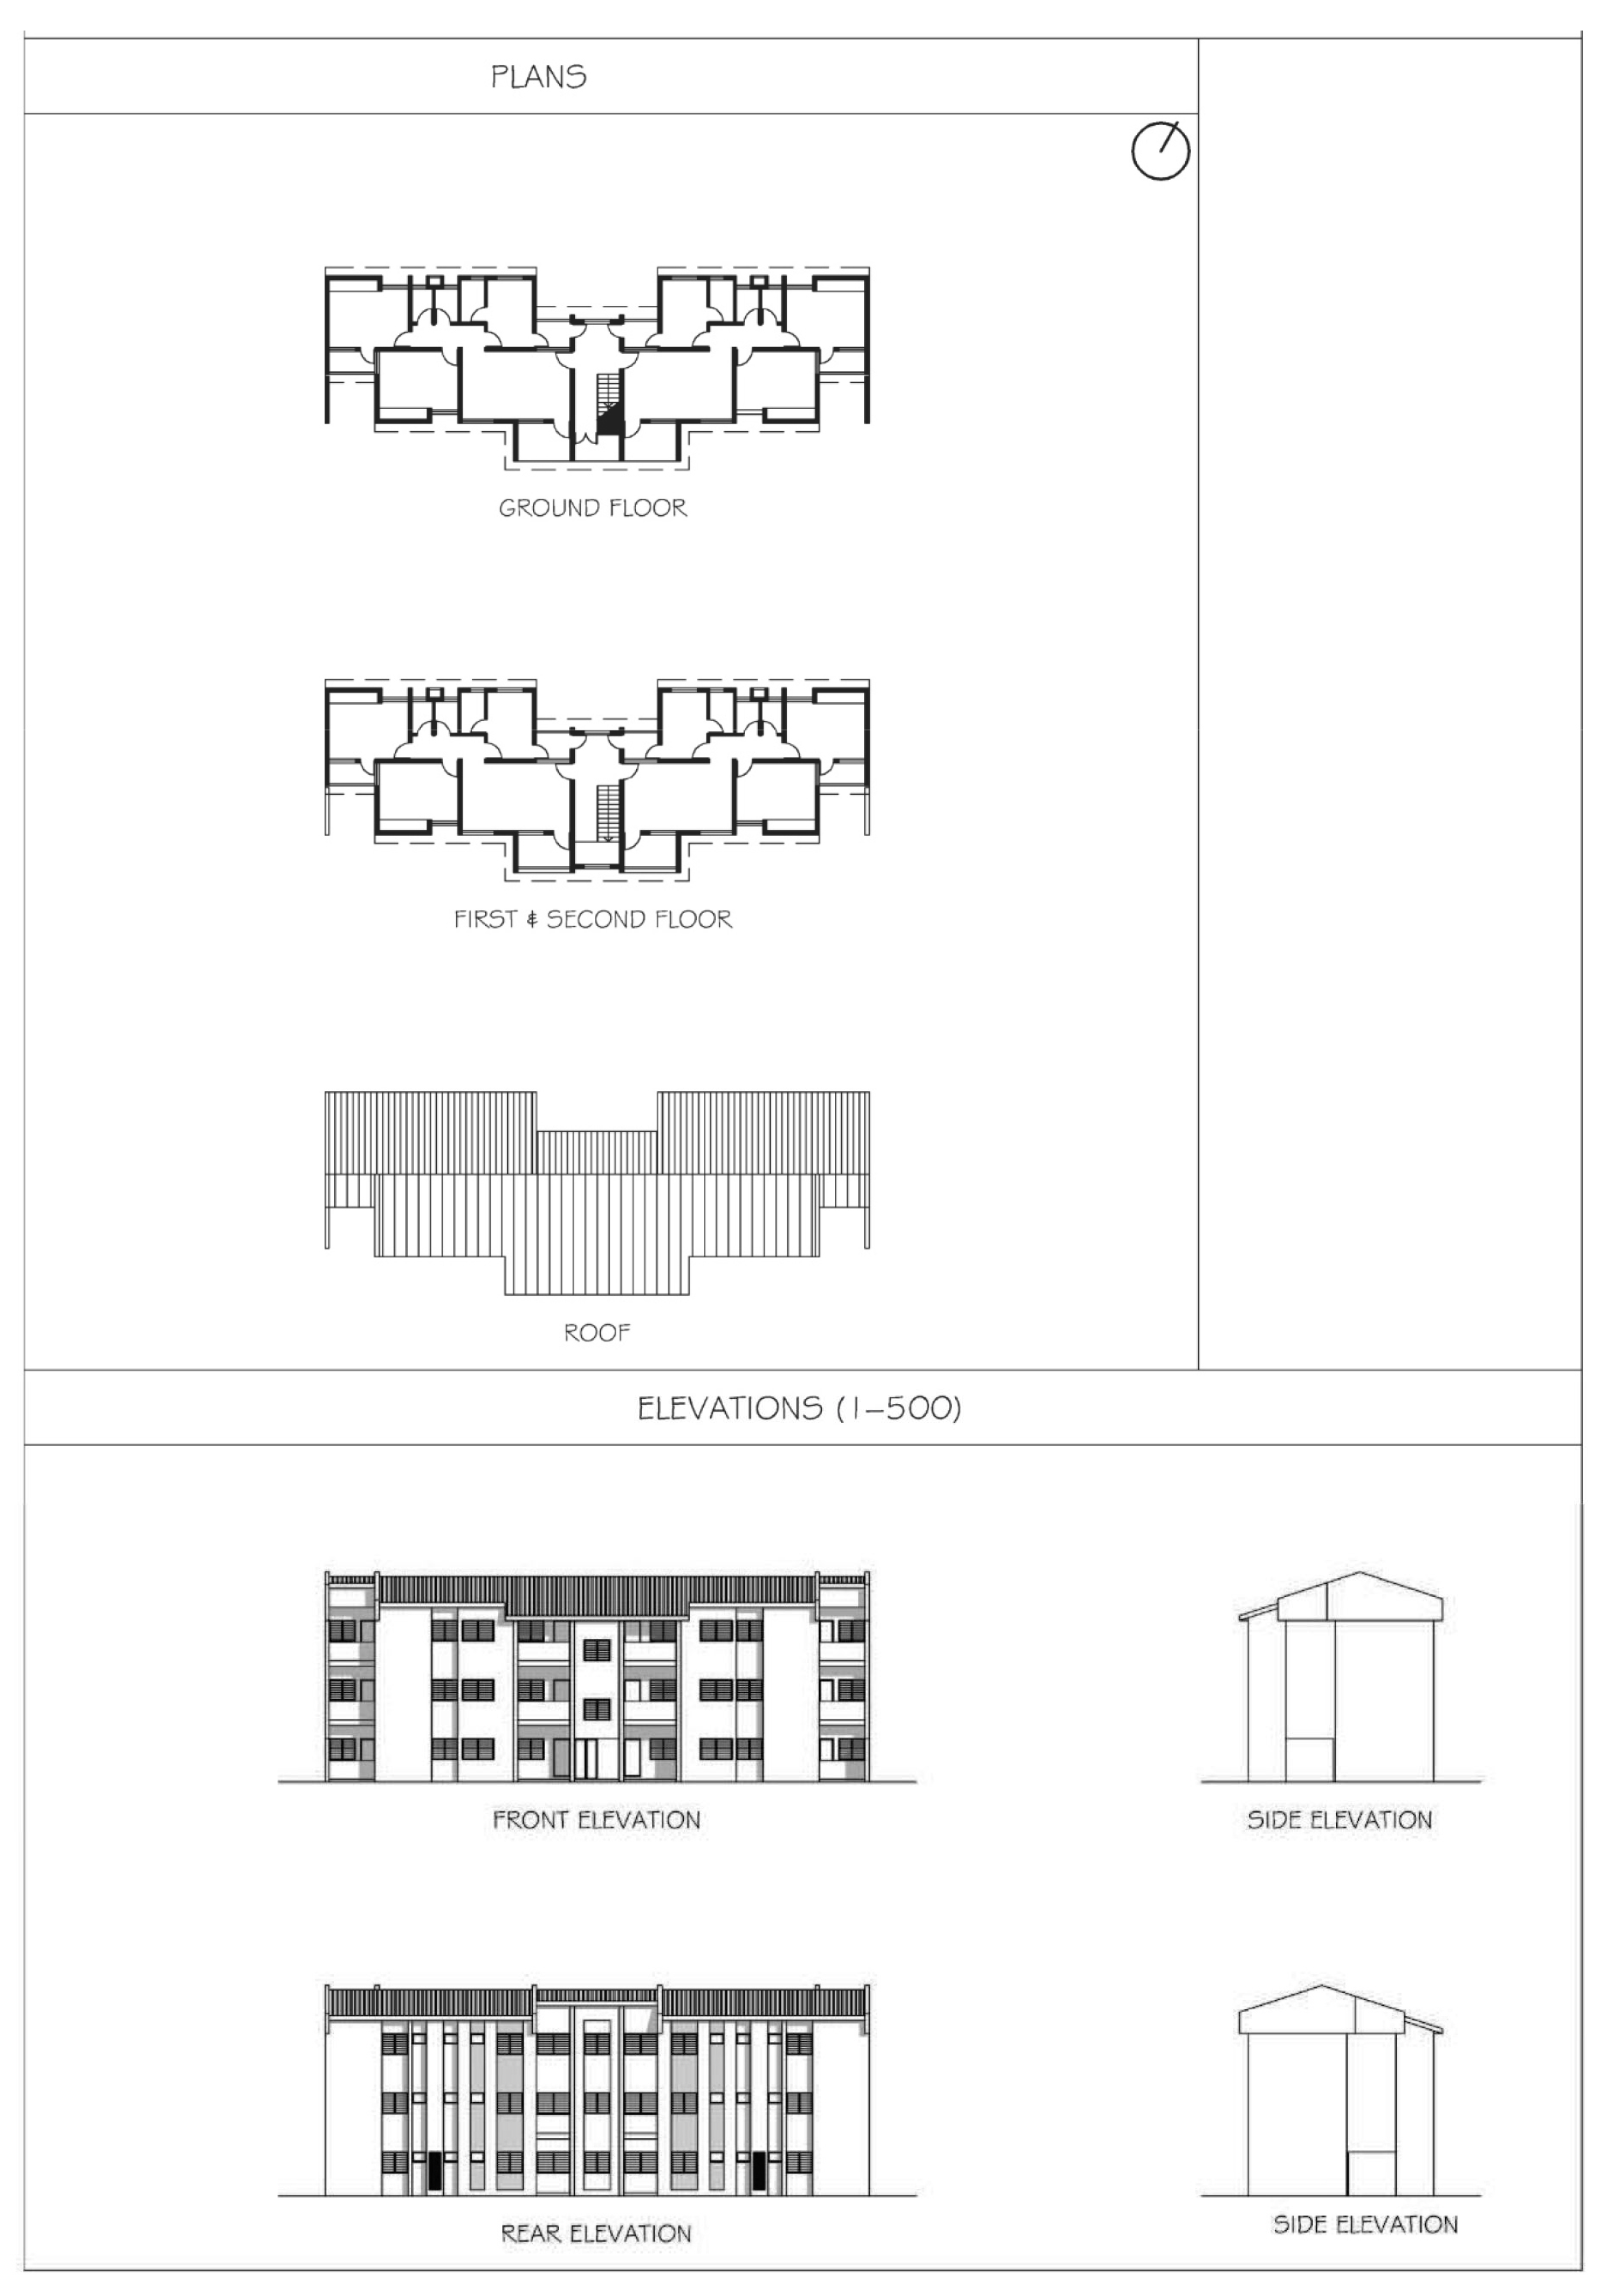
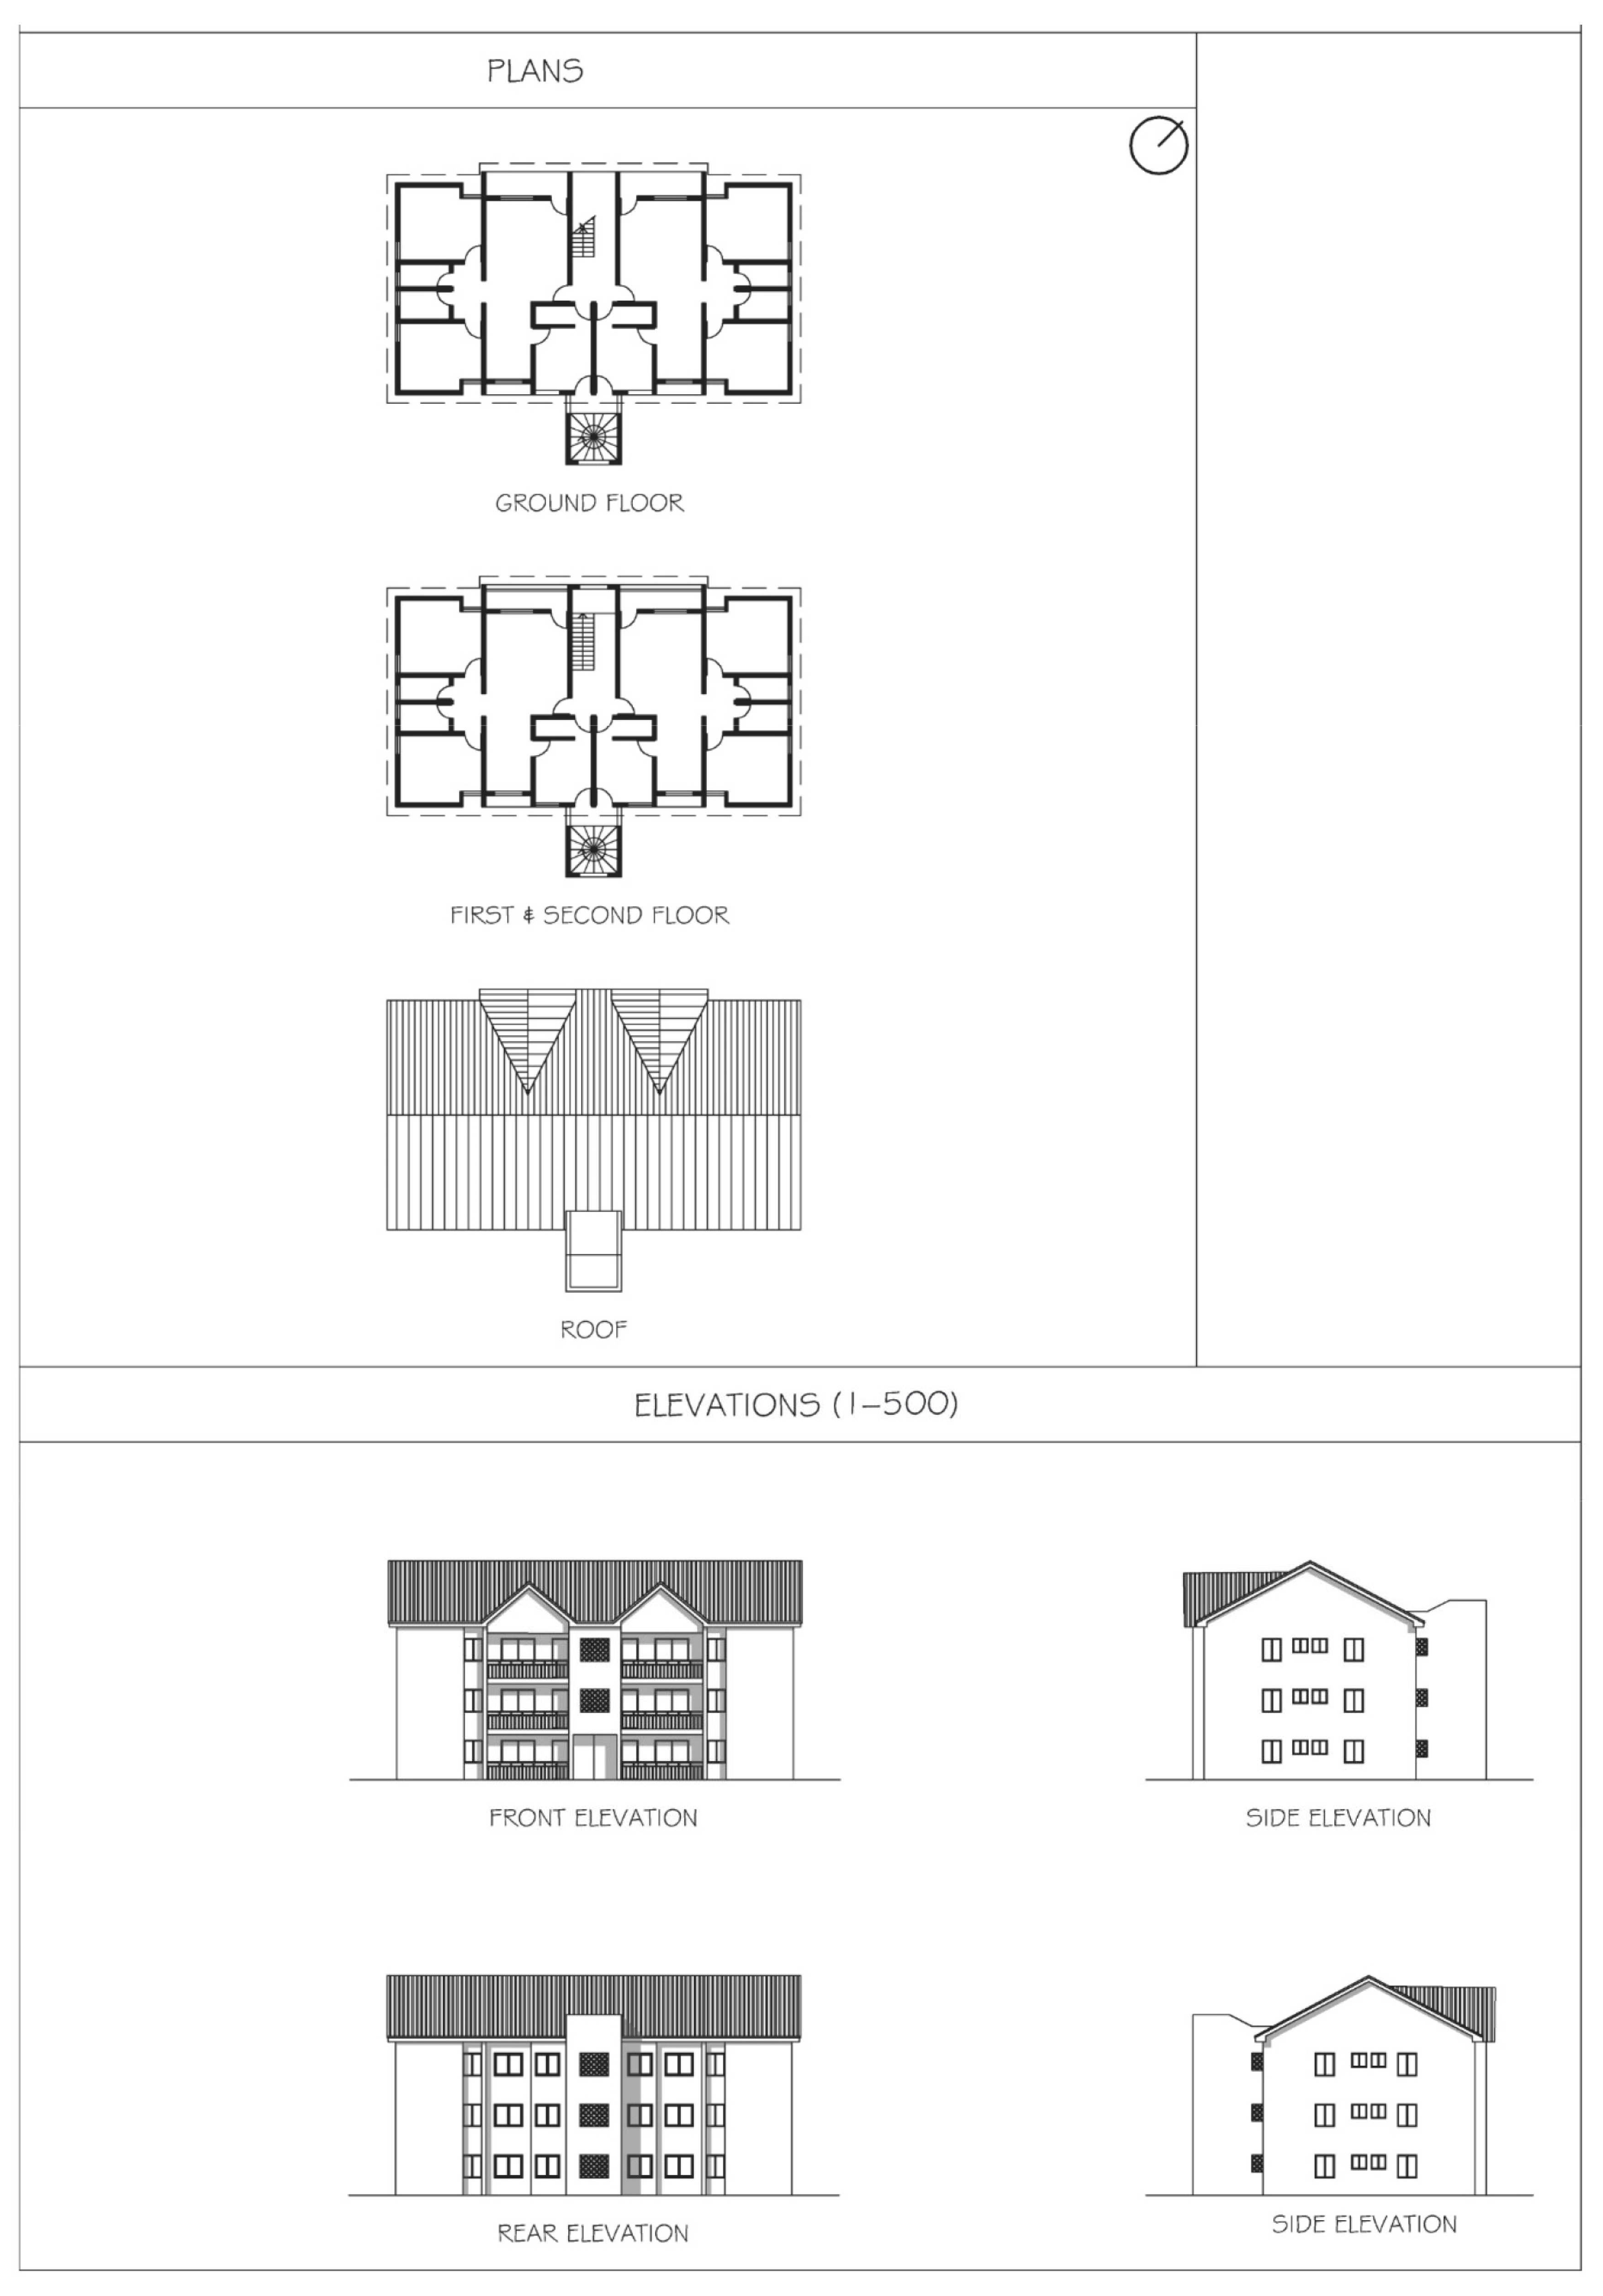
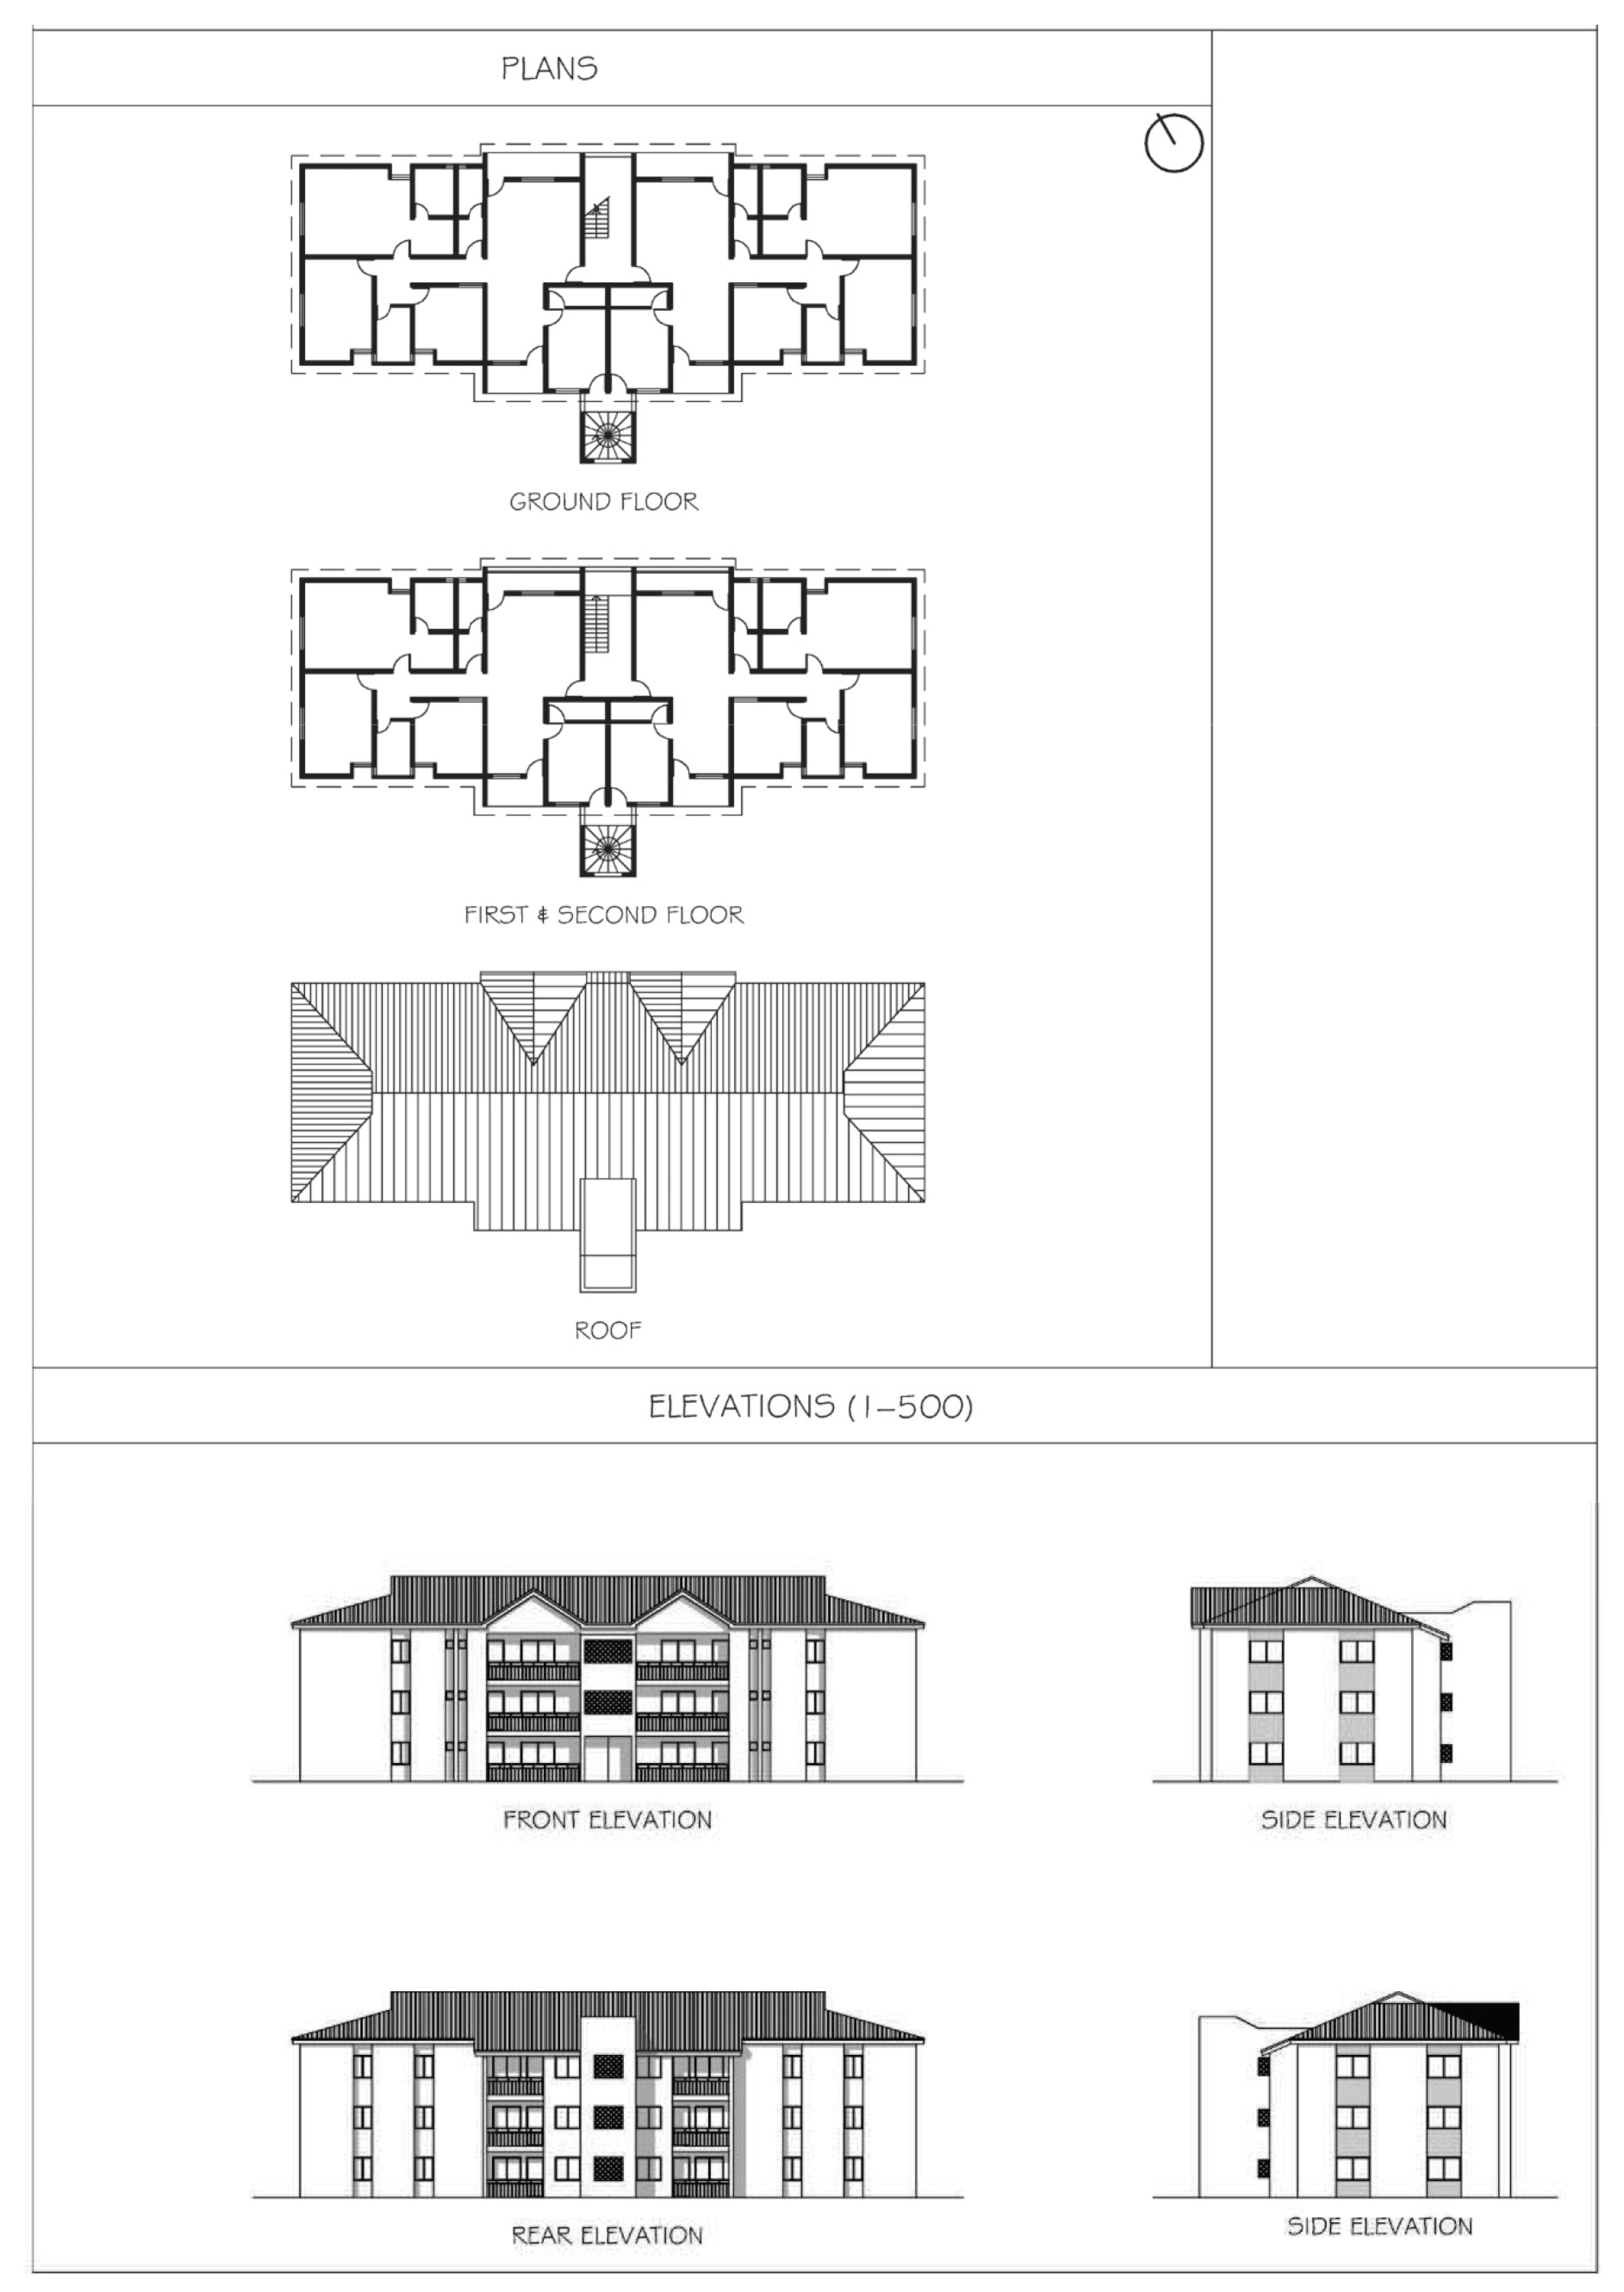
Six housing prototypes were chosen as case studies from three neighbourhoods across different districts in Abuja for the evaluation. Three of the selected buildings were built between 1980 and 2000, while the other three were constructed in the early 2000s. Figure 2 illustrates the location and general description of the buildings, as well as the frequency of the prototype replication within the same neighbourhood (supplementary architectural drawings of the case study building are included in Appendix A). In total, the selected housing units in the study sample have envelope forms and material characteristics that are comparable to more than 800 housing units in the chosen neighbourhoods. Additionally, in the early phases of the city’s development, these prototype designs were reused in other government housing schemes, either unchanged or with a few modifications. Therefore, the results reported are relevant to a significant portion of Nigeria’s urban landscape. Understanding how these prototypes perform can provide a road map for improving the design of residential buildings in the country by identifying common deficiencies in the design of prevalent contemporary residential building developments.

7. Methodology

7.1. Simulation Modelling and Validation

Simulation modelling was used to assess the thermal performance of the studied buildings. The IES VE 2014 (Integrated Environmental Solutions Virtual Environment) software package was selected as the simulation tool, due to its ability to predict building performance in tropical climates accurately. Using the Heat Balance Method (HBM), IES VE calculates radiative, convective, and latent heat fluxes. The tool accounts for conductivity, specific heat, emissivity, and internal gains, and conforms to ASHRAE 140 [39]. That said, prior to conducting the simulations, preliminary simulations and validations were carried out as part of the assessment. The results, detailed in a previous paper (anonymous), demonstrated a significant positive correlation between the measured and simulated internal air temperature, ranging between 0.9625 (p < 0.00001) and 0.9521 (p < 0.00001). Similarly, the correlation between the measured and simulated external air temperatures ranged between 0.9557 (p < 0.00001) and 0.9316 (p < 0.00001), with an average relative error of 5% and 9%. These values are closely aligned with those reported in similar studies [40,41,42].
3D digital models of the selected buildings were created based on the information collected during the fieldwork (Figure 2). The simulations were carried out assuming full-time occupancy with the maximum dwelling occupancy rate as specified by the Nigerian government [19]. It was also believed that occupants would always take practical steps to improve the indoor conditions, such as opening windows, if the indoor operative temperatures exceeded the acceptable comfort limits, as shown in Table 2. The maximum acceptable level of CO2 concentration (1000 ppm) was adapted from ASHRAE standard 62.1 [43], while the occupant’s thermal load was adapted from the standards from the CIBSE [44].

7.2. Performance Evaluation Indicators

Given the ongoing issues in Nigeria’s power sector and the rising electricity costs, models assessing thermal comfort in Abuja’s residential buildings should not be based on assumptions that buildings are equipped with air-conditioning systems. Therefore, the ASHRAE Standard 55 [46] adaptive model for thermal comfort in naturally ventilated buildings was used to define the thermal comfort boundary in the study. The upper and lower limits of the temperature range considered acceptable for 80% of occupants in the buildings were determined using the following equations:
Upper 80% acceptability limit, Tover (°C) = 0.31 × Tpma + 21.3
Lower 80% acceptability limit, Tunder (°C) = 0.31 × Tpma + 14.3
where Tpma is the prevailing mean outdoor air temperature, which is the arithmetic mean of all the mean daily outdoor air temperatures for no fewer than seven and no more than 30 sequential days before the day in question. In this study, the Tpma calculated for each day is derived from the prevailing mean outdoor air temperature for 14 days before the day in question. It can be assumed that thermal comfort is achieved when the operative temperature in a room is greater than Tunder and less than Tover.
To measure and analyse the frequency and intensity of discomfort in the studied buildings, an approach based on simple indicators calculated using a statistical method was adapted from [47]. The statistical indicators include the Hours of Thermal Discomfort (HTD), Frequency of Thermal Discomfort (FTD), and the Area Under Curve (AUC) for thermal discomfort (Intensity). HTD is a measure of hours during which acceptable indoor thermal conditions are not accomplished. FTD is the percentage of time during which the acceptable indoor thermal is not accomplished. The values for HTD and FTD can be delineated from Tover and Tunder. AUC was calculated by estimating the area between the curve of the operative temperatures over a given period and Tover or Tunder as shown in Figure 3.
To facilitate the assessment of the thermal comfort and to identify potential improvements, FTD and AUC were used to classify the thermal performance of the rooms into four discomfort zones as shown in Figure 4. These zones are defined as: Zone 1 for light and temporary thermal discomfort, Zone 2 for frequent but not intense thermal discomfort, Zone 3 for temporary but intense thermal discomfort, and Zone 4 for frequent and intense thermal discomfort. Graphically presenting the zones in this simple format can help easily track changes in thermal performance. In addition to calculating operative temperatures, solar gain values were also calculated to provide further information about the possible causes of overheating indoors.

8. Thermal Performance Analysis of the Housing Prototypes

The primary factor influencing thermal comfort in Abuja’s buildings is the contrast in conditions between the two seasons. Figure 5 shows the predicted operative temperatures in the rooms assessed during the seasons. The results, summarised in Table 3, further illustrate the impact of the city’s two main climatic seasons on the indoor thermal environment. As shown in the table, the FTD predicted during the dry season in the six selected cases ranges between 59% and 88%, whereas during the rainy season, the predicted values dropped greatly, ranging between 11% and 30%. Similarly, the daily AUC during the dry season ranges between 23 and 45 °C·h/day, while during the rainy season, the AUC values are much lower (3 and 7 °C·h/day). The thermal conditions are particularly unfavourable during the last three months of the dry season, which are marked by clear sky conditions, high solar altitude, elevated temperatures, and slow wind speeds.
Throughout most of the rainy season, the temperatures inside the rooms remain within the acceptable range for thermal comfort. While it is difficult to isolate the effect of individual parameters in the houses, general observations can still be made regarding the role of certain factors, such as building orientation, use of shading and thermal properties of materials, in influencing the indoor thermal environment.

8.1. Effect of Orientation

According to Table 3, rooms with their main façade and window area facing north and west have relatively lower FTD and AUC compared to those orientated south and east. The living rooms in B1 and B2 (Figure 2) are comparable in floor area (21 m2 and 21.4 m2) and total window area (3.6 m2 and 3.8 m2), but the FTD in the living room in B2 is 5% higher than that in B1 during the days assessed in the dry season. Similarly, the average AUC in the living room in B2 is 18 °C·h/day higher than that of B1. The higher frequency and intensity of thermal discomfort are caused by the amount of solar radiation entering the room through the large south-facing window area, particularly around midday during the dry season. Compared to the living room in B1, the living room in B2 is predicted to receive about 0.35 kW more solar radiation during this season. Notably, the Living room in B1 has a 26.9% WWR (the largest of all the rooms assessed), which contradicts the guidelines of the National Building Energy Efficiency Code (BEEC). Yet, it maintains the lowest FTD and AUC throughout the year at 35% and 13.1 °C·h/day, respectively. Besides the room’s primary north-facing orientation, its external wall area measures only 13.1 m2. This implies that future guidelines on WWR should consider both the façade orientation and the size of the external wall area relative to the room size.
The FTD in both the living room and bedroom in B3, which each has 25 m2 external wall area, is similar (63%) on the days during the dry season, despite the living room’s WWR being more than 10% greater than that of the bedroom. Also, the predicted daily AUC in the bedroom is over 5 °C·h/day greater than that of the living room. Both rooms are orientated south-east, as illustrated in the floor plan in Figure 2; however, the main window wall of the living room is shaded, along with the secondary window wall on the north façade. The main window of the bedroom has a slight recess but is not properly shaded. While both rooms receive an average daily solar radiation of approximately 0.5 kW during the dry season, the additional window areas in the living room appear to facilitate better cross-ventilation and night-time cooling. These results point out the influence that shading can have on the frequency and intensity of thermal discomfort.

8.2. Effect of Shading and Fenestration

Among the rooms assessed, the bedroom in B6 has the highest AUC and intensity of thermal discomfort during the dry season, with a value of 45 °C·h/day. This is mainly attributed to the room orientation and lack of shading. The room, with unshaded windows oriented north-east and south-east, receives an average solar gain of 0.56 k during the dry season, which is the highest value found in the analysis of all twelve rooms. However, shading should be considered with the layout of the rooms being shaded. The living rooms in B4 and B5 are orientated to north-west and north-east, respectively, with both having shaded window wall areas. Nevertheless, the average FTD in both rooms remains high during the dry season, reaching 71% in B4 and 88% in B5. Despite having the lowest average annual solar gain of 0.12 kW, the living room in B5 has the highest FTD and the second-highest AUC at 37 °C·h/day during the dry season. The high frequency and intensity of thermal discomfort in this room is attributed to its deep plan (as shown in Figure 2) and small window area (3.8 m2) relative to its floor area (37.8 m2). Although the fenestration factor of the room is within the 10% minimum specified by the National Building Code (2006) [19], these results highlight the need to revisit this guideline and give appropriate attention to the room layout.
While reducing the exposure of the external windows and walls to solar gain can mitigate thermal discomfort, the space layout ought to be considered early in the design process. As exemplified by the results from the living room in B5, the effectiveness of balconies and shading devices in reducing solar radiation may be diminished by other variables, such as orientation, window size and position, room configuration and dimensions.

8.3. Effect of Thermal Transmittance

Case study buildings B1 and B2 are examples of residential buildings from the early 1980s’ accelerated phase of development, constructed with precast concrete panels. The remaining case study buildings were built using hollow sandcrete blocks, which are more commonly used in contemporary building construction in Abuja. Walls constructed with hollow sandcrete blocks have a better U-value (2.14 W/m2k) compared to those built with precast concrete panels (3.03 W/m2k). However, apart from the shift from using prefabricated concrete panels for rapid development to using hollow sandcrete blocks for wall construction, there has been little change in the materials and methods used to construct residential buildings for low and middle-income groups in Abuja. Although a wider range of roofing and glazing materials is becoming available for the construction of residential buildings in Abuja, corrugated metal roofing on steel or timber trusses remains the most common choice for housing construction. Finding ways and means to improve the architecture of low-income housing without increasing costs is probably the most challenging area facing architects in Nigeria. Ugochukwu and Chioma [48] stated that building materials account for about 70% of the total housing production cost. They also mentioned that the existing regulations prevent the use of readily available local building materials and more cost-effective, environmentally friendly construction technologies.
Figure 6 shows the predicted frequency and intensity of thermal discomfort in the rooms. All rooms perform poorly during the dry season, with the best case being the living rooms in B1 and B4, which are expected to experience frequent but not intense thermal discomfort. In contrast, during the rainy season, all the rooms are expected to experience light and temporary discomfort. As explained in Section 4, the outdoor temperatures during the rainy season are more favourable, and their positive impact on the indoor thermal environment is evident.

9. Impact of Design Parameters on Prototypes’ Thermal Performance

Given the range of design variation across the rooms and prototypes, and the difficulty in isolating the influence of each design parameter on thermal performance, further analysis was conducted using the worst thermally performing room as the basis of assessment. Out of 12 rooms evaluated, the bedroom in B6 stands out as the worst performing in terms of intensity of thermal discomfort, with the highest average annual solar gain (45 kW) and the highest AUC. Therefore, a range of scenarios were conducted to systematically evaluate the impact of orientation, fenestration factor, thermal transmittance, and shading on indoor thermal comfort in the bedroom in B6 and to examine whether modifying the room design could enhance its internal conditions during the warmer period of the year (the dry season).

9.1. Orientation

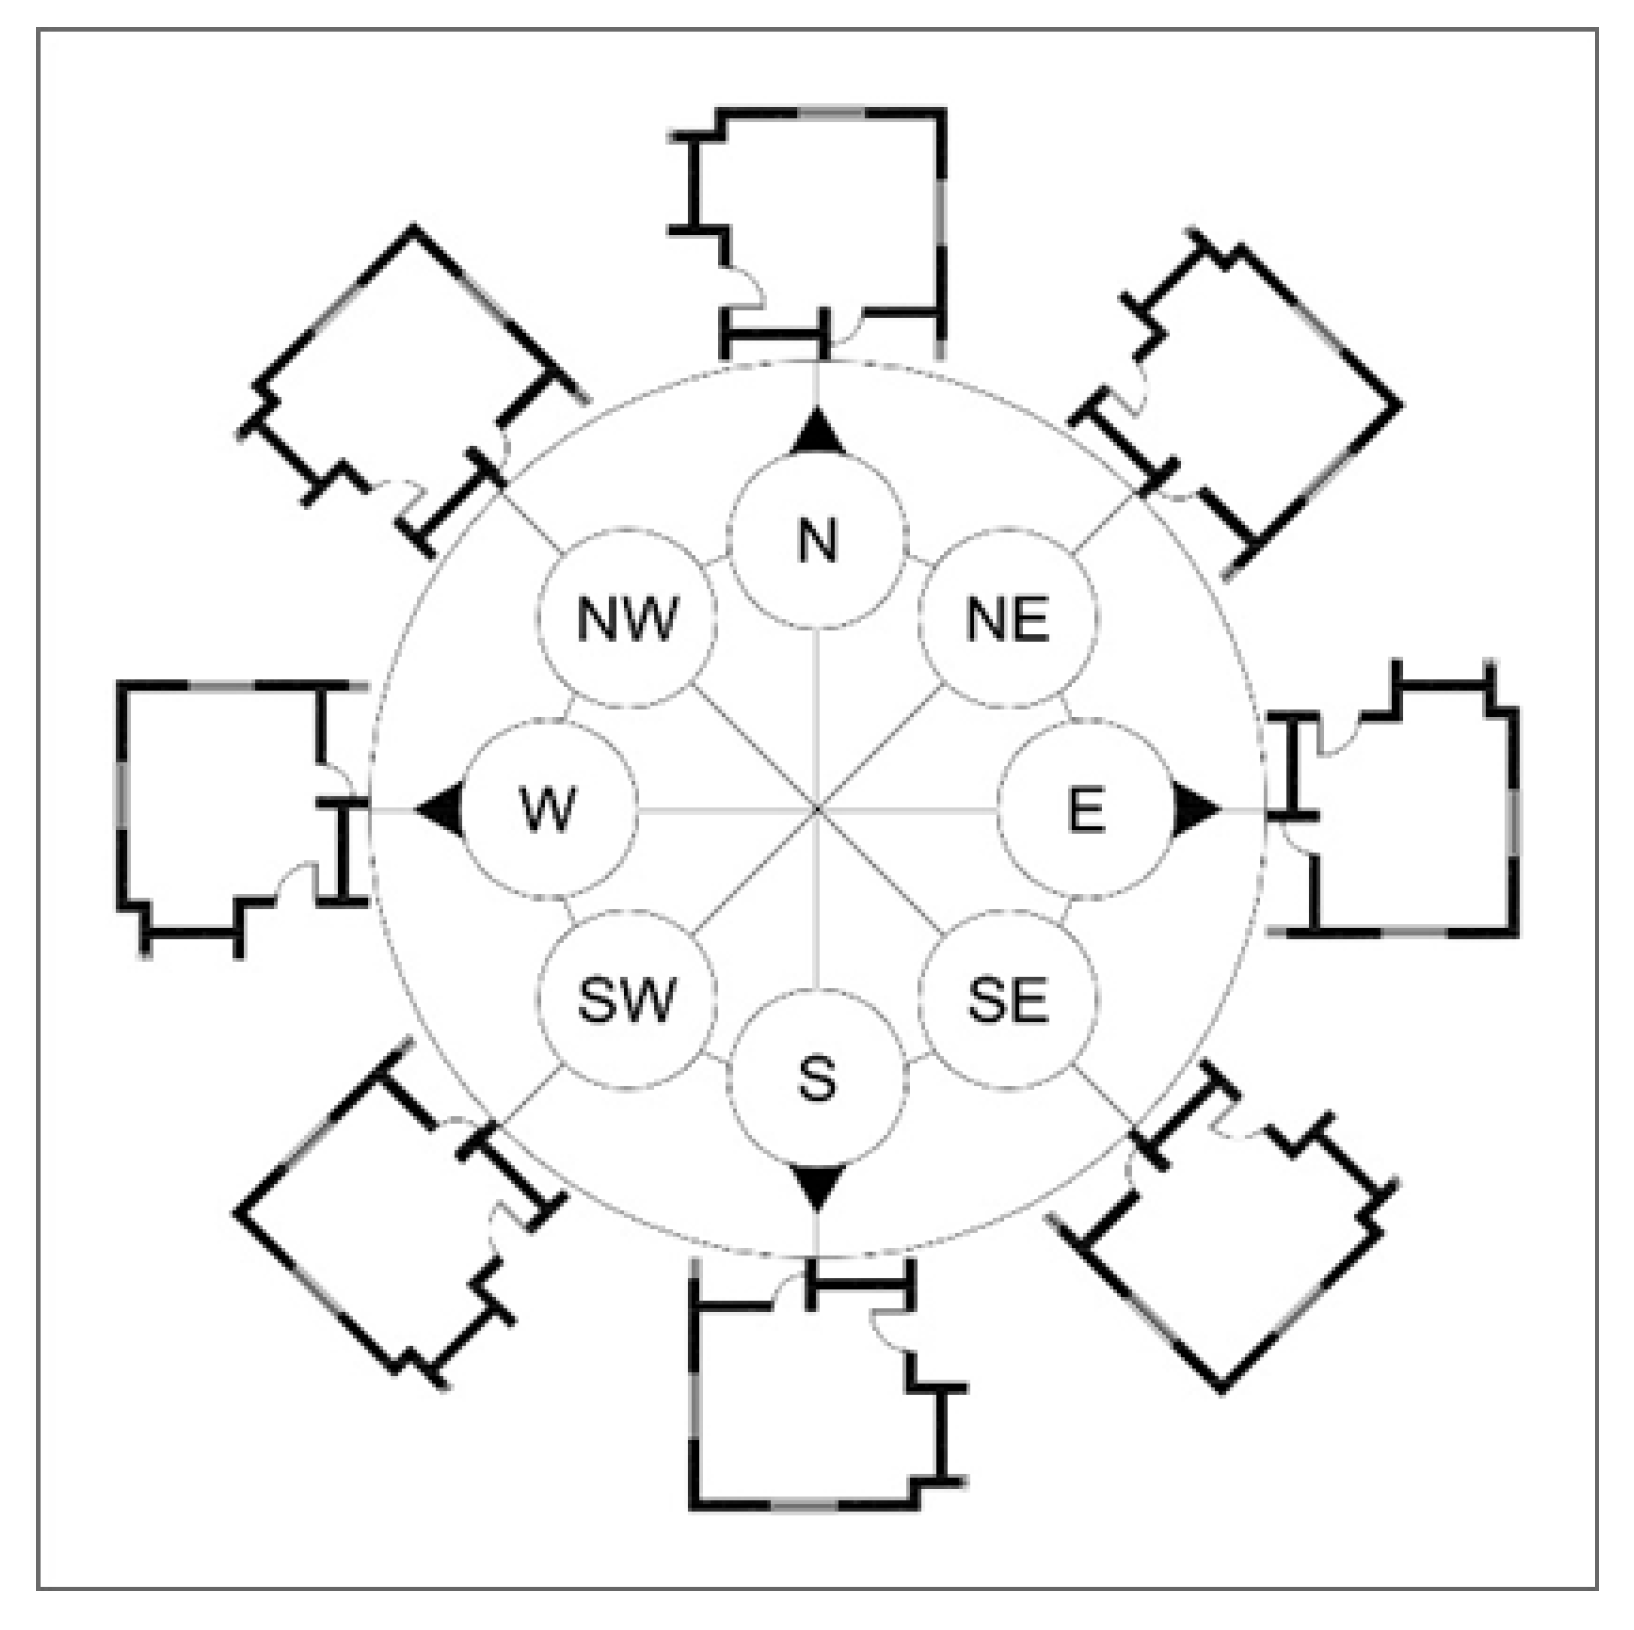
The influence of wall orientation on the amount of sunlight received by a building during the day and throughout the seasons, and subsequently on the thermal conditions indoors, is well understood. In the as-built building simulation reported above, the main window wall in the bedroom in B6 was orientated north-east. In the follow-up simulations, the angles of rotation for the building were subsequently recalibrated at 45° increments clockwise until a full circle was completed. Hence, 0°, 90°, 180° and 270° represent north, east, south and west, respectively (Figure 7).
Figure 8 shows the impact of the varying orientations on the frequency and intensity of thermal discomfort in the bedroom in B6. The data indicate that, during the first three months of the dry season, the bedroom in B6 will have the lowest average FTD (approximately 36%) and AUC values (approximately 13 °C·h/day) if the room’s main window wall area is orientated west (270°) or northwest (315°). During the second half of the dry season, orientating the room to the west results in the lowest average FTD (about 70%) and AUC (43 °C·h/day) values. As the sun’s altitude increases, more solar radiation enters the room through the secondary window facing northeast, if the main window area faces northwest. Orientating the main window wall north-east, with both windows in the room facing east, results in the highest predicted average FTD (74%) and AUC (52 °C·h/day) for thermal discomfort during this season. The average hourly solar gain in the room, if it is orientated west (the best orientation predicted) is around 0.32 kW. However, if the room is orientated east, the average hourly solar gain nearly doubles to 0.59 kW. These results suggest that adjusting the room’s orientation resulted in a 4–11% and 9–11 °C·h/day reduction in the projected frequency and intensity of thermal discomfort during the dry season.
The data emphasises the drawback of east-facing windows, which allow high levels of solar gain early in the day. East-facing windows are also difficult to shade due to the sun’s low elevation in the sky during the morning.

9.2. Fenestration Factor

The fenestration factor (window-to-floor area) is the only parameter specified in the 2006 National Building Code. The analysis of the as-built building simulations provided evidence suggesting that the fenestration factor impacts the amount of solar radiation reaching the rooms and the level of cooling achievable through ventilation. However, the relationship between this parameter and the frequency and intensity of thermal discomfort primarily depends on the building’s orientation (Figure 9).
Figure 10 shows the results from the simulation of the thermal conditions in the room with four different fenestration factors, including the thermal environment in its existing state (BS). The varying fenestration factors were selected based on the common window sizes and the guidelines from the national building code. The results from the simulations carried out for the room highlight the shifting balance between sizing window areas for improved ventilation or controlling solar gain. Increasing the fenestration factor from 15% (BS) to 25% or reducing it to 10% does not significantly impact the predicted FTD during the first half of the dry season. Moreover, the 25% fenestration factor increases the predicted AUC by 3 °C·h/day, while the 10% fenestration factor increases it by 6 °C·h/day during this period. In contrast, during the latter part of the dry season, both the 10% and 25% fenestration factors are expected to reduce the predicted FTD by about 3%. However, the predicted AUC with the 10% fenestration factor is approximately 4 °C·h/day higher. The larger window areas facilitate nighttime cooling thereby reducing the FTD in the evenings. However, they also allow more solar gain in the room during the day, which increases the frequency of thermal discomfort as well as the maximum temperatures in the room.
Increasing the fenestration factor from 15% to 25% will increase the average hourly solar gain from 0.55 kW to 0.73 kW during this season. On the other hand, having smaller windows will limit cross ventilation and the possibility of nighttime cooling. With the 10% fenestration factor, the maximum operative temperatures in the room around midday are predicted to be 1 °C to 2 °C higher, despite the predicted average hourly level of solar gain being 0.18 kW lower. While larger window areas allow more direct solar radiation indoors, the results suggest that increasing window areas to aid cross ventilation is more beneficial, particularly during the dry season. Moreover, window and vent types that allow a larger part of the building envelope to be operable without increasing the fenestration factor are more appropriate for improving cross ventilation in the buildings in the region.

9.3. Thermal Transmittance of Roofs and Walls

The study also examined how insulation materials can help reduce the amount of heat transmitted through the roof and external walls, in the room in B6. Polyurethane foam is widely available as an insulating material in the Nigerian market and can be produced locally at a low cost. The type and thickness of the materials used to reduce the thermal transmittance (u-value) of the roofs and walls in the room are illustrated in Figure 11. The figure outlines the typical roof design configuration used in the design of B6, as well as three alternative roof designs with varying thicknesses of polyurethane insulation. These alternative designs were used to examine the impact of the heat transmittance of roofs on the thermal conditions indoors.
Changing the U-value of the roof in B6 from 3.79 W/m2K (BS) to 0.12 W/m2K (R2) or 0.08 W/m2K (R3) lowers the predicted FTD in the room by about 2.3% in the first half of the dry season and 5.7% in the second half (Figure 12). Similarly, both R2 and R3 decrease the AUC by 2.5 °C·h/day and 9 °C·h/day during the first and second half of the dry season, respectively.
These results suggest that a roof with enhanced insulation can reduce the frequency and intensity of thermal discomfort, particularly during the second half of the dry season, which is typically the hottest period in Abuja. The results also indicate that the different insulation thicknesses have a similar effect. This means that a thin insulating layer, such as R1 (with a 100 mm layer of insulation), can effectively improve the thermal conditions in dwellings at a cost that is financially feasible for low-income housing development.
Figure 13 illustrates the typical wall design configuration of B6, along with three alternative wall designs featuring varying insulation thicknesses. These were tested to examine the impact of wall heat transmittance on the thermal conditions indoors. Similar to the selection of roofing insulating materials, the components of the wall designs were chosen based on the availability, practicality and cost-effectiveness of the materials within the Nigerian context.
Adjusting the u-value from 2.15 W/m2K (BS) to either 0.41 W/m2K (W1), 0.22 W/m2K (W2), or 0.15W/m2K (W3) does not significantly affect the predicted FTD during the first part of the dry season (Figure 14). Additionally, these alternative wall configurations are expected to increase the average AUC by about 3 °C·h/day. However, during the dry season, all three options reduce the predicted FTD by about 5.3% with both W2 and W3 lowering the predicted AUC by 9 °C·h/day.
The results indicate that when insulated with polyurethane panels, the unshaded wall area of the room absorbs a significant amount of solar radiation, which is then rapidly released into the room as the day progresses. Based on the analysis, insulating the walls will significantly improve the indoor temperatures between February and April but might have an adverse effect during other periods of the year.

9.4. Façade and Window Shading Variables

The use of shading elements to reduce the amount of sunlight reaching the vertical surfaces of buildings has long been a common practice in Nigerian architecture. From the design of B1 to B5, it is evident that these design elements continue to be used in the construction of modern residential buildings in Abuja. However, the appropriate configuration and sizing of these elements remain unclear. Moreover, it seems that in some cases, verandas and balconies are used more as an aesthetic design element rather than as a means of limiting the amount of sunlight reaching indoors.
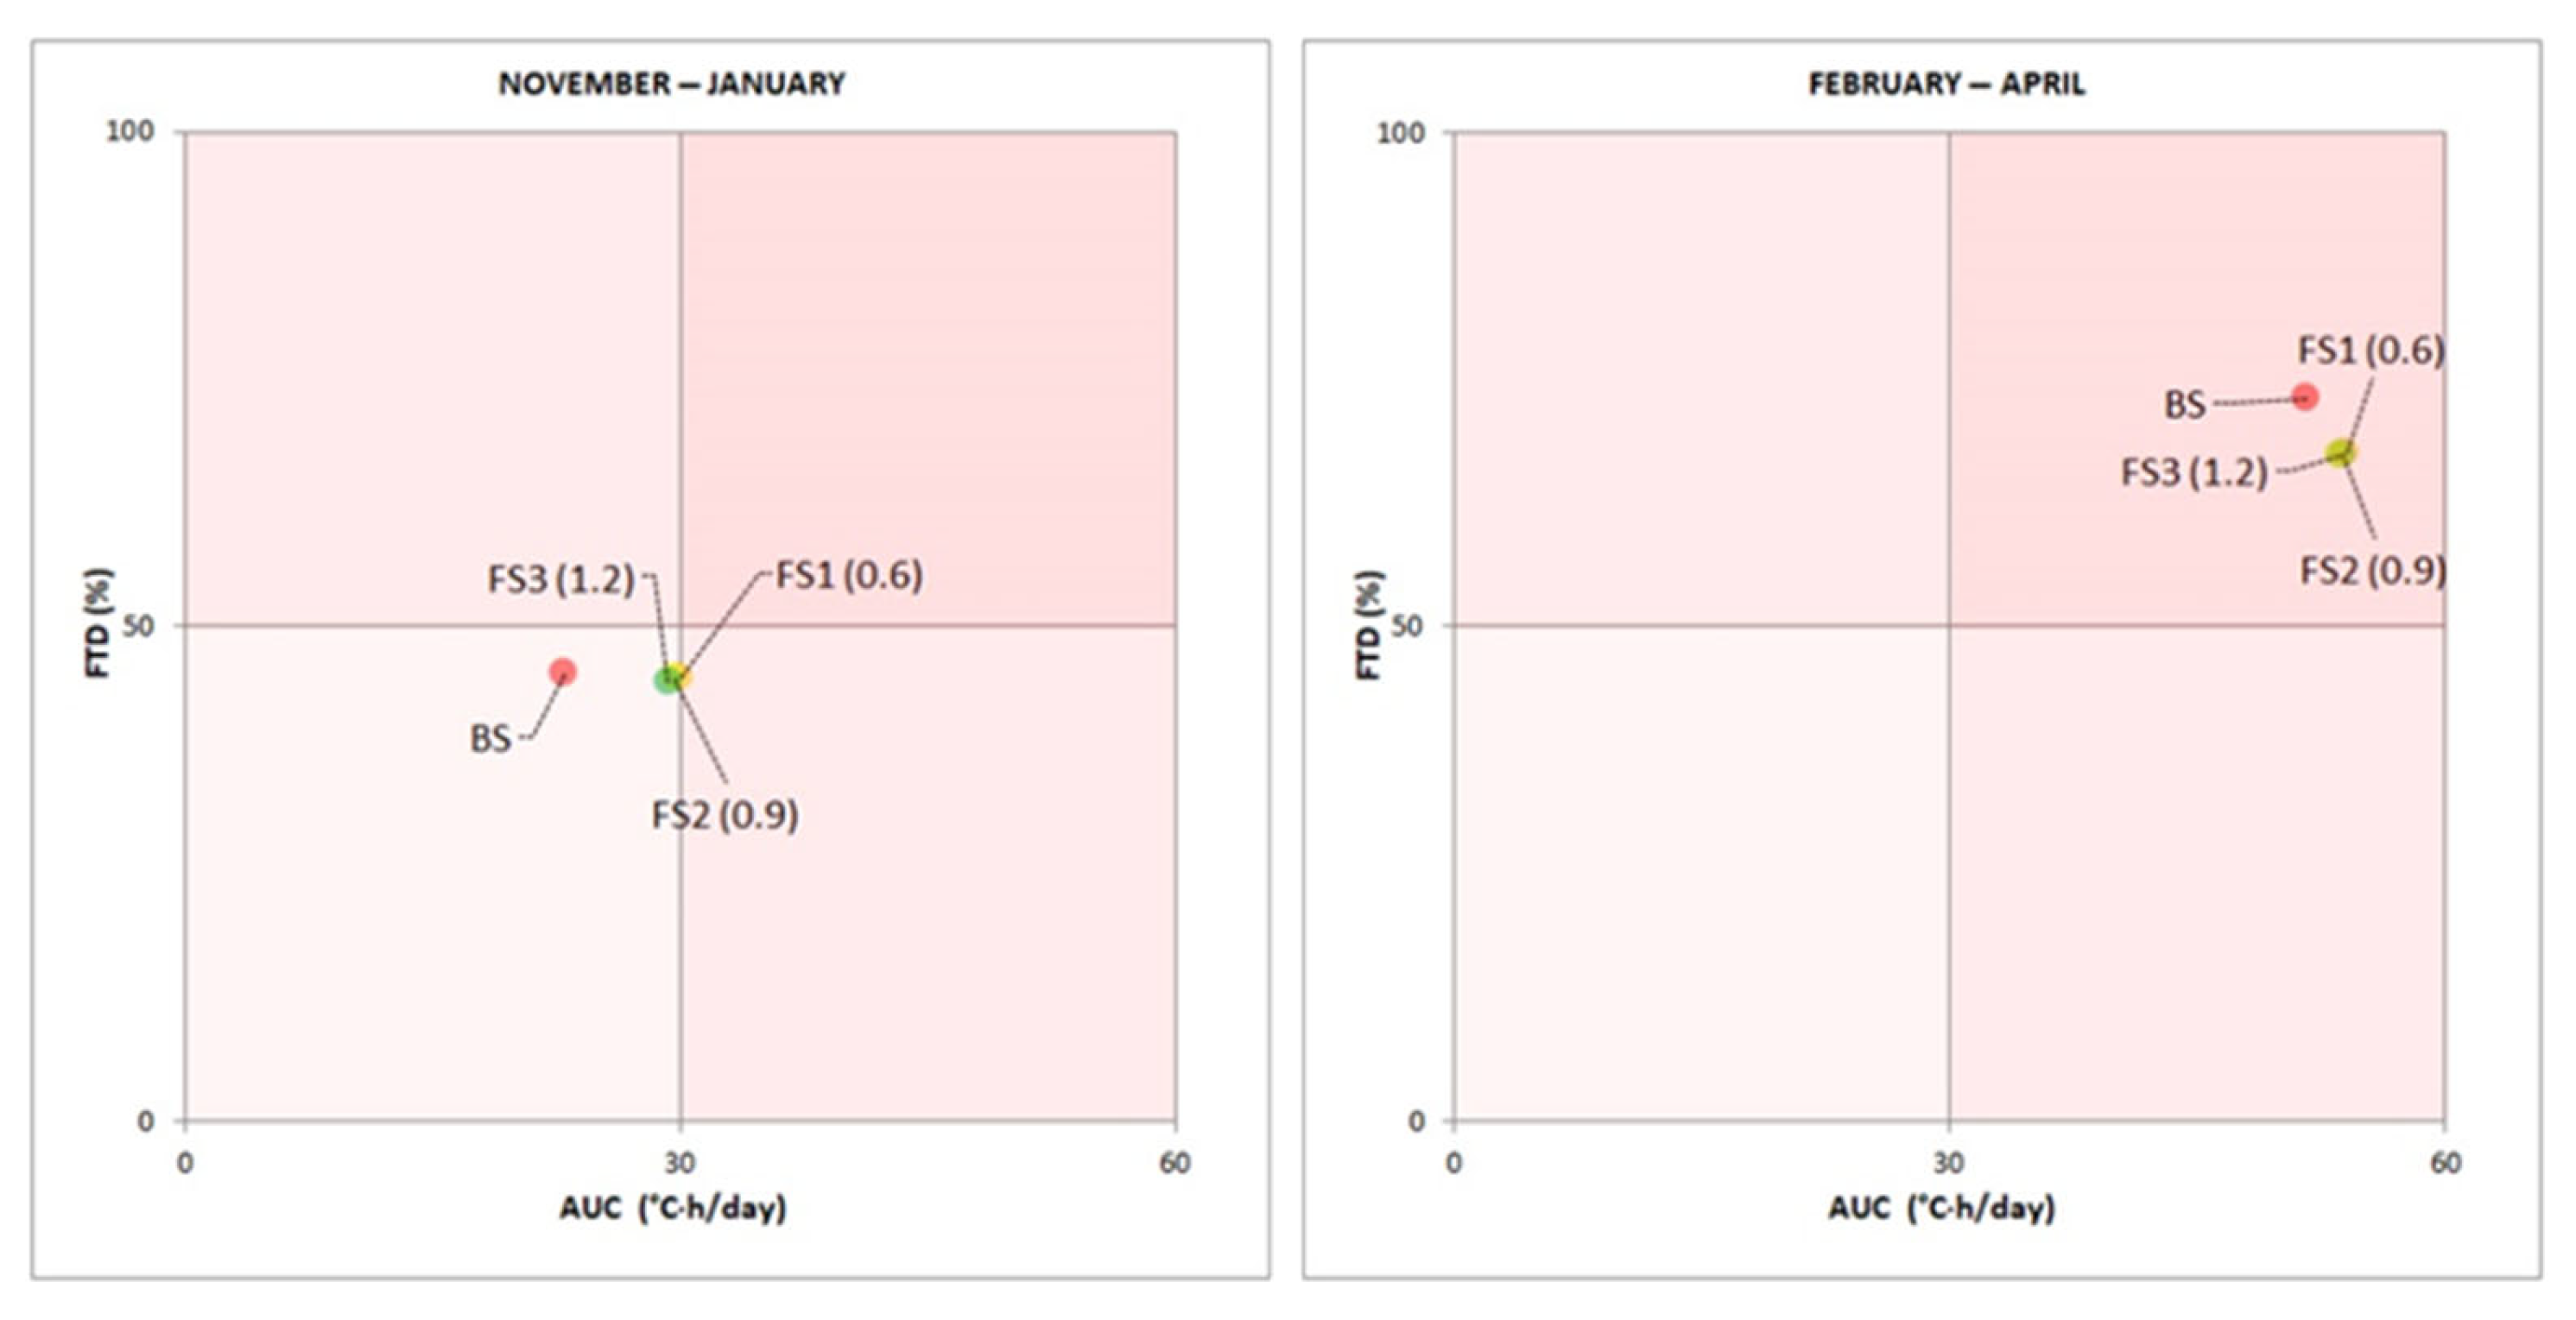
The impact of façade shading on the thermal conditions in the bedroom in B6 was examined further. Figure 15 shows the results from the simulation of the thermal conditions in the bedroom of B6 with the three façade shading designs illustrated in Figure 16, as well as without shading elements (BS). According to the simulated data, the addition of FS1, FS2, and FS3 during the first part of the dry season reduces the predicted average FTD by less than 1%. Additionally, all three shading options have a negative impact on the intensity of thermal discomfort, as they increase the predicted average AUC by over 6 °C·h/day during this period.
In contrast, it is anticipated that the three options will reduce the predicted FTD by about 5.5% during the second part of the dry season. However, all three variations are expected to increase the AUC by around 2 °C·h/day.
It is noteworthy that the differences in the impact of the 0.6 m, 0.9 m, and 1.2 m deep façade shading on the conditions predicted in the room are relatively insignificant. Overall, the analysis of the effect of façade shading on thermal conditions in the room suggests that the use of rigid horizontal and vertical façade shading components is not suitable for shading easterly façades, as demonstrated by the impact of façade shading on the performance of the bedroom in B6.
Rigid window shading elements, such as fins, overhangs and egg-crates, were a common feature in tropical or African modernist architecture that emerged in the mid-twentieth century.
These types of shading elements can improve indoor thermal conditions by reducing the amount of solar radiation that enters a room through its openings. Thus, the appropriate type, configuration and size of shading elements required to improve the thermal conditions in residential buildings should be considered and selected relative to orientation. For instance, balconies like those used in B3, B4, and B5 are not appropriate for all orientations.
The bedroom in B6 was used to examine the impact of window shading on room thermal conditions. Figure 17 shows the results from the simulation of the thermal conditions in the bedroom in B6 with the three different composite shading designs illustrated in Figure 18, as well as without shading elements (BS).
In comparison to the use of façade shading elements, the results suggest that window shading elements will have a more positive impact on the frequency and intensity of thermal discomfort in the room, particularly with the addition of S3. During the first part of the dry season, it is predicted that the application of S1, S2, and S3 around the windows of the room will reduce the FTD by 1.8%, 3.5%, and 4.9%, respectively. Additionally, S1, S2, and S3 are expected to reduce the AUC in the room by 2.2 °C·h/day, 4 °C·h/day, and 5.2 °C·h/day, respectively, during this period. Similarly, during the second part of the dry season, S1, S2, and S3 are expected to reduce the AUC by 2.3 °C·h/day, 4 °C·h/day, and 5.2 °C·h/day, respectively. Although their impact on the predicted FTD during this part of the dry season is significantly lower compared to the first part, it remains positive, with a reduction in the frequency of thermal discomfort ranging between 1 and 2.3%.
Despite the north-east and south-east orientation of the window walls in the room, the shading elements sufficiently limit the amount of solar radiation reaching the room in the morning. The average hourly levels of solar gain on the assessed days during the dry season are 0.34 kW lower in the room with S3. Additionally, the predicted operative temperatures in the room with S3 are typically about 1 °C lower than the temperatures in the room without shading elements.
It appears that façade shading components are more appropriate for rooms orientated north or south, or when the solar altitude is high, as experienced in the latter half of the dry season. Conversely, rooms with windows on the easterly or westerly façade will likely require window shading elements to limit the level of solar radiation entering the room through the openings, particularly around sunrise and sunset. Therefore, the orientation of a room should guide the selection of the appropriate type and projection of shading needed to reduce the amount of solar radiation reaching indoors.

9.5. Combined Parametric Changes

The parametric analysis data indicate that notable improvements to the frequency and intensity of thermal discomfort can be achieved by adjusting the orientation, fenestration factor, envelope thermal transmittance, and shading. According to the findings presented above and summarised in Table 4, orientation could have the greatest potential to impact the frequency and intensity of discomfort, followed by enhancing the roof’s thermal transmittance, especially during the latter half of the dry season. Conversely, façade shading, which is the most commonly used element in the design of residential buildings in the city, seems to have the least positive impact on the thermal conditions, particularly for easterly window walls.
Nevertheless, no single parameter improves the prevalent thermal conditions in the room from frequent and intense thermal discomfort during the peak heat period from February to April. It is evident that improving indoor thermal comfort in Abuja requires a combination of passive design solutions. A further phase of analysis was conducted to assess the combined impact of adjusting these parameters on improving the thermal conditions in the room. The main window wall was orientated north-west, the roof u-value wall was adjusted to 0.12 W/m2K (R2), and the 0.6 m window shading (S1) was positioned around both windows.
The result, as illustrated in Figure 19, shows that this combination of changes shifted the predominant thermal condition in the room during the hottest part of the dry season from frequent and intense thermal discomfort (Zone 4) to frequent but not intense thermal discomfort (Zone 2). The average FTD decreased from approximately 73% to 53%, while the average AUC reduced from approximately 52 °C·h/day to 24 °C·h/day during the hottest part of the year. While the opportunity to optimise the orientation of window walls is often constrained by other factors, various passive methods can be devised to reduce indoor heat gain. These include limiting the ratio of opaque and transparent surfaces and providing adequate shading for unfavourable orientations. Heavily thatched roofs were commonly used for traditional dwellings in Nigeria; similar locally produced solutions should be considered for the design of residential buildings. As stated above, 100 mm of polyurethane insulation is almost as effective as 300 mm. This insulation material is readily available and relatively cost-effective in Nigeria, making it a practical option for improving housing performance. In the long term, incorporating these passive design solutions will enhance energy efficiency and reduce energy costs for low and middle-income households.

10. Conclusions

Abuja, as a relatively new city in a developing country, has a unique opportunity to set a precedent for energy-efficient urban development in the region. Nonetheless, the narrative presented in the current study highlights the need for more comprehensive guidelines to enhance the energy efficiency of Nigeria’s residential buildings. The National Building Code was first published in 2006, at a time when there was less acknowledgement of the impact of building energy use on the environment. Yet, the subsequent publication of the most recent Building Energy Efficiency Code a decade later did little to address this gap. Despite offering general guidelines for improving the energy efficiency of buildings, their application is compromised by the ambiguity of the guidelines, lack of detail, and to some extent, a lack of reference to the local environmental context.
The current National Building Code specifies a minimum fenestration factor and openable window area to floor area ratio. Also, the National Building Energy Efficiency Code states that the overall window-to-wall ratio for a residential building should only exceed 20% if adequate shading is provided. However, to truly improve the performance of residential buildings in the city and reduce occupants’ reliance on artificial cooling, the sizing of windows and openings should be linked to the building’s orientation. The impact of insulating the roofs and walls of the buildings on the indoor thermal conditions may vary, depending on the time of year and other design characteristics. However, the findings discussed suggest that insulating the roof is the most favourable option for reducing the intensity of thermal discomfort during the last three months of the dry season, which are typically the hottest in Nigeria. The use of shading elements could also help reduce the frequency and intensity of thermal discomfort indoors. However, the façade shading elements tested do not effectively reduce the amount of solar radiation reaching the easterly façade of the room examined.
The data presented in the investigation illustrated that different passive design strategies must be used in concert to achieve the desired improvement in the thermal conditions in residential buildings in the city. The result demonstrated that it is possible to provide thermal comfort for many households in the city through passive design solutions that are both effective and inexpensive. For a country such as Nigeria, these solutions are critical for reducing energy demand, utility costs and greenhouse gas emissions. Therefore, more refined and comprehensive requirements are needed in the Nigerian building code to successfully promote energy-efficient and sustainable building practices. This should include requirements for: orientation and site planning, thermal insulation, window-to-wall ratio and shading devices. Moreover, it might also be beneficial implement policies that incentivise green building development. Policies such as offering tax deductions for developers or homeowners who achieve specific passive design standards. and providing grants or low-interest loans to entrepreneurs to set up local production facilities for sustainable building materials.
Nigeria can systematically transform its housing stock by implementing a multi-faceted policy framework. The study provides information that can be used to develop local and national regulatory frameworks appropriate to Abuja and Nigeria in general. It also offers evidence for similar developments in regions with comparable climatic contexts and social challenges.

Author Contributions

Conceptualisation, M.A. and S.A.-M.; methodology, M.A. and S.A.-M.; modelling, and validation, M.A.; analysis and investigation, M.A.; data curation, S.A.-M.; writing—original draft preparation, M.A. and S.A.-M.; writing—review and editing, S.A.-M.; visualisation, M.A.; supervision, S.A.-M.; project administration, M.A. All authors have read and agreed to the published version of the manuscript.

Funding

This research received no external funding.

Institutional Review Board Statement

Not applicable.

Informed Consent Statement

Not applicable.

Data Availability Statement

Data available upon request from the corresponding author.

Conflicts of Interest

Author Mahmood Abdulkareem was employed by the company Core Architects Inc. The remaining authors declare that the research was conducted in the absence of any commercial or financial relationships that could be construed as a potential conflict of interest.

Abbreviations

The following abbreviations are used in this manuscript:
NBCNational Building Code
ASHRAEAmerican Society of Heating, Refrigerating and Air-Conditioning Engineers
BEECBuilding Energy Efficiency Code
SANSSouth African National Building Standards
FFFenestration Factor
ACHAir Changes per Hour
HTDHours of Thermal Discomfort
FTDFrequency of Thermal Discomfort
AUCArea Under the Curve

Appendix A

Figure A1. Building 1 plans and elevations.
Sustainability 17 08435 g0a1
Figure A2. Building 2 plans and elevations.
Sustainability 17 08435 g0a2
Figure A3. Building 3 plans and elevations.
Sustainability 17 08435 g0a3
Figure A4. Building 4 plans and elevations.
Sustainability 17 08435 g0a4
Figure A5. Building 5 plans and elevations.
Sustainability 17 08435 g0a5
Figure A6. Building 6 plans and elevations.
Sustainability 17 08435 g0a6

References

  1. Intergovernmental Panel on Climate Change (IPPC). Climate Change 2022: Impacts, Adaptation and Vulnerability; IPCC: Geneva, Switzerland, 2022; Available online: https://www.ipcc.ch/report/ar6/wg2/ (accessed on 23 July 2025).
  2. International Energy Agency (IEA). World Energy Outlook 2023; IEA: Paris, France, 2023; Available online: https://www.iea.org/reports/world-energy-outlook-2023 (accessed on 23 July 2025).
  3. International Energy Agency (IEA). Africa Energy Outlook 2022; IEA: Paris, France, 2022; Available online: https://www.iea.org/reports/africa-energy-outlook-2022 (accessed on 23 July 2025).
  4. National Bureau of Statistics (NBS). Demographic Statistics Bulletin 2022; National Bureau of Statistics: Beijing, China, 2023. Available online: https://nigerianstat.gov.ng/elibrary/read/1241422. (accessed on 23 July 2025).
  5. Ogunlesi, T. The New Electricity Tariff in Nigeria: Matters Arising. Premium Times. 9 April 2024. Available online: https://www.premiumtimesng.com/opinion/684657-the-new-electricity-tariff-in-nigeria-matters-arising-by-tolu-ogunlesi.html (accessed on 23 July 2025).
  6. Izauka, M. Average Retail Price of Petrol Up 223% in 12 Months—NBS. Premium Times. 20 June 2024. Available online: https://www.premiumtimesng.com/news/more-news/705548-average-retail-price-of-petrol-up-223-in-12-months-nbs.html (accessed on 23 July 2025).
  7. Hu, M.; Zhang, K.; Nguyen, Q.; Tasdizen, T. The effects of passive design on indoor thermal comfort and energy savings for residential buildings in hot climates: A systematic review. Urban Clim. 2023, 49, 101466. [Google Scholar] [CrossRef]
  8. Mabogunje, A.L. Abuja: The promise, the performance and the prospect. In The Review of the Abuja Master Plan; Kalgo, M.S.U., Ayileka, O., Eds.; Fountain Publications: Ibadan, Nigeria, 2001; pp. 1–10. [Google Scholar]
  9. Ademiluyi, I.A. Public housing delivery strategies in Nigeria: A historical perspective of policies and programmes. J. Sustain. Dev. Afr. 2010, 12, 153–161. [Google Scholar]
  10. Ajayi, B. Perspective on Urban and Regional Planning in Nigeria: A Collection of Papers and Speeches; Penthouse publications: Ibadan, Nigeria, 2013; pp. 154–196. [Google Scholar]
  11. Muhammad, Z.; Johar, F.; Sabri, S.; Jonathan, Z.U. A review of housing provision and the challenges of sustainable housing delivery in the Federal Capital Territory Abuja, Nigeria. J. Teknol. 2015, 77, 23–31. [Google Scholar] [CrossRef]
  12. Waziri, A.G.; Yusof, N.A.; Salleh, A.G. Residential satisfaction with private housing estate development in Abuja-Nigeria. ALAM CIPTA. Int. J. Sustain. Trop. Des. Res. Pract. 2013, 6, 3–12. [Google Scholar]
  13. Jegede, O.E.; Taki, A. Optimization of building envelopes using indigenous materials to achieve thermal comfort and affordable housing in Abuja, Nigeria. Int. J. Build. Pathol. Adapt. 2021, 40, 219–247. [Google Scholar] [CrossRef]
  14. Ezennia, I.S. Insights of housing providers’ on the critical barriers to sustainable affordable housing uptake in Nigeria. World Dev. Sustain. 2022, 1, 100023. [Google Scholar] [CrossRef]
  15. Nduka, D.O.; Ogunsanmi, O.E. Stakeholders perception of factors determining the adoptability of green building practices in construction projects in Nigeria. J. Environ. Earth Sci. 2015, 5, 188–196. [Google Scholar]
  16. Gofwen, C.N.; Ola-Adisa, E.O.; Daniel, A.A. Contemporary Architecture in Nigeria: Evolution or Decadence. J. Sci. Eng. Res. 2018, 5, 386–393. [Google Scholar]
  17. Kawuwa, A.; Sani, A.; Mustapha, S.; Ishaku, D. Development of strategies for sustainable energy efficient building codes in Nigeria. Int. J. Sci. Res. Publ. 2015, 5, 1–7. [Google Scholar]
  18. Dahiru, D.; Abdulazeez, A.; Abubakar, M. An evaluation of the adequacy of the national building code for achieving a sustainable built environment in Nigeria. Res. J. Environ. Earth Sci. 2012, 4, 857–865. [Google Scholar]
  19. Federal Republic of Nigeria (FRN). National Building Code; LexisNexis: Durban, South Africa, 2006. [Google Scholar]
  20. Solid Green. Development of the National Building Energy Efficiency Code (BEEC); Federal Ministry of Power, Works and Housing: Abuja, Nigeria, 2016. [Google Scholar]
  21. Federal Republic of Nigeria (FRN). National Building Energy Efficiency Code, 1st ed.; Federal Ministry of Power, Works and Housing: Abuja, Nigeria, 2017. [Google Scholar]
  22. Ochedi, E.T.; Taki, A. A framework approach to the design of energy efficient residential buildings in Nigeria. Energy Built Environ. 2022, 3, 384–397. [Google Scholar] [CrossRef]
  23. Macaulay, I.A.; Magaji, J.I.; Bello, I.E.; Anthonia, A.N. Assessment of Compliance to Building Energy Efficiency Strategies in the Development of Housing Estates in FCC, Abuja Nigeria. Open J. Energy Effic. 2023, 12, 36–48. [Google Scholar] [CrossRef]
  24. Adaji, M.U.; Adekunle, T.O.; Watkins, R.; Adler, G. Indoor comfort and adaptation in low-income and middle-income residential buildings in a Nigerian city during a dry season. Build. Environ. 2019, 162, 106276. [Google Scholar] [CrossRef]
  25. Odimegwu, C. A Derivation of Passive Guidelines for Achieving Thermal Comfort in the Design of Residential Buildings in Warm Humid Climate of Abia State, Nigeria. Int. J. Dev. Strateg. Humanit. Manag. Soc. Sci. 2019, 9, 1–15. [Google Scholar]
  26. Abbakyari, M.; Taki, A.H. Passive design strategies for energy efficient housing in Nigeria. In Proceedings of the Passive Low Energy Architecture (PLEA): Design to Thrive, Edinburgh, UK, 2–5 July 2017. [Google Scholar]
  27. Onyenokporo, N.C.; Ochedi, E.T. Low-cost retrofit packages for residential buildings in hot-humid Lagos, Nigeria. Int. J. Build. Pathol. Adapt. 2019, 37, 250–272. [Google Scholar] [CrossRef]
  28. Okonta, D.E. Investigating the impact of building materials on energy efficiency and indoor cooling in Nigerian homes. Heliyon 2023, 9, e20316. [Google Scholar] [CrossRef]
  29. Usman, A.M. Effect of Roof Configurations on Temperature and Thermal Comfort on Residential Homes in Hot Dry Climate of Bauchi, Nigeria. Int. J. Eng. Res. Appl. 2022, 12, 123–136. [Google Scholar]
  30. Perera, U.S.; Weerasuriya, A.U.; Zhang, X.; Ruparathna, R.; Tharaka, M.G.I.; Lewangamage, C.S. Selecting suitable passive design strategies for residential high-rise buildings in tropical climates to minimize building energy demand. Build. Environ. 2025, 267, 112177. [Google Scholar] [CrossRef]
  31. Nugroho, A.M. Passive design strategy in vernacular house of Samin, Indonesia. Dimens. J. Archit. Built Environ. 2024, 51, 17–27. [Google Scholar] [CrossRef]
  32. Ergün, R.; Bekleyen, A. Reinterpretation of Passive Cooling Strategies in Hot and Dry Climate Traditional Architecture: Vents in The Building. Int. J. Built Environ. Sustain. 2024, 11, 79–93. [Google Scholar] [CrossRef]
  33. Dharmatanna, S.W.; Wijaya, E.S.; Wijaya, B.C. Passive cooling design opportunities: Lessons learned from traditional Banjar houses. IOP Conf. Ser. Earth Environ. Sci. 2024, 1404, 012001. [Google Scholar] [CrossRef]
  34. Xi, T.; Sa’ad, S.U.; Liu, X.; Sun, H.; Wang, M.; Guo, F. Optimization of Residential Indoor Thermal Environment by Passive Design and Mechanical Ventilation in Tropical Savanna Climate Zone in Nigeria, Africa. Energies 2025, 18, 450. [Google Scholar] [CrossRef]
  35. Adedoja, O.S.; Ayantunji, B.G.; Saleh, U.A.; Jatto, S.S. Diurnal and Seasonal Variation of Global Solar Radiation at Anyigba, North-Central Nigeria. Int. J. Eng. Sci. Innov. Technol. 2015, 4, 140–145. [Google Scholar]
  36. Osueke, C.O.; Uzendu, P.; Ogbonna, I.D. Study and evaluation of solar energy variation in Nigeria. Int. J. Emerg. Technol. Adv. Eng. 2013, 3, 501–505. [Google Scholar]
  37. Eludoyin, O.M. Some aspects of physiologic climatology in Nigeria. Interdiscip. Environ. Rev. 2013, 14, 150–185. [Google Scholar] [CrossRef]
  38. Lemo, E.O.; Ogobor, E.A.; Ayantunji, B.G.; Mangete, O.E.; Alagbe, G.A.; Abdulkareem, M.L.; Obarolo, A.E.; Onuh, B.O. Relationship between relative humidity and the dew point temperature in Abuja, Nigeria. Open Access Libr. J. 2021, 8, 1–13. [Google Scholar]
  39. ANSI/ASHRAE Standard 140-2020; Method of Test for Evaluating Building Performance Simulation Software. American Society of Heating, Refrigerating, and Air-Conditioning Engineers (ASHRAE): Atlanta, GA, USA, 2020.
  40. Corcoran, L.; Saikia, P.; Ugalde-Loo, C.E.; Abeysekera, M. An effective methodology to quantify cooling demand in the UK housing stock. Appl. Energy 2025, 380, 125002. [Google Scholar] [CrossRef]
  41. Che-Ani, A.I.; Raman, S.N. Thermal environment accuracy investigation of integrated environmental solutions-virtual environment (IES-VE) software for double-story house simulation in Malaysia. J. Eng. Appl. Sci. 2019, 14, 3659–3665. [Google Scholar]
  42. Leng, P.C.; Ahmad, M.H.; Ossen, D.R.; Hamid, M. Investigation of integrated environmental solutions-virtual environment software accuracy for air temperature and relative humidity of the test room simulations. In Proceedings of the UMT 11th International Annual Symposium on Sustainability Science and Management, Kuala, Terengganu, 9–11 July 2012; pp. 1298–1305. [Google Scholar]
  43. ANSI/ASHRAE Standard 62.1-2013; Ventilation for Acceptable Indoor Air Quality. American Society of Heating, Refrigerating, and Air-Conditioning Engineers (ASHRAE): Atlanta, GA, USA, 2013.
  44. Chartered Institute of Building Services Engineers (CIBSE). CIBSE Guide A: Environmental Design; The Lavenham Press: Suffolk, UK, 2015. [Google Scholar]
  45. Bliss, S. Best Practices Guide to Residential Construction: Materials, Finishes, and Details; John Wiley Sons: New York, NY, USA, 2006. [Google Scholar]
  46. ANSI/ASHRAE Standard 55-2020; Thermal Environmental Conditions for Human Occupancy. American Society of Heating Refrigerating and Air-Conditioning Engineers (ASHRAE): Atlanta, GA, USA, 2020.
  47. Sicurella, F.; Evola, G.; Wurtz, E. A statistical approach for the evaluation of thermal and visual comfort in free-running buildings. Energy Build. 2012, 47, 402–410. [Google Scholar] [CrossRef]
  48. Ugochukwu, I.B.; Chioma, M.I.B. Local building materials: Affordable strategy for housing the urban poor in Nigeria. Procedia Eng. 2015, 118, 42–49. [Google Scholar] [CrossRef]
Figure 1. Low-income (top) and middle-income (bottom) residential buildings in Abuja (Author, 2024).
Sustainability 17 08435 g001
Figure 2. Location, description, and design parameters of case study buildings, with plans showing the living room (LR) and bedroom (BR).
Sustainability 17 08435 g002
Figure 3. Illustration of Area Under the Curve (AUC) for intensity of thermal discomfort.
Sustainability 17 08435 g003
Figure 4. Zones of thermal discomfort.
Sustainability 17 08435 g004
Figure 5. The operative temperatures in the rooms assessed on the 15th day of each month.
Sustainability 17 08435 g005
Figure 6. Frequency and intensity of thermal discomfort predicted in the rooms during the dry and rainy seasons.
Sustainability 17 08435 g006
Figure 7. Alternative orientations simulated for the bedroom room in B6.
Sustainability 17 08435 g007
Figure 8. Impact of orientation on the frequency and intensity of thermal discomfort in the bedroom in B6 during the dry season (November–January, February–April).
Sustainability 17 08435 g008
Figure 9. The fenestration factor of the bedroom in B6 (BS), as well as three alternative fenestration factors.
Sustainability 17 08435 g009
Figure 10. Impact of fenestration factor on the frequency and intensity of thermal discomfort in the bedroom in B6 during the dry season (November–January, February–April).
Sustainability 17 08435 g010
Figure 11. Roof types assessed.
Sustainability 17 08435 g011
Figure 12. Impact of roof thermal transmittance on the frequency and intensity of thermal discomfort in the bedroom in B6 during the dry season (November-January, February-April).
Sustainability 17 08435 g012
Figure 13. Wall types assessed.
Sustainability 17 08435 g013
Figure 14. Impact of wall thermal transmittance on the frequency and intensity of thermal discomfort in the bedroom in B6 during the dry season (November–January, February–April).
Sustainability 17 08435 g014
Figure 15. Impact of façade shading on the frequency and intensity of thermal discomfort in the bedroom in B6 during the dry (November–January, February–April).
Sustainability 17 08435 g015
Figure 16. Illustration of the existing façade design (BS), as well as alternative designs with different façade shading sizes (FS1, FS2, FS3).
Sustainability 17 08435 g016
Figure 17. Impact of window shading on the frequency and intensity of thermal discomfort in the bedroom in B6 during the dry season (November–January, February–April).
Sustainability 17 08435 g017
Figure 18. Illustration of the existing façade design (BS), as well as alternative designs with different window shading sizes (S1, S2, S3).
Sustainability 17 08435 g018
Figure 19. Classification of thermal conditions in the bedroom in B6 (red) and with parametric improvements (green) during the dry season (November–January, February–April).
Sustainability 17 08435 g019
Table 1. Nigerian national building energy code in comparison to relevant global standards. Adapted from [20].
Nigerian BEECSouth Africa SANSUSA ASHRAE
Roof insulation
R-value
1.253.74.2
External wallsConcrete blockBrickworkHighly insulated lightweight construction
Glass typeSingle clear
SHGC—0.78
U-Value—5.8
Single clear
SHGC—0.78
U-Value—5.8
Single low-performance glass
SHGC—0.4
U-Value—3.4
Window-to-Wall RatioOverall window-to-wall ratio to not exceed 20%Varies per orientation
Average 30%
As per design building or 40% whichever is lower
Air-conditioningInverter Split unit COP 2.8Split unit COP 2.5Varies according to the size of the building
Table 2. Simulation reflectance, occupancy, and opening modulation set-up.
ParameterDescriptionValueNotes
Occupancy scheduleDuration of occupancy (h)24Full time occupancy assumed for residential building
Rate of occupancy (m2/person)18.6Rate of occupancy (m2/person) value obtained from the National Building Code [19], this value also accounts for all other spaces that discharge through the space to gain access to an exit.
Occupant’s
thermal load
Sensible gain (Watt/person)70Values of heat gain for seated occupants doing light work obtained from CIBSE guide A [44]
Latent gain (Watt/person)45
Opening
schedule
formula
(Top > Tover) & (Top > Ta) or (CO2 > 1000 ppm)It is assumed that occupants will open windows: if the indoor operative temperature (Top) is greater than the upper limit of acceptable temperature (Tover) and the outdoor dry bulb air temperature (Ta), or the indoor carbon dioxide (CO2) levels are above 1000 parts per million (ppm) [43]
Ventilation
opening area
(percentage of
window area)
Living room45%The percentage of the opening area designed to allow air flow is derived from Bliss [45]. A standard double panel sliding window type is used for all windows.
Bedroom45%
Table 3. Summary of performance of case studies).
BuildingB1B2B3B4B5B6
RoomLRBRLRBRLRBRLRBRLRBRLRBR
U-value
(W/m2K)
Walls3.033.033.032.152.152.152.152.152.152.152.152.15
Windows5.225.225.225.225.225.225.225.225.225.225.225.22
Roof3.793.793.793.793.793.793.793.793.793.793.793.79
Floor2.382.382.302.302.382.382.382.382.382.382.382.38
Frequency of thermal discomfort
Year (%)35.143.142.040.344.844.142.438.958.740.647.250.0
Dry (%)59.064.663.961.163.262.570.862.587.560.466.071.5
Rainy (%)11.121.520.119.426.425.713.915.329.920.828.528.5
Area under the curve for thermal discomfort
Year (°C·h/day)13.119.222.920.520.824.216.219.121.018.323.725.9
Dry (°C·h/day)23.333.841.136.336.642.129.033.937.132.040.945.0
Rainy (°C·h/day)2.94.64.74.75.16.33.34.24.84.76.56.8
Average solar gain (kW)
Year (kW)0.250.130.430.150.380.410.230.200.120.260.400.45
Dry (kW)0.210.100.560.140.490.510.280.230.120.240.410.56
Rainy (kW)0.290.150.310.170.280.330.180.180.120.270.400.35
Note: LR—Living room, BR—Bedroom.
Table 4. Potential impact of the studied parameters on the frequency and intensity of thermal discomfort.
RankParameterFTD (%)AUC (°C·h/day)
1Orientation4 to 118 to 11
2Roof thermal transmittance2 to 62.5 to 9.5
3Window shading2 to 52 to 5
4Wall thermal transmittance0 to 5.3−3 to 5.3
5Fenestration factor0 to 33 to 4
6Façade shading0.8 to 5.5−2 to −6.8
Disclaimer/Publisher’s Note: The statements, opinions and data contained in all publications are solely those of the individual author(s) and contributor(s) and not of MDPI and/or the editor(s). MDPI and/or the editor(s) disclaim responsibility for any injury to people or property resulting from any ideas, methods, instructions or products referred to in the content.