Article

Monitoring and Analysis of Coastal Salt Pans Using Multi-Feature Fusion of Satellite Imagery: A Case Study Along the Laizhou Bay

1
College of Earth Science and Engineering, Shandong University of Science and Technology, Qingdao 266590, China
2
Key Laboratory of Marine Geology and Environment, Institute of Oceanology, Chinese Academy of Sciences, Qingdao 266071, China
3
Shandong Provincial Geological and Mineral Engineering Group Co., Ltd., Jinan 250014, China
*
Author to whom correspondence should be addressed.
Sustainability 2025, 17(18), 8436; https://doi.org/10.3390/su17188436
Submission received: 11 August 2025 / Revised: 18 September 2025 / Accepted: 18 September 2025 / Published: 19 September 2025

Abstract

Coastal ecosystems, located at the interface of terrestrial and marine environments, provide significant ecological functions and resource value. Coastal salt pans, as critical coastal resources with significant implications for coastal ecosystem health and resource management, have attracted extensive research attention. However, current studies on the extraction of spatiotemporal patterns of coastal salt pans remain relatively limited and superficial. This study takes coastal salt pans in Laizhou Bay as a case study, proposing a hierarchical classification method—Salt Pan Feature-Enhanced Fusion Image Random Forest (SPFEFI-RF)—based on multi-index synergy guidance and deep-shallow feature fusion, achieving high-precision extraction of coastal salt pans. First, a Modified Water Index (MWI) and Salt Pan Crystallization Index (SCI) were constructed from image spectral features, specifically targeting the extraction of evaporation ponds. Concurrently, a salt pan sample dataset was developed for the DeepLabv3+ (DL) method to extract deep semantic features and perform multi-scale feature fusion. Subsequently, a three-channel fusion strategy—R(MWI)-G(SCI)-B(DL)—was employed to produce the Salt Pan Feature-Enhanced Fusion Image (SPFEFI), enhancing distinctions between salt pans and background land cover. Finally, the Random Forest (RF) classifier using shallow spectral features was applied to extract salt pan information, further optimized by spatial domain denoising techniques. Results indicate that the SPFEFI-RF approach effectively extracts coastal salt pan features, achieving an overall accuracy of 92.29% and a spatial consistency of 85.14% with ground-truth data. The SPFEFI-RF method provides advanced technical support for high-precision extraction of global coastal salt pan spatiotemporal characteristics, optimizing coastal zone management decisions and promoting the sustainable development of coastal ecosystems and resources.

1. Introduction

Coastal ecosystems, located at the terrestrial–marine interface, nurture diverse and unique habitats such as mangroves, coastal wetlands, and salt pans, playing an irreplaceable role in providing ecosystem services and supporting socio-economic development in coastal regions [1].
Coastal salt pans are an important resource and land use type in shoreline regions worldwide. As widely distributed production spaces and ecological units, they not only embody a long history of salt making but also play key roles in maintaining regional biodiversity, regulating local climate, and sustaining coastal ecological balance. However, under climate change, rising sea levels and intensified human activities, salt pan ecosystems face mounting pressure of degradation, conversion, and fragmentation. Their sustainable management has, therefore, become a transboundary challenge. Although salt pans are globally extensive and highly heterogeneous, and remote sensing has been applied to identify and monitor salt pans in local areas, there is no generalizable extraction method that operates across climatic zones and landforms and accommodates diverse spectral behaviors. This gap prevents the global assessment and coordinated governance of salt pan resources.
Consequently, high-accuracy extraction of coastal salt pans has become a research focus in recent years. Sridhar highlighted the importance of water body extraction in coastal zones and, based on the reflectance properties of water, proposed the Salt Pan Index (SpI) to jointly extract salt pans and aquaculture ponds [2]. Building on this line of work, Jin [3], Chen [4], and Ni [5] combined spectral and textural features—such as the Laplacian operator [4], Hessian matrix [4,5] and local spatial similarity [6] (Appendix A.3)—to derive salt pan targets. Machine learning approaches have also offered new technical routes: Safaee [7] and Ji [8] achieved high precision extraction using learning-based classifiers. Nevertheless, because salt pans, aquaculture ponds, and tidal flats often exhibit highly similar spectral and spatial signatures [6], methods relying on spectra alone struggle to separate classes; texture-based methods require careful feature design and are sensitive to window size and orientation, which limits model generalization.
Given these limitations in remote sensing feature extraction methods, recent research has increasingly adopted multi-feature extraction (including spectral, textural, shape-based, indices [9], and automated deep learning-derived features [10]) and information fusion strategies (such as multi-source [11], multi-temporal [12], and feature/decision-level fusion [13]). By combining multi-dimensional features and complementary information, these approaches significantly improve classification accuracy and model robustness. Nevertheless, for the specific case of salt pan extraction, challenges such as spectral confusion, sensitivity to textural parameters, and limited generalization capabilities remain, and more effective solutions are urgently required.
In particular, current methods struggle to effectively distinguish between evaporation ponds and aquaculture ponds within salt pans. Efficient extraction and integration of their unique spectral and spatial response characteristics, as well as the construction of models robust enough to accommodate complex environmental variations, remain open challenges.
To address the persistent confusion between evaporation ponds and aquaculture ponds, this study proposes a multi-feature collaborative extraction framework that establishes a new “spectral–semantic–machine-learning” paradigm for salt pan mapping. Because different water bodies have similar spectral responses, spectral indices alone cannot reliably distinguish evaporation ponds from other water samples; therefore, to capture complete salt pan characteristics, we extracted features for all samples of water containing evaporation ponds as well as crystallization ponds. We first design two targeted indices—the Modified Water Index (MWI) and the Salt Pan Crystallization Index (SCI)—to emphasize evaporation and crystallization features. To suppress residual non-salt pan water, we introduce, for the first time in salt pan extraction, the encoder–decoder Deeplabv3+ (DL) semantic segmentation model to resolve water-body details, particularly separating aquaculture ponds from evaporation ponds. We then implement an R(MWI)-G(SCI)-B(DL) three-channel fusion strategy to merge these outputs and produce a Salt Pan Feature-Enhanced Fusion Image (SPFEFI), which markedly improves separability from the background. Finally, we apply a Random Forest (RF) classifier to SPFEFI for coastal salt pan mapping and evaluate the effectiveness of this approach using a representative salt pan region in the Laizhou Bay coastal zone. Research on salt pan extraction provides essential evidence for understanding the coupling between resource use and ecological processes in coastal zones. These findings offer practical guidance for sustainable coastal management and balancing regional economic development with environmental protection.

2. Materials and Methods

2.1. Study Area Overview

The Laizhou Bay coastal zone lies along the north-eastern coast of Shandong Province, China, spanning approximately 118°30′–120° E and 37°00′–37°40′ N (Figure 1). The bay covers about 7000 km2, the mainland shoreline is ~319 km long, and the mean water depth is ~10 m; overall relief is gentle. The climate is a typical temperate monsoon regime with four distinct seasons. Mean annual temperature is ~12.5 °C, and mean annual precipitation is ~600 mm, distributed very unevenly through the year and concentrated in July–September; potential evapotranspiration greatly exceeds precipitation.
Laizhou Bay is characterized by extensive, contiguous muddy tidal flats with exceptionally rich intertidal resources. The flats may extend several kilometers seaward with very low gradients, forming distinctive wetland systems. The Laizhou Bay coastal zone encompasses diverse land-cover types, including tidal flats, wetlands, salt marshes, mangroves, and coastal water, as well as varied land use categories such as agriculture, fisheries, salt production, industry, and tourism. Such abundant natural resources, combined with diversified land utilization patterns, position this area as critically significant for both regional economic development and ecological conservation. Laizhou Bay represents a typical coastal zone region, where salt extraction is primarily conducted through the evaporation of pumped subterranean brine [14].

2.2. Dataset

We used Landsat-8 OLI/TIRS imagery. Using Google Earth Engine (GEE), we retrieved scenes and performed radiometric calibration and atmospheric correction. Overall, cloud cover was low; the study area itself was cloud-free, and subsequent time-series processing mitigated any residual cloud effects. Data screening criteria are summarized in Table 1. We employed visible and infrared band combinations at a 30 m spatial resolution.

2.3. Methods

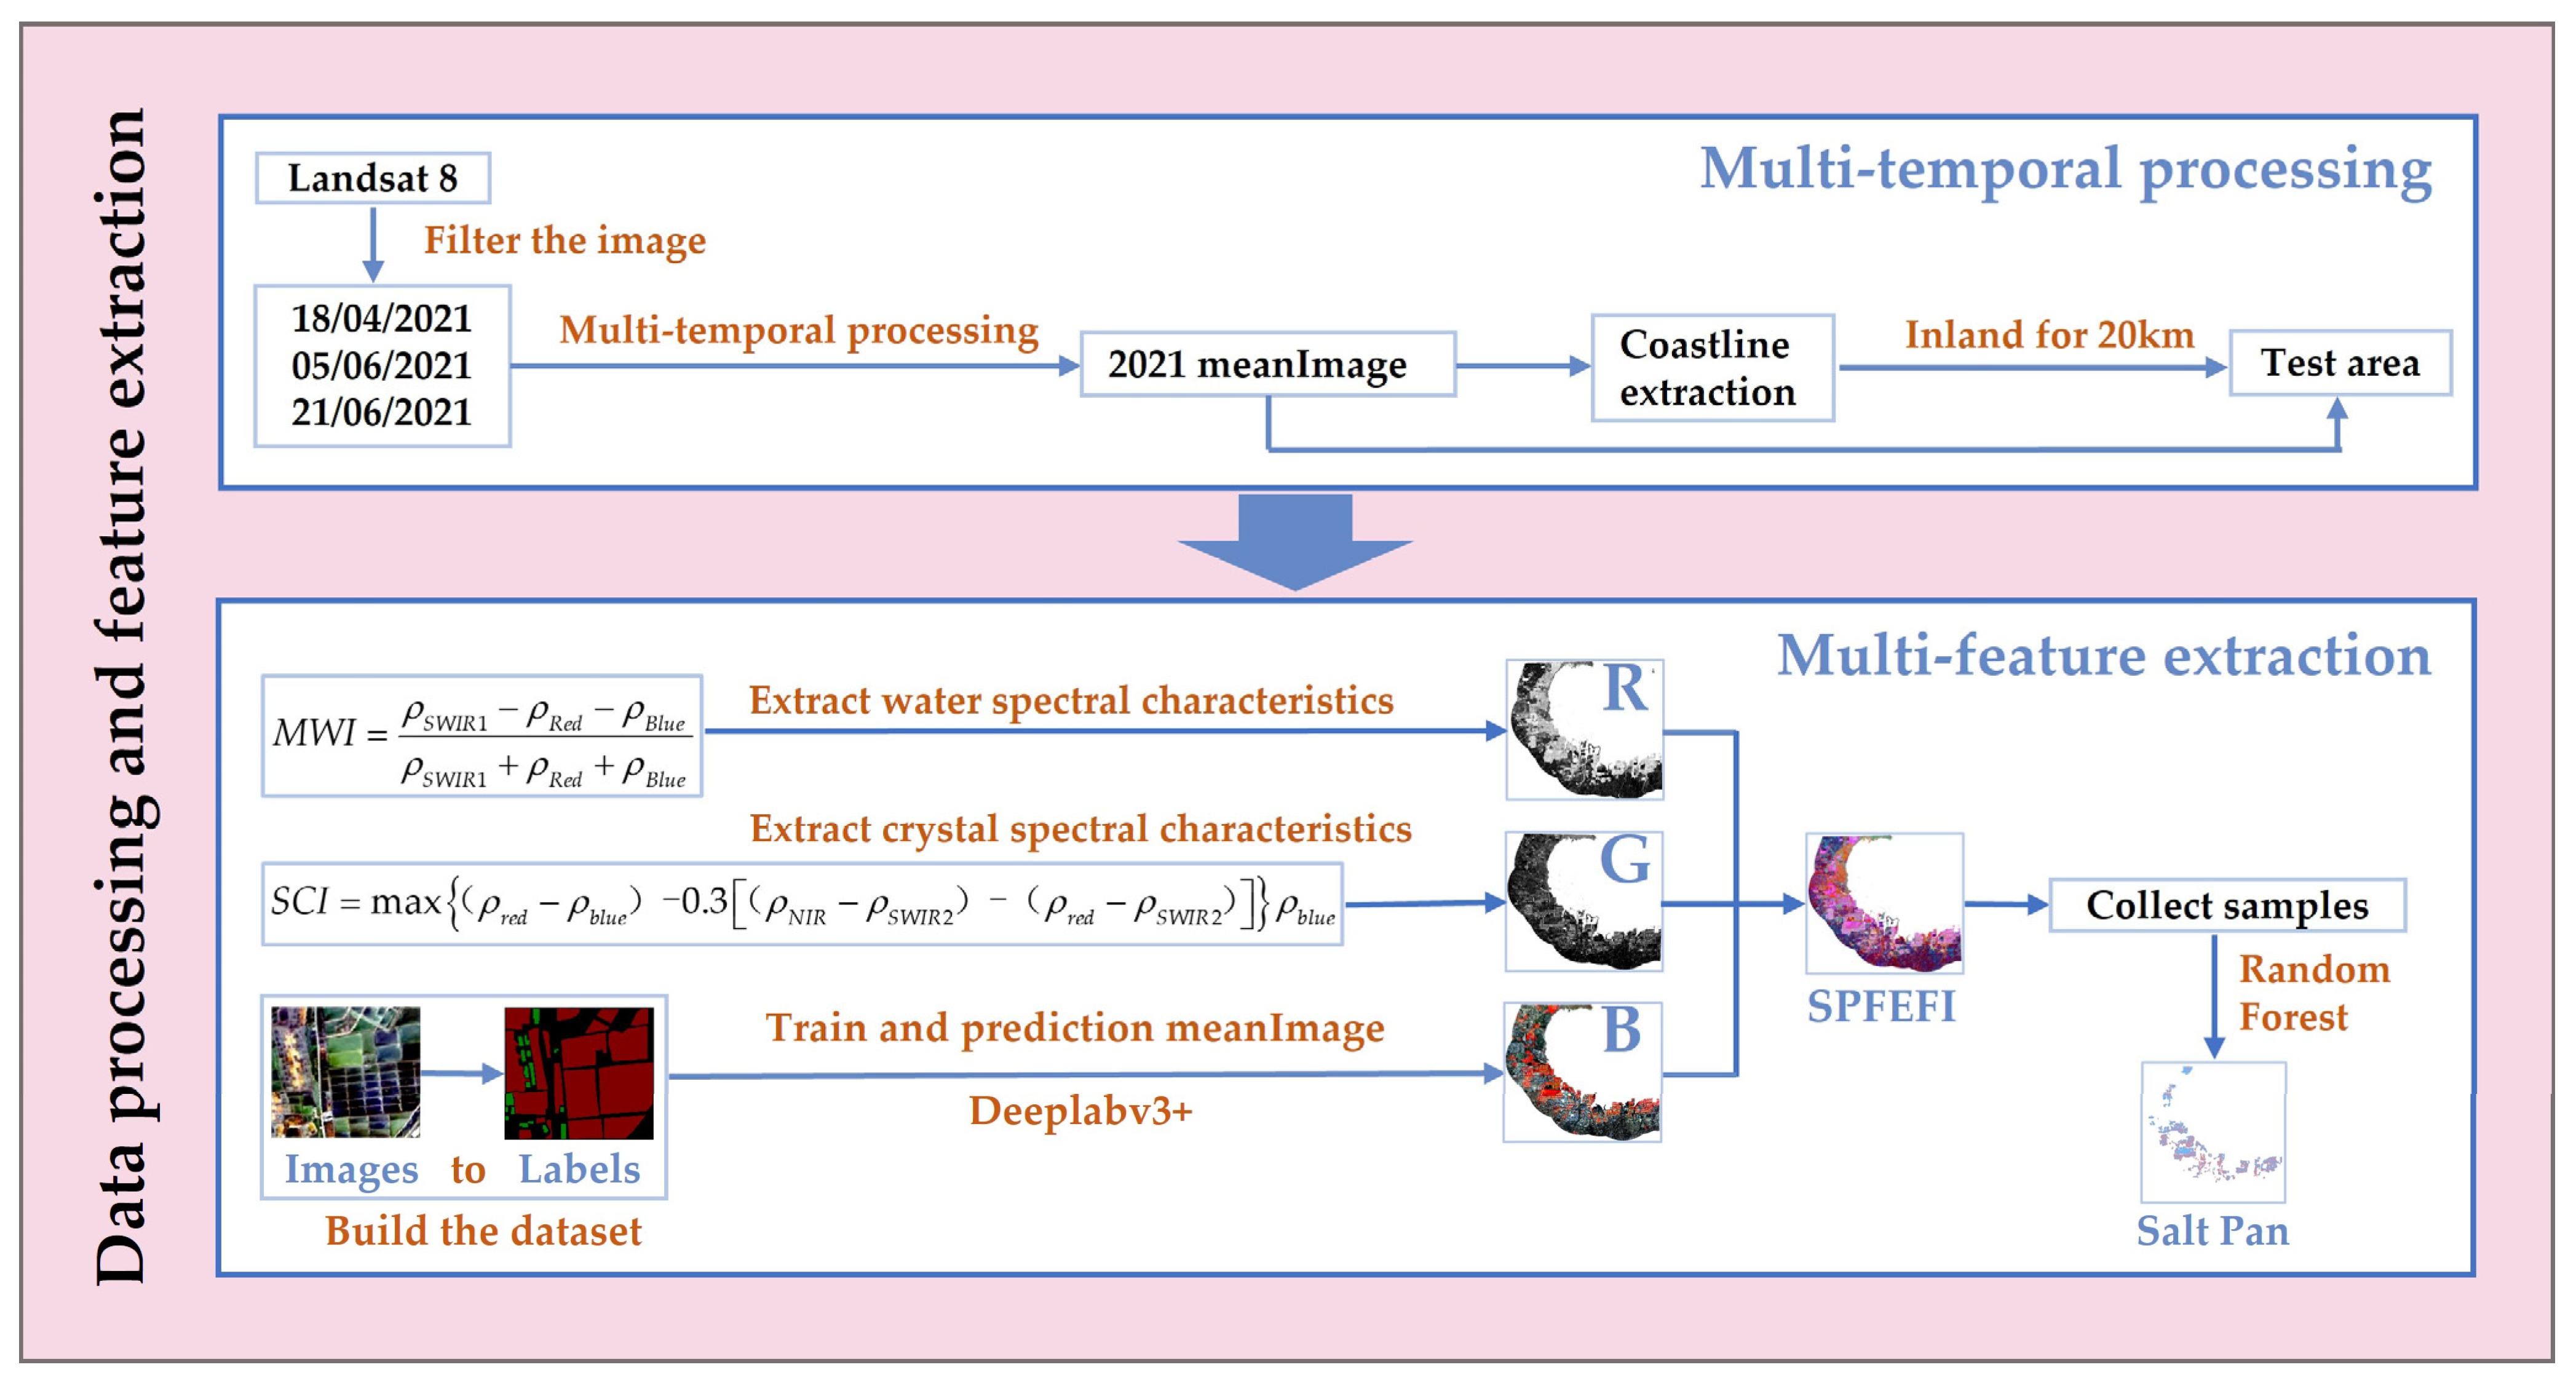
In this section, we first selected three images with distinct salt pan features from 2021 and performed multi-temporal processing to generate the 2021meanImage. Subsequently, to meet research requirements, we extracted the land portion of the Laizhou Bay coastal zone by deriving the coastline from the 2021meanImage and extending it 20 km inland to define the study area (Figure 1). Following this, feature extraction was conducted for the MWI, SCI, and DL indices, which were then fused using an R(MWI)-G(SCI)-B(DL) composite to generate the SPFEFI. Finally, the SPFEFI was processed using the Random Forest algorithm (Figure 2).

2.3.1. Remote Sensing Indices

  • Modified Water Index
To effectively enhance the extraction accuracy of evaporation ponds in salt pans and improve spectral separability between water and non-water bodies, this study proposes a Modified Water Index (MWI). Based on a comprehensive analysis of existing water indices—the Normalized Difference Water Index (NDWI) [15] and the Modified Normalized Difference Water Index (MNDWI) [16]—the spectral differences between water and non-water bodies were analyzed in detail (Appendix A.1 MWI). The MWI employs blue ( ρ B l u e ), red ( ρ R e d ), and short-wave infrared ( ρ S W I R 1 ) bands. These formulas are given as follows:
M W I = ρ S W I R 1 ρ R e d ρ B l u e ρ S W I R 1 + ρ R e d + ρ B l u e
N D W I = ρ G r e e n ρ N I R ρ G r e e n + ρ N I R
M N D W I = ρ G r e e n ρ S W I R ρ G r e e n ρ S W I R
2.
Salt Pan Crystallization Index
Existing salinity indices, such as the Salinity Index (SpI) and Salinity Sensitivity Index (SSI), are primarily developed for monitoring soil or surface salinization. However, these indices struggle to accurately identify crystallization pools in salt pans. To effectively extract crystallization ponds and improve their spectral distinguishability from background land features, this study proposes a novel Salt Pan Crystallization Index (SCI). Based on detailed spectral analyses of salt pans and typical interference features (Appendix A.2 SCI), SCI optimizes band combinations to enhance extraction accuracy. The specific formulas are as follows:
S p I = ρ G r e e n ρ S W I R ρ G r e e n + ρ S W I R
S S I = ρ b l u e ρ r e d
S C I = max ( ρ r e d ρ b l u e ) 0.3 ( ρ N I R ρ S W I R 2 ) ( ρ r e d ρ S W I R 2 ) ρ b l u e

2.3.2. DeepLabv3+

  • Network Overview
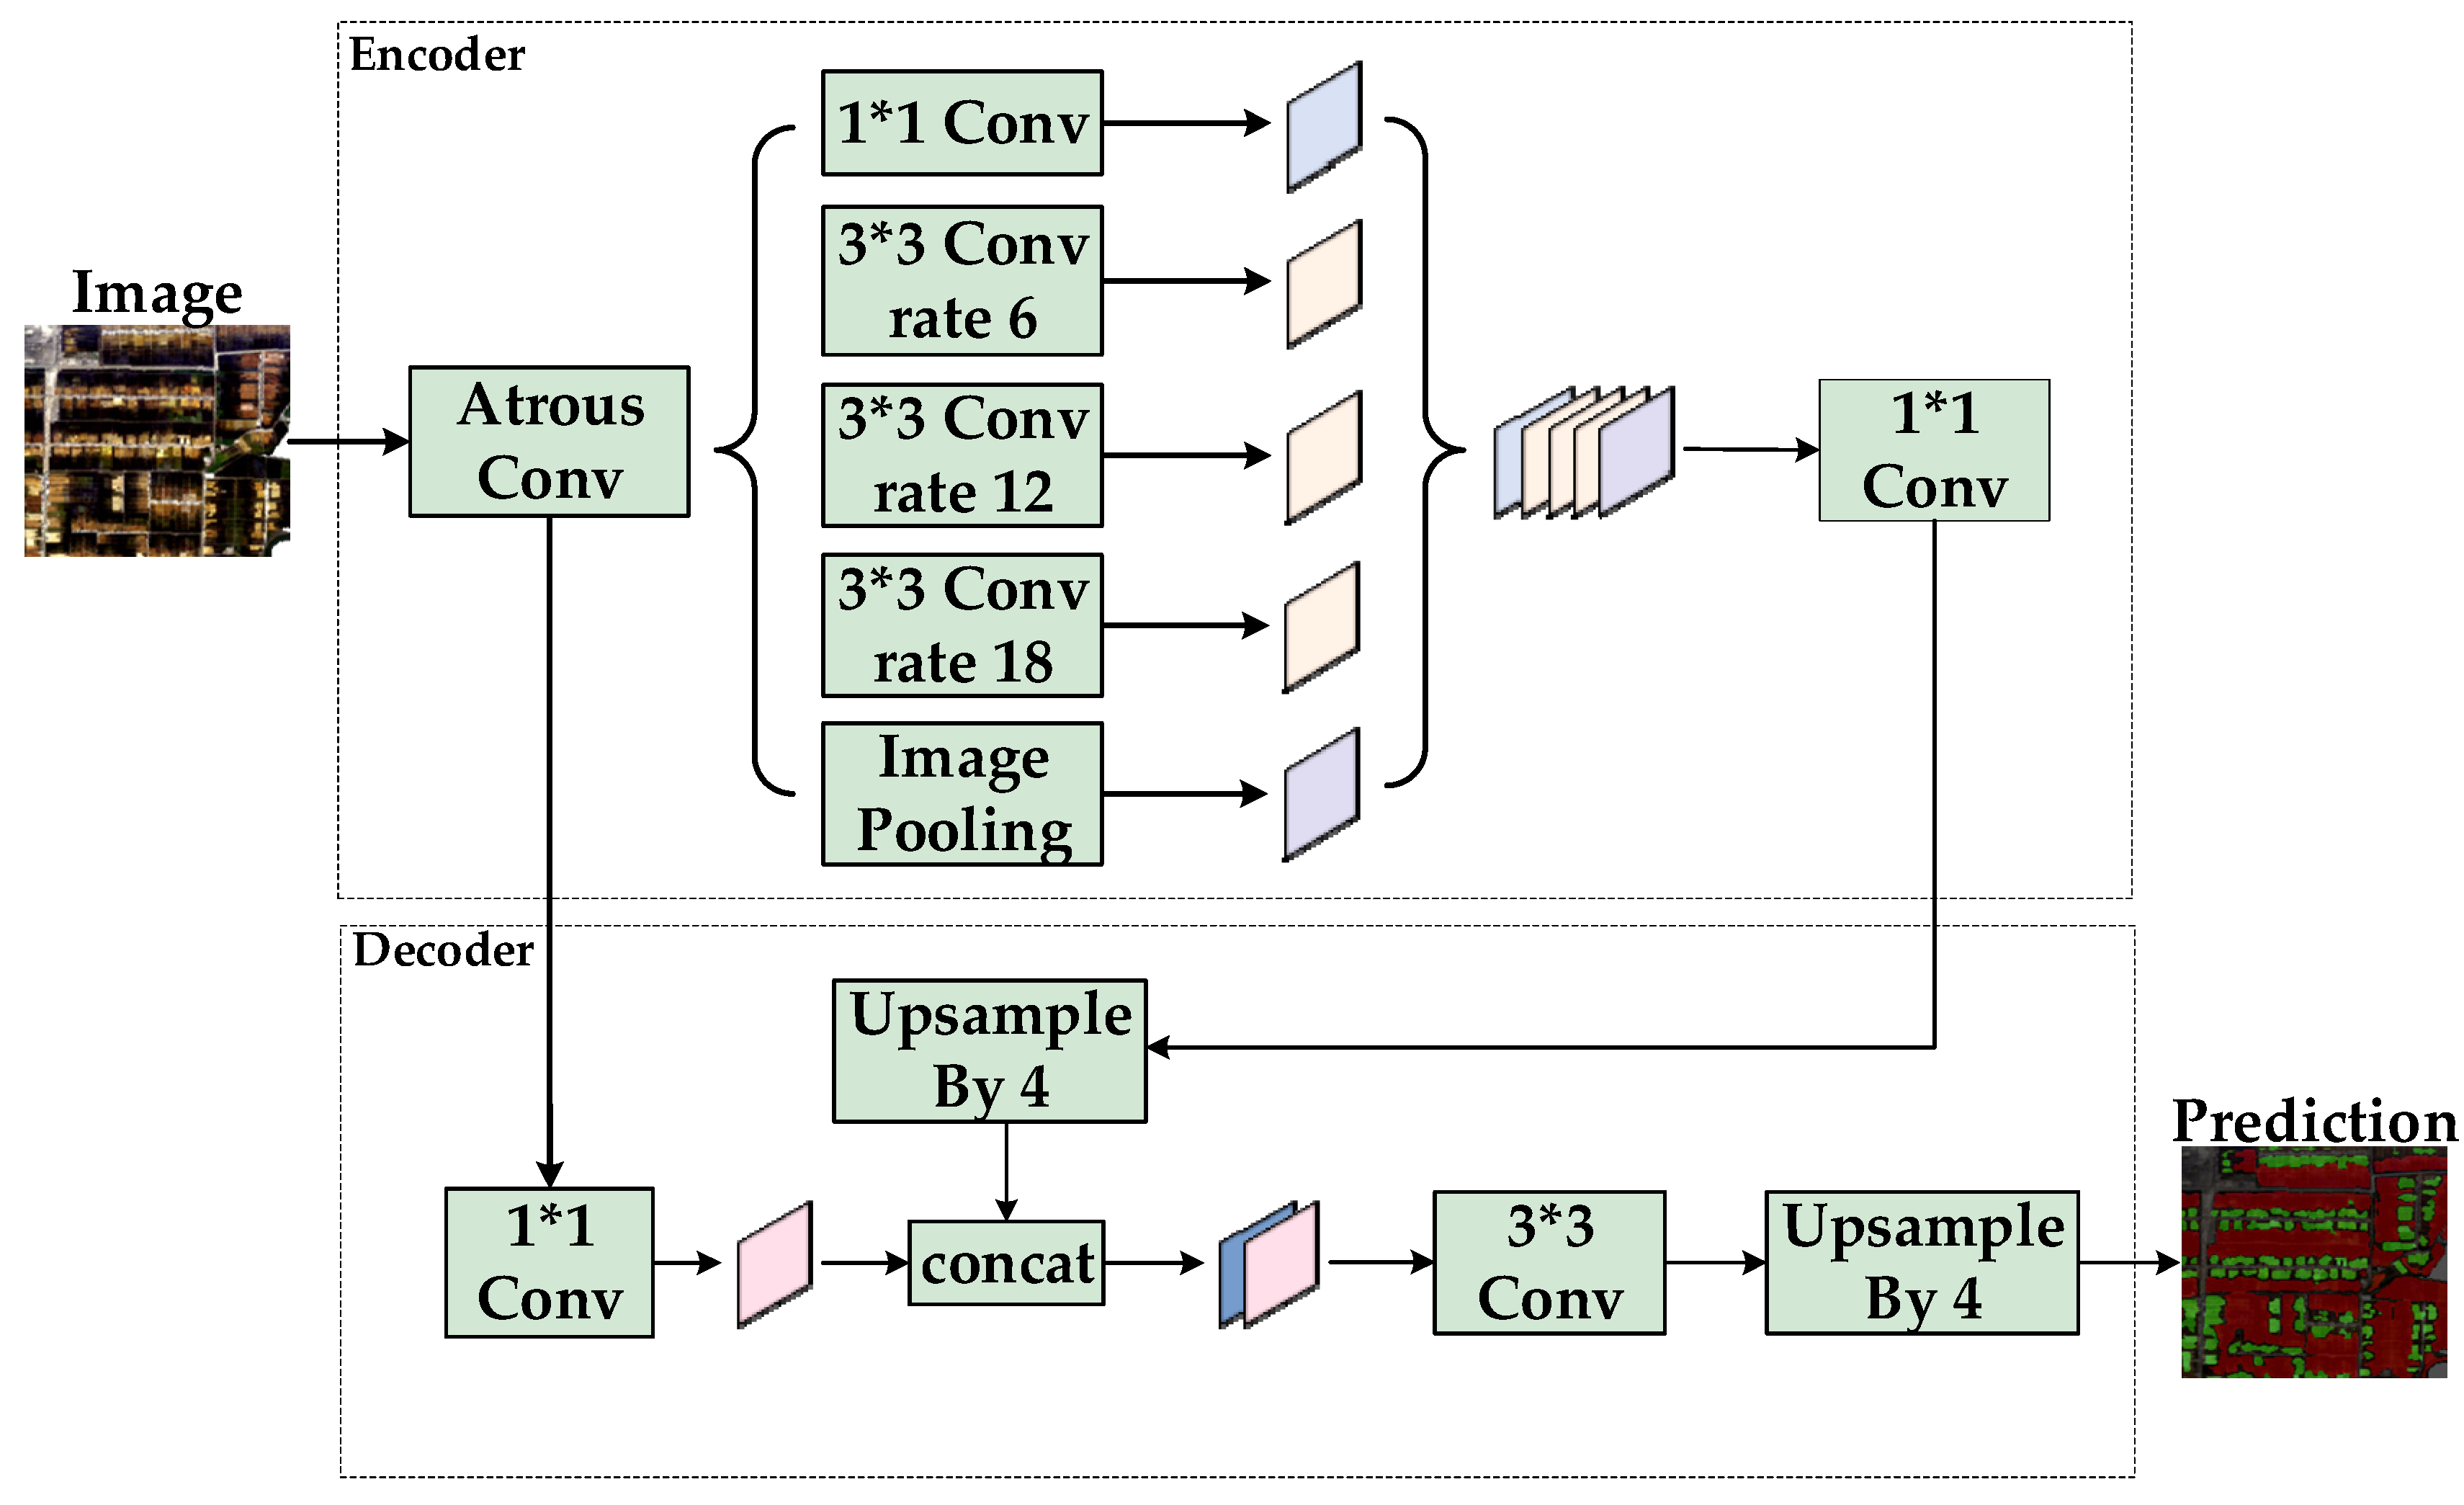
DeepLabv3+ is a semantic segmentation model proposed by Google based on an encoder–decoder architecture (Figure 3). Its core innovations lie in combining multi-scale feature extraction and detail recovery mechanisms [17]. The model employs MobileNetV2 as its backbone, extracting features after two and four downsampling operations as foundational feature layers [18]. During encoding, multi-scale context information is captured through an Atrous Spatial Pyramid Pooling (ASPP) module, producing high-level semantic features upon fusion [19,20]. During decoding, the encoder outputs undergo a four-fold upsampling and are aligned and stacked spatially with shallow-layer features. Effective fusion of deep semantic information and shallow details is achieved via depthwise separable convolutions, generating high-precision segmentation results [21,22].
2.
Dataset Construction
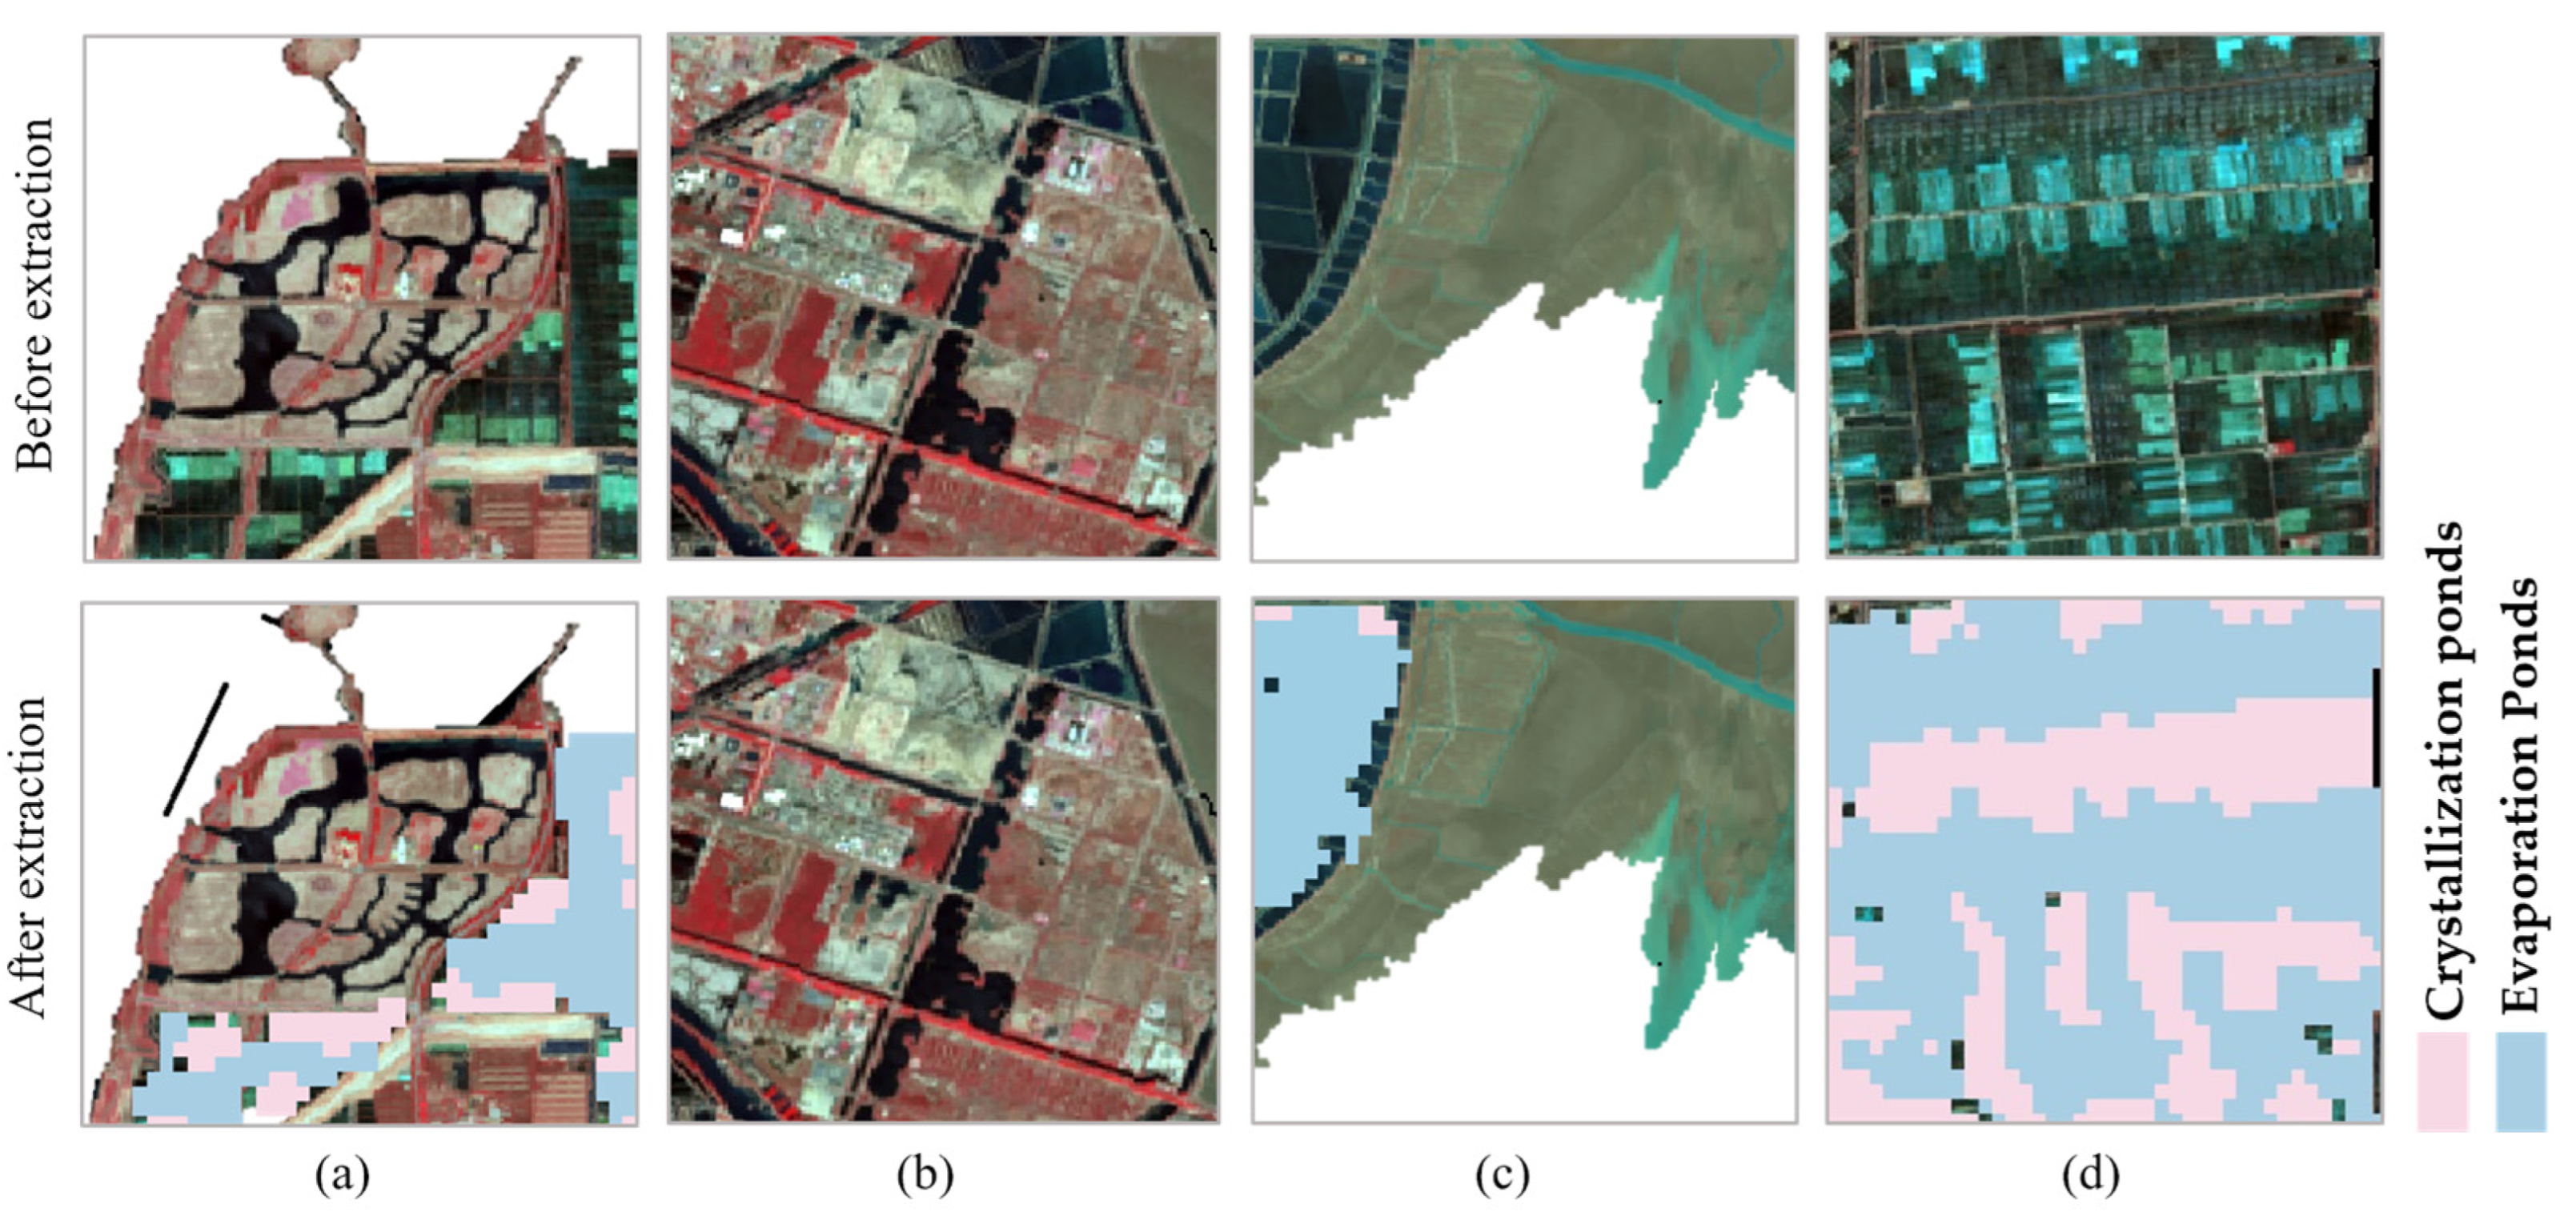
On the GEE platform, we assembled a multi-temporal Landsat dataset by selecting summer scenes (June–September) from 2020 to 2024 with <30% cloud cover (Table 2). To address insufficient valid samples of salt pans, data augmentation strategies—including 90° rotations, mirroring, and adjustments to saturation, brightness, and contrast—were applied to increase dataset scale and diversity.
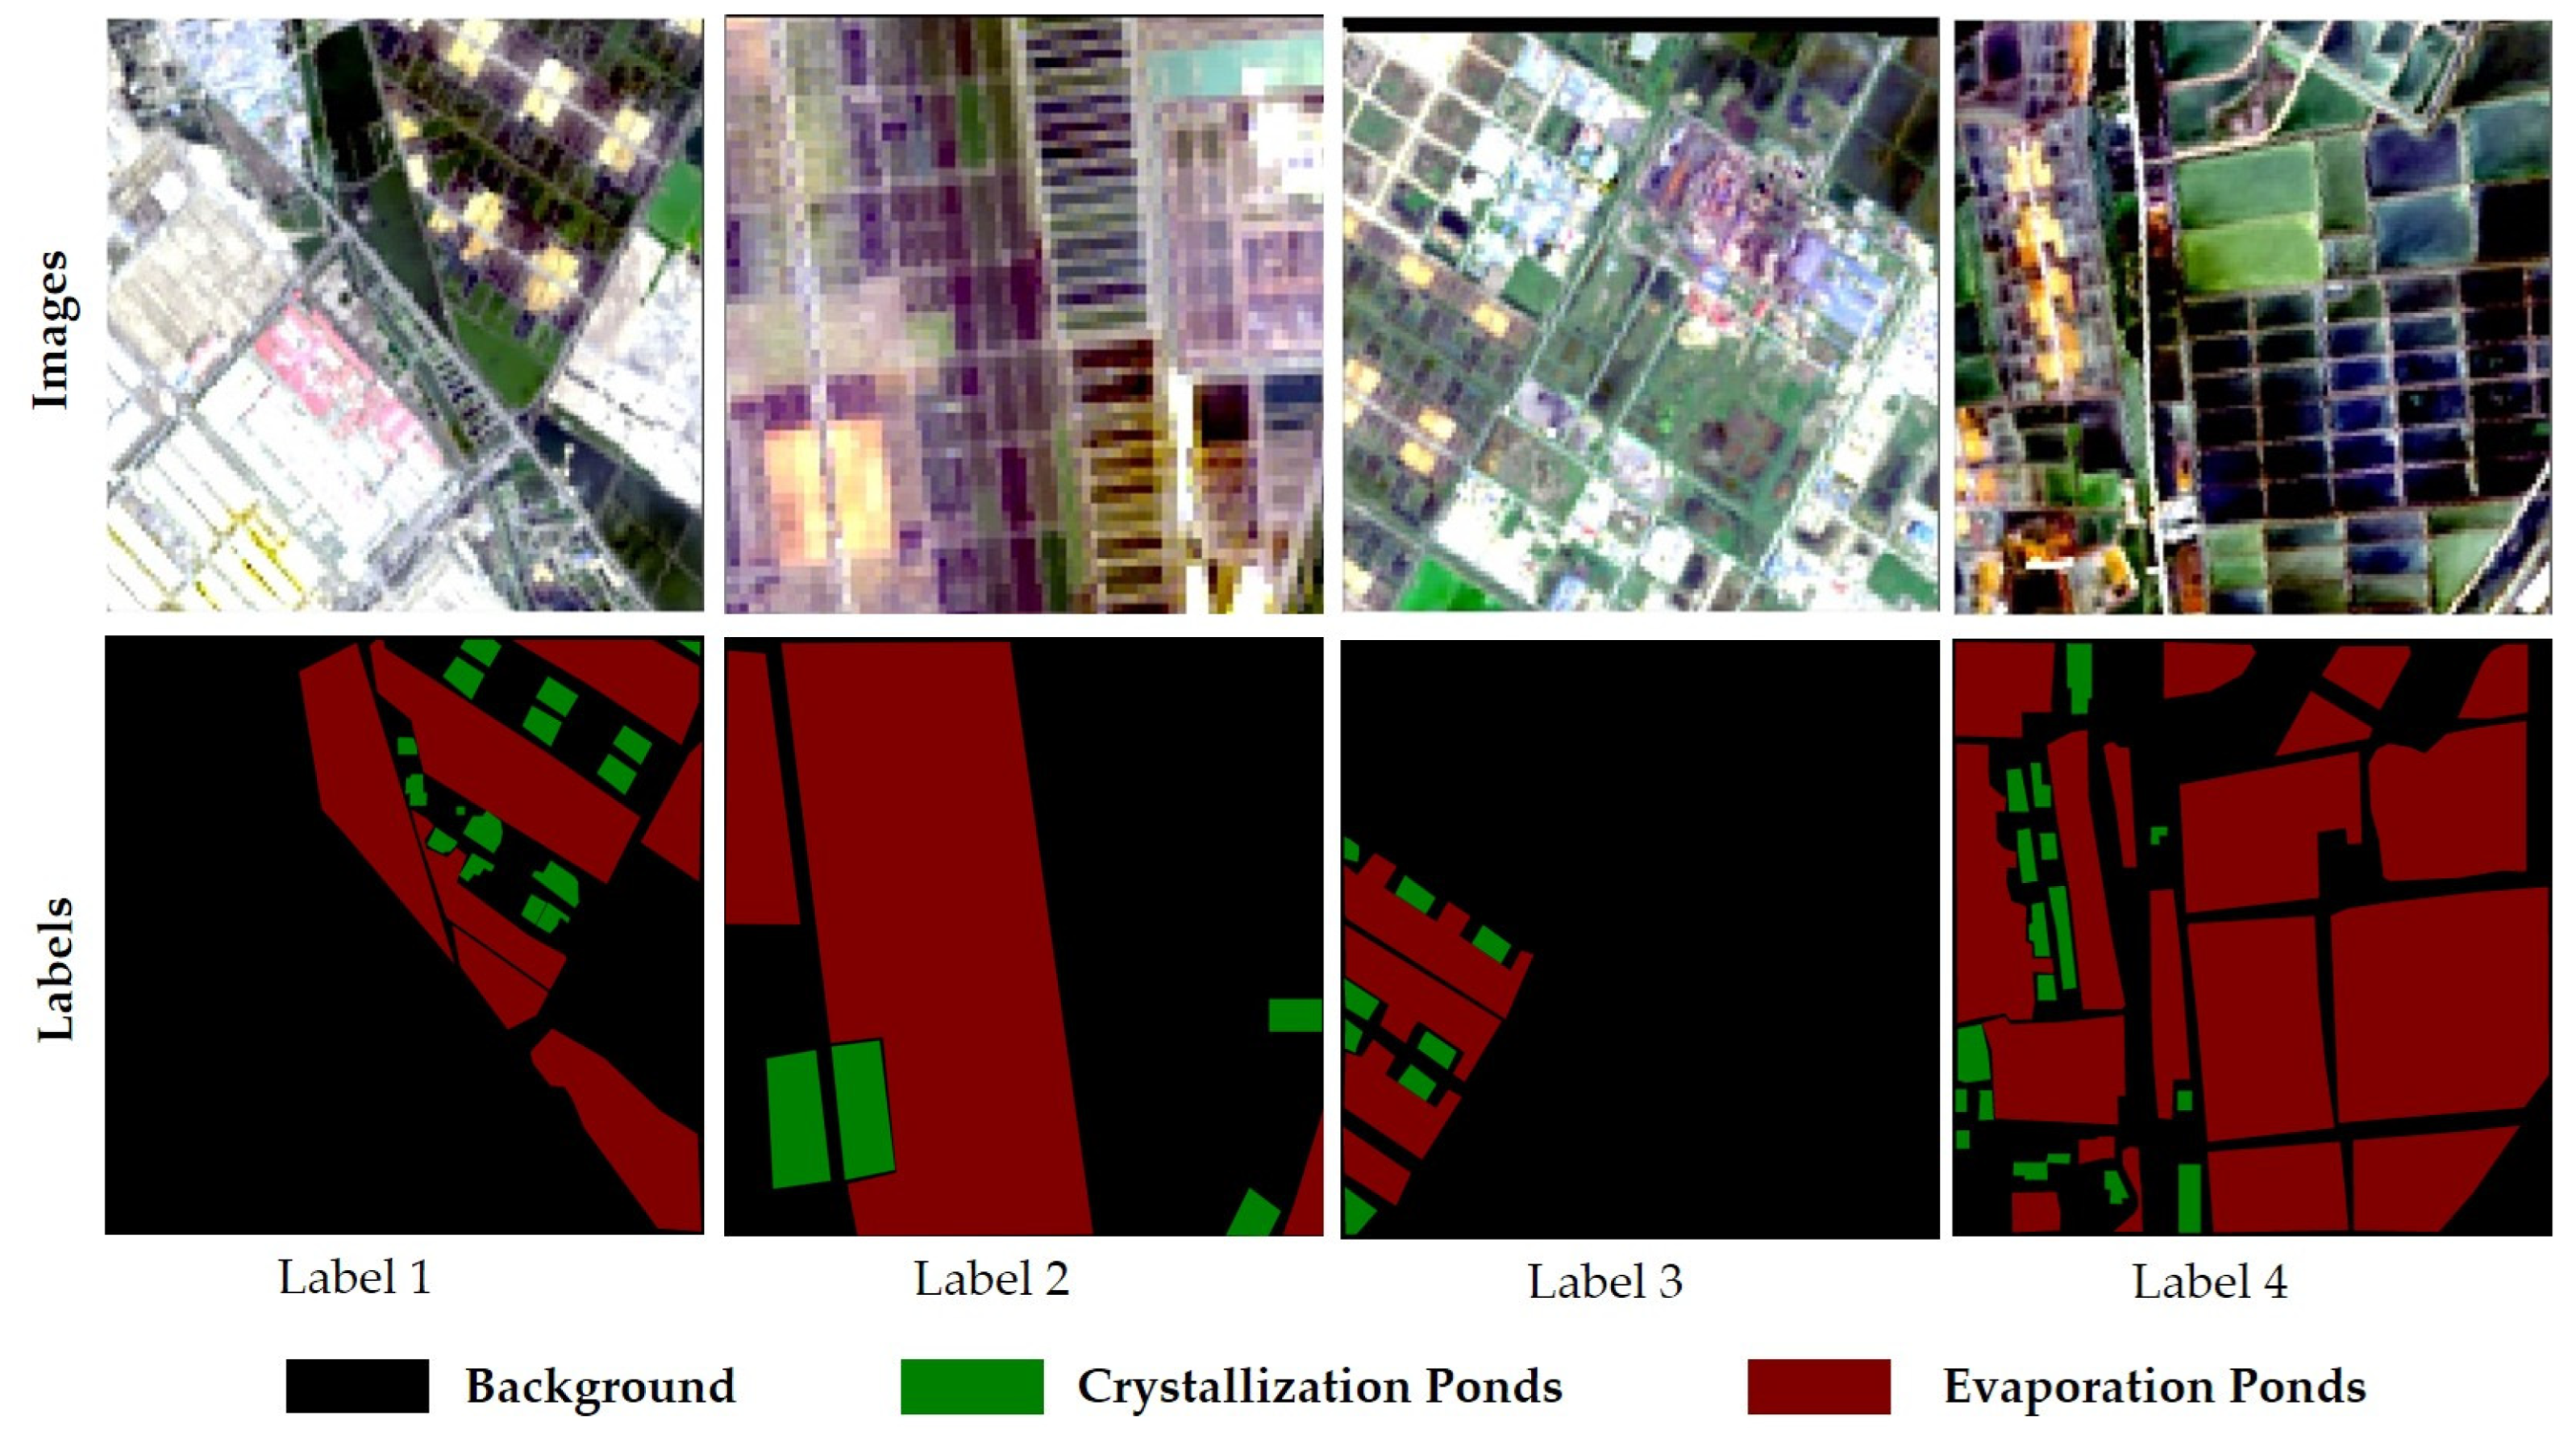
During the sample annotation phase, the images were divided into small patches to create semantic labels. Those containing cloud cover or unclear features of the salt pans were excluded. Representative examples of the semantic labels are shown in Figure 4. Semantic labels were manually annotated using visual interpretation, categorizing features into crystallization ponds, evaporation ponds, and background based on their spectral and textural characteristics, preserving spatial relationships and structural integrity among categories. The resulting semantic segmentation dataset contains 12,581 labeled samples, providing a robust foundation for training deep learning models.

2.3.3. Random Forest (RF)

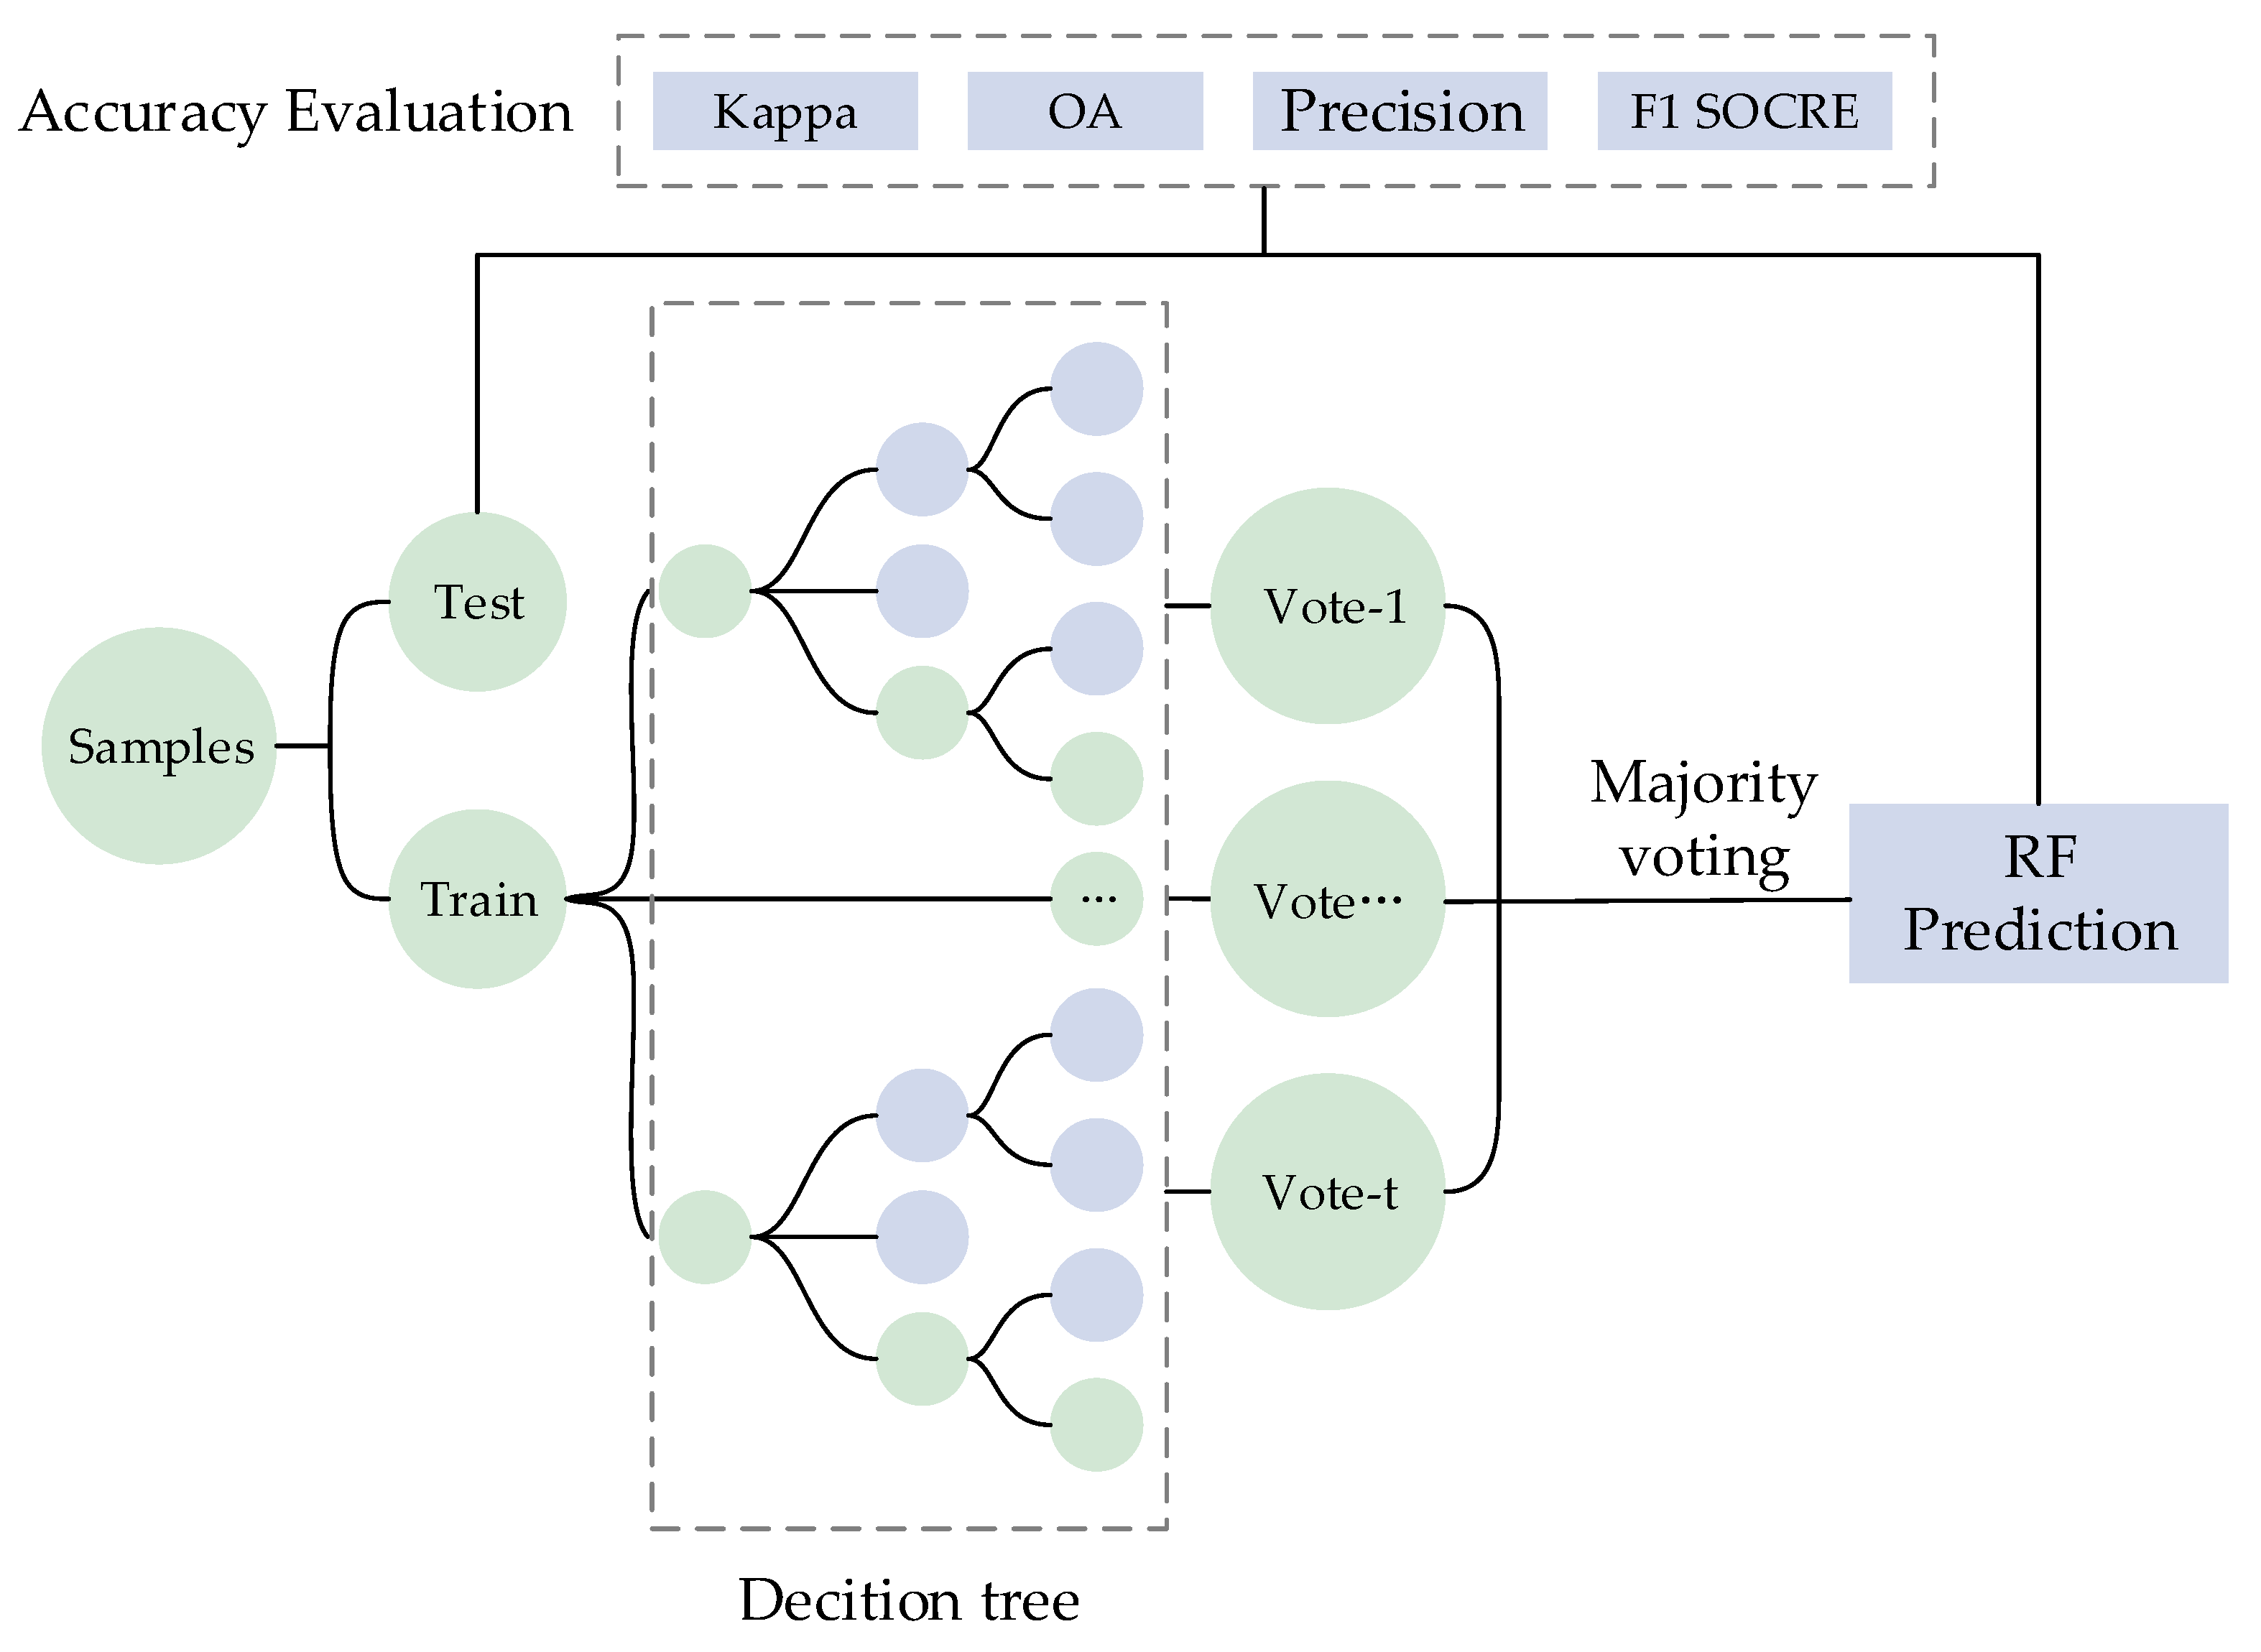
Random Forest (RF) is a classification algorithm based on Bagging ensemble learning techniques (Figure 5), which significantly enhances classification stability and prediction accuracy by constructing multiple decision trees and aggregating their predictions [23]. The RF algorithm effectively handles high-dimensional data and mitigates multicollinearity issues [24,25]. The cooperative prediction and ensemble learning mechanisms of multiple decision trees substantially reduce the risk of overfitting [26,27]. Thus, this multi-feature collaborative method provides a comprehensive and reliable solution for extracting coastal salt pans.

2.4. Accuracy Assessment Method

This study employs a Kappa coefficient, Overall Accuracy, Precision, and F1-score as accuracy evaluation metrics (Table 3). True Positive (TP) denotes pixels correctly classified into a specific class. True Positives (TP) represent the number of samples that truly belong to a class and are correctly classified. False Positives (FP) denote pixels incorrectly classified into a class.

3. Results

3.1. Multi-Temporal Image Fusion

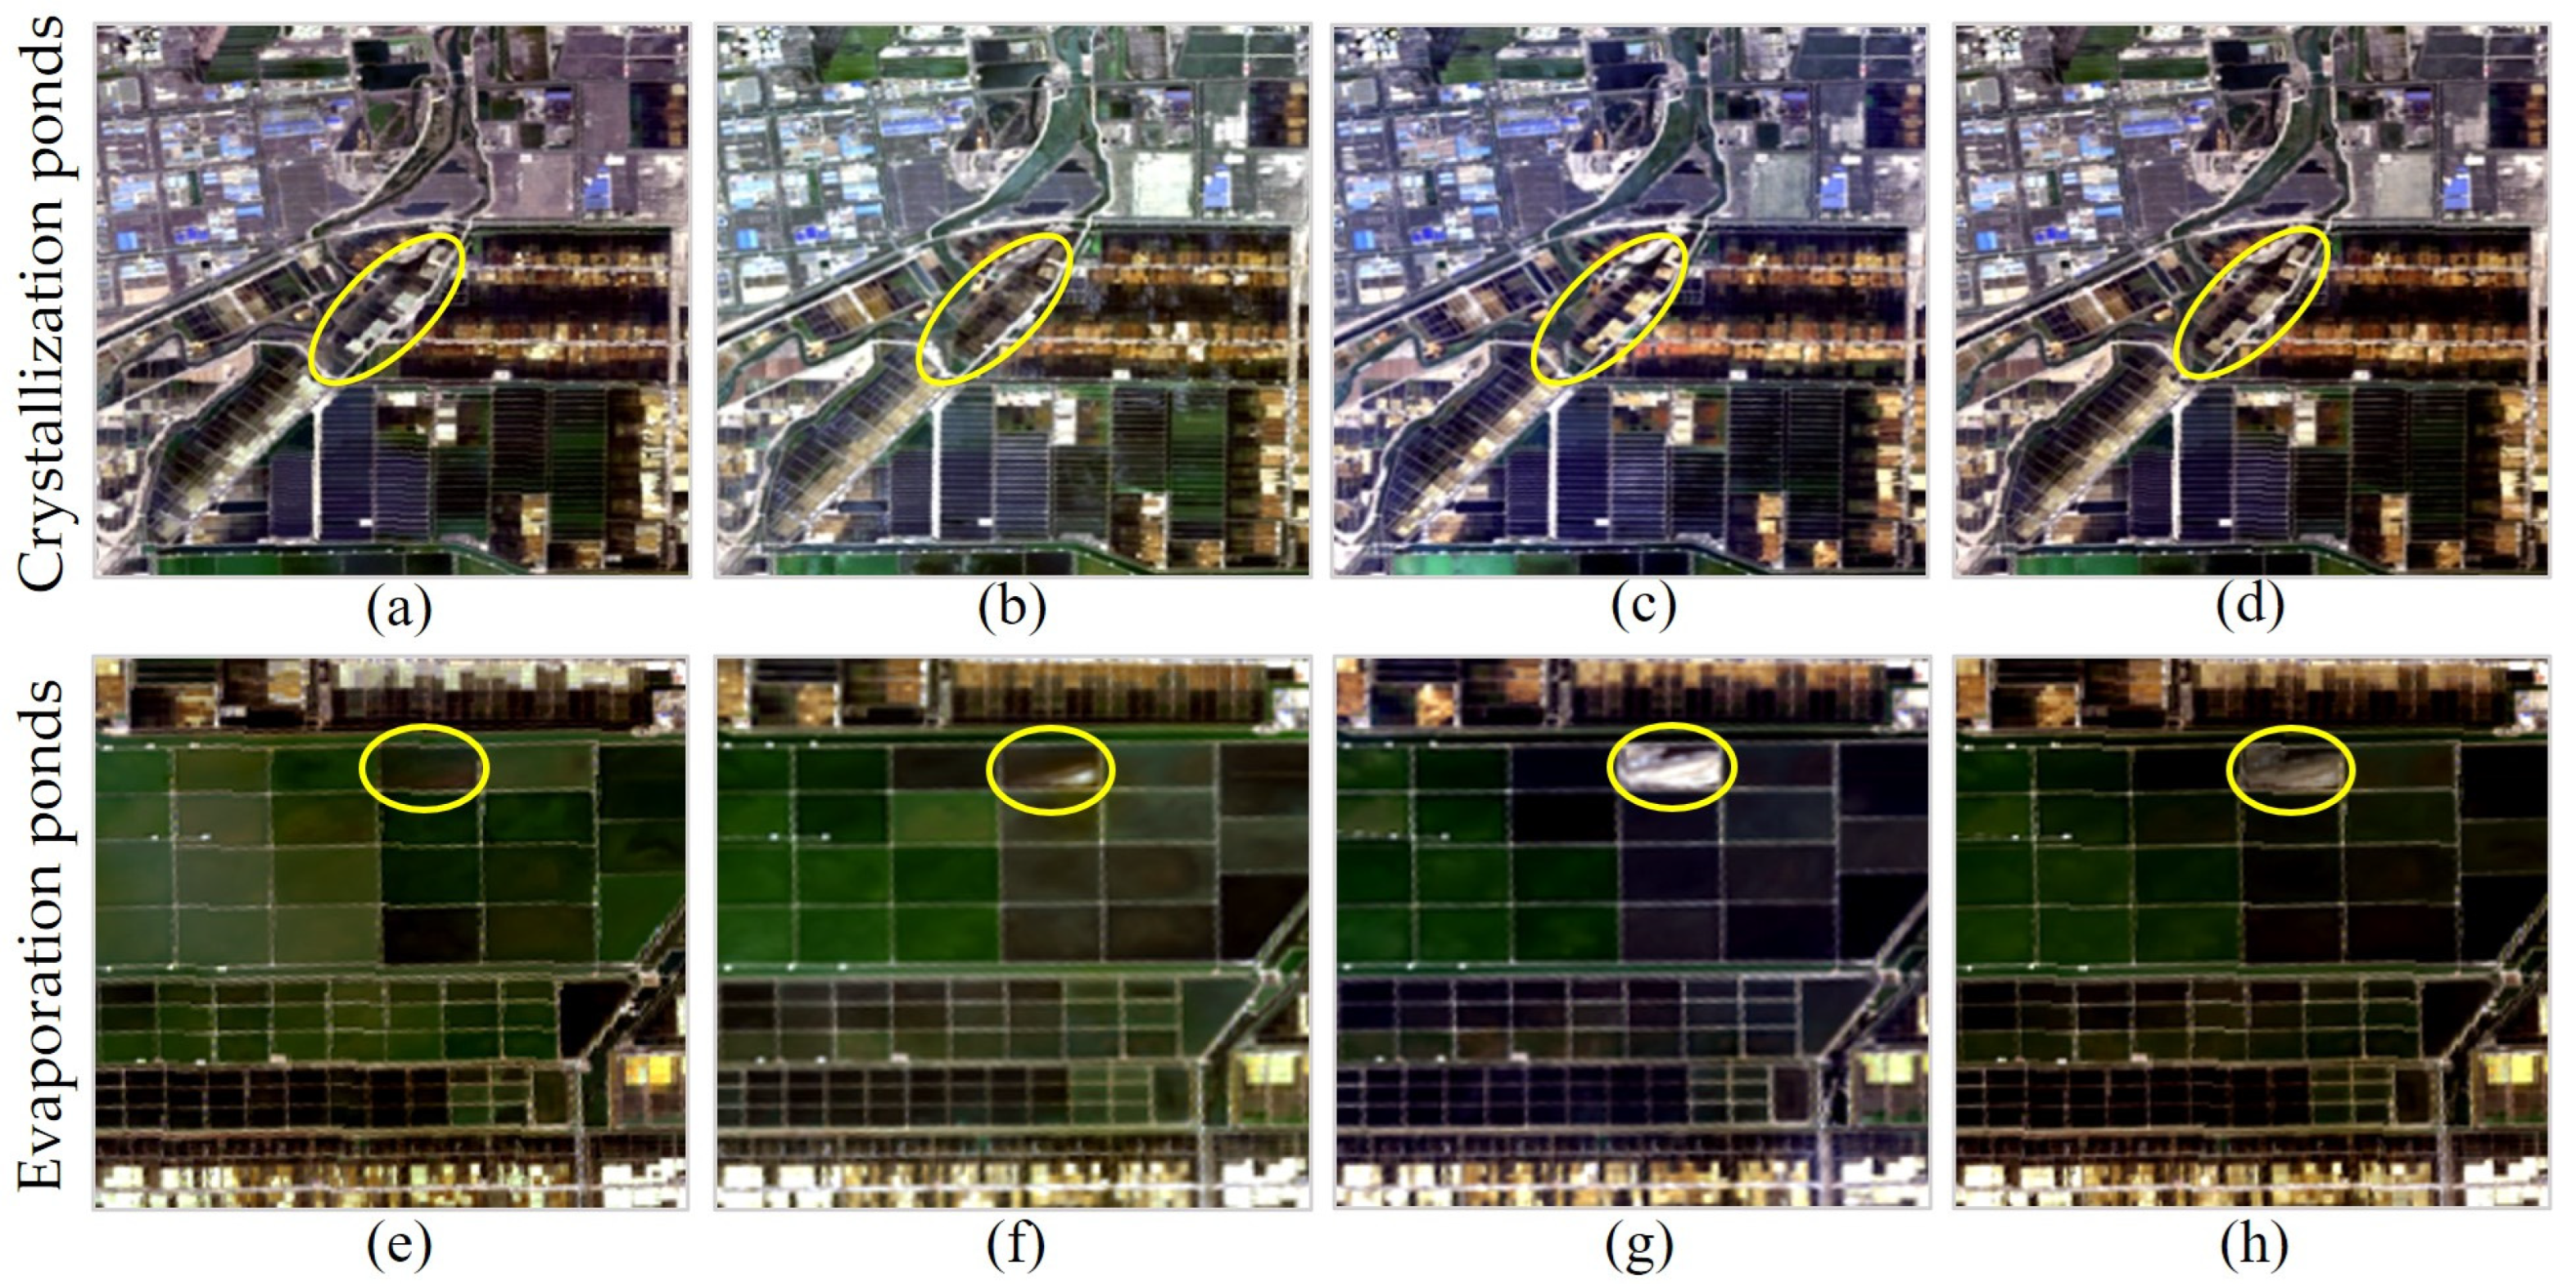
In salt production, environmental factors dynamically regulate the states of various pond sections, causing significant temporal changes in evaporation and crystallization ponds throughout the harvesting cycle, leading to variations in surface characteristics and spectral reflectance. Multi-temporal image fusion optimally preserves real land-cover characteristics of salt pans. Using three images from spring and summer of 2021 as an example, image fusion effectively mitigated the influence of dynamic variations during the salt production cycle (Figure 6).
In the temporal analysis of remote sensing imagery within the salt pan region, the dynamic variation characteristics of crystallization and evaporation ponds are distinctly observable. For the crystallization pond area (highlighted by the yellow ellipse in the first row), significant temporal differences are evident across different image dates. The image from 18 April 2021 reveals that the crystallization ponds appear darker, indicating that some ponds had not reached the typical crystallization stage (Figure 6a). On 5 June 2021, the crystallization ponds collectively displayed a significantly darker tone, with limited spectral separability from the surrounding features (Figure 6b). By 21 June 2021, the distinction between crystallization ponds and their surroundings improved noticeably, and the spectral features of the ponds became more pronounced (Figure 6c). Therefore, to address the inconsistent characteristics of crystallization ponds across temporal images, a multi-temporal fusion approach was employed using the first three images (Figure 6d). The fused image shows a uniform, bright tone with clear spectral features, consistent with optimal crystallization conditions. Simultaneously, the fusion enhanced spatial uniformity within adjacent evaporation ponds.
For the evaporation ponds (highlighted by the yellow ellipse in the second row), optical features varied temporally. On 18 April 2021, no salt crystallization was observed in these ponds (Figure 6e). By 5 June 2021, minor salt crystallization began to appear (Figure 6f). By 21 June 2021, salt crystallization significantly increased (Figure 6g). The fused image retained the crystallization information from 21 June while better representing the typical optical characteristics of evaporation ponds (Figure 6h). Furthermore, compared with single-temporal images, the fused evaporation pond areas exhibited enhanced spatial consistency in tone.

3.2. Spectral Index Feature Extraction

We compared the results of SCI and MWI using the original images and conducted on-site observations at the salt field, confirming that the results of MWI and SCI extraction were consistent with the real surface information. Comparisons of results with existing indices are provided as follows.

3.2.1. Modified Water Index (MWI)

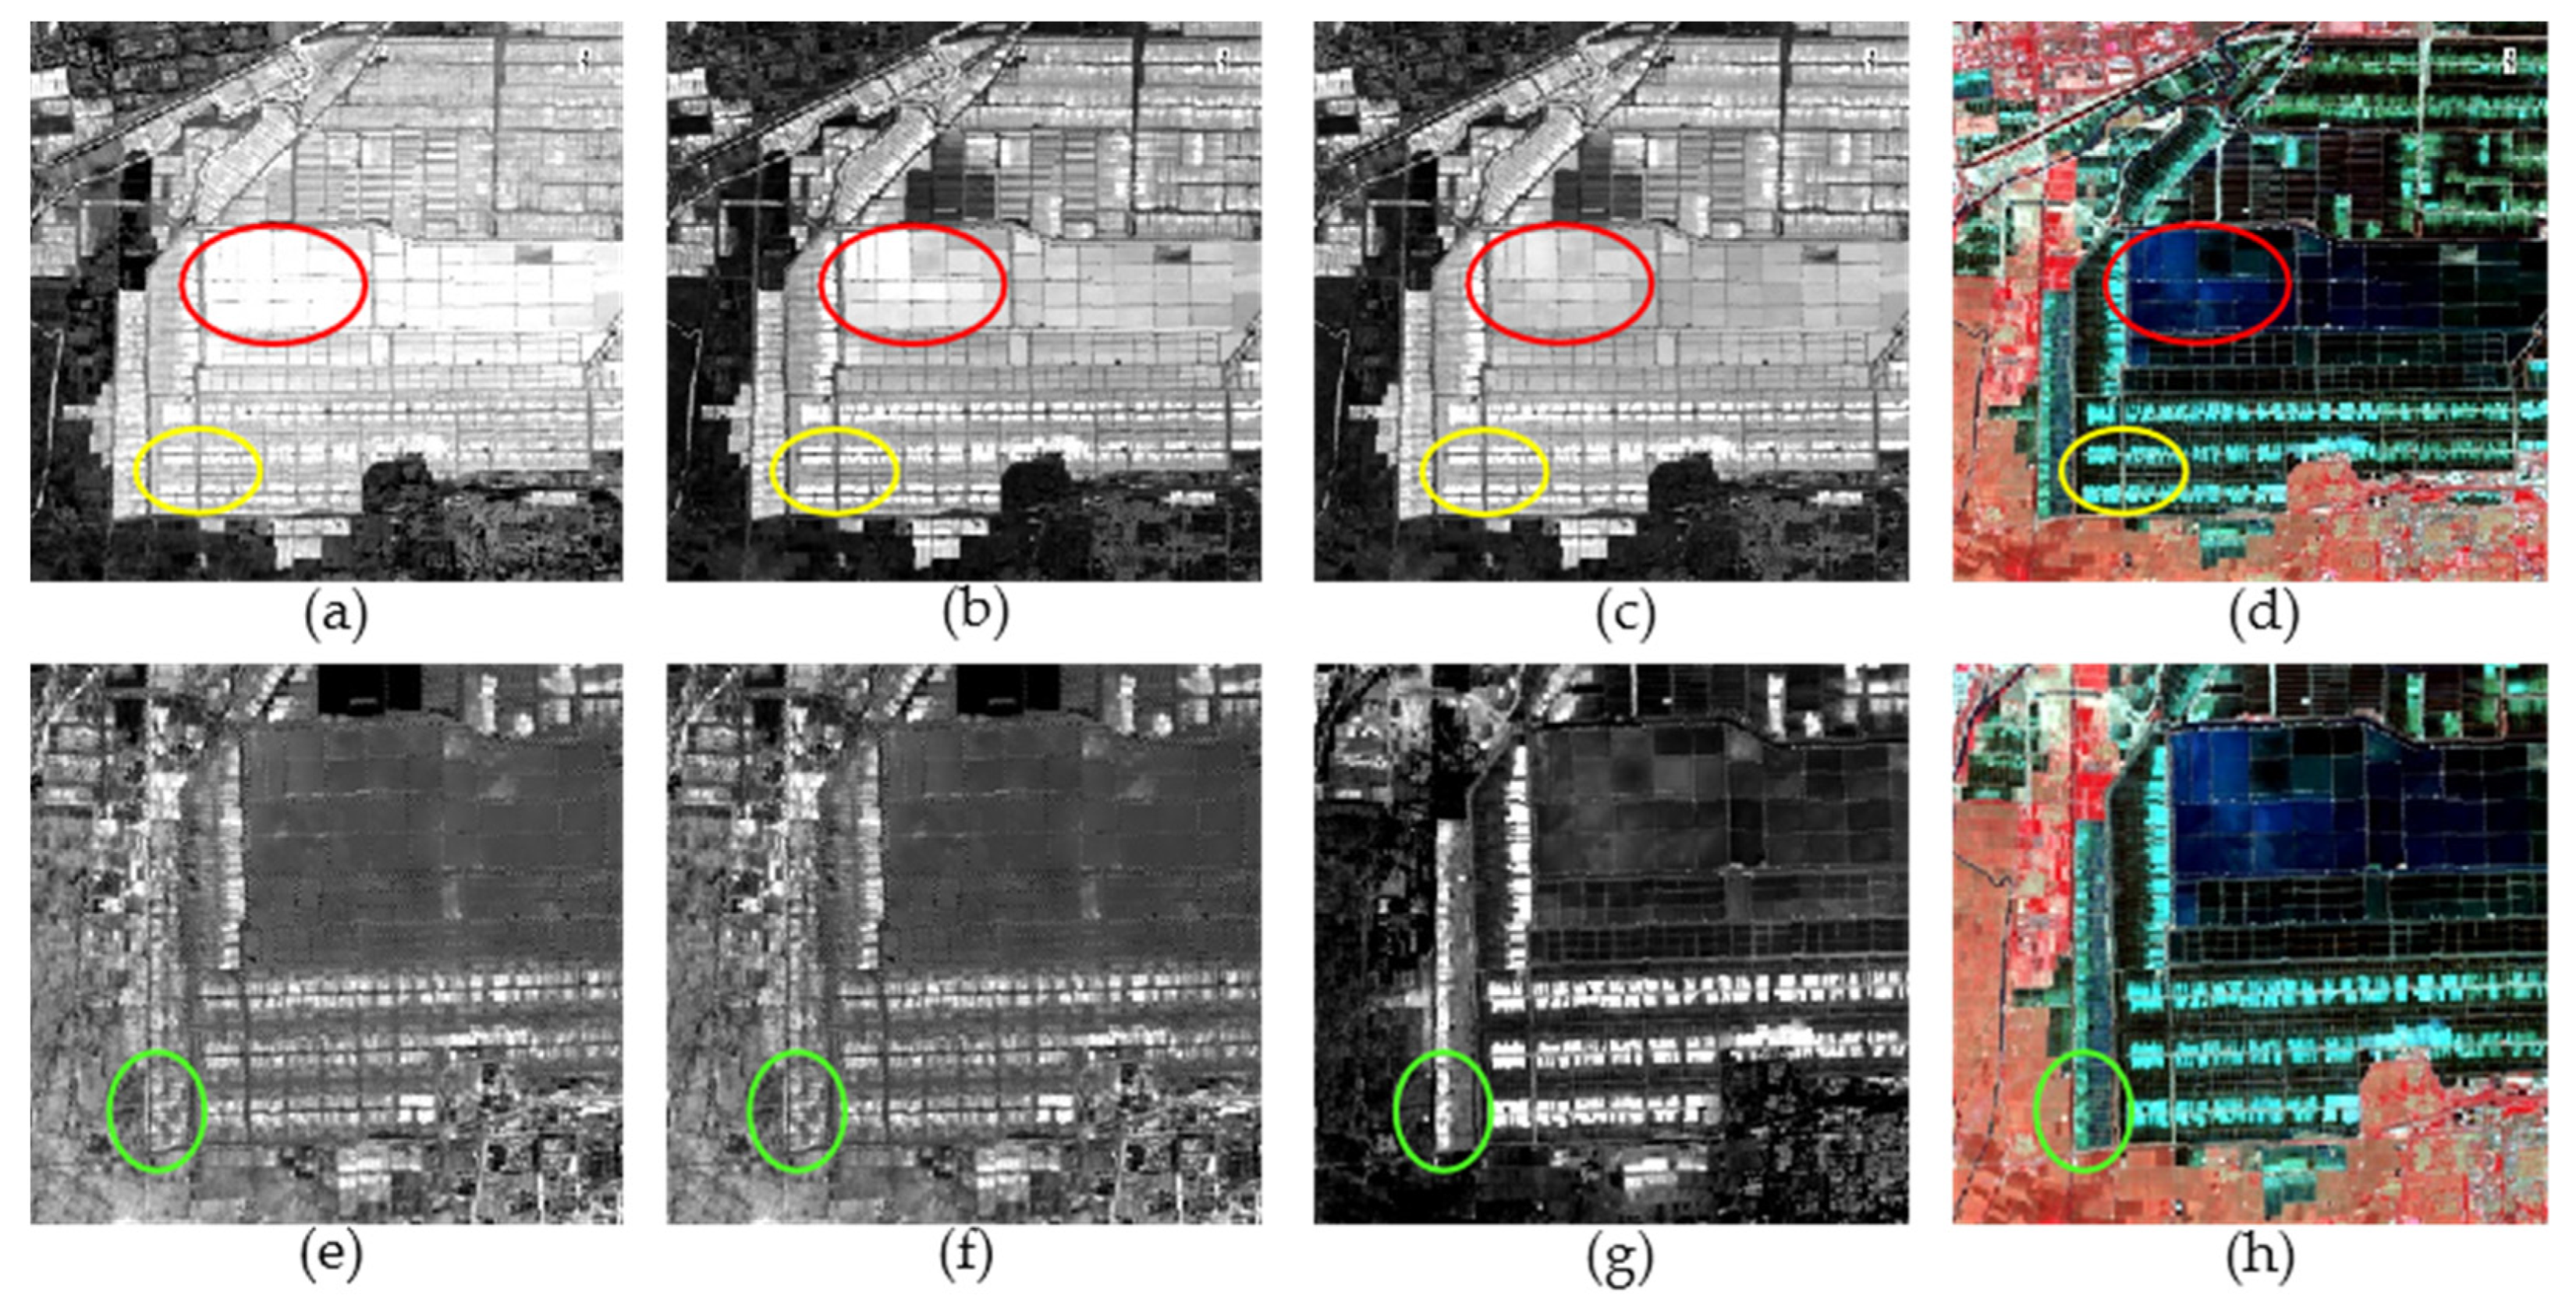
Based on the Modified Water Index (MWI) described in Section 2.3.1, water and non-water features were extracted and comparatively analyzed against traditional indices such as Normalized Difference Water Index (NDWI) and Modified NDWI (MNDWI). In the extraction of specialized water bodies such as salt pans, NDWI and MNDWI exhibited notable band limitations. As illustrated in Figure 7 (red ellipse region), NDWI fails to effectively differentiate spectral features between water bodies and salt pan crystallization ponds, resulting in highly similar extraction outcomes and misclassification of embankments between evaporating ponds as water bodies. Although MNDWI improves the distinction between evaporating ponds and crystallization ponds, it introduces abrupt tonal changes, significant spectral heterogeneity, and unstable extraction results.
In contrast, MWI not only achieves high extraction accuracy but also maintains spatial continuity, significantly improving spectral uniformity within evaporating pond areas. Additionally, while enhancing water information, MWI effectively distinguishes water bodies (including evaporating ponds) from crystallization ponds within the salt pan regions.
As demonstrated in Figure 7, the MWI, based on spectral features, exhibits clear advantages in distinguishing water and non-water areas. By optimizing the combination of visible and short-wave infrared bands, MWI significantly enhances spectral separability between crystallization and evaporating ponds and accurately identifies water bodies from background features. Moreover, MWI demonstrates robust performance against interference from complex backgrounds, significantly reducing false detections from surrounding dry surfaces and built-up features, thus enhancing the overall accuracy and reliability of salt pan extraction.

3.2.2. Salt Pan Crystallization Index

The Salt Pan Crystallization Index (SCI), introduced in Section 2.3.1, was applied for extracting crystallization ponds using a synergistic analysis of visible and infrared bands. Its performance was compared with existing salt indices, SpI and SSI, as shown in Figure 7.
Comparative analysis of SpI, SSI, and SCI, validated using false-color composites, indicates that traditional soil salinity indices (SpI and SSI) perform poorly in crystallization pond extraction. This inadequacy arises because these indices were primarily developed for soil salinization detection and fail to capture spectral characteristics of high-salinity water bodies, resulting in blurred boundaries and fragmented internal structures. Conversely, SCI enhances the distinctive high reflectance features specific to crystallization ponds while suppressing background interference, substantially reducing false detections from adjacent soils and vegetation, thus preserving pond boundary continuity. The SCI extraction closely matches the spatial distribution in the false-color composite, especially excelling in detecting lower-concentration crystallization ponds (yellow ellipse, Figure 7), where SpI and SSI exhibit varying degrees of omission.
By enhancing the spectral characteristics of crystallization ponds, SCI effectively mitigates the sensitivity of traditional indices to mixed pixels, clearly delineating crystallization ponds from other land cover types. The central contribution of SCI lies in its critical role within the hierarchical framework for salt pan feature extraction, constituting an indispensable element for accurately delineating crystallization pond structures.

3.3. Extraction Using DeepLabv3+

3.3.1. Model Construction

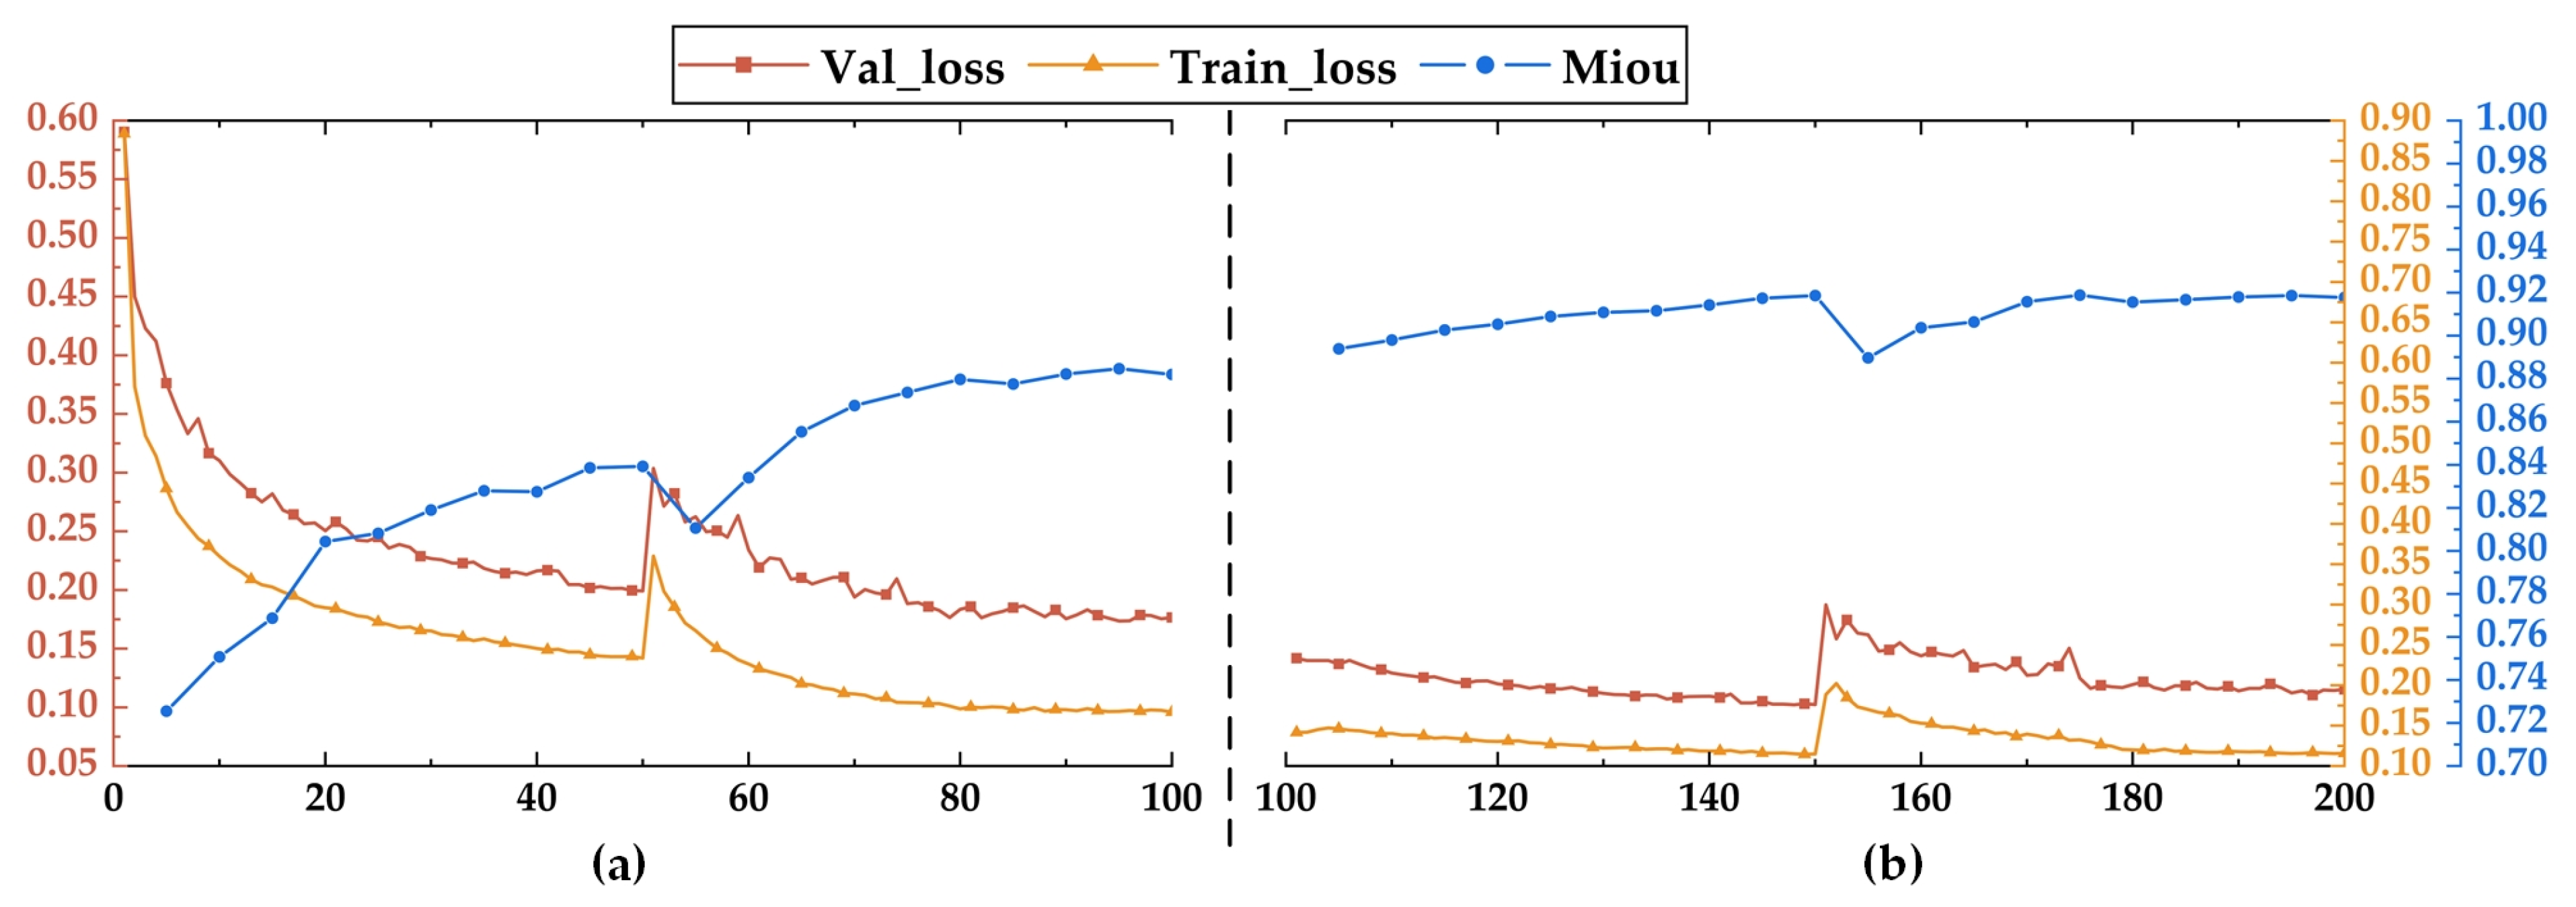
The semantic segmentation model was constructed based on the DeepLabv3+ framework, employing MobileNetV2—a lightweight neural network—as its backbone. To optimize model performance, a phased, progressive training strategy was implemented. In the initial phase, the MobileNetV2 pre-trained on ImageNet served as initial weights and was trained for 100 epochs. For the second phase, the model weights corresponding to the lowest validation loss from the first phase (epoch = 100, val_loss = 0.166) were used as the starting point for another 100 epochs of training. This iterative, pyramid-style training method gradually approaches the optimal solution, significantly enhancing the model’s capability for feature extraction (Figure 8).

3.3.2. Inference Results of Deeplabv3+

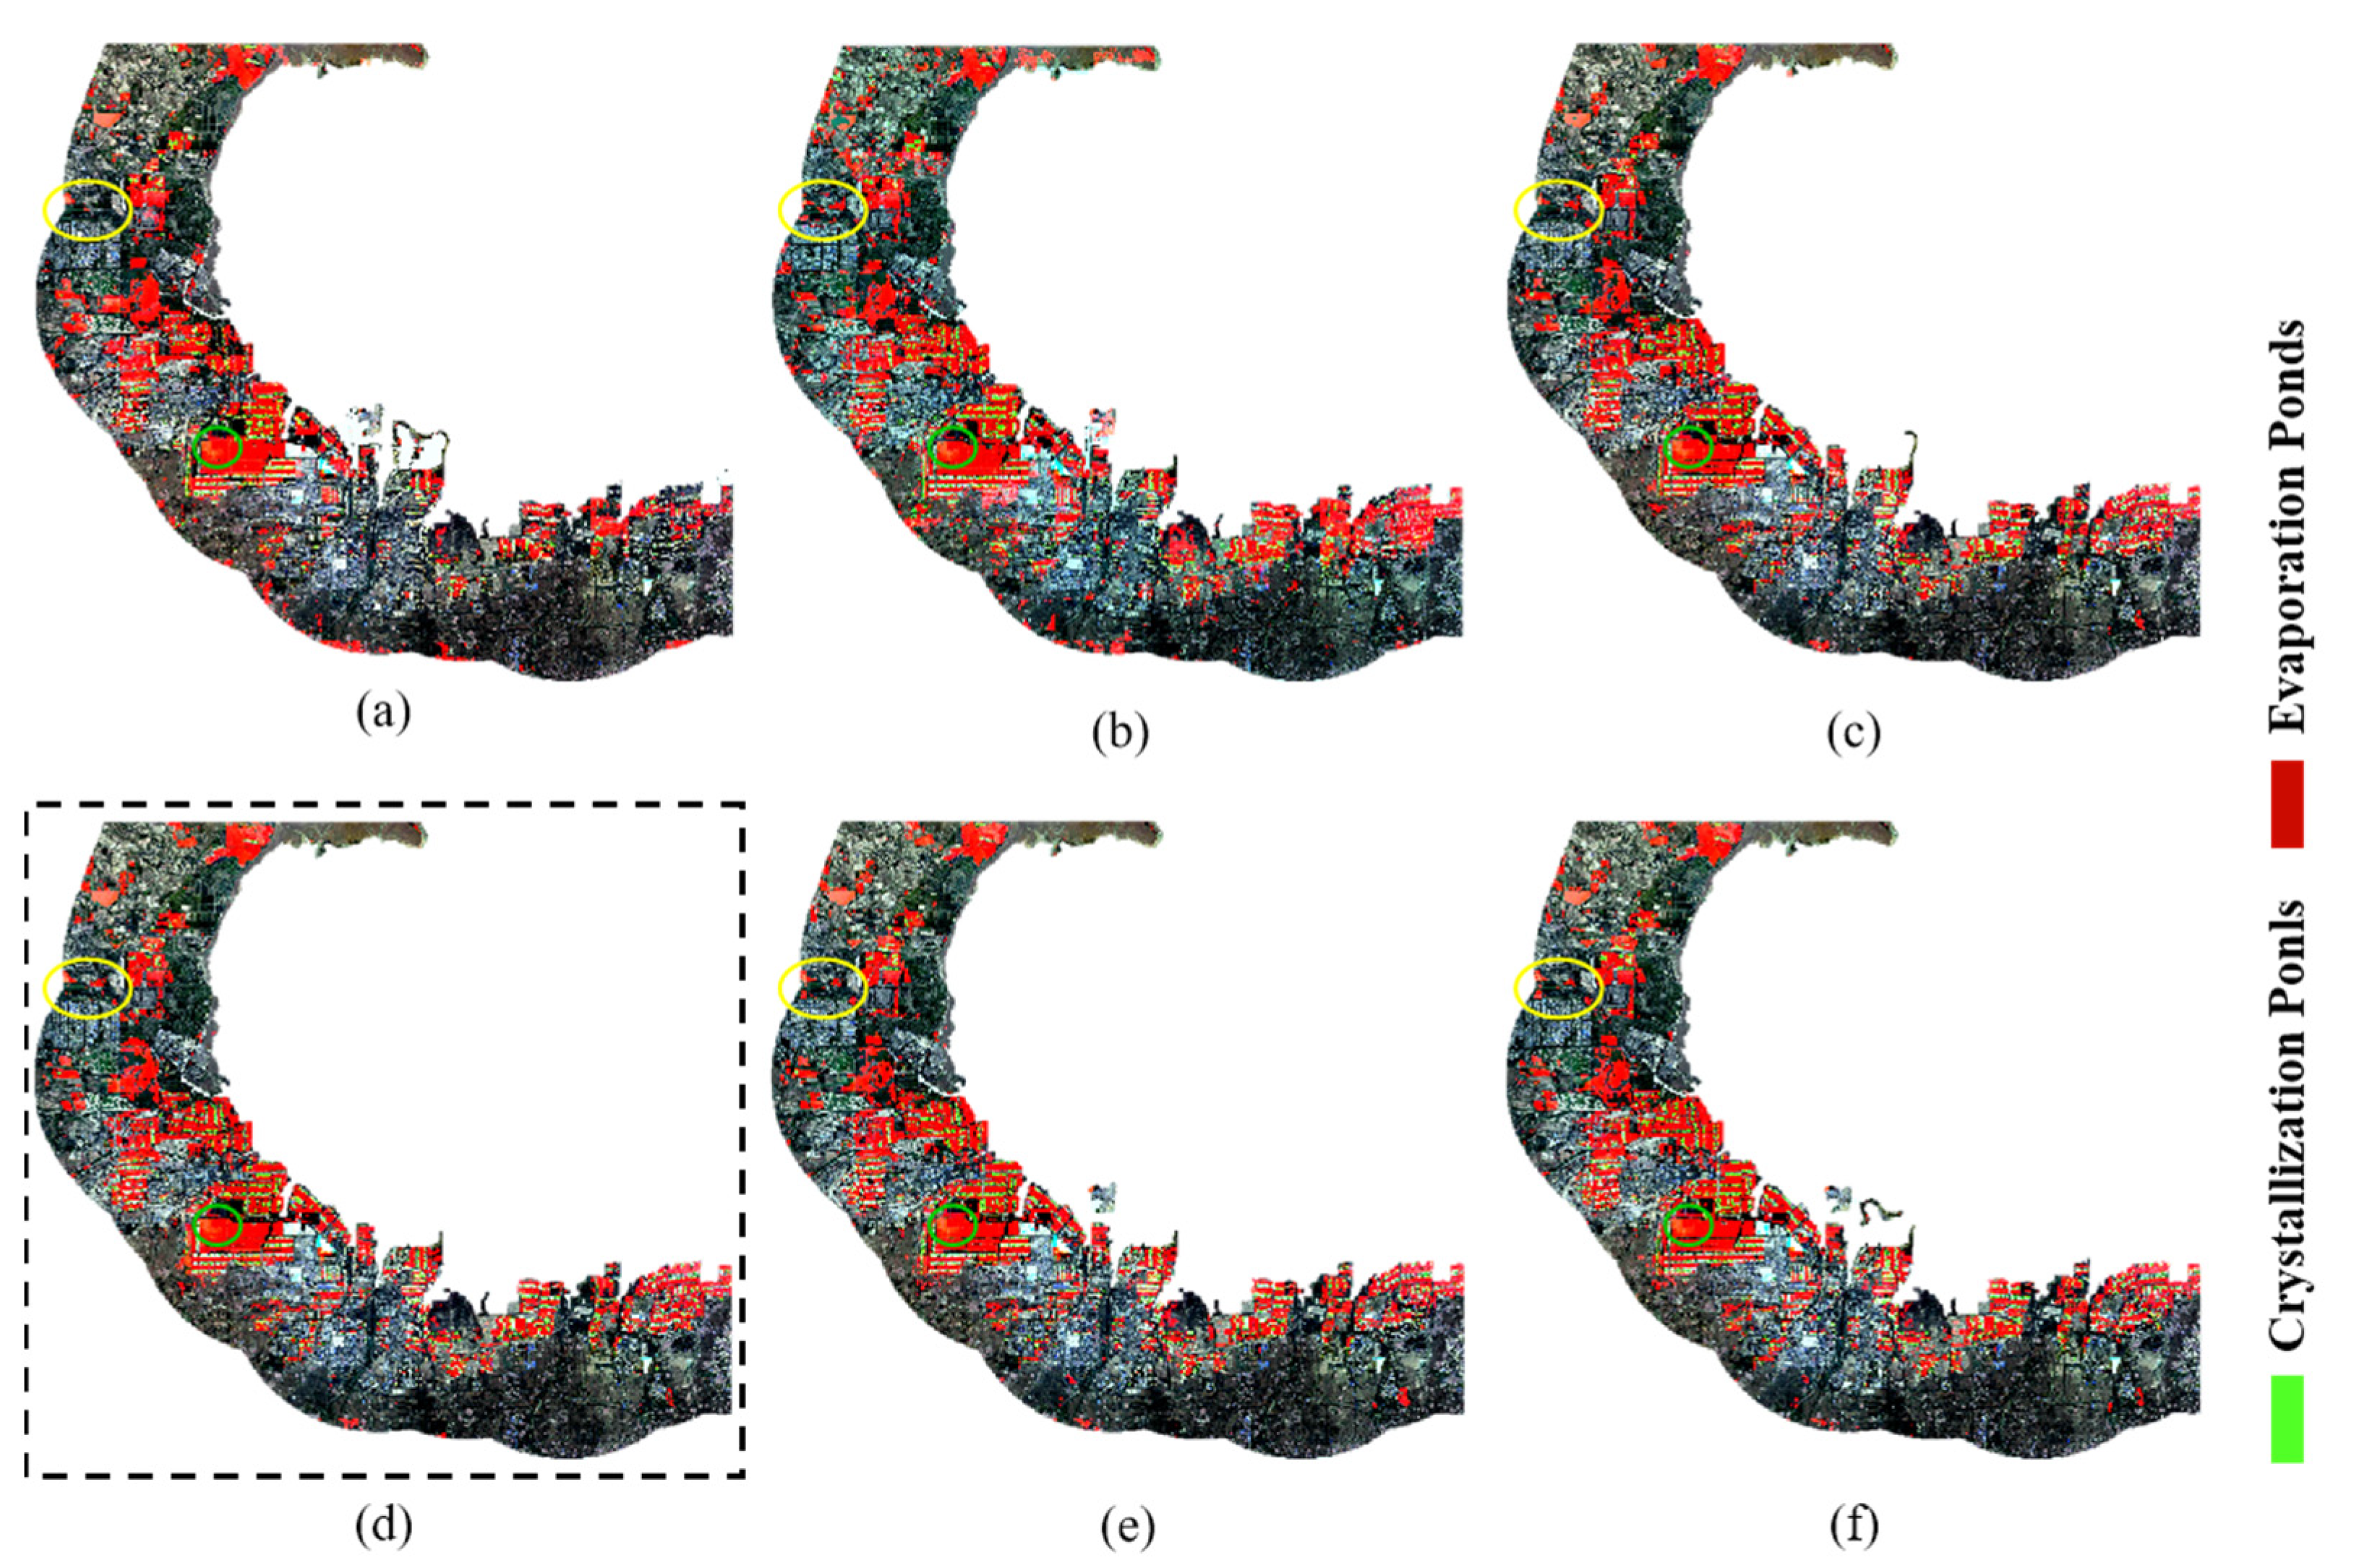
A multi-model selection strategy was employed during inference. Through predictive comparisons of the weight files generated after each epoch, visual assessment indicated that the weight file from epoch 105 delivered the optimal prediction performance. Six sets of model weights (epochs: 05, 50, 95, 105, 140, 195) corresponding to different stages of validation loss were selected for comparative analysis (Figure 9). Significant variations were observed between epochs regarding the misclassification of water bodies (indicated by yellow ellipses) and the missed detection of evaporating ponds in the salt pan (indicated by green ellipses). Among the evaluated models, the epoch-105 model (val_loss = 0.141) exhibited the best detection performance, presenting the fewest misclassifications of water bodies and uniquely avoiding any omission of evaporating ponds in the salt pan. Notably, subsequent epochs (e.g., 140 and 195) demonstrated lower validation loss and higher mIoU scores (Figure 10); however, these models exhibited pronounced missed detections during inference on the test dataset. Experimental results indicate that the optimal inference performance does not necessarily correspond to the models with the lowest validation loss or the highest mIoU scores. Instead, the epoch-105 model—trained just prior to overfitting—demonstrated enhanced robustness within the 2021 dataset, as evidenced by its accurate preservation of the geometric structural features of salt-pan regions across the different scenes used to create the summer composite. This finding validates the effectiveness of the phased fine-tuning strategy, further emphasizing that appropriately timed early stopping is crucial to preventing overfitting and consequent performance degradation.

3.4. Result of RGB Strategy Multi-Feature Fusion

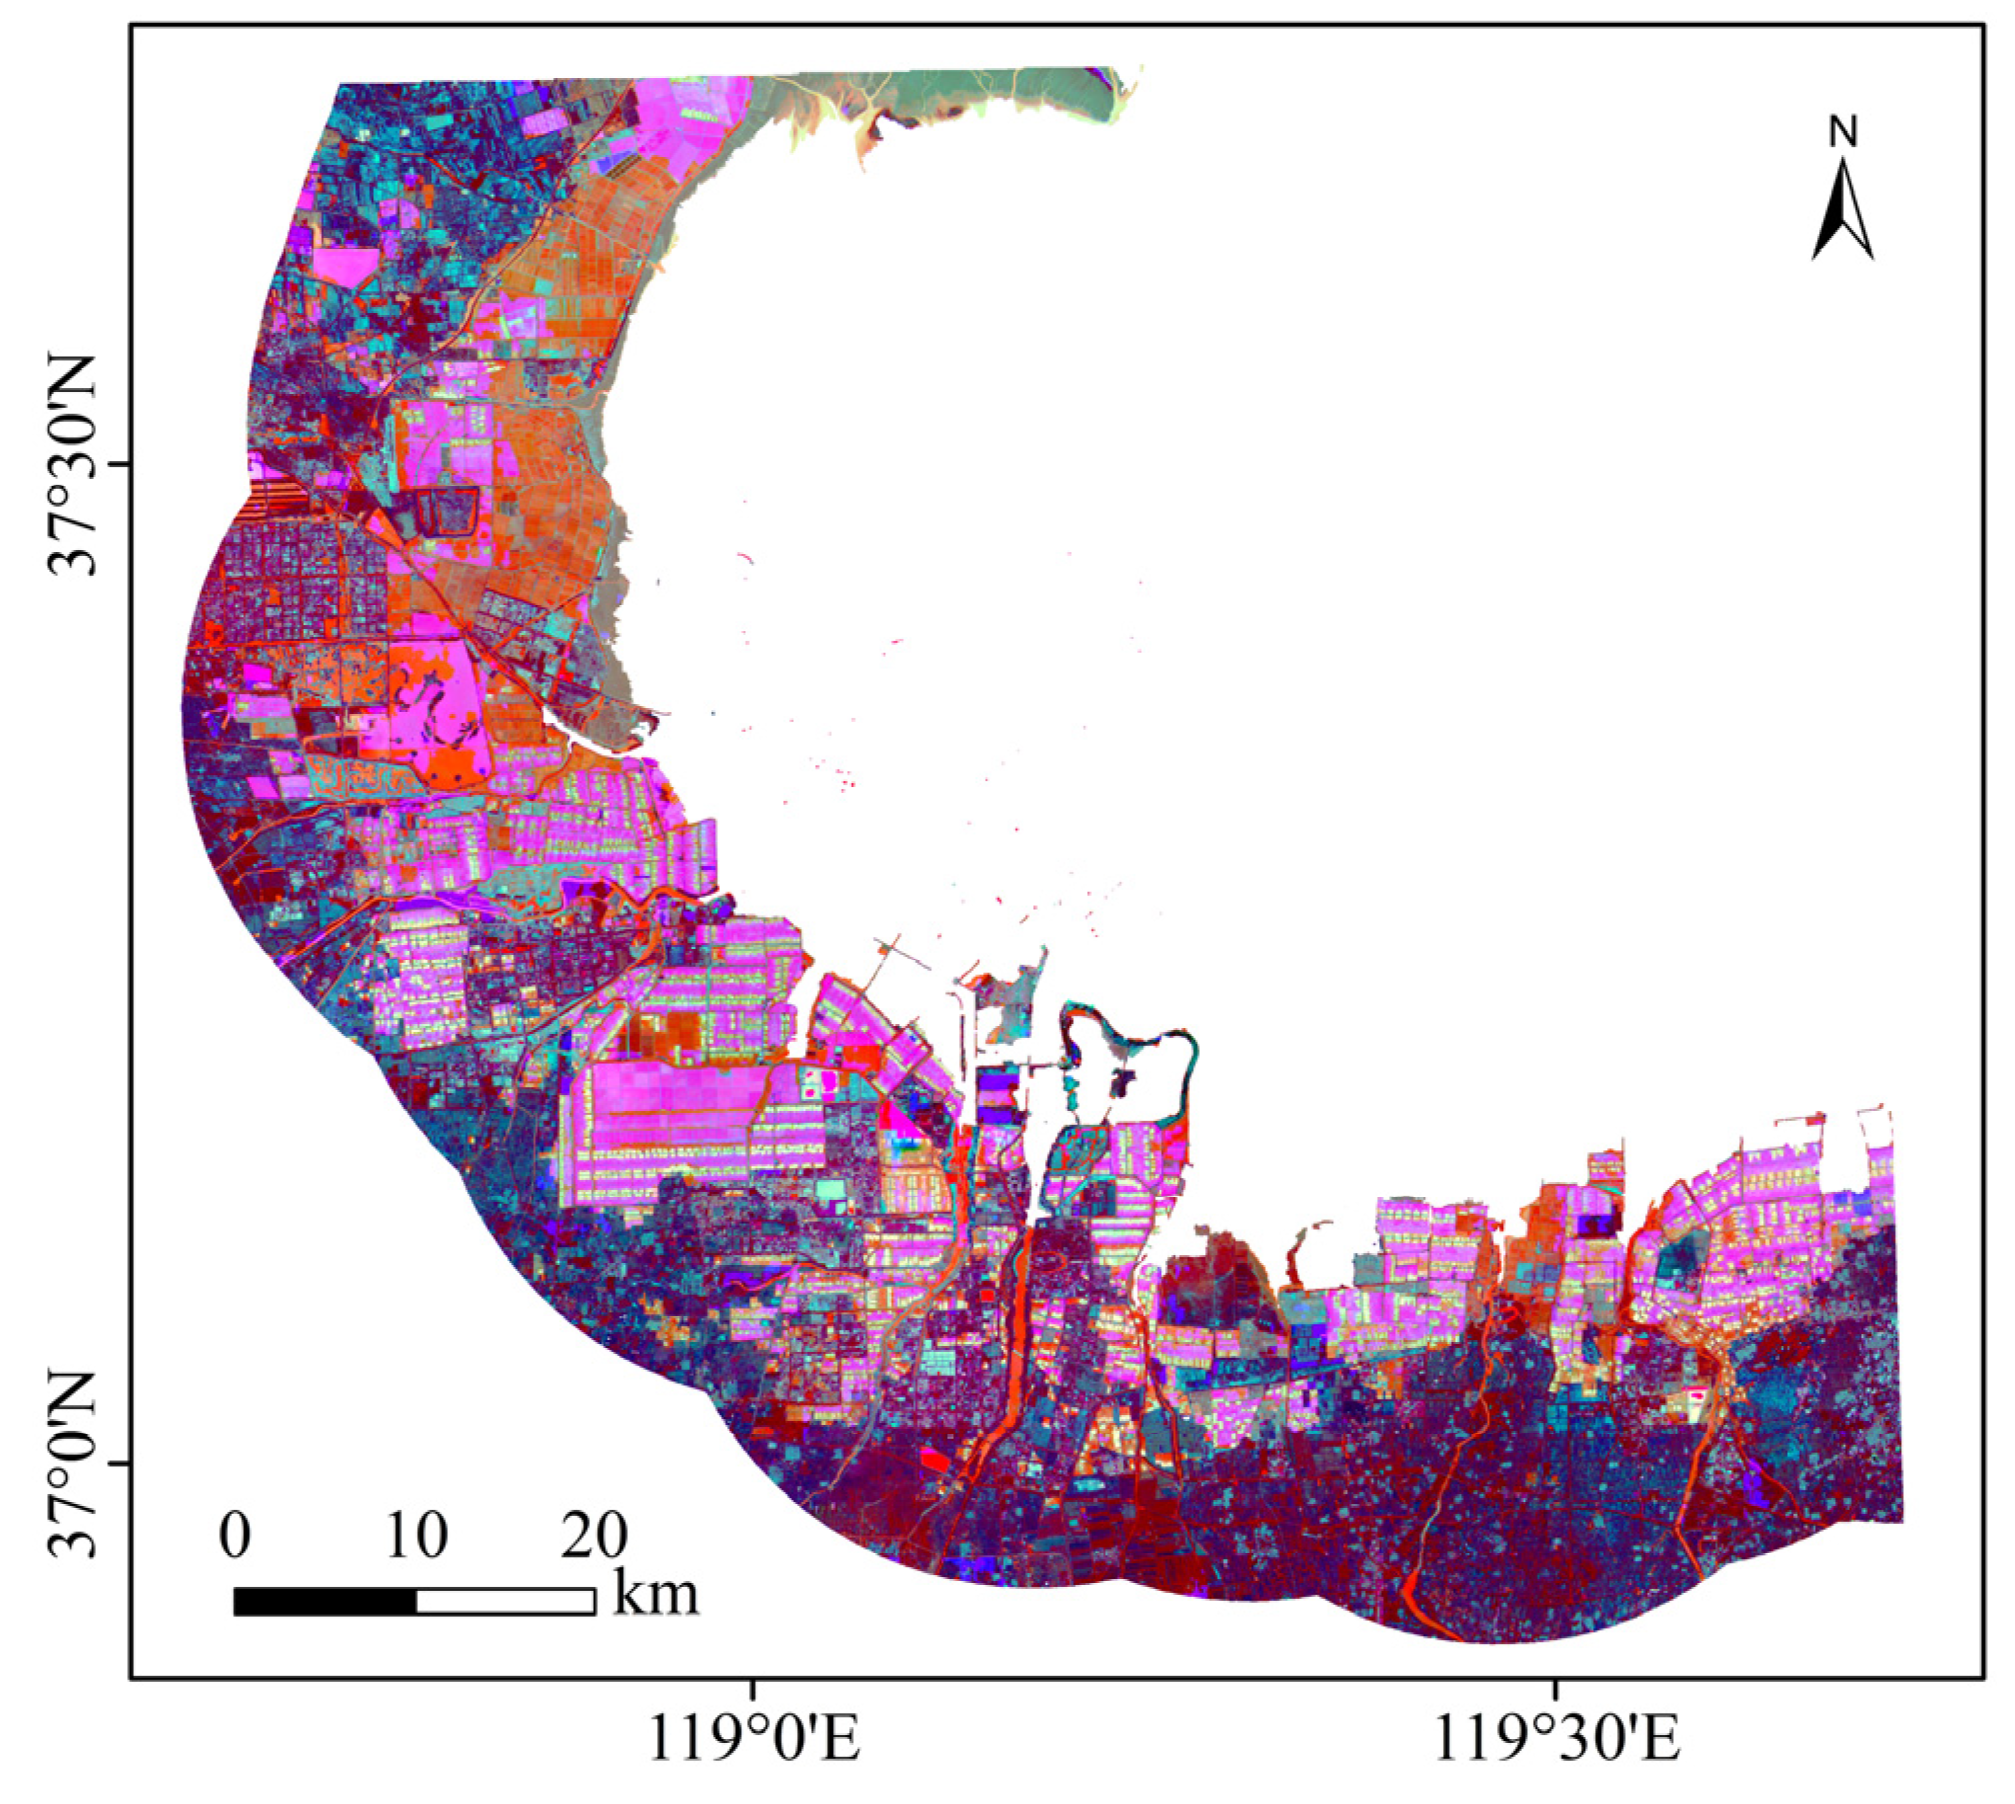
The proposed Salt Pan Feature-Enhanced Fusion Image (SPFEFI) method collaboratively utilizes spectral indices and deep learning features to enhance the visual interpretability of salt pan surface characteristics. An RGB color space compositing strategy was employed, assigning independently derived grayscale images—MWI, SCI, and DL features—to the R, G, and B channels, respectively. This linear combination of grayscale values produces a composite color image that facilitates a multi-dimensional representation, effectively revealing spatial relationships among features through channel overlay (Figure 10).
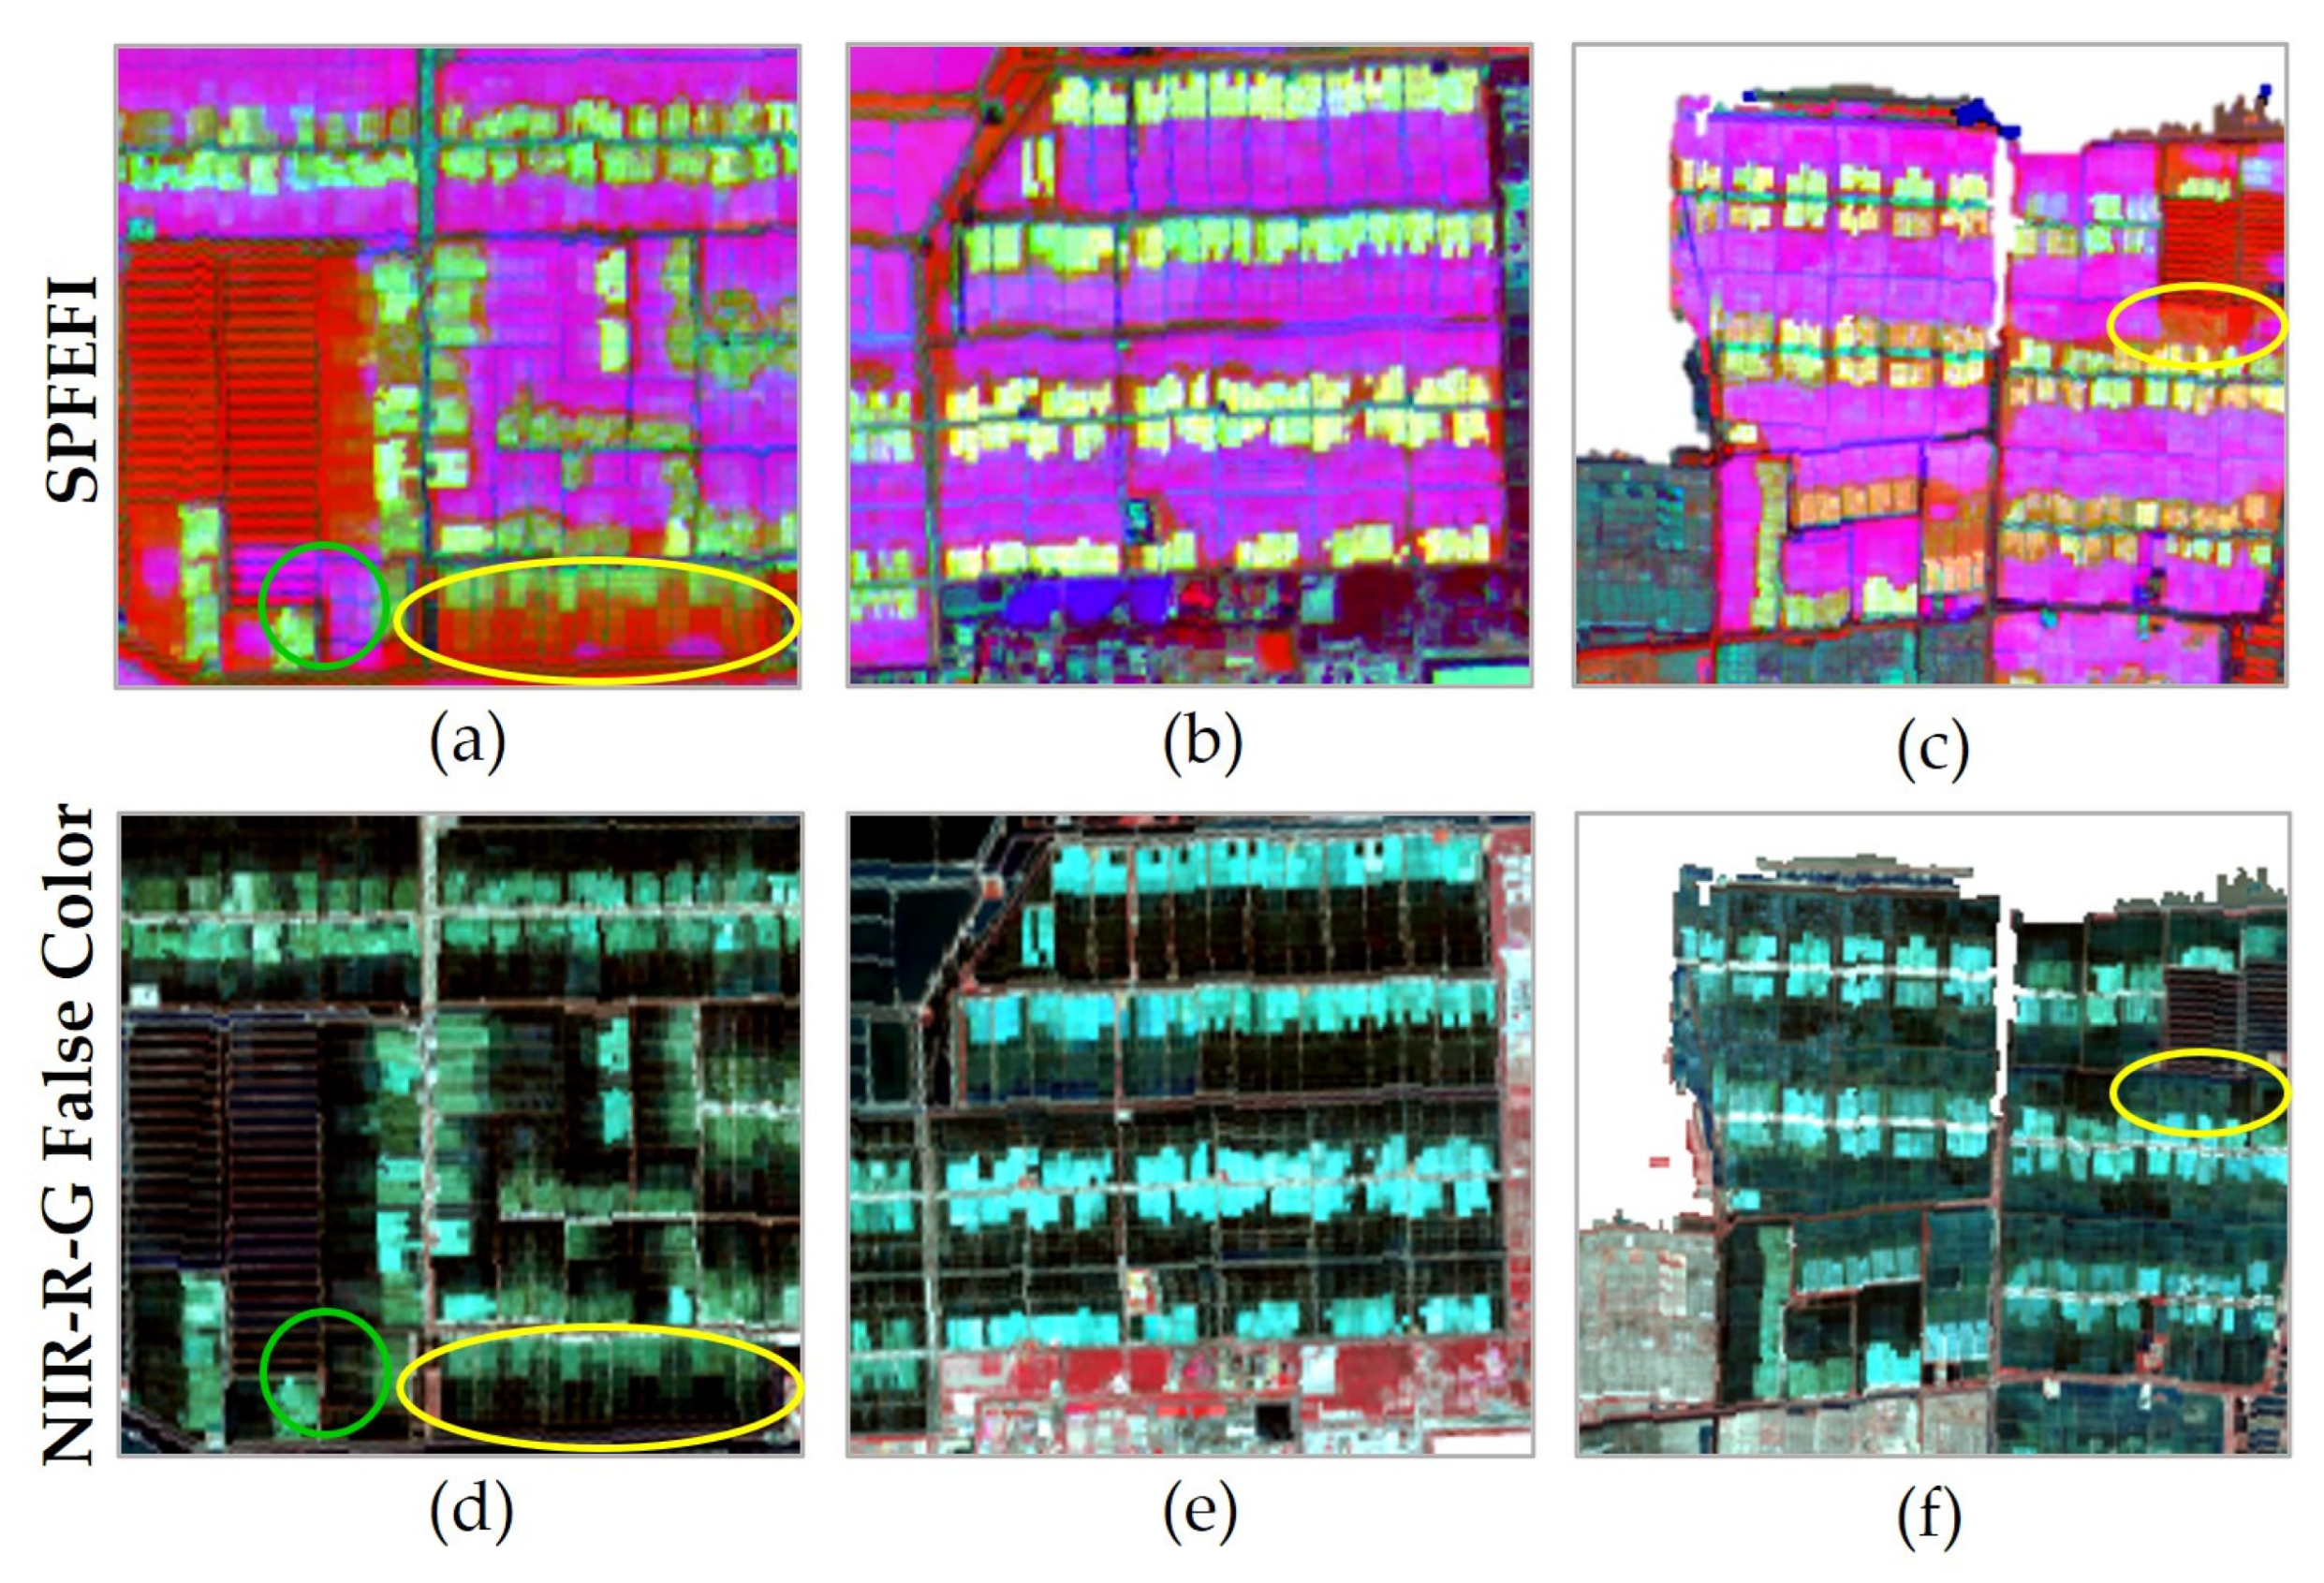
Regions with high values in the red channel (R ≈ 255) represent all water bodies detected by MWI, including salt pan ponds. Highlighted regions in the green channel (G ≈ 255) correspond to crystallization ponds identified by SCI. High-intensity areas in the blue channel (B ≈ 255) represent the main salt pan areas classified by the DL model. Overlapping the three primary colors produces mixed-color areas indicating feature consistency: magenta regions (R + B) indicate areas identified by both MWI and DL models as water bodies, and yellowish-white areas (G + B) indicate spatial coupling between SCI and DL predictions. Other colors reflect land-cover types with lower salt pan-feature consistency; for instance, pure red areas represent aquaculture ponds or other water bodies. This imaging approach employs a color-semantic encoding scheme to enable intuitive visualization of multidimensional salt pan features, enhancing their distinction through collaborative feature interactions, and facilitating effective chromatic differentiation between various salt pan developmental stages, including evaporating and crystallization ponds.
Although the fusion of multiple features significantly enhances salt pan characteristics, inconsistencies occur in the SPFEFI results (Figure 10) due to intrinsic differences in the mechanisms through which MWI identifies water bodies and the DL model classifies salt pans.
In Figure 11a,c, the red anomaly within the yellow ellipse indicates evaporating ponds misclassified as water bodies. This occurs due to the DL model’s inability to accurately recognize evaporating ponds, resulting in the absence of a strong blue channel response (B < 255) and leaving only a dominant red signal from MWI (R ≈ 255). Although this red shade visually resembles pure aquaculture ponds, the slight non-zero green channel response introduces subtle salt pan characteristics, resulting in a darker, less saturated red tone that can be distinguished from the typical bright red color of aquaculture ponds.
The magenta-colored anomaly within the green ellipse in Figure 11a corresponds to aquaculture ponds mistakenly classified as salt pans due to the DL model incorrectly identifying the highly reflective aquaculture ponds as salt pans. This triggers a strong blue channel response (B ≈ 255), overlapping with the MWI red channel (R + B). However, the absence of SCI green channel responses (G ≈ 0), combined with spectral differences from actual evaporating ponds, causes these areas to display cooler-toned or unusually bright magenta shades, distinguishable from the warmer-toned magenta associated with genuine evaporating ponds that have slight green-channel signals.
The misrepresentation of evaporating pond features in Figure 11 was subsequently addressed using the Random Forest classification approach.

3.5. Extraction of Salt Pan Information

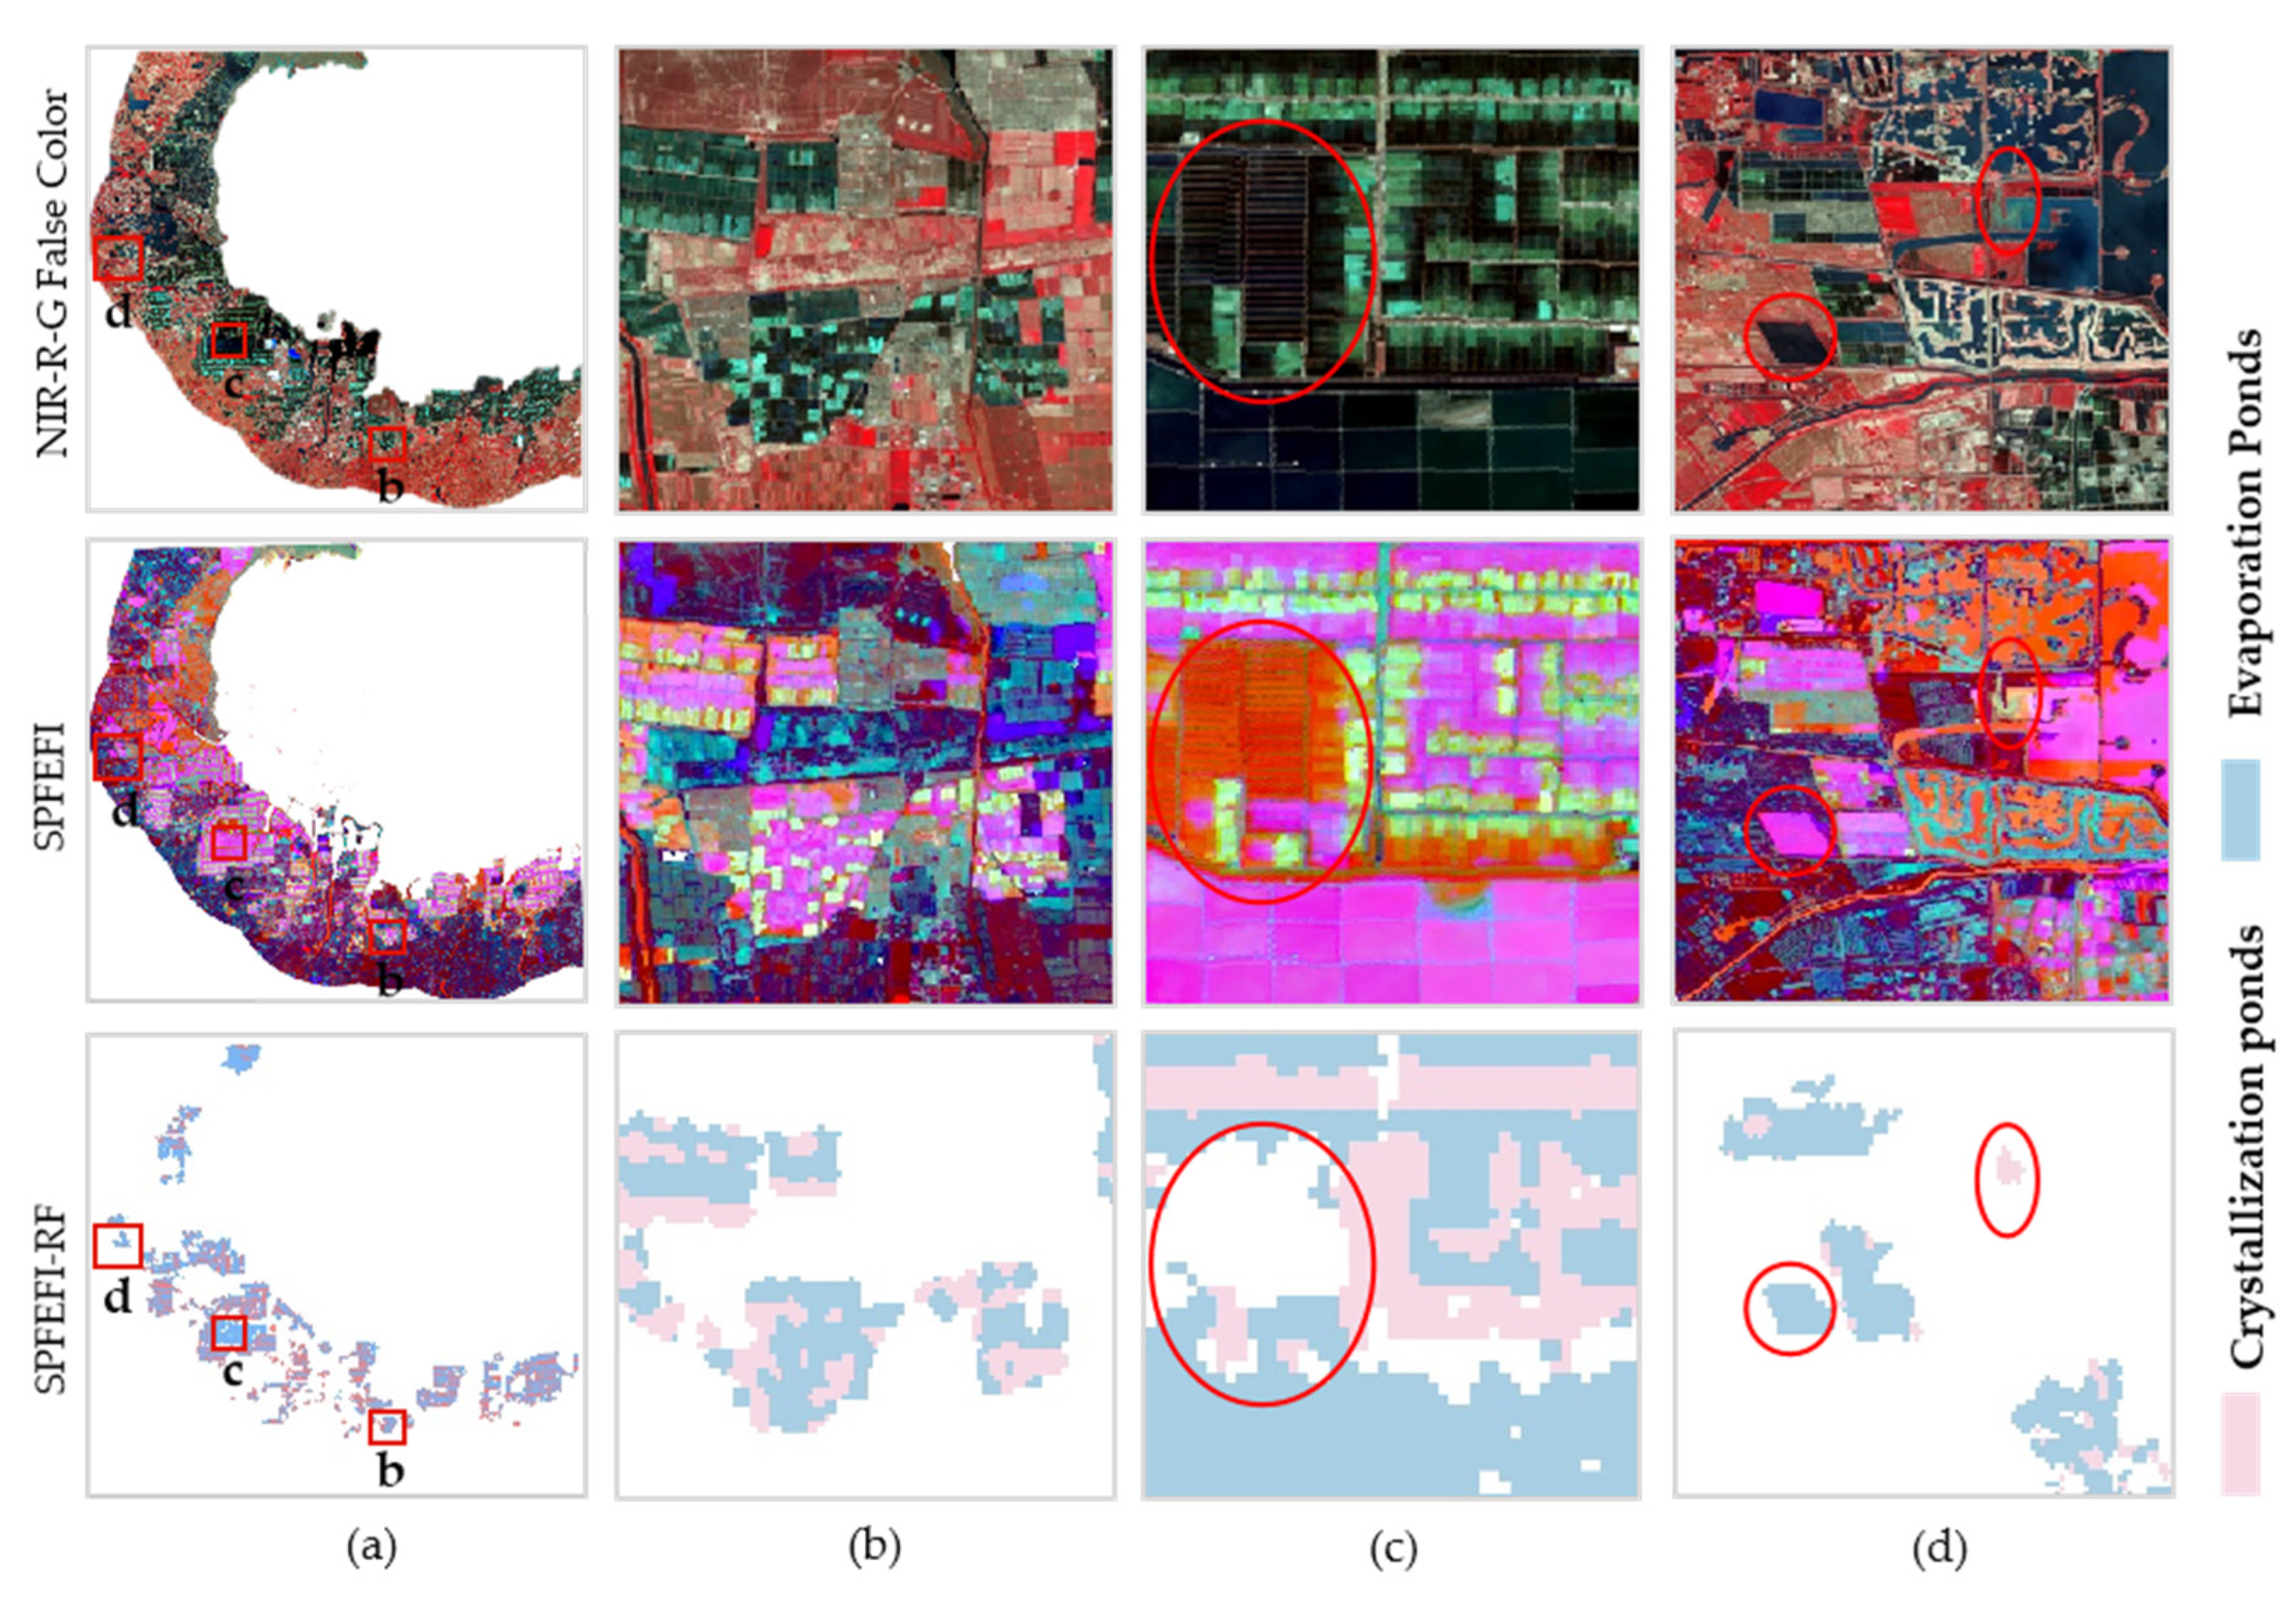
The method integrating SPFEFI fused image with the Random Forest (RF) classifier effectively extracted salt pan information along the Laizhou Bay coastline (Figure 12a). In localized analyses, the SPFEFI-RF method demonstrated superior performance (Figure 12b–d). Despite complex backgrounds comprising bare soil, vegetation, and water bodies surrounding the salt pans, boundaries and internal structural details of the salt pan targets were precisely distinguished and extracted (Figure 12b). Concerning spatial heterogeneity caused by highly similar spectral and textural characteristics between salt evaporation ponds and aquaculture ponds (indicated by the red ellipse in Figure 12c), the RF classifier accurately differentiated them by capturing subtle differences in their spectral feature space, thus preventing misclassification. Additionally, the method showed robust performance even in scenes containing disturbances from rivers, reservoirs, and bare soil. Although slight misclassification occurred in areas indicated by red ellipses (Figure 12d), this primarily resulted from inherent spectral and spatial similarities. Overall, the SPFEFI-RF method proved highly applicable to Laizhou Bay, achieving comprehensive and accurate extraction of large-scale, regularly distributed salt pan structures.
The RF classification method based on SPFEFI excels in accurately preserving detailed salt pan features, even against complex backgrounds. It effectively resolves the confusion between salt pans and spectrally similar land cover types, particularly aquaculture ponds. The minor local misclassification observed with reservoirs and bare soil suggests that future studies should consider incorporating finer spectral characteristics or spatial contextual information to further enhance the model’s ability to discriminate subtle differences.

3.6. Accuracy Assessment

Based on the accuracy evaluation approach described in Section 2.4, we quantitatively assessed the accuracy of the SPFEFI-RF method for salt pan extraction in the study area (Table 4). The F1-scores obtained for crystallization ponds and evaporation ponds were 90.34% and 93.66%, respectively, and the overall classification accuracy reached 92.3%. These results demonstrate that the proposed method provides accurate and reliable extraction outcomes.
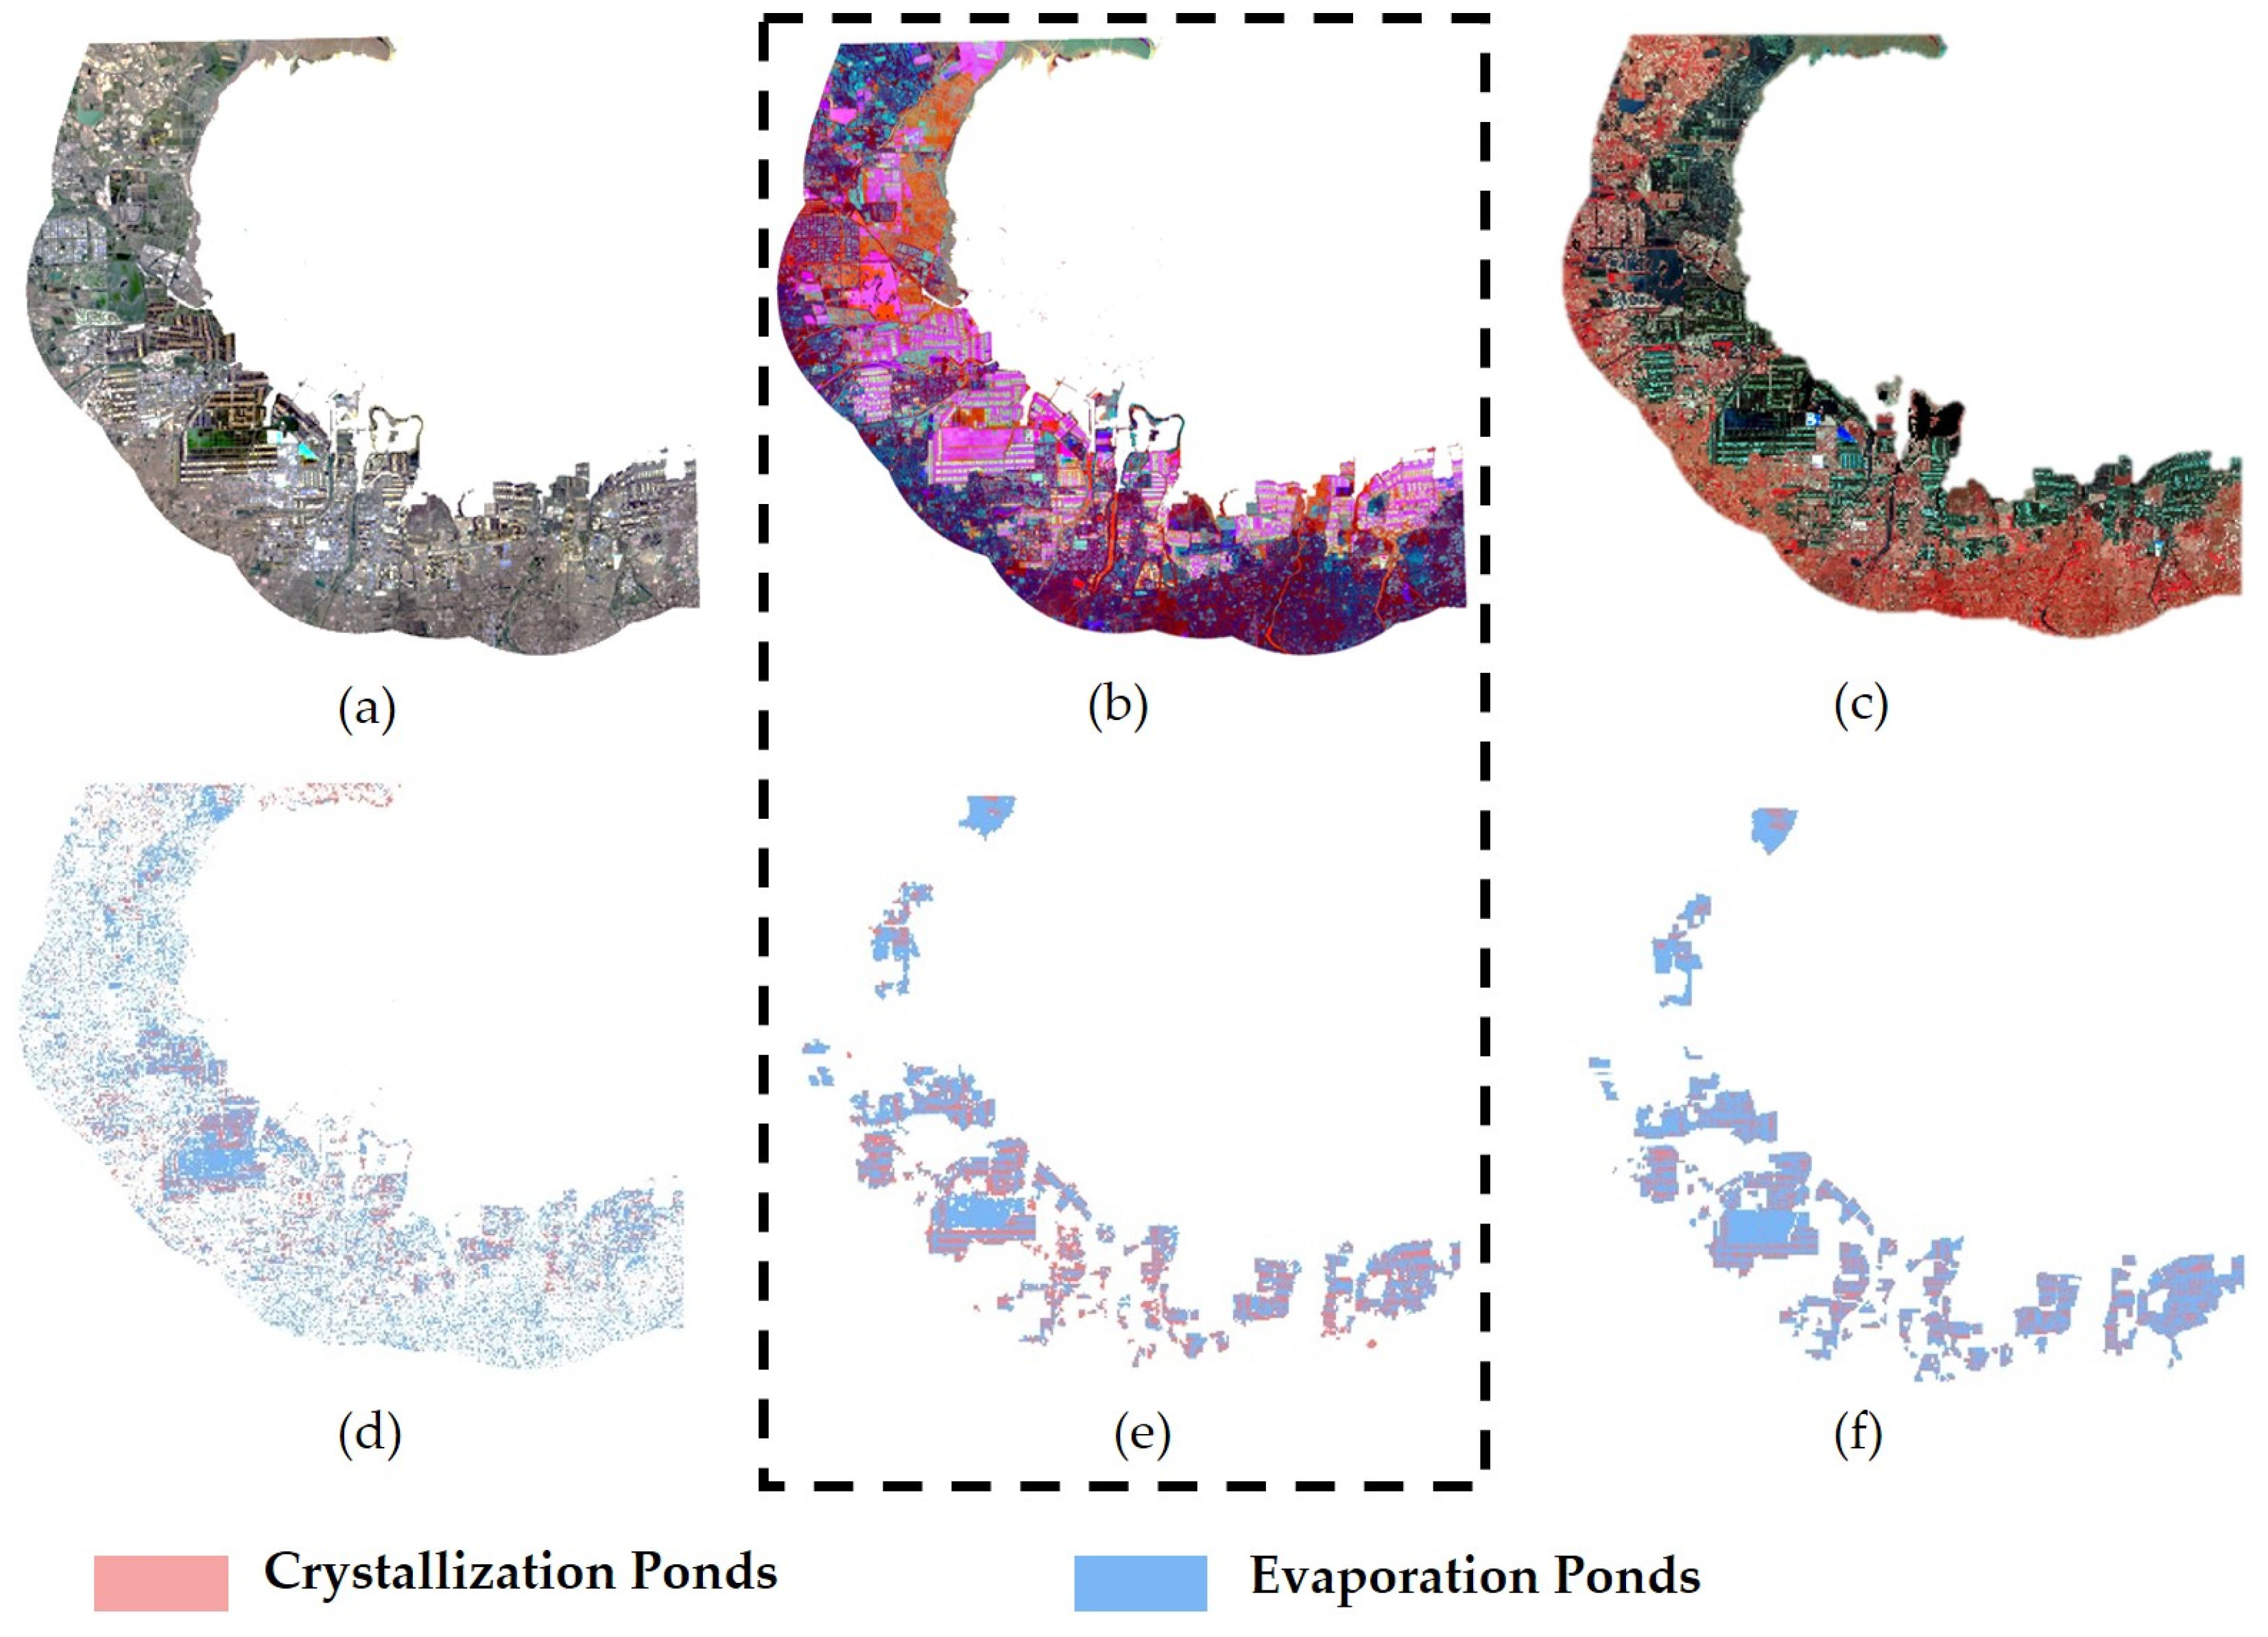
To further analyze the extraction accuracy and reliability of the SPFEFI-RF method, its results were compared with ground truth data and results obtained from the original RF classification approach (Figure 13). As illustrated by the multi-temporal fused image (Figure 13a) and a false-color image (Figure 13c), the experimental area exhibits complex land covers, with extensive water bodies and high spectral similarity among salt pans, other water bodies, and tidal flats, making classification challenging. The results obtained from RF classification using a multi-temporal fused image (Figure 13e) exhibited discontinuous salt pan boundaries, substantial internal omissions, poor spatial continuity, and widespread misclassifications throughout the study area. According to the analysis combined with Figure 13c, misclassified land cover types primarily included other water bodies, tidal flats, and built-up areas, reflecting the limited spectral discrimination capability of the original image. In contrast, incorporating both spectral and deep semantic features significantly enhanced the differentiation between salt pans and other land covers (Figure 13b). This resulted in clearer and more coherent salt pan boundaries, substantially improved internal continuity, and significantly reduced misclassifications, particularly in regions prone to confusion between water bodies and tidal flats (Figure 13e). Further comparison with ground truth data (Figure 13f) indicated that this feature-enhanced method markedly improved extraction accuracy compared with traditional RF classification, reduced fragmentation effects, and yielded an overall classification result superior to direct classification from the original image, achieving an overlap rate with ground truth data of 85.14%.
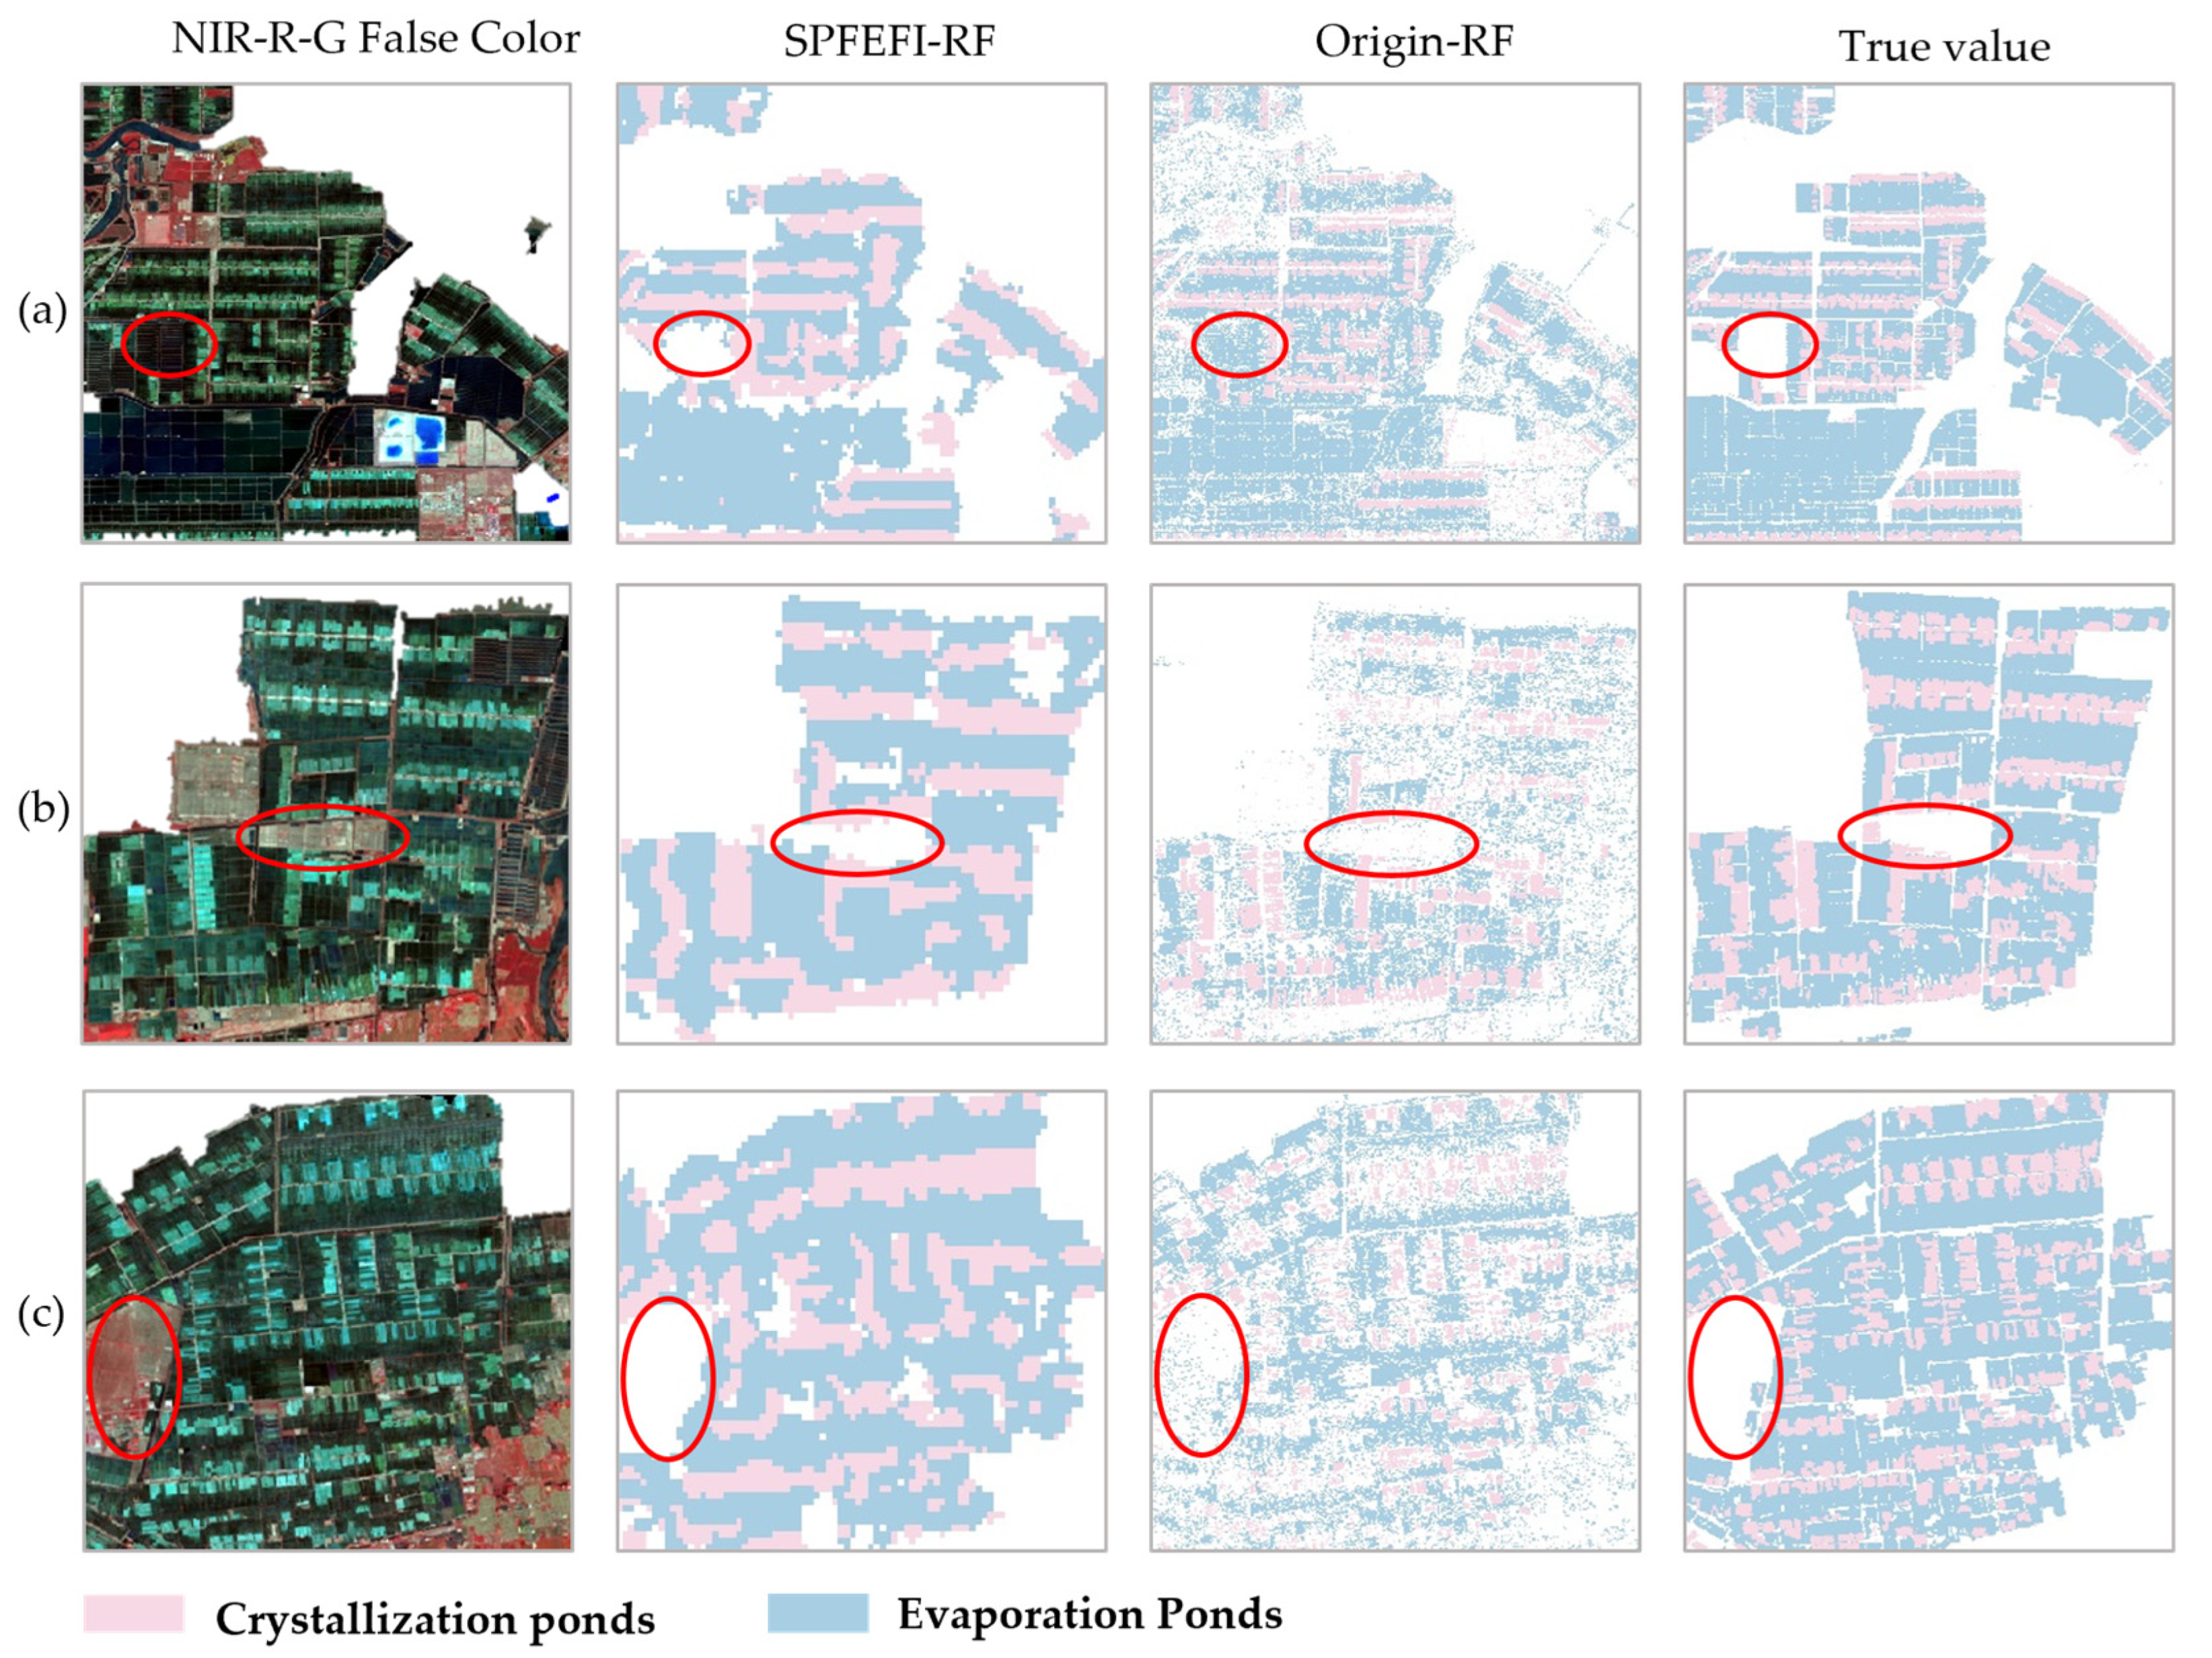
To more precisely evaluate the classification performance of the two image types, representative land cover categories within the study area were selected for localized comparative analysis (Figure 14). In the mixed zone of salt evaporation ponds and aquaculture ponds (red ellipse in Figure 14a), the classification result derived from multi-temporal images using the original RF approach (origin-RF) showed significant confusion, with aquaculture ponds frequently misclassified as salt evaporation ponds. In contrast, the SPFEFI-RF method effectively preserved the spatial structure of salt pan boundaries, with only a few isolated misclassified pixels, which were subsequently removed through post-processing in the RF classification. In the boundary area between crystallization ponds and bare soil (Figure 14b), both the multi-temporal fused image and SPFEFI demonstrated relatively accurate discrimination of bare soil. However, the SPFEFI-RF method produced more regularly aligned boundary pixels, exhibiting a higher spatial consistency with the ground truth contours. In the vegetation-covered area (red ellipse in Figure 14c), the origin-RF result exhibited evident salt-and-pepper noise, manifesting as scattered misclassification patches. By contrast, the SPFEFI-RF results showed a more natural transition between vegetated areas and salt pans, with significantly improved noise suppression. In summary, while the SPFEFI-RF method performed comparably to the multi-temporal image in differentiating bare soil, it yielded superior boundary delineation results. Furthermore, in areas with complex water bodies (Figure 14a) and vegetation edges (Figure 14c), the SPFEFI-RF method produced fewer misclassifications and closer alignment with the ground truth. These findings suggest that incorporating deep semantic features can further enhance the ability to distinguish spectrally similar land cover types.

4. Discussion

4.1. Factors Affecting the Extraction of Evaporation Ponds

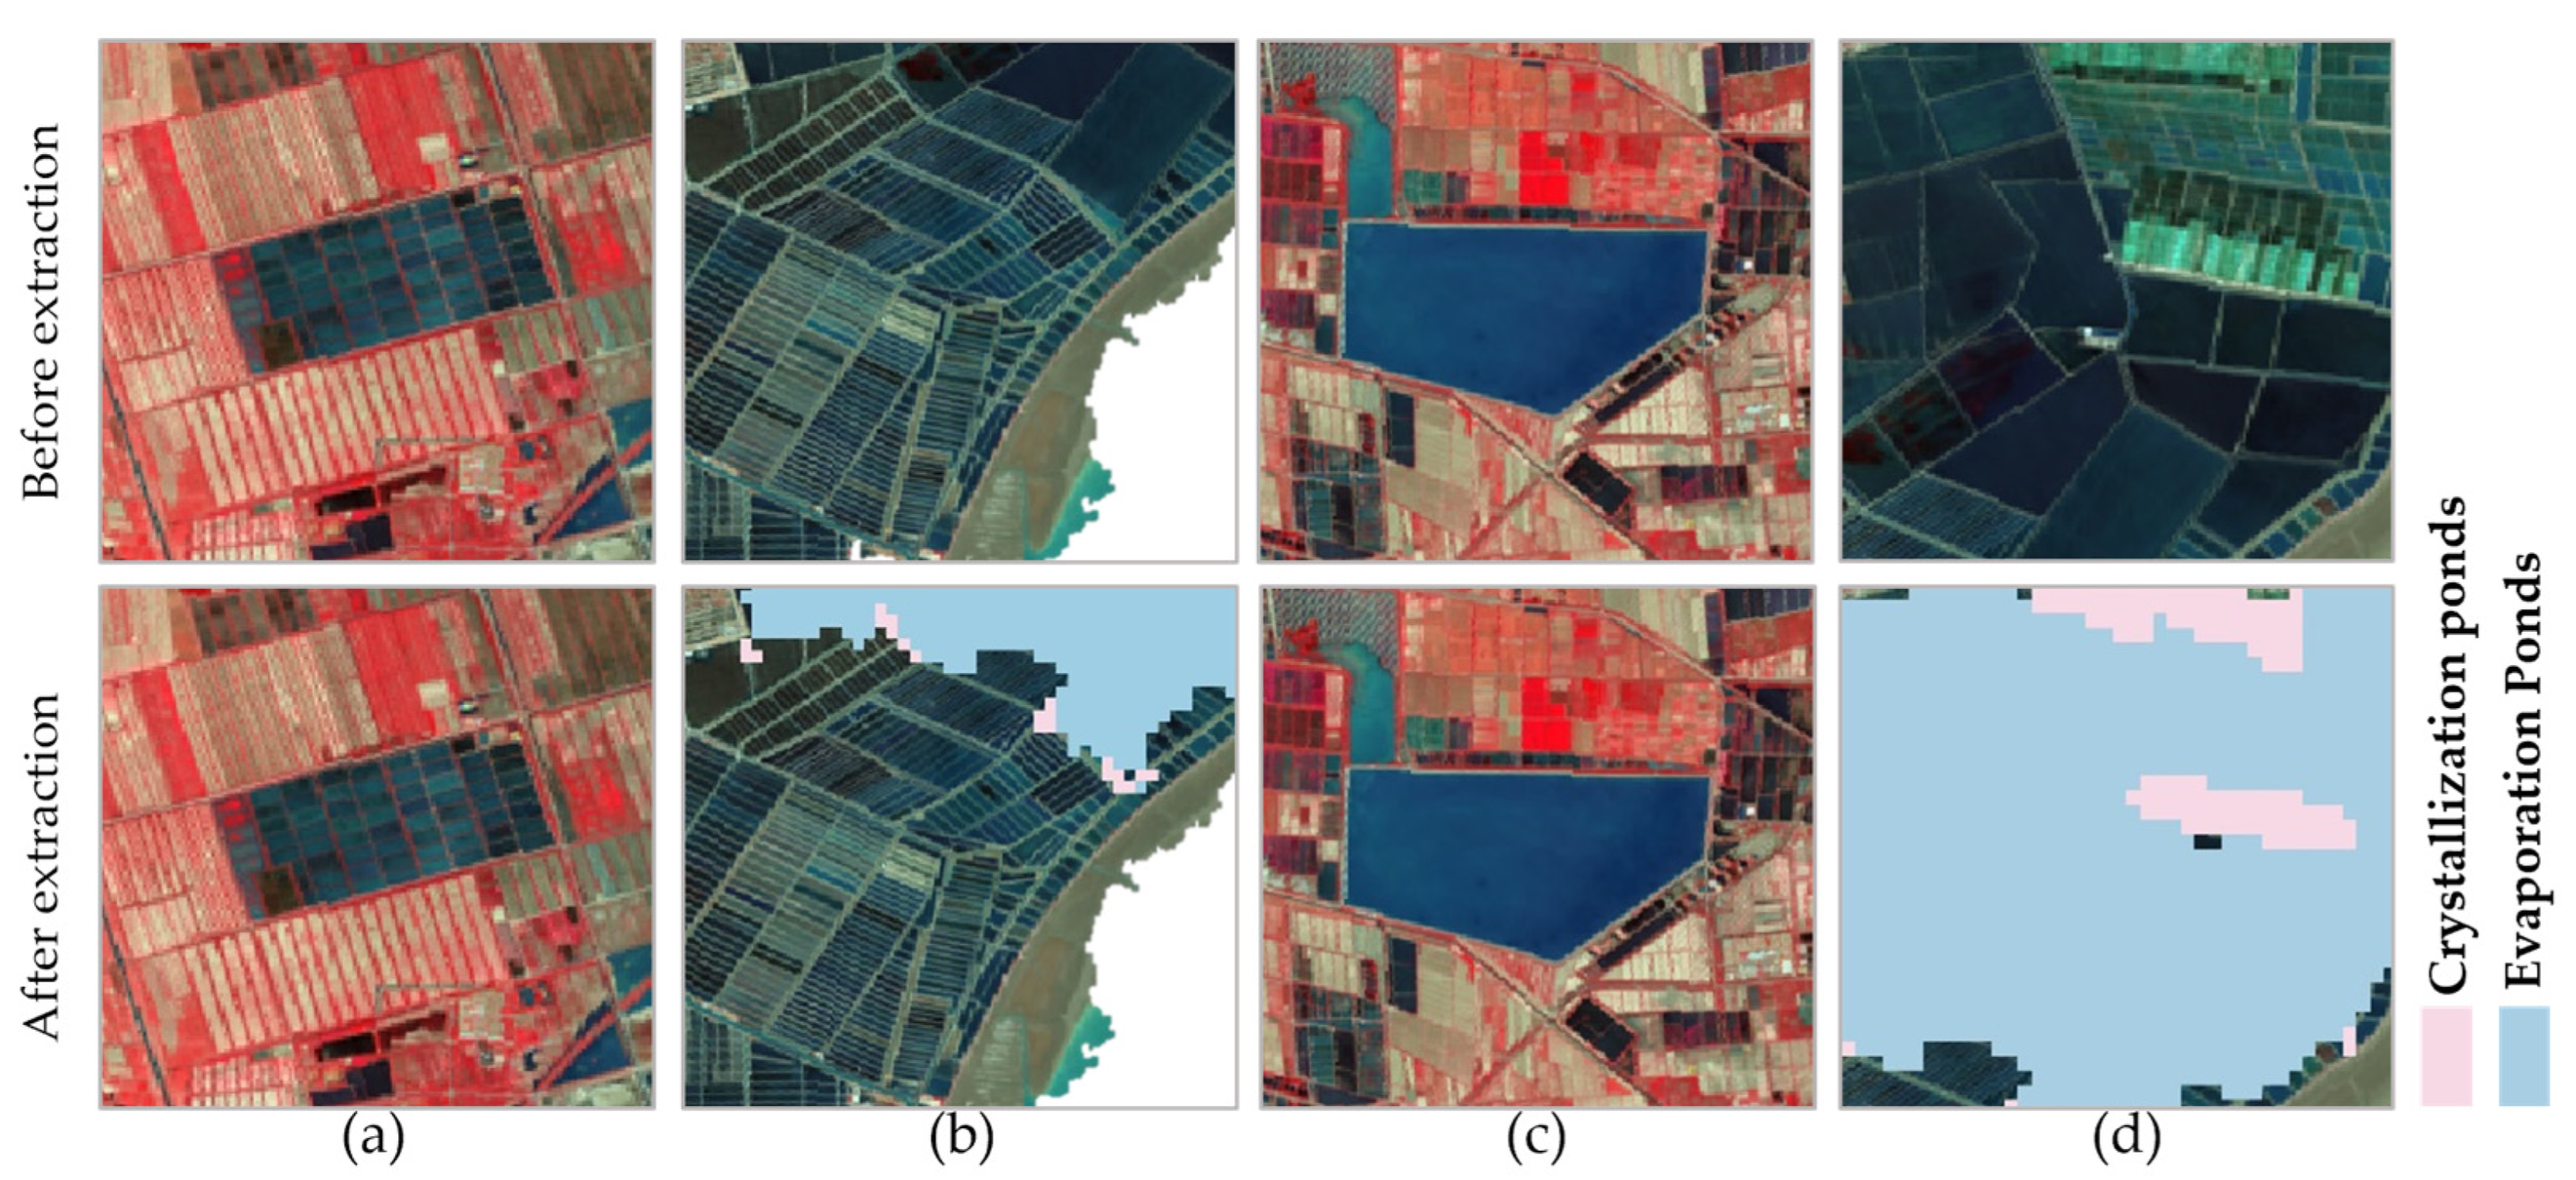
In remote sensing imagery, evaporation ponds typically appear as densely clustered, grid-like structures, whereas a smaller number of evaporation ponds are irregularly shaped and loosely grouped. These features exhibit distinctive geometric characteristics. The main challenge in accurately extracting evaporation ponds lies in interference from spectrally and geometrically similar water bodies, such as aquaculture ponds. Effectively removing such interference is essential to ensuring both classification accuracy and the reliability of the application results. The proposed method effectively extracts salt pan evaporation ponds while successfully eliminating interference from unrelated water bodies (Figure 15).
Aquaculture ponds that share similar spatial arrangements with salt evaporation ponds (Figure 15a) pose a significant risk of misclassification due to their nearly identical spatial distribution patterns and spectral characteristics. Relying solely on spectral or semantic features is insufficient for effectively removing such interference; the integration of spatial-domain information is essential to achieving accurate differentiation. In contrast, aquaculture ponds arranged in narrow, linear strips exhibit clear textural distinctions from evaporation ponds (Figure 15b), although their spectral profiles still exhibit substantial overlaps. In this case, semantic features can effectively reduce or even eliminate such interference, and the boundary between evaporation ponds and aquaculture ponds is clearly defined in overlapping regions (Figure 15b). For spectrally similar yet spatially isolated water bodies such as reservoirs (Figure 15c), applying random forest classification to SPFEFI-enhanced imagery effectively removes these sources of interference and minimizes false positives.

4.2. Factors Affecting the Extraction of Crystallization Ponds

In remote sensing imagery, crystallization ponds in salt pans typically appear as regularly arranged rectangular or grid-shaped structures, characterized by well-defined boundaries and consistent geometric shapes. Their spectral characteristics vary significantly across space and time due to differences in salt concentration and crystallization stage. However, land cover types such as bare soil, buildings, alkali processing zones, and tidal flats exhibit spectral signatures similar to those of crystallization ponds. This spectral similarity poses significant challenges for the accurate interpretation of remote sensing imagery. Consequently, relying solely on spectral information for classification often results in misclassification. The proposed method effectively distinguishes crystallization ponds from spectrally similar land cover types, significantly improving the accuracy and reliability of remote sensing interpretation (Figure 16).
The proposed method demonstrates strong discriminatory capability when distinguishing crystallization ponds from spectrally similar surfaces such as bare soil (Figure 16a,b) and tidal flats (Figure 16c). In bare soil interference zones, the algorithm captures subtle spectral differences between soil and crystallization ponds, maintaining clear spatial separation and effectively suppressing misclassification caused by bare land (Figure 16a,b). In scenarios involving tidal flat interference, despite the high spectral similarity, the method maintains consistent extraction accuracy, indicating strong anti-interference robustness (Figure 16c). Even in cases where crystallization pond features are poorly expressed (Figure 16d), the method still accurately identifies the target class, ensuring both the completeness and reliability of the extracted results. This robustness stems from the algorithm’s optimized extraction of multidimensional salt pan features, enabling it to adapt effectively to varying scene complexities in crystallization pond detection.

4.3. Advantages and Limitations of the Proposed Method

This study presents a salt pan extraction method that integrates remote sensing indices, deep learning, and random forest classification. Although the method performs well overall, several limitations remain.

4.3.1. Advantages

First, the multi-feature collaborative strategy substantially improves separability between salt pans and confusing classes. The MWI and SCI indices enhance the spectral response of salt pans. In comparison with SCI, ASI [6] and NDSI [2] for crystallization-pond extraction, all three indices perform well, but SCI better distinguishes tidal flats from crystallization ponds. In addition, deep semantic features derived by Deeplabv3+ compensate for the limited use of spatial context in traditional spectral methods and remove several interferents that MWI and SCI alone cannot filter. Fusing these outputs into the RGB-composite SPFEFI further enlarges the contrast between salt pans and commonly confused classes such as tidal flats and aquaculture ponds, yielding higher classification accuracy than any single-feature approach. Secondly, the staged classification design balances efficiency and accuracy. The RF classifier performs a second-stage extraction on the feature-enhanced imagery, retaining the interpretability of shallow spectral cues while suppressing noise through spatial denoising. The final results achieved high accuracy (Kappa = 0.84) with fewer misclassifications among salt pan-confounding classes.

4.3.2. Limitations

Firstly, although the overall separability is high, land types such as bare soil and aquaculture ponds—due to their close similarity in both spectral and spatial domains—still occasionally cause misclassification. This issue arises mainly from the overlapping feature space in both spectral reflectance and semantic representation. Secondly, the methodological framework is relatively complex. Although the integration of MWI, SCI, DeepLabv3+, and RF enhances extraction accuracy, it also increases computational cost and necessitates substantial hyperparameter tuning. Finally, the performance of the model is highly dependent on training data. DeepLabv3+, in particular, is sensitive to the quantity and quality of annotated samples. In the absence of representative training data, the model’s generalization ability may degrade. Future work could explore the integration of higher-resolution temporal features or the incorporation of elevation data to further reduce false positives.

5. Conclusions

This study addressed the challenge of accurately extracting coastal salt pan features by developing a hierarchical classification method, SPFEFI-RF, which integrates multi-index guidance with deep–shallow feature fusion. The strength of this framework lies in its progressive design for salt pan extraction. Specifically, the MWI and the SCI were constructed based on spectral information from remote sensing imagery. A salt pan sample dataset was then established, and a deep learning model was employed to extract multi-scale deep semantic features. These outputs were further combined through an R(MWI)-G(SCI)-B(DL) three-channel fusion strategy to generate an SPFEFI, which significantly improved the separability of salt pans from background land covers. Finally, the RF classifier was applied to extract salt pan information from shallow features, and spatial denoising was performed to refine the final results.
By employing this feature-fusion strategy, salt pan information was effectively extracted, overcoming the limitations of traditional single-feature approaches and resolving the difficulty of distinguishing water bodies from evaporation ponds with highly similar spectral responses, particularly in separating evaporation ponds from aquaculture ponds. The overall accuracy of the extraction reached 92.29%, and the spatial consistency between the extracted salt pans and the ground truth was 85.14%. SPFEFI-RF demonstrated strong adaptability and robustness in complex coastal environments with multiple interfering land covers, achieving high-precision salt pan extraction. Salt pan mapping has profound implications for understanding resource use, ecological processes, and system stability in coastal zones. This research not only reveals the coupling mechanisms between human activities and ecosystems but also provides a scientific basis for optimizing land use, enhancing ecosystem resilience, and advancing sustainable development in coastal regions.
In future work, we plan to incorporate Digital Surface Model (DSM) data or Interferometric Synthetic Aperture Radar (InSAR) imagery as additional information sources. Integration of DSM data would enable the model to capture three-dimensional surface structures and elevation information, which is crucial for distinguishing land covers with similar spectral signatures but notable elevation differences, such as salt pans, water bodies, and flat terrain. Meanwhile, InSAR imagery can provide surface deformation data, facilitating the identification of internal structural characteristics and dynamic processes within salt pans. It is anticipated that multimodal data fusion will significantly enhance the segmentation accuracy and the model’s capability to interpret complex land-cover scenarios.

Author Contributions

Y.L.: methodology, software, validation; B.Y.: formal analysis, investigation, resources, data curation; P.Z.: writing—original draft preparation, writing—review and editing, visualization; Z.G.: supervision, project administration; L.Z.: funding acquisition. All authors have read and agreed to the published version of the manuscript.

Funding

This work is funded by Shandong Provincial Natural Science Foundation (Grant No. ZR2025MS527), the Open Fund of the Key Laboratory of Marine Geology and Environment, Chinese Academy of Sciences (Grant No. MGE2022KG1), the National Natural Science Foundation of China (Grant No. 41706092, 42307255, 42206187 and 42006148).

Institutional Review Board Statement

Not applicable.

Informed Consent Statement

Not applicable.

Data Availability Statement

The Landsat open-source dataset used in this study is publicly available and can be accessed at: https://earthexplorer.usgs.gov/ (accessed on 1 September 2025).

Conflicts of Interest

Author Zhiyou Gao was employed by the company Shandong Provincial Geological and Mineral Engineering Group Co., Ltd. The remaining authors declare that the research was conducted in the absence of any commercial or financial relationships that could be construed as a potential conflict of interest.

Abbreviations

The following abbreviations are used in this manuscript:
SPFEFISalt Pan Feature-Enhanced Fusion Image
MWIModified Water Index
SCISalt Pan Crystallization Index
RFRandom Forest
DLDeepLabv3+
SPFEFI-RFFeature-Enhanced Fusion Image Random Forest
NMWINormalized Difference Water Index
MNDWIModified Normalized Difference Water Index
SSISalinity Sensitivity Index
SpISalinity Index

Appendix A

Appendix A.1. MWI

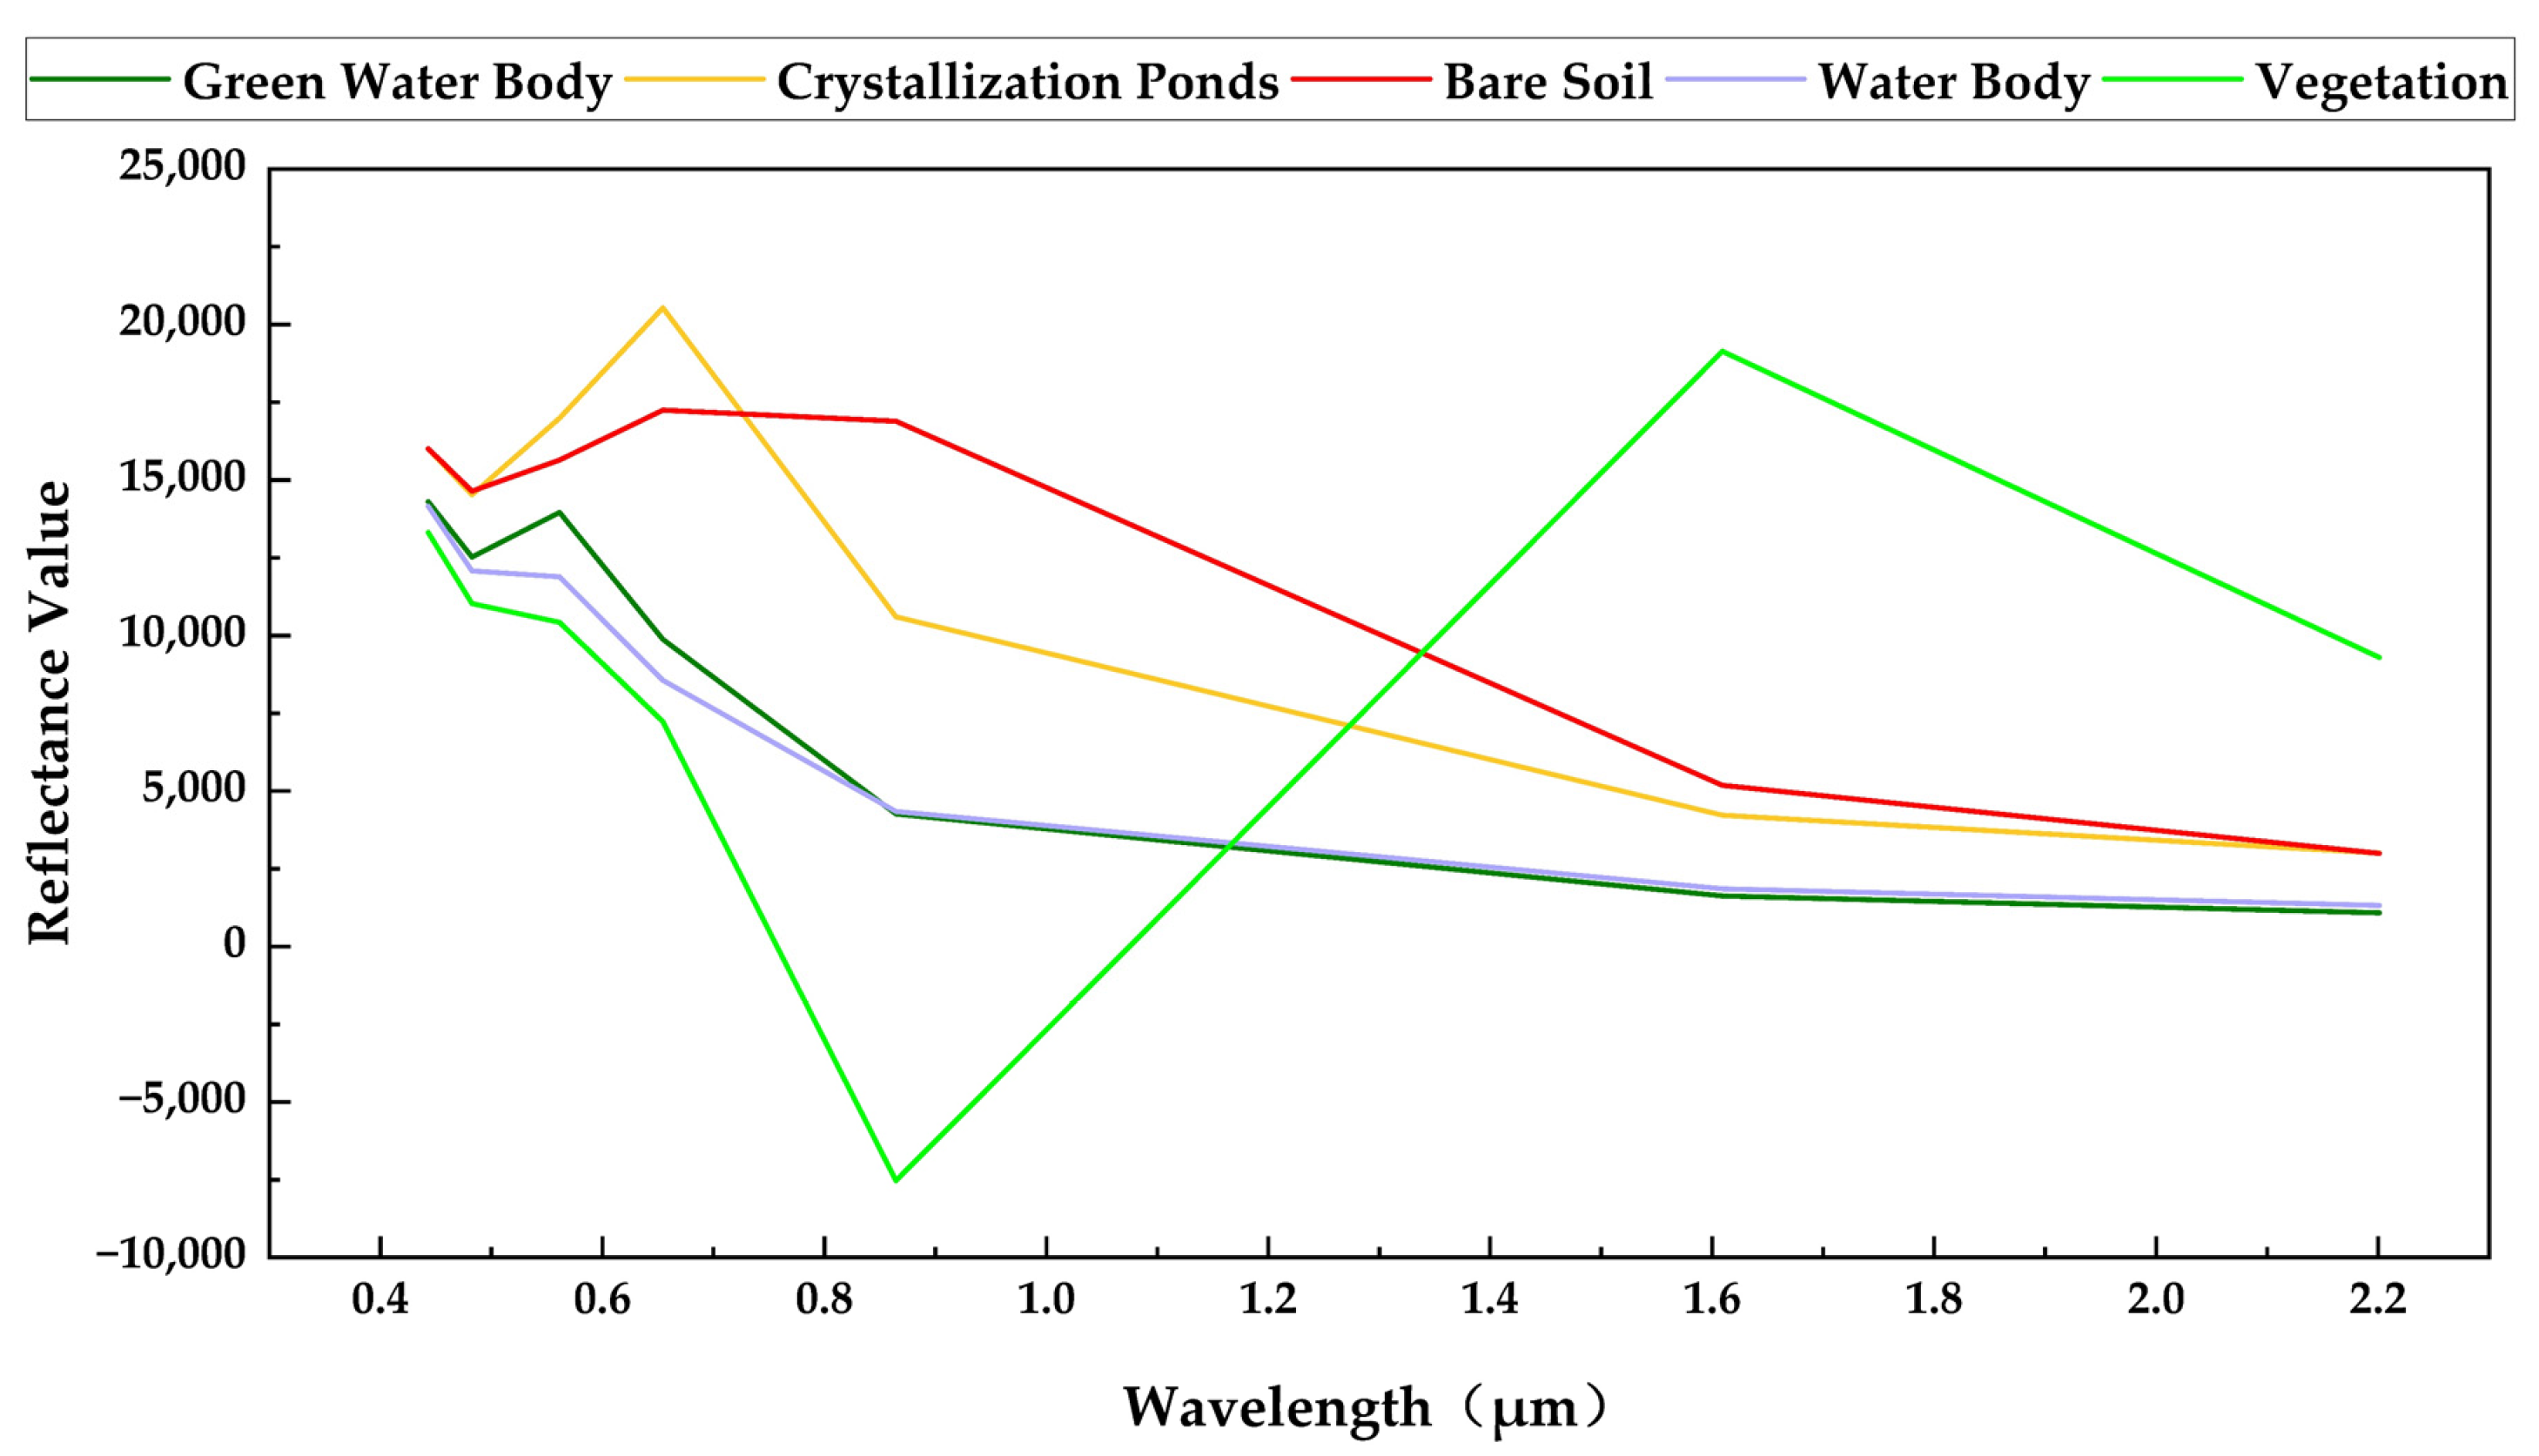
To eliminate interference from non-water features during the extraction of salt pan water bodies, water features across the study area were first identified using water body extraction techniques. Representative samples of water bodies were collected, and their average spectral reflectance curves were generated (Figure A1). In this study, approximately 50 samples were deployed for each land cover category to ensure comprehensive coverage of various typical scenarios. The spectral data from these samples were then averaged to mitigate individual variations, ultimately yielding a representative spectral curve for each land cover type. The spectral curve shows a continuously decreasing reflectance trend for water, with inflection points observed at the blue and red bands. Notably, the greatest difference in reflectance occurs around the blue wavelength, and the lowest reflectance is found in the shortwave infrared band. Therefore, the blue ( ρ B l u e ), red ( ρ R e d ), and shortwave infrared ( ρ S W I R 1 ) bands are suitable for water body extraction. Based on these observations, we propose an improved water index, the Modified Water Index (MWI), which enhances the spectral separability between water bodies and other land cover types, facilitating the accurate extraction of salt pan water features.
Figure A1. Spectral reflectance curve plot.
Sustainability 17 08436 g0a1
M W I = ρ S W I R 1 ρ R e d ρ B l u e ρ S W I R 1 ρ R e d ρ B l u e

Appendix A.2. SCI

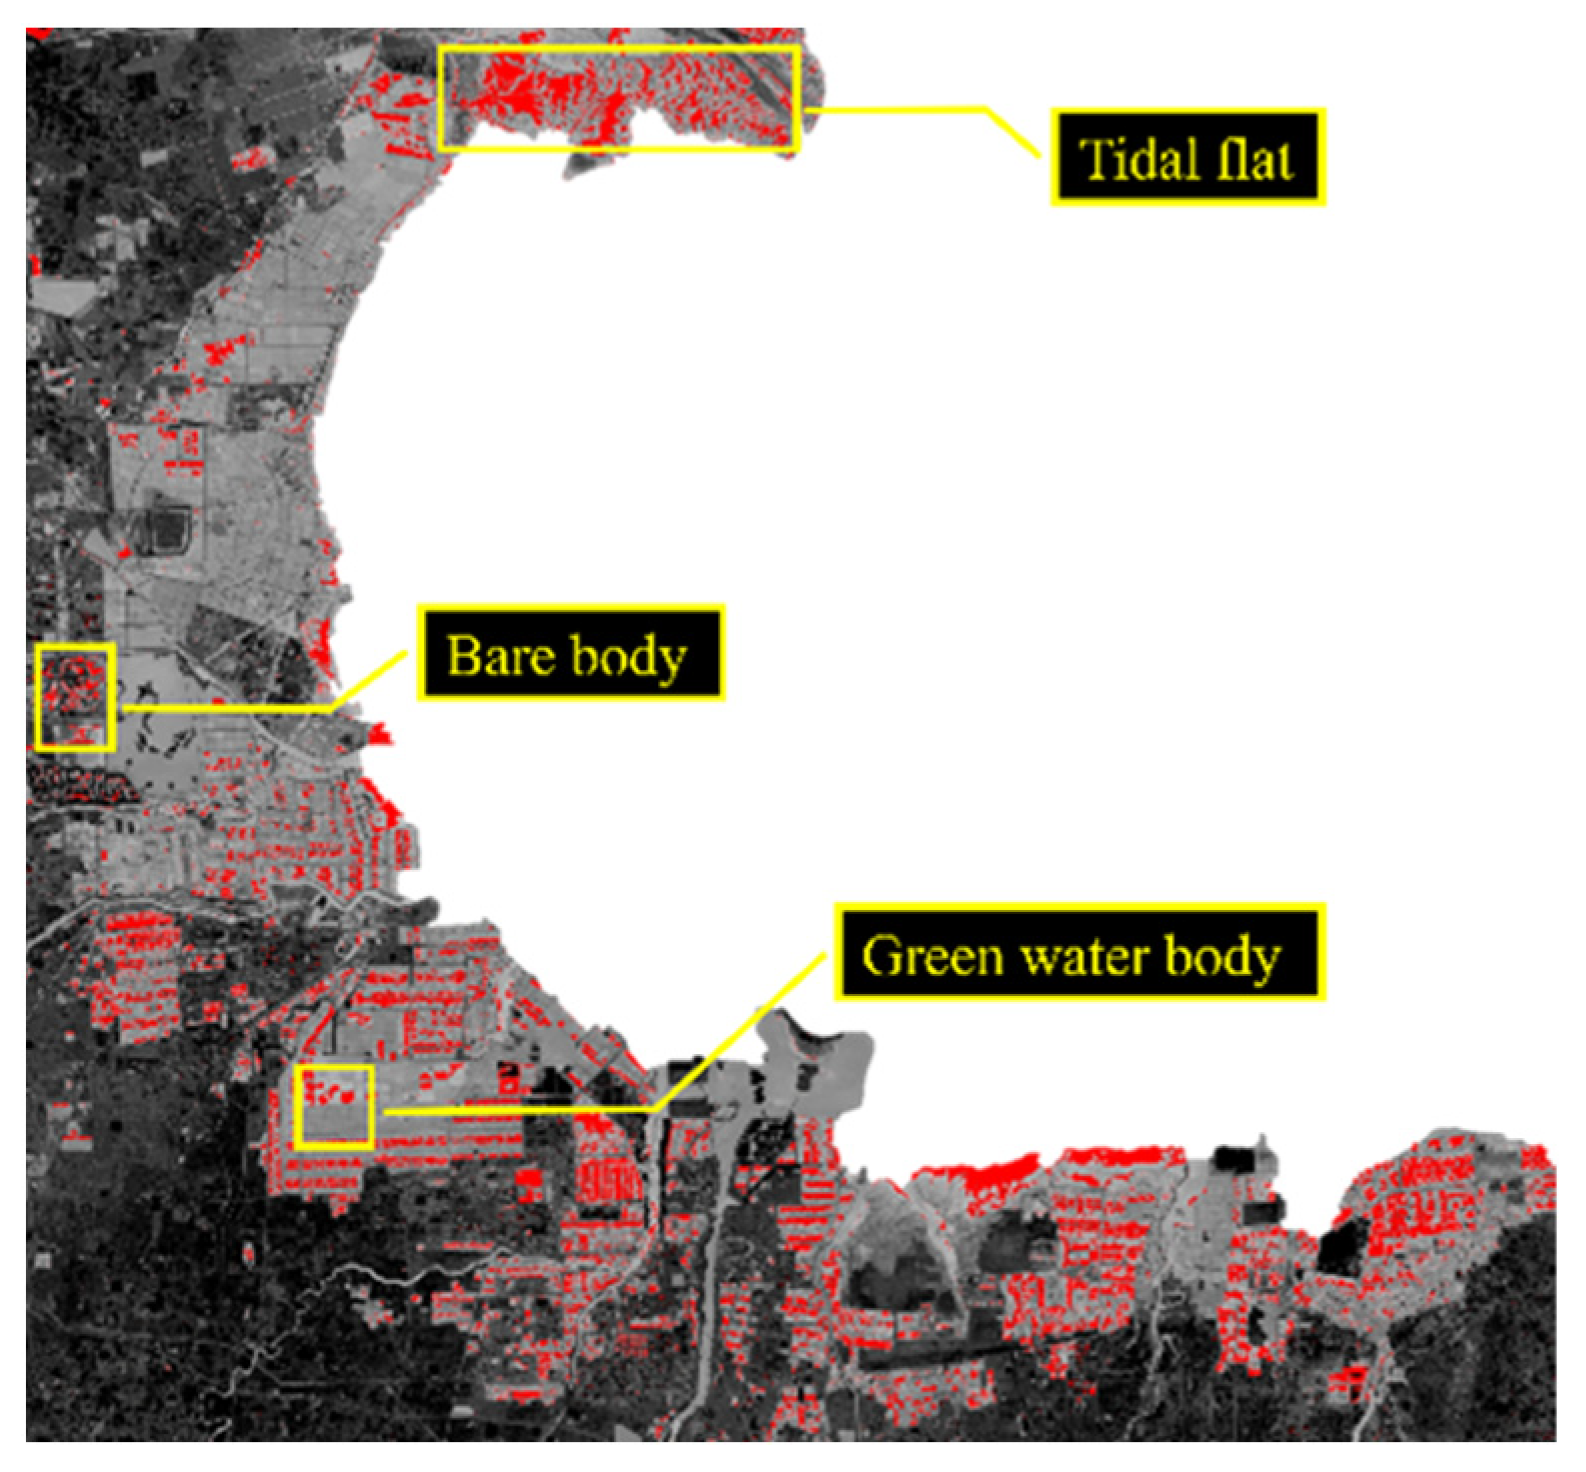
Samples from salt crystallization ponds were collected, and their average spectral curves (Figure A1) indicate a maximum reflectance in the red band ( ρ R e d ) and a minimum in the shortwave infrared 2 band ( ρ S W I R 2 ). Therefore, the difference ρ R e d ρ S W I R 2 was used as a basis for extracting crystallization ponds. The extraction results are shown in Figure A2.
Figure A2. Image derived from ρ N I R ρ S W I R 2 .
Sustainability 17 08436 g0a2
As shown in Figure A2 the extracted crystallization pond features contain a significant amount of interference, primarily from bare soil and green-colored evaporation ponds. Accordingly, additional samples of bare soil and green evaporation ponds were collected, and their average spectral reflectance was analyzed (Figure A1). Tidal flats exhibit the greatest spectral difference from crystallization ponds in the near-infrared band ( ρ N I R ) and also show low reflectance in ρ S W I R 2 . Hence, the difference ρ N I R ρ S W I R 2 was employed to suppress interference from tidal flats and bare soil during crystallization pond extraction. Green water bodies exhibit high reflectance in the blue band ( ρ B l u e ) and low reflectance in. However, using ρ B l u e ρ S W I R 2 does not provide sufficient distinction from crystallization ponds. In contrast, ρ Re d ρ B l u e yields better separability between green water bodies and crystallization ponds and is thus adopted for removing green water body interference.
A = ρ G e d ρ B l u e
B = ( ρ N I R ρ S W I R 2 ) ( ρ R e d ρ S W I R 2 )
To avoid significant discrepancies in image values when calculating between Formulas A2 and A3 the results obtained from Formula A3 were scaled down. Experimental results indicate that applying a coefficient of 0.3 better preserves the features of crystallization ponds while suppressing interference from other ground objects.
Based on the above analysis, we propose a novel index—the Salt Pan Crystallization Index (SCI)—for the extraction of crystallization ponds. The SCI was applied to enhance the spectral distinction between crystallization ponds and surrounding features, thereby improving the precision of salt pan extraction.
S C I = max { ( ρ r e d ρ b l u e ) 0.3 [ ( ρ N I R ρ S W I R 2 ) ( ρ r e d ρ S W I R 2 ) ] } ρ b l u e

Appendix A.3. Spatial Feature Analysis Methods

In previous studies, various approaches have been proposed for spatial feature extraction and analysis of remote sensing imagery. Among them, the Laplacian operator, the Hessian matrix, and local spatial similarity are widely used representative methods.
  • Laplacian operator
The Laplacian operator is a second-order differential operator that is highly sensitive to abrupt intensity changes and highlights regions with strong gray-level variations [4]. Its principle involves computing the second-order differences in the image, typically implemented using four- or eight-neighbor convolution masks, which enhances edges and fine details. In numerous studies, the Laplacian operator has been applied to edge detection, image sharpening, and texture enhancement, making it effective for delineating water bodies, salt pond boundaries, and man-made structures with distinct edge features.
2.
Hessian matrix
The Hessian matrix is composed of the second-order partial derivatives of the image intensity field and characterizes the local curvature of the intensity surface [4,5]. Researchers typically compute the second derivatives within a pixel neighborhood, construct the matrix, and perform eigenvalue decomposition to identify corners, ridges, and valleys. Compared with first-order gradient operators, the Hessian matrix captures higher-order structural information and is more robust to noise. It has been widely used for linear feature extraction, such as roads and rivers, geomorphological structure recognition, and spatial pattern analysis in complex landscapes.
3.
Local spatial similarity
Local spatial similarity methods are based on spatial statistical analysis and measure the homogeneity between a pixel and its neighbors in terms of spectral or textural features [6]. These methods usually employ a moving window to compute similarity metrics (e.g., Euclidean distance, correlation coefficient) and produce a spatial coherence measure. Such approaches can suppress isolated noisy pixels and enhance the continuity of homogeneous regions. In the literature, they have been applied to image denoising, homogeneous patch identification, and classification post-processing, improving the spatial consistency and boundary smoothness of classification and segmentation results.

References

  1. Zhao, L.; Fan, X.; Xiao, S. Remote-Sensing Indicators and Methods for Coastal-Ecosystem Health Assessment: A Review of Progress, Challenges, and Future Directions. Water 2025, 17, 1971. [Google Scholar] [CrossRef]
  2. Sridhar, P.N.; Surendran, A.; Ramana, I.V. Auto-extraction Technique-based Digital Classification of Saltpans and Aquaculture Plots Using Satellite Data. Int. J. Remote Sens. 2008, 29, 313–323. [Google Scholar] [CrossRef]
  3. Jin, M. Study of Methodology in the Salt Pan Information Extraction Based on High-Resolution Images. Master’s Thesis, China University of Geosciences, Beijing, China, 2018. [Google Scholar]
  4. Chen, F. Multi-Feature Sequential Extraction Algorithms for Coastal Multi-Type Water Bodies Based on Landsat-8 Imagery. Master’s Thesis, Dalian Maritime University, Dalian, China, 2023. [Google Scholar]
  5. Ni, K. Extraction Algorithms of Coastal Salt Pans and Aquaculture Ponds Based on Landsat-8 Images. Master’s Thesis, Dalian Maritime University, Dalian, China, 2021. [Google Scholar]
  6. Jiao, X.; Shi, X.; Shen, Z.; Ni, K.; Deng, Z. Automatic Extraction of Saltpans on an Amendatory Saltpan Index and Local Spatial Parallel Similarity in Landsat-8 Imagery. Remote Sens. 2023, 15, 3413. [Google Scholar] [CrossRef]
  7. Safaee, S.; Wang, J. Towards Global Mapping of Salt Pans and Salt Playas Using Landsat Imagery: A Case Study of Western United States. Int. J. Remote Sens. 2020, 41, 8693–8716. [Google Scholar] [CrossRef]
  8. JI, M.; Jianran, X.U.; Zhang, L.; Wang, C. Large Convolution Kernel Network Algorithm for Extracting Salt Field Farms from High-Resolution Images. Geospat. Inf. 2023, 21, 5–9. [Google Scholar]
  9. Xu, Z.; Sun, H.; Zhang, T.; Xu, H.; Wu, D.; Gao, J. The High Spatial Resolution Drought Response Index (HiDRI): An Integrated Framework for Monitoring Vegetation Drought with Remote Sensing, Deep Learning, and Spatiotemporal Fusion. Remote Sens. Environ. 2024, 312, 114324. [Google Scholar] [CrossRef]
  10. Guo, D.; Li, Z.; Gao, X.; Gao, M.; Yu, C.; Zhang, C.; Shi, W. RealFusion: A Reliable Deep Learning-Based Spatiotemporal Fusion Framework for Generating Seamless Fine-Resolution Imagery. Remote Sens. Environ. 2025, 321, 114689. [Google Scholar] [CrossRef]
  11. Meng, X.; Zhang, S.; Wang, G.; Ding, J.; Chu, C.; Zhang, J.; Wang, H. Decoding Agricultural Drought Resilience: A Triple-Validated Random Forest Framework Integrating Multi-Source Remote Sensing for High-Resolution Monitoring in the North China Plain. Remote Sens. 2025, 17, 1404. [Google Scholar] [CrossRef]
  12. Radford, B.; Puotinen, M.; Sahin, D.; Boutros, N.; Wyatt, M.; Gilmour, J. A Remote Sensing Model for Coral Recruitment Habitat. Remote Sens. Environ. 2024, 311, 114231. [Google Scholar] [CrossRef]
  13. Li, H.; Li, L.; Wang, H.; Zhang, W.; Ren, P. Underwater Image Captioning with AquaSketch-Enhanced Cross-Scale Information Fusion. IEEE Trans. Geosci. Remote Sens. 2025, 63, 4208718. [Google Scholar] [CrossRef]
  14. Ling, Q.; Huang, H.; Guan, C.; Li, Y. Utilization of Underground Brine Resources and Phase Diagram Analysis in Laizhou Bay. J. Salt Sci. Chem. Ind. 2023, 52, 42–47. [Google Scholar]
  15. Gao, B. NDWI—A Normalized Difference Water Index for Remote Sensing of Vegetation Liquid Water from Space. Remote Sens. Environ. 1996, 58, 257–266. [Google Scholar] [CrossRef]
  16. Xu, H. A Study on Information Extraction of Water Body with the Modified Normalized Difference Water Index (MNDWI)c. J. Remote Sens. 2005, 9, 589–595. [Google Scholar]
  17. Feng, H.; Hu, Q.; Zhao, P.; Wang, S.; Ai, M.; Zheng, D.; Liu, T. FTransDeepLab: Multimodal Fusion Transformer-Based DeepLabv3+ for Remote Sensing Semantic Segmentation. IEEE Trans. Geosci. Remote Sens. 2025, 63, 4406618. [Google Scholar] [CrossRef]
  18. Guo, Y.; Liu, Y.; Georgiou, T.; Lew, M.S. A Review of Semantic Segmentation Using Deep Neural Networks. Int. J. Multimed. Info. Retr. 2018, 7, 87–93. [Google Scholar] [CrossRef]
  19. Sunandini, G.; Sivanpillai, R.; Sowmya, V.; Sajith Variyar, V.V. Significance of Atrous Spatial Pyramid Pooling (ASPP) in Deeplabv3+ for Water Body Segmentation. In Proceedings of the 2023 10th International Conference on Signal Processing and Integrated Networks (SPIN), Noida, India, 23 March 2023; pp. 744–749. [Google Scholar]
  20. Guo, S.; Zhu, C. Cascaded ASPP and Attention Mechanism-Based Deeplabv3+ Semantic Segmentation Model. In Proceedings of the 2022 IEEE 8th International Conference on Cloud Computing and Intelligent Systems (CCIS), Chengdu, China, 26 November 2022; pp. 315–318. [Google Scholar]
  21. Sun, J.; Zhou, J.; He, Y.; Jia, H.; Liang, Z. RL-DeepLabv3+: A Lightweight Rice Lodging Semantic Segmentation Model for Unmanned Rice Harvester. Comput. Electron. Agric. 2023, 209, 107823. [Google Scholar] [CrossRef]
  22. Yang, S.; Cui, Z.; Li, M.; Li, J.; Gao, D.; Ma, F.; Wang, Y. A Grapevine Trunks and Intra-Plant Weeds Segmentation Method Based on Improved Deeplabv3 Plus. Comput. Electron. Agric. 2024, 227, 109568. [Google Scholar] [CrossRef]
  23. Breiman, L. Random Forests. Mach. Learn. 2001, 45, 5–32. [Google Scholar] [CrossRef]
  24. Xia, J.; Ghamisi, P.; Yokoya, N.; Iwasaki, A. Random Forest Ensembles and Extended Multiextinction Profiles for Hyperspectral Image Classification. IEEE Trans. Geosci. Remote Sens. 2018, 56, 202–216. [Google Scholar] [CrossRef]
  25. Ham, J.; Chen, Y.C.; Crawford, M.M.; Ghosh, J. Investigation of the Random Forest Framework for Classification of Hyperspectral Data. IEEE Trans. Geosci. Remote Sens. 2005, 43, 492–501. [Google Scholar] [CrossRef]
  26. Belgiu, M.; Drăguţ, L. Random Forest in Remote Sensing: A Review of Applications and Future Directions. ISPRS J. Photogramm. Remote Sens. 2016, 114, 24–31. [Google Scholar] [CrossRef]
  27. Speiser, J.L.; Durkalski, V.L.; Lee, W.M. Random Forest Classification of Etiologies for an Orphan Disease. Stat. Med. 2015, 34, 887–899. [Google Scholar] [CrossRef] [PubMed]
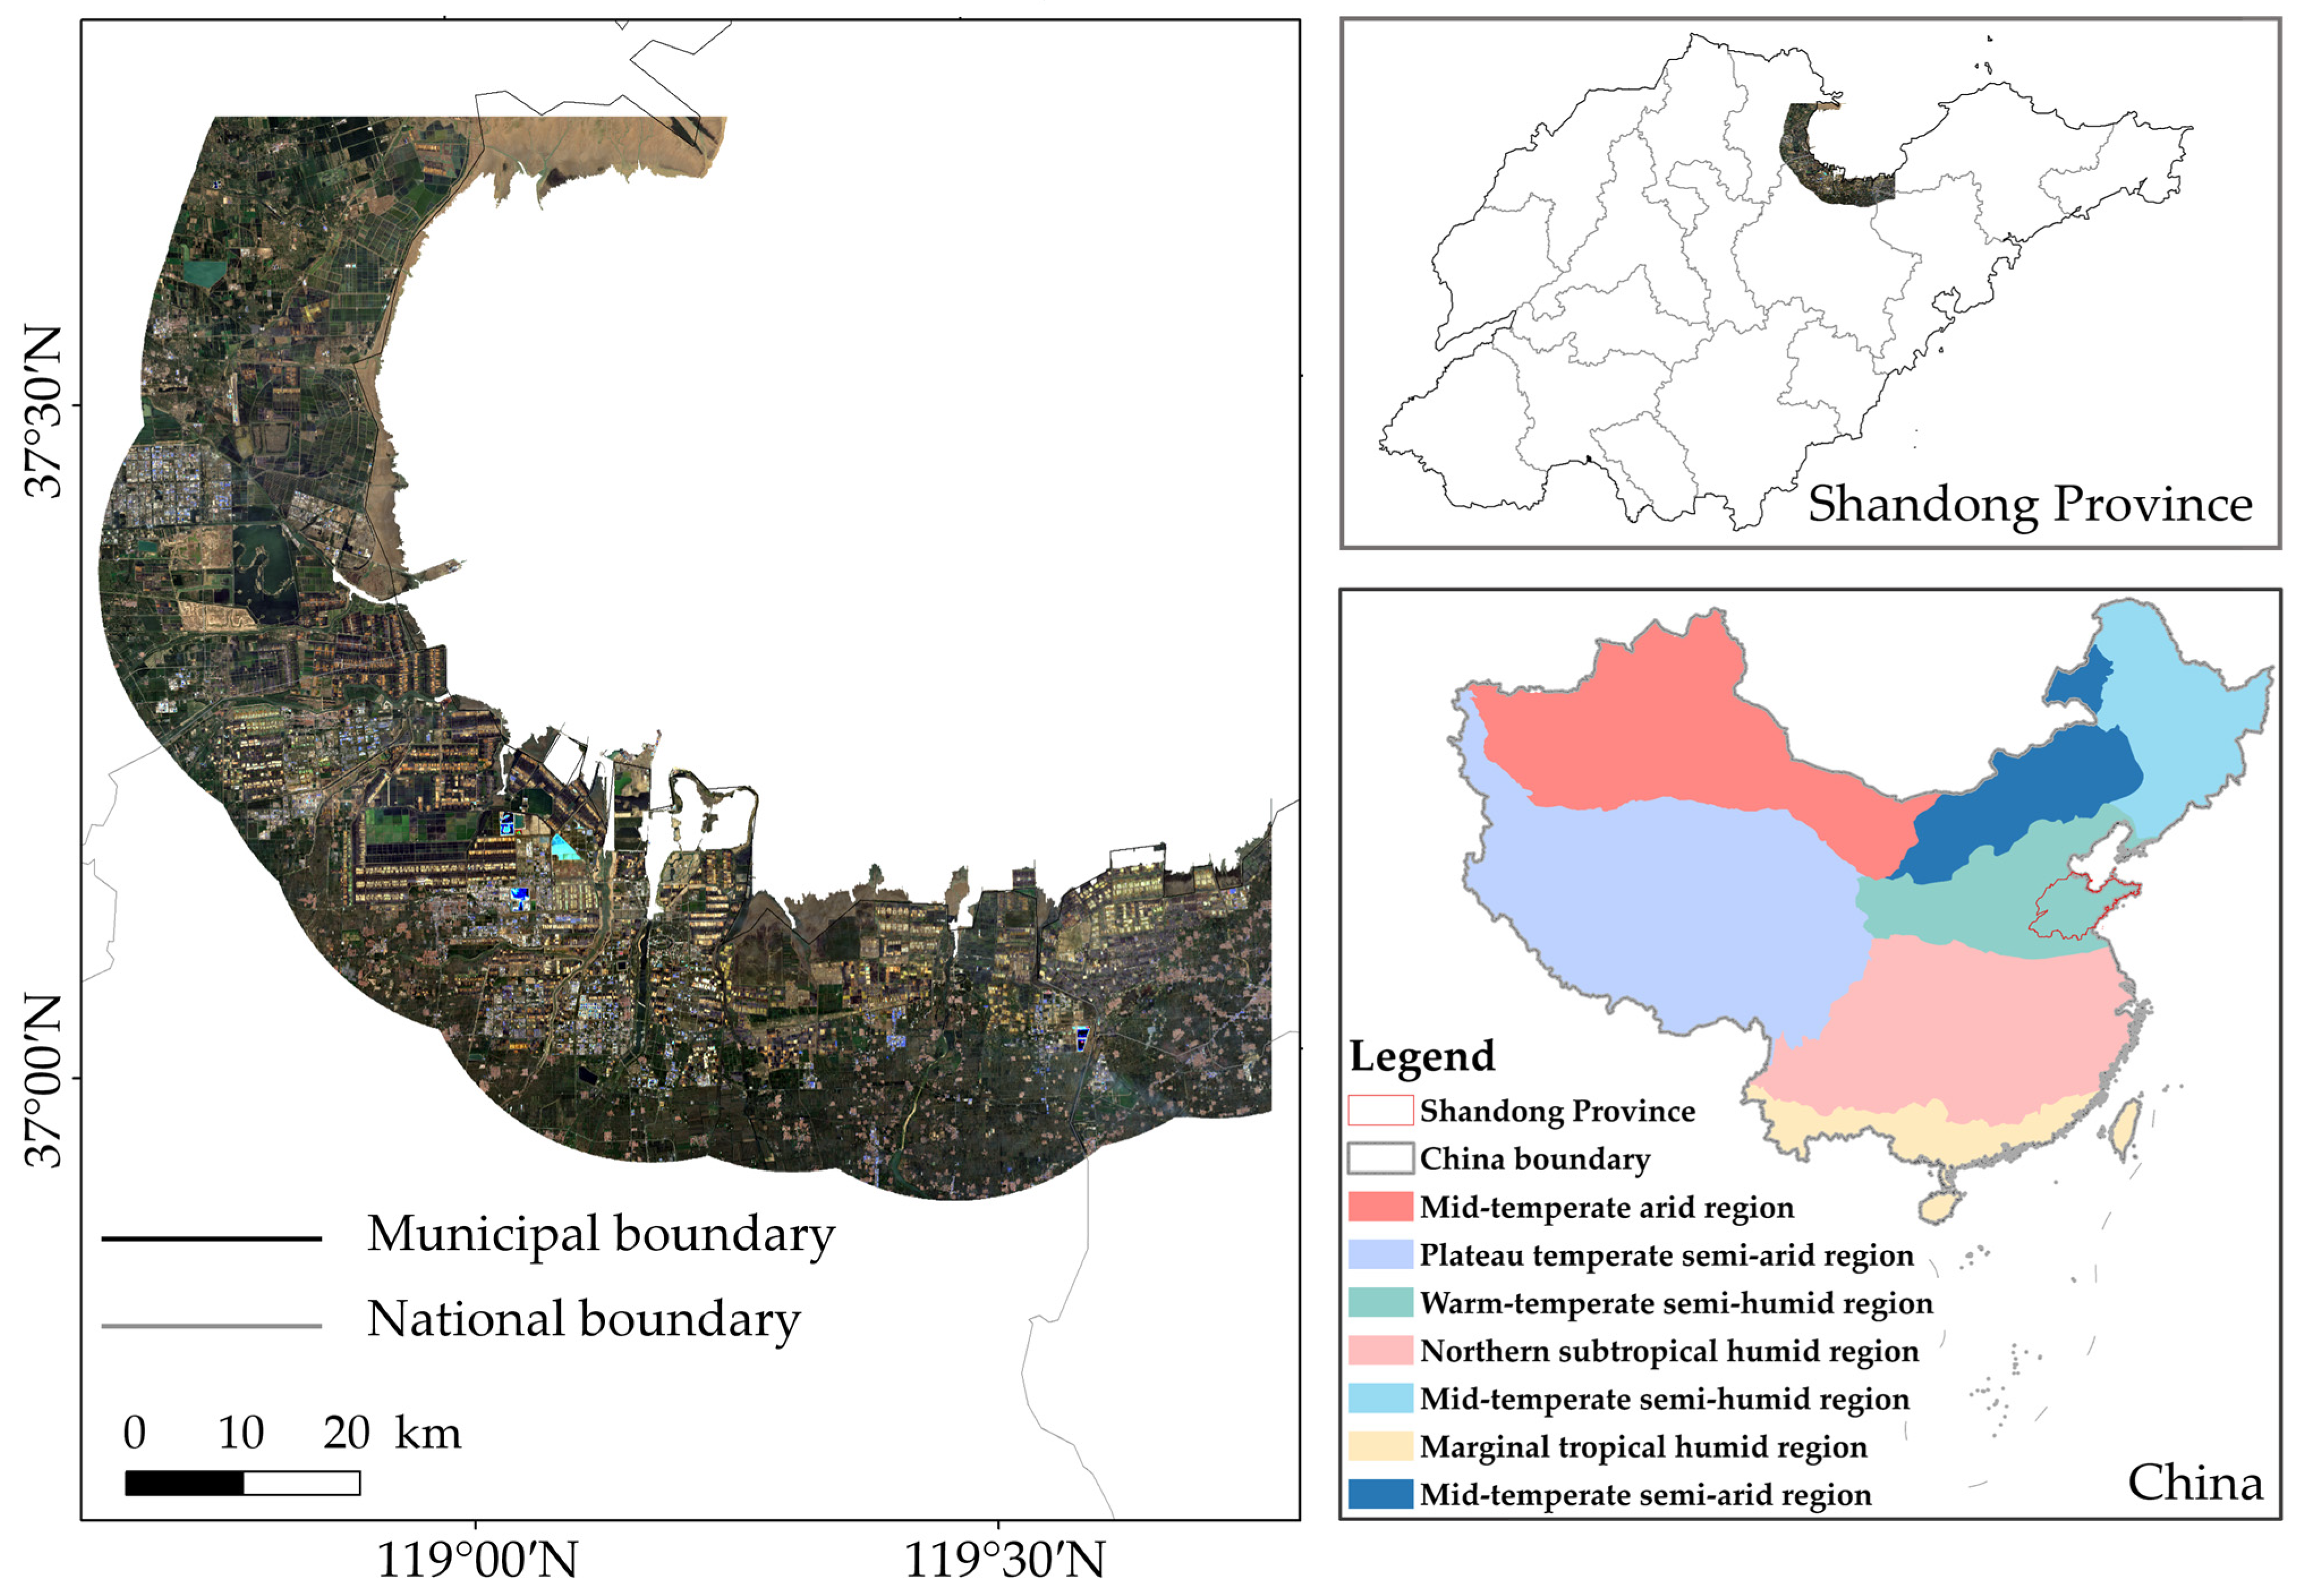
Figure 1. Geographical location of the study area.
Sustainability 17 08436 g001
Figure 2. Technical workflow.
Sustainability 17 08436 g002
Figure 3. Schematic diagram of DeepLabv3+.
Sustainability 17 08436 g003
Figure 4. Semantic labels.
Sustainability 17 08436 g004
Figure 5. Schematic diagram of random forest.
Sustainability 17 08436 g005
Figure 6. Multi-temporal images and fusion results. (a,e) Salt pan images from 18 April 2021; (b,f) 5 June 2021; and (c,g) 21 June 2021. (d,h) show the fused results of the three preceding images. Yellow ellipses in the first row indicate temporal variation in crystallization ponds, while those in the second row denote variation in evaporation ponds.
Sustainability 17 08436 g006
Figure 7. Comparison of MWI and SCI results. (ac) Results using NDWI, MNDWI, and MWI methods, respectively. (d) The corresponding false-color image of the extraction area. (eg) The results of SpI, SSI, and SCI computations, respectively. (h) The corresponding false-color image. The highlighted regions in (h) indicate the crystallization ponds. The red ellipses highlight problematic water body detection zones and green ellipses highlight problematic crystallization detection zones, while the yellow ellipses indicate pond areas.
Sustainability 17 08436 g007
Figure 8. Curves of deep learning loss functions and mean Intersection over Union (mIoU). (a) The training loss and mIoU curve for the first training cycle; (b) The corresponding results for the second training cycle.
Sustainability 17 08436 g008
Figure 9. Comparison of inference results under different deep learning loss functions. (af) Epochs 5, 50, 95, 105 (dotted box), 140, and 195, respectively. Regions enclosed by yellow ellipses indicate false positive detections, while those highlighted with green ellipses represent missed detections.
Sustainability 17 08436 g009
Figure 10. The results of the R(MWI)-G(SCI)-B(DL) strategy multi-feature fusion.
Sustainability 17 08436 g010
Figure 11. Figure 11. Detailed view of multi-feature fused images, with inaccurate salt pan identification areas highlighted by yellow ellipses. The first row presents the SPFEFI image, and the second row shows the false-colour composite. Ellipses in (a), (c), (d), and (f) highlight heterogeneous regions in the SPFEFI image, while (b) and (e) indicate an area with normal feature representation.
Sustainability 17 08436 g011
Figure 12. Results of salt pan extraction. (a) The overall results for the study area. (bd) The detailed results for sub-regions b, c, and d within (a), respectively. The first row presents false-color imagery; the second row shows the SPFEFI; and the third row illustrates the classification result using SPFEFI and random forest (RF). The red ellipses in (c) indicate heterogeneous areas in the SPFEFI, while those in (d) mark regions of misclassification between crystallization and evaporation ponds.
Sustainability 17 08436 g012
Figure 13. Comparative analysis of extraction results in the experimental area. (a) The multi-temporal fused image; (b) the SPFEFI result; and (c) the corresponding false-color image. (d,e) The classification results obtained using RF on (a,b), respectively. (f) The salt pan ground truth.
Sustainability 17 08436 g013
Figure 14. Comparison of classification details for three selected subregions: (ac). The first column displays false-color images from multi-temporal fused imagery; the second column shows the RF classification results based on SPFEFI; the third column shows RF results based on multi-temporal fusion; and the fourth column presents the salt pan ground truth.
Sustainability 17 08436 g014
Figure 15. Comparison of salt pan evaporation pond extraction before and after removing interference. (a,b) include aquaculture ponds as interfering features; (c) shows interference from a reservoir; and (d) displays salt evaporation ponds as the target feature. The first row contains false-color imagery, while the second row presents the extracted salt pan results overlaid on the false-color background.
Sustainability 17 08436 g015
Figure 16. Extraction results of salt pan crystallization ponds before and after interference removal. (a,b) involve bare soil as interfering features; (c) includes tidal flats; (d) highlights salt crystallization ponds in bright white. The first row shows false-color imagery, and the second row displays the extracted salt pan results overlaid on the corresponding images.
Sustainability 17 08436 g016
Table 1. Image information.
No.DatePath/RowCloud CoverSpatial Resolution (m)
118 April 2021121/03415.00%30
25 June 2021121/03414.74%30
321 June 2021121/03426.95%30
Table 2. Dataset information.
Cloud CoverageSensorDate
<30%LANDSAT 8
LANDSAT 9
May 2020~July 2020
May 2021~July 2021
May 2022~July 2022
May 2023~July 2023
May 2024~July 2024
Table 3. Accuracy metric formulas.
AccuracyFormulation
Kappa P r e c i s i o n     ( T P   +   F P )   ×   ( T P   +   F N )   ×   ( F P   +   T N ) ( T N   +   T P   +   F P   +   F N ) 2 1     ( T P   +   F P )   ×   ( T P   +   F N )   ×   ( F P   +   T N ) ( T N   +   T P   +   F P   +   F N ) 2
Overall Accuracy T P T P + F P
Precision T P T P + F N
F1 score U A × P A U A + P A × 2
Table 4. Assessment of the SPFEFI RF method.
AccuracyCrystallization PondEvaporation Pond
Overall Accuracy92.29%92.29%
Kappa84.01%84.01%
Precision99.10%83.06%
F1 score90.34%93.66%
All precision calculations were performed using the same sample set.
Disclaimer/Publisher’s Note: The statements, opinions and data contained in all publications are solely those of the individual author(s) and contributor(s) and not of MDPI and/or the editor(s). MDPI and/or the editor(s) disclaim responsibility for any injury to people or property resulting from any ideas, methods, instructions or products referred to in the content.