1. Introduction
Surface energy and moisture balance processes govern land–atmosphere interactions, particularly in regions with temperate oceanic climates. These regions are characterized by mild temperatures, relatively high humidity, persistent cloud cover, and evenly distributed rainfall throughout the year. Such climatic conditions lead to moderate but dynamic energy fluxes, strongly influenced by fluctuations in solar radiation, wind speed, and soil moisture availability [
1,
2]. The partitioning of energy among net radiation, sensible heat flux, latent heat flux, and soil heat flux is tightly coupled with meteorological inputs, vegetation cover, and soil characteristics. In temperate oceanic environments, simulating surface energy and moisture exchanges is essential for enhancing hydrological modeling, improving irrigation scheduling, and developing land use strategies that respond to short-term variability and long-term climate change. These modeling efforts are critical for informing sustainable soil management practices and for supporting adaptive agricultural strategies under variable climatic and land use conditions. These regions often include grasslands, pastures, forests, and rotational croplands, where partial or seasonal vegetation cover results in exposed soil surfaces that dominate soil–atmosphere interactions during significant parts of the year. Under such conditions, accurate modeling of evaporation, soil heat transfer, and surface temperature becomes crucial [
3,
4]. To address these complexities, physically based Soil–Vegetation–Atmosphere Transfer (SVAT) models have become essential tools. These models simulate the coupled vertical transport of water and energy within the unsaturated zone and their interaction with atmospheric drivers. The SiSPAT model (Simple Soil–Plant–Atmosphere Transfer) applies the Philip–De Vries formulation to model heat conduction, liquid water flow, and vapor diffusion in soils. SiSPAT integrates soil properties such as thermal conductivity, hydraulic conductivity, and soil texture with atmospheric boundary conditions including solar radiation, wind speed, temperature, and humidity [
5,
6]. One of SiSPAT’s strengths is its ability to resolve diurnal and seasonal variations in energy and moisture fluxes. This is especially relevant in temperate oceanic climates, where frequent weather changes within short periods—due to cloud formation, rainfall, or wind variation—can lead to sharp changes in surface conditions. Empirical models often fail to capture these fluctuations accurately, while SiSPAT’s mechanistic structure offers a more dynamic and physically grounded simulation [
7,
8]. Moreover, in many managed or semi-natural systems within this climate zone, bare or semi-bare soil surfaces are common due to harvesting, grazing, or land use transitions. These surfaces are critical in controlling energy partitioning, particularly when soil moisture is limited. SiSPAT’s ability to simulate bare soil evaporation, soil temperature profiles, and heat fluxes enables its application in conditions where empirical resistance-based models typically underperform [
9,
10]. The model can also incorporate surface resistance and soil thermal inertia, key variables in predicting surface–atmosphere exchange processes under moderate to high humidity.
The increasing availability of remote sensing observations has significantly improved SVAT model calibration and validation. Satellite products such as MODIS and Sentinel-2 provide land surface temperature, albedo, and vegetation indices, which, when combined with field measurements of soil moisture and net radiation, support more accurate and scalable modeling [
11,
12]. These datasets facilitate spatial scaling of simulations from plot to watershed level, expanding the application of models like SiSPAT to larger domains with greater reliability [
13]. Nevertheless, modeling in temperate oceanic regions presents challenges. The high spatial and temporal variability in soil texture, vegetation, and microclimatic conditions can introduce uncertainty [
14]. Accurate input of soil hydraulic properties, roughness parameters, and boundary layer characteristics is essential. Studies have highlighted that the sensitivity of SVAT models to soil thermal properties, especially thermal inertia and vapor diffusivity, can significantly influence energy flux predictions [
15]. Furthermore, dynamic land cover conditions—such as crop rotation or grass regrowth—require adaptive parameterization strategies to maintain model performance. Despite the growing application of SVAT models like SiSPAT in agricultural and semi-natural systems, their performance under temperate oceanic climate conditions remains underexplored. Existing studies have predominantly focused on arid or continental climates, leaving a critical gap in our understanding of energy and moisture exchange processes in regions with moderate humidity, frequent cloud cover, and variable soil wetness. Few studies have validated SiSPAT’s ability to simulate surface fluxes under conditions of transient vegetation cover and fluctuating boundary conditions typical of temperate oceanic systems. Thus, the objective of this study is to evaluate the performance of the SiSPAT model in simulating diurnal and seasonal soil–atmosphere fluxes under temperate oceanic climate conditions, with the goal of guiding sustainable soil management and conservation strategies that enhance agricultural resilience in transitional land use systems.
2. Materials and Methods
2.1. Experimental Site
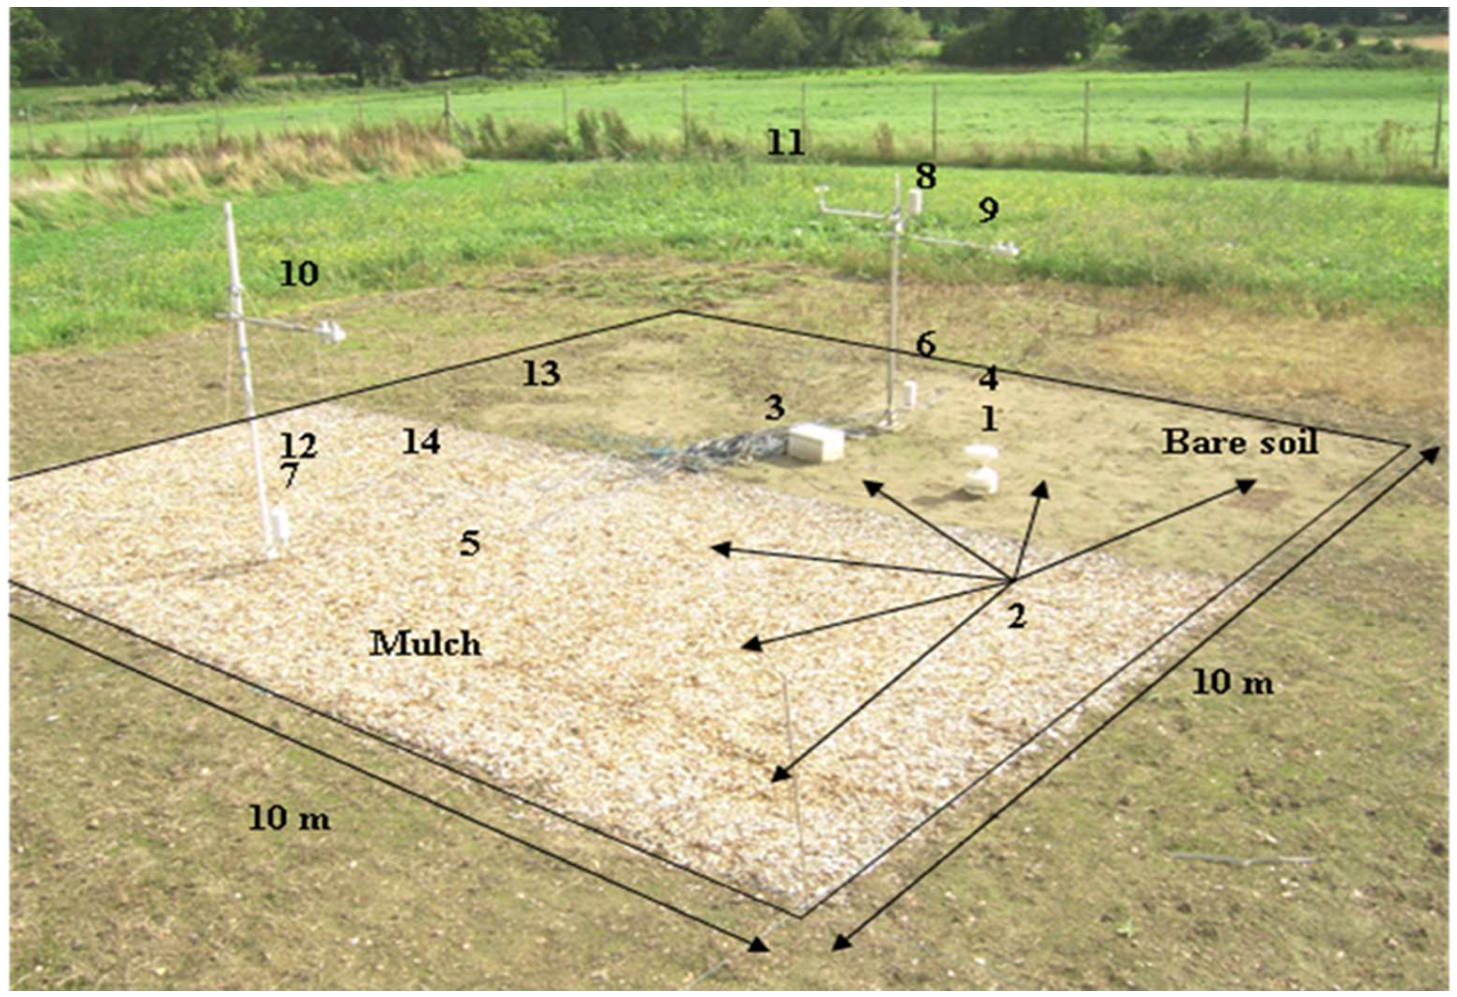
A field experiment was conducted from June to October at the Plant Science Unit of the University of Reading, commonly known as Shinfield Farm (SF). The site is situated in Shinfield, Reading, United Kingdom (51°24′38″ N, 0°56′23″ W), at an altitude of approximately 43 m above sea level. The regional climate is classified as sub-humid, and the soil has a sandy loam texture. The experimental setup (
Figure 1) included a combination of micrometeorological instruments, soil sensors, and six microlysimeters installed in bare soil plots to directly measure evaporation. Each microlysimeter was constructed from polyvinyl chloride (PVC) and consisted of two concentric cylinders: an inner pipe (10.3 cm diameter, 15 cm depth) and a slightly larger outer pipe designed to hold the inner unit securely.
The depths and heights adopted for installing the soil and microclimatic sensors were selected according to recommended practices reported in previous field studies, which demonstrated the suitability of these positions for monitoring soil and atmospheric conditions [
16]. The inner pipe was filled with undisturbed soil to preserve its natural structure and sealed at the bottom to prevent drainage. To maintain the accuracy of measurements, the soil within the inner microlysimeters was periodically replaced. Daily gravimetric measurements were performed by weighing each microlysimeter to determine water loss due to evaporation, providing a reliable and direct estimate of soil evaporative fluxes under bare surface conditions.
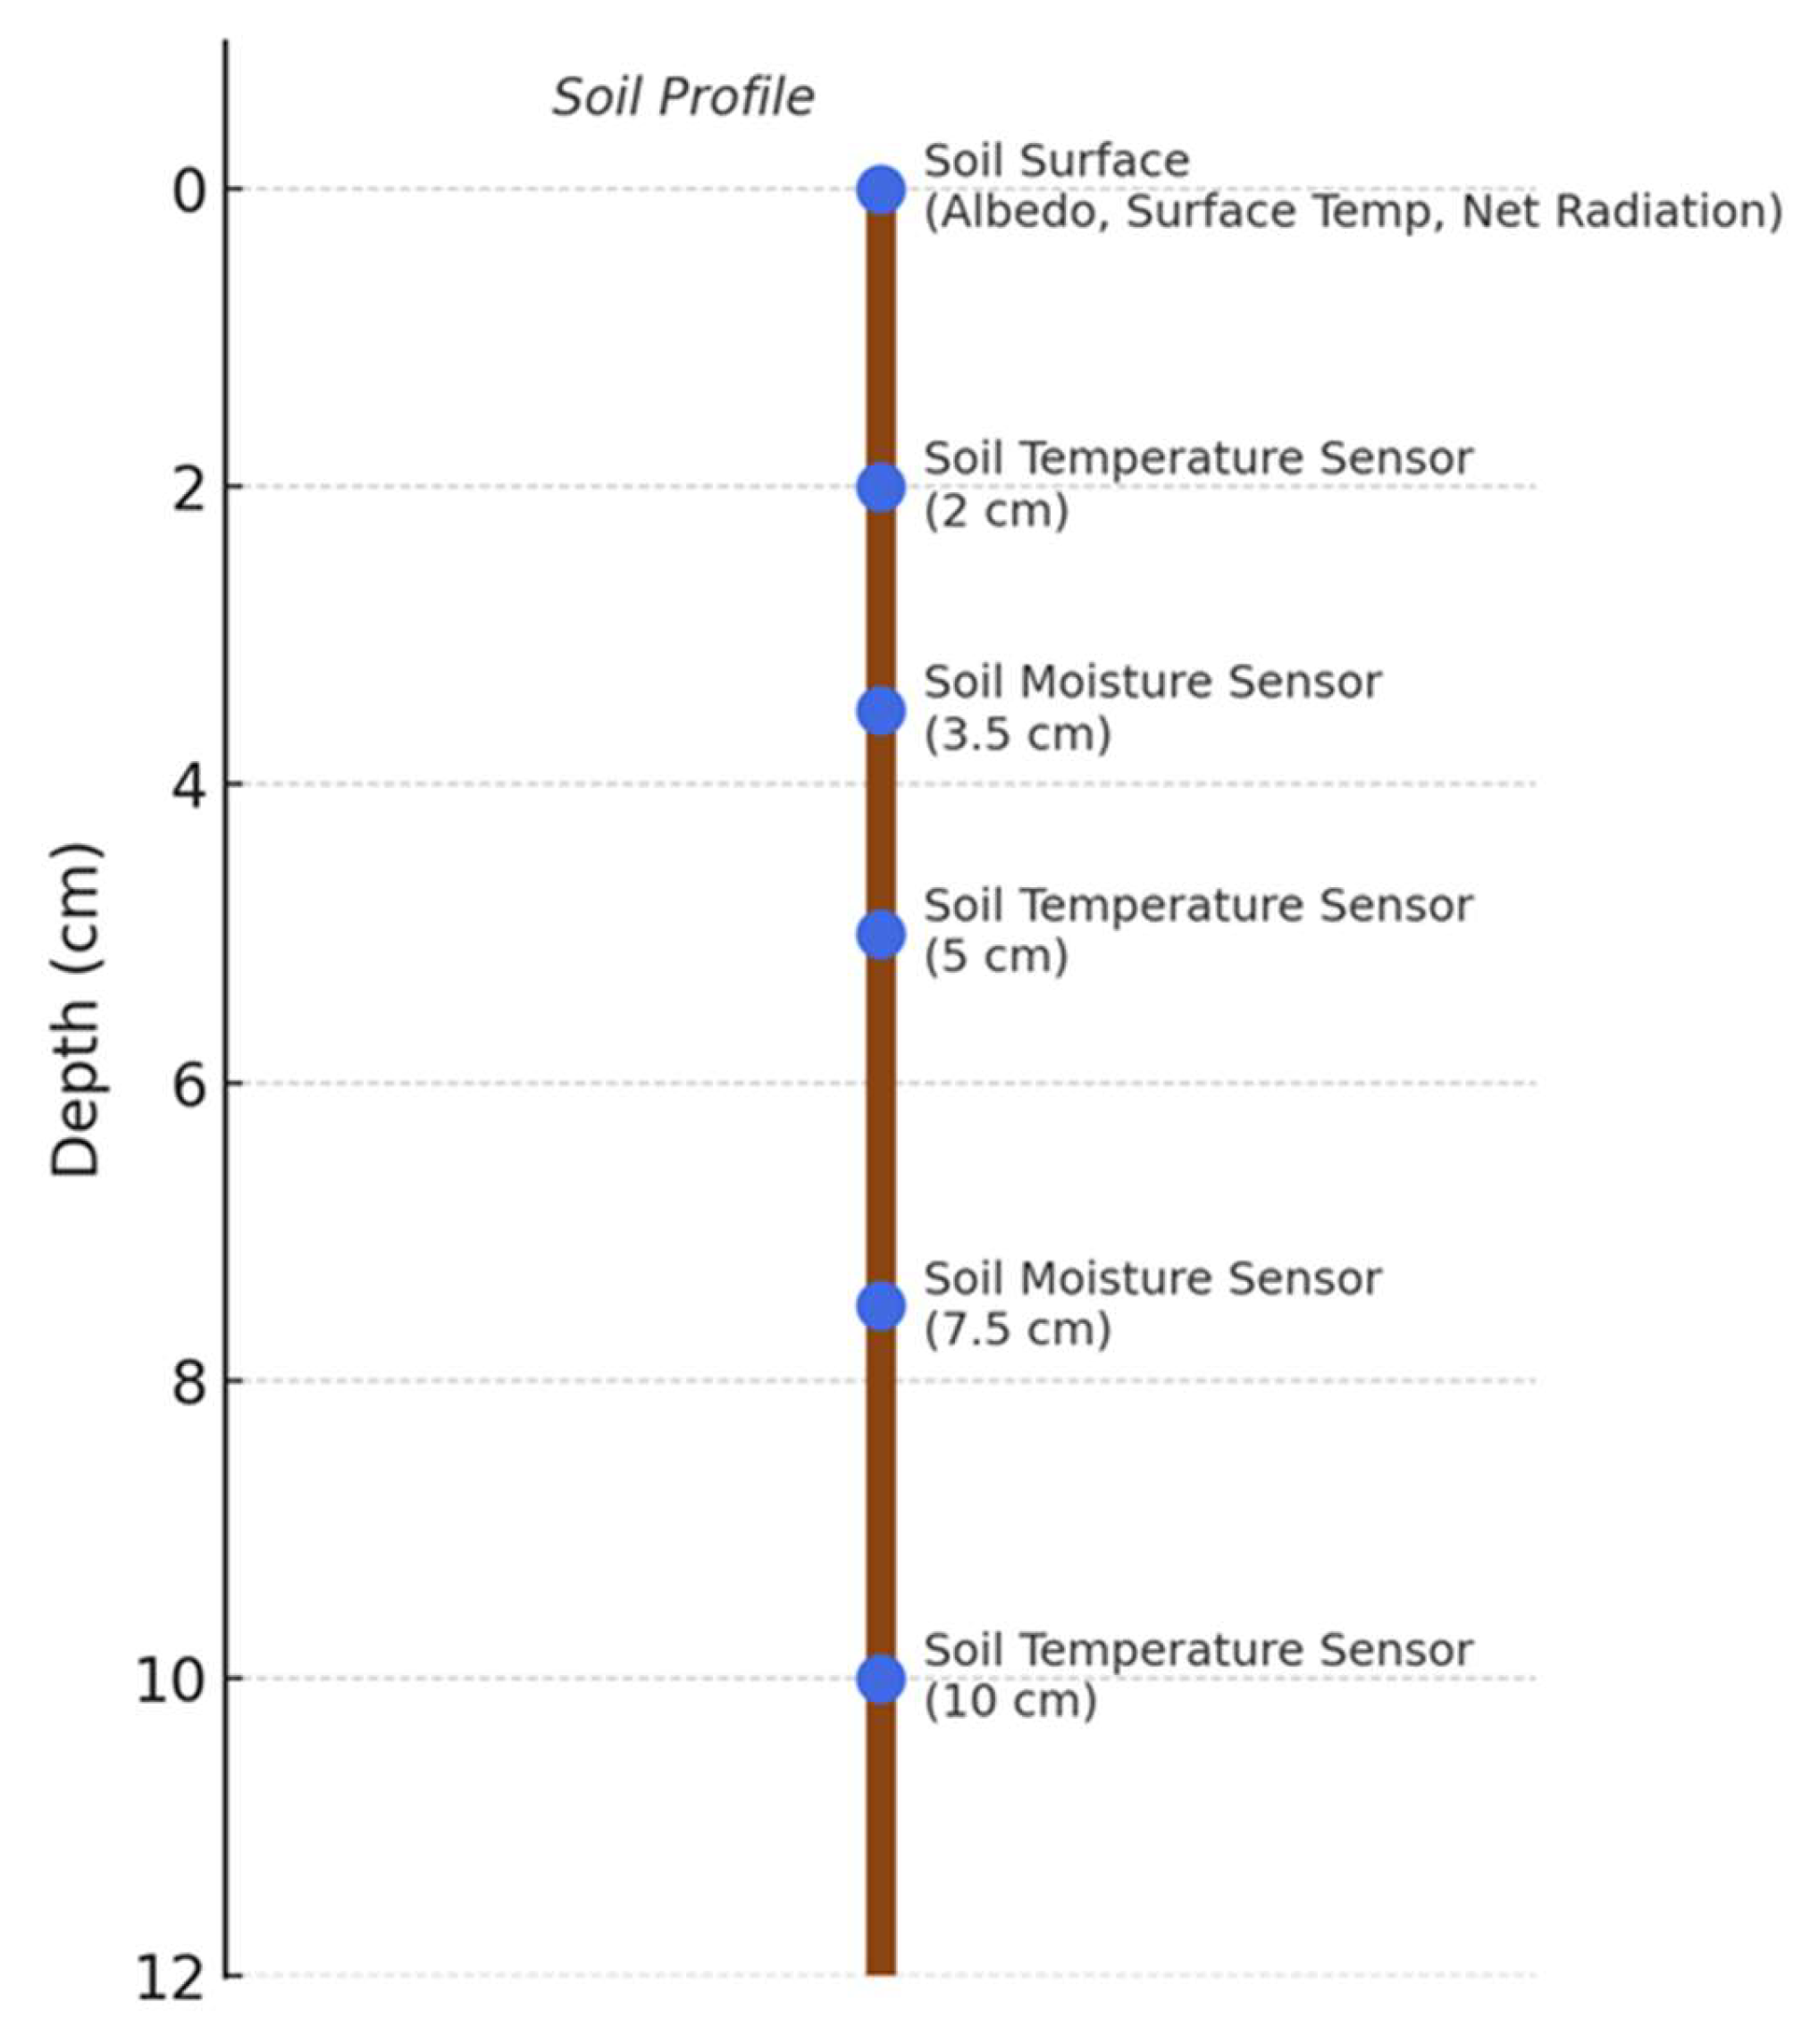
Figure 2 presents a schematic representation of the vertical distribution of the soil sensors within the experimental plot, showing the specific installation depths for soil temperature, soil moisture, and radiative measurements.
2.2. Data Collection
To accurately quantify the components of the surface energy balance and to provide reliable input and validation data for the SiSPAT model, advanced meteorological and soil measurement techniques were employed throughout the experimental period, as detailed in
Table 1.
Regular field inspections and sensor calibrations were conducted to ensure the accuracy, integrity, and consistency of the measurements throughout the study period. Meteorological and soil data were collected at a 30-min interval, resulting in 48 measurements per day, over a 74-day period (DOY 192–266), yielding a total of 3552 measurements. The sensors provided high-resolution data, with an accuracy of ±0.1 °C for soil temperature, ±0.01 m3·m−3 for volumetric soil moisture content, ±1 W·m−2 for net radiation, and ±0.1 W· m−2 for soil heat flux. This comprehensive, state-of-the-art monitoring ensured precise capture of diurnal and seasonal variations in surface energy fluxes and soil moisture dynamics, thereby forming a highly reliable dataset for both model input and validation.
2.3. Integration into the SiSPAT Model
The Simple Soil–Plant–Atmosphere Transfer (SiSPAT) model is a one-dimensional, physically based numerical framework developed to simulate coupled heat and mass transport within the soil–vegetation–atmosphere continuum. Initially introduced by Braud et al. [
17] and later enhanced and documented in its user manuals [
18,
19], SiSPAT has been widely employed in hydrology, soil physics, and micrometeorology. Its applications include studies on land surface energy partitioning, soil moisture dynamics, and evapotranspiration processes under various climatic and soil conditions.
In SiSPAT, soil water movement is modeled by accounting for both liquid and vapor phases. The flow of liquid water in unsaturated soils is described by Richards’ equation, while vapor diffusion is explicitly modeled to address enhanced vapor flow under steep thermal gradients. This is particularly important in scenarios where near-surface evaporation dominates the soil–atmosphere interactions. Soil hydraulic properties are described using parameterizations such as the van Genuchten–Mualem model, which provides the soil water retention curve and unsaturated hydraulic conductivity function.
Soil heat transport is governed by Fourier’s law, incorporating conductive heat flow, convective components associated with water movement, and latent heat effects due to phase change between liquid and vapor water. This allows the model to simulate transient thermal profiles under realistic field conditions, capturing both seasonal and diurnal variability.
The surface energy balance is a central component in SiSPAT and is expressed as Equation (1).
where
λE represents latent heat flux from evaporation,
Rn is net radiation,
H is the sensible heat flux, and
G is the ground heat flux. This equation links atmospheric forcing to soil processes and is dynamically driven by incoming solar radiation, air temperature, humidity, and wind speed. Although the current study focused exclusively on bare soil evaporation, the model is also capable of simulating plant water uptake through a root extraction module. This module is based on a resistance approach that couples root distribution and soil hydraulic gradients, thereby allowing integration of vegetation effects when needed [
17].
Model inputs are comprehensive and include:
Meteorological forcing: incoming shortwave and longwave radiation, precipitation, air temperature, relative humidity, wind speed, and atmospheric pressure. These are typically provided at hourly intervals.
Soil physical properties: texture, porosity, and bulk density.
Hydraulic properties: saturated hydraulic conductivity and soil water retention parameters.
Thermal properties: volumetric heat capacity and thermal conductivity.
The model also requires initial conditions in the form of vertical profiles of soil temperature and water content. Boundary conditions are defined at both the surface (coupled energy and mass exchange with the atmosphere) and the bottom of the domain, which may be either free drainage or a specified pressure or temperature boundary.
The output variables generated by SiSPAT include high-resolution vertical profiles of soil temperature and moisture, liquid and vapor fluxes within the soil matrix, surface evaporation rates, and surface energy flux components such as net radiation, sensible heat, latent heat, and soil heat flux. These outputs are produced at fine temporal intervals and are particularly suited for comparison within situ measurements and for the validation of physically based energy balance models.
2.4. SiSPAT Model Configuration and Simulation Approach
The simulation period extended from 10 July (DOY 192) to 22 September (DOY 266), coinciding with the main phase of soil drying and energy exchange dynamics. The soil profile was discretized into five horizons, subdivided into a total of 100 numerical layers, enabling fine vertical resolution of thermal and hydraulic processes across the soil column. The detailed physical and hydraulic properties for each soil horizon are presented in
Table 2. To represent the soil water retention characteristics, the Brooks and Corey model was employed. This model has been effectively used in previous studies, such as Akhmetov et al. [
20], to derive soil water retention curves from observed soil texture data. Additionally, the saturated hydraulic conductivity (
Ksat) was estimated from particle size distribution data and used to compute the unsaturated hydraulic conductivity function
K(
θ).
Upper boundary conditions at the soil surface incorporated both soil heat flux and mass (water) flux, which were derived from measured meteorological variables and surface energy balance components. At the lower boundary, a sinusoidal time function was prescribed for both soil matric potential and soil temperature to reflect dynamic subsoil interactions and seasonal fluctuations. This sinusoidal representation was chosen because it provides a simple yet realistic approximation of the natural periodic variation in subsoil temperature and matric potential, a method widely used in SVAT applications. Similarly, cloud cover was parameterized to account for its influence on atmospheric transmissivity and incoming radiation when direct high-resolution measurements were not available. While these approaches simplify the forcing conditions, they are consistent with previous modeling studies and offer a practical balance between realism and computational efficiency. Initial conditions for the simulations were specified using observed profiles of soil temperature and matric potential collected on 25 July, ensuring consistency with field measurements and model spin-up. Several surface parameters were also specified. The albedo was set as a function of surface soil moisture content to reflect its dynamic nature. Surface emissivity was fixed at 0.97, consistent with values commonly used for moist bare soils. The roughness length for momentum (
zom) was set to 0.01 m, following the values reported by Braud et al. [
17] for comparable surface conditions.
This configuration ensured accurate representation of coupled heat and moisture transport in the upper soil layers and realistic interaction with atmospheric boundary conditions. The high vertical resolution and precise parameterization were crucial for resolving sharp gradients in moisture and temperature, which are characteristic of bare soil surfaces under fluctuating weather conditions.
2.5. Statistical Analysis
The performance of the SiSPAT model was evaluated for variables, including net radiation (Rn), soil heat flux (G), latent heat flux (λE), cumulative evaporation, sensible heat flux (H), soil surface temperature, soil temperature at 2, 5, 10, and 20 cm depth, and soil moisture content (θ) at 3.5, 7.5, 15, and 35 cm depth. For each variable, paired observations and simulated values at the original temporal resolution were used to calculate standard statistical metrics, including the number of paired observations (N), root mean square error (RMSE), coefficient of determination (R2), and mean bias error (Bias) to quantify agreement between model predictions and measurements. Calculations were performed using IBM SPSS Statistics (version 29.0, IBM Corp., Armonk, NY, USA). Time steps with missing or invalid observations were excluded from the analysis.
3. Results
This section presents a comprehensive evaluation of the SiSPAT model’s performance in simulating surface energy balance components and soil physical conditions under bare soil in a temperate oceanic climate. The assessment includes simulations of net radiation (Rn), soil heat flux (G), latent heat flux (λE), and sensible heat flux (H), as well as vertical profiles of soil temperature and moisture. Each subsection compares the simulated outputs with corresponding field measurements, providing interpretive insights into the model’s accuracy, strengths, and limitations across the simulation period. Although the full set of measurements was conducted from 10 July (DOY 192) to 22 September (DOY 266), the graphical representation of the key variables focuses on the period from DOY 217 to 225. This interval was selected not only to highlight the model’s performance during a representative phase of soil-atmosphere interaction, but also because it encompasses a relatively stable period with minimal external disturbances, allowing clearer observation of energy and moisture flux dynamics. An exception to this timeframe is the presentation of soil moisture profiles, which were illustrated over an extended period from DOY 217 to 265. This longer duration was chosen to capture the gradual evolution of soil water content under sustained dry conditions and to evaluate the model’s ability to reproduce moisture redistribution over time. Since changes in soil moisture occur more slowly than flux responses, and are influenced by cumulative processes such as evaporation, drainage, and capillary rise, a longer observation window was necessary to assess the temporal accuracy of the model’s hydrological behavior.
3.1. Net Radiation (Rn)
The balance between all incoming and outgoing radiation fluxes at the soil–atmosphere interface serves as the principal energy source driving surface processes, including evaporation, sensible heat exchange, and soil heat flux. Accurate simulation of this component is fundamental for reproducing the surface energy balance and its partitioning throughout the soil–vegetation–atmosphere continuum.
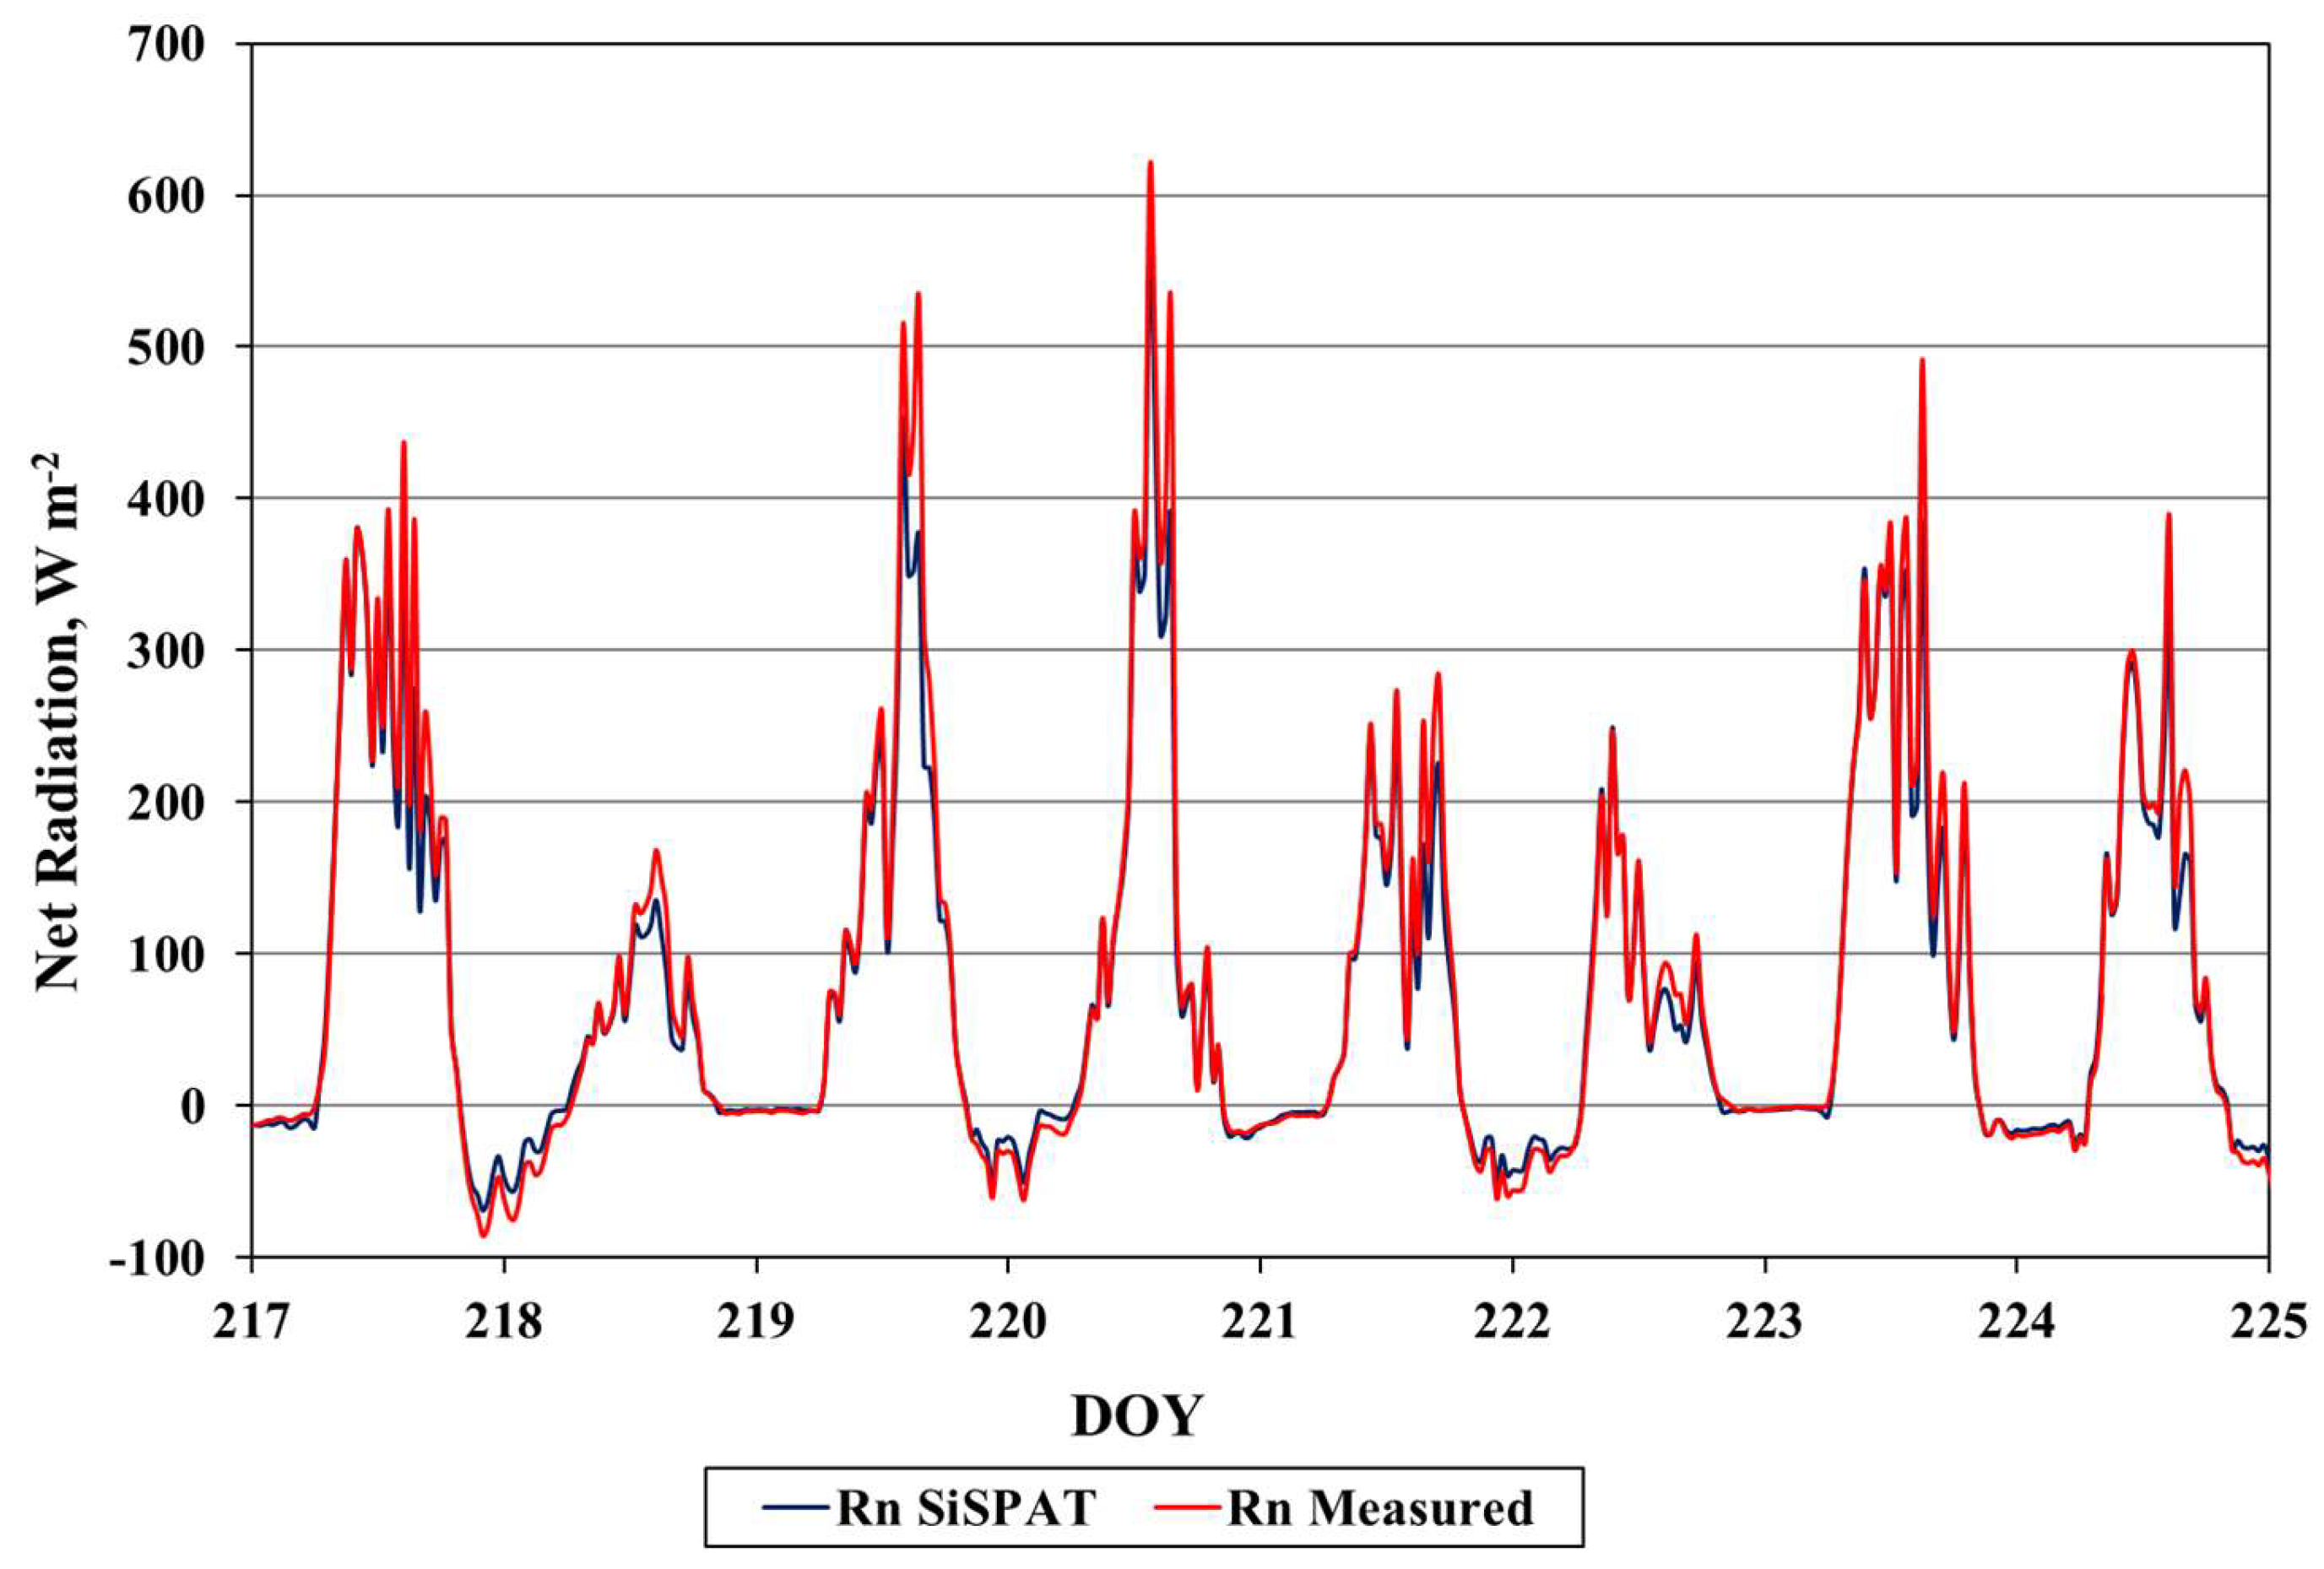
Figure 3 presents a detailed comparison between the measured and simulated values of net radiation (
Rn) produced by the SiSPAT model for the period extending from DOY 217 to DOY 225.
The SiSPAT model demonstrated a strong capability in reproducing the net radiation dynamics observed during the measurement period. It accurately captured the amplitude, general shape, and phase of the diurnal cycles across the nine consecutive days under bare-soil conditions. During early morning hours, the model outputs closely aligned with the measured Rn values, indicating precise simulation of the evolution of solar angles and radiative fluxes during low-sun periods. Similarly, during late afternoon hours, the model correctly reproduced the decline in net radiation as solar elevation decreased, matching the observed timing and rate of radiation decay.
The model also successfully predicted the timing and magnitude of peak radiation around solar noon for most days. On DOY 217, 218, 220, 222, 223, and 224, the simulated Rn closely followed the measured peaks, capturing both the phase and amplitude of the midday maximum. On DOY 219 and 221, minor deviations were observed, with simulated Rn slightly underestimating the measured peak values. These deviations can be attributed to the model’s treatment of surface albedo as a dynamic variable responsive to changes in soil moisture content in the upper layers. As the top 1–2 cm of soil dried rapidly while the underlying layers retained moisture, the model increased surface albedo, which temporarily reduced shortwave radiation absorption. This effect is physically justified and enhances the realism of radiative processes in the model, but it occasionally results in small underestimations of net radiation during periods of high solar input.
In addition to these midday discrepancies, minor differences between measured and simulated Rn were observed during transient cloudy periods. These variations are likely due to simplifications in estimating cloud cover and atmospheric transmissivity within the model. Since direct radiation measurements were not always available, the model relied on empirical relationships and parameterized inputs, which may not fully capture the temporal variability and spatial heterogeneity of cloud dynamics.
3.2. Soil Heat Flux (G)
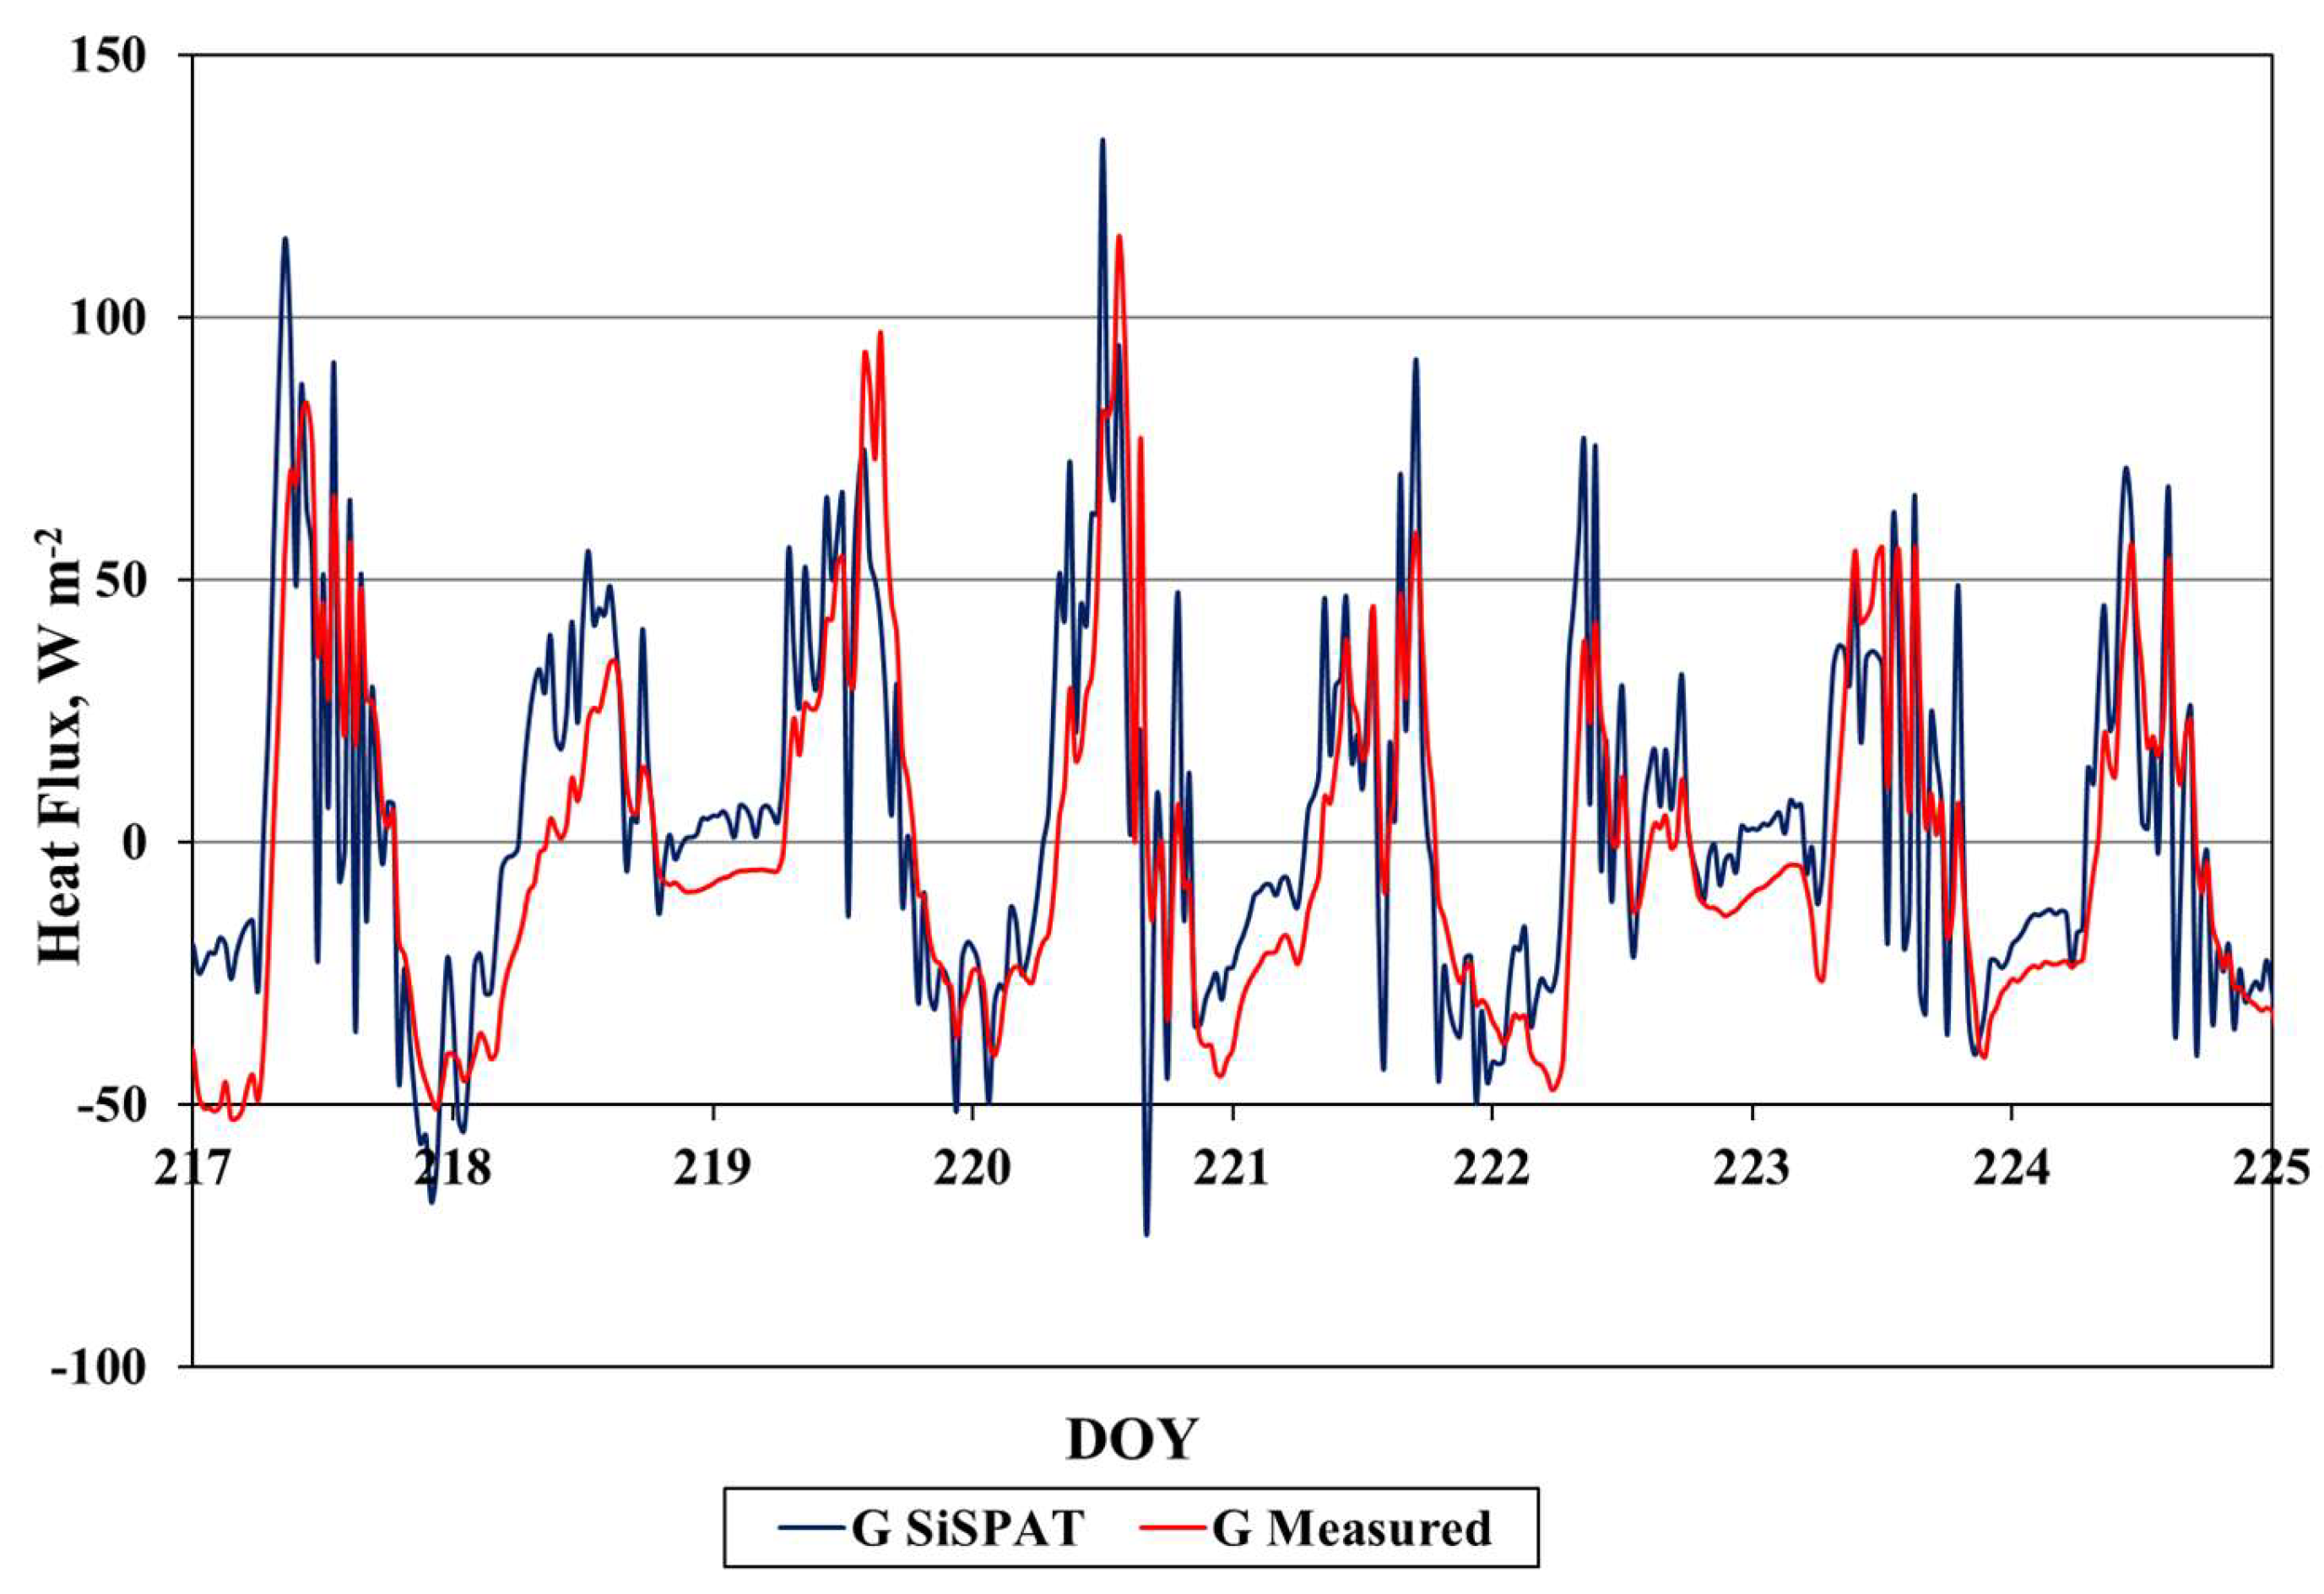
Soil heat flux represents the portion of net radiation that is either conducted downward into the soil profile during the daytime or released upward from the soil during the nighttime, and it is a critical component of the surface energy balance, particularly under bare-soil conditions where the absence of vegetation allows direct radiation to act upon the soil surface, as shown in
Figure 4, which illustrates the diurnal evolution of soil heat flux (
G) as simulated by the SiSPAT model and compared with corresponding measured values for the period extending from DOY 217 to DOY 225. Understanding and accurately simulating
G is essential for capturing the dynamics of subsurface energy storage and release, which influence both soil temperature regimes and feedback to atmospheric processes. The simulation results indicate that the SiSPAT model can reproduce the general shape, timing, and sign of soil heat flux with reasonable fidelity. During daytime hours,
G typically exhibits positive values, corresponding to the conduction of heat from the warmed surface into the soil layers. Conversely, during nighttime periods,
G shifts to negative values as heat stored in the upper soil layers is released upward, contributing to surface cooling and subsequent energy loss to the atmosphere. The SiSPAT model accurately replicated this diurnal alternation in direction across all days in the study period, suggesting that its thermal boundary conditions and surface flux formulations are physically appropriate and dynamically responsive. However, despite this consistency in trend, some underestimation was observed in the amplitude of simulated
G values, particularly around the midday peaks on DOY 219 and DOY 223.
These two days were characterized by clear-sky conditions and elevated levels of net radiation, which intensified surface heating and, consequently, the expected magnitude of soil heat conduction. The model’s tendency to slightly underestimate G under such conditions may be attributed to how thermal conductivity (λ) is estimated within SiSPAT. The model computes λ as a function of soil water content (θ), a method that captures the general decline of conductivity with drying but may not fully reflect the sharp, nonlinear reduction in λ that occurs in desiccated surface soils. When soil becomes very dry, particularly within the uppermost centimeter, the thermal connectivity among particles diminishes dramatically, reducing actual heat conduction rates. If the model fails to represent this behavior precisely, it may overestimate conductivity, thereby underestimating the temperature gradient required to drive a given flux, ultimately reducing the simulated G amplitude.
Another possible contributing factor is the vertical resolution of the soil profile used in the model. In many SVAT models, including SiSPAT, thermal properties are computed for discretized layers spanning several centimeters. If the upper boundary layer—where the largest temperature gradients and diurnal changes occur is averaged over a thicker zone, the distinct thermal dynamics of the very topsoil may be smoothed out. This smoothing effect can reduce the sensitivity of simulated heat flux to rapid surface warming and cooling, leading to muted G responses during periods of intense radiative forcing.
Despite these limitations, the SiSPAT model demonstrated strong consistency in capturing the directionality and temporal evolution of soil heat flux. The transition from positive daytime fluxes (heat storage) to negative nighttime fluxes (heat release) occurred at appropriate times, reflecting the model’s ability to represent changes in surface temperature, thermal diffusivity, and heat capacity with physical realism. The timing and phase of the simulated fluxes were well-aligned with observed patterns, indicating that the model handles the energy storage and transfer mechanisms between the surface and subsurface layers reliably under bare-soil conditions.
While residual errors in G remain, particularly in terms of magnitude, they fall within acceptable bounds for field-scale modeling applications. Given the spatial variability, measurement uncertainty, and soil heterogeneity inherent in field experiments, such discrepancies are common and do not significantly undermine the model’s overall performance. Importantly, although soil heat flux generally accounts for a smaller fraction of the total surface energy budget when compared to net radiation (Rn) and sensible heat flux (H), it plays a crucial role in closing the energy balance and in determining the thermal behavior of the soil system. A realistic simulation of G is therefore vital not only for subsurface temperature modeling but also for interpreting the partitioning of available energy among competing surface processes.
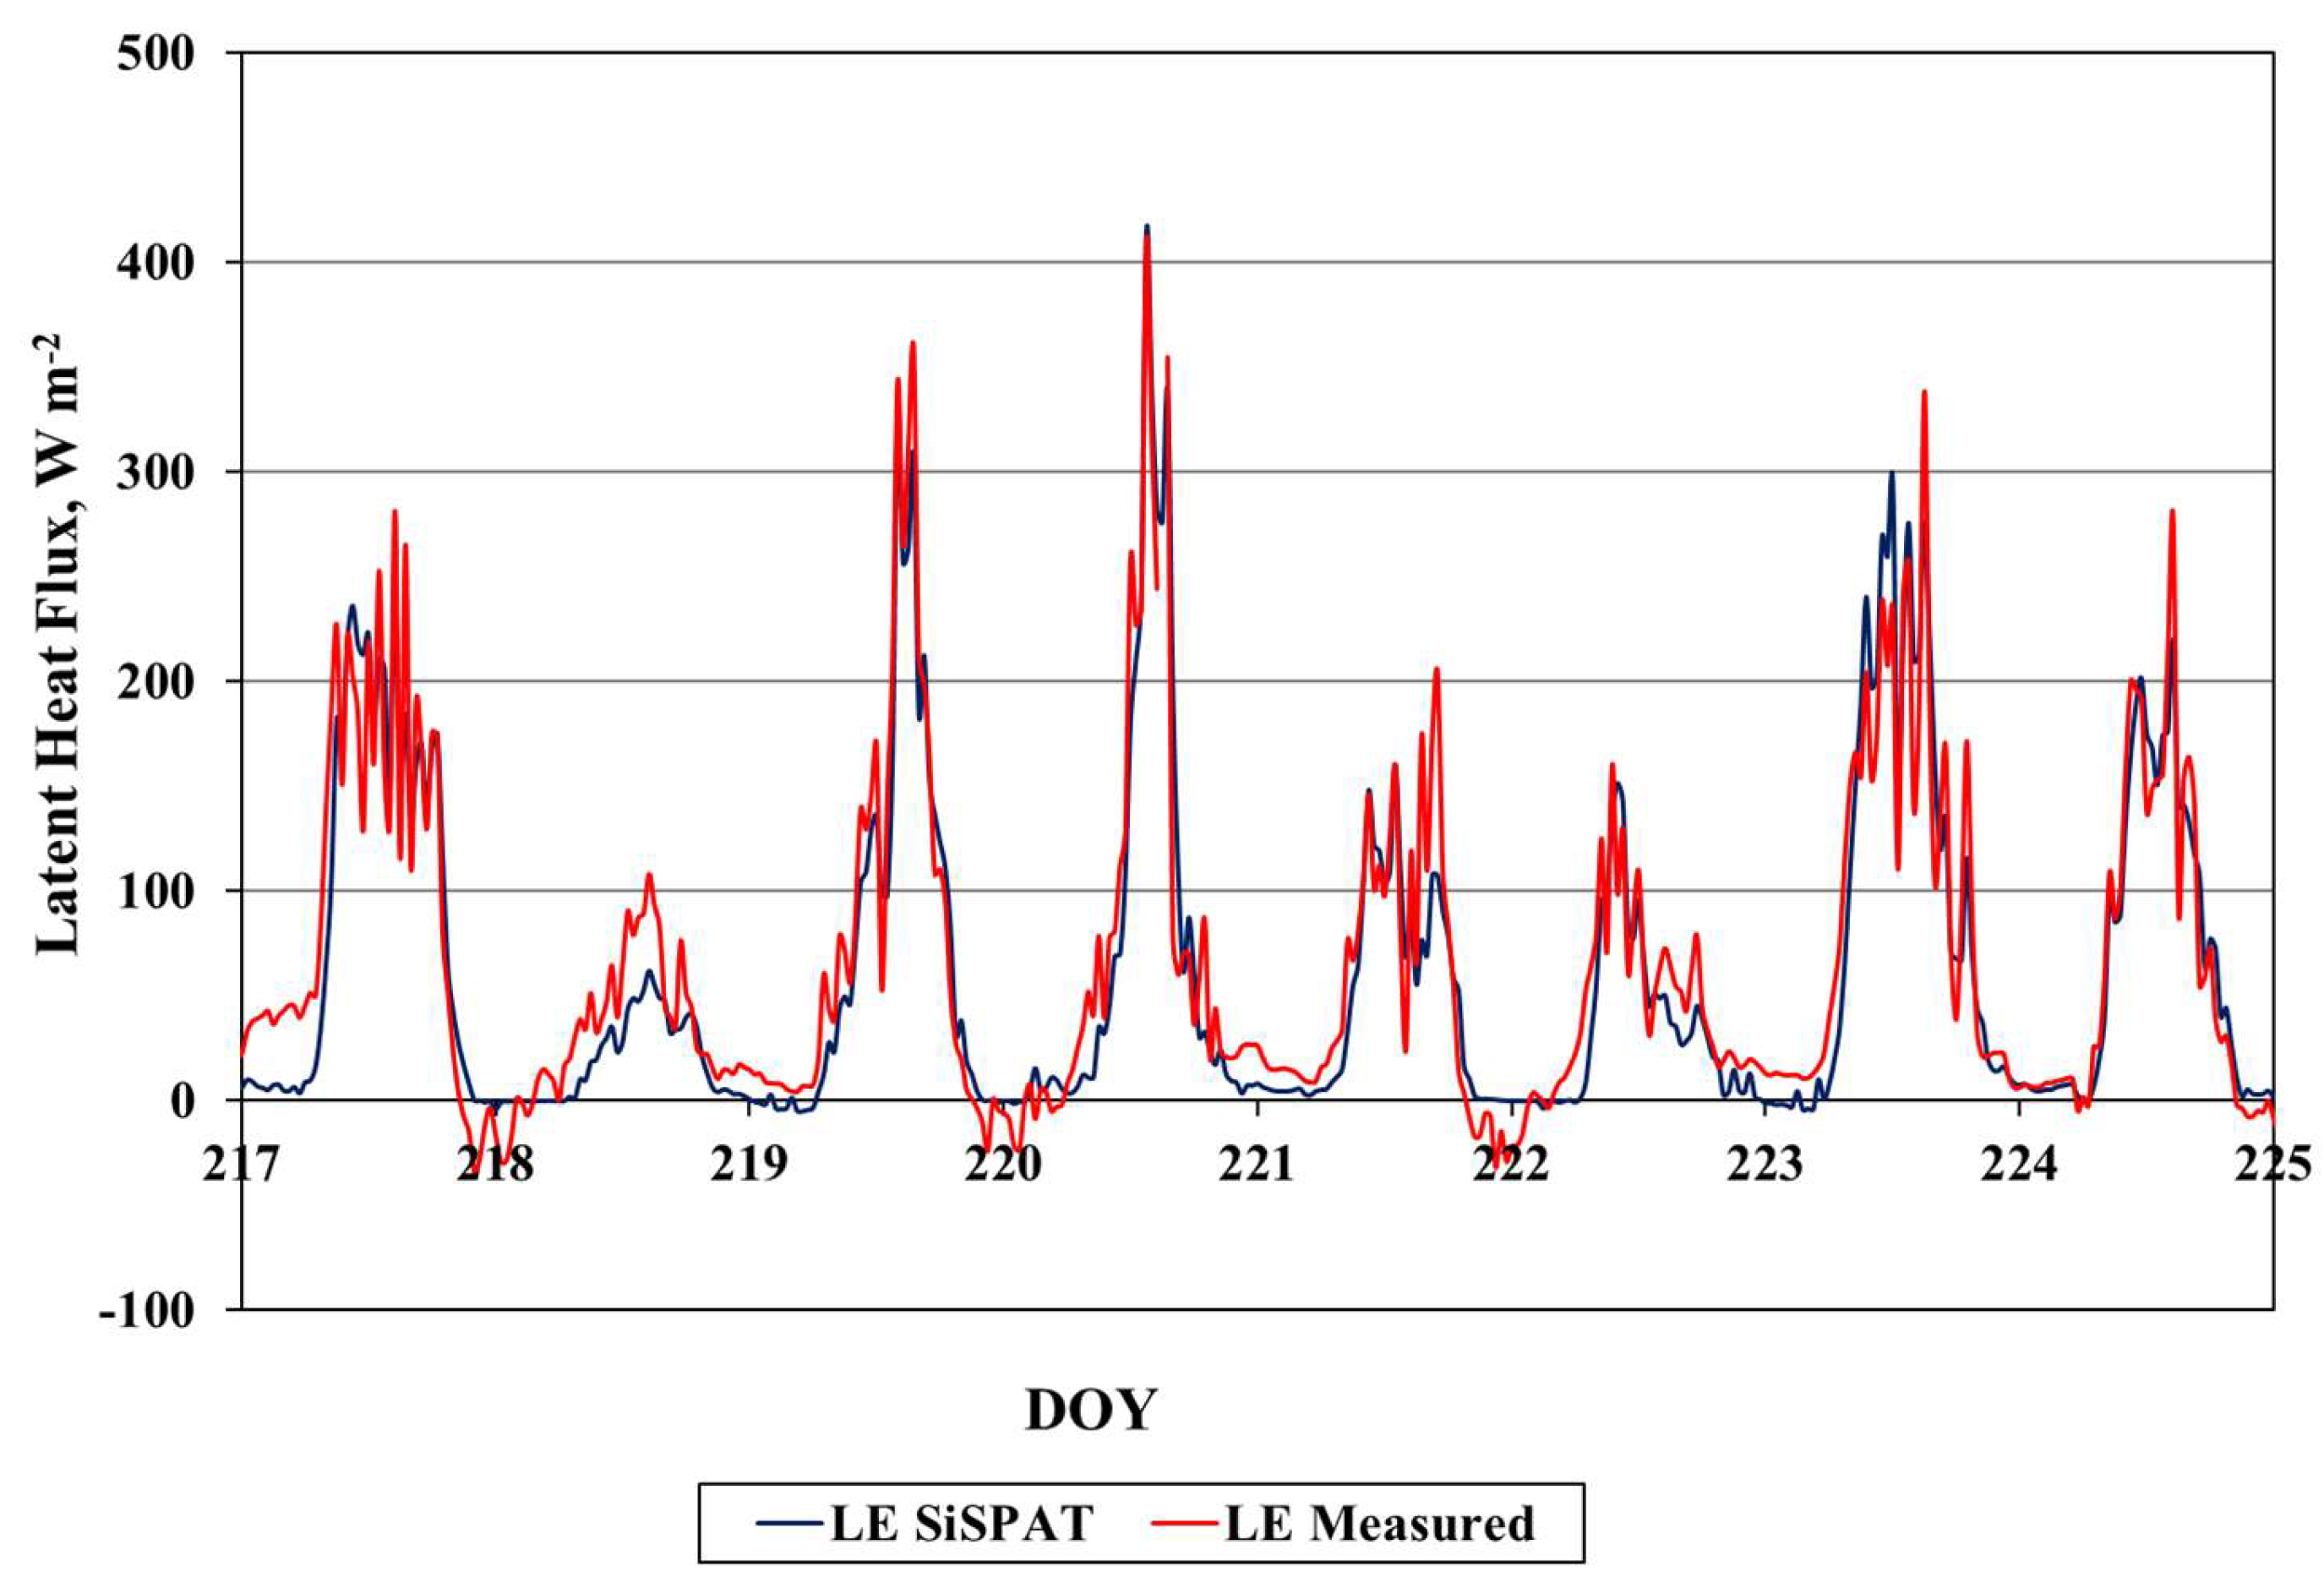
3.3. Latent Heat Flux (λE)
Soil heat flux represents the portion of net radiation that is either conducted downward into the soil profile during daytime or released upward from the soil during nighttime, and it is a critical component of the surface energy balance, particularly under bare-soil conditions where the absence of vegetation allows direct radiation to act upon the soil surface.
Figure 5 illustrates the diurnal evolution of soil heat flux (
G) as simulated by the SiSPAT model and compared with the corresponding measured values for the period extending from DOY 217 to DOY 225. Understanding and accurately simulating
G is essential for capturing the dynamics of subsurface energy storage and release, which influence both soil temperature regimes and feedback to atmospheric processes.
The simulation results indicate that the SiSPAT model can reproduce the general shape, timing, and sign of soil heat flux with high fidelity. During daytime hours, G typically exhibits positive values, corresponding to the conduction of heat from the warmed surface into the soil layers. Conversely, during nighttime periods, G shifts to negative values as heat stored in the upper soil layers is released upward, contributing to surface cooling and subsequent energy loss to the atmosphere. The SiSPAT model accurately replicated this diurnal alternation in direction across all days in the study period, suggesting that its thermal boundary conditions and surface flux formulations are physically appropriate and dynamically responsive.
Minor underestimations in the amplitude of simulated G values were observed, particularly during periods of intense midday radiation on DOY 219 and DOY 223. The two days in question were characterized by clear-sky conditions and elevated levels of net radiation, which intensified surface heating and, consequently, the expected magnitude of soil heat conduction.
The model’s tendency to slightly underestimate G under these conditions may be attributed to several technical factors. First, thermal conductivity (λ) within SiSPAT is computed as a function of soil water content (θ), a method that captures the general decline of conductivity with drying but may not fully reflect the sharp, nonlinear reduction in λ that occurs in desiccated surface soils. When soil becomes very dry, particularly within the uppermost centimeter, the thermal connectivity among particles diminishes dramatically, reducing actual heat conduction rates. If the model does not precisely represent this behavior, it may overestimate conductivity, thereby underestimating the temperature gradient required to drive a given flux, ultimately reducing the simulated G amplitude.
Another contributing factor is the vertical resolution of the soil profile used in the model. In many SVAT models, including SiSPAT, thermal properties are computed for discretized layers spanning several centimeters. If the upper boundary layer—where the largest temperature gradients and diurnal changes occur is averaged over a thicker zone, the distinct thermal dynamics of the very topsoil may be smoothed out. This smoothing effect can reduce the sensitivity of simulated heat flux to rapid surface warming and cooling, leading to muted G responses during periods of intense radiative forcing.
Despite these factors, the SiSPAT model demonstrated strong consistency in capturing the directionality and temporal evolution of soil heat flux. The transition from positive daytime fluxes (heat storage) to negative nighttime fluxes (heat release) occurred at appropriate times, reflecting the model’s ability to represent changes in surface temperature, thermal diffusivity, and heat capacity with physical realism. The timing and phase of the simulated fluxes were well-aligned with observed patterns, indicating that the model reliably handles the energy storage and transfer mechanisms between surface and subsurface layers under bare-soil conditions.
While residual errors in G remain, particularly in terms of magnitude, they fall within acceptable bounds for field-scale modeling applications. Given the spatial variability, measurement uncertainty, and soil heterogeneity inherent in field experiments, such discrepancies are common and do not significantly undermine the model’s overall performance. Although soil heat flux generally accounts for a smaller fraction of the total surface energy budget compared to net radiation (Rn) and sensible heat flux (H), it plays a crucial role in closing the energy balance and in determining the thermal behavior of the soil system. A realistic simulation of G is therefore vital not only for subsurface temperature modeling but also for interpreting the partitioning of available energy among competing surface processes.
3.4. Cumulative Evaporation
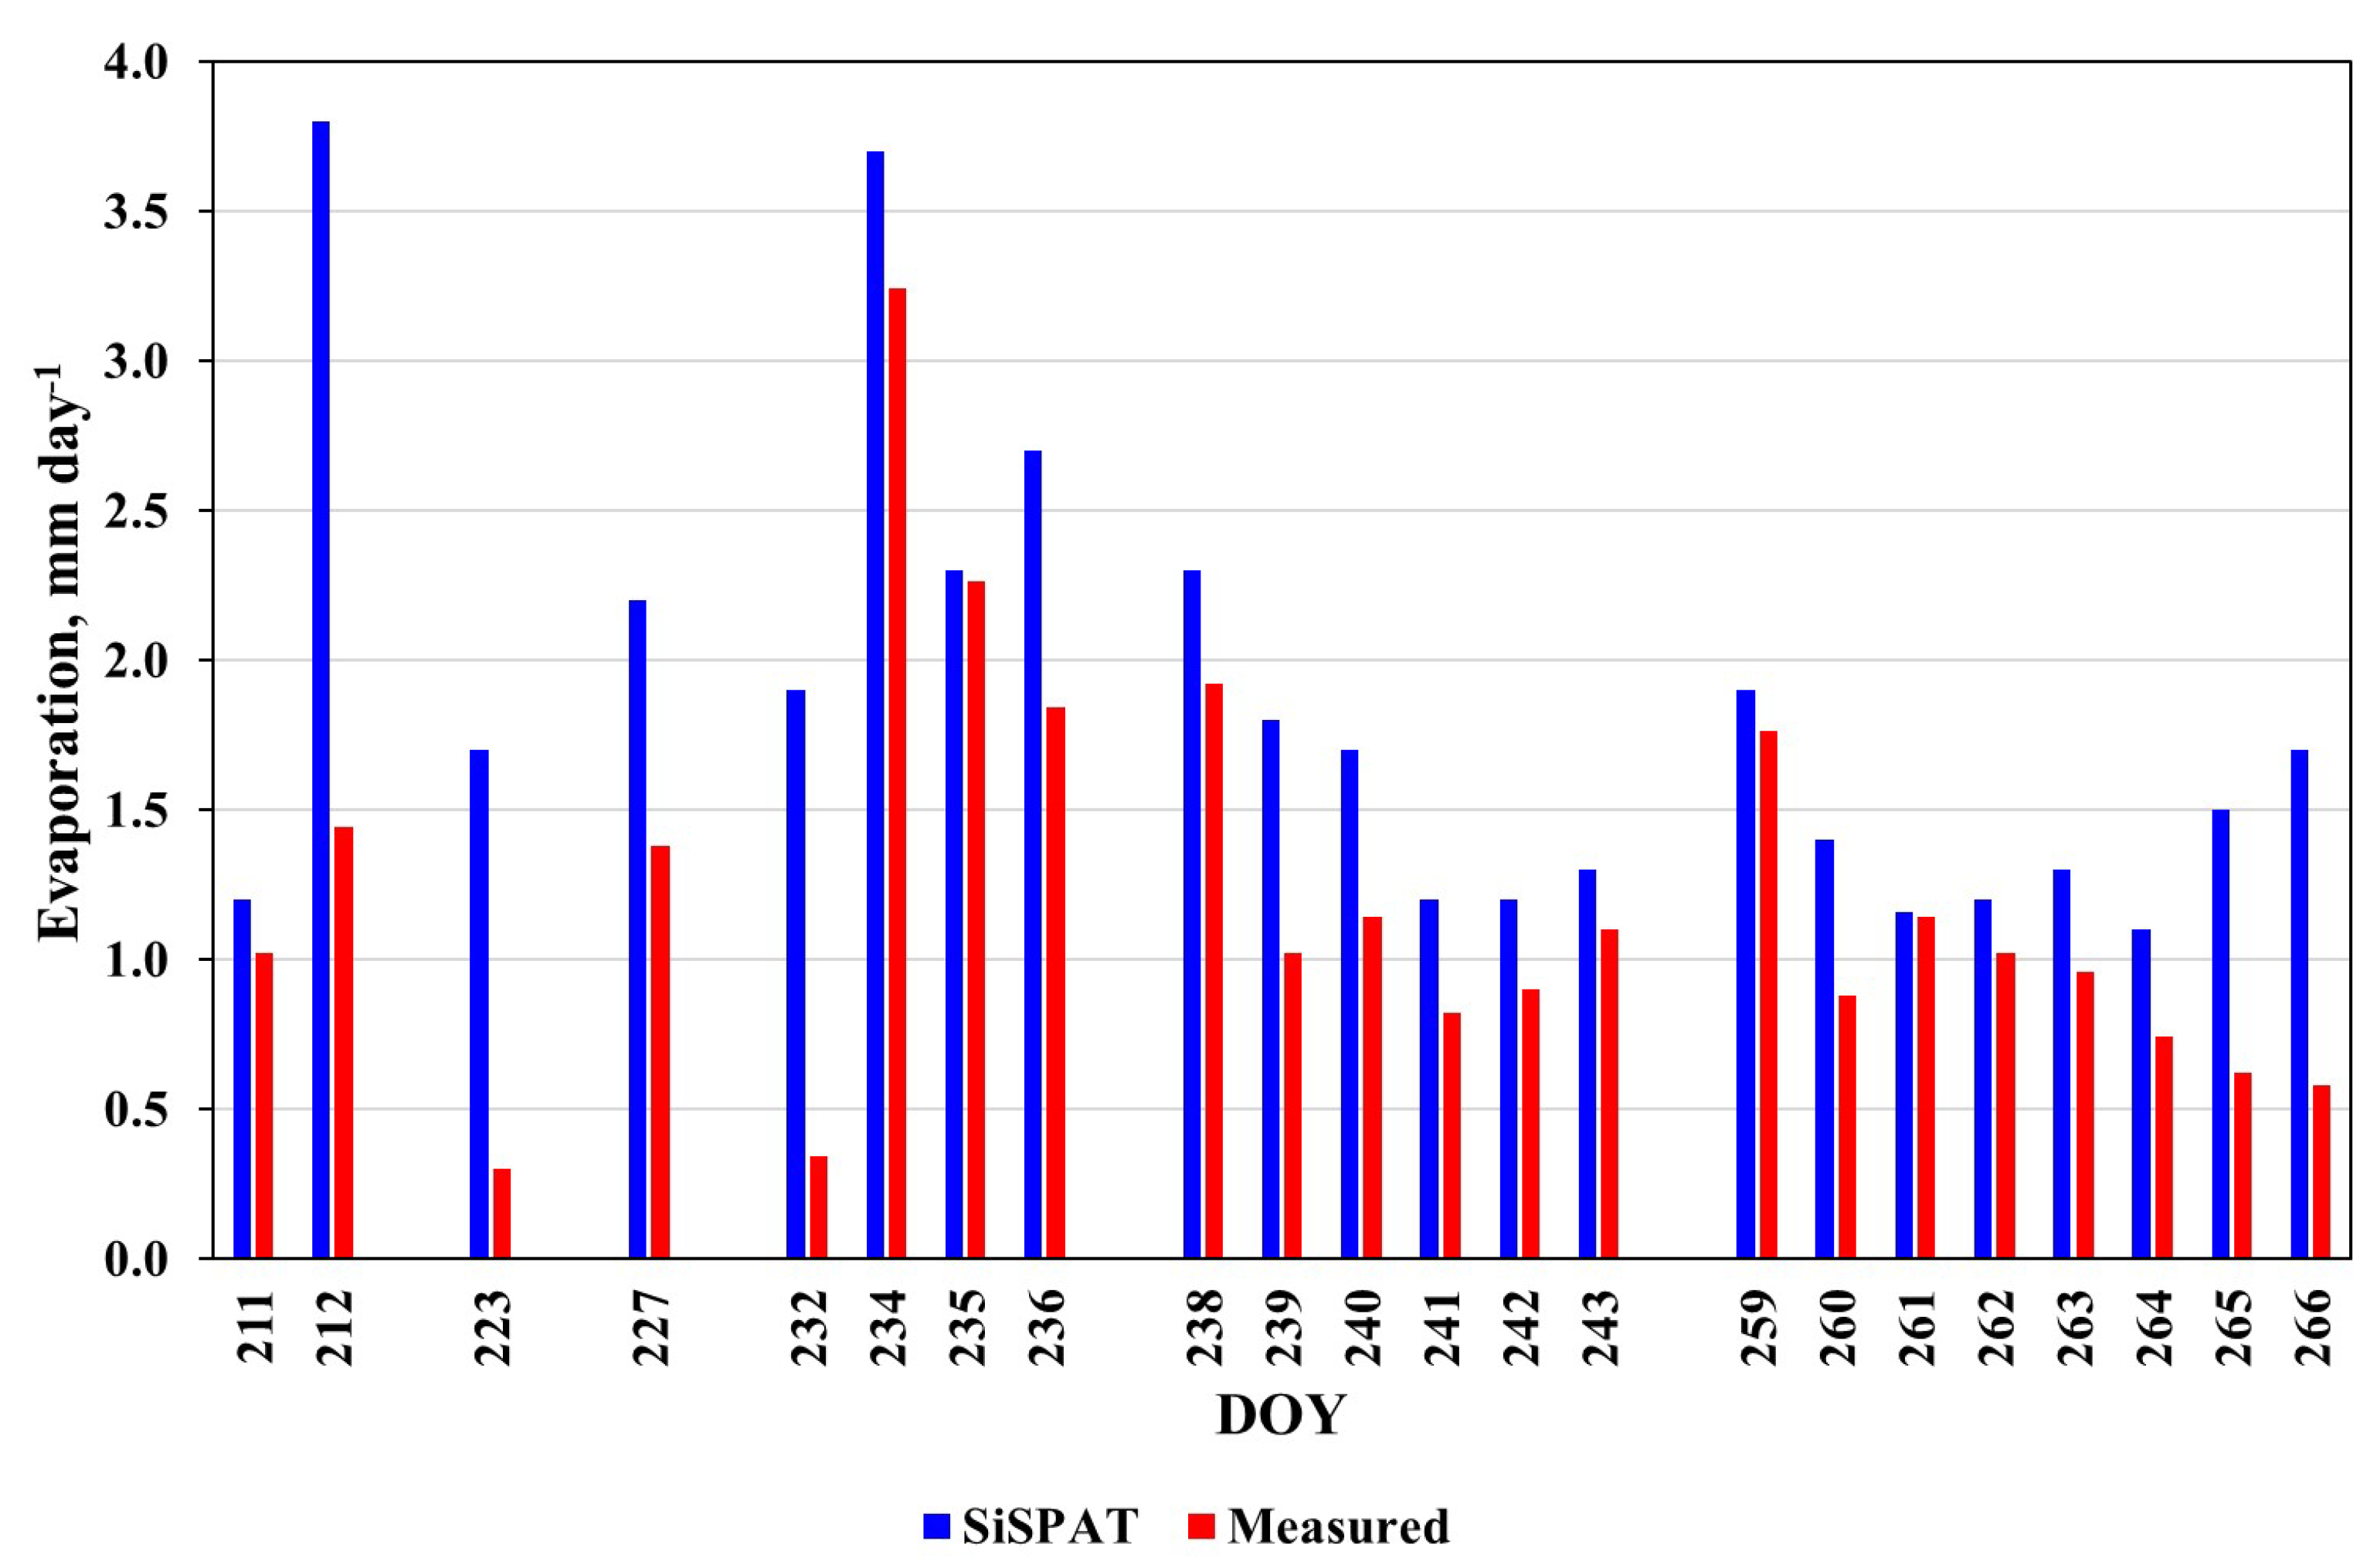
Cumulative evaporation is a critical integrative metric in water balance studies, as it reflects the aggregate effect of transient meteorological conditions, soil moisture dynamics, and soil–atmosphere interactions over time, and
Figure 6 presents a cumulative comparison between measured evaporation obtained using micro-lysimeters and the values simulated by the SiSPAT model. Unlike instantaneous or daily fluxes, cumulative evaporation captures long-term deviations in model performance and highlights systematic biases that may not be evident on shorter timescales. The SiSPAT model tended to overestimate total cumulative evaporation relative to micro-lysimeter measurements, with the most significant overprediction occurring during the wetter portion of the observation period, approximately between DOY 234 and DOY 265. This discrepancy suggests challenges in the model’s ability to simulate surface evaporation under conditions of elevated soil moisture availability, which followed several rainfall events. During this phase, the increase in soil moisture content naturally led to a reduction in surface resistance to vapor flux, thereby enhancing actual evaporation rates. While SiSPAT responded by simulating increased latent heat fluxes, it appears to have overestimated the persistence of elevated surface moisture, maintaining high evaporation rates for longer durations than those observed in the field. Several days of actual evaporation measurements using the micro-lysimeters were not available due to continuous daily rainfall events, which prevented accurate weighing and data collection. These periods appear as gaps in the cumulative evaporation dataset. This behavior points to potential inaccuracies in the model’s representation of moisture redistribution and evaporation regulation mechanisms, especially in the uppermost soil layers.
By contrast, during the earlier and relatively drier phase of the experiment (DOY 211–234), the model’s cumulative evaporation estimates were in closer agreement with the observed values, though occasional deviations were still present. These discrepancies are likely linked to simplifications in the treatment of vapor-phase transport and surface drying processes in the SiSPAT model. The top 1–2 cm of the soil surface plays a dominant role in controlling the onset and intensity of evaporation, but they are also the most difficult to model due to rapid fluctuations in moisture, sensitivity to thermal conductivity, and physical surface changes such as crust formation and microrelief. SiSPAT parameterization may not fully capture the effects of these small-scale phenomena, leading to an over- or underrepresentation of actual surface fluxes.
Another important source of deviation arises from the specification of boundary conditions for both energy and moisture fluxes. If atmospheric demand, commonly expressed as potential evaporation, is not accurately represented—or if it is not properly coupled with the model’s internal constraints on soil water availability—SiSPAT may continue to simulate evaporation even after field conditions no longer support it. This can result in overprediction during periods when surface soil moisture has already declined but the atmospheric forcing remains strong. Furthermore, feedback loops between radiation, heat fluxes, and moisture gradients must be well-resolved in the model to avoid persistence errors in cumulative water loss simulations.
It is also worth noting that differences between modeled and observed cumulative evaporation can be partially attributed to spatial heterogeneity in the measurement technique. Micro-lysimeters sample small, localized volumes of soil, which may not fully represent the spatially averaged surface conditions that are resolved at the model grid scale. Localized variation in infiltration, shading, micro-topography, or surface disturbance can cause measured values to diverge from those simulated by a spatially homogeneous model. Despite these sources of variability, the overall temporal trend of the simulated cumulative evaporation followed the same general trajectory as the observations, indicating that SiSPAT successfully captured the seasonal evolution of surface water loss under bare-soil conditions in a temperate oceanic climate.
This agreement is further supported by the statistical comparison during the wetter period, where the model achieved an R2 value of 0.64, which indicates a moderate level of performance. While this suggests that the model structure is fundamentally sound, it also highlights the need for improvements in the representation of surface drying dynamics. Enhancing the parameterization of topsoil resistance to evaporation, including better formulations for crust development, discontinuous moisture pathways, and non-uniform drying fronts, would likely improve the predictive accuracy of SiSPAT in future applications.
Cumulative evaporation outputs are of special importance in practical domains such as irrigation scheduling, water resource planning, and dryland hydrology. In such contexts, small systematic errors in daily evaporation rates can accumulate into large discrepancies over time, potentially leading to suboptimal decisions. Therefore, refining the evaporation module, especially under variable moisture regimes and dynamic atmospheric conditions, will be a key step toward extending the utility of the SiSPAT model in environmental modeling and agricultural forecasting in temperate oceanic climates.
3.5. Sensible Heat Flux (H)
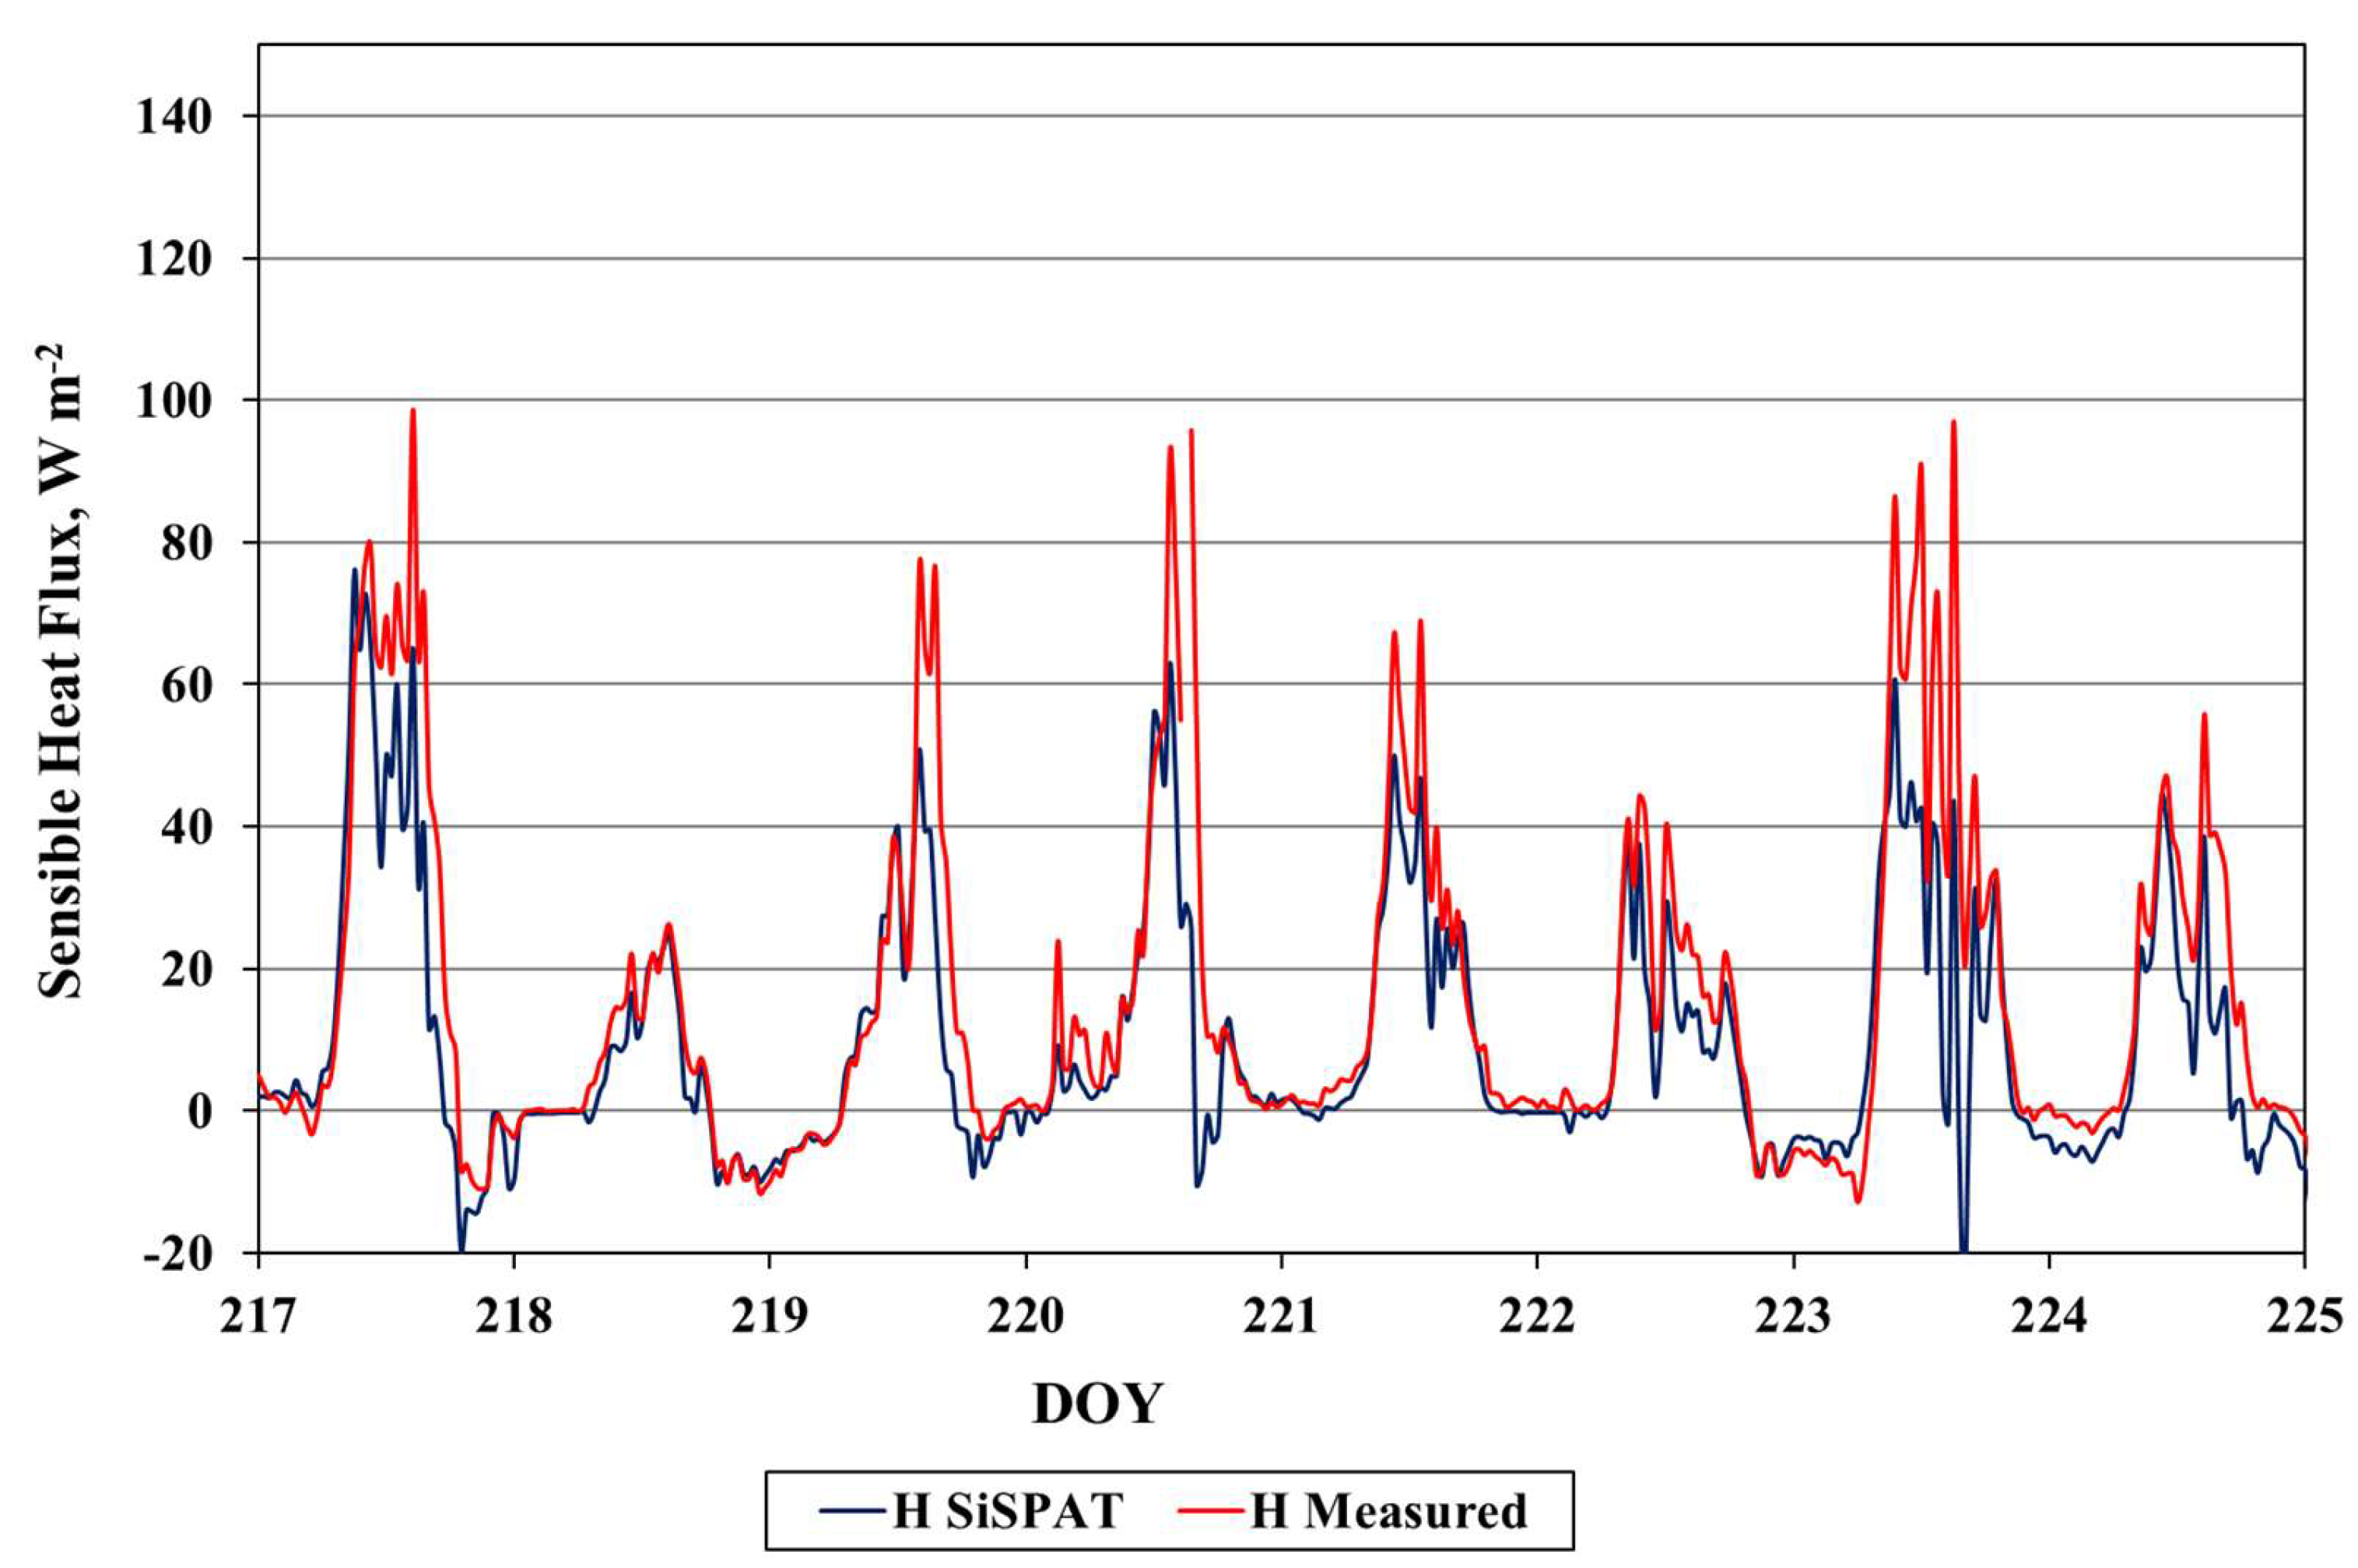
Sensible heat flux (
H) represents the rate of energy transfer from the soil surface to the overlying atmosphere driven by temperature gradients, and it constitutes a vital component of the surface energy balance, particularly under bare-soil conditions typical of temperate oceanic climates. In these environments, the direct exposure of the soil to solar radiation intensifies surface heating, producing pronounced diurnal variations in
H.
Figure 7 presents a detailed comparison between the measured sensible heat flux values and the outputs simulated by the SiSPAT model for the period spanning DOY 217 to DOY 225. Accurately modeling
H is essential for characterizing the dynamics of heat exchange between the land surface and the lower atmosphere, which influences local microclimatic conditions and feedback to the broader atmospheric boundary layer.
Throughout the simulation period, the SiSPAT model successfully captured the diurnal evolution of H, including the timing of flux increases in the morning, peak values around midday, gradual declines in the afternoon, and near-zero or slightly negative fluxes at night reflecting minimal or reversed heat transfer under stable nocturnal conditions. Despite this temporal fidelity, the model consistently underestimated the magnitude of H during midday hours, particularly on DOY 219 and DOY 221, which were characterized by strong solar radiation and elevated surface temperatures. These days correspond to the steepest surface-to-air temperature, which drive maximum energy transfer from soil to atmosphere. This underestimation reflects a systematic bias in the simulation of the key driving variables for H, primarily the surface temperature (Ts) and aerodynamic resistance.
The underestimation of H is largely attributed to the model’s underestimation of surface temperature (Ts) during peak radiation periods. Since sensible heat flux is directly governed by the magnitude of the surface-to-air temperature gradient, any suppression in predicted Ts proportionally reduces the simulated H. In addition, the model’s representation of aerodynamic resistance contributes to the observed underprediction. In SiSPAT, aerodynamic resistance is calculated using simplified formulations that assume fixed or semi-empirical values for surface roughness, canopy height, and stability corrections. These assumptions may be insufficient to account for dynamically changing atmospheric conditions, particularly during unstable midday periods when thermal convection enhances turbulent mixing. In real field conditions, additional factors such as soil microrelief, surface crusting, and variability in wind speed further influence turbulent exchange processes. Therefore, the absence of locally calibrated or dynamically responsive aerodynamic parameters limits the model’s ability to fully reproduce peak H values under high-energy scenarios.
It is important to note that the underestimation of H does not occur in isolation. During the same midday periods, the model also underestimated latent heat flux (λE), indicating that the combined surface energy fluxes reflect compensating interactions among the components of the energy balance. Net radiation (Rn) was simulated with high accuracy, and soil heat flux (G) showed good agreement with observations in both trend and timing, suggesting that discrepancies in H and λE are likely associated with redistribution biases and the specific parameterizations of surface processes rather than with a fundamental misrepresentation of total available energy at the soil surface. This highlights the interconnected nature of surface energy fluxes and the challenge of simultaneously achieving precise quantitative predictions for all components in SVAT models, particularly under conditions of strong radiative forcing. Despite these systematic underestimations during midday, the SiSPAT model demonstrates strong capability in reproducing the diurnal pattern and directional behavior of H. The timing of flux transitions, the alignment of daytime heating with afternoon cooling, and the phase consistency with field measurements indicate that the model’s core structural assumptions regarding energy partitioning, thermal diffusivity, and turbulent transport remain valid.
3.6. Soil Surface Temperature
Soil surface temperature (
Ts) serves as a critical upper boundary condition for both heat and moisture transfer processes in soil–atmosphere models, as it directly governs sensible heat flux (
H) and latent heat flux (
λE). Accurate simulation of
Ts is therefore essential for correctly closing the surface energy balance and reproducing coupled soil–atmosphere interactions.
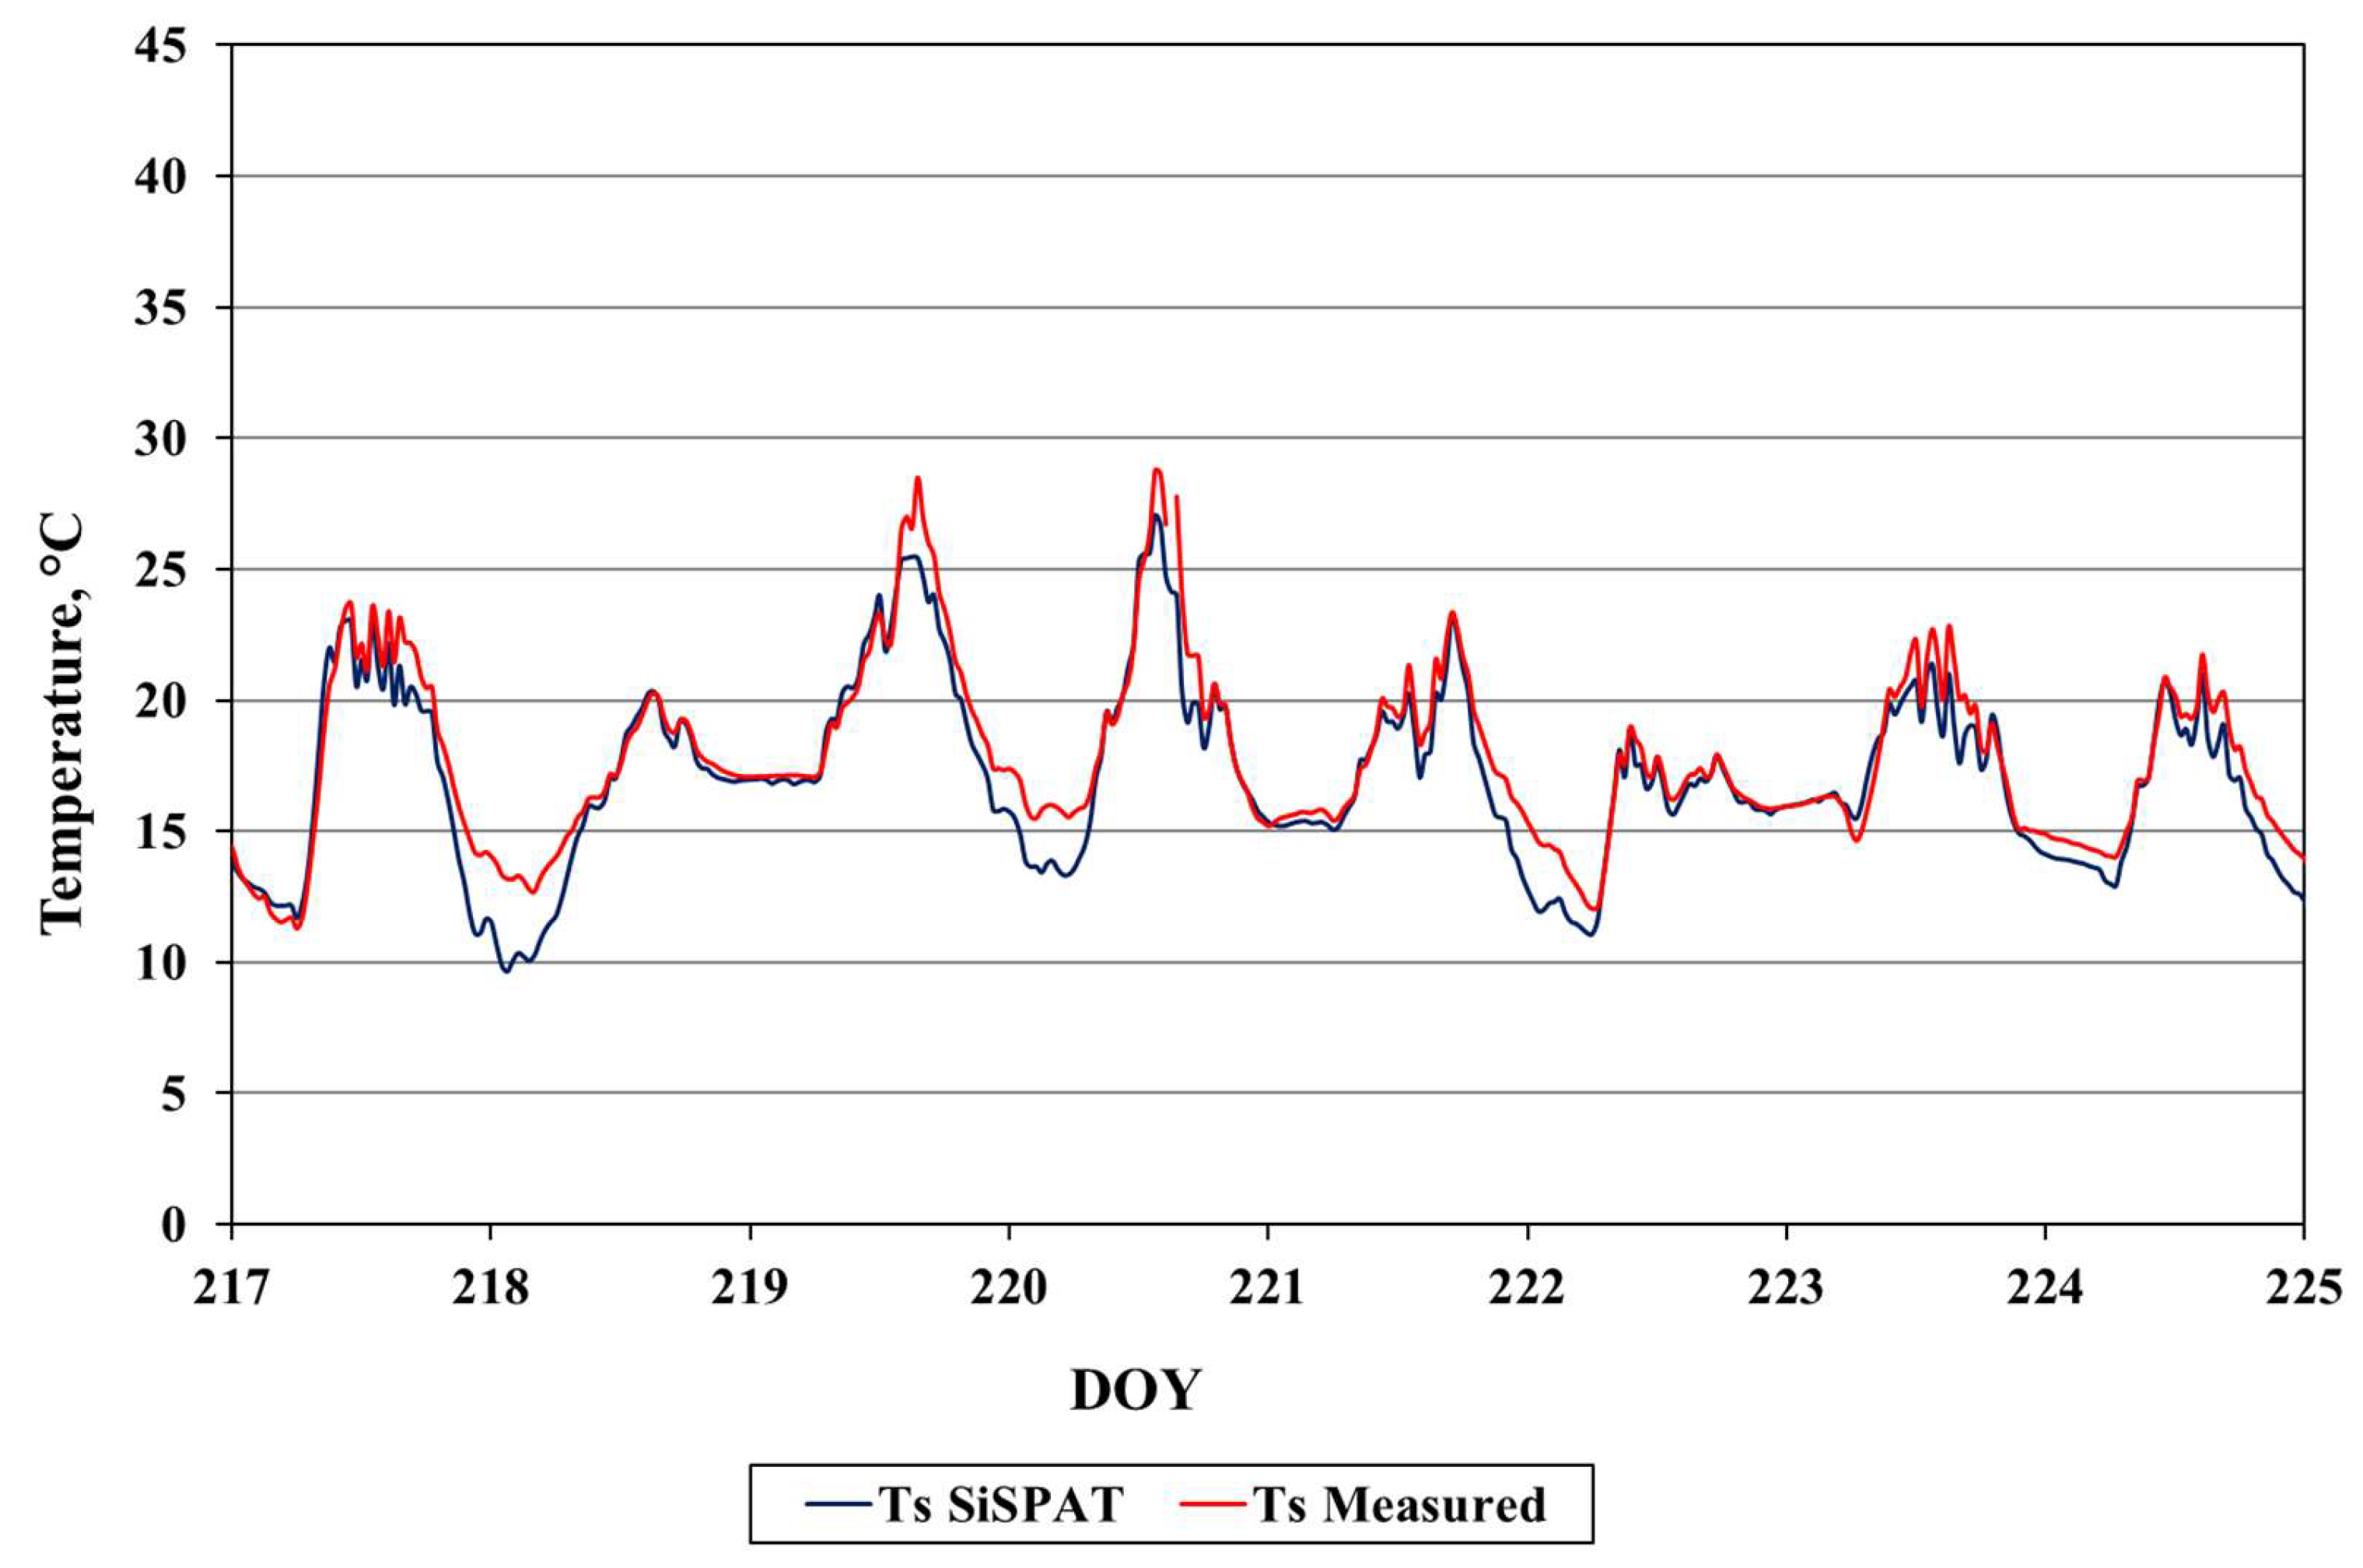
Figure 8 presents a detailed comparison between measured and simulated
Ts over the period from DOY 217 to DOY 225, highlighting the diurnal evolution captured by the SiSPAT model.
Throughout the simulation period, the SiSPAT model consistently underestimated Ts, with the most pronounced discrepancies occurring around midday. For instance, on DOY 219 and DOY 221, both characterized by high solar radiation, measured surface temperatures exceeded 45 °C, whereas the model’s predictions rarely surpassed 42 °C. This persistent underestimation directly influenced the reduction in H and λE during peak hours, as both fluxes depend on surface thermal gradients driven by Ts.
Several factors contributed to this deviation. First, the vertical discretization of the model may lack sufficient resolution near the surface to capture rapid and intense heating in the uppermost millimeters of soil. These shallow layers experience fast diurnal thermal fluctuations, and coarse discretization can smooth temperature peaks, consequently dampening heat flux responses. Second, the surface energy balance formulation in SiSPAT may simplify key thermal parameters such as surface albedo, emissivity, and aerodynamic roughness, often treating them as spatially or temporally constant. These parameters vary dynamically due to soil moisture changes, crust formation, or surface texture heterogeneity, significantly influencing the absorption and emission of radiation. If these variations are not fully represented, Ts predictions systematically diverge from field observations.
Another source of discrepancy may arise from timing mismatches between model radiative forcing and surface thermal response. Even minor inaccuracies in the temporal specification of solar inputs can shift the phase of the diurnal Ts pattern, causing the model to miss peak heating periods. Despite these challenges, the SiSPAT model successfully reproduced the overall diurnal trend of Ts, including a sharp morning increase, peak near solar noon, gradual afternoon decline, and nocturnal cooling. The alignment of these trends indicates that the model’s thermal structure is conceptually robust, but achieving higher fidelity requires finer vertical resolution and dynamic calibration of surface parameters.
Given that Ts directly controls both hydrological processes, such as evaporation, and atmospheric coupling, including boundary layer development, improving the model’s surface thermal representation is crucial. Refinements in the mechanisms governing surface energy exchange and incorporation of dynamic, physically realistic surface characteristics would enhance SiSPAT’s reliability for agricultural, hydrological, and climate modeling applications under temperate oceanic climates.
3.7. Soil Temperature Profiles
Simulating accurate soil temperature profiles is crucial for evaluating subsurface thermal regimes and for validating the model’s capability to represent vertical heat transfer under dynamically varying surface forcing.
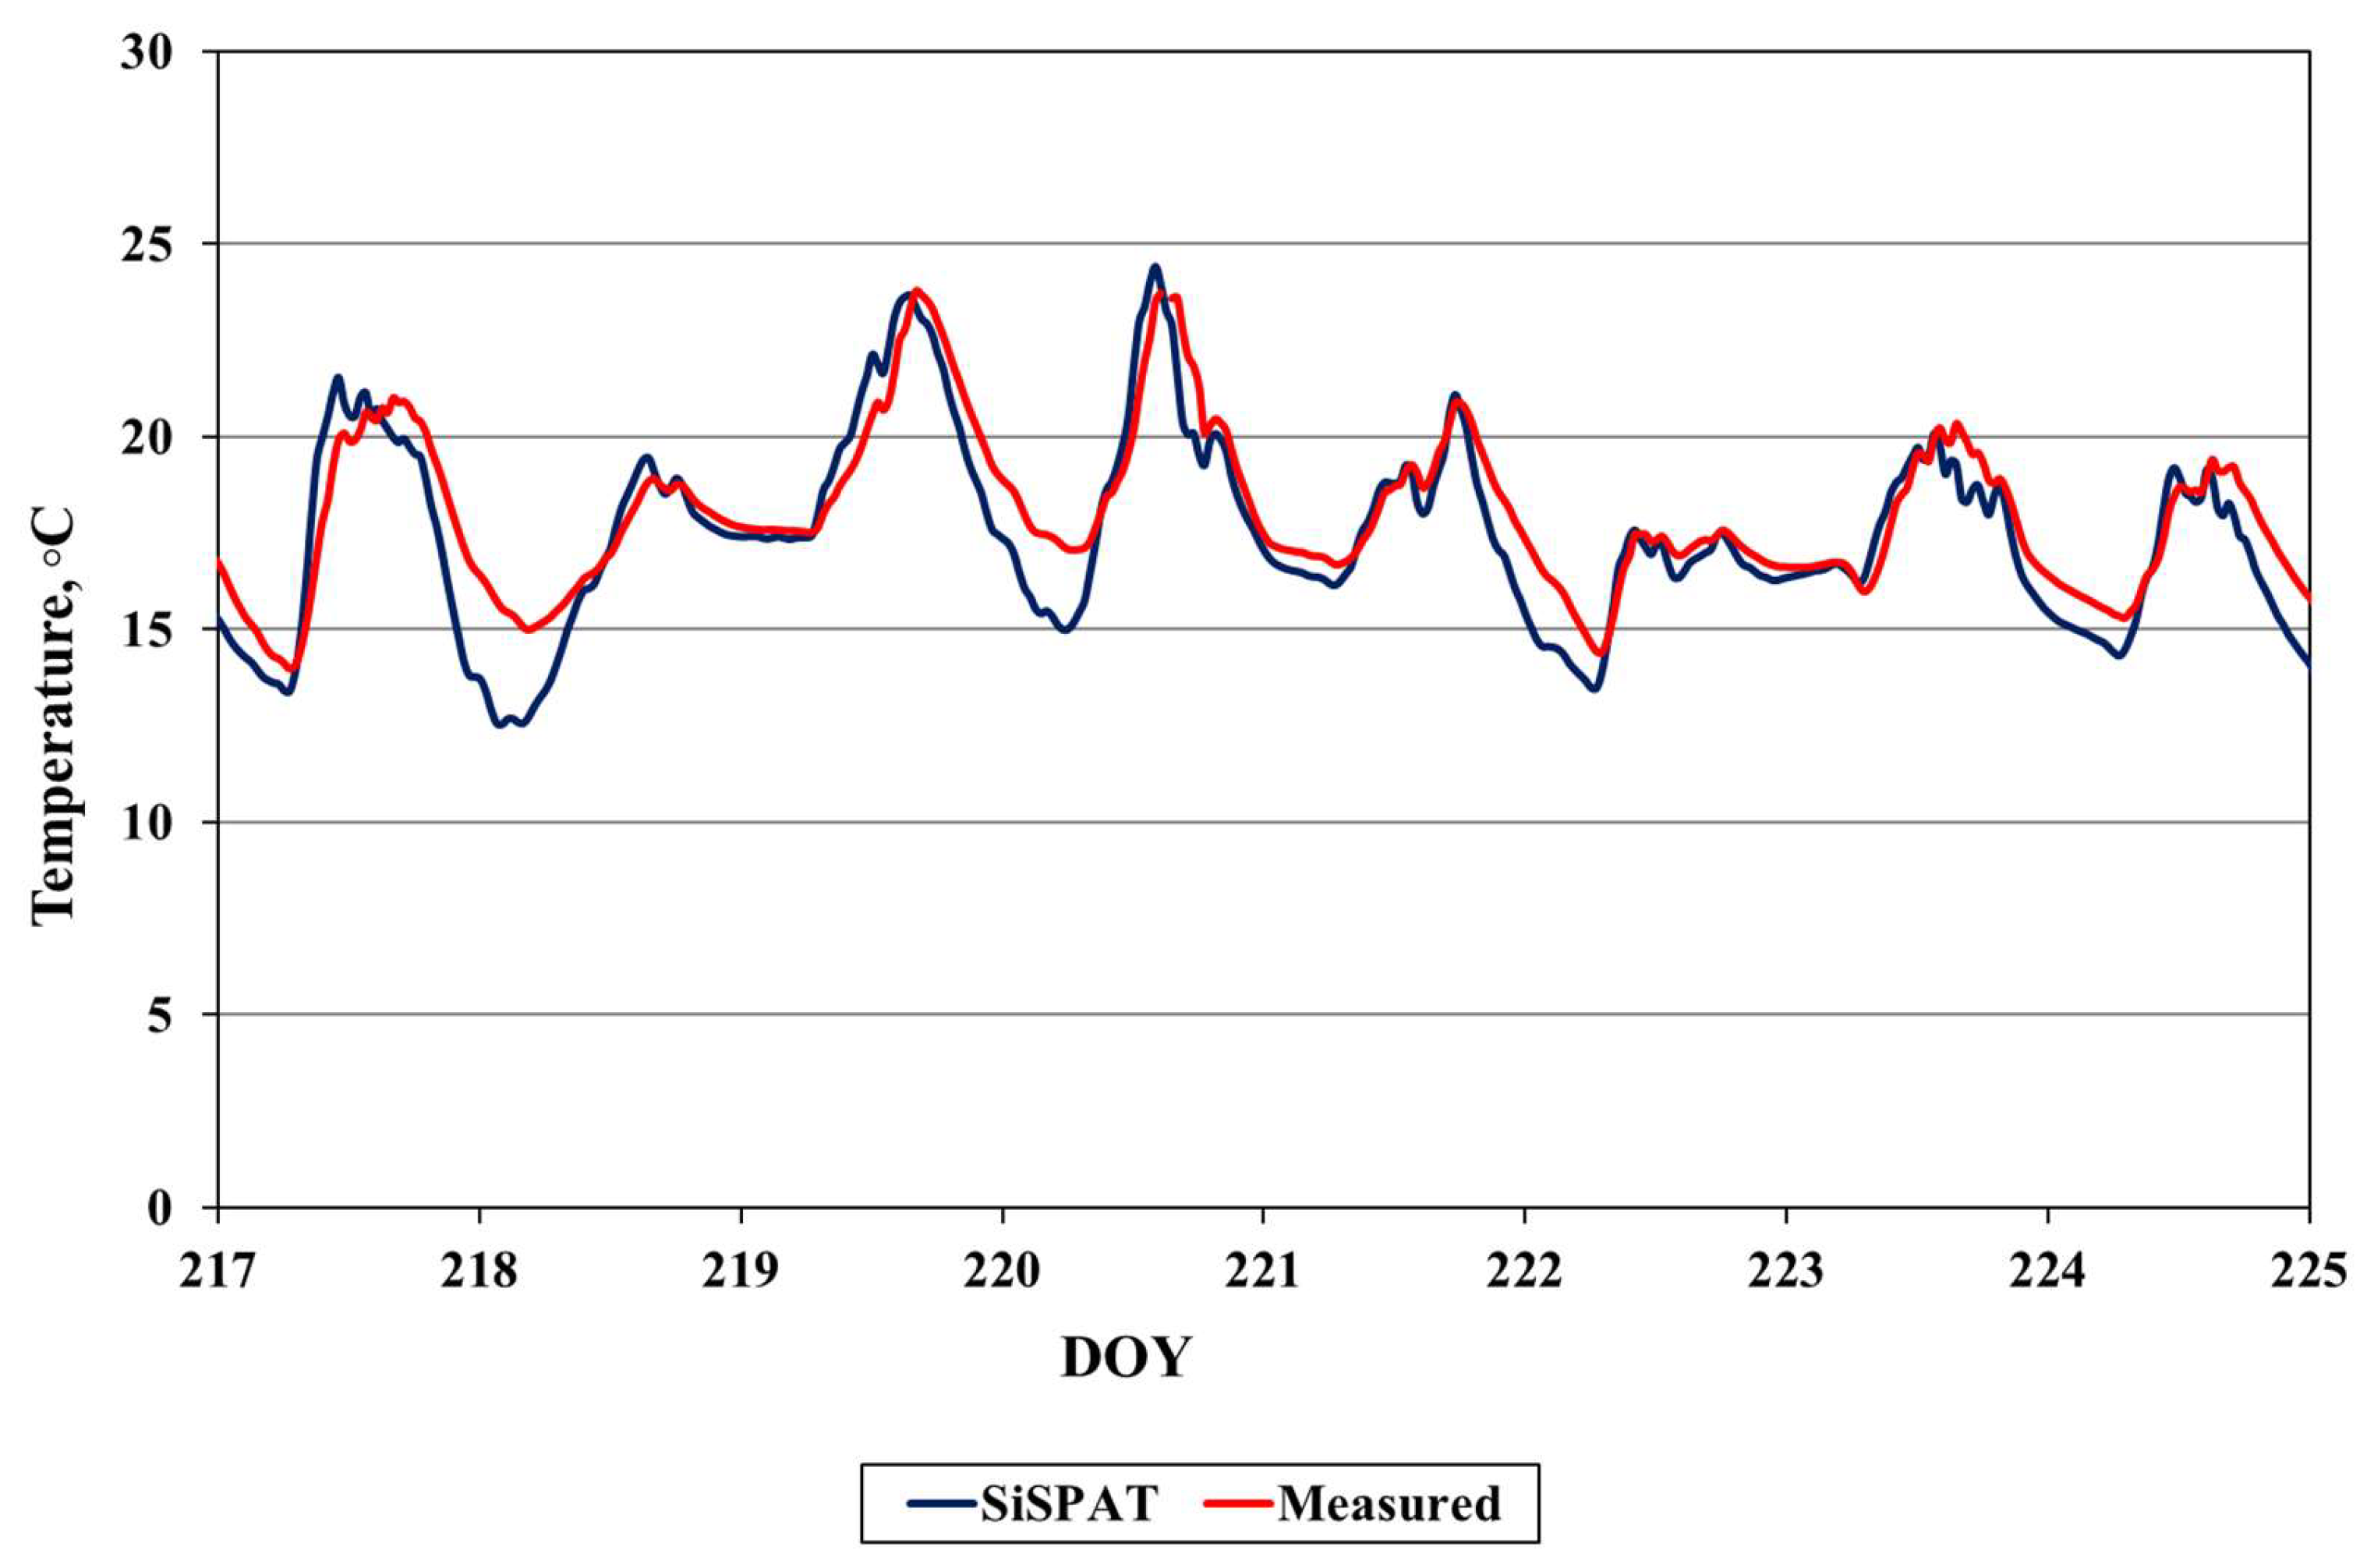
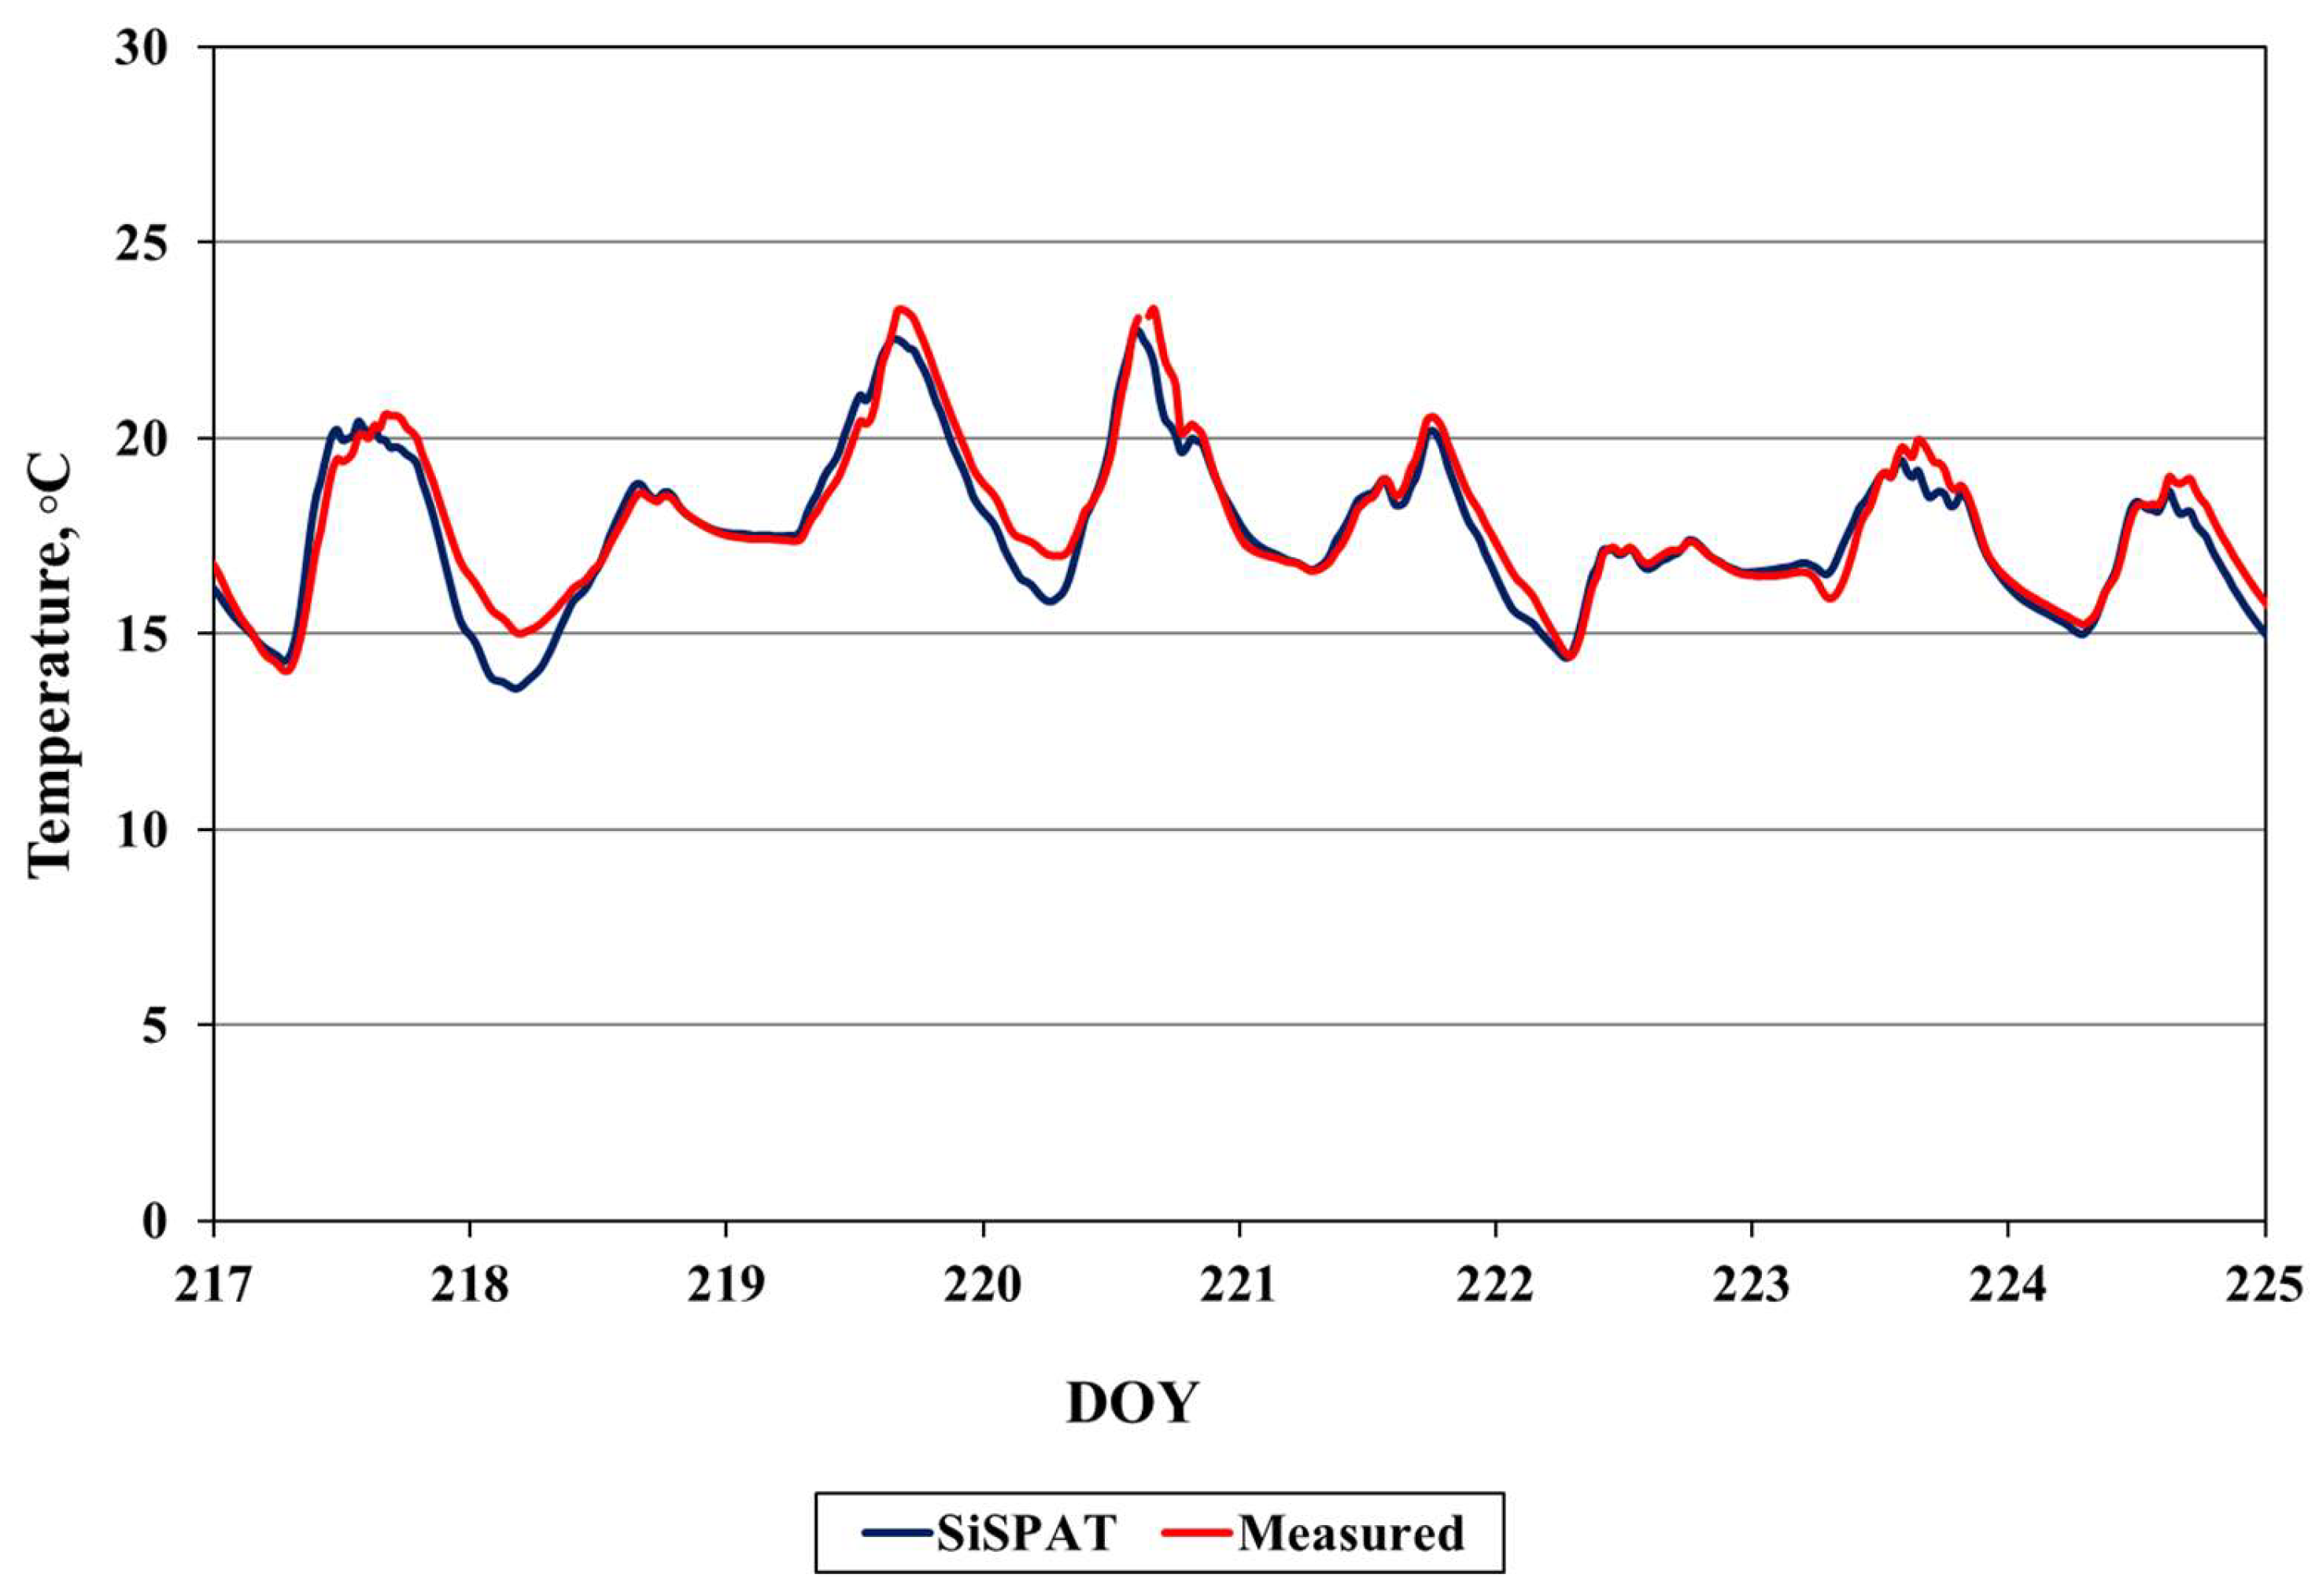
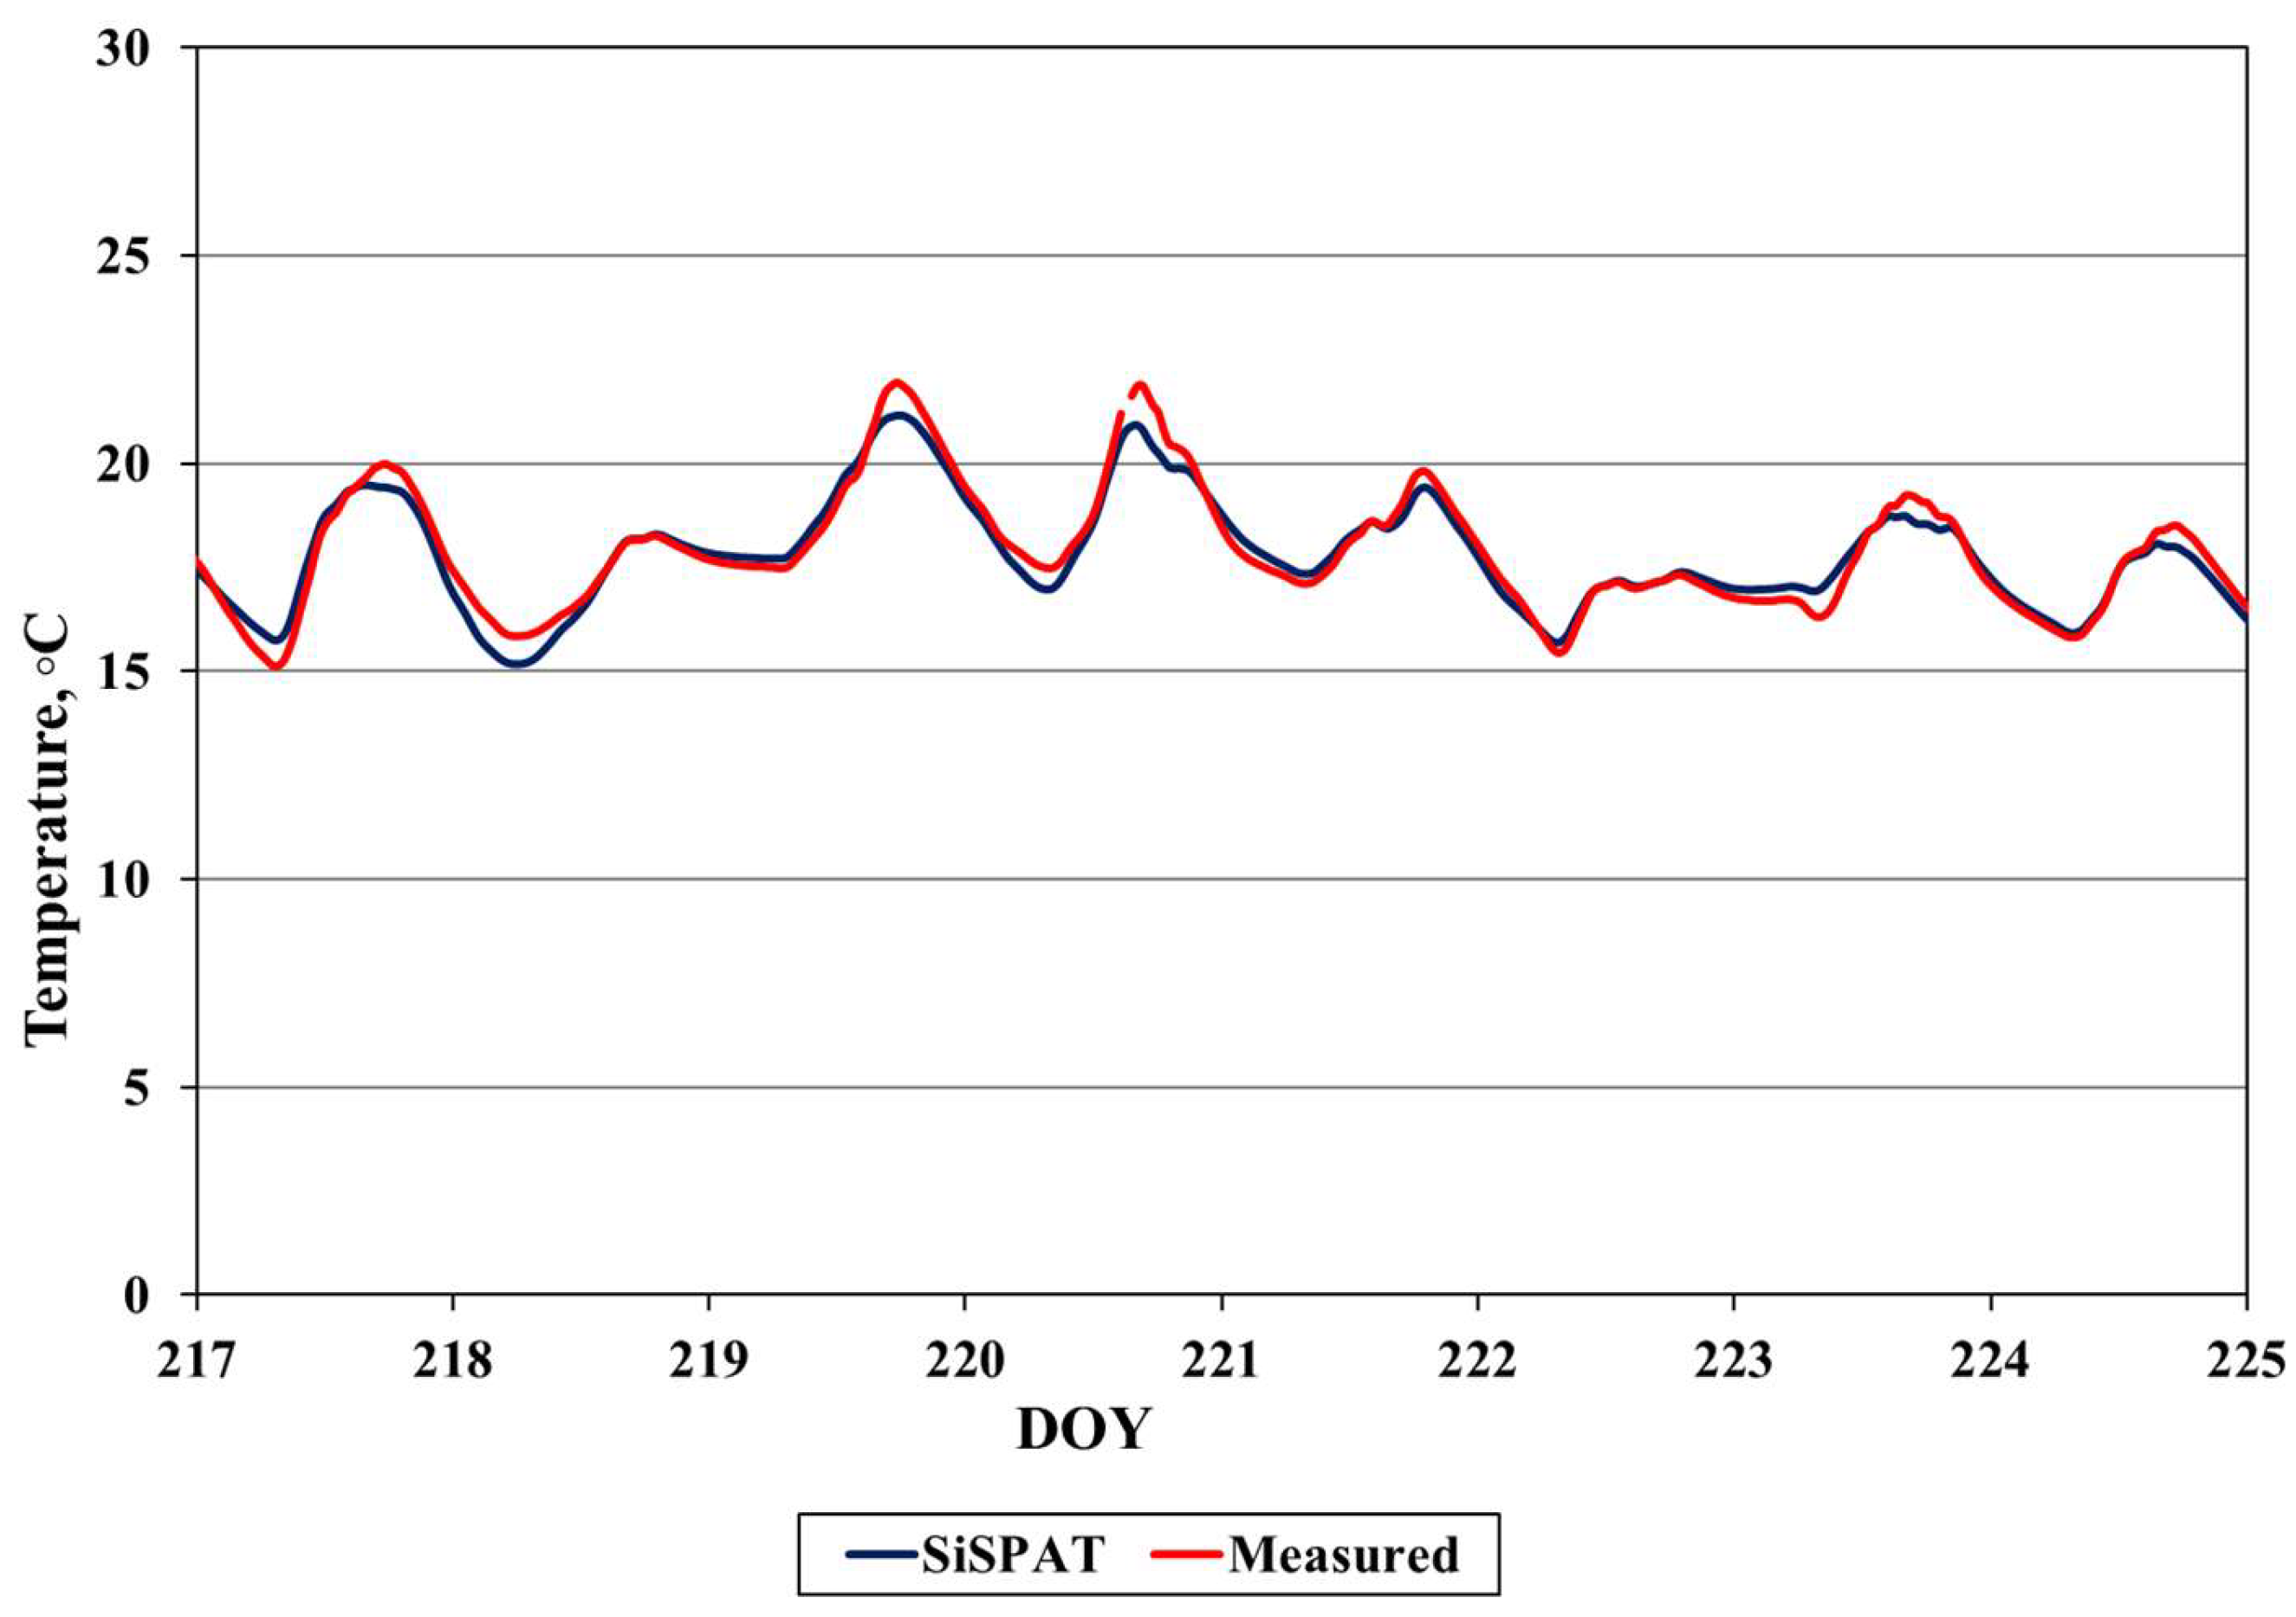
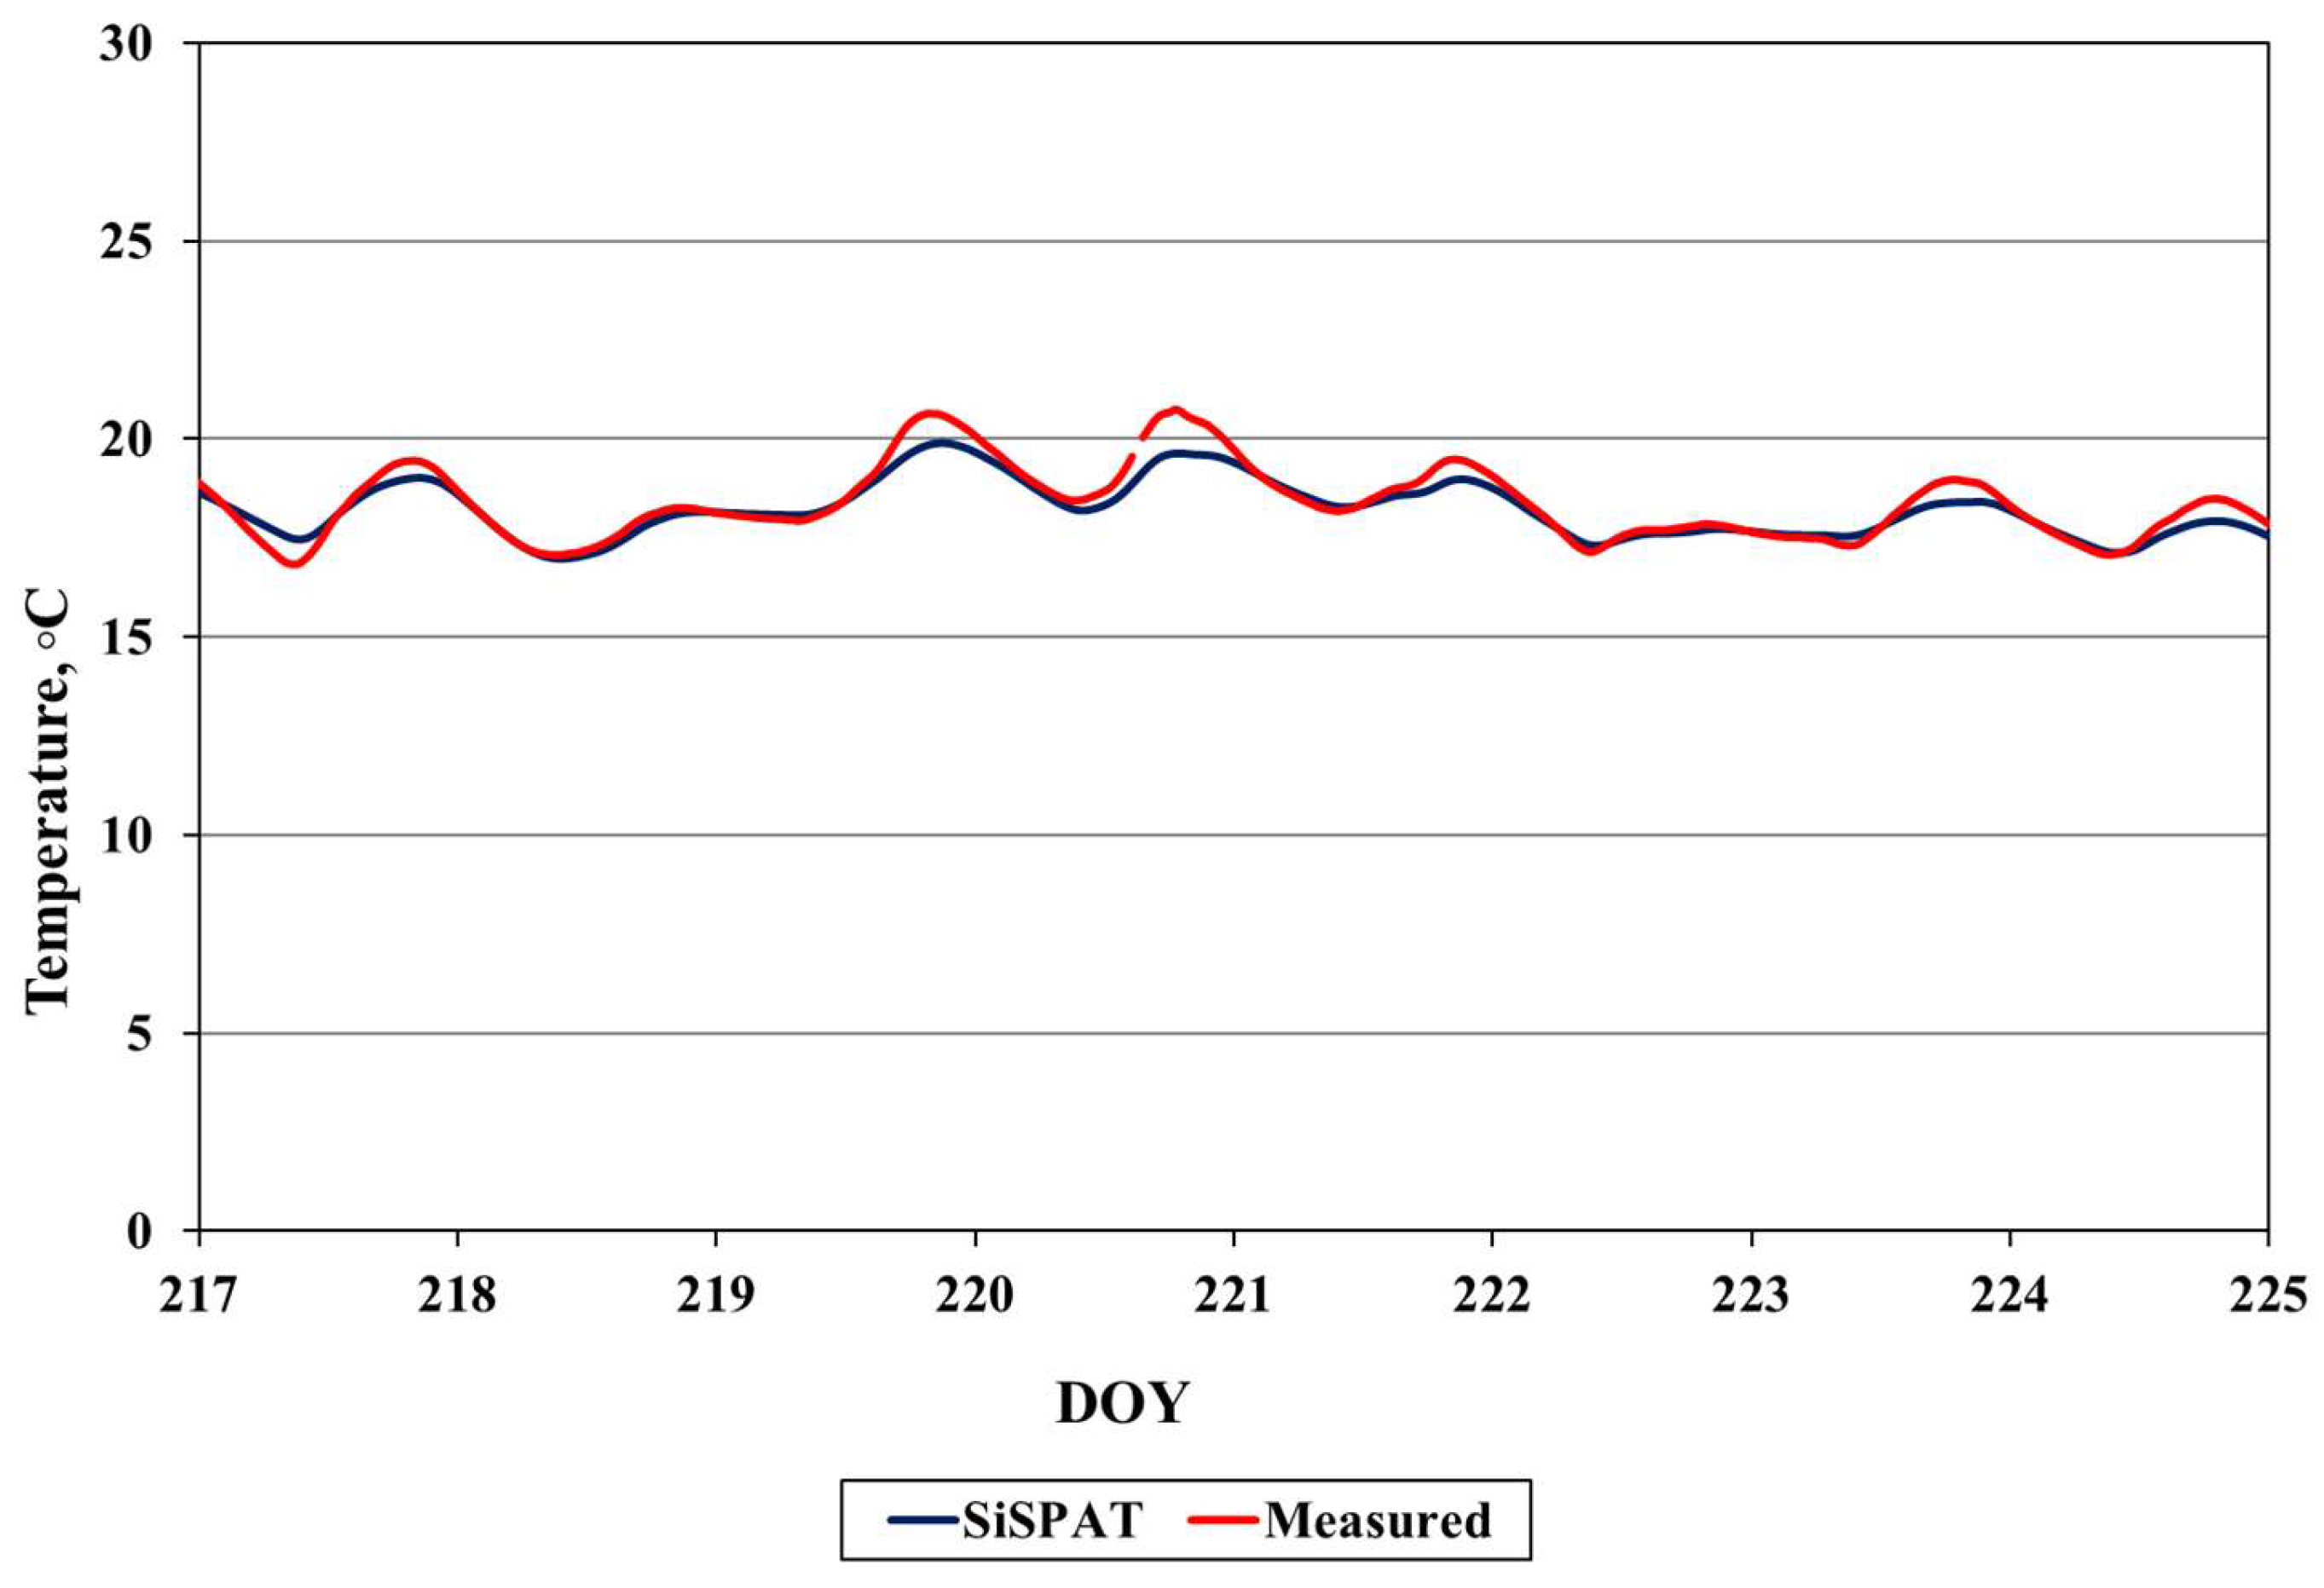
Figure 9,
Figure 10,
Figure 11 and
Figure 12 present comparisons between observed and simulated soil temperatures at four depths—2 cm, 5 cm, 10 cm, and 20 cm—over the study period from DOY 217 to DOY 225. These comparisons allow assessment of the model’s ability to reproduce both diurnal amplitude and phase of thermal fluctuations across the soil profile, which is essential for physically consistent representation of soil–atmosphere energy interactions and for subsequent interpretation of surface fluxes.
At the 2 cm depth (
Figure 9), the SiSPAT model notably underestimated peak daytime temperatures, particularly during clear-sky periods characterized by strong surface heating. Observed temperatures frequently exceeded 40 °C, whereas simulated values remained 2–4 °C lower. This underestimation is consistent with the findings from soil surface temperature analysis (
Section 3.6) and highlights the limitations in resolving rapid thermal responses in the shallowest soil layer. The observed discrepancies are likely related to the conservative parameterization of thermal diffusivity in the model, coarse vertical discretization near the soil surface, or simplifications in surface boundary conditions, including albedo, emissivity, and aerodynamic roughness, which may not dynamically respond to rapid soil moisture and surface condition changes. Despite these differences, the model successfully reproduced the general diurnal trend at 2 cm depth, capturing the morning rise, midday peak, afternoon decline, and nocturnal cooling phases, indicating that the overall structural formulation of the model remains robust.
At 5 cm (
Figure 10) and 10 cm (
Figure 11) depths, the model demonstrated a notable improvement in capturing soil temperature dynamics. Simulated temperatures closely matched observed values in both amplitude and phase of diurnal variations. Minor underestimations of peak temperatures were observed around midday, generally within ±1.5 °C, which is considered acceptable for field-scale energy balance modeling. These results indicate that SiSPAT’s internal representation of soil heat storage, vertical conduction, and boundary interactions is well-calibrated for intermediate soil layers, providing reliable estimates for thermal energy partitioning and subsequent modeling of surface fluxes.
At 20 cm depth (
Figure 12), the model accurately captured the attenuated amplitude and delayed phase characteristic of deeper soil layers. A slight phase lag was observed, whereby simulated temperatures trailed measured values during heating and cooling transitions. This lag likely stems from simplified assumptions in the vertical distribution of soil thermal properties, as natural soils exhibit heterogeneity in layering, compaction, and moisture content, which strongly affect the propagation of thermal waves. Averaging or homogenizing these properties in the model can introduce small phase shifts and damped amplitudes, yet the overall trends remain consistent with observed data.
Across all depths, the SiSPAT model reproduced the expected physical patterns of amplitude reduction and temporal smoothing with increasing depth, consistent with heat conduction theory in soils. The uppermost soil layers, however, remain the most challenging to simulate accurately due to their rapid heat and moisture exchanges, high sensitivity to diurnal radiation, and strong response to surface moisture changes. The underestimation of peak temperatures in shallow layers indicates that future model improvements should focus on increasing vertical discretization near the surface, incorporating depth-specific thermal parameters for topsoil layers, and dynamically adjusting surface boundary parameters in response to moisture and radiative forcing. Accurately simulating these thermal gradients is essential not only for representing soil temperature profiles but also for reliably estimating associated surface energy fluxes, including sensible and latent heat transfer and cumulative evaporation.
Despite these minor discrepancies, the SiSPAT model demonstrates strong overall capability in reproducing soil temperature dynamics under bare-soil conditions in a temperate oceanic climate. The model effectively captures diurnal thermal patterns across shallow, intermediate, and deeper soil layers, providing confidence in its use for energy balance evaluation, hydrological modeling, and integrated assessment of soil–atmosphere interactions in both research and practical applications. This performance supports the utility of SiSPAT as a robust tool for investigating soil thermal behavior and its implications for surface energy fluxes and soil moisture dynamics in temperate environments.
3.8. Soil Moisture Profiles
Soil moisture is a pivotal variable influencing multiple interconnected soil–plant–atmosphere processes, including surface evaporation, plant water availability, thermal conductivity, and hydrological transport. Its accurate simulation is therefore critical for assessing the reliability of SVAT models like SiSPAT in reproducing real-world soil moisture dynamics under bare-soil conditions within a temperate oceanic climate.
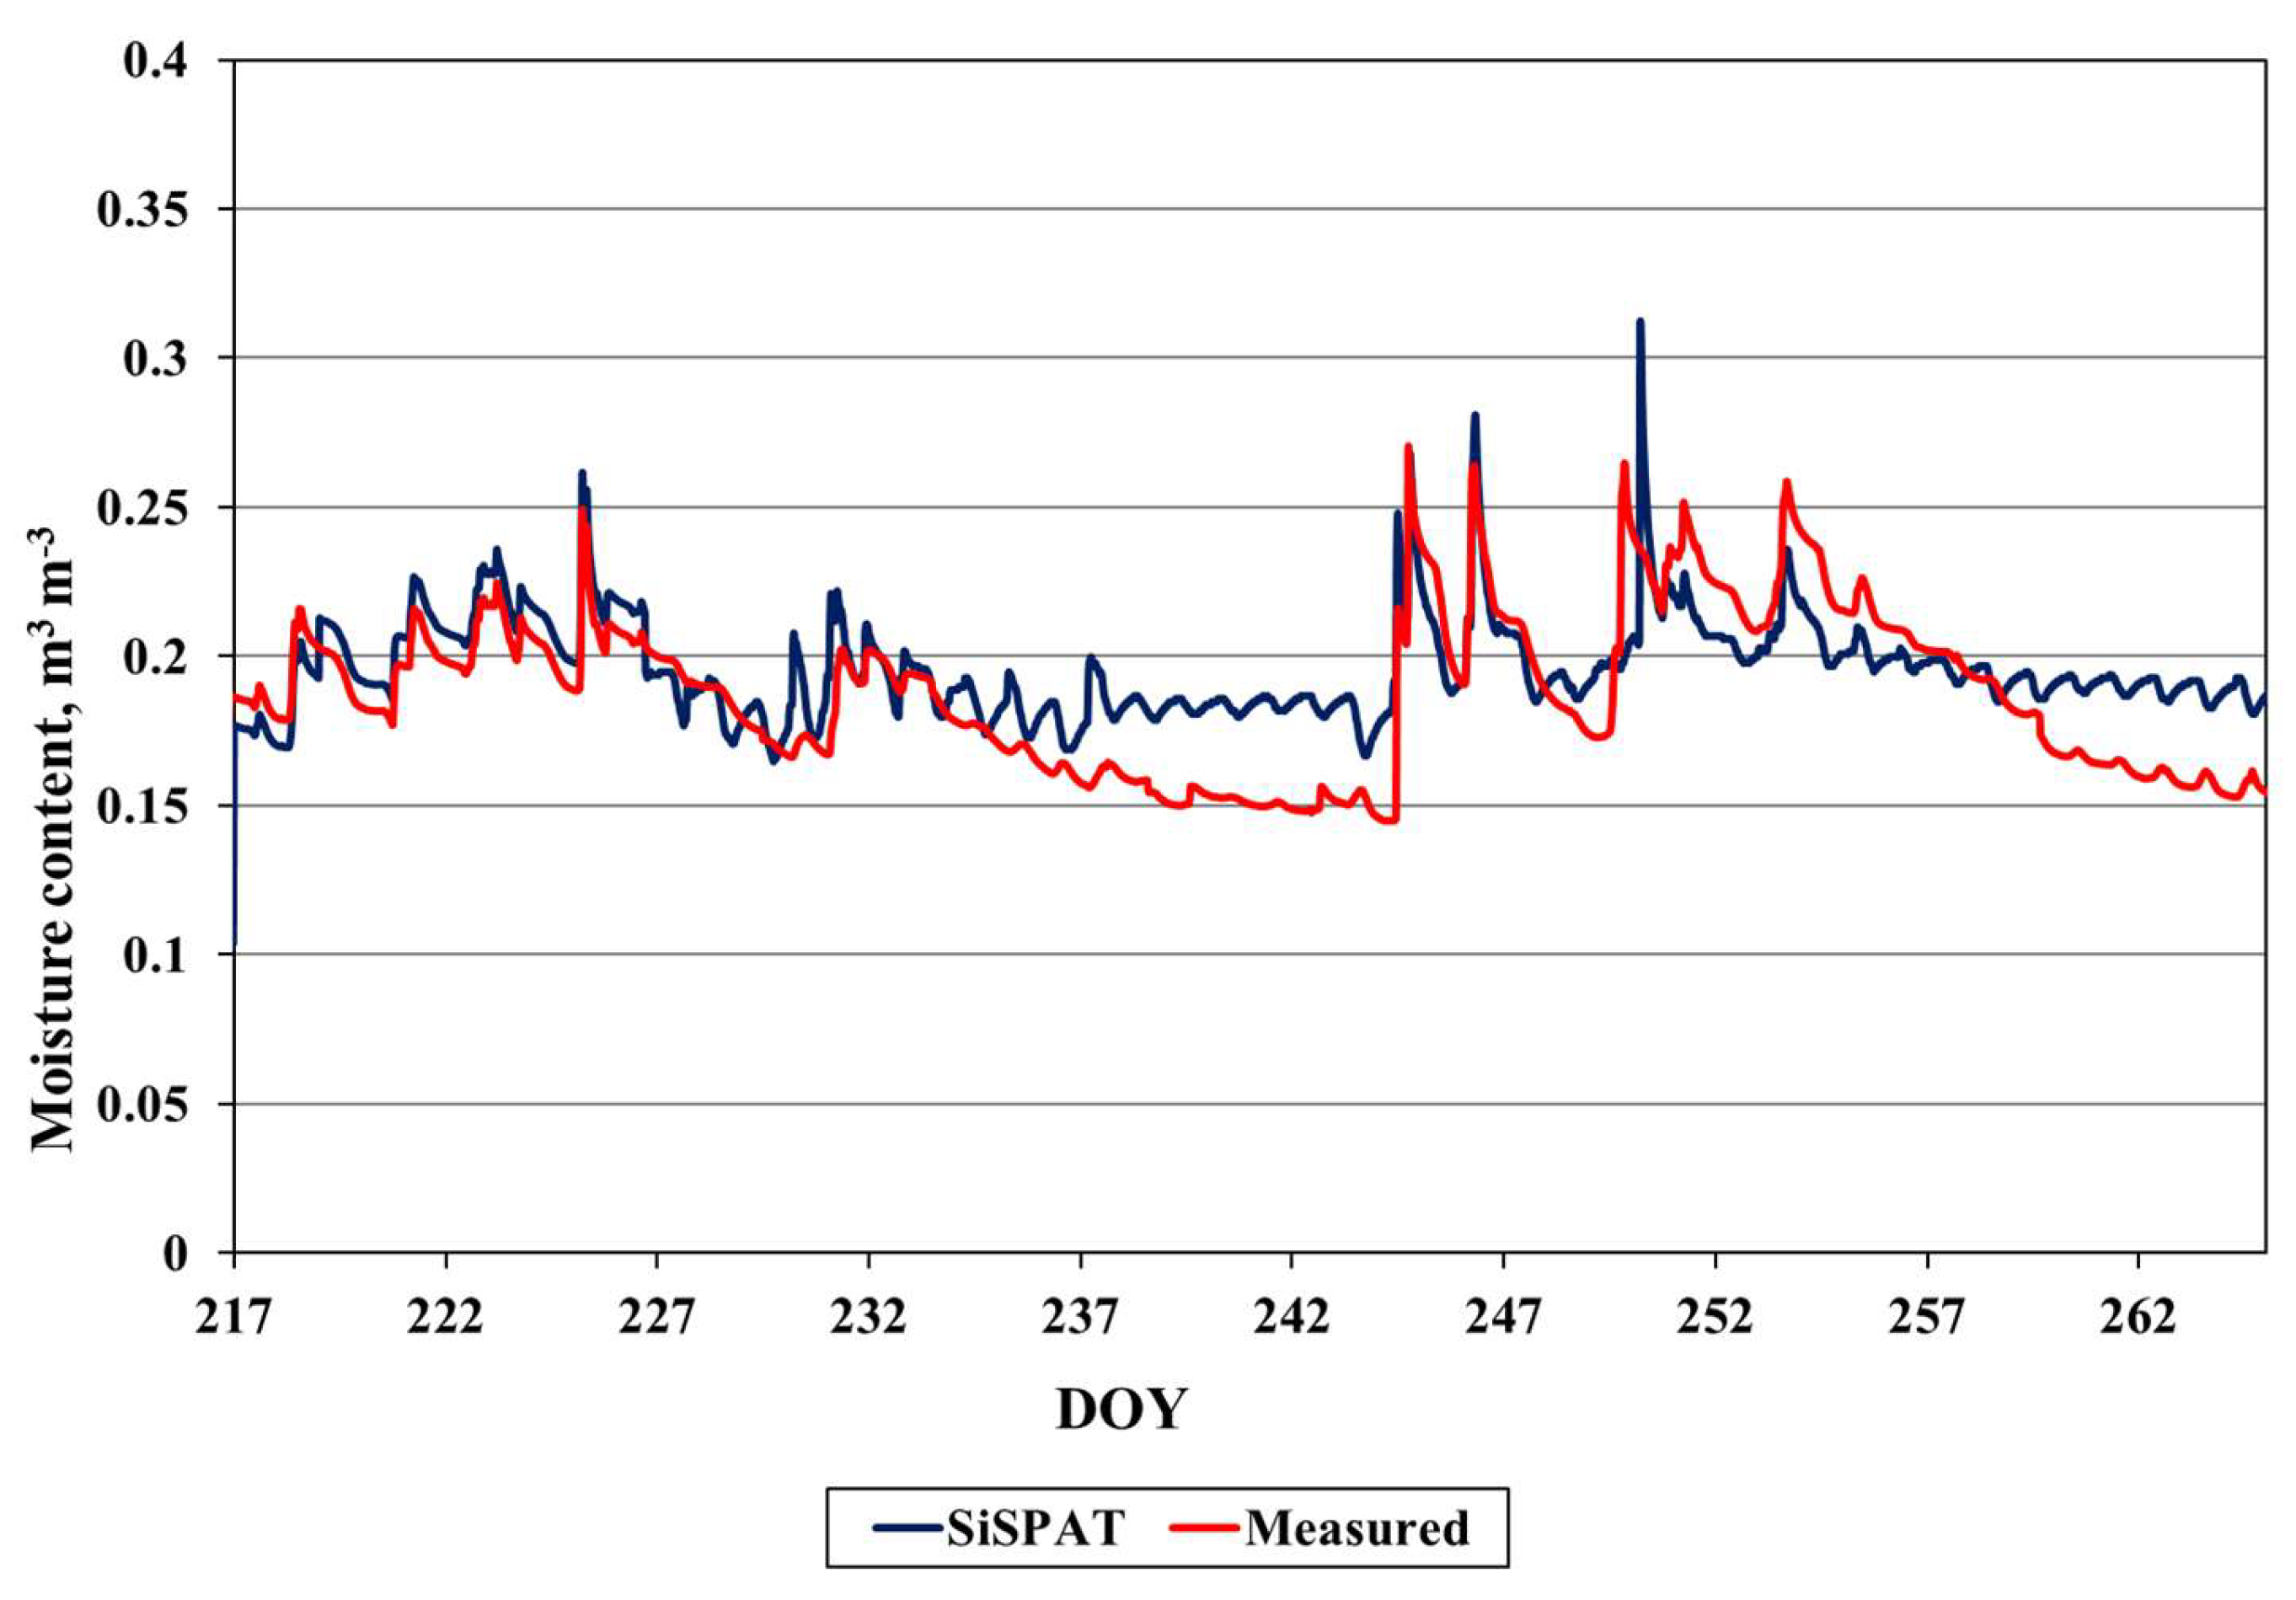
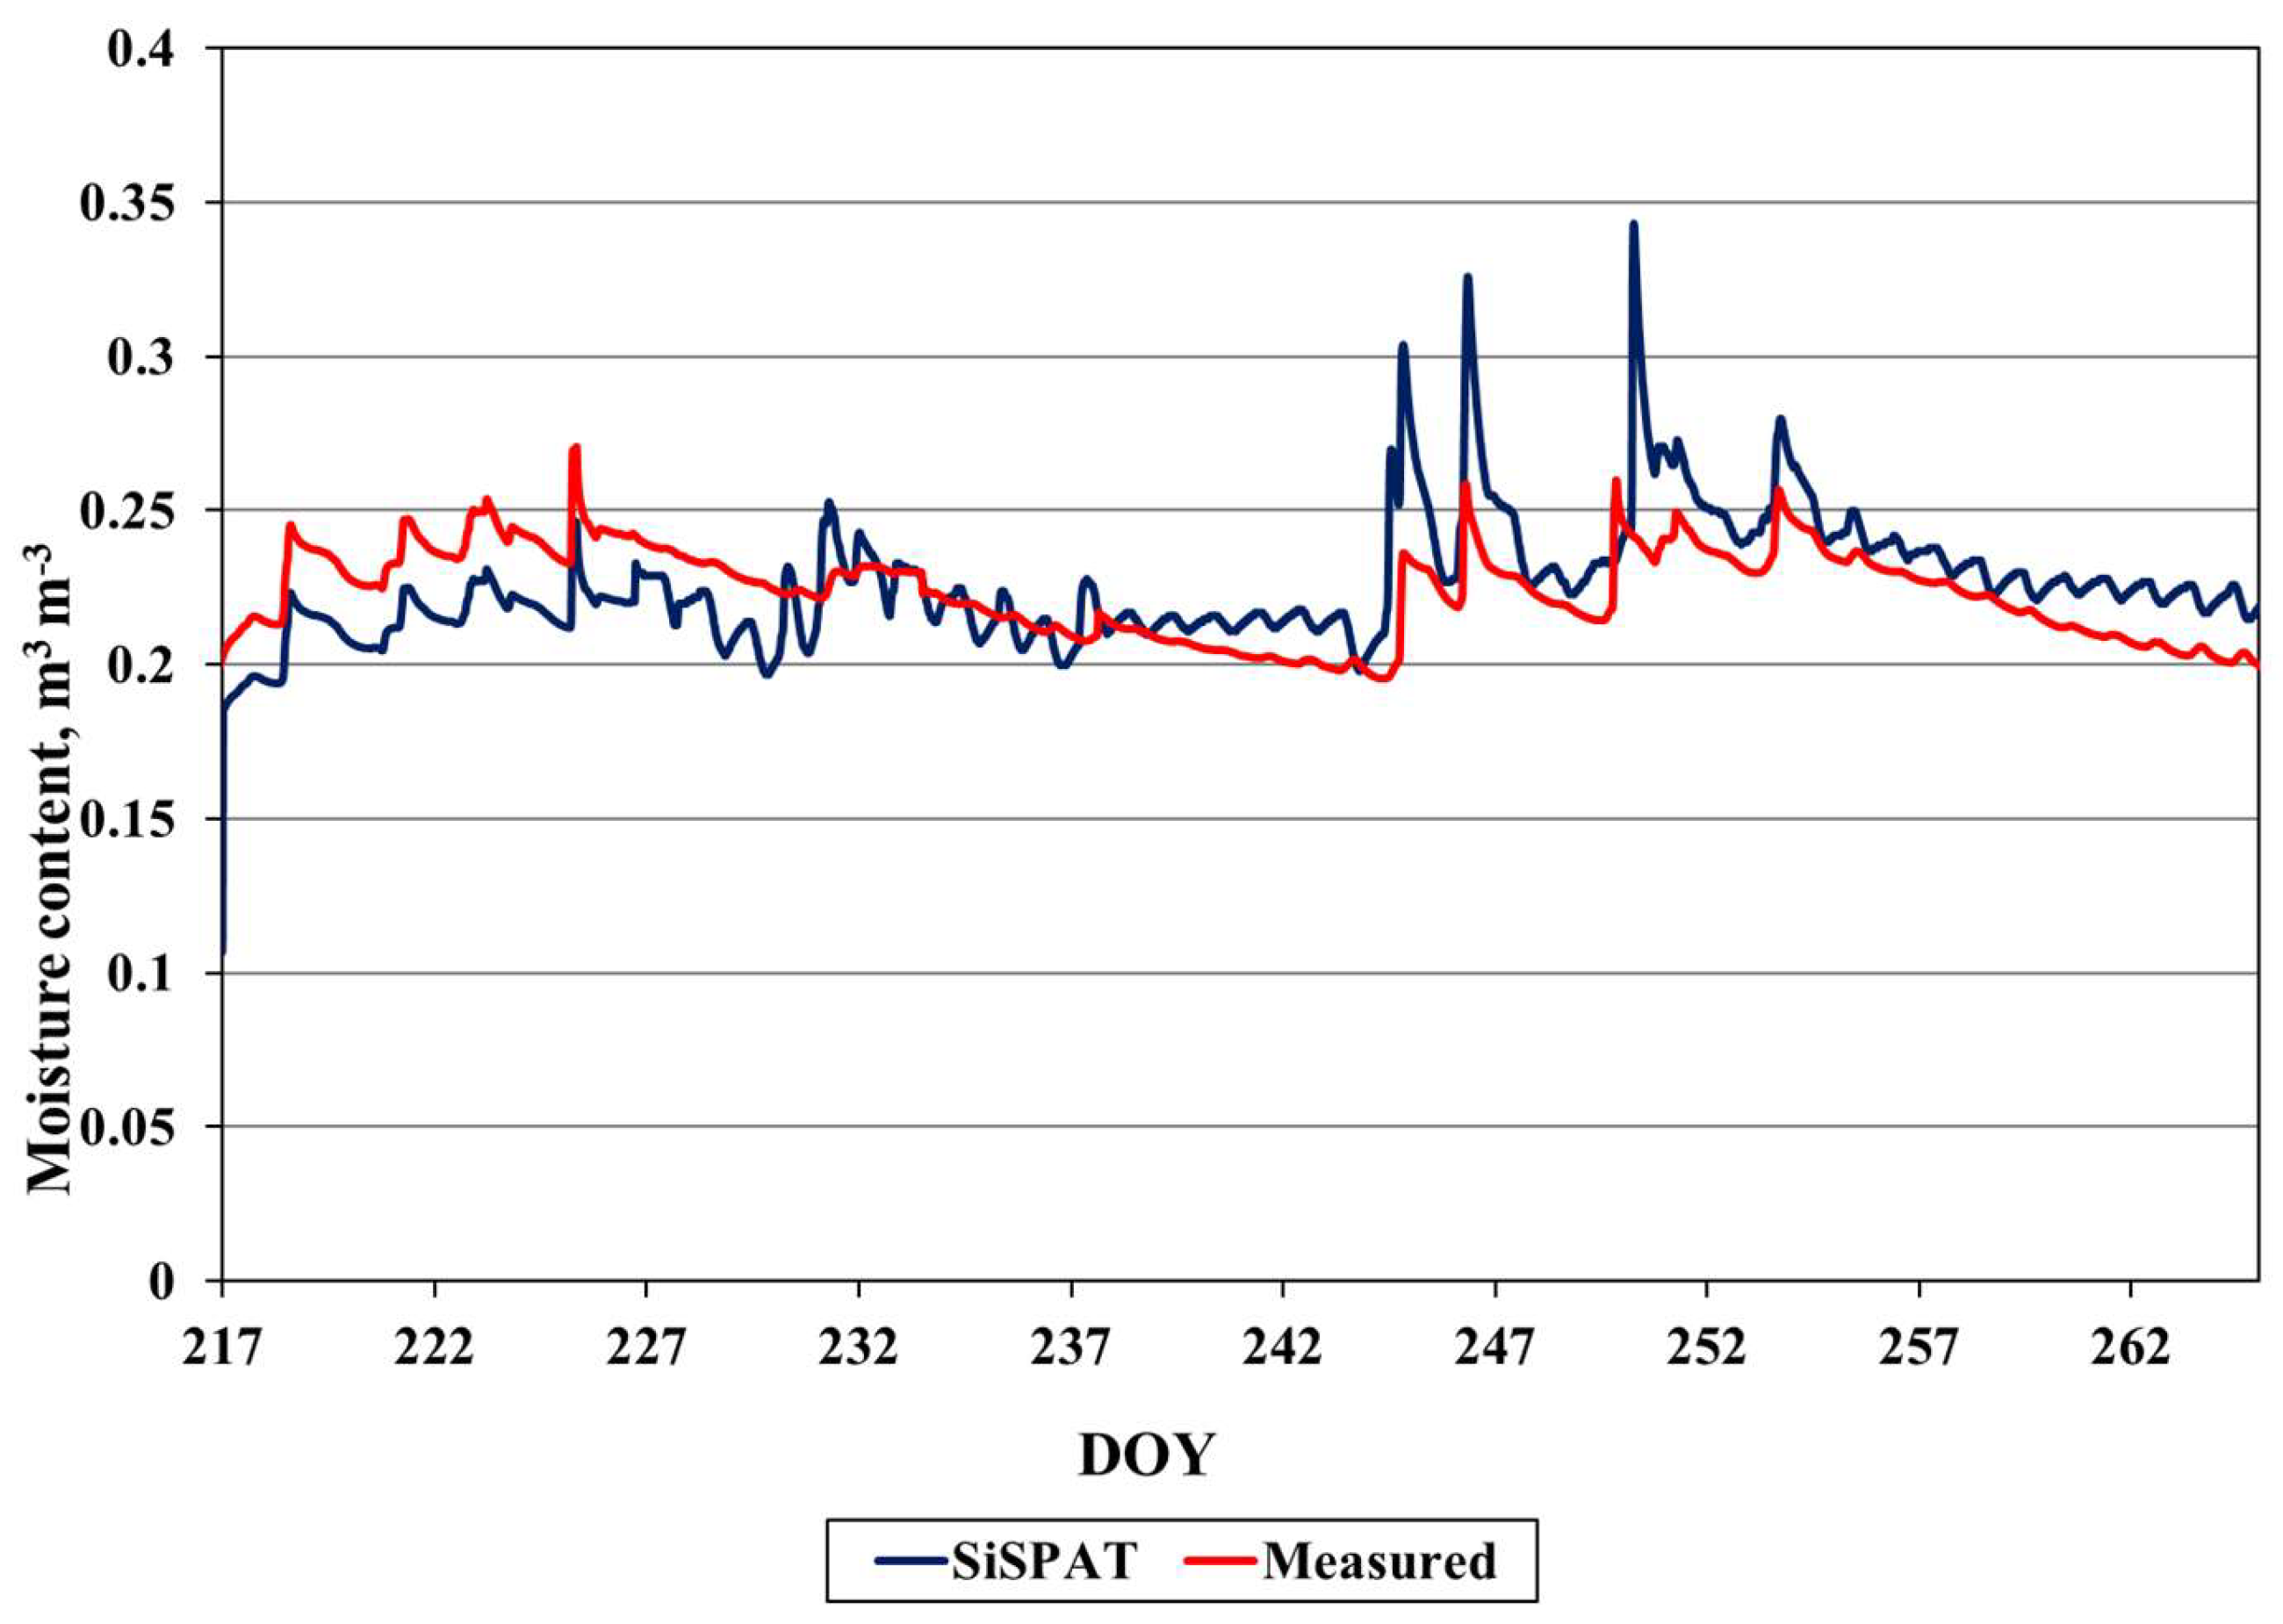
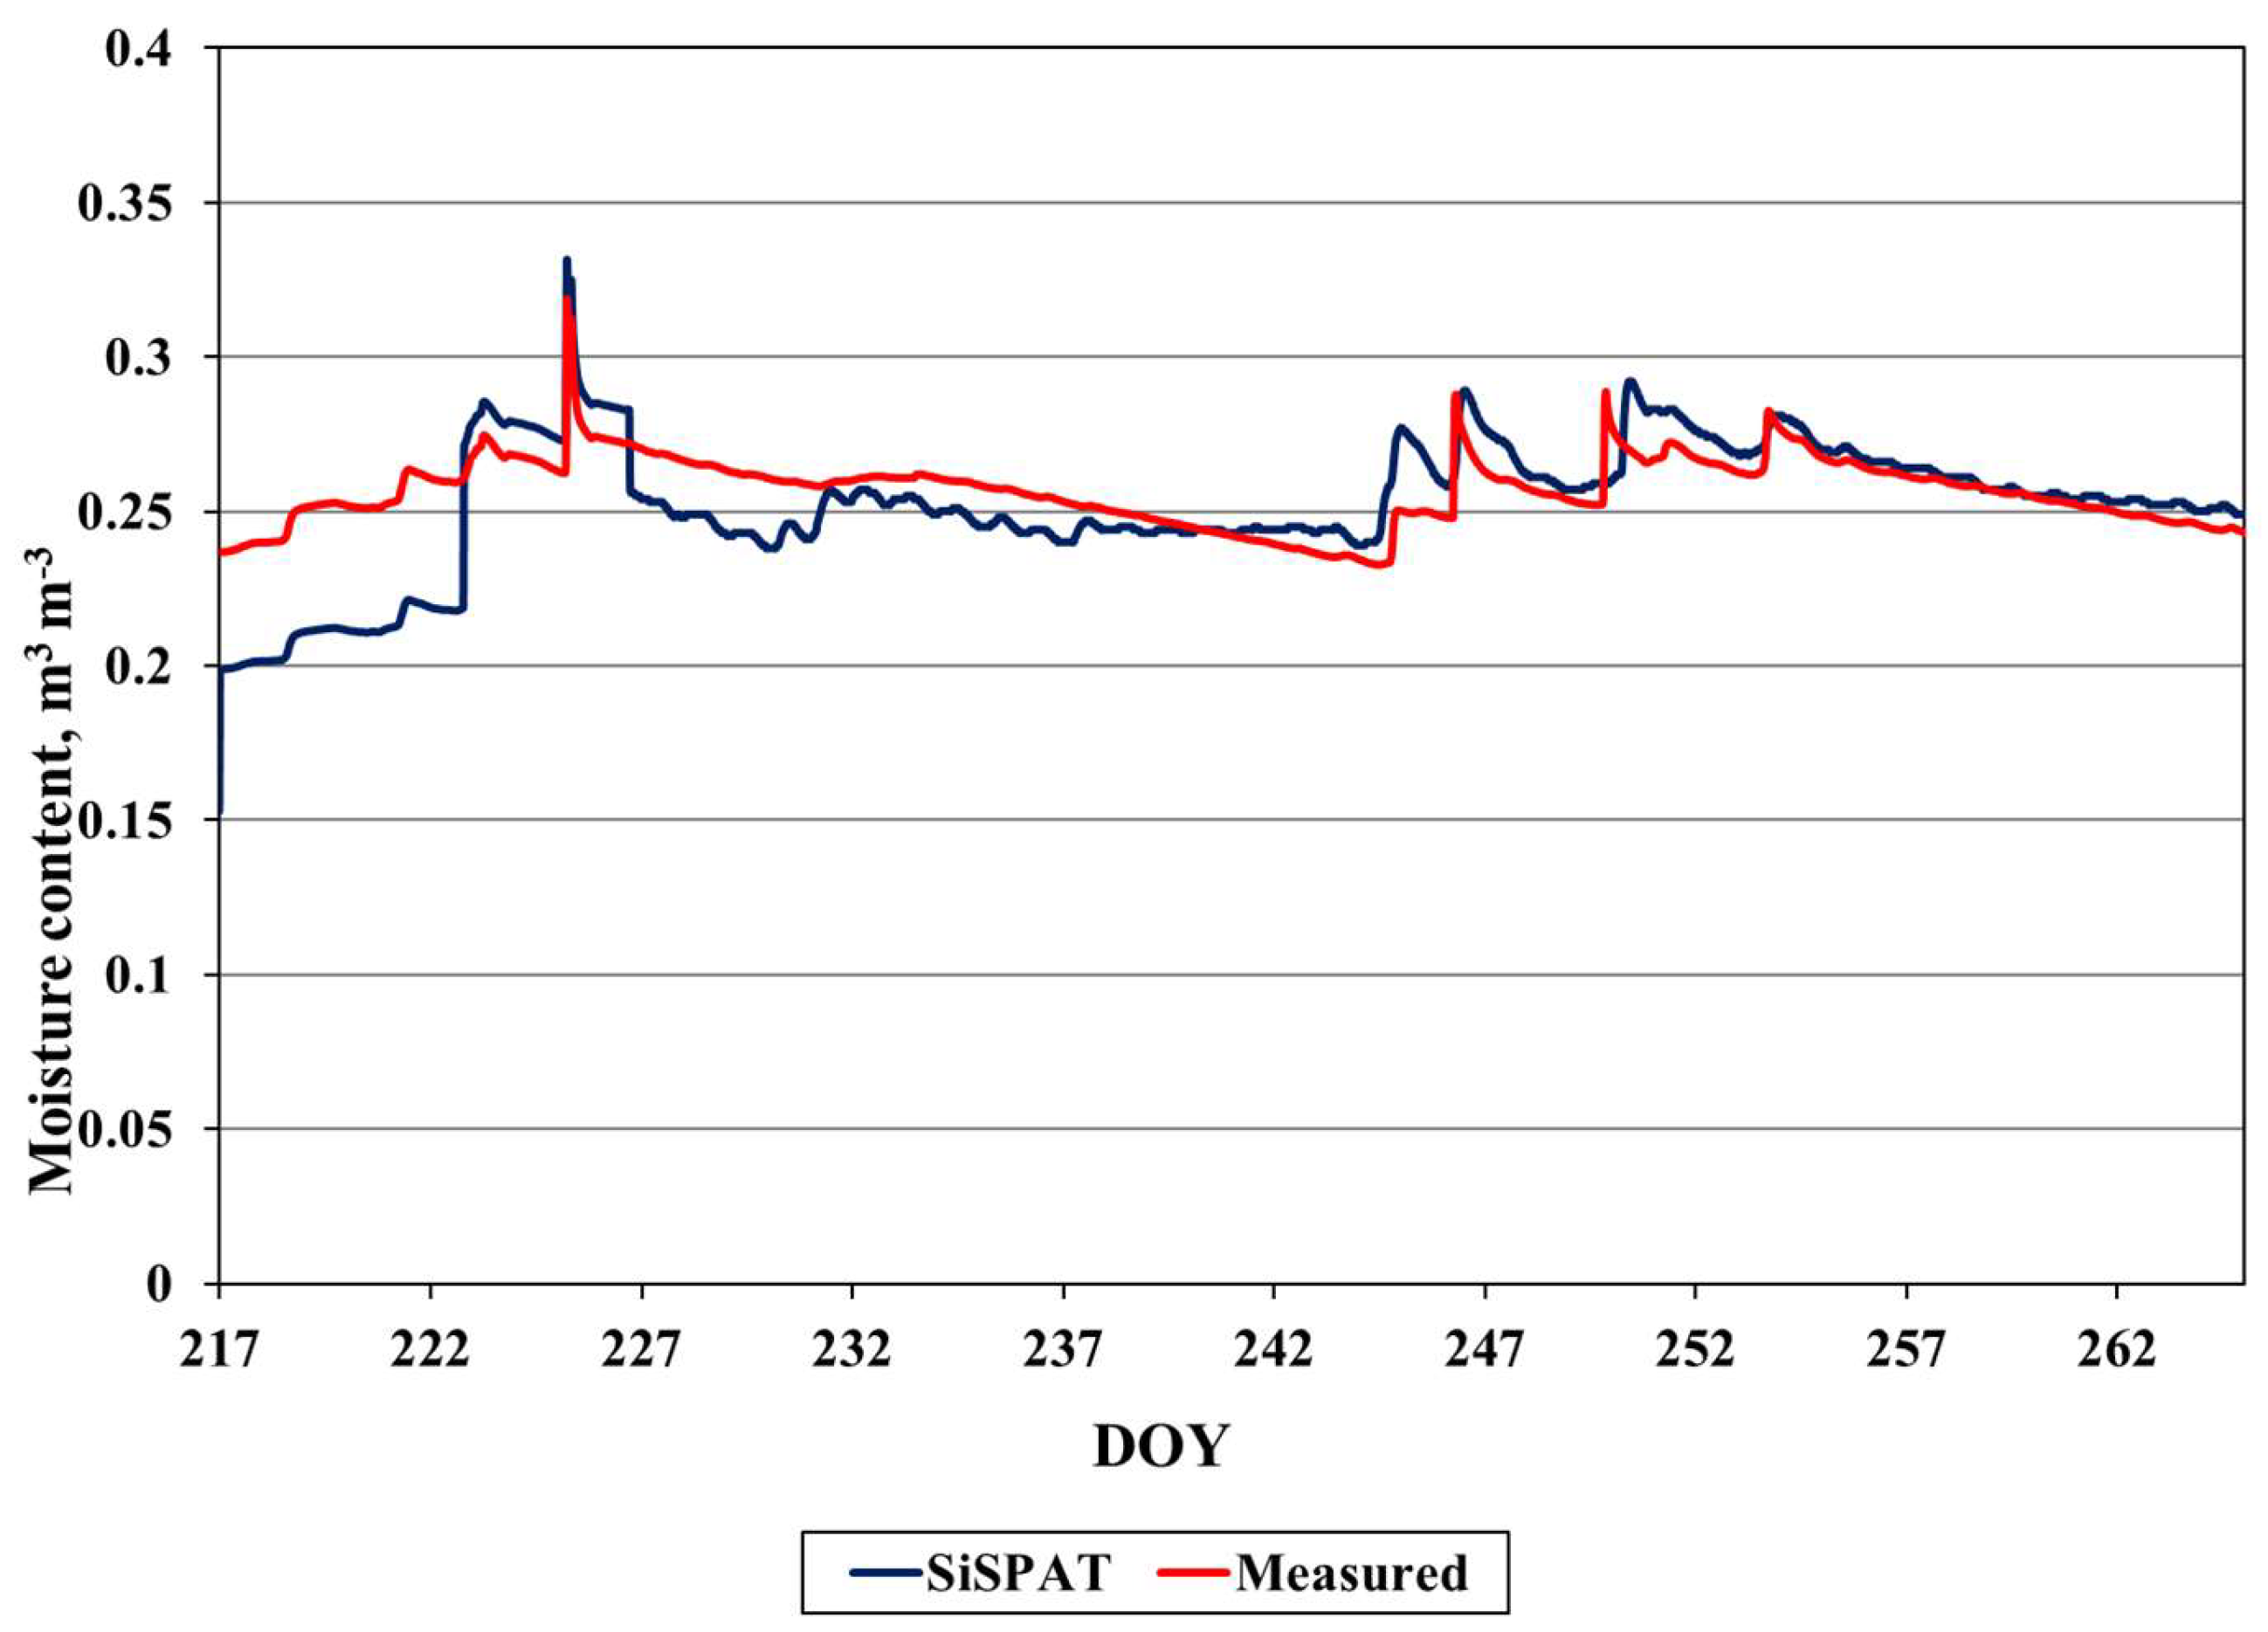
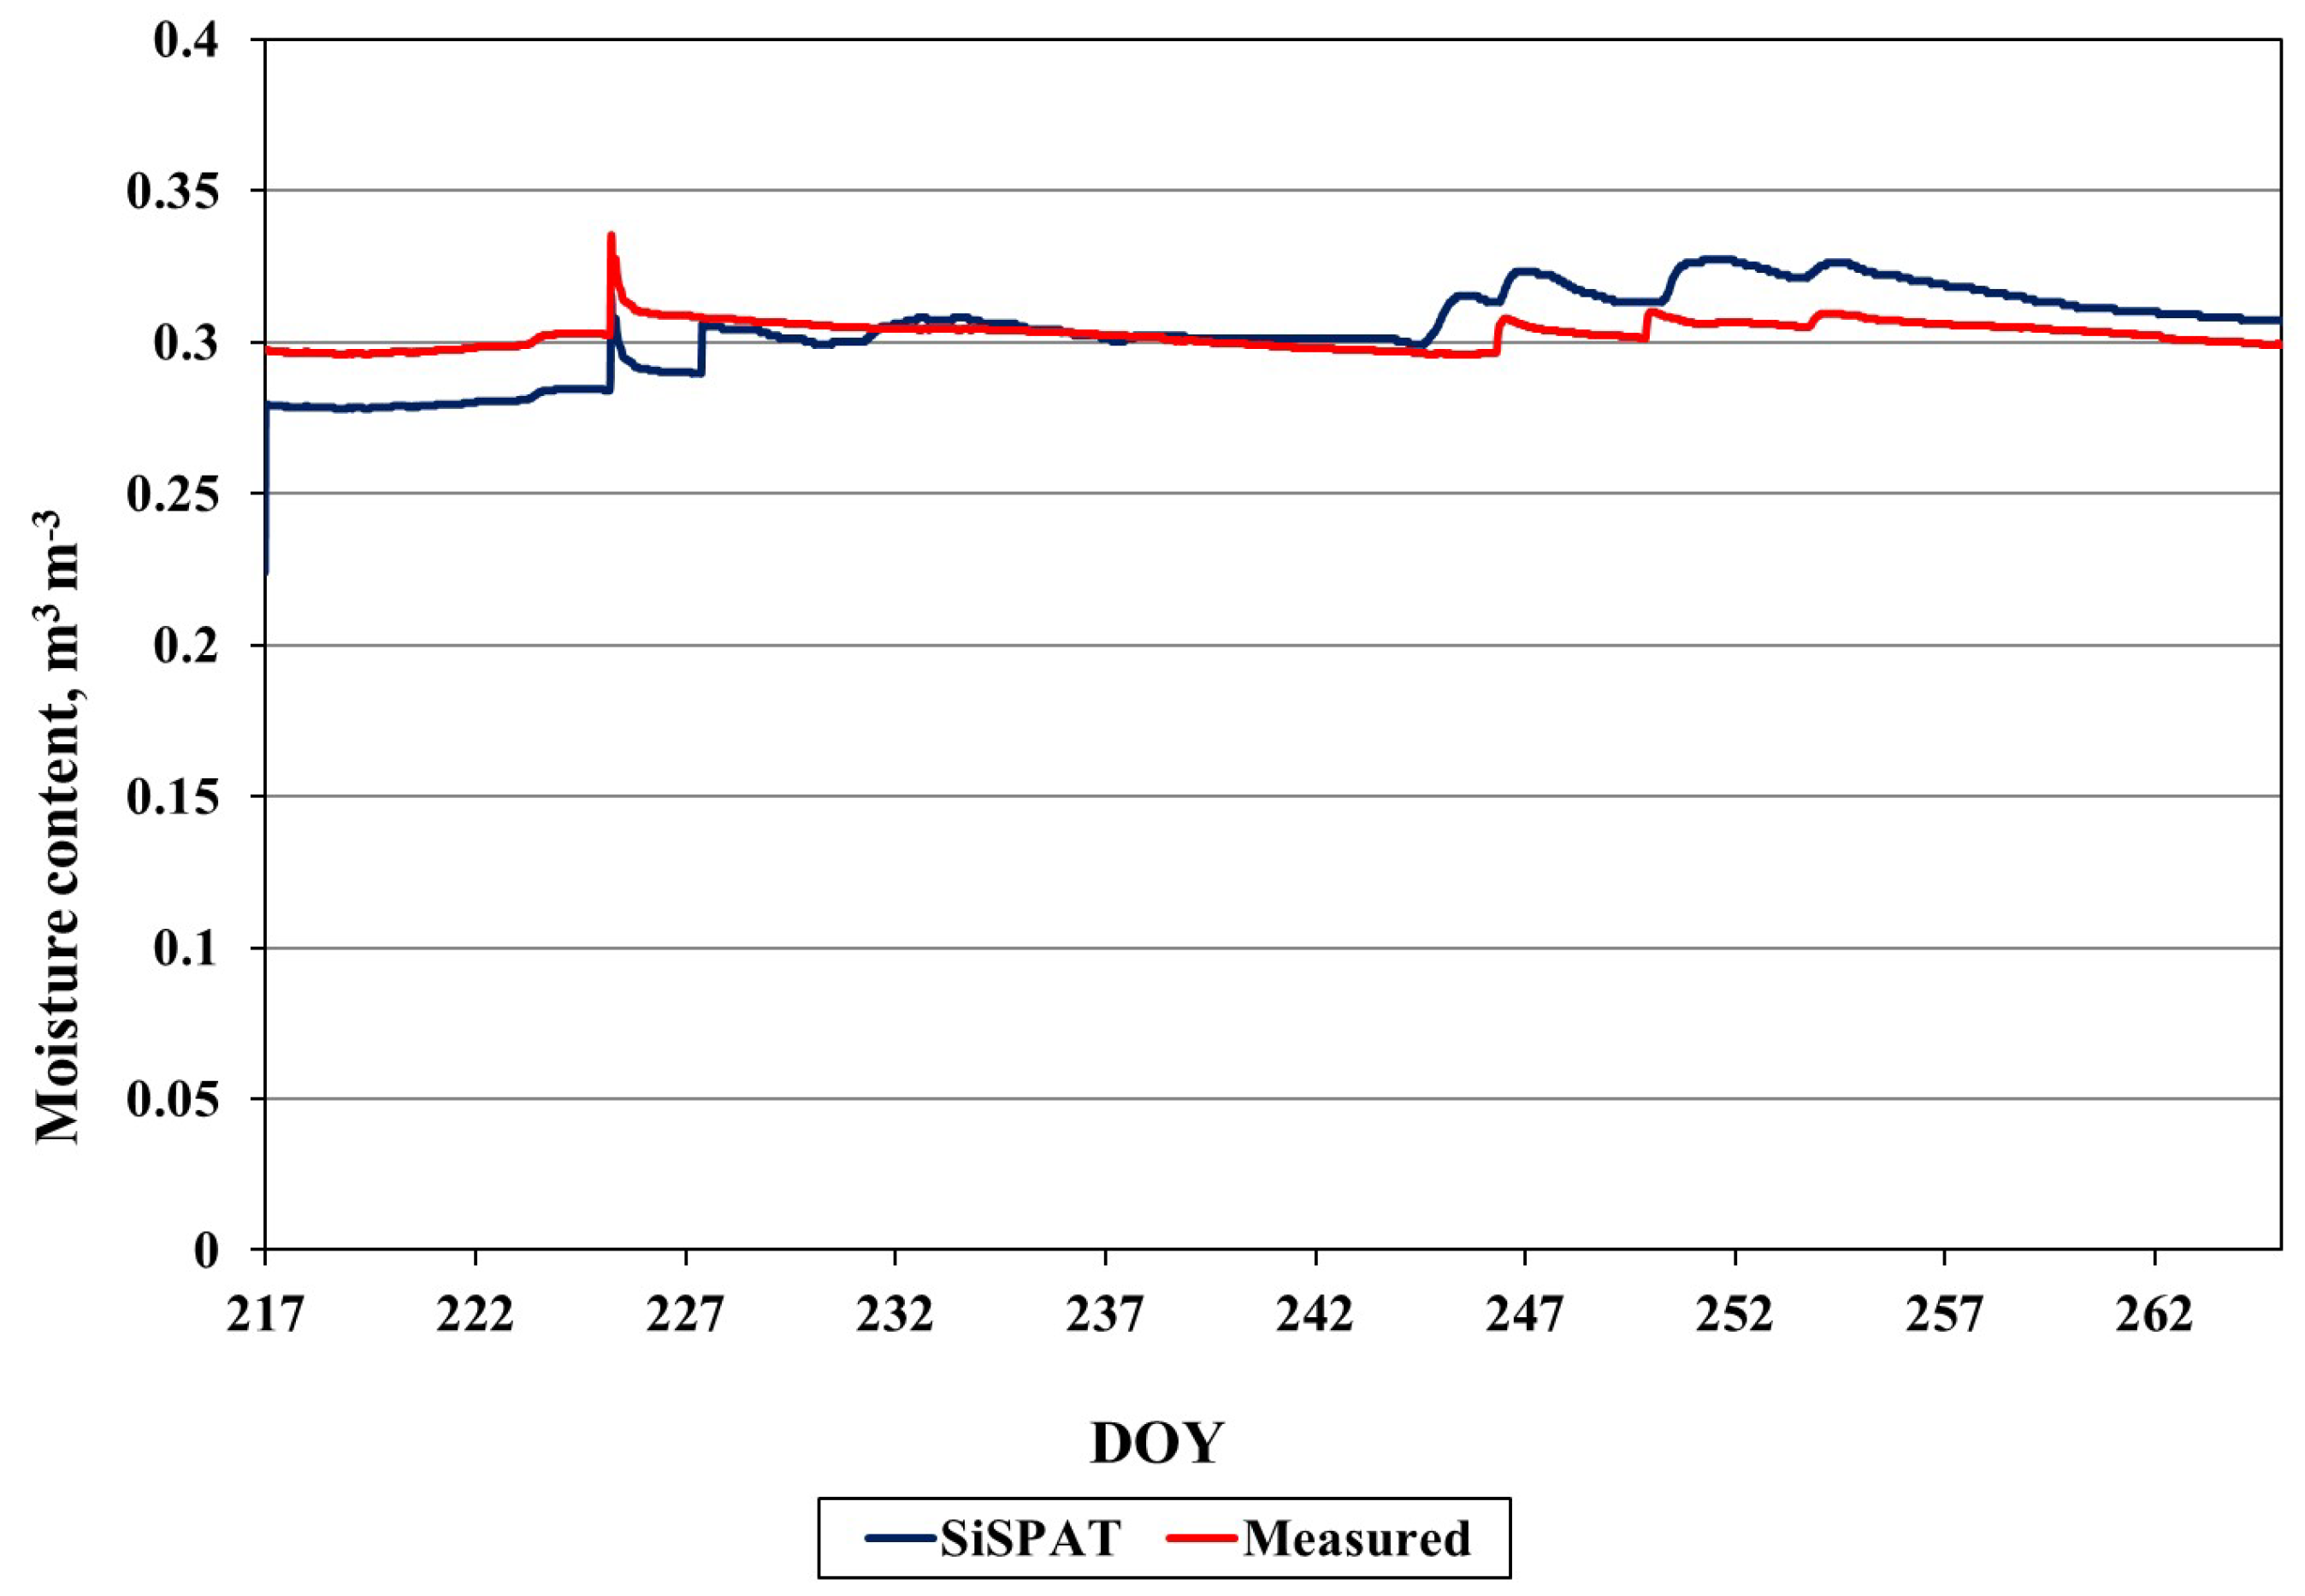
Figure 13,
Figure 14,
Figure 15 and
Figure 16 present a detailed comparison between measured and simulated volumetric soil moisture content (
θ) at four representative depths: 3.5 cm, 7.5 cm, 15 cm, and 35 cm.
In the shallowest layers, 3.5 cm (
Figure 13) and 7.5 cm (
Figure 14), SiSPAT generally overestimated
θ, particularly during extended dry periods. Field measurements indicated a rapid decline in moisture following consecutive days without precipitation, reflecting the sensitivity of the topsoil to evaporation and surface drying. In contrast, the model retained higher moisture values, suggesting a conservative representation of surface desaturation. This behavior likely stems from multiple interacting factors. Firstly, the soil water retention parameters, particularly those derived from van Genuchten curves, may overpredict capillary retention in the uppermost centimeters if not calibrated specifically for the surface layer. Secondly, the model may not fully account for resistance to evaporation induced by surface crusting, compaction, or sealing.
Together, these effects reduce hydraulic connectivity at the soil–atmosphere interface, accelerating actual moisture loss more rapidly than the model predicts. Furthermore, the vertical discretization of the topsoil may be insufficient to resolve steep moisture gradients during rapid drying events. In numerical models, thicker layers smooth θ variations, slowing simulated drying and resulting in overestimation of surface moisture. These deviations in the upper layers have direct implications for latent heat flux (λE), which is strongly coupled with near-surface soil moisture.
At intermediate and deeper depth 15 cm (
Figure 15) and 35 cm (
Figure 16) the agreement between measured and simulated values improved substantially. The model accurately reproduced the timing, amplitude, and trends of moisture changes, including gradual drying patterns and episodic recharge following rainfall events. These deeper layers are less sensitive to short-term atmospheric fluctuations and exhibit more buffered hydrological behavior.
The improved simulation accuracy at depth highlights the robustness of SiSPAT in modeling unsaturated flow and gravity-driven redistribution processes based on well-characterized soil hydraulic properties, such as θsat and Ksat. Moisture dynamics in these layers are primarily governed by capillary gradients and hydraulic conductivity, which are better constrained in the model than rapid surface fluxes.
Across all layers, SiSPAT captured the expected patterns of amplitude reduction and temporal smoothing with increasing depth, consistent with physical principles of soil water redistribution. While the model demonstrates strong overall capability in reproducing vertical soil moisture dynamics under bare-soil conditions, the top 1–7 cm remains the most challenging to simulate with high fidelity. Refinements such as enhanced topsoil parameterization, incorporation of depth-specific hydraulic properties, and finer vertical discretization near the surface would likely improve the model’s ability to capture sharp moisture gradients and rapid desaturation events. These enhancements would also positively influence the accuracy of coupled surface flux simulations, particularly λE and energy balance components, thereby supporting more reliable hydrological and land–atmosphere interaction modeling under temperate oceanic climates.
3.9. Statistical Evaluation of SiSPAT Model Performance
Table 3 provides a quantitative evaluation of the performance of the SiSPAT model against measured energy fluxes, soil temperatures, and soil moisture contents. The results show that the model performs very well in simulating the components of the surface energy balance. Net radiation was reproduced with excellent accuracy (R
2 close to 0.97, RMSE about 22.9 W m
−2), confirming that the model can capture the overall surface energy input with only a small negative bias. Soil heat flux showed moderate agreement (R
2 ≈ 0.58) and a positive bias, reflecting a tendency of the model to slightly overestimate heat conduction into the soil. Latent and sensible heat fluxes were both simulated with reasonable accuracy, although the model tended to underestimate their magnitudes, as indicated by the negative biases. Nevertheless, the relatively high coefficients of determination (0.88 for
λE and 0.70 for
H) confirm that SiSPAT reproduces the temporal dynamics of these fluxes with good fidelity.
For soil temperature, the model achieved consistently high accuracy across all measured depths. Surface soil temperature showed a good match (R2 ≈ 0.87), while deeper layers exhibited even stronger performance. At 10 cm depth, for example, the RMSE was only 0.36 °C and R2 exceeded 0.93, indicating excellent agreement between simulated and observed values. The progressive improvement with depth highlights the model’s ability to capture subsurface thermal processes and the attenuation of diurnal fluctuations below the soil surface.
In contrast, the model performance for soil moisture content was clearly weaker. At the shallowest depth (3.5 cm), the model retained some predictive skill (R2 ≈ 0.29), but for deeper layers the coefficients of determination became negative. Negative R2 values in this context indicate that the model was unable to capture the limited variability of the observed data and that deviations from measurements outweighed the explained variance. This suggests that SiSPAT, as configured in this study, struggles to adequately represent soil hydraulic properties and vertical redistribution processes, particularly below the uppermost soil layer. Despite relatively small RMSE values, the systematic biases and poor correlation highlight the need for improved parameterization of soil water dynamics.
4. Discussion
This study evaluated the performance of the SiSPAT model in simulating surface energy fluxes and soil thermal-hydraulic dynamics under bare soil conditions in a temperate oceanic climate. The evaluation was based on detailed comparisons between model outputs and high-resolution field measurements, focusing on net radiation (Rn), soil heat flux (G), latent heat flux (λE), sensible heat flux (H), soil temperature (Ts), and volumetric soil moisture content (θ) at multiple depths.
The model reproduced net radiation (
Rn) with high fidelity, capturing both the diurnal phase and amplitude with only minor underestimations during peak radiation periods. These results are consistent with Braud et al. [
6], who emphasized the critical role of dynamic albedo parameterization in accurate Rn predictions. Similar agreement was observed in temperate conditions by Grachev et al. [
21] and Jin et al. [
22], further supporting the robustness of SiSPAT in representing surface radiative exchanges. Importantly, the accurate representation of both Rn and soil heat flux demonstrates that SiSPAT can reliably simulate coupled surface energy exchanges under bare soil conditions. In line with recent developments, SiSPAT has also been successfully integrated with high-frequency field measurements and remote sensing data to simulate energy and moisture dynamics across diverse environmental conditions [
23,
24]. These applications reinforce the adaptability of the model, its fine-scale resolution, and its capacity to capture soil–atmosphere interactions, such as evaporation and thermal gradients, thereby supporting the reliability of its predictions in the present study.
Simulations of soil heat flux (
G) were found to be robust in both magnitude and timing, reflecting the model’s ability to capture subsurface thermal dynamics with a high degree of accuracy. Only minor underestimations were observed during midday peaks under high radiation, when steep vertical temperature gradients intensified heat transfer. This observation aligns with Bhattacharya et al. [
12] and Bhattarai and Wagle [
25], who reported the importance of resolving near-surface thermal conductivity in SVAT models. The strong agreement in both trend and timing lends further confidence to the model’s representation of energy balance processes. Additionally, SiSPAT successfully captured the soil’s thermal inertia, demonstrated by its ability to reproduce the lag between surface forcing and subsurface propagation of heat. This capability is particularly valuable in temperate maritime environments, where rapidly changing radiation regimes caused by cloud cover strongly influence soil thermal responses. Such consistency confirms that SiSPAT’s estimates of
G can serve as reliable diagnostic variables in coupled models of evapotranspiration, boundary layer dynamics, and agricultural land management applications requiring precise assessment of soil heat exchange.
Latent heat flux (
λE) exhibited systematic underestimation during midday periods, particularly under dry soil conditions, which is likely linked to the model’s treatment of surface resistance that increases rapidly with drying. This behavior is consistent with findings by Wang [
26] and Onyeaka et al. [
27], who highlighted the sensitivity of
λE to topsoil desaturation and the limitations of simplified resistance formulations in capturing rapid evaporative shifts in maritime temperate climates. Furthermore, cumulative evaporation tended to be overestimated during wetter periods (DOY 234–267), a pattern also noted by Yang et al. [
28], Baalousha et al. [
29], and Banerjee et al. [
30]. These studies demonstrated that lumped SVAT models often overpredict evaporation during wet spells due to assumptions of persistent surface moisture and insufficient representation of intermittent drying–rewetting cycles. Together, these results point to a redistribution bias in SiSPAT’s λE simulations, where deviations primarily reflect misrepresentation of temporal variability rather than systematic errors in total evaporative demand.
Sensible heat flux (
H) was generally underestimated around midday, in close association with underestimation of surface temperature (
Ts), which governs the gradient between the soil surface and the overlying air. Comparable discrepancies were reported by Deng et al. [
31] and Sayão et al. [
32], who noted that fine-scale fluctuations in
Ts are difficult to capture under bare soil or sparsely vegetated conditions. Despite this, the model effectively reproduced the diurnal trends and the directional behavior of
H. Improvements in H simulation would require refinement in Ts estimation and potentially the implementation of dynamically adjusted turbulence parameterizations, particularly with respect to aerodynamic resistance, as these directly regulate sensible heat transfer under variable boundary layer conditions. Nevertheless, the observed agreement in broader flux dynamics demonstrates that SiSPAT remains a reliable tool for assessing surface energy partitioning.
Soil surface temperature (
Ts) was consistently underestimated during peak radiation periods, a discrepancy likely associated with simplified parameterizations of surface properties such as albedo, emissivity, and roughness length, and with limited vertical resolution near the surface. These findings are consistent with the observations of Al-Shibli et al. [
33], who emphasized the sensitivity of
Ts to near-surface parameterization schemes. Soil temperature profiles showed improved accuracy with depth, where shallow layers (5–10 cm) displayed only minor deviations, while deeper layers (20 cm) exhibited slight phase lags in the simulated diurnal cycle. This is in line with Shih [
34] and Vereecken et al. [
35], who reported that accurate reproduction of soil thermal profiles requires horizon-specific calibration of thermal diffusivity and heat capacity. The ability of SiSPAT to replicate soil temperature dynamics across layers further supports its applicability in analyzing soil heat transport and validating land surface model parameterizations.
Simulated soil moisture content (
θ) was generally overestimated in shallow layers (3.5–7.5 cm) during dry conditions, most likely due to the model’s underrepresentation of evaporation-driven desaturation and surface crust formation processes. Similar outcomes were reported by Sela et al. [
36] and Duarte and Hernandez [
37], who observed that SVAT models often misrepresent surface drying dynamics. At deeper layers (15–35 cm), the model reproduced the overall wetting and drying tendencies but failed to capture the limited variability of the observed data, as indicated by weak or negative coefficients of determination. This suggests that SiSPAT could follow the general redistribution trends, but its predictive skill declined with depth due to inadequate representation of soil hydraulic properties and vertical water movement. These findings are consistent with the evaluation of Li et al. [
38], who noted that SVAT models often exhibit redistribution biases rather than accurate reproduction of soil water storage dynamics.
A recurring and unifying pattern across the different fluxes and soil conditions is the tendency of SiSPAT to underestimate peak values during midday hours, particularly under conditions of strong solar radiation and elevated surface temperatures. This pattern was evident in Rn, G, λE, H, Ts, and shallow soil moisture, where deviations were linked to the combined effects of limited vertical resolution in the topsoil, simplified parameterizations of albedo and emissivity, conservative formulations of thermal and hydraulic properties, and static treatments of aerodynamic resistance under strongly convective boundary layer conditions. These limitations resulted in consistent suppression of midday peaks in Ts, H, and λE, slight underestimation of midday amplitudes in G, and retention of excess water in the upper soil layers during extended dry spells. Although such localized deviations reduce accuracy during extreme diurnal forcing, the model reliably reproduced diurnal trends, phase timing, and directional changes across all flux components, thereby demonstrating structural consistency in representing soil–atmosphere interactions.
The accurate simulation of energy and moisture fluxes by SiSPAT also demonstrates its practical relevance under transitional land use phases. During post-harvest periods and rotational fallows, soils are exposed to rapid evaporative loss and extreme temperature fluctuations, conditions that are challenging to monitor and manage. SiSPAT’s ability to capture both flux dynamics and soil moisture variations under these transient conditions highlights its potential for integration into land surface modeling frameworks in temperate regions. This capability supports scenario-based evaluations, including reduced tillage, cover cropping, and optimized irrigation schedules, which are essential for maintaining soil moisture, mitigating heat stress, and enhancing agroecosystem resilience. The value of such applications has been corroborated in recent studies [
23,
24], demonstrating the usefulness of SiSPAT in evaluating land management strategies under variable climatic and agronomic conditions.
Overall, the findings of this study confirm that SiSPAT provides a comprehensive and physically consistent representation of coupled energy and water fluxes in bare soil systems under temperate oceanic conditions. By accurately reproducing net radiation, soil heat flux, latent and sensible heat dynamics, and soil thermal–hydraulic behavior across multiple depths, the model proves to be a robust tool for both research and management purposes. The results further highlight the importance of integrating high-resolution meteorological and soil data for accurate simulations, as emphasized by Zhou et al. [
39] and Ford and Quiring [
40], while its demonstrated performance aligns with broader model evaluations reported in temperate climates [
41]. SiSPAT’s ability to simulate processes over fine temporal and spatial scales makes it particularly valuable for integrated assessments of soil–atmosphere interactions, offering insights that support scientific understanding as well as informed decision-making in climate-sensitive agriculture and land use planning.
