Article

Quantifying the Impacts of Climate Change and Human Activities on Monthly Runoff in the Liuhe River Basin, Northeast China

1
School of Resources and Geosciences, China University of Mining and Technology, Xuzhou 221116, China
2
School of Environment and Disaster Management, Institute of Disaster Prevention, Langfang 065200, China
*
Author to whom correspondence should be addressed.
Sustainability 2025, 17(17), 8050; https://doi.org/10.3390/su17178050 (registering DOI)
Submission received: 31 July 2025 / Revised: 29 August 2025 / Accepted: 5 September 2025 / Published: 7 September 2025

Abstract

Both climate change and human activities have had a significant impact on hydrological processes. Quantification of affecting factors on river regime changes is scientifically essential for understanding hydrological processes and sustainable water resources management in the basins. This study investigates the features of variations in meteorological and hydrological variables in the Liuhe River Basin (LRB) from 1956 to 2020 based on various observed records and statistical methods. It then quantitatively identifies the possible impacts of climate variability and human activities on runoff in the LRB using the empirical methods and the Budyko framework. The results show that (1) the runoff demonstrates a significantly decreasing trend over the past 65 years, but the rainfall has no obvious trend with significant interannual fluctuations, and potential evapotranspiration exhibits a weekly decreasing trend, particularly in summer. (2) The runoff series can be divided into two periods, i.e., the baseline (1956–1969) and change (1970–2020) periods, and the change period can also be divided into two stages, i.e., stage I (1970–1999) and stage II (2000–2020). (3) Human activities are the dominant factors in the runoff decline in the LRB, with the contribution rates being greater than 80% in the change period, particularly for stage II. The analysis of this study can provide a reference for the rational utilization of water resources in the LRB.

1. Introduction

In recent years, global climate change and human activities have significantly influenced hydrological cycle processes at both global and regional scales [1,2,3], with substantial changes having been observed in approximately 30–40% of runoff and 40–50% of suspended sediment load in major global rivers [4]. Extensive research data demonstrate that significant runoff alterations have occurred in numerous regions and river basins under the combined influences of human activities and climate variations [5,6,7]. The synergistic impacts of climate change and human activities on river runoff have induced pronounced hydrological alterations. Climate change primarily refers to climatic elements such as precipitation, temperature, and evaporative capacity, while human activities mainly encompass underlying surface changes induced by land use alterations, construction of water conservancy projects, and vegetation restoration, as well as changes in water volume due to socio-economic development. Furthermore, the spatial heterogeneity of these driving factors results in significant regional disparities in runoff responses [8]. For example, the Naodehai Reservoir, completed in 1942, is situated at the transition between the upper and lower reaches of the Liuhe River. Since its construction, the lower course of the river has been relocated five times, resulting in a maximum lateral displacement of the river mouth of 12 km [9]. These changes directly affect the allocation, development, management, and utilization of water resources at watershed scales. Therefore, scientific understanding of response mechanisms in runoff changes and systematic quantification of climatic versus anthropogenic contributions are essential for advancing knowledge of regional water cycle dynamics and providing critical references for sustainable water resources management.
Currently, many previous studies have been conducted to assess hydrological regime changes. Huang et al. [10] applied three integrated methods for quantitative analysis in the Dawen River Basin and determined that hydrological modeling (SWAT) is the most suitable approach, concluding that human activities predominate in runoff changes. Saifullah et al. [11] analyzed runoff changes in the Kunhar River Basin using a hydrological modeling method to reconstruct natural runoff; their results indicated a 75% contribution from human activities to the basin changes. Alifujiang et al. [12] adopted both a Periodic Trend Summation model and the double mass curve method to assess the impacts on runoff changes in the Lake Issyk-Kul Basin. Both methods revealed that climate change is the primary driver of runoff changes, with contributions of 64.7% and 82%, respectively. Existing studies collectively demonstrate that either climatic factors or anthropogenic influences may dominate runoff changes. Among the commonly used approaches for runoff change attribution analysis, three methods predominate: the Budyko hypothesis-based approach, hydrological simulation, and the double mass curve method. Commonly used hydrological models for the simulation method include the SWAT model and the VIC model [13]. The double mass curve method identifies runoff change mechanisms by analyzing the precipitation-runoff relationship, offering relative computational simplicity [14]. The Budyko hypothesis framework establishes a nonlinear relationship between precipitation (P), potential evapotranspiration (PE), and runoff (R). With clear physical foundations and parameter parsimony, this framework proves particularly suitable for long-term attribution analysis in human-modified basins and has gained widespread application in runoff change attribution studies [15]. Shahid et al. [16] compared the ABCD model and Budyko framework to evaluate relative contributions of climate change and land use change to runoff changes in Pakistan’s Soan River Basin. The comparative analysis yielded consistent results. The study quantified the contributions of climate change and human activities at 68% and 32%, respectively, validating the applicability of the Budyko hypothesis-based method for runoff change analysis.
The Liuhe River Basin (LRB), a sediment-laden tributary located in the middle and lower reaches of the Liaohe River, is part of one of China’s seven major river systems, situated in the southwestern part of Northeast China. It has undergone varying degrees of change in recent decades. For example, Tian et al. [17] conducted a long-term analysis of runoff in the Liaohe River Basin and found that runoff changes were primarily influenced by human activities, showing an overall declining trend, with the contribution rate exceeding 80%. Changes in precipitation and evaporation were the most direct and important factors affecting runoff volume, while the combined contribution of precipitation and evaporation was no more than 20%. In recent years, the LRB has experienced high evaporation rates, with the average annual evaporation reaching 2000 mm, making it one of the regions with the highest evaporation rates in Northeast China [18]. This frequently leads to water scarcity issues. Therefore, analyzing the evolution patterns of water cycle elements in the LRB and quantifying the impacts of climate change and human activities on runoff changes in this basin are key to the rational utilization of water resources.
Although numerous studies have been devoted to revealing the impacts of climate change and human activities on river runoff and have developed various attribution analysis methods, such as the Budyko hypothesis, hydrological modeling, and the double mass curve method, systematic research on small and medium-sized river basins in the semi-arid region of Northeast China remains relatively scarce. Most existing studies have certain limitations. Firstly, they predominantly focus on large rivers or humid regions, paying insufficient attention to typical small basins like the LRB, which is characterized by semi-aridity, high evaporation, and high sediment load. Secondly, the research methods are often singular, lacking comparative validation across multiple approaches, which affects the robustness of the conclusions. Furthermore, analyses of runoff changes are mostly confined to entire study periods without detailed division and comparison of different phases after change points, making it difficult to reveal the dynamic evolution of human impacts. Moreover, quantitative analyses of the specific driving mechanisms of human activities (such as land use transformation and the influence of water conservancy projects) remain weak. Finally, few studies have connected hydrological changes in such basins with global climate modes (e.g., Atlantic Multidecadal Oscillation (AMO), El Niño/Southern Oscillation (ENSO), Pacific Decadal Oscillation (PDO)), limiting the understanding of regional hydrological variability from the perspective of large-scale climate dynamics [19,20]. Thus, in this study, our specific objectives were to (1) assess the characteristics of climate and runoff changes in the LRB from 1956 to 2020, (2) detect the possible influencing factors of the runoff changes in the LRB, and (3) quantify and separate the contributions of climate changes and human activities to runoff changes in the LRB. The results will provide fundamental scientific references on water resource allocation, water conservancy project construction, and ecological project measures, and benefits in the basin or surrounding areas.

2. Materials and Methods

2.1. Study Area and Data

2.1.1. Study Area

The Liuhe River originates in the Dalushan Mountains of Naiman Banner, Inner Mongolia, located between 121°16′–122°52′ E longitude and 41°54′–42°52′ N latitude. The LRB primarily flows through Inner Mongolia’s Hure Banner and Horqin Left Rear Banner, as well as Fuxin, Zhangwu, and Xinmin in Liaoning Province, before discharging into the Liaohe River. The river has a total length of 302 km and a basin area of 5798 km2, with an annual mean runoff volume of 218 million m3. This region is characterized by shallow mountain loess hilly terrain, and the river is sediment-laden due to severe soil erosion. The topography of the LRB is undulating, sloping from higher elevations in the north to lower elevations in the south. It experiences a continental cool-temperate climate, with mean annual temperatures ranging from 6 to 8 °C. Annual precipitation ranges between 400 and 600 mm, increasing from north to south. Precipitation from June to September accounts for 75–80% of the annual total, and the seasonal precipitation regime exhibits a pronounced monsoonal pattern. This concentrated, high-intensity rainfall frequently triggers landslides and flooding. The basin is characterized by relatively low total precipitation and pronounced intra-annual unevenness in its distribution, coupled with poor vegetation coverage within the watershed.

2.1.2. Data Sources

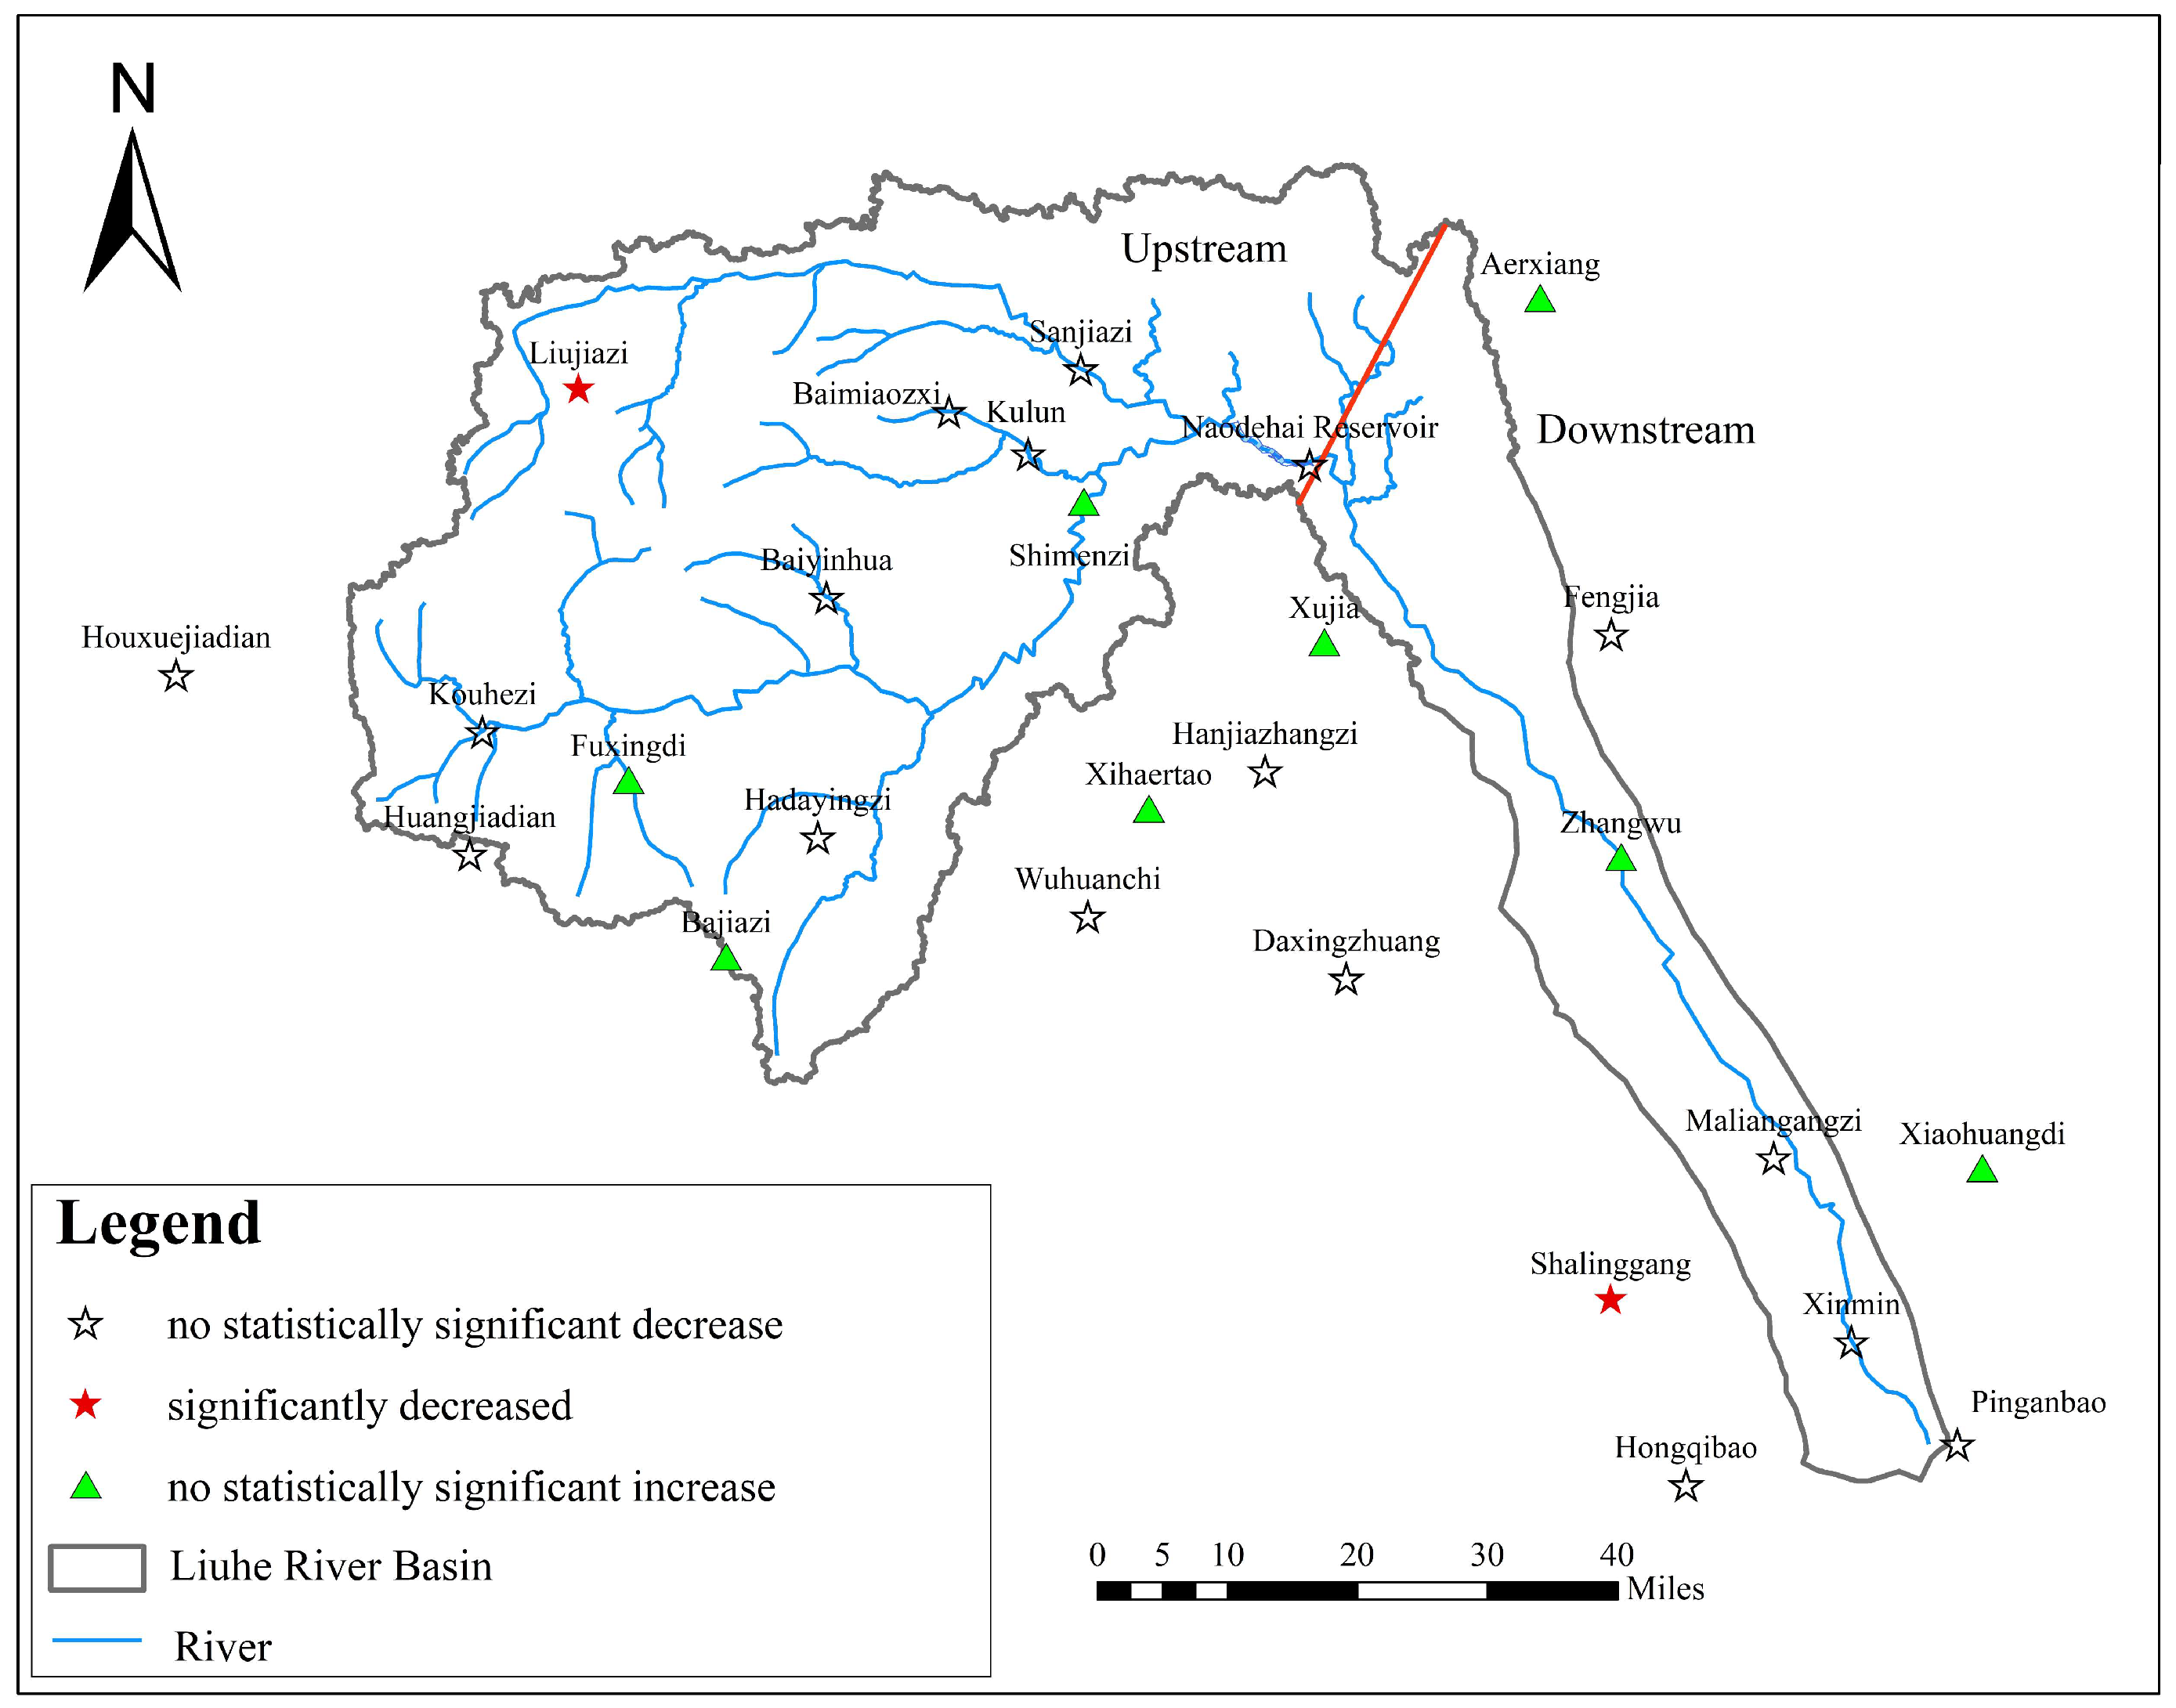
The monthly runoff data (1956–2020) from six hydrological stations (Shimenzi, Sanjiazi, Baimiaozi, Naodehai Reservoir, Zhangwu, and Xinmin) and monthly precipitation data (1956–2020) from 27 rain gauge stations (including three national meteorological stations) are used in this work. The annual evaporation data (1956–2018) from five evaporation stations (Naodehai Reservoir, Kulun, Gongzhutun, Zhangwu, and Xinmin) were also used in this study. The spatial distribution of all stations is illustrated in Figure 1. Moreover, the daily-scale potential evapotranspiration (PET) was estimated using the Penman–Monteith method based on the observed records from five meteorological stations (Kulun, Zhangwu, and Xinmin in the basin; Baoguotu and Fuxin in the surrounding area), and the annual and monthly PET were then obtained. Additionally, the land use cover in the LRB in 1980 and 2023, the monthly indices of the PDO, AMO, and the multivariate ENSO index (MEI) are downloaded for relevant investigation.

2.2. Trend and Mutation Testing Methods

2.2.1. M-K Trend Test

The Mann–Kendall trend test (abbreviated as M-K test) is a method recommended by the World Meteorological Organization (WMO) for trend analysis in environmental time series data [21]. It does not require that the data be normally distributed or linear. Thus, it was widely used for identifying the abrupt point and change trend of runoff and other variables in the field of hydrology and meteorology.
Considering the sequence Xi (i = 1, 2, …, n) as a set of sequentially sampled observations, with Fi(x) representing the distribution function of sample Xi, the M-K hypothesis test establishes that: Null Hypothesis (H0): Fi(x) = … = Fn(x), meaning that sequence Xi (i = 1, 2, …, n) consist of independent and identically distributed random samples. Alternative Hypothesis (H1): Fi(x) > … > Fn(x) or H1: Fi(x) < … < Fn(x), indicating the presence of a statistically significant increasing or decreasing monotonic trend in the sequence. The test statistic is as follows:
S = i = 1 n 1 j = i + 1 n sgn ( x j x i ) = 1 x j > x i 0 x j = x i 1 x j < x i
The statistic S follows a normal distribution with a mean of 0 and variance var(S) = n(n − 1)(2n + 5)/18. For the test statistic Z, the M-K trend test calculates the Z value, where a positive Z indicates an increasing trend and a negative value denotes a decreasing trend. When the absolute value of Z is larger than 1.96, the trend is considered statistically significant at the 95% confidence level [22].

2.2.2. Sliding T-Test

This study employs the moving t-test method to identify abrupt change points in runoff characteristics, which are then used to demarcate baseline and change periods [23]. The moving t-test examines whether the difference between the means of two sample groups is statistically significant to detect abrupt changes.
For a time series x with n samples, an arbitrary reference point is designated to divide the series into two subsequences x1 and x2 with sample sizes n1 and n2, respectively. Let x ¯ 1 and x ¯ 2 represent the means of the two subsequences, with s 1 2 and s 2 2 denoting their variances. Define the statistic:
t = x ¯ 1 x ¯ 2 s 1 n 1 + 1 n 2
s = n 1 s 1 2 + n 2 s 2 2 n 1 + n 2 2
The statistic in Equation (2) follows Student’s t-distribution with n − 2 degrees of freedom [24].

2.3. Hydrothermal Coupling Equation Based on the Budyko Hypothesis

The Budyko equation is a coupled water–energy balance equation, which has achieved iconic status in hydrology for its concise and accurate representation of the relationship between annual evapotranspiration and long-term average water and energy balance at catchment scales [25]. Thus, we employ the Budyko framework to analyze runoff variations in the LRB, utilizing Fu’s equation for quantitative assessment [26]:
A E P = 1 + P E T P 1 + P E T P w 1 w
where AE is the actual evapotranspiration (mm); P is the rainfall (mm); PET is the potential evapotranspiration (mm), which represents the amount of water evaporated and transpired into the atmosphere from an amply supplied underlying surface (i.e., a fully saturated surface or open water body); w is the parameter of the underlying surface, which reflects the properties of the underlying surface, and the higher w is, the greater the basin’s propensity for evapotranspiration.
The contribution of climate change is attributed to variations in P and AE, and the contribution of human activities is caused by changes in the underlying surface parameter w. Based on data from the baseline period (1956–1970) for AE, PET, and P, a nonlinear curve-fitting procedure was employed, yielding a value of w = 2.56. This value is adopted to represent the underlying surface conditions characteristic of the baseline period. Then, keeping w constant, the measured P and PET from the stage I (1970–1999) and stage II (2000–2020) of the change period were incorporated into the equation to obtain AE. Then, the runoff R is obtained, which represents the simulated runoff driven solely by climate. Combined with the runoff change attribution analysis in Section 3.2, the impact rates of climate change and human activities on runoff change can be determined.

2.4. Linear Regression Model

Linear regression and double mass curve methods are the most common and simple empirical methods to determine the impacts of human activities and climate variability on runoff. First, a mathematical model is constructed monthly to establish the relationship between runoff and rainfall during the baseline period. Subsequently, the runoff series in the change period is reconstructed by applying the precipitation series in the linear regression model. Finally, the relative contributions of climate change (represented by rainfall) and human activities to runoff are quantified using the model, and the dominant control effect of rainfall as a natural driving force on runoff during periods of historical stability is assessed. Additionally, the model addresses the issue of unclear physical significance, ensuring transparency, ease of understanding, and practical applicability.

2.5. Runoff Change Attribution Analysis

The difference between the measured runoff depth and the baseline runoff depth during the period influenced by human activities primarily consists of two components: human activities and climate change [27], and the multi-year average R of the two periods is calculated. The difference between the multi-year average runoff depth of the two periods is expressed as follows:
Δ R = R T 2 R T 1
Use the following formula to calculate the amount and rate of impact of climate change and human activities on runoff change.
R 0 R simulation = Δ R climate
R simulation R observation = Δ R human
η human = R human R climate + R human 100 %
η climate = R climate R climate + R human 100 %
where R0 is the average annual runoff depth in the baseline period, mm; Rsimulation is the annual runoff depth after restoration in the change period, mm; Robservation is the actual annual runoff depth in the change period, mm; ΔRclimate means climate impact amount, mm; ΔRhuman represents human impact amount, mm; ηclimate and ηhuman are the impact rate caused by climate and human, respectively.

3. Results and Discussion

3.1. Trend and Mutation Analysis of Hydrometeorological Elements

3.1.1. Precipitation Changes

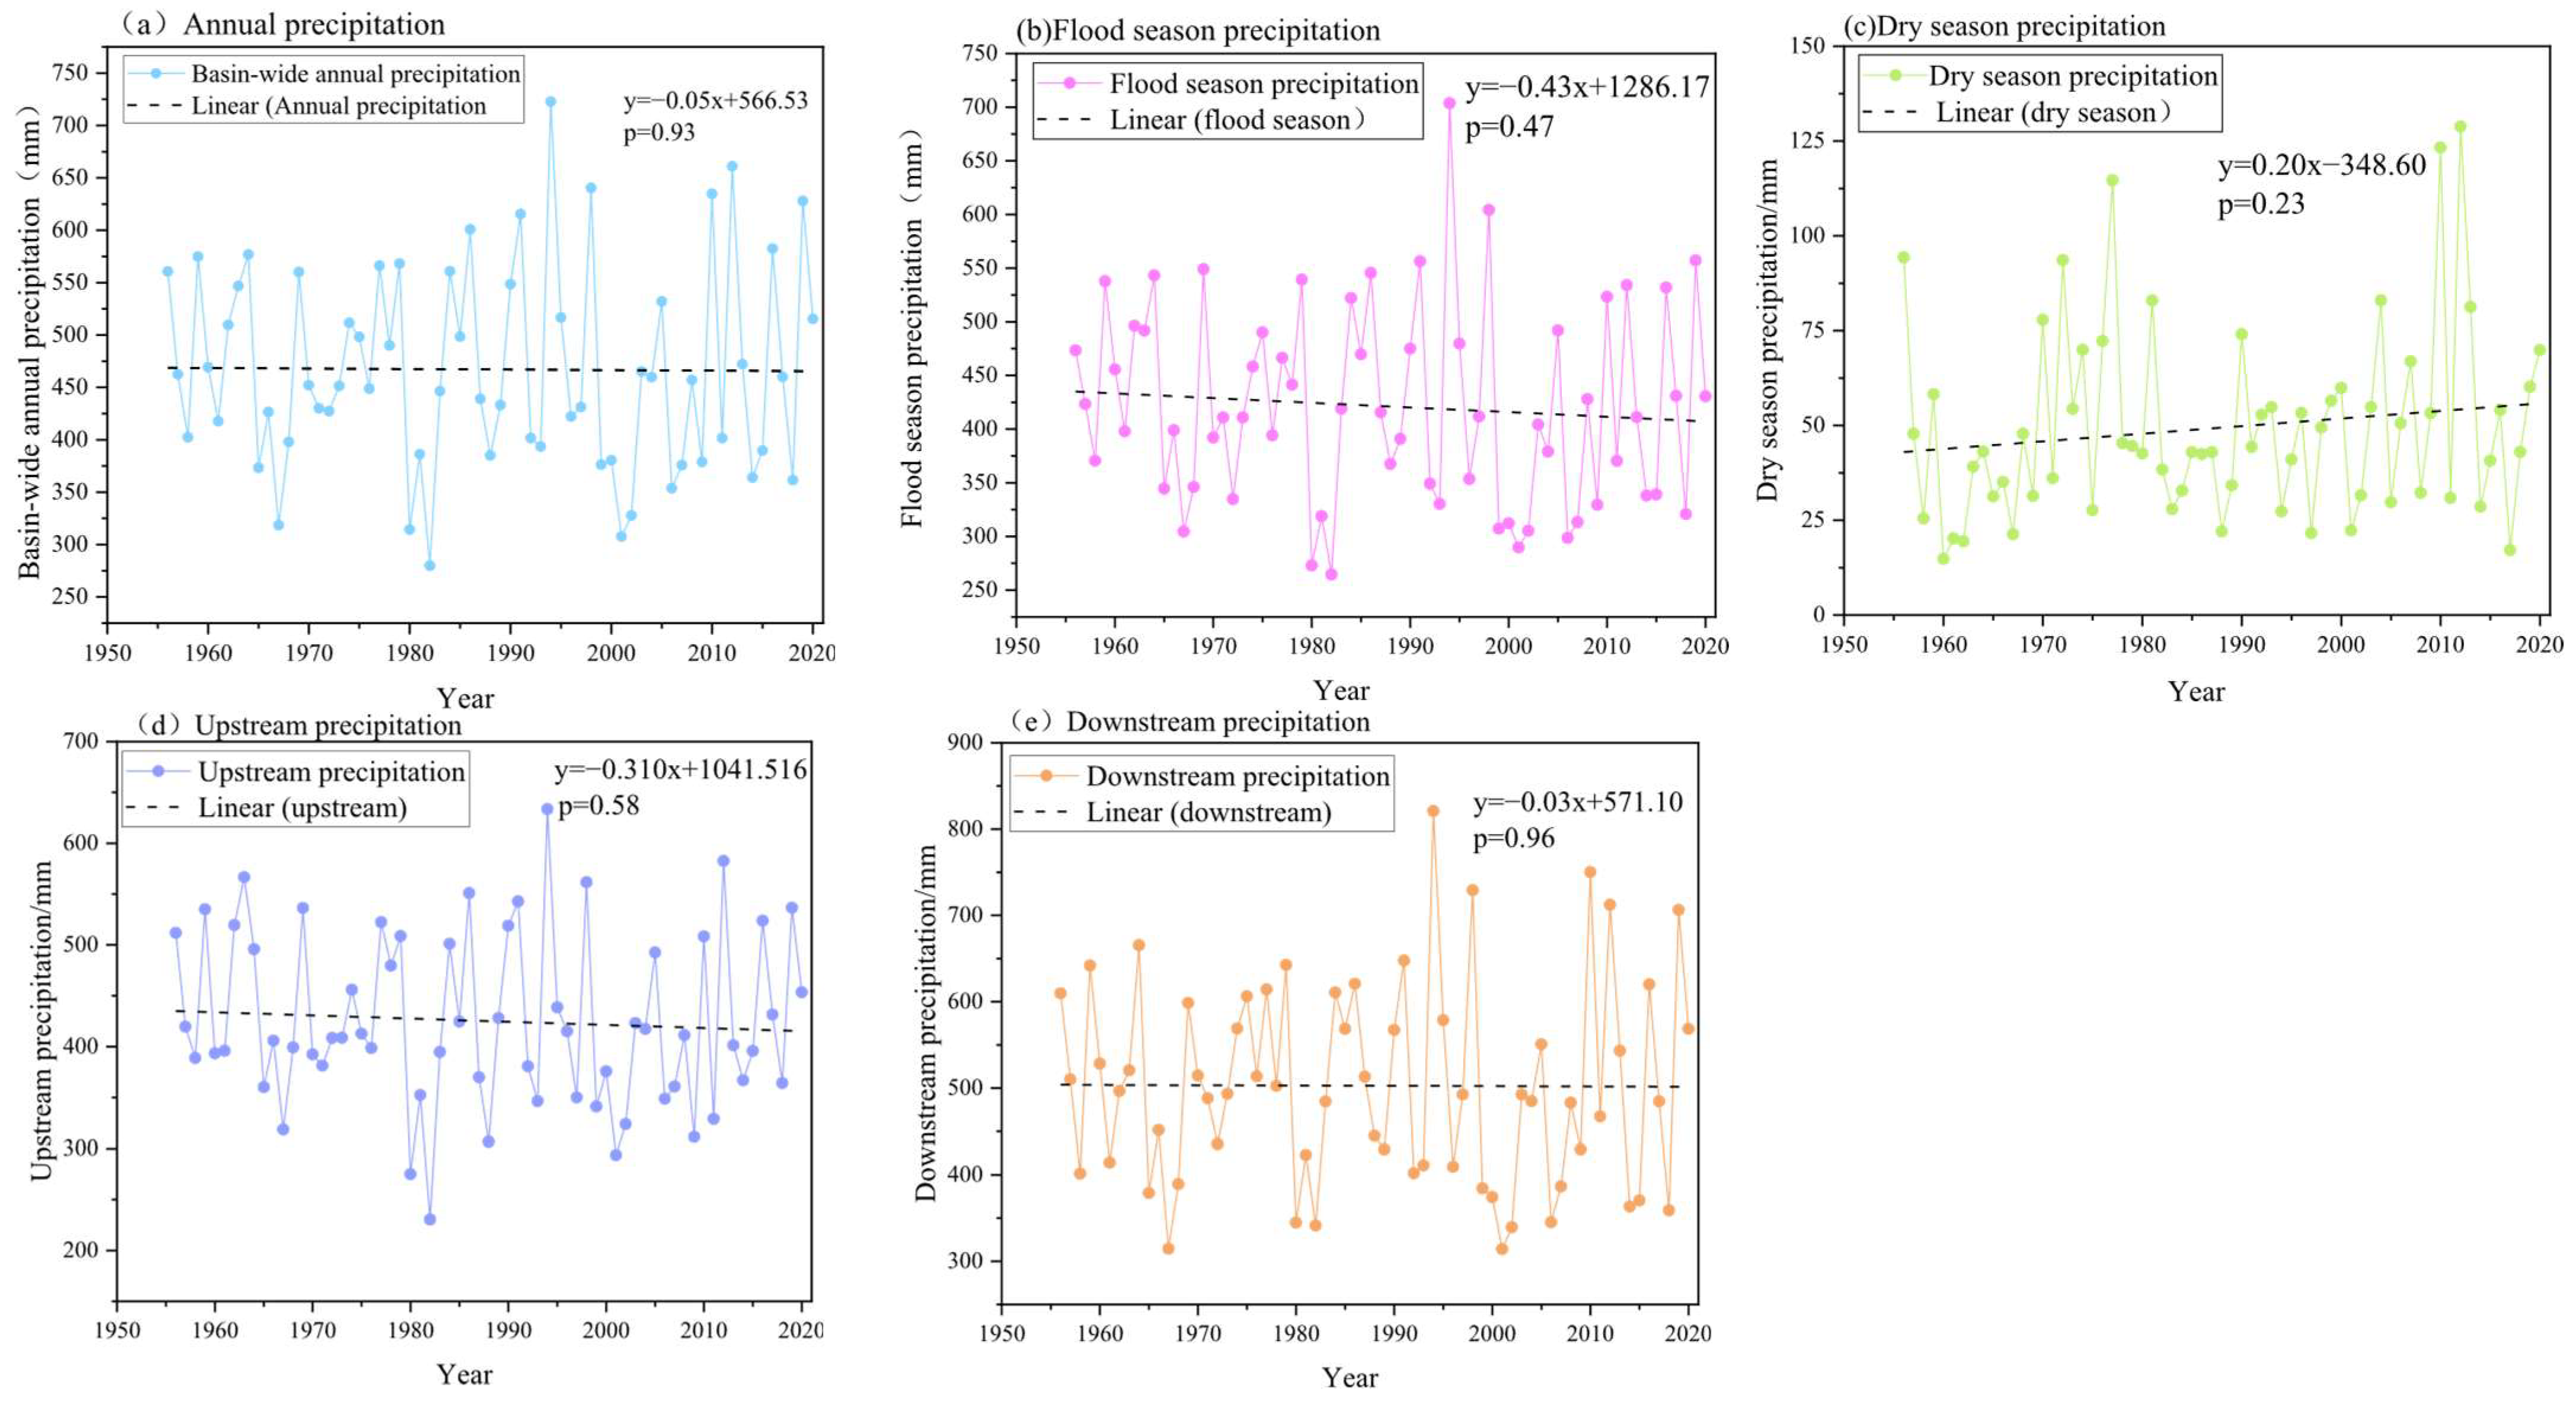
Firstly, the variation patterns of the annual average, flood season (April to September), and non-flood season precipitation were statistically analyzed, as shown in Figure 2. Overall, the annual precipitation and the average precipitation during the flood season in the entire basin exhibited a downward trend, while that during the non-flood season showed an upward trend; none of these trends were significant. According to the p-value shown in Figure 2, the annual rainfall does not exhibit a significant temporal trend and cannot be effectively modeled using a linear regression approach. The M-K trend test and sliding t-test revealed no statistically significant abrupt changes in precipitation across the basin. Figure 2 presents the interannual variations in precipitation for: (1) annual mean, (2) flood season (April–September), and (3) dry season (October–March) across the entire basin and its upstream/downstream (delimited by the Naodehai Reservoir). The results demonstrate decreasing trends in annual and flood-season precipitation basin-wide, offset by increasing dry-season precipitation. Mean precipitation values were determined as 467.1 mm (annual), 421.1 mm (flood season), and 49.4 mm (dry season) for the entire basin; 424.2 mm (upper reaches) and 435.6 mm (lower reaches). While both upper and lower reaches experienced declining annual precipitation, the trend was less pronounced downstream. Moreover, there are decreasing trends at 19 stations compared to increasing trends at 8 stations, with Liujiazi and Shalinggang exhibiting statistically significant declines, as illustrated in Figure 3.

3.1.2. Runoff Variations

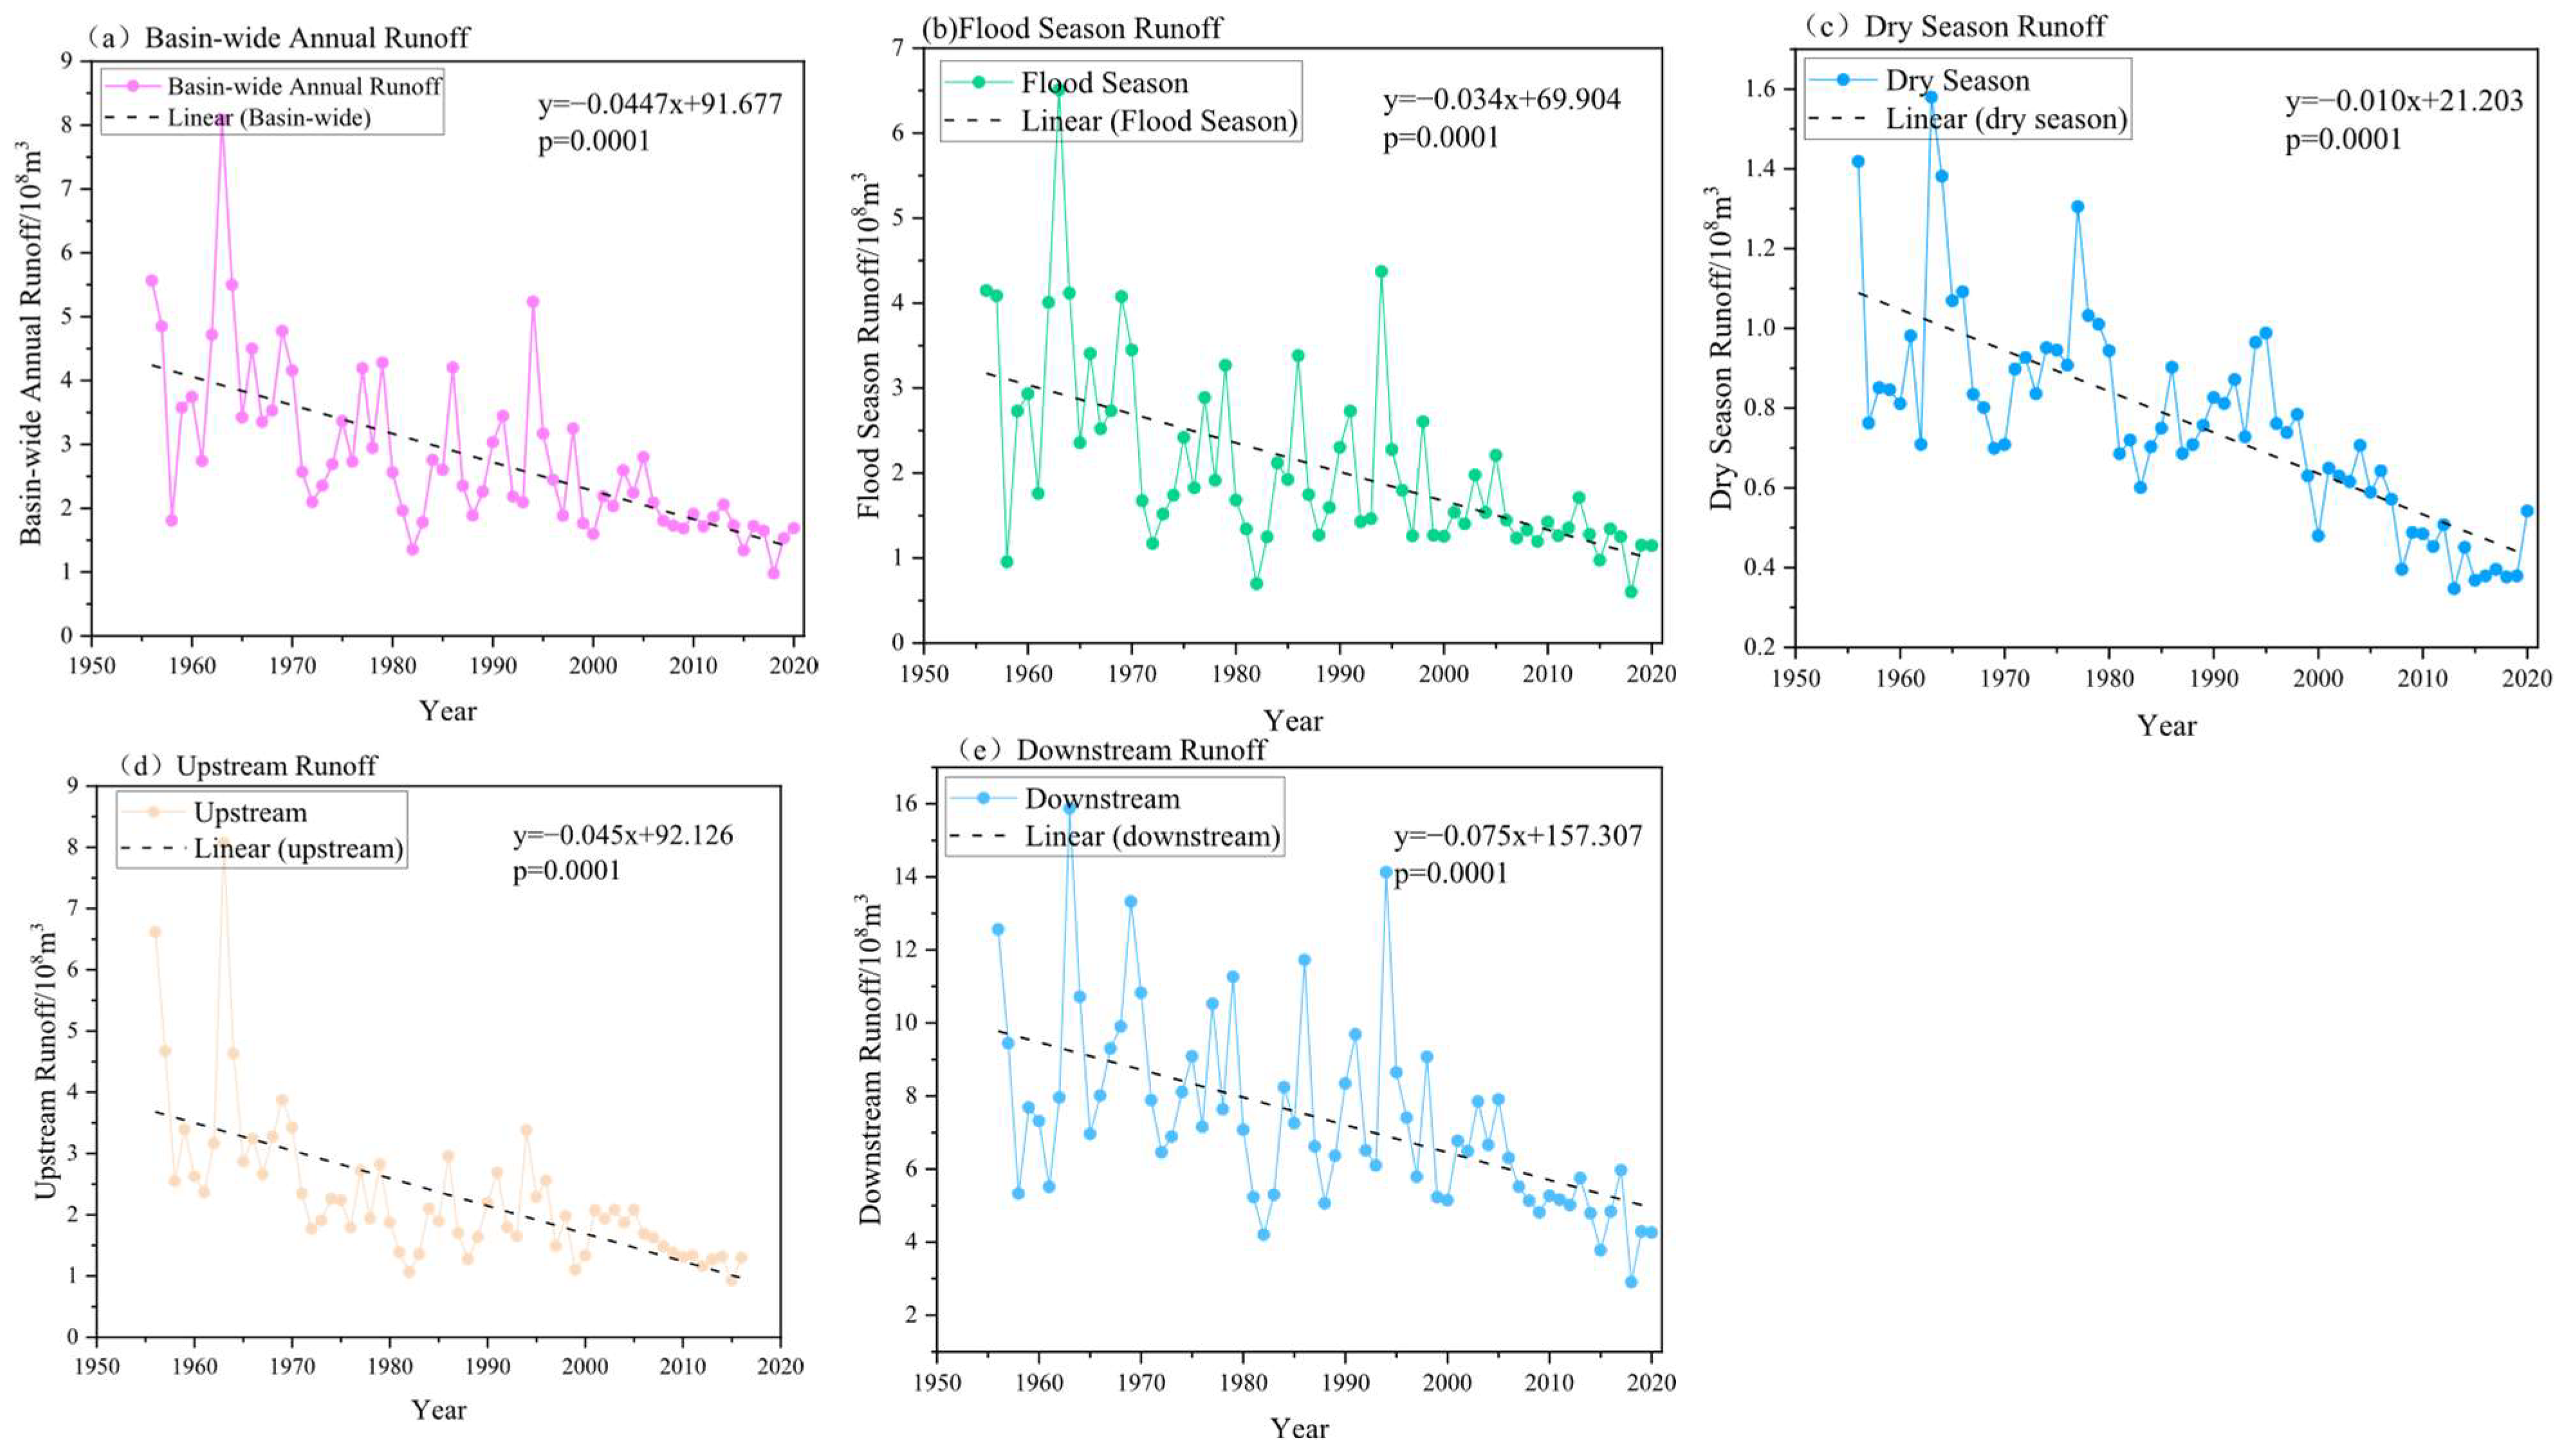
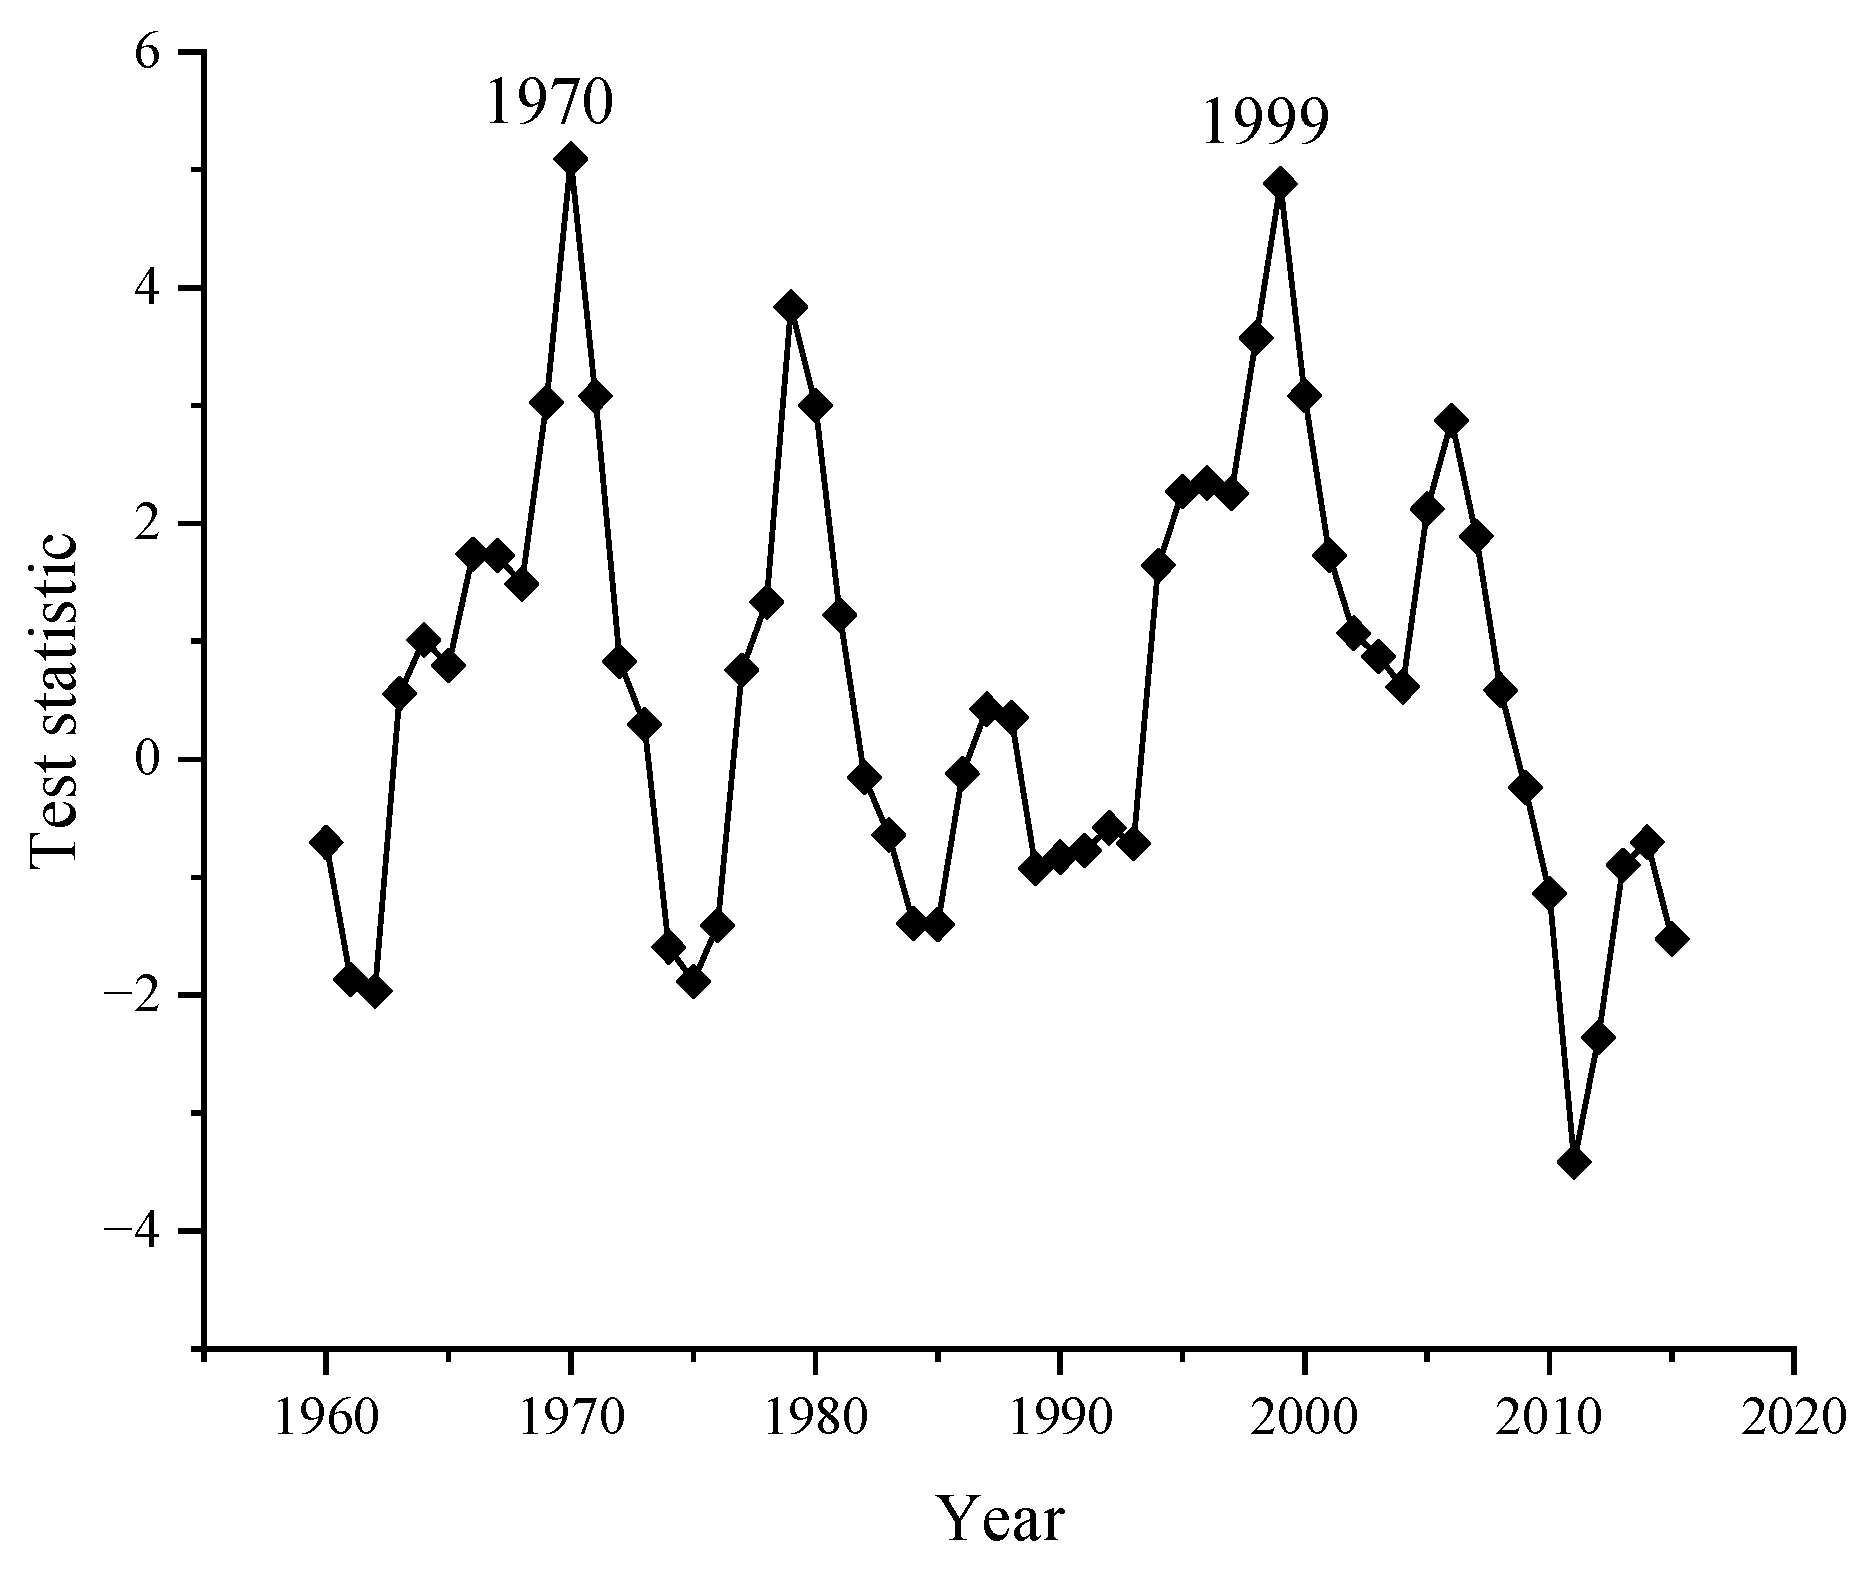
As shown in Figure 4, the annual runoff in the LRB generally exhibits a declining trend. After peaking in the mid-1960s, both the measured runoff and flood-season runoff decreased significantly, stabilizing after the early 21st century. The basin-wide average annual runoff is 284 million m3, with flood-season runoff accounting for 208 million m3 and dry-season runoff contributing 76 million m3. A phased comparison reveals that the average annual runoff before 1980 was 360 million m3, which dropped to 150 million m3 after 1980. Similarly, runoff in both the upstream and downstream regions follows a consistent decreasing trend. At the station level, all six hydrological stations exhibit a statistically significant decreasing trend. At the Baimiaozi, Naodehai, Sanjiazi, Shimenzhi, and Xinmin stations, runoff peaked between 1956 and 1963 before beginning to decline. In contrast, the Zhangwu station recorded its highest runoff in 1969 (448.96 million m3), after which it decreased steadily beginning in the 1970s. The M-K trend test confirms a significant decreasing trend at all six stations. Notably, the Xinmin station (the basin’s outlet) yielded a statistical Z-value of −6.5, indicating a highly significant reduction in runoff. A mutation analyst at the Xinmin station identifies two abrupt change points: 1970 and 1999, with 1970 being the most statistically significant (Figure 5). Therefore, the basin experienced two runoff mutation years: 1970 and 1999.

3.1.3. Spatio-Temporal Changes in Potential Evapotranspiration

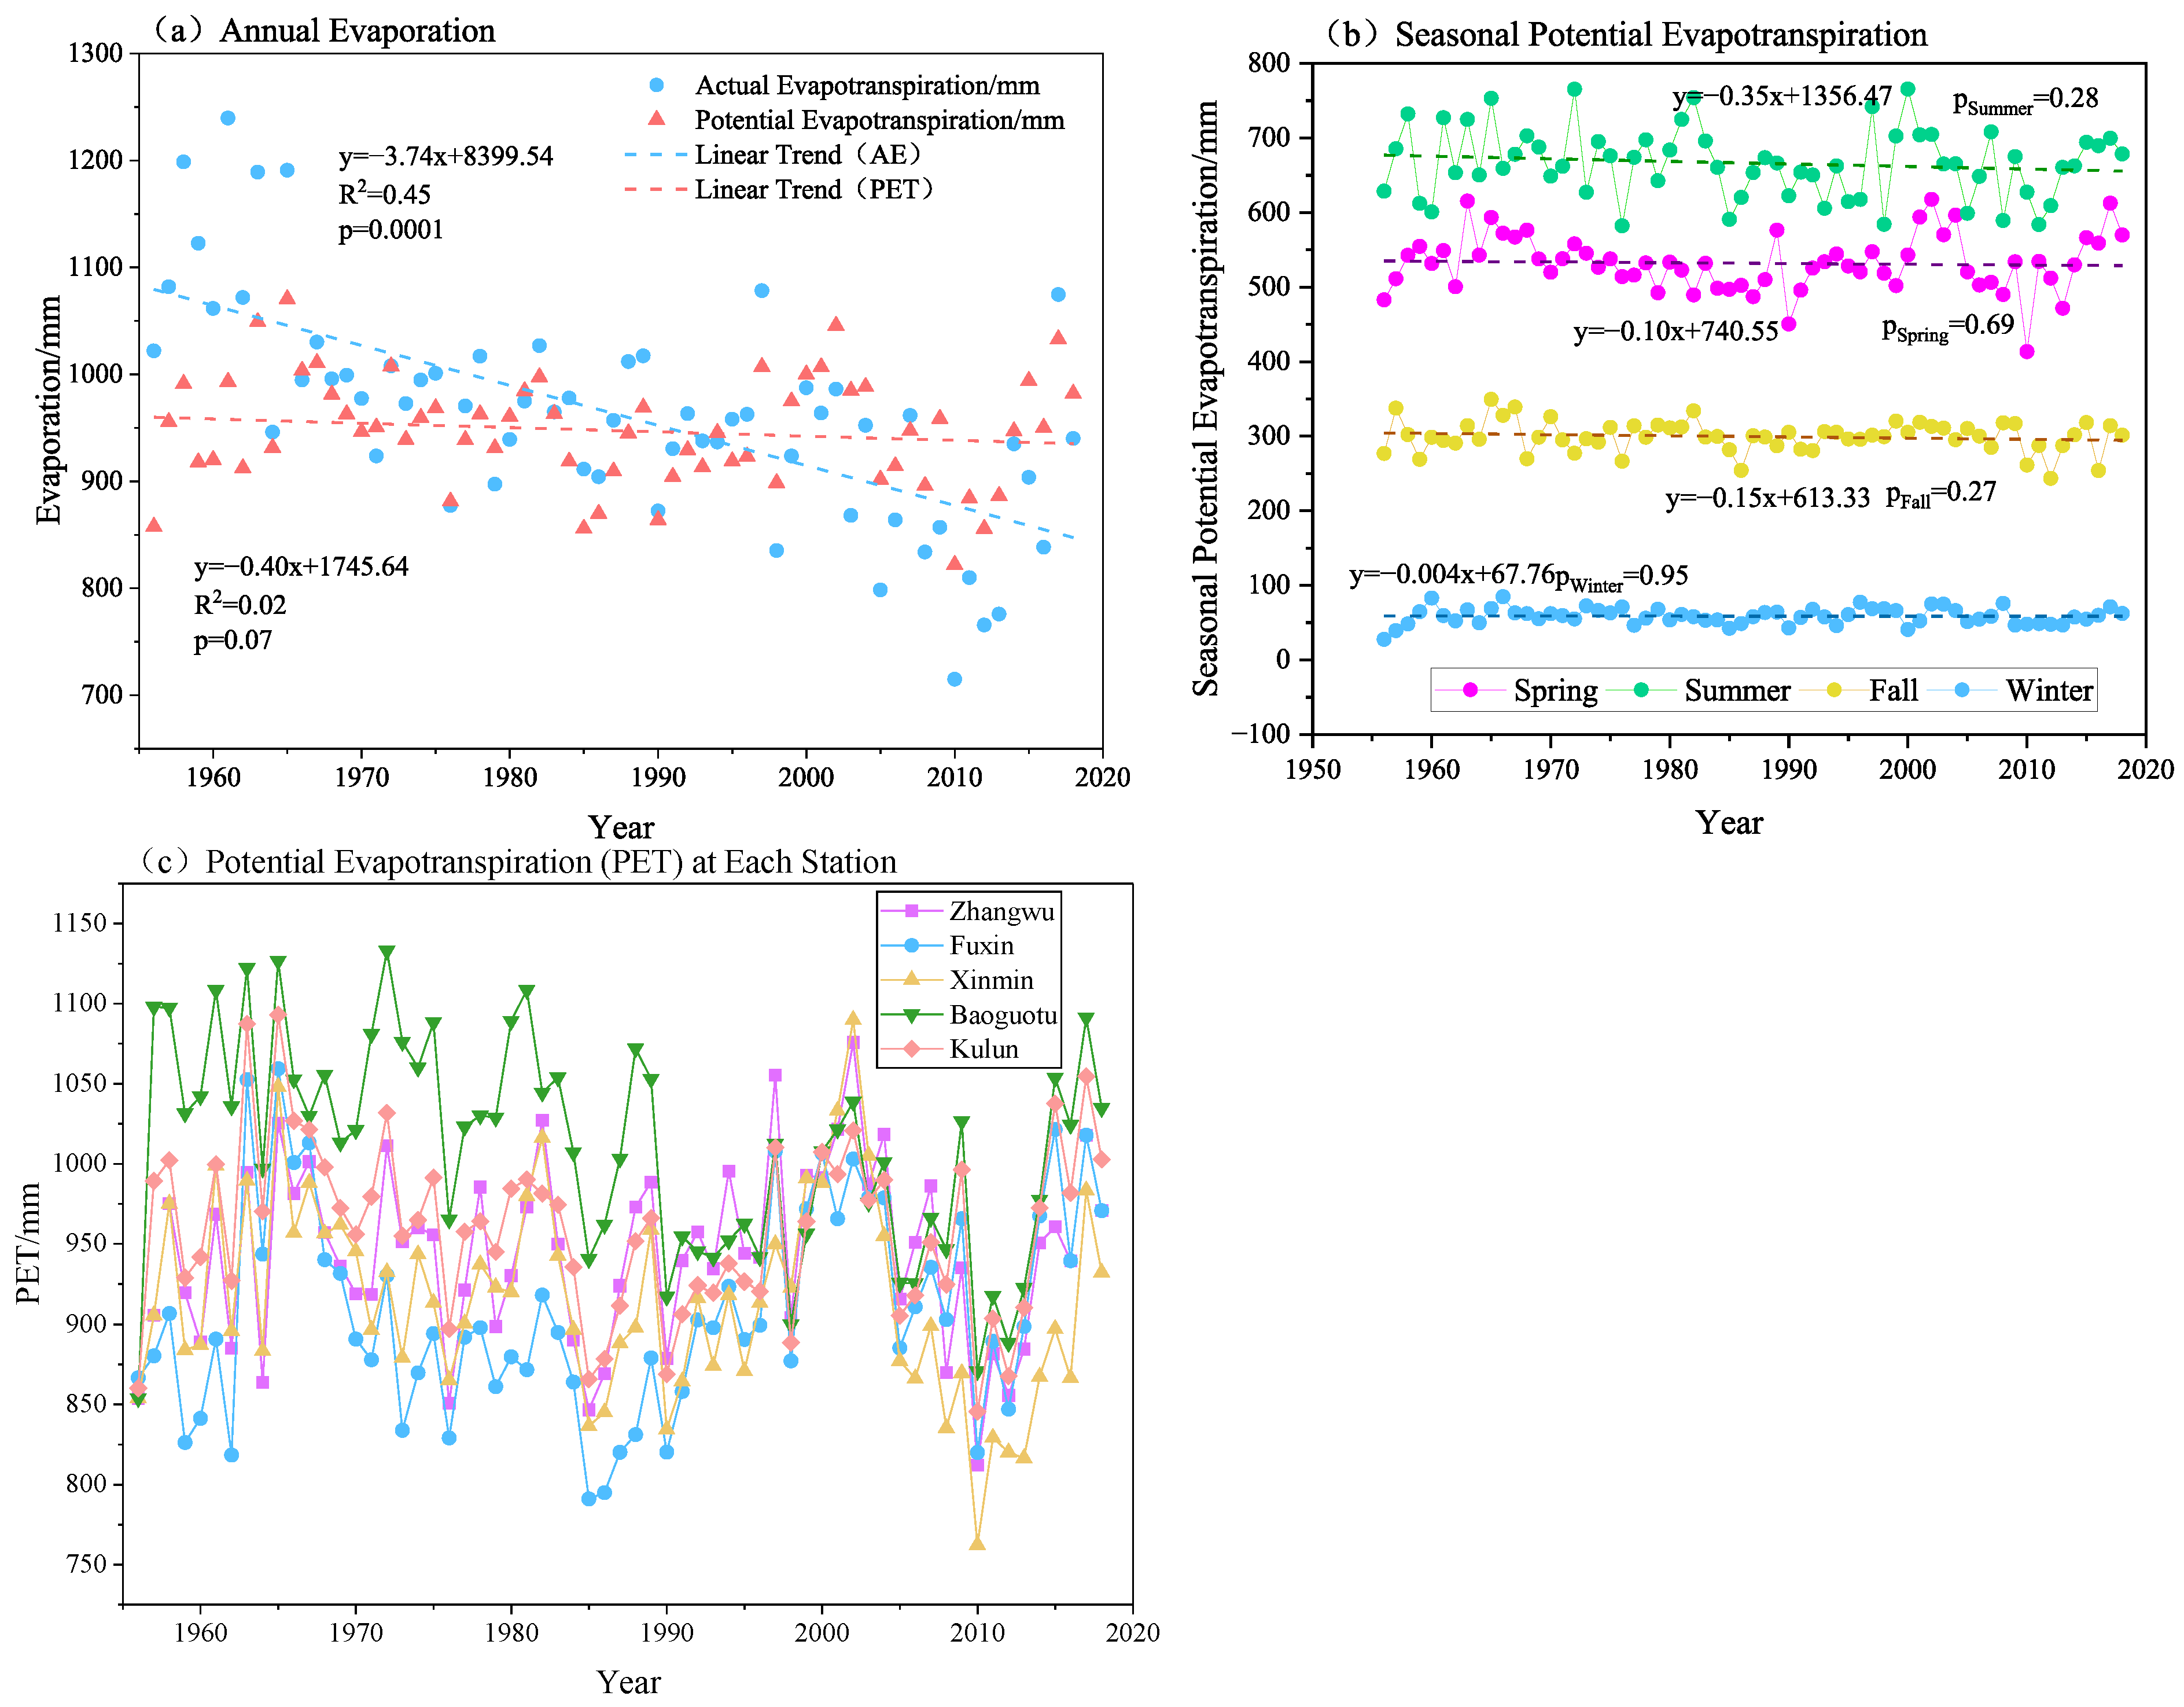
Figure 6 illustrates the interannual variability of potential evapotranspiration (PET) and actual evapotranspiration (AE) in the LRB from 1956 to 2018. The PET exhibits a weakly decreasing trend at a rate of 0.5 mm/yr. The mean annual PET during this period was 947.6 mm. The mean annual AE across the LRB was 963.53 mm, showing a significant decreasing trend at a rate of 2.91 mm/yr. Seasonal analysis revealed that PET variability was relatively small in autumn and winter but more pronounced in summer, with a significant declining trend. At the station scale, Fuxin and Zhangwu stations displayed an increasing trend in annual PET, with Fuxin exhibiting a notable upward trend (0.7 mm/yr). In contrast, Baoguotu, Kulun, and Xinmin stations showed decreasing trends, with Baoguotu experiencing the most obvious decline (−1.7 mm/yr) and Xinmin showing a significantly decreasing trend (−1.9 mm/yr, Z = −2.0). However, the basin-averaged annual PET demonstrated a non-significant decreasing trend. Furthermore, no abrupt change points were detected using the moving t-test method.

3.2. Quantitative Attribution Analysis of Runoff Changes in the LRB

3.2.1. Division of the Baseline Period and the Change Period

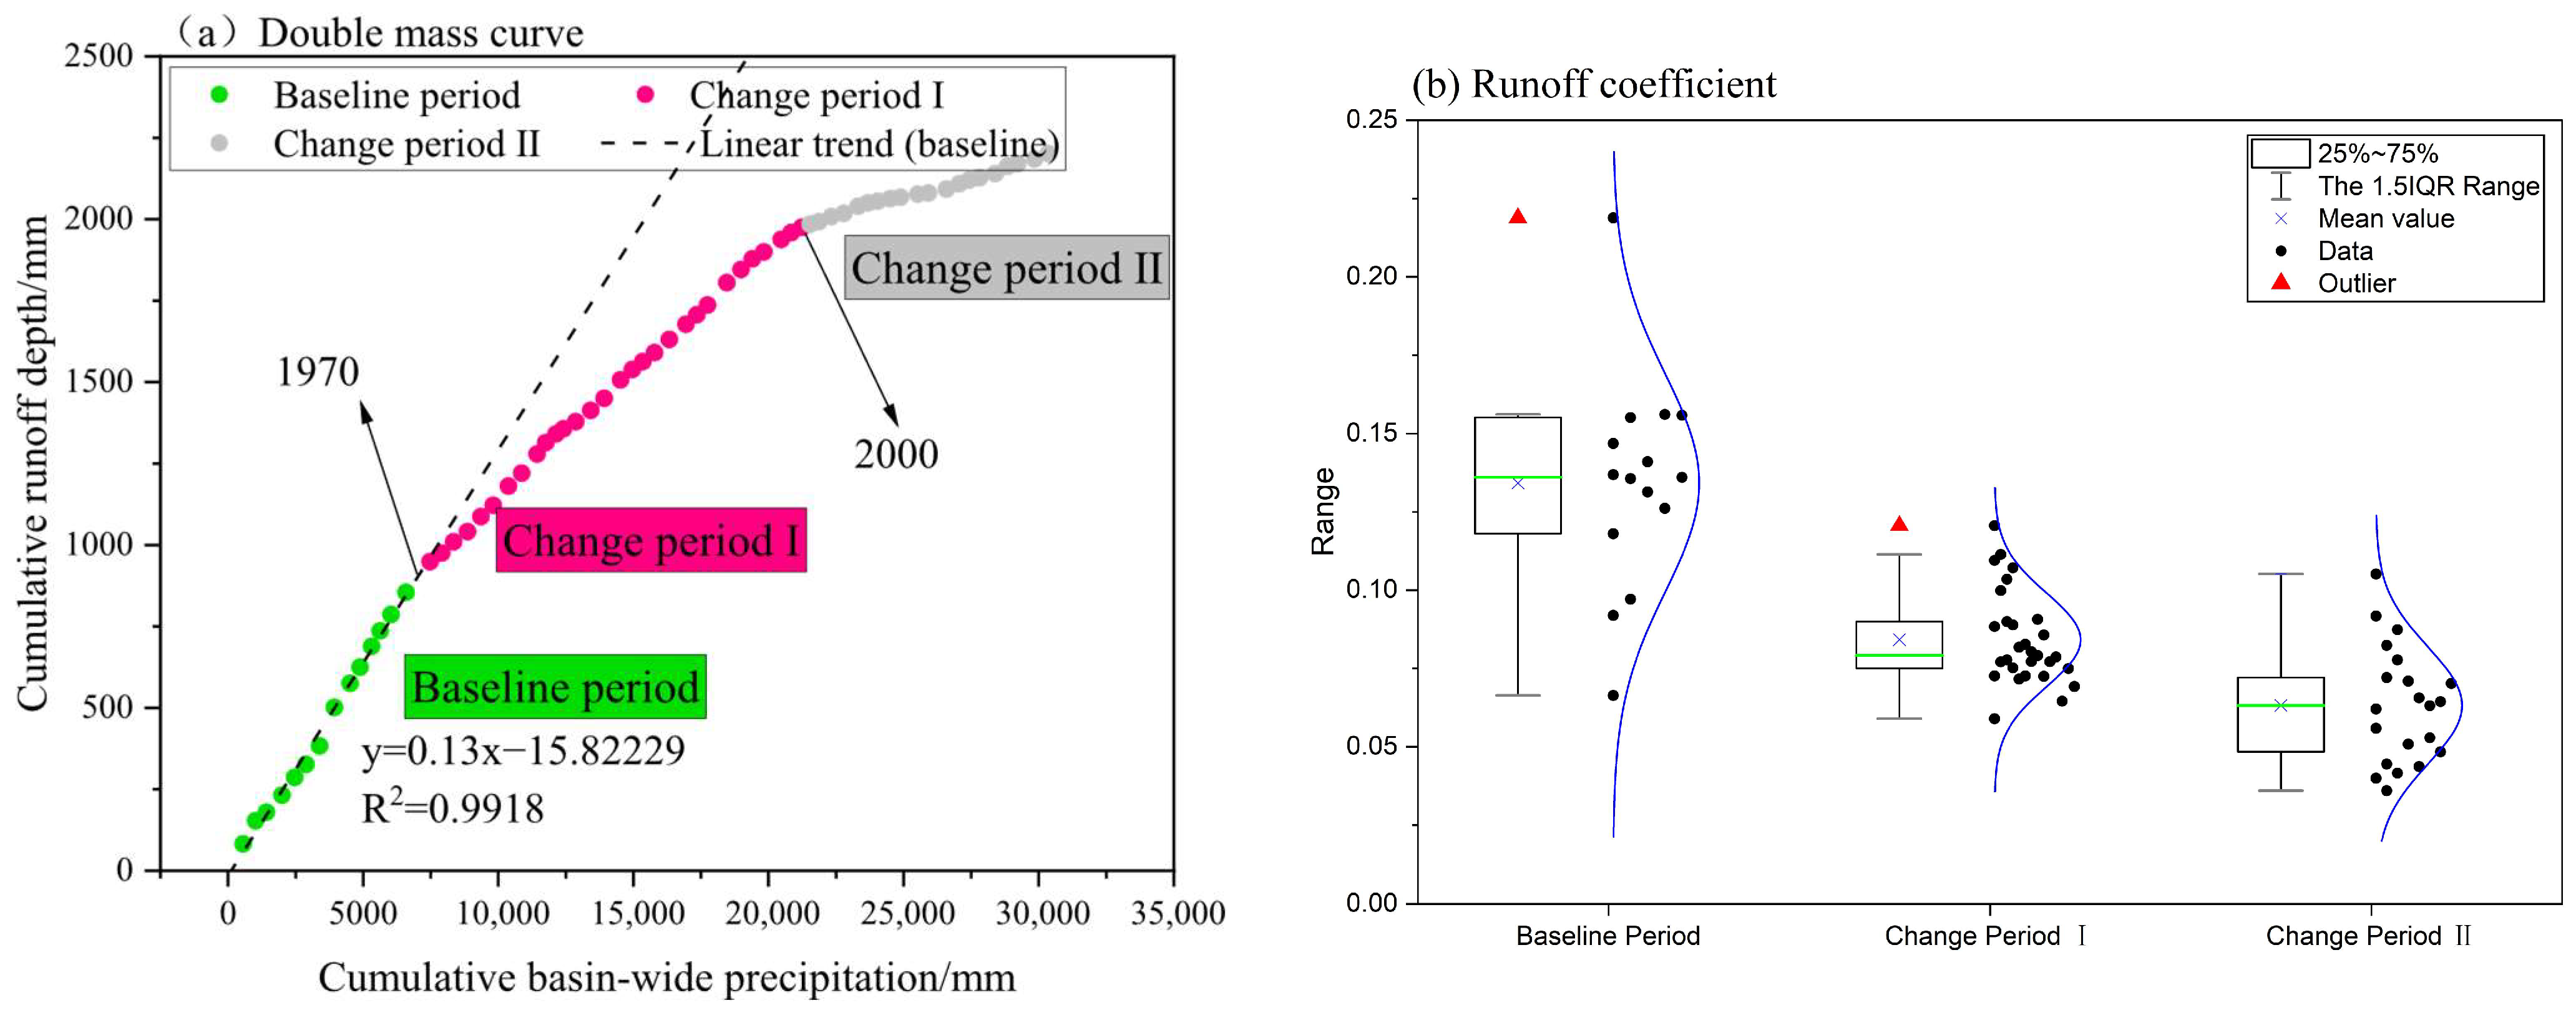
The rainfall–runoff double mass curve in the LRB reveals two abrupt change points in runoff: 1970 and 2000 (Figure 7). The baseline period is identified as 1956–1970, with the first abrupt shift occurring in 1970 and the second in 2000. Using 1970 as the demarcation point between the baseline and change periods, the post-change interval is further divided into two phases: 1970–1999 (stage I) and 2000–2020 (stage II). The dashed line represents the theoretical trajectory under natural (undisturbed) conditions. However, deviations caused by combined climatic and anthropogenic influences induce abrupt shifts, with the observed divergence serving to quantify their cumulative impact. Compared to the baseline period, the change periods exhibit an average annual rainfall reduction of 3.6 mm, a decrease in potential evapotranspiration of 25.5 mm, and a temperature rise of 1.0 °C. The runoff coefficient (α) demonstrates a pronounced declining trend: the mean annual value was 0.129 during the baseline period, which decreased to 0.077 in stage I and then dropped to 0.026 in stage II.

3.2.2. Results of Linear Regression Model

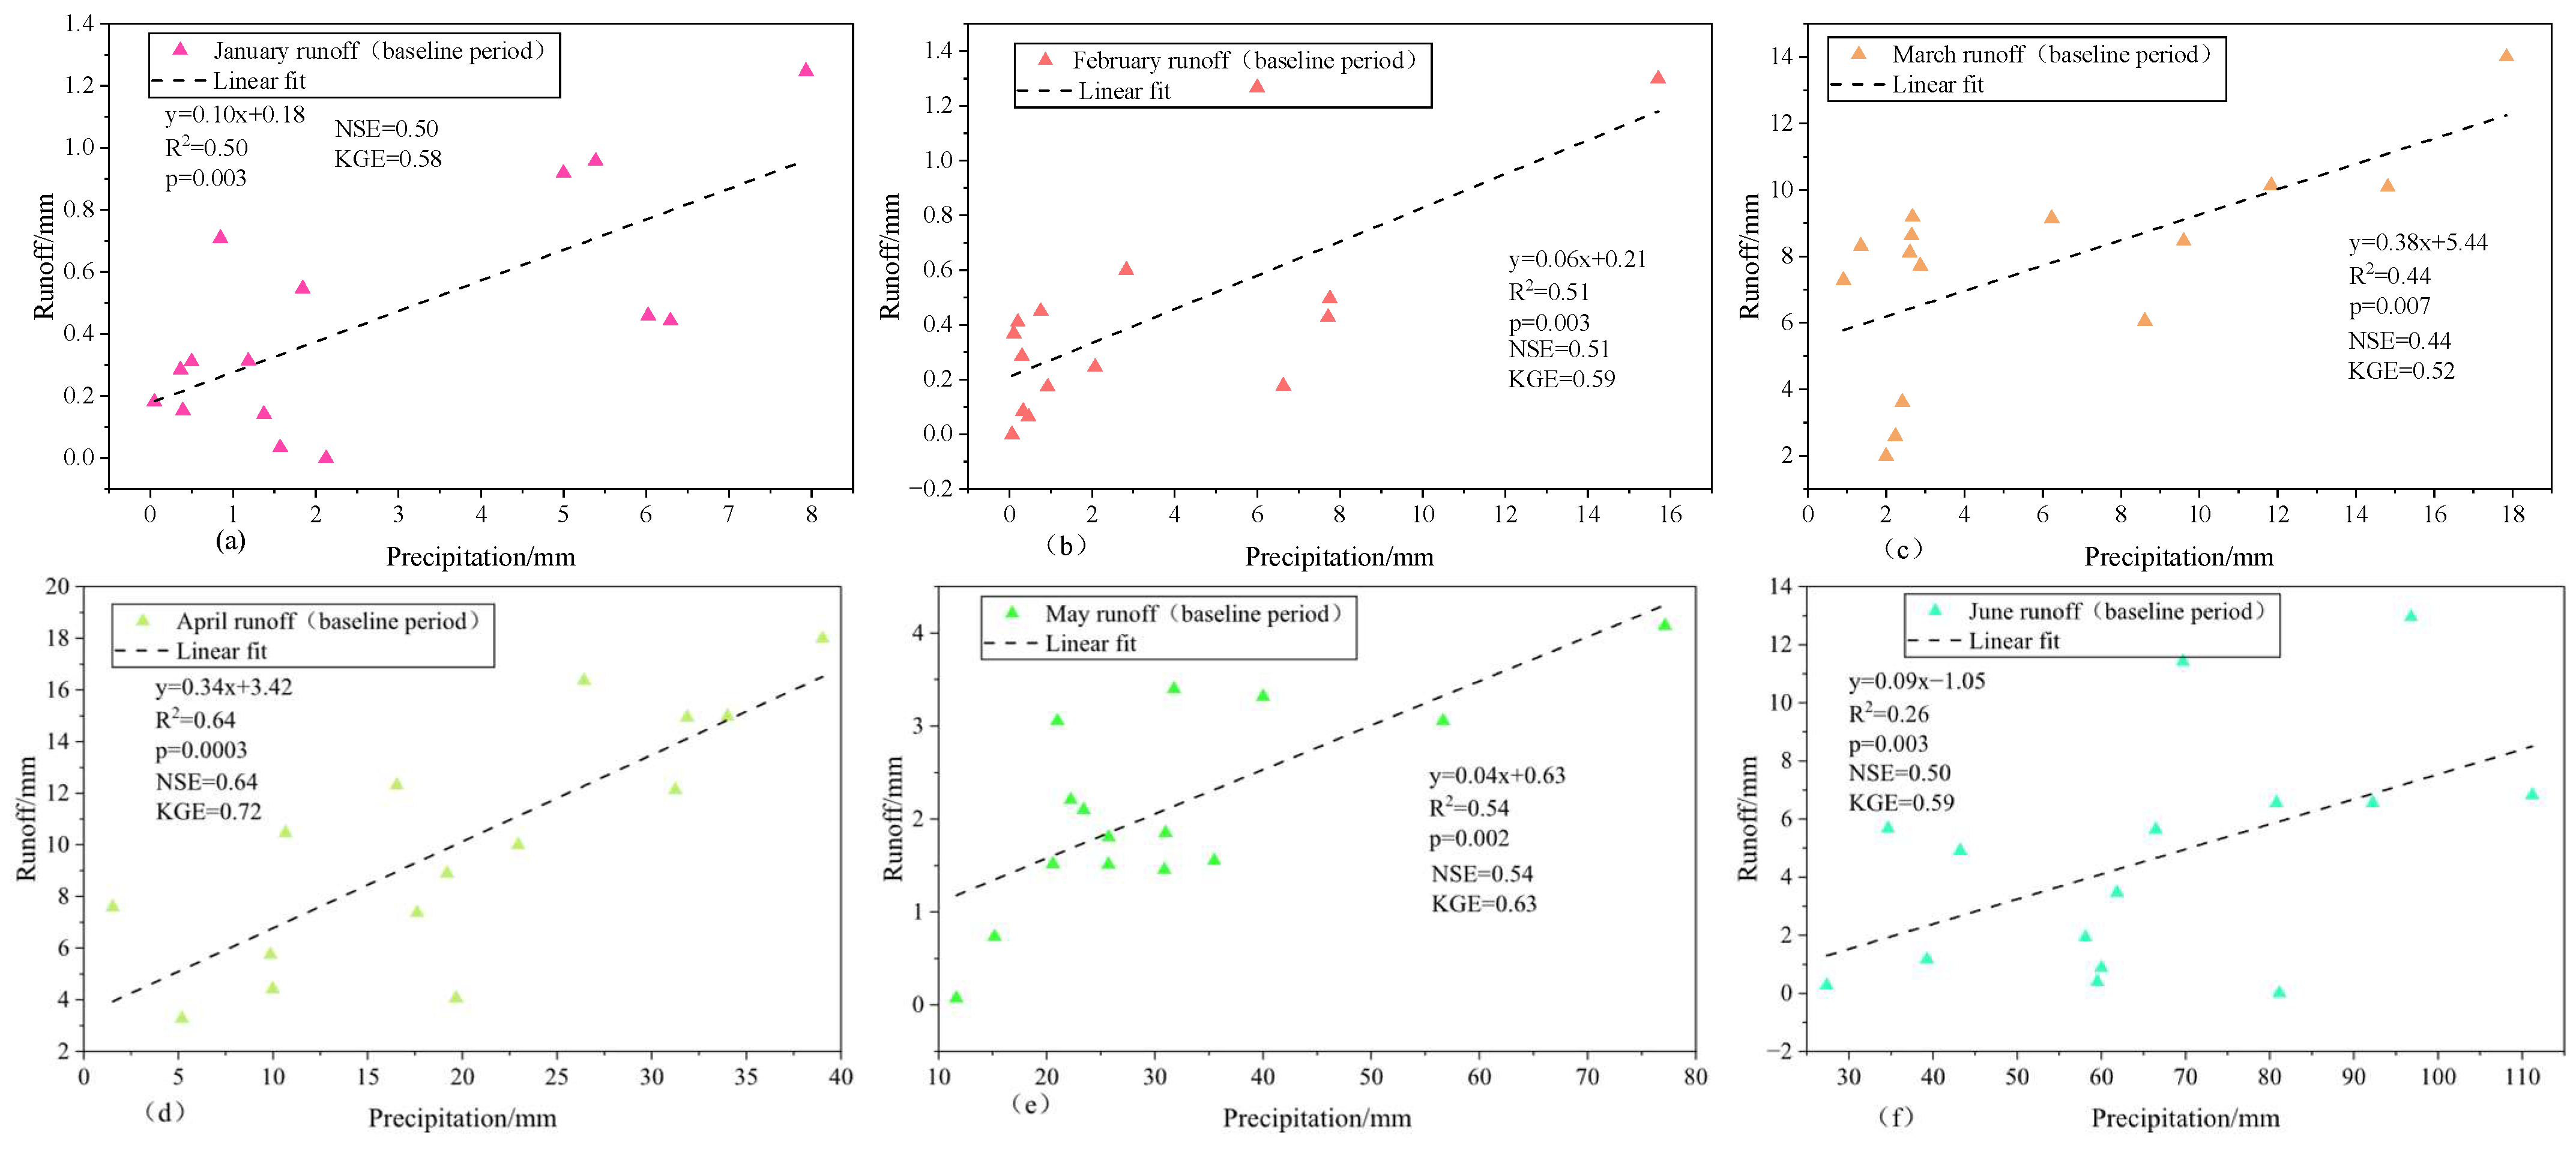
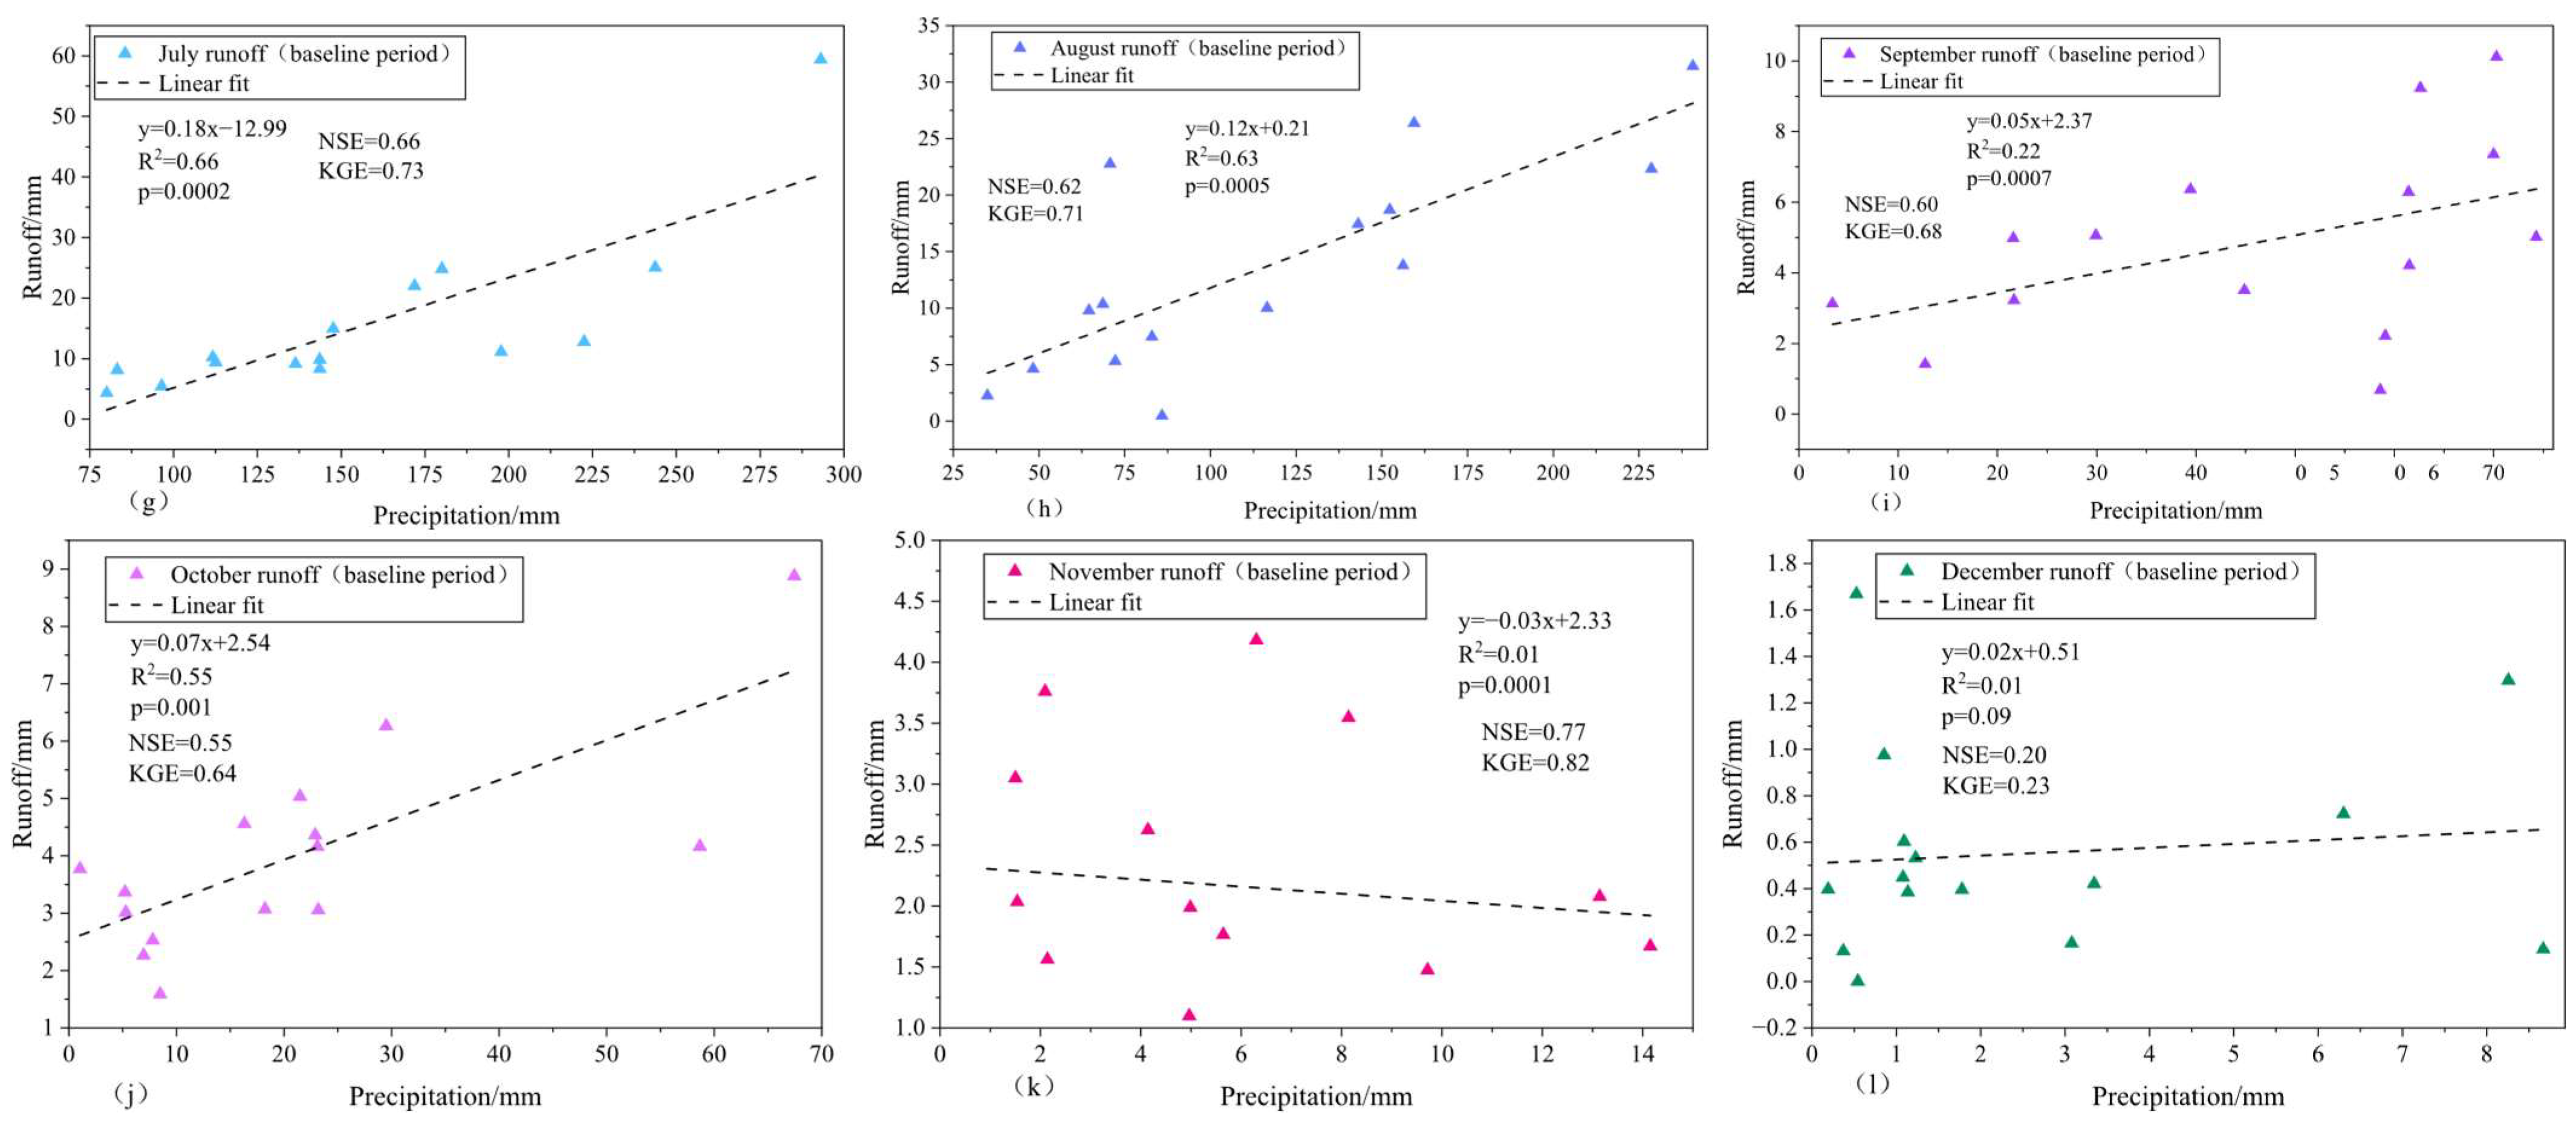
Based on the linear regression model, the monthly rainfall–runoff relationships were established, as illustrated in Figure 8. The correlations for February, March, April, November, and December exhibit relatively poor performance. This is attributed to the climate characteristics of the LRB, located in northeastern China, where late autumn and winter conditions result in precipitation occurring primarily as snowfall rather than rainfall. Snowfall does not contribute immediately to surface runoff, leading to reduced reliability in the rainfall–runoff model and introducing certain errors. However, compared to the flood season, these months contribute minimally to the annual runoff volume. Consequently, their impact on the simulated annual runoff totals—and thus on the quantification of human-induced effects—remains limited. Furthermore, the model uncertainties during the dry season do not exhibit systematic bias. In long-term multi-year analyses, positive and negative errors in individual months tend to offset each other when aggregated at annual or longer timescales. This error compensation effectively mitigates their influence on overall trend assessment, ensuring that the cumulative uncertainty remains within an acceptable range.

3.2.3. Changes in Hydrometeorological Elements in Different Periods

Based on the delineated baseline and change periods, statistical analyses of their respective relationships with precipitation, runoff, and PET were conducted (Table 1). The results indicate a substantial reduction in runoff during the change periods compared to the baseline. Specifically, runoff decreased by 39.7% in the first change period and 81.1% in the second period, with an overall reduction of 44.5% across the entire change period. In contrast, the declines in precipitation and PET were relatively modest. The magnitude of runoff variation significantly exceeded that of precipitation and PET, demonstrating a disproportionate hydrological response.

3.2.4. Changes in Land Use Types

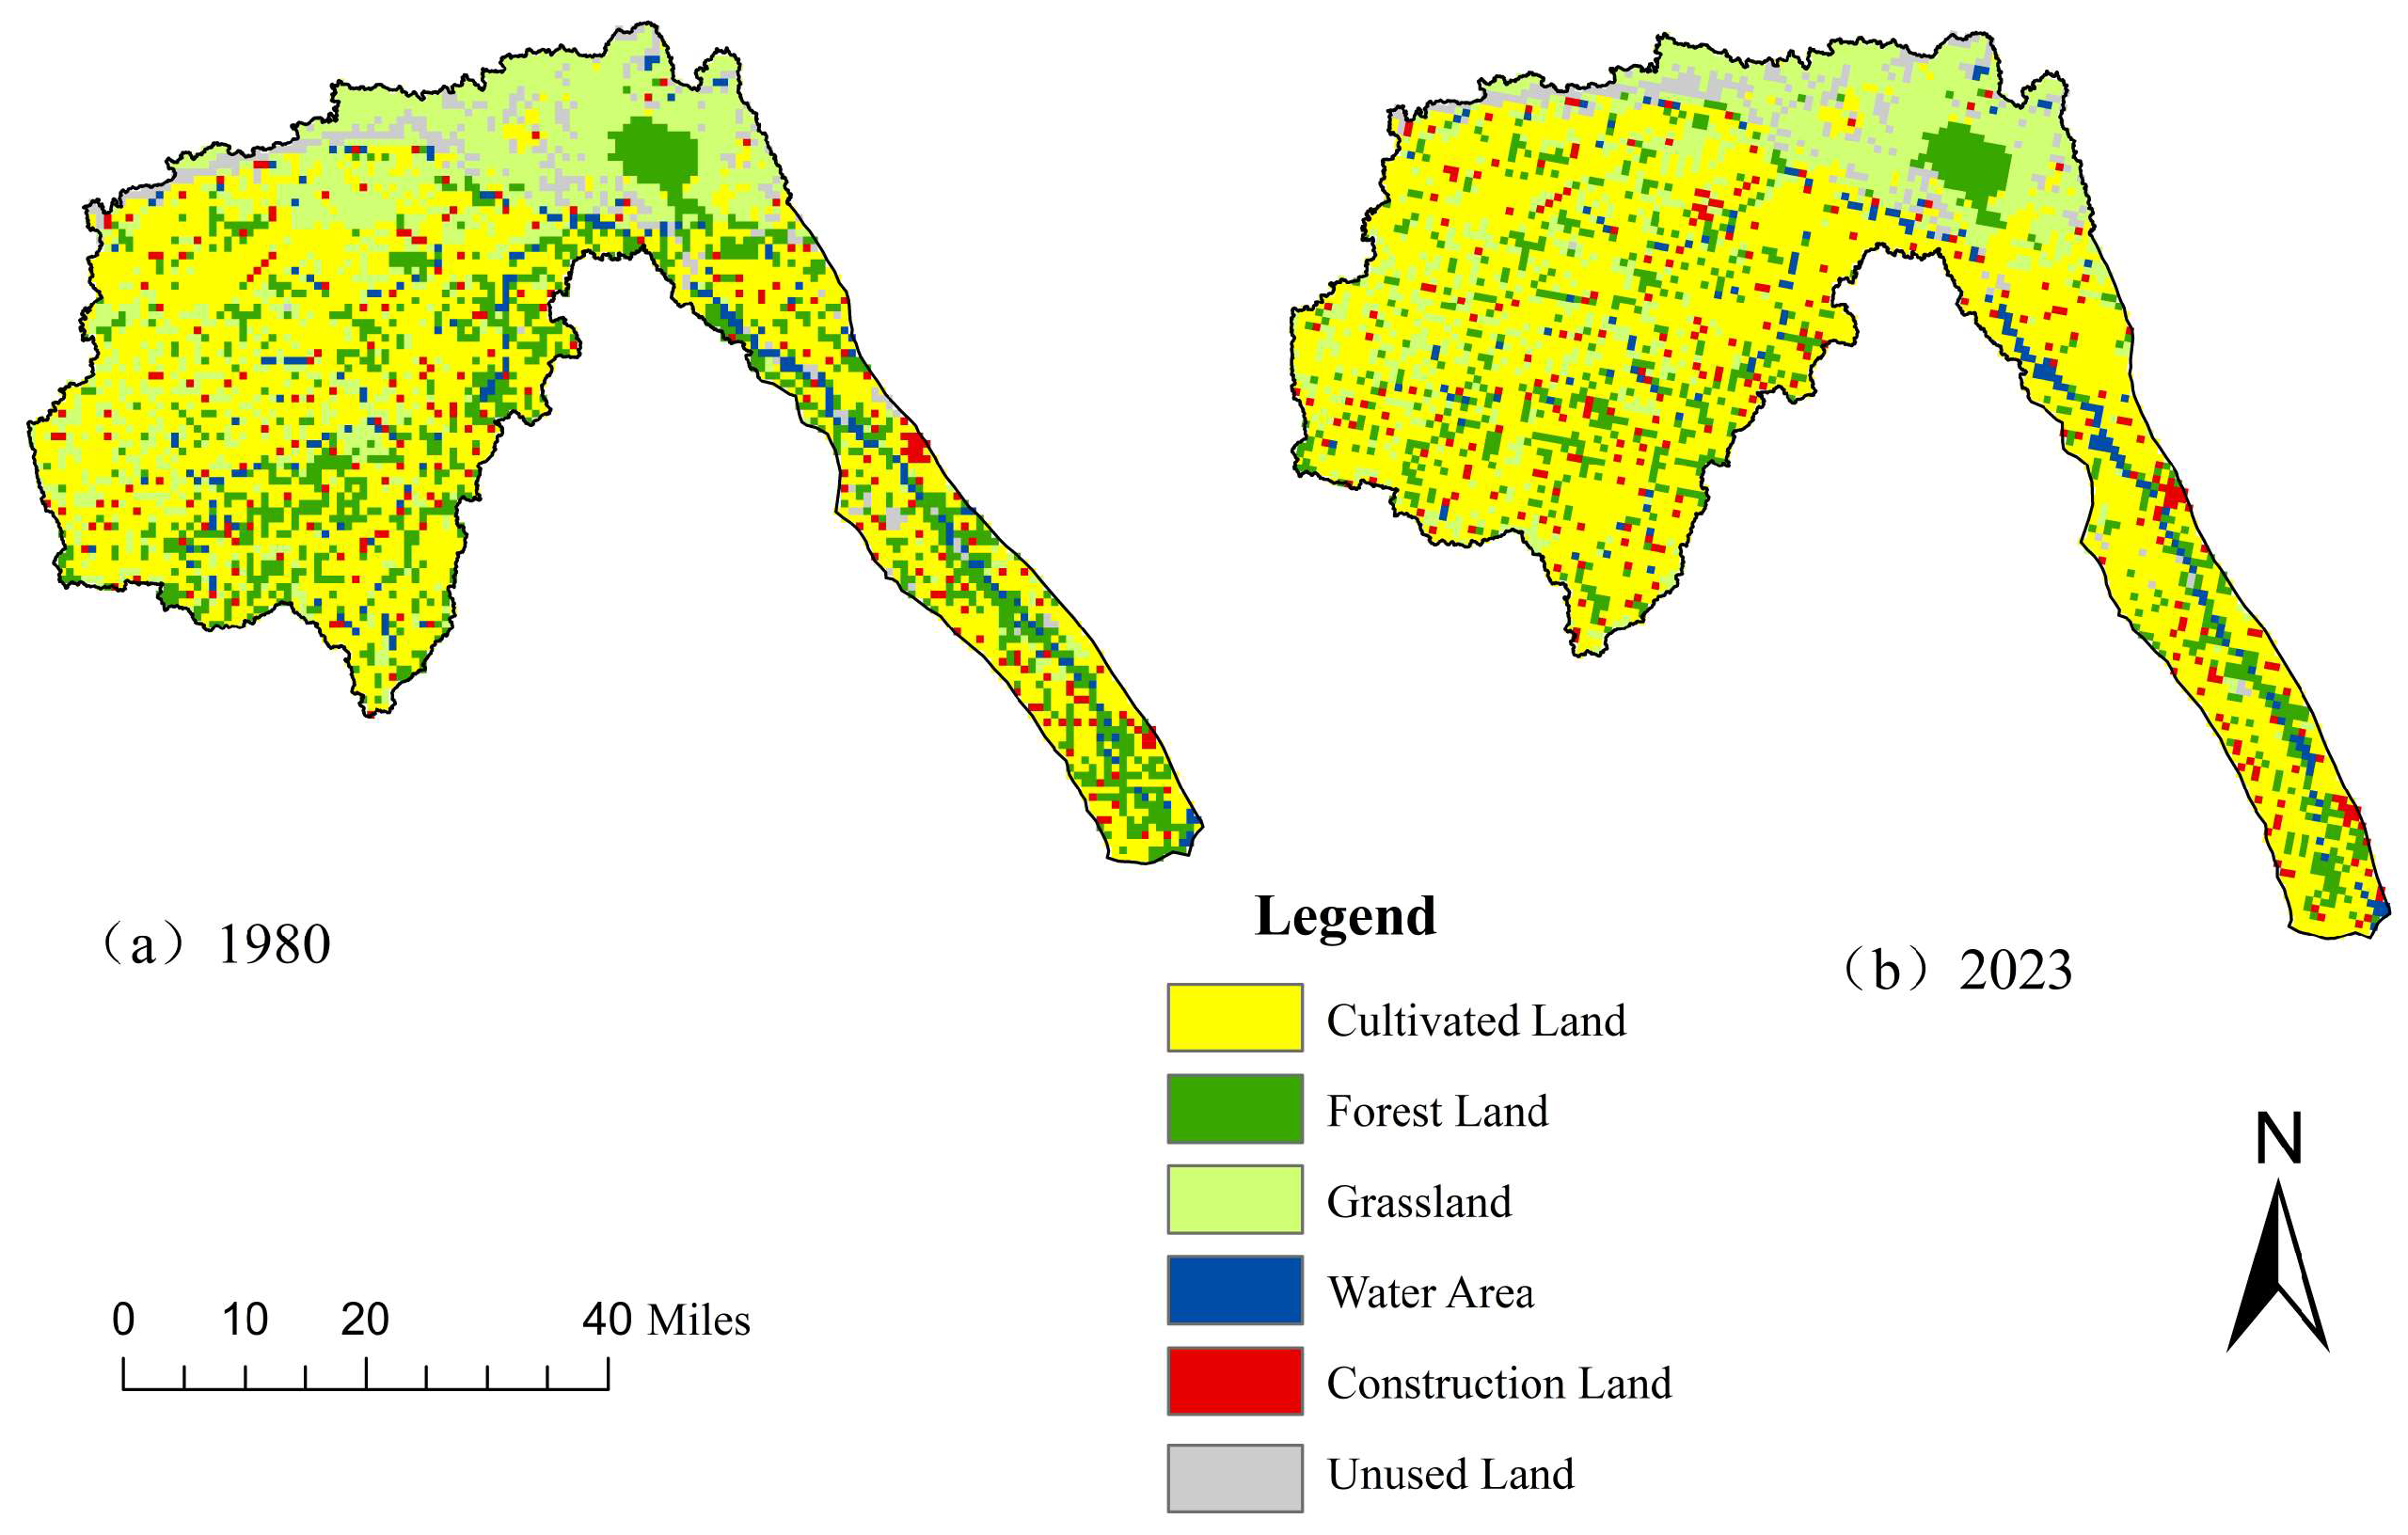
Land use changes in the LRB from 1980 to 2023 were quantified using ArcGIS 10.0 (Figure 9). Cropland and grassland constituted the dominant land cover types, accounting for 47.2–56.8% and 19.7–23.0% of the total catchment area, respectively. Overall, forest, grassland, water bodies, and unused land experienced substantial contractions, whereas cropland and built-up land exhibited pronounced expansion. Specifically, forest area declined by 340 km2, equivalent to a 31.7% reduction relative to the 1980 baseline; grassland decreased by 201 km2 (−14.3%); water bodies by 37 km2 (−17.3%); and unused land by 39 km2 (−13.9%). Conversely, cropland increased by 585 km2 (+120%), and built-up land by 32 km2 (+110%). These dynamics reveal a sustained trajectory of cropland encroachment upon forested areas, alongside a marked expansion of built-up land, indicative of intensifying anthropogenic pressures. Notably, a conspicuous grassland-to-forest transition occurred extensively throughout the middle and lower reaches of the basin.

3.2.5. Quantifying the Impact of Climate Change and Human Activities on Runoff

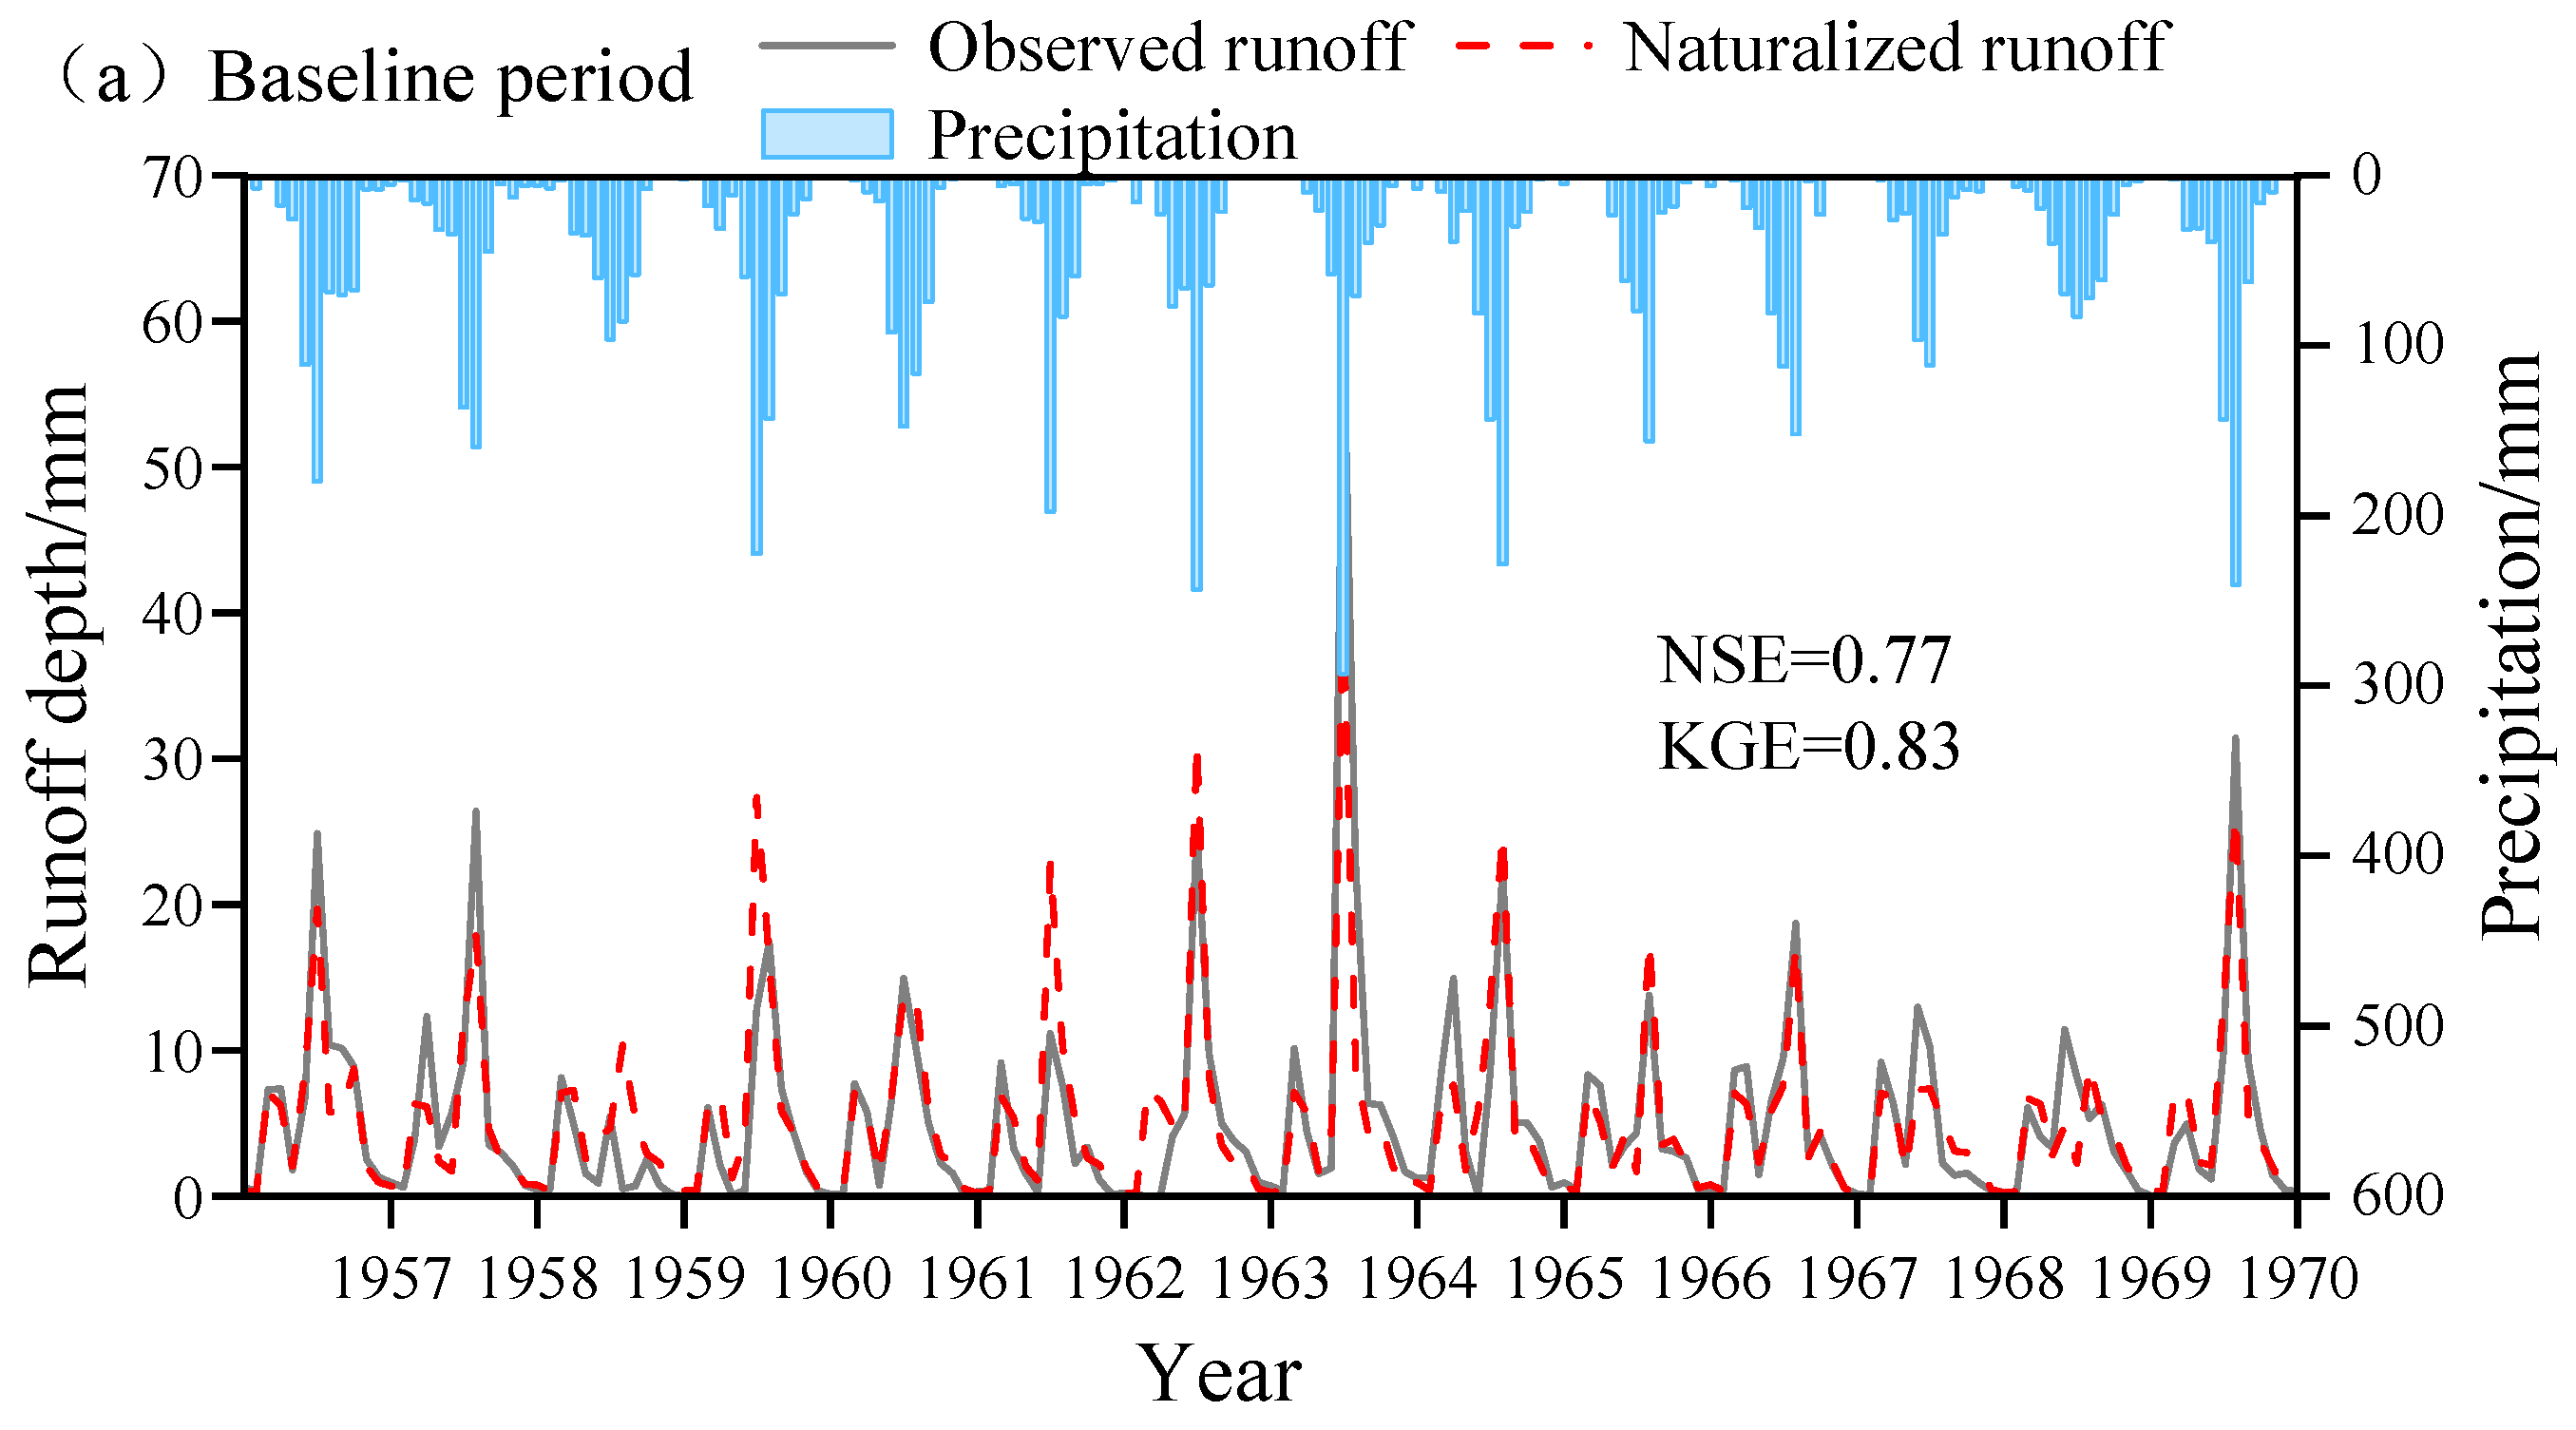
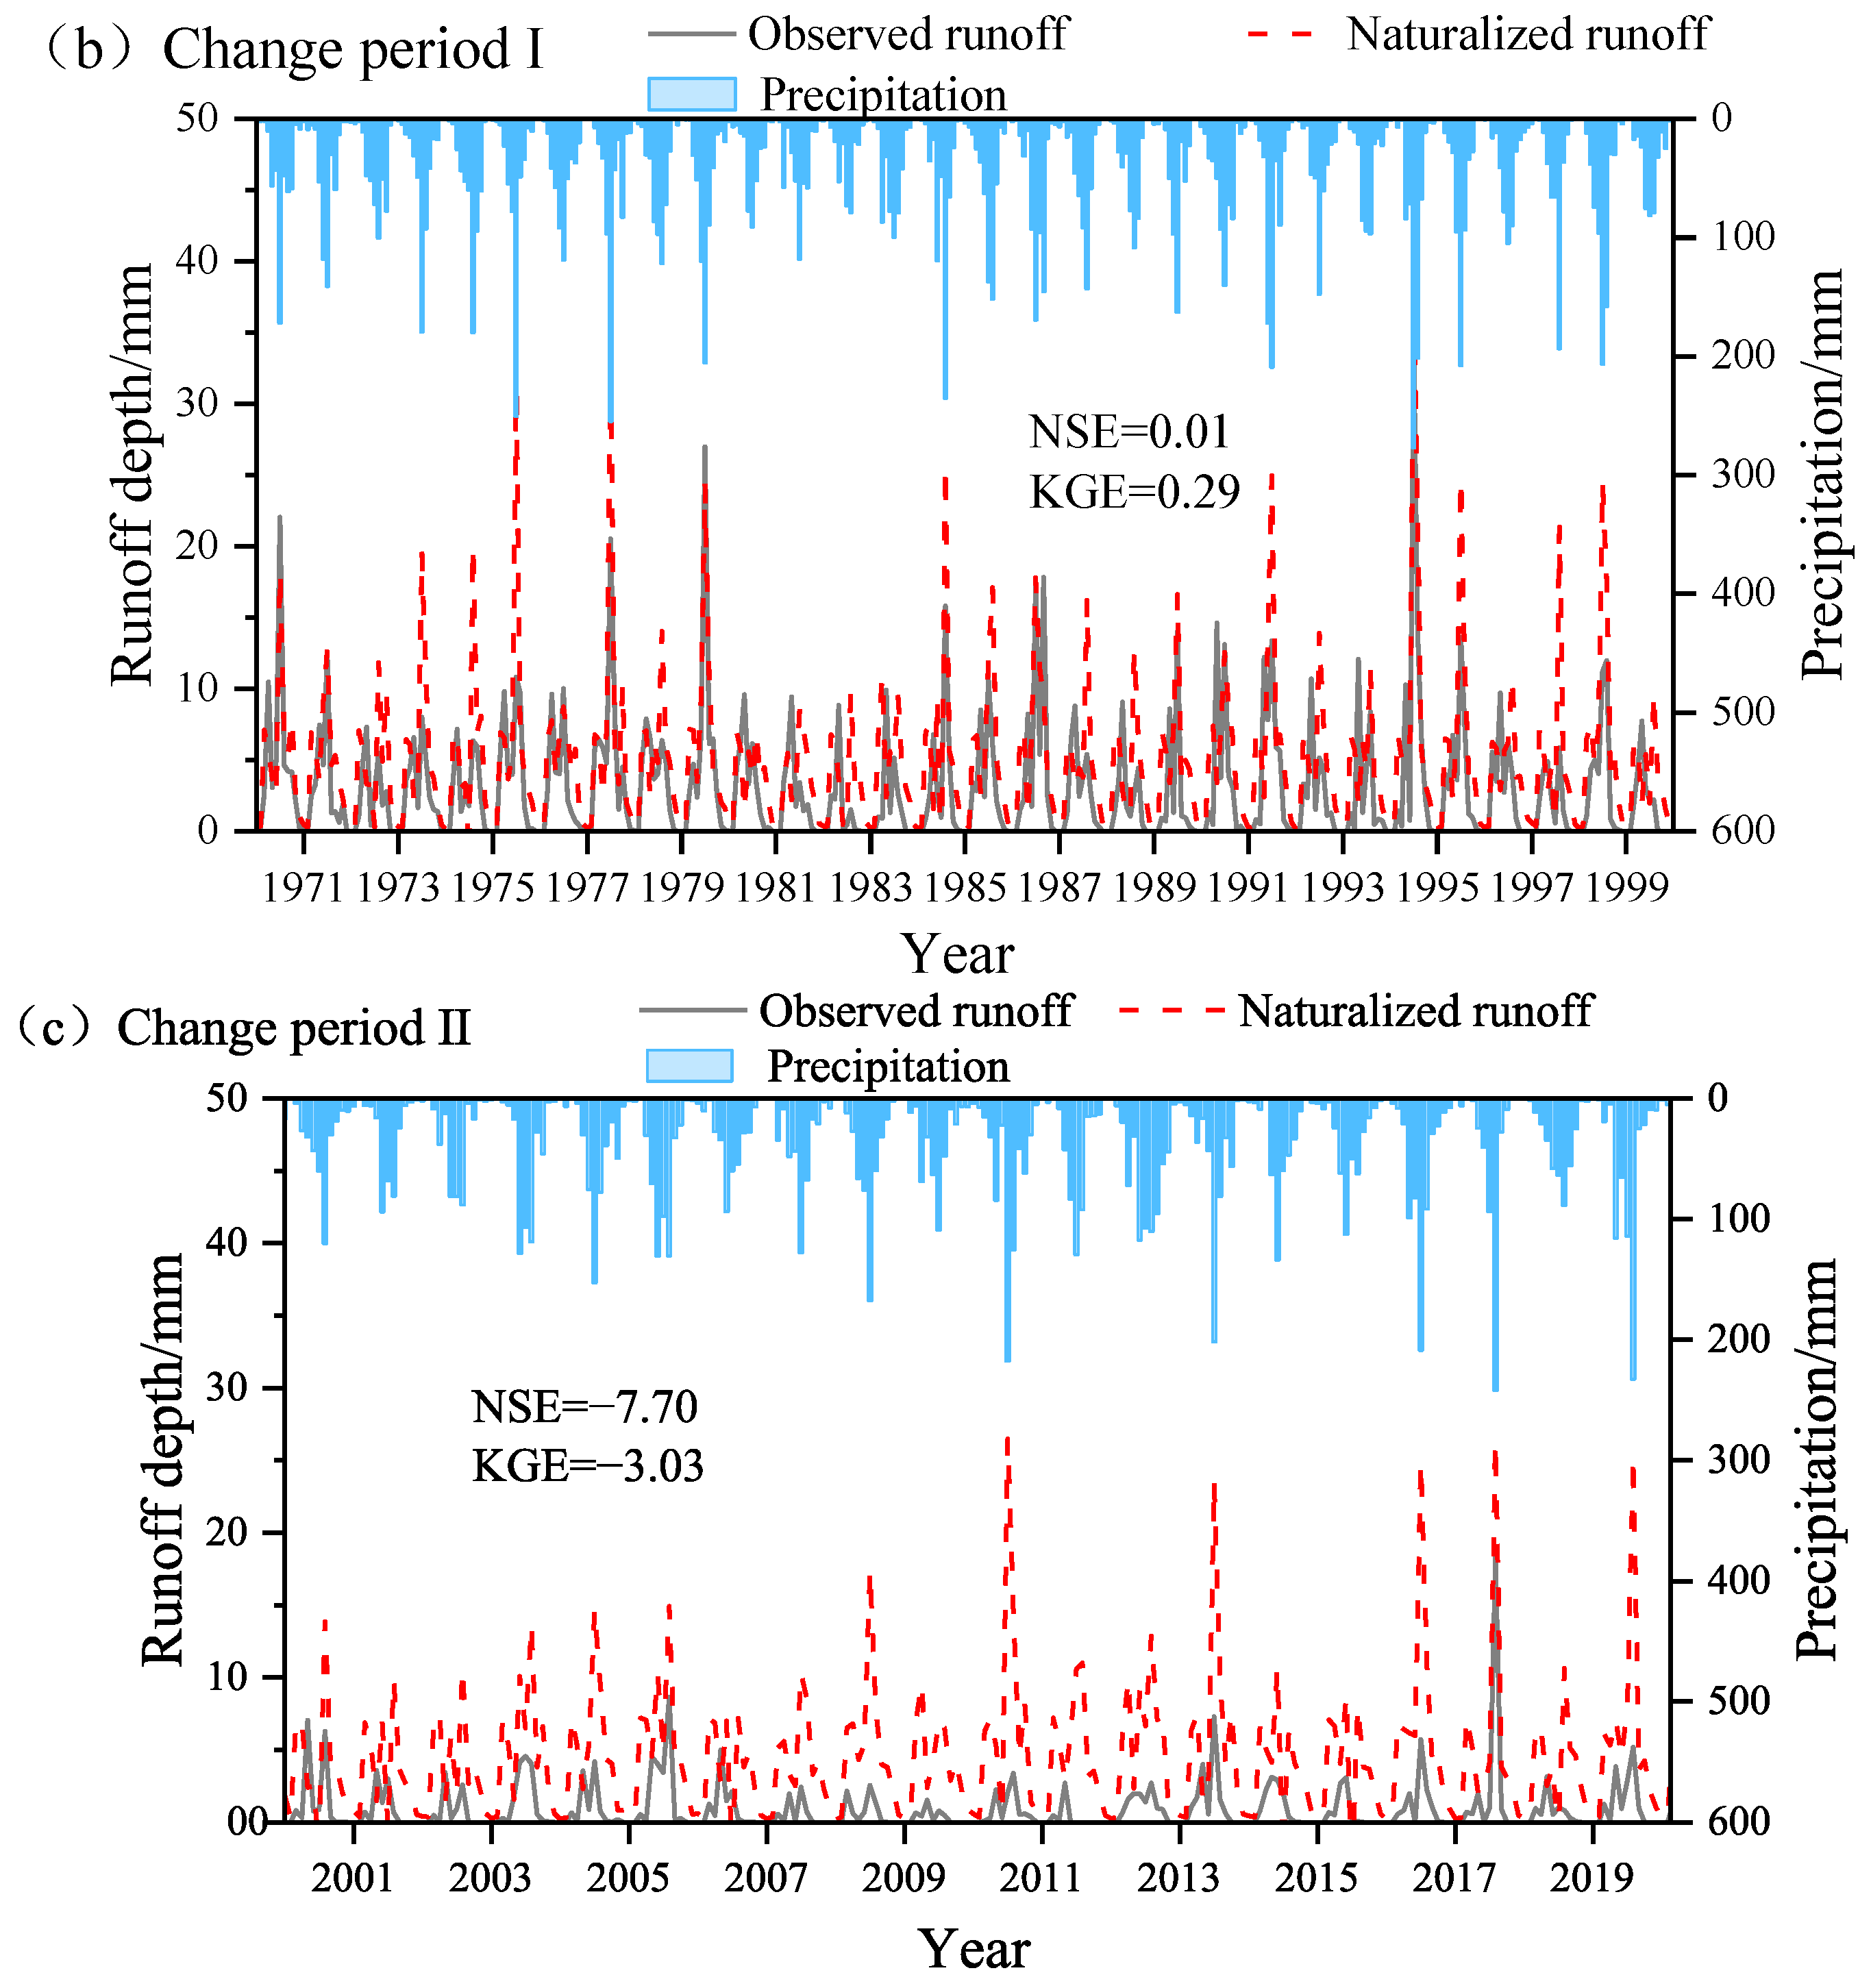
To quantify the possible impact of climate change and human activities on runoff changes, the naturalized runoff series in the change period needs to be constructed using the linear regression model. And then the relationship between measured runoff depth and naturalized runoff depth was examined across these three phases. As illustrated in Figure 10, the measured and naturalized runoff depths exhibited strong consistency during the baseline period (Figure 10a) with NSE = 0.77 and KGE = 0.83. However, a significant divergence emerged in the change periods, particularly during the second period (2000–2020), where the naturalized runoff depth significantly exceeded the measured values (Figure 10b,c). This discrepancy underscores the intensified impacts of both climatic factors and anthropogenic activities on runoff processes after 2000.
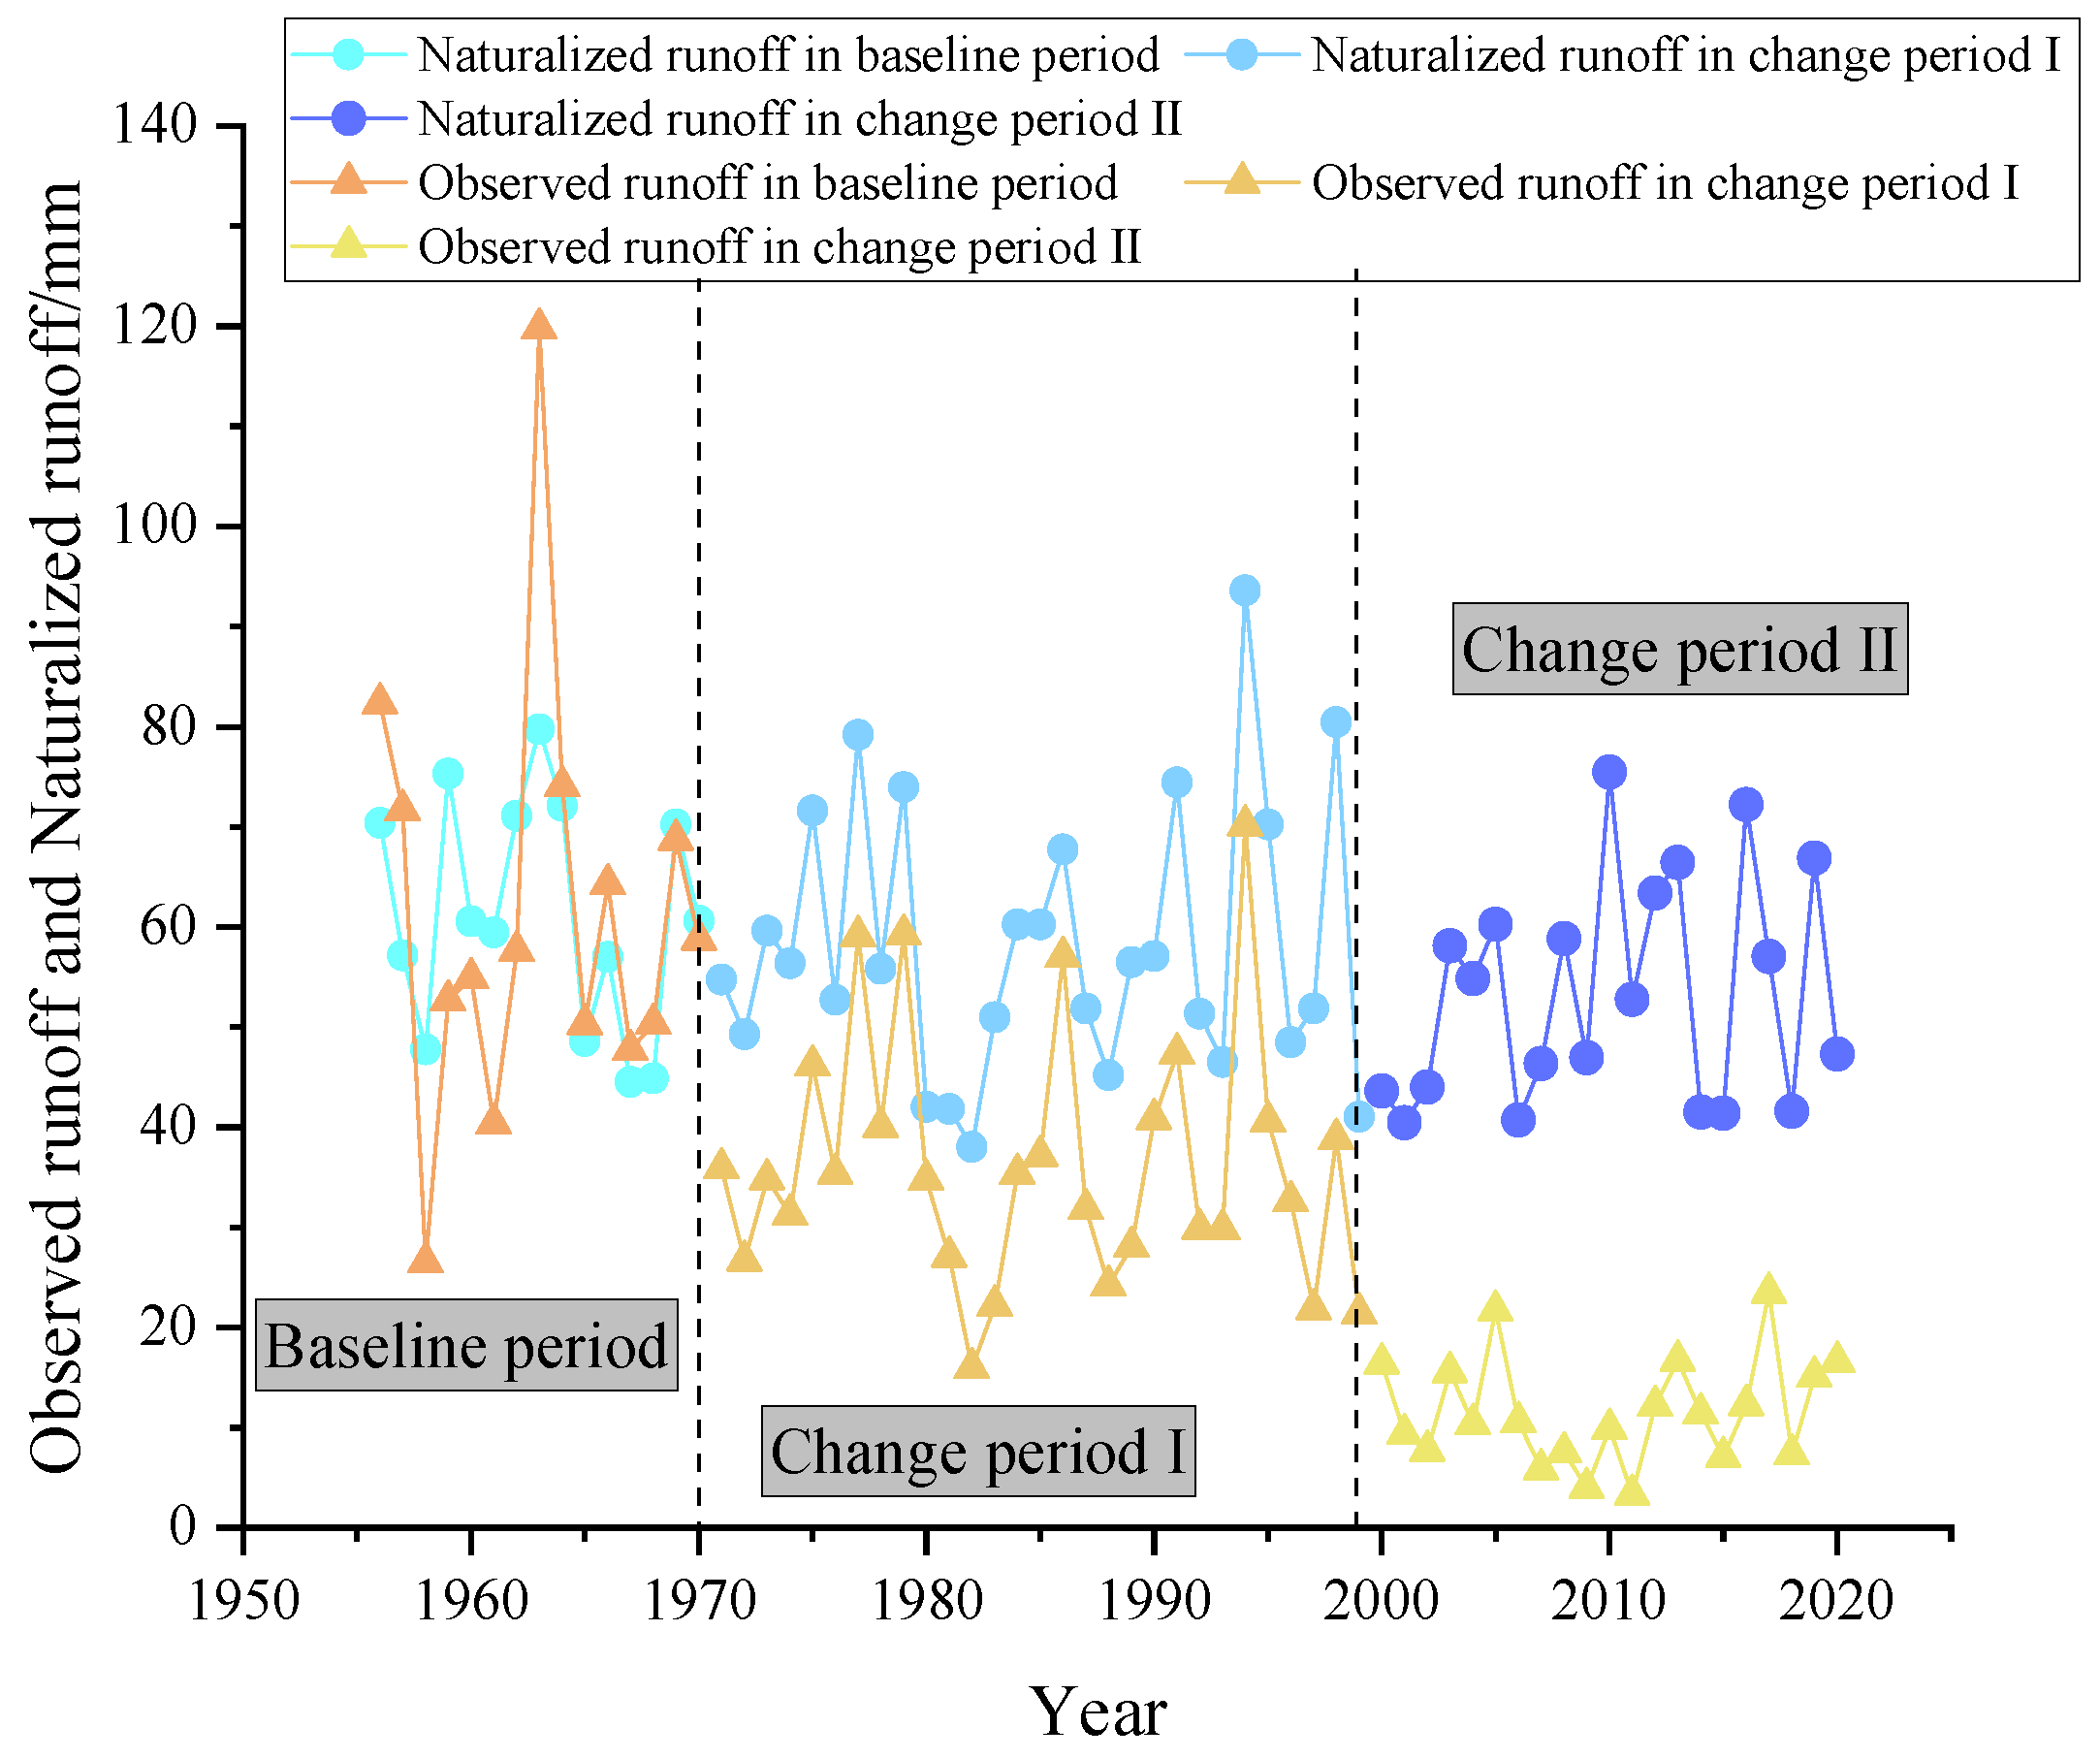
The relationship between the measured and naturalized runoff depth (i.e., runoff depth without human influence) derived from the linear regression model is presented in Figure 11. The results indicate that the naturalized runoff depth in stage I of the change period is lower than that in stage II, suggesting that human activities contributed more substantially to runoff alterations during change period II. In contrast, during the baseline period, the impact of human activities on runoff was minimal and thus negligible.
According to Figure 11, it can be calculated that the reduced average annual runoff is 57.3 mm, the average annual runoff in the baseline period is 61.4 mm, and the actual average annual runoff in the change period is 25.7 mm. Combining the calculations of Section 2.2 and Section 2.4, it can be obtained that during the period 1970–1999, the influence rate caused by climate was 14.0%, and the influence rate caused by humans was 86.0%. During the change period II, the influence rate caused by climate was 16.4%, and the influence rate attributed to humans was 83.6%. During the change period, the impact rate caused by climate change was 15.4%, and the impact rate caused by human activities was 84.6%. Human activities were identified as the dominant factor. The contribution rate of climate change to runoff variation throughout the entire change period was 15.2%, and the contribution rate of human impact was 84.8%. During change period I, the contribution rate of climate change to runoff variation was 28.6%, and the contribution rate of human activities to runoff variation was 71.4%. During change period II, the contribution rate of climate change to runoff variation was 11.3%, and the contribution rate of human activities to runoff variation was 88.7%. It can be observed that the influence of human activities in change period II is significantly greater than that in change period I, indicating that the impact of human activities on the hydrological cycle of this region is increasing over time. Based on the linear regression model and the Budyko equation, the contribution rates of climate change and human activities to runoff variation were quantitatively calculated, as presented in Table 2.
In this study, runoff is more sensitive to the impacts of climate change and human activities, and Table 2 summarizes the results of calculating the contribution rates of climate change and human activities in the LRB using two methods (the linear regression equation and the Budyko hypothesis), with the impact intensity of human activities gradually increasing over time. The relative contribution of human activities to runoff changes has increased over time, attributable to the combined effects of multiple factors. During the study period, accelerated urbanization and land use changes have increased evapotranspiration and reduced runoff volume, while the construction of the Naodehai Reservoir directly decreased runoff through diversion. These findings are consistent with those reported by Li et al. [28] for the Liuhe River basin and by Tian [17] for the Liao River basin. Similarly, in the study by Li et al. [28], the SWAT model and Budyko equation were used in the LRB, and their results showed that the contribution of human activities was 86.3%, indicating that the changes in human activities are the main driver of runoff changes. Quantifying the impact of climate change and human activities on water resource changes in river basins, especially in arid or semi-arid areas, is of great significance for the rational utilization of water resources. Therefore, there is a need for deeper research to quantify the impact of various factors on runoff changes via different methods.

3.2.6. Effects of Global Meteorological Indicators on Runoff in the LRB

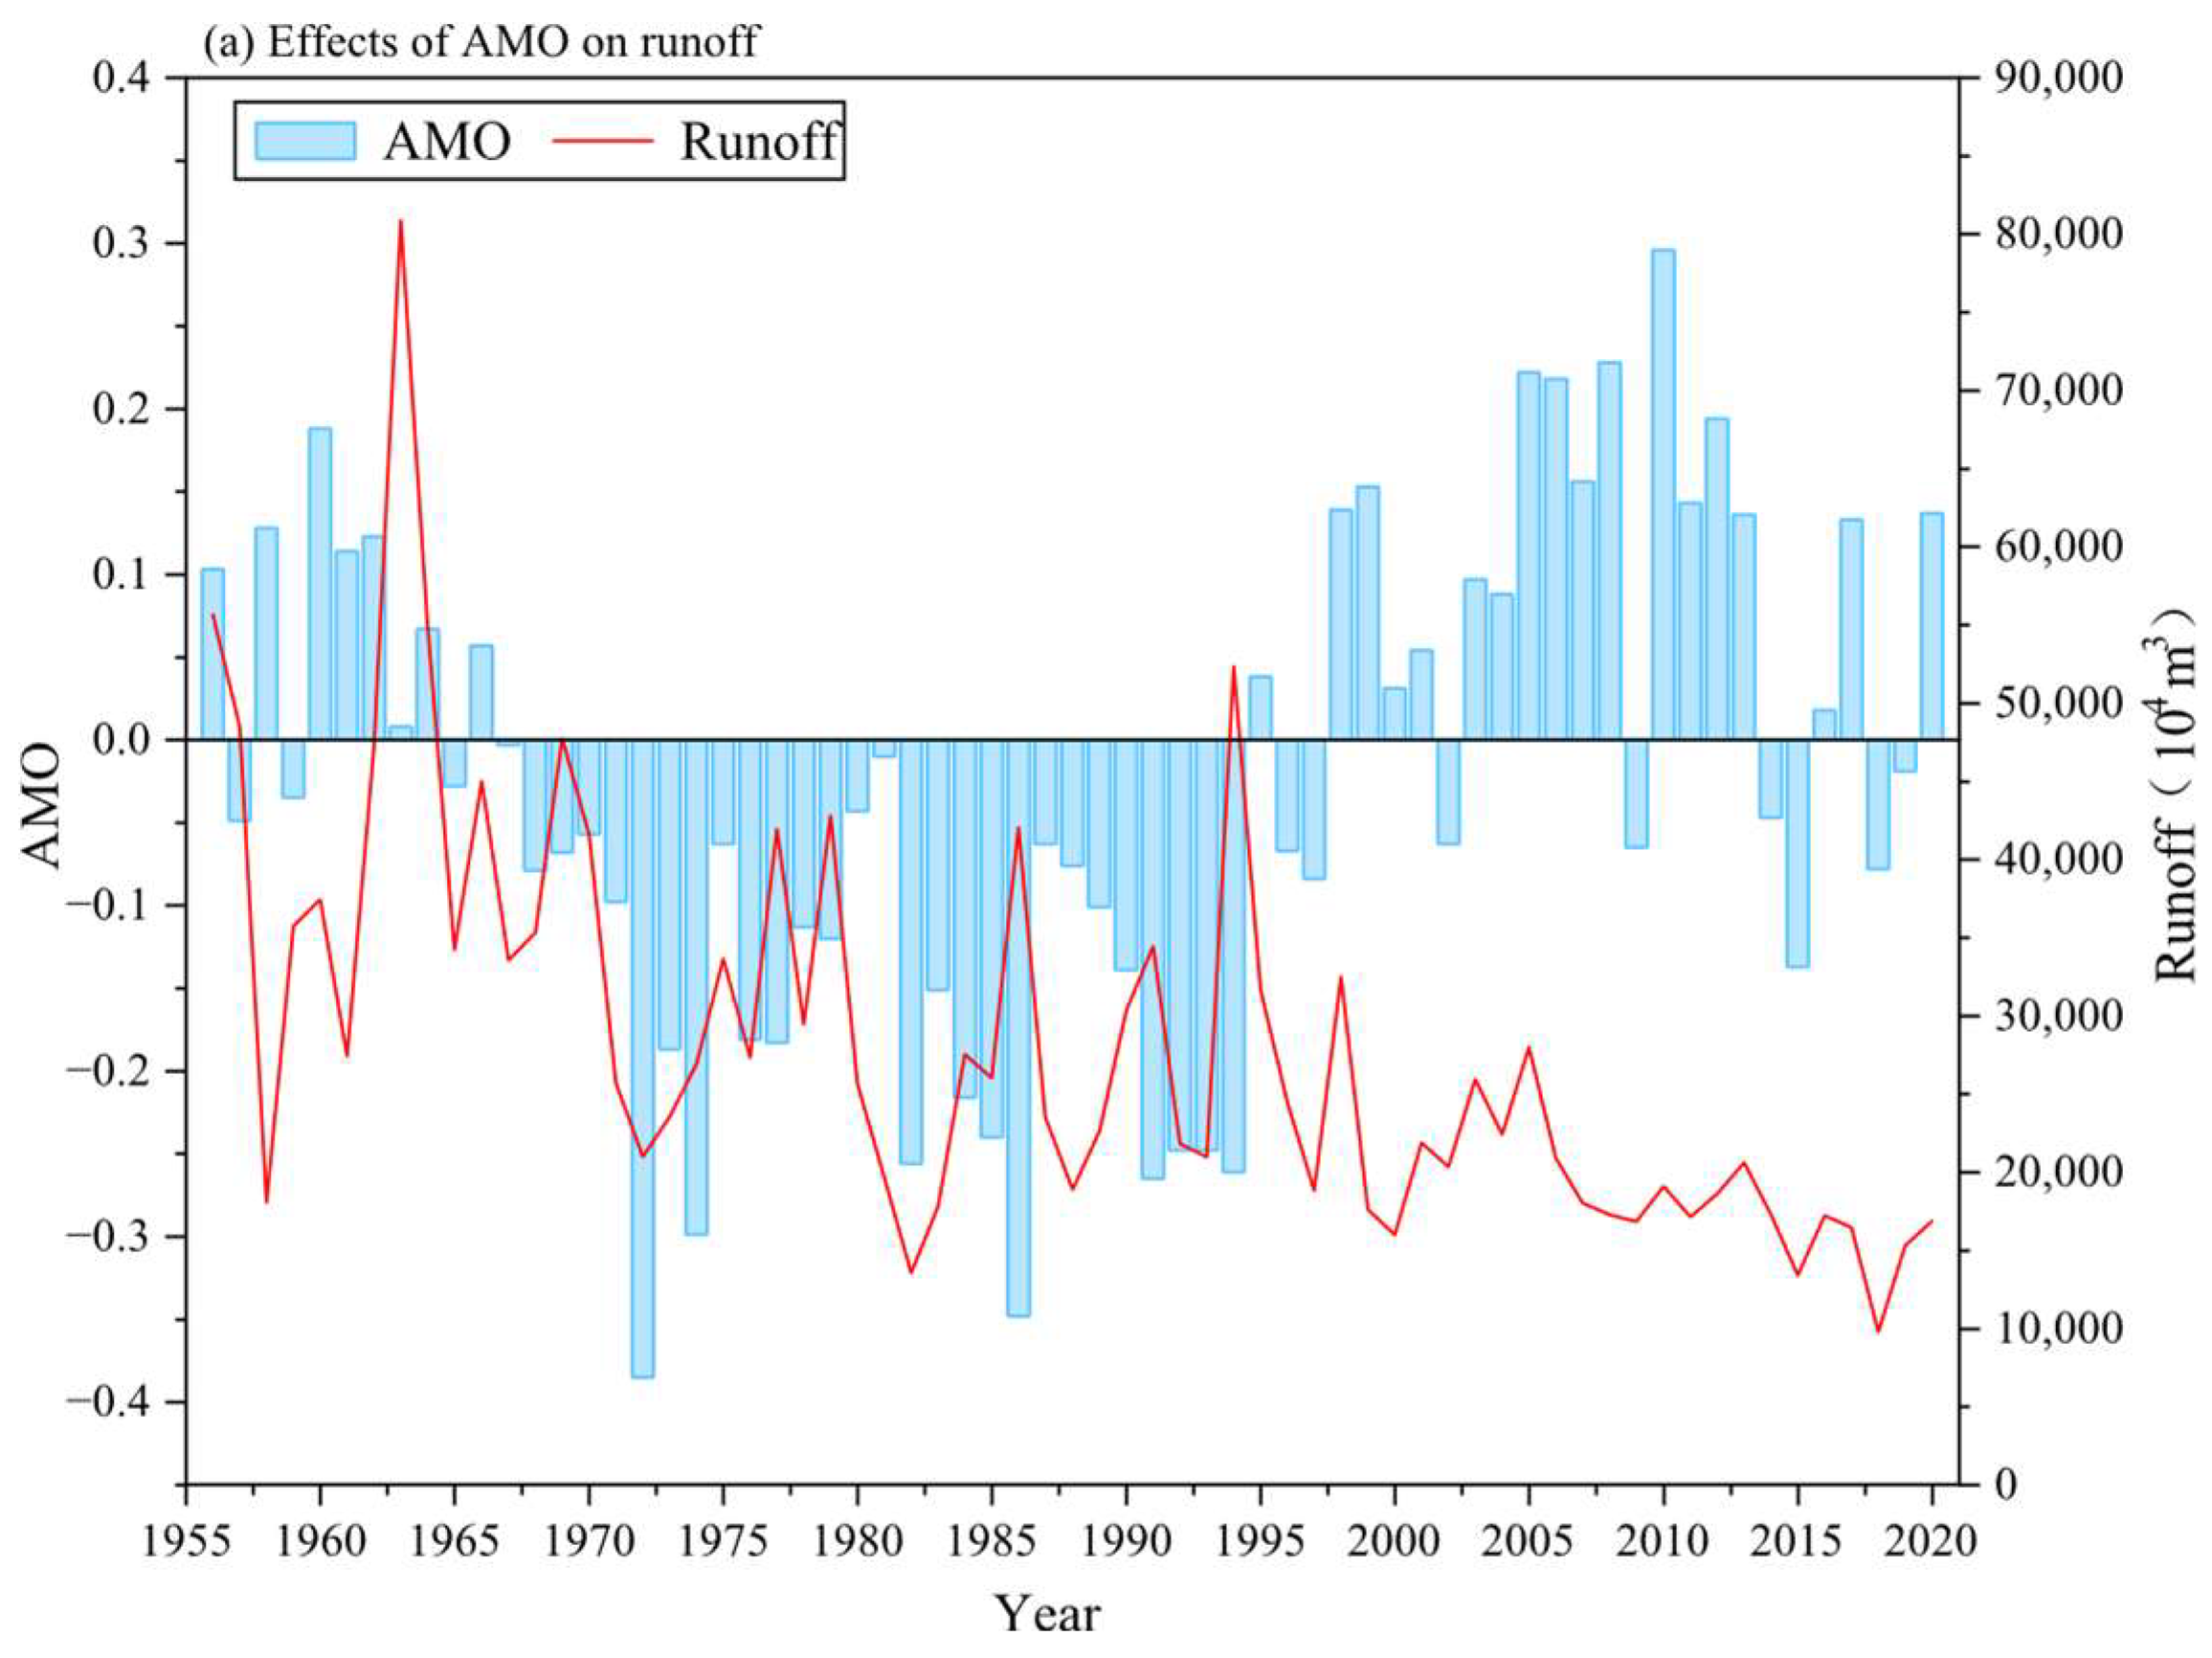
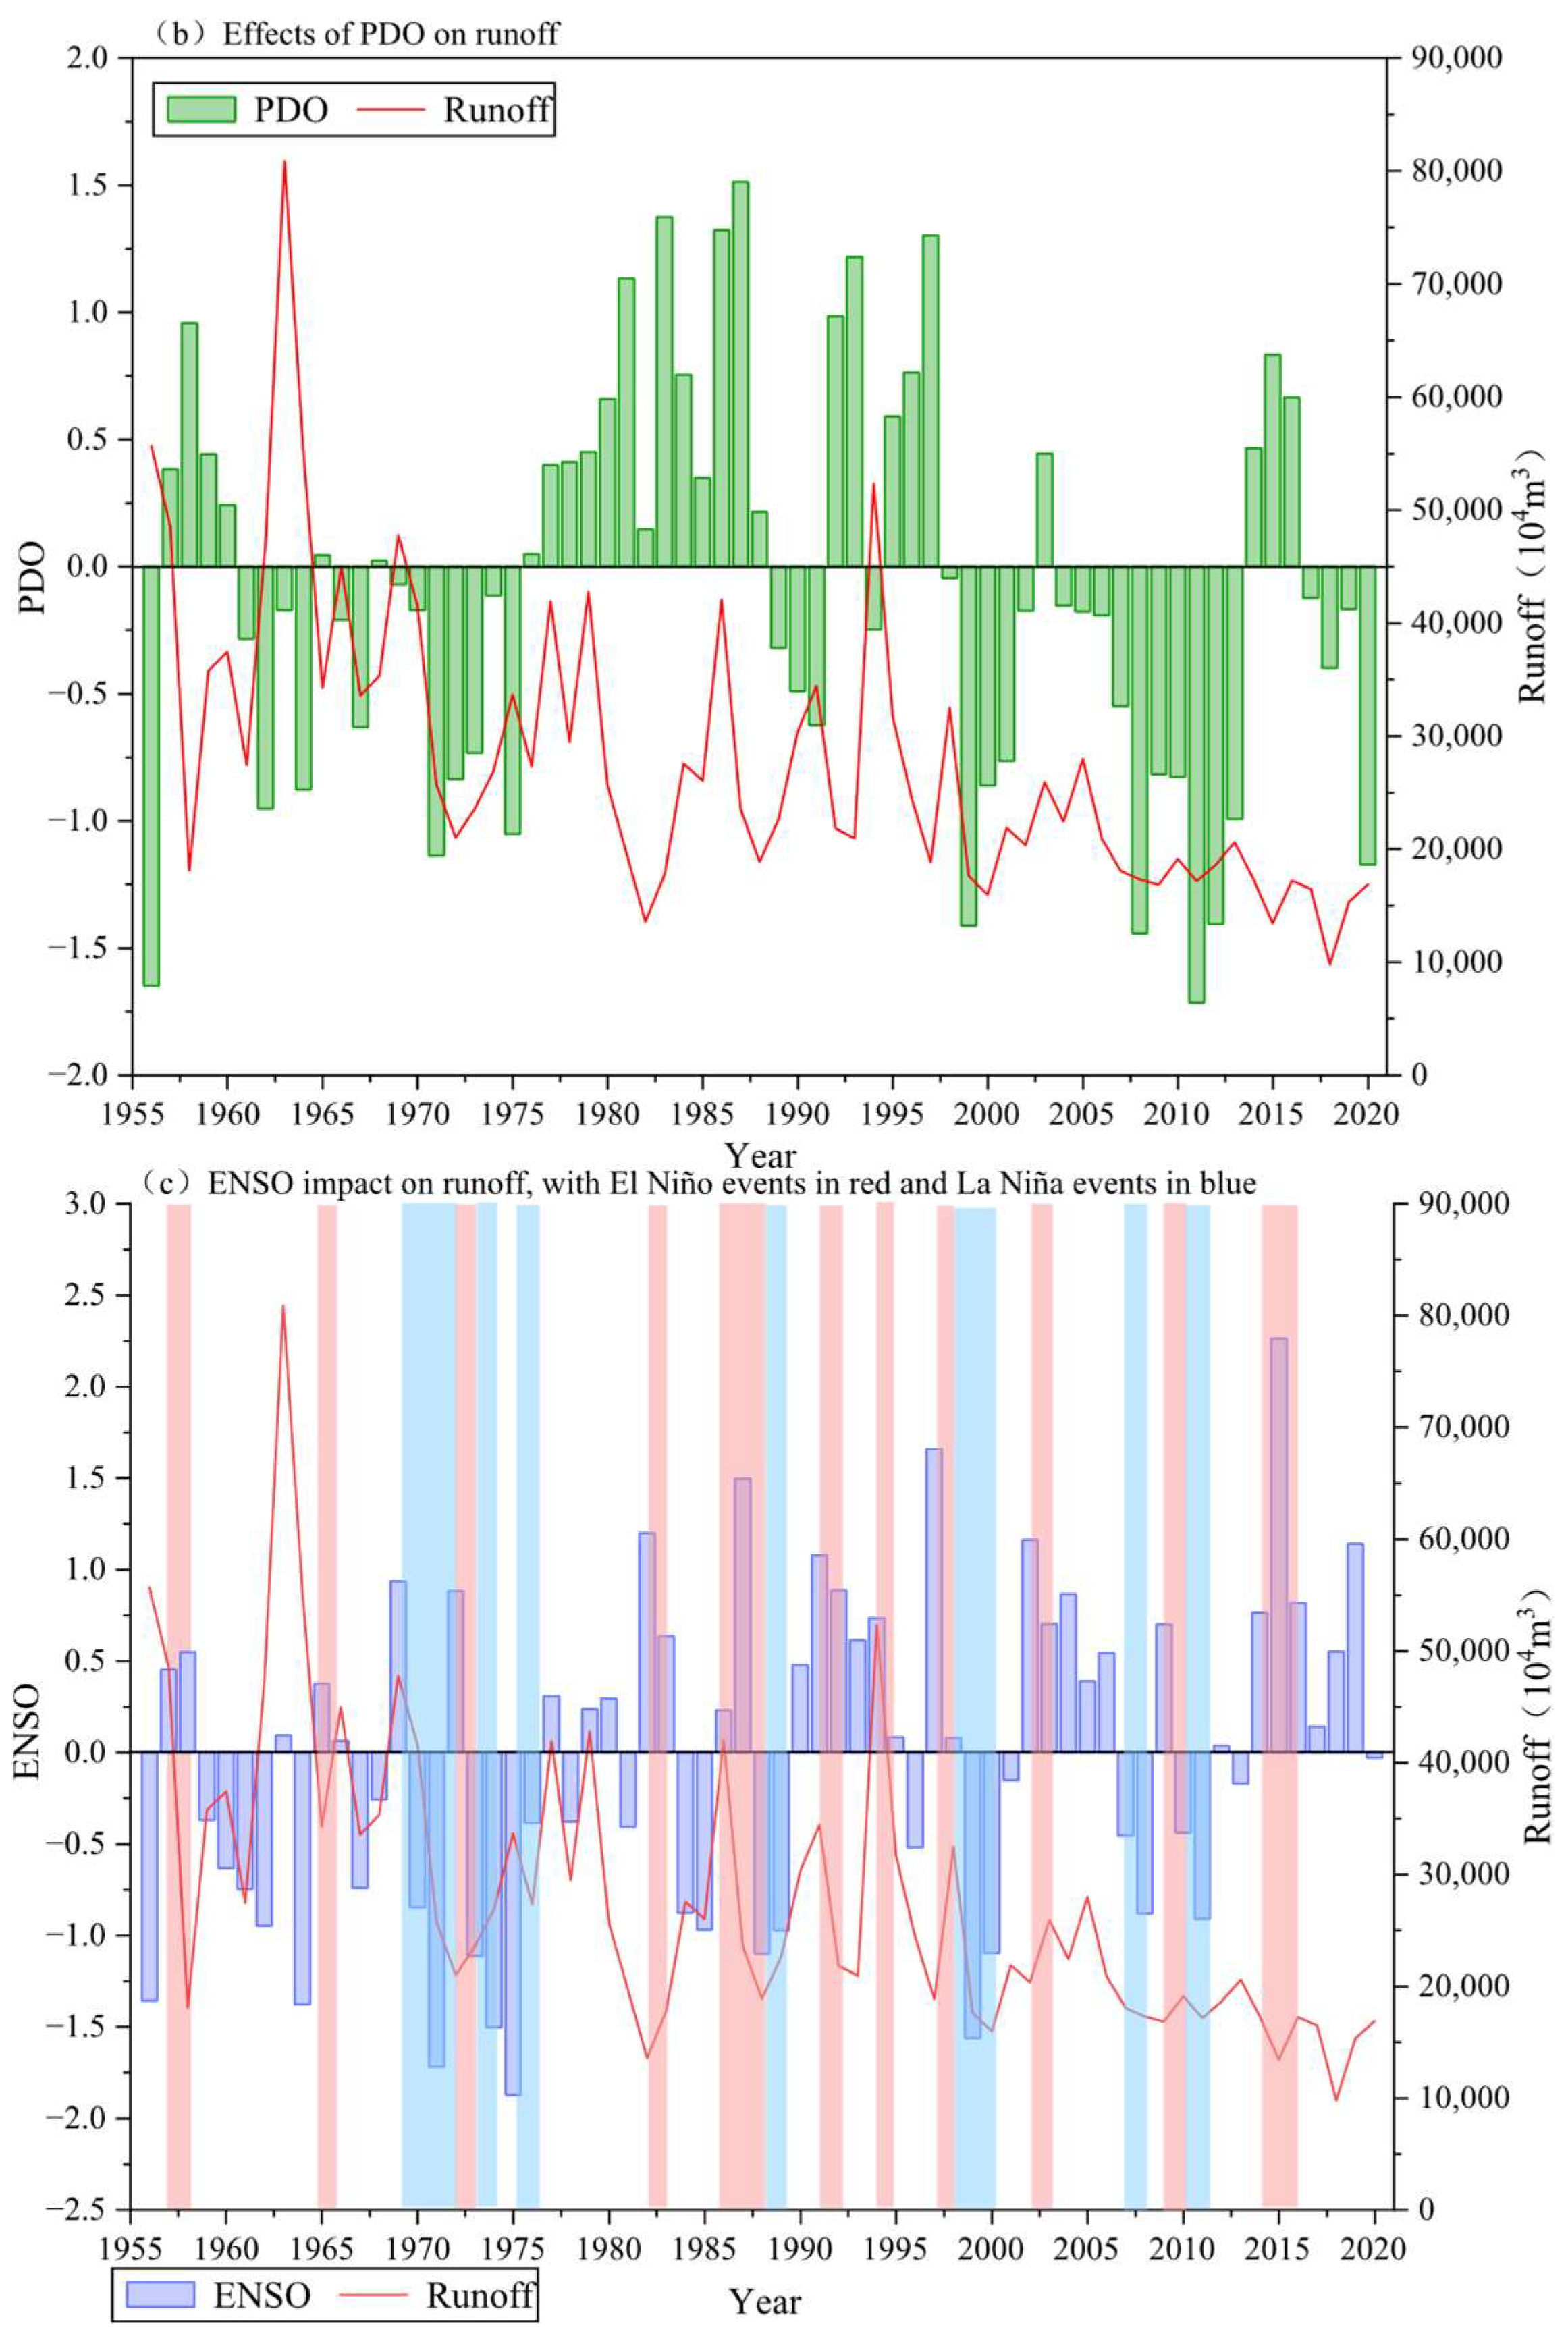
Previous studies have demonstrated that the hydroclimate of China during the 20th century was significantly modulated by the AMO, PDO, and ENSO [19]. Here, we also assembled continuous monthly indices for AMO, PDO, and ENSO spanning 1956–2020 and examined their coupled influences on runoff variability in the LRB.
Figure 12 presents the contrasting impacts of the AMO, PDO, and ENSO on annual runoff in the LRB. Panel (a) reveals a robust inverse relationship: runoff is significantly higher during AMO cold phases than during warm phases. Conversely, panels (b) and (c) exhibit no systematic phase–runoff association for either PDO or ENSO, indicating that these modes exert negligible influence on basin-scale streamflow. This differential response can be attributed to the disparate teleconnection pathways and physical mechanisms of the three climate systems. During AMO warm phases, anomalous North Atlantic sea-surface temperatures trigger a circum-Eurasian atmospheric wave train that directly reorganizes the East Asian summer monsoon, thereby reducing moisture advection into the Liuhe basin. Simultaneously, the AMO-induced tropospheric warming over Eurasia intensifies surface evaporative demand. The combined “reduced moisture supply–enhanced evaporative loss” mechanism suppresses runoff generation and drives a marked decline in streamflow. In contrast, the PDO’s primary footprint is confined to the eastern Pacific and western North America; its downstream influence on inland Northeast China is weak and largely mediated through modulation of ENSO. The LRB, however, lies at the northern margin of the ENSO teleconnection zone and displays only muted hydrological sensitivity to ENSO-related anomalies. Any precipitation perturbations induced by the PDO are further offset by temperature-driven increases in evapotranspiration, yielding no discernible net effect on runoff. ENSO itself predominantly influences the southern sector of the East Asian monsoon region; its impact on northeastern China is limited in magnitude and exhibits pronounced inter-event variability. Collectively, these findings demonstrate that the interdecadal variability of LRB runoff is governed primarily by the AMO—a stronger and more direct Atlantic-scale driver—whereas PDO and ENSO play, at best, a secondary and indirect role.
Table 3 indicates that the correlation between the AMO and annual runoff in the LRB is weak but statistically discernible, whereas the corresponding correlations for the PDO and ENSO are statistically indistinguishable from zero. These results suggest that hydrological variability in this Northeast China catchment is more strongly modulated by Atlantic-scale forcing than by Pacific modes, and—more importantly—that climate indices collectively explain only a modest fraction of the observed runoff variance, thereby corroborating the broader conclusions of this study.

3.3. Study Limitations

Notwithstanding the insights gained in this study, several limitations merit explicit acknowledgment. Runoff in the Liuhe basin arises from the concomitant influence of climatic variability and diverse anthropogenic pressures; yet, these drivers cannot be disentangled by direct observation alone [29]. Our reliance on a multiple linear regression framework enabled a first-order quantification of the relative contributions of climate change and human activities; however, the analysis aggregated these drivers into two broad categories. A more nuanced assessment would decompose them into their constituent determinants—namely, precipitation, potential evapotranspiration, temperature, and wind speed on the climatic side, and land use change, vegetation dynamics, hydraulic infrastructure, and groundwater abstraction on the anthropogenic side. Furthermore, we did not explicitly account for the feedback between anthropogenic activities and the climate system. Urbanization, for example, intensifies regional warming and increases the frequency of extreme heat and precipitation events, thereby exerting an indirect but potentially substantial influence on runoff; such pathways were neglected in the present model. Additionally, the Liuhe basin lies in the high-latitude northeast of China and receives a considerable snowpack whose spring melt constitutes a distinct hydrological pulse. Under a warming climate, accelerated snow and glacier melt worldwide have been shown to alter total runoff volumes [30]. By omitting snowmelt processes, our model exhibits markedly reduced skill during low-temperature months. Future research should therefore integrate high-resolution process representations to quantify the individual and synergistic effects of these multifaceted drivers on runoff variability.
In addition, this study employed linear regression to quantify runoff changes; however, it is important to acknowledge the limitations of this approach, as it cannot reveal the physical mechanisms underlying hydrological processes. In contrast, distributed hydrological models such as SWAT and VIC—which have been validated and successfully applied in semi-arid basins like the Liaohe River Basin—are capable of simulating the impacts of climate and human activities on hydrological processes more systematically. Future research will prioritize the use of process-based hydrological models, complemented by comparative analysis with linear regression models, to more accurately elucidate hydrological response mechanisms within the basin.

4. Conclusions

Understanding the effects of climate change and anthropogenic activities on water resource variations, particularly in arid and semi-arid regions, is crucial for sustainable water resources management. This study employs empirical methods (linear regression model and double mass curve) and the Budyko framework to quantitatively assess the relative contributions of climate change and human activities to runoff variations in the LRB, providing scientific support for regional water resources planning. The key findings are as follows:
(1)
From 1956 to 2020, the rainfall in the LRB showed an increasing trend, while the runoff and potential evapotranspiration exhibited a decreasing trend. Runoff is relatively sensitive to the impacts of climate change and human activities.
(2)
Using the linear regression model, the influence rates attributed to climate and human activities were 15.4% and 84.6% in the change period, 14.0% and 86.0% during the change period I (1970–1999), and 16.4% and 83.6% during the change period II (2000–2020), respectively. Similar results can be obtained from the Budyko equation, and the contribution rates of climate change and human activities were 15.2% and 84.2% in the change period, 28.6% and 71.4% in stage II, 11.3% and 88.7% in stage II, respectively. The different methods indicate that human activities play a dominant role in the changes in runoff in the LRB.

Author Contributions

Conceptualization, J.Y. and X.S.; methodology, J.Y.; software, J.Y.; validation, J.Y., X.S., and M.L.; formal analysis, J.Y.; investigation, X.S.; resources, M.L.; data curation, M.L.; writing—original draft preparation, J.Y.; writing—review and editing, X.S.; visualization, J.Y.; supervision, X.S.; project administration, X.S.; funding acquisition, X.S. All authors have read and agreed to the published version of the manuscript.

Funding

This research was funded by the National Natural Science Foundation of China, grant number 51979271, and the Natural Science Foundation of Jiangsu Province, China, grant number BK20211247.

Data Availability Statement

The data that support the findings of this study are available on request from the corresponding author. The monthly PDO used in this analysis is available at https://www.ncei.noaa.gov/access/monitoring/pdo/, accessed on 24 August 2025. The monthly AMO can be accessed at https://psl.noaa.gov/data/timeseries/AMO/, accessed on 24 August 2025. The MEI is available at https://psl.noaa.gov/enso/mei/, accessed on 24 August 2025. Land use data are from the Resource and Environment Science and Data Centre, and available at http://www.resdc.cn/.

Conflicts of Interest

The authors declare no conflicts of interest.

References

  1. Song, X.; Zhang, J.; Zhan, C.; Liu, C. Review for impacts of climate change and human activities on water cycle. J. Hydraul. Eng. 2013, 44, 779–790. [Google Scholar]
  2. Sha, Z.; Bofu, Y.; Lintner, B.R.; Findell, K.L.; Yao, Z. Projected increase in global runoff dominated by land surface changes. Nat. Clim. Change 2023, 13, 442–449. [Google Scholar]
  3. Piao, S.; Ciais, P.; Huang, Y.; Shen, Z.; Peng, S.; Li, J.; Zhou, L.; Liu, H.; Ma, Y.; Ding, Y. The impacts of climate change on water resources and agriculture in China. Nature 2010, 467, 43–51. [Google Scholar] [CrossRef]
  4. Li, L.; Ni, J.; Chang, F.; Yue, Y.; Frolova, N.; Magritsky, D.; Borthwick, A.G.L.; Ciais, P.; Wang, Y.; Zheng, C.; et al. Global trends in water and sediment fluxes of the world’s large rivers. Sci. Bull. 2020, 65, 62–69. [Google Scholar] [CrossRef]
  5. Zhang, H.; Meng, C.; Wang, Y.; Wang, Y.; Li, M. Comprehensive evaluation of the effects of climate change and land use and land cover change variables on runoff and sediment discharge. Sci. Total Environ. 2020, 702, 134401. [Google Scholar] [CrossRef]
  6. Chen, T.; Zou, L.; Xia, J.; Liu, H.; Wang, F. Decomposing the impacts of climate change and human activities on runoff changes in the Yangtze River Basin: Insights from regional differences and spatial correlations of multiple factors. J. Hydrol. 2022, 615, 128649. [Google Scholar] [CrossRef]
  7. Xue, D.; Zhou, J.; Zhao, X.; Liu, C.; Wei, W.; Yang, X.; Li, Q.; Zhao, Y. Impacts of climate change and human activities on runoff change in a typical arid watershed, NW China. Ecol. Indic. 2021, 121, 107013. [Google Scholar] [CrossRef]
  8. Li, Z.; Quiring, S.M. Investigating spatial heterogeneity of the controls of surface water balance in the contiguous United States by considering anthropogenic factors. J. Hydrol. 2021, 601, 126621. [Google Scholar] [CrossRef]
  9. Zhang, S. Research on governance measures of Liuhe (Xinmin section). Heilongjiang Hydraul. Sci. Technol. 2025, 53, 76–79. [Google Scholar]
  10. Huang, C.; Yang, Z.Z.; Yang, X.Y.; Ma, H.; Yang, Y.K.; Zhang, J.C. Attribution Analysis of Runoff Change in a Changing Environment: A Case Study of the Dawen River Basin. Water 2025, 17, 1538. [Google Scholar] [CrossRef]
  11. Saifullah, M.; Adnan, M.; Zaman, M.; Walega, A.; Liu, S.; Khan, M.I.; Gagnon, A.S.; Muhammad, S. Hydrological Response of the Kunhar River Basin in Pakistan to Climate Change and Anthropogenic Impacts on Runoff Characteristics. Water 2021, 13, 3163. [Google Scholar] [CrossRef]
  12. Alifujiang, Y.; Abuduwaili, J.; Groll, M.; Issanova, G.; Maihemuti, B. Changes in intra-annual runoff and its response to climate variability and anthropogenic activity in the Lake Issyk-Kul Basin, Kyrgyzstan. Catena 2021, 198, 104974. [Google Scholar] [CrossRef]
  13. Zhang, F.; Lai, W.; Zhang, S.; Liu, W.; Hou, S.; Zhang, J. Quantifying the contribution of climate changes and human activities on runoff changes in the Changhua River Basin of Hainan Island. J. Hydrol.-Reg. Stud. 2025, 60, 102474. [Google Scholar] [CrossRef]
  14. Zhu, H.; He, G.; Zhao, Y.; Wang, J.; He, F.; Li, W.; Wang, X. Evolution Characteristics and Attribution Analysis of Yellow River Runoff into the Sea from 1956 to 2022. Water Resour. Prot. 2025, 1–16. [Google Scholar]
  15. Zhang, Y.; Wang, W.; Yang, Y. Attribution Analysis of Annual Runoff Changes in the Pearl River Basin Based on Budyko Hypothesis. J. China Hydrol. 2025, 1–8. [Google Scholar]
  16. Shahid, M.; Cong, Z.; Zhang, D. Understanding the impacts of climate change and human activities on streamflow: A case study of the Soan River basin, Pakistan. Theor. Appl. Climatol. 2018, 134, 205–219. [Google Scholar] [CrossRef]
  17. Tian, L.; Wang, S. Analysis of the Runoff Change and Main Influencing Factors in the Liaohe River Basin. Res. Soil Water Conserv. 2018, 25, 153–159. [Google Scholar]
  18. Kai, W. Water Resources Evaluation and Development and Utilization Scheme of the Plain Area of Liuhe River Basin in Liaoning Province. Master’s Thesis, Jilin University, Jilin, China, 2022. [Google Scholar]
  19. Yang, Q.; Ma, Z.; Fan, X.; Yang, Z.-L.; Xu, Z.; Wu, P. Decadal Modulation of Precipitation Patterns over Eastern China by Sea Surface Temperature Anomalies. J. Clim. 2017, 30, 7017–7033. [Google Scholar] [CrossRef]
  20. Ouyang, R.; Liu, W.; Fu, G.; Liu, C.; Hu, L.; Wang, H. Linkages between ENSO/PDO signals and precipitation, streamflow in China during the last 100 years. Hydrol. Earth Syst. Sci. 2014, 18, 3651–3661. [Google Scholar] [CrossRef]
  21. Bai, X.L.; Zhao, W.Z. Impacts of climate change and anthropogenic stressors on runoff variations in major river basins in China since 1950. Sci. Total Environ. 2023, 898, 165349. [Google Scholar] [CrossRef]
  22. Gu, X.; Zhang, P.; Zhang, W.; Liu, Y.; Jiang, P.; Wang, S.; Lai, X.; Long, A. A Study of Drought and Flood Cycles in Xinyang, China, Using the Wavelet Transform and M-K Test. Atmosphere 2023, 14, 1196. [Google Scholar] [CrossRef]
  23. Ye, T.; Shi, P.; Zhong, H.; Qu, S.; Wu, H.; Shen, L. Attribution analysis of runoff change in the upper and middle Huaihe River based on Budyko hypothesis and differential equation. J. Hohai Univ. (Nat. Sci.) 2022, 50, 25–32. [Google Scholar]
  24. Wei, F. The Current Statistical Climatic Diagnosis and Forecasting Technology; Beijing Meteorological Press: Beijing, China, 1999. [Google Scholar]
  25. Wang, X.; Guo, S.; Wang, J.; Shi, Y.; Dong, F. Attribution analysis of inflow runoff reduction for Danjiangkou Reservoir based on Budyko Equation. Yangtze River 2025, 1–16. [Google Scholar]
  26. Baw-puh, F. On the calculation of the evaporation from land surface. Chin. J. Atmos. Sci. 1981, 5, 23–31. [Google Scholar]
  27. Yang, S.; Jiang, R.; Xie, J.; Zhu, J.; Wang, J. Trend and attribution analysis of runoff in Jinghe River. J. Xi’an Univ. Technol. 2019, 35, 186–191. [Google Scholar]
  28. Li, M.; Wang, H.; Du, W.; Gu, H.; Zhou, F.; Chi, B. Responses of runoff to changes in climate and human activities in the Liuhe River Basin, China. J. Arid Land 2024, 16, 1023–1043. [Google Scholar] [CrossRef]
  29. Xu, J.J.; Gao, X.C.; Yang, Z.Y.; Xu, T.Y. Trend and Attribution Analysis of Runoff Changes in the Weihe River Basin in the Last 50 Years. Water 2022, 14, 47. [Google Scholar] [CrossRef]
  30. Ding, Y.; Zhang, S.; Chen, R.; Qin, J.; Zhao, Q. A review of the impacts of climate change on cryospheric hydrological processes. Clim. Change Res. 2025, 21, 1–21. [Google Scholar]
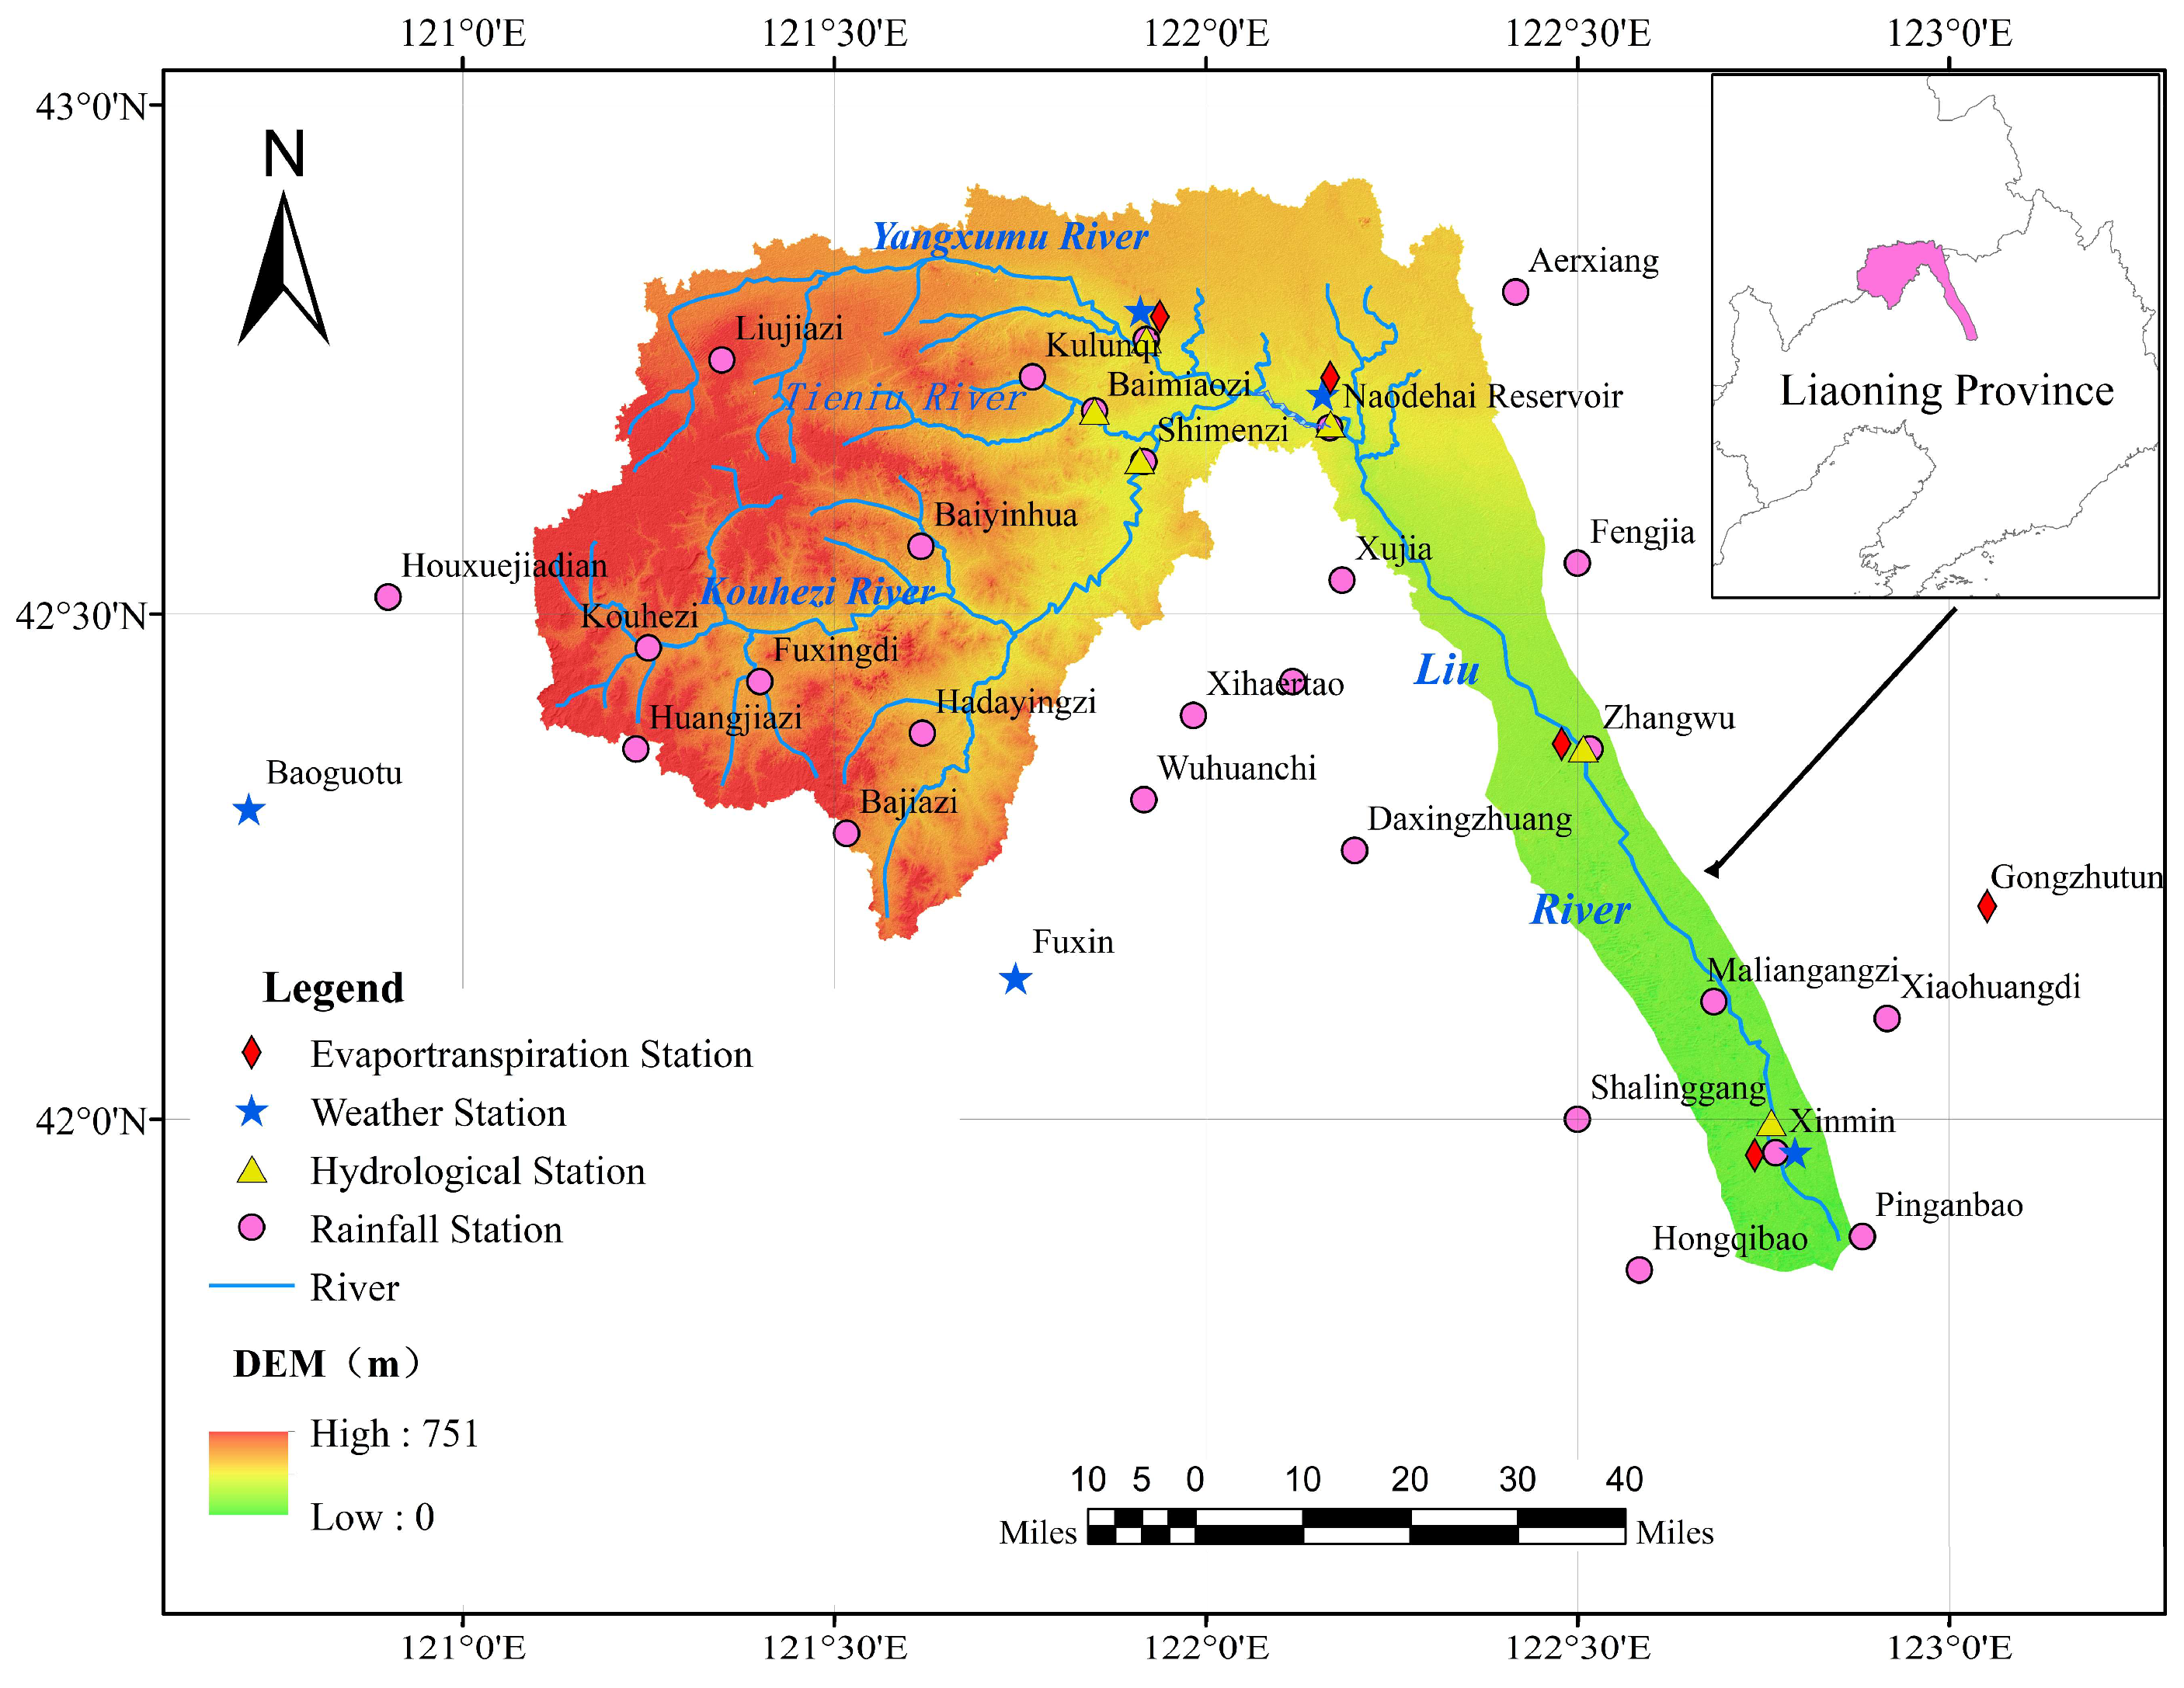
Figure 1. Spatial distribution of meteorological and hydrological stations in the LRB.
Sustainability 17 08050 g001
Figure 2. Interannual variation in annual precipitation series in a year (a), flood season (b), dry season (c), upstream (d), and downstream (e) parts in the LRB. The p-value was derived based on the t-distribution.
Sustainability 17 08050 g002
Figure 3. Trends of precipitation series at each station in the LRB.
Sustainability 17 08050 g003
Figure 4. Similar to Figure 2, but for runoff.
Sustainability 17 08050 g004
Figure 5. Detection results of runoff mutations.
Sustainability 17 08050 g005
Figure 6. Interannual variations in potential and actual evaporation in the LRB. (ac) represent the temporal variations in annual potential evapotranspiration, actual evapotranspiration, seasonal potential evapotranspiration, and actual evaporation at each site, respectively.
Sustainability 17 08050 g006
Figure 7. The division and runoff coefficient of the change period and the baseline period. (a) the rainfall–runoff double mass curve; (b) the runoff coefficient curve.
Sustainability 17 08050 g007
Figure 8. Figures (al) represent the monthly rainfall-runoff relationships and their regression models for January to December during the baseline period, respectively. KGE is Kling–Gupta efficiency, and NSE is Nash–Sutcliffe efficiency.
Sustainability 17 08050 g008aSustainability 17 08050 g008b
Figure 9. Land use maps of the LRB for 1980 (a) and 2023 (b).
Sustainability 17 08050 g009
Figure 10. The relationships between observed runoff and naturalized runoff in the LRB are presented in Figure panels (ac), where (a) corresponds to the baseline period and (b) and (c) correspond to the first and second change periods, respectively.
Sustainability 17 08050 g010aSustainability 17 08050 g010b
Figure 11. Changes in measured and reduced runoff in the LRB.
Sustainability 17 08050 g011
Figure 12. Effects of climatic factors on annual runoff in the LRB.
Sustainability 17 08050 g012aSustainability 17 08050 g012b
Table 1. Variation characteristics of hydrometeorological elements in the baseline period and abrupt change period in the LRB.
ElementBaseline Period/mmChange Period IChange Period IIChange Period (1970–2020)
Mean/mmRate of ChangeMean/mmRate of ChangeMean/mmRate of Change
Rainfall471.2475.20.9%452.8−3.9%467.1−0.9%
Runoff61.036.8−39.7%11.5−81.1%33.9−44.5%
PET968.5938.0−3.2%947.4−2.2%947.6−2.2%
Table 2. Quantitative analysis of runoff changes due to climate change and human activities.
PeriodRunoff ChangeLinear Regression ModelBudyko Models
∆R∆Rhuman∆Rclimate∆Rhuman∆Rclimate
mmmm%mm%mm%mm%
I−24.4−21.086.0−3.414.0−20.771.4−8.528.6
II−49.9−41.783.6−8.216.4−39.788.7−5.411.3
All−34.9−29.584.6−5.415.4−30.281.8−6.918.2
Note: Change period I is 1970–1999, change period II is 2000–2020, and all is 1970–2020.
Table 3. Correlation analysis between climatic factors and runoff in the LRB.
IndexCorrelation Coefficient rCorrelation Strength
AMO−0.322Weak correlation
PDO−0.051Extremely weakly correlated/irrelevant
ENSO0.097Extremely weakly correlated/irrelevant
Note: Pearson correlation coefficients are interpreted as follows: |r| ≥ 0.8, very strong; 0.6 ≤ |r| < 0.8, strong; 0.4 ≤ |r| < 0.6, moderate; 0.2 ≤ |r| < 0.4, weak; |r| < 0.2, very weak or negligible.
Disclaimer/Publisher’s Note: The statements, opinions and data contained in all publications are solely those of the individual author(s) and contributor(s) and not of MDPI and/or the editor(s). MDPI and/or the editor(s) disclaim responsibility for any injury to people or property resulting from any ideas, methods, instructions or products referred to in the content.