Article

Smart Residual Biomass Supply Chain: A Digital Tool to Boost Energy Potential Recovery and Mitigate Rural Fire Risk

by
Tiago Bastos
1,2,*,
Leonel J. R. Nunes
1,3,4 and
Leonor Teixeira
1,2
1
DEGEIT, Departamento de Economia, Gestão, Engenharia Industrial e Turismo, Universidade de Aveiro, Campus Universitário de Santiago, 3810-193 Aveiro, Portugal
2
Laboratório Associado de Sistemas Inteligentes (LASI), Instituto de Engenharia Eletrónica e Informática de Aveiro (IEETA), Universidade de Aveiro, 3810-193 Aveiro, Portugal
3
GOVCOPP, Unidade de Investigação em Governança, Competitividade e Políticas Públicas, Universidade de Aveiro, Campus Universitário de Santiago, 3810-193 Aveiro, Portugal
4
PROMETHEUS, Unidade de Investigação em Materiais, Energia, Ambiente para a Sustentabilidade, Instituto Politécnico de Viana do Castelo, Rua da Escola Industrial e Comercial de Nun’Alvares, 4900-347 Viana do Castelo, Portugal
*
Author to whom correspondence should be addressed.
Sustainability 2025, 17(17), 7863; https://doi.org/10.3390/su17177863
Submission received: 6 May 2025 / Revised: 13 August 2025 / Accepted: 26 August 2025 / Published: 1 September 2025
(This article belongs to the Special Issue Digital Transformation for a Sustainable World: Trends and Challenges)

Abstract

Agroforestry landscape has undergone changes, namely land abandonment, which when combined with negative attitudes towards fire, is associated with the eradication of agroforestry leftovers and acts towards the proliferation of fires, threatening sustainability concerns. Agroforestry leftovers recovery presents high potential to act on this problem; however, the logistical costs associated with the recovery chain make it unfeasible. The lack of coordination/transparency between stakeholders is one of the main explanations for these costs. This study develops a digital tool to enhance the residual biomass supply chain for energy recovery and fire risk mitigation. In addition to this concept, this work also proposes conceptual models and a prototype, two essential contributions to software development. Methodologically, this study consulted 10 experts to validate a concept previously presented in the literature, supplemented with UML modeling and prototyping with Figma®. The main results point to the creation of a disruptive concept that will allow access to information/transparency about agroforestry services, with the goal that this will improve the functioning of the RBSC, resulting in a reduction in fire risk and, consequently, improvements in sustainability concerns associated with this hazard.

1. Introduction

The search for solutions that can mitigate sustainability challenges is increasing, as projections of future consumption reinforce the need to take measures to ensure the sustainability of future generations [1]. To guide these sustainable needs, the United Nations has launched a guide with 17 Sustainable Development Goals (SDGs), that aims to address societal needs [2,3]. Across different nations, e.g., Portugal or Spain, fire occurrence has threatened sustainability concerns [4]. The consequences of these events affect the three dimensions of sustainability (economic, environmental, and social), allowing the inference to be drawn that, directly or indirectly, they affect all 17 SDGs. The emission of gases, contributing to an increase in the greenhouse effect, the contamination of soil and water, the destruction of ecosystems, and the loss of animal biodiversity can all be listed as the main negative effects of these events [5,6,7]. In this sense, the SDGs, 6—“Clean Water and Sanitation”, 13—“Climate Action”, 15—“Life on Land”, and 11—“Sustainable Cities and Communities”, can be enumerated as the most impacted. A significant share of these fires appears when agroforestry leftovers are burned, as a result of negligent attitudes towards fire, since these resources do not have established markets [8,9,10,11,12]. In addition to fire harmful consequences, this burning inhibits leftovers valorization for energy production [13,14,15] or for textile/plastics industries [16]. These points can impact SDG7—“Affordable and Clean Energy” and SDG8—“Decent Work and Economic Growth”, boosting renewable energy production and reducing external dependence on energy sources (mainly in countries without fossil fuels). Despite the potential benefits of agroforestry leftovers recovery, it is tagged by the logistical costs inherent to the supply chain (SC) responsible for its recovery, the residual biomass supply chain (RBSC) [17,18], where the collaboration between RBSC stakeholders (e.g., farmers, technology providers, and policymakers) becomes crucial to boost its feasibility [19].
Empowered by technological innovations associated with the Fourth Industrial Revolution (I4.0), the concept of smartness has emerged. This concept seeks to answer different sustainability needs of SC stakeholders [20]. Concerning RBSC, some solutions have been developed to increase the smarter degree, such as mathematical optimization models [21,22,23] or RBSC digital models [24]. However, communication between the different players remains unworkable [25], in many circumstances made difficult by the impracticality of implementing solutions with a very high level of technological complexity [24].
In this sense, this study aims to develop a digital tool that optimizes RBSC by improving communication, enhancing the concept of intelligent RBSC, and reducing fire hazards, filling the above-mentioned gap. As a direct impact of the tool, higher recovery rates of residual biomass (RB) are expected, resulting in potential improvements in terms of the sustainability concerns identified above. The digital tool presented is the result of the validation of a concept, with 10 experts, in a focus group, of the concept presented in the literature [26,27], resulting in a disruptive digital tool concept and modeling, complemented with a prototype as proof of concept. The article concludes with a discussion of the possible impacts of using the tool on the different stakeholders and on society.

2. Literature Review

2.1. Mitigating Rural Fires Through Biomass Recovery—RBSC Challenges

Rural fires are a concern among societies since they threaten human living conditions and socio-ecological systems and threaten various dimensions such as water, where fires are responsible for contamination or floods [28], gas emissions [29], biodiversity losses, or human diseases [7]. One cause of fire risk increase is the accumulation of fuel loads, mainly explained by rural abandonment [30,31] and is associated with younger rural exodus [18]. Furthermore, the climatic changes associated with dry periods have increased the rural fire risk [32,33]. Besides this, many fires arise from negligent behaviors with fire, normally used to eradicate agroforestry leftovers [9,10]. This triad of occurrences is in line with the theory that favorable weather conditions, ignitions, and fuel are the three main conditions for the proliferation of fires [34].
To mitigate this occurrence, recovering RB appears as promising since it will reduce fuel loads and negligent fire behaviors and will contribute to renewable energy, which is particularly relevant in recent years because of energy needs [35]. However, this recovery is tagged by RBSC logistic costs [18]. RBSC processes are complex, requiring specific and varied equipment, involving various actors, such as producers, transporters, and end consumers [25,36,37]. Biomass locations and seasonality [38] as well as high transportation costs represent barriers of this recovery [39,40]. At the information level, RBSC is tagged by lower coordination/communication between RBSC actors [13]. Besides the RBSC constrains, RB is tagged by high moisture content, inert value, heterogeneity, and low calorific value and density, which makes RB recovery difficult [13,41]. Tasks such as storage [23] or pre-treatment activities [21] can be used to improve RB recovery. As it is visible, even though the decision-making process can be complex, various mathematical models have been developed that can help with this decision-making [27]. However, the literature also indicated that, regarding digital tools to boost information transparency, connecting actors, this gap persists. Figure 1 summarizes the problem of rural fires, based on the highlights of this section.

2.2. Smartness Concept: Smart Supply Chain Management and Smart Cities

Nowadays, environments are changing constantly, increasing the need for smart solutions [42]. The increasing complexity, variety demands, and technological developments make organizations more concerned about SC smart and sustainable solutions [20]. Organizations are adopting complex technology for SC management, altering traditional processes. This change makes the chain smarter, creating the concept of Smart Supply Chain Management (SSCM) [43]. SSCM is as main driver of the various chain players’ connection [42]. Digital tools and Information Systems (IS) will support collaboration between SC players, offering new opportunities for organization [44]. If on the one hand, Industry 3.0 was tagged by the digital tools based in the technology existent at that time, the Fourth Industrial Revolution proposes the eradication of boundaries between companies [45].
This smart concept was not exclusively a result of SC or industry contexts, as this could be applied to cities. Around one-third of the population has residence in cities and almost 90% of the population has a net signal [46], leading to changes in the city concept, which has transitioned from a traditional agglomeration of infrastructures to ecosystems populated by technology, improving sustainability and efficiency [47]. This new ecosystem is the base of the smart city concept [48], which has attracted policymakers’ attention to achieve the SDGs [46]. Rural fires are one of the concerns of smart cities, where satellite remote sensing [49] or sensitization [50] are pointed out as fire risk reductors. The Internet of Things (IoT) and Artificial Intelligence (AI) are also responsible for this detection; however, data collected through IoT can be threatened in non-smart environments [51].

3. Materials and Methods

3.1. Refining Solution Requirements

The IS has become a valuable tool to boost efficiency; however, to ensure the desired outcomes, correct design and implementation are vital [52]. In this sense, IS design requirements [53] and conceptual model creation [54] are two important phases to ensure an increase in the likelihood of producing the desired effects. To formulate the IS requirement list, some techniques could be used, such as surveys or interviews [55]. User participation in solution design is crucial, since good user experience results in user willingness to use IS, and good usability can ensure that the system will be used to its full potential [56].
In this regard, the research objective of this paper falls into the refinement phase of the solution, after the preliminary version of the concept has been created. This validation is particularly important as it fits in with the philosophy of agile development, where small increments are made and validated, correcting the concepts and preventing initial errors from accruing huge costs in the final solution, which is commonly associated with linear software methodologies [57]. Figure 2 shows the use of agile methodology in software development.
Therefore, to achieve this objective, 10 experts from academia were consulted to evaluate and refine an initial solution [26,27]. The selected experts were chosen for the focus group based on their relevant experience and domain knowledge, ensuring informed and meaningful contributions to the discussion. The technique used to perform this assessment was a focus group, with a duration of one hour. The focus group technique was chosen because it allows for direct feedback from target users, validating perceptions, needs, and reactions to the proposed technological concept. Here, the tool concept was presented, and three main questions were determined:
  • Which information model best meets the needs of the problem?
  • Which system actors should be incorporated into the solution?
  • What vicissitudes of the real context do practitioners face that are not reflected in the first version?
To complement the focus group, the study conducted literature analyses.

3.2. Creation of Technological Solution—Conceptual Models and Prototype

The second part of the work consisted of modeling the solution, seeking to achieve the second part of the development of technological solutions. For this, Unified Modeling Language (UML) modeling techniques were used. This notation was chosen due to the impact it has on software engineering. Two diagrams were chosen to design the solution, the use-case diagram, to define and detail the system’s actors, as well as their requirements, tracing the relationships between these different elements, between requirements, between requirements and actors, and between actors. The second diagram, the class diagram, appears with the purpose of providing a model for a database that will support the proposed tool. In this sense, all requirements were analyzed/scrutinized to clarify what information will be needed, as well as the information typology and the relationship between the different classes/tables. This design was made resorting to case tools.
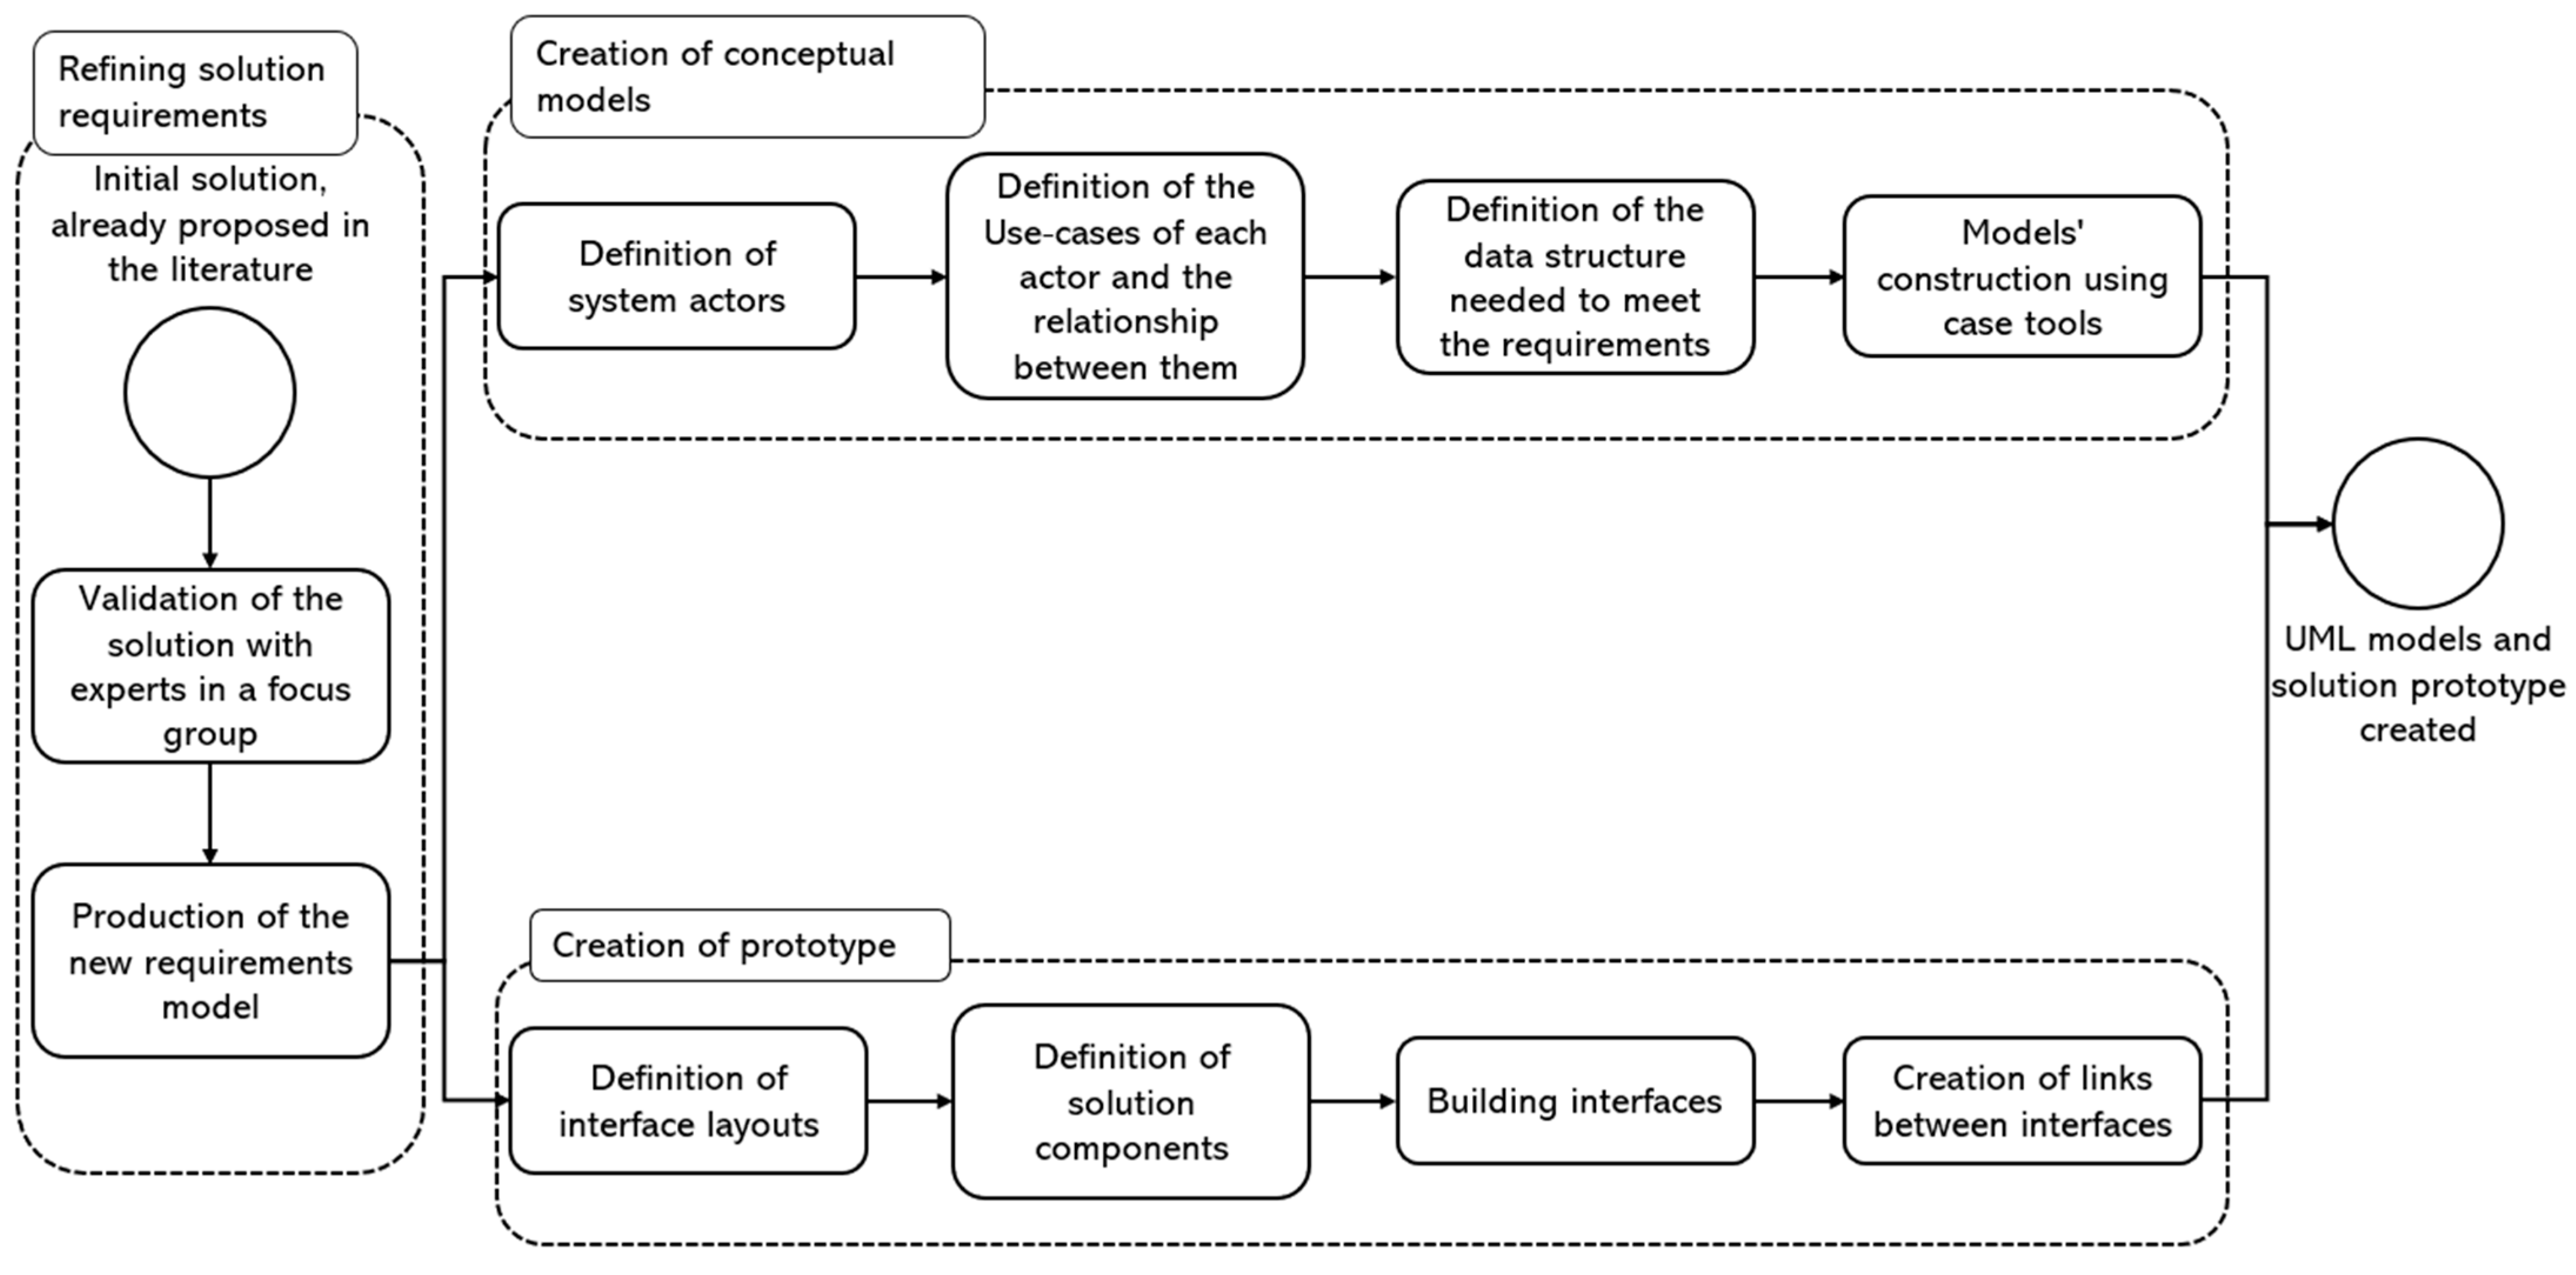
To complement the models, as proof of concept, a horizontal prototype was created in Figma®, a collaborative interface design platform. This tool was used given its prototyping possibilities, allowing for a component-based approach, e.g., defining buttons, headers, or footers. This tool also has the possibility of providing Cascading Style Sheets (CSS) code, which proves to be valuable in the following phases of platform building. Thus, in procedural terms, this phase began with the definition/redefinition of the structure of the layouts, as well as the definition of the color palette. Secondly, there was the choice and consequent detail of the components, culminating in the last phase, construction of the individual interfaces. Once the interfaces were made, the next step consisted of creating interactions between them to make the prototype as close to the final solution (with the programming done) as possible. The summary of the entire methodology carried out in this study is presented in Figure 3.

4. Results

4.1. Concept: Actors and Main Requirements

As the focus of this tool relies on the linkage between RB producers and RB consumers, two groups were created, the first (producers), to communicate their leftovers on the platform, and the second (consumers), to manifest interest in the resource. To connect the mentioned groups (producer–consumers), end consumers can assume this function or outsource, appearing with the third actor, the transporter. To act in fuel load problems, another actor arises in this system, the intermediary, where their role relies on fuel load remotion. To manage the entire system, the management entity (e.g., parish council or reginal civil protection) was included, which can also function as a reactive actor, acting when some profiles are missing. This role can be taken on by any other actor in the system; however, disregarding possible conflicts of interest, this individual must have two registrations for the system to recognize the profile, providing the corresponding requirements and permissions.
Thus, the proposed system will have five actors: producer, intermediary, transporter, end consumer, and management entity (ME). Table 1 summarizes the actors, their descriptions, and their specific requirements.
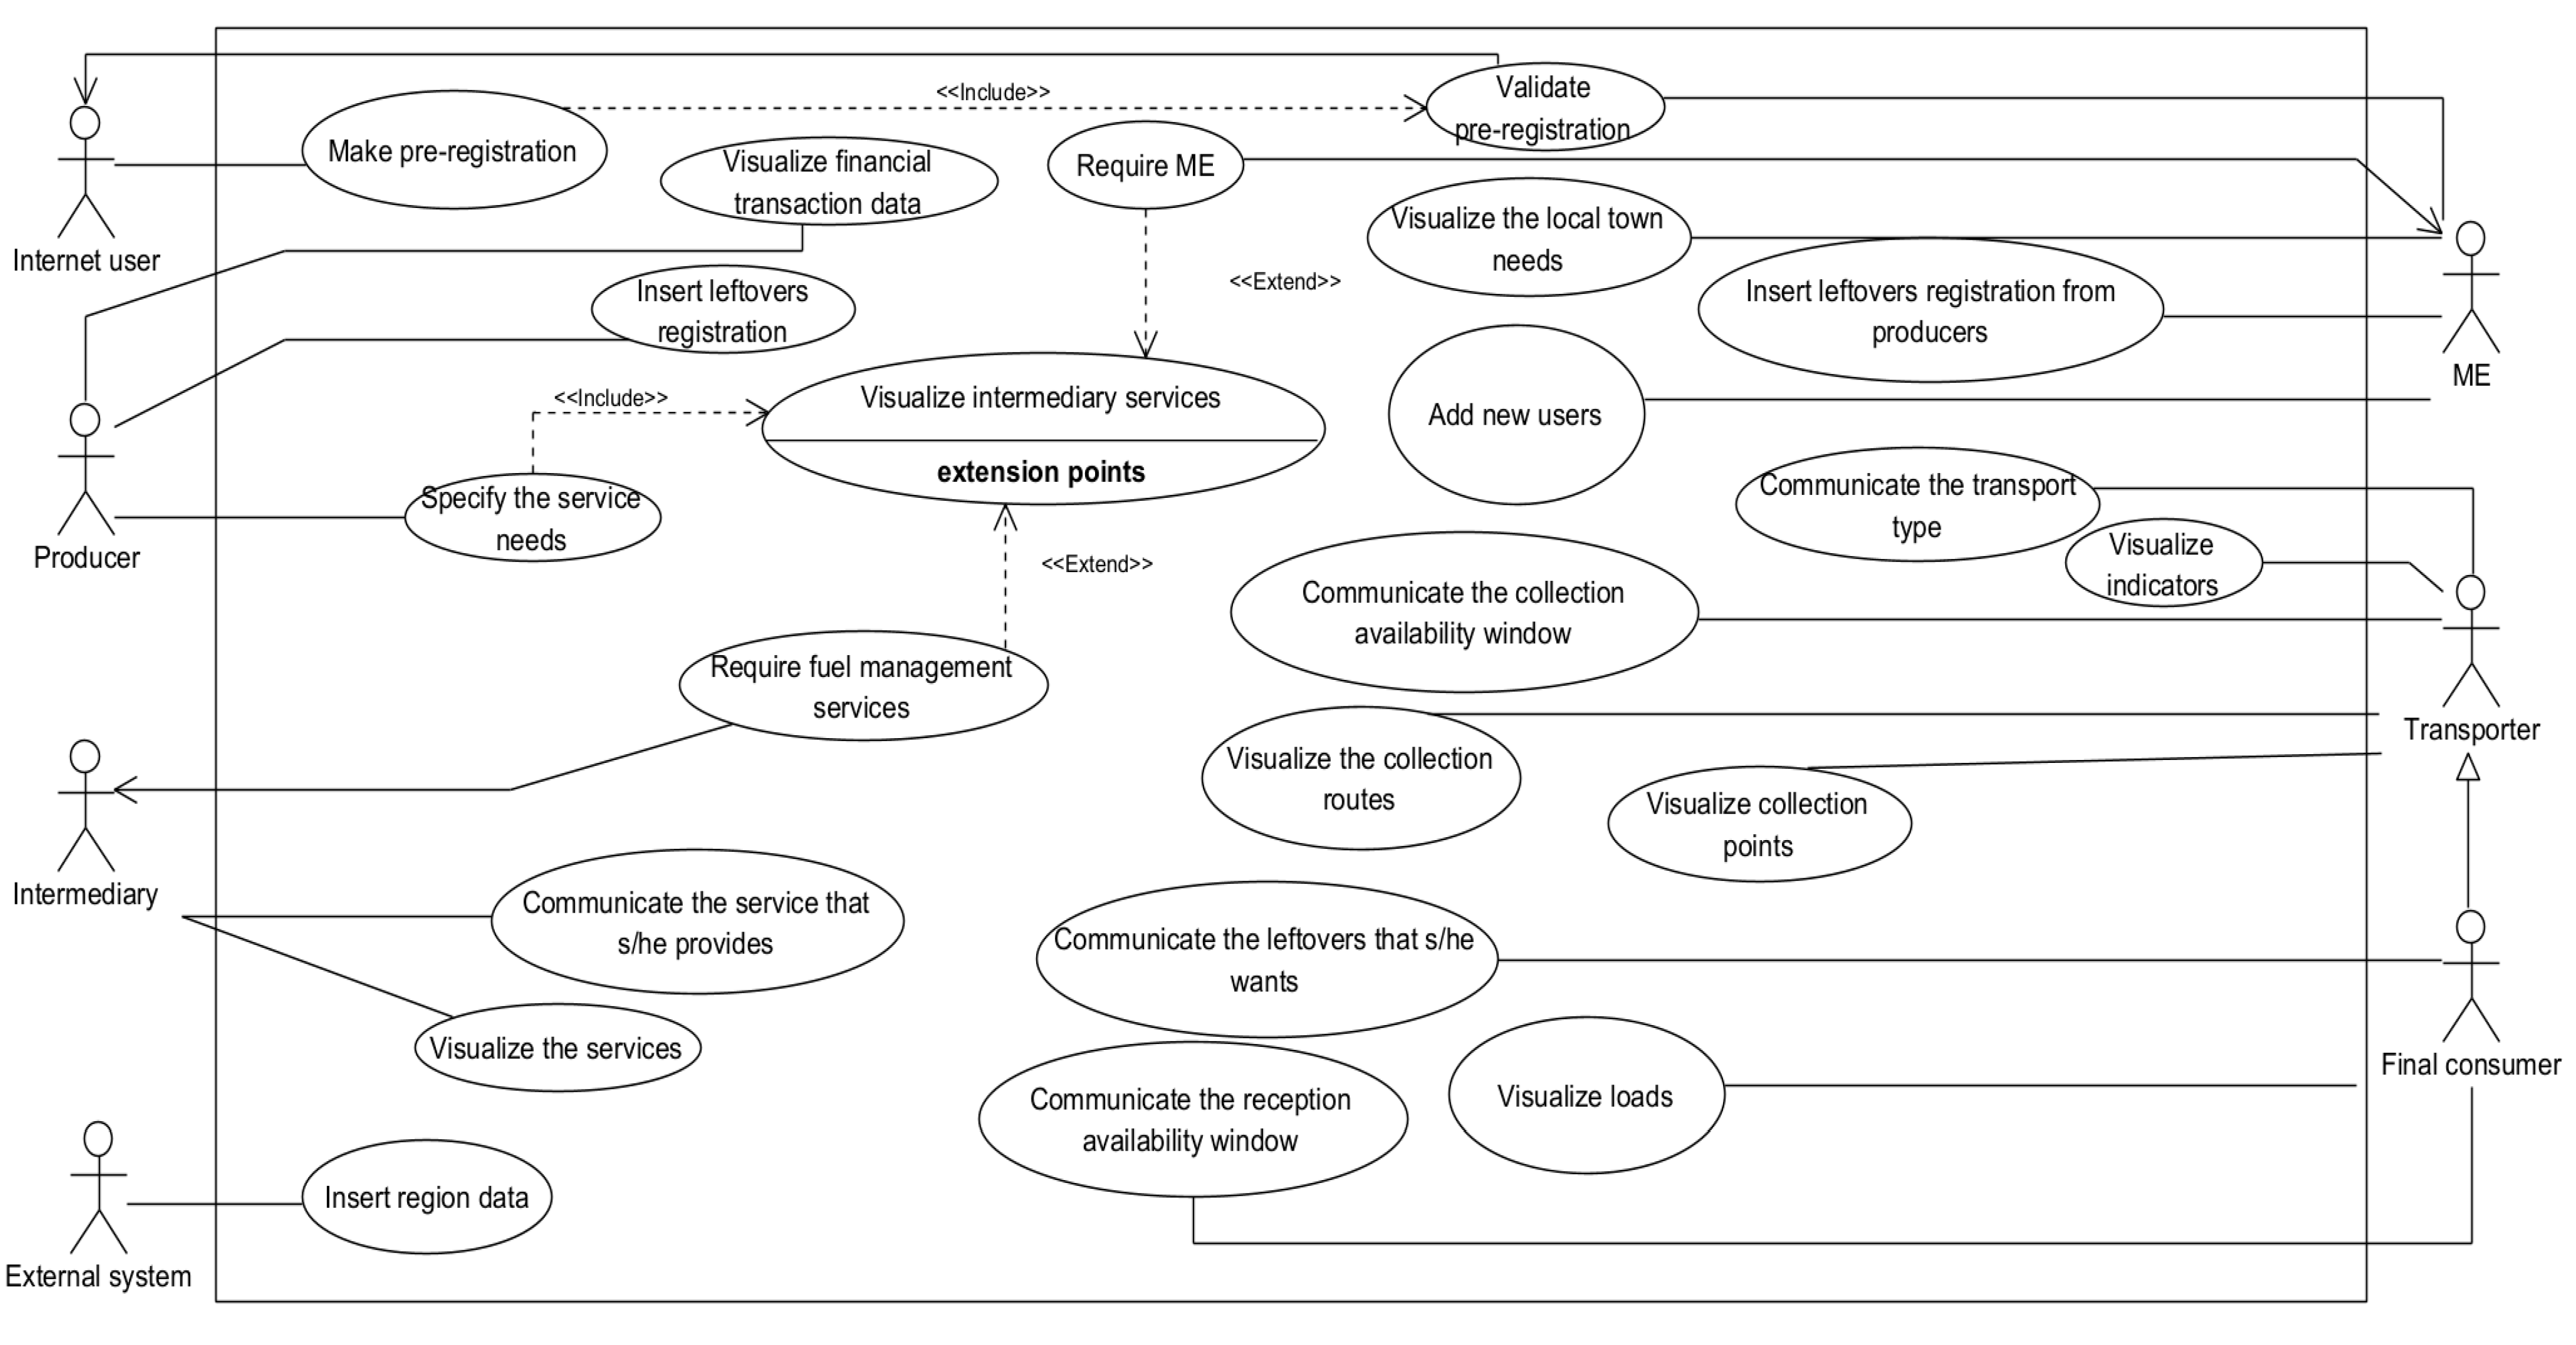
Table 1 requirements are modeled in UML, in a use-case diagram. It should be noted that to suppress all the functionalities mentioned, in addition to the five profiles identified in Table 1, two actors in the system will be considered, the Internet user and an external data system, with the primary being any Internet user who wishes to pre-register on the platform and the second being a system that provides data external to the ME. The use-case diagram systematizes the various features and relationships between them, and it is presented below in Figure 4.
The considered solution require that all system users must go through the pre-user state, where the Internet user must perform pre-registeration, which requires a response from the ME. After this, Internet user is notified. When becoming a user and being a producer, two main functionalities appear: inserting new amounts of leftovers and requesting fuel management services. Following the second possibility, the producer should specify the land needs, and the system must return the intermediaries who can perform these tasks. At this point, if someone appears to perform the service, the producer will request it. Otherwise, the producer must request help from the ME. The intermediary must communicate what services they can provide and visualize its future/historical services. Concerning the ME, in addition to the potential users’ validation, it also has the possibility of adding new ones. In addition, the ME can register quantities of leftovers from individual producers. The ME can also observe indicators, which, in addition to the system data, have an actor, an external system that provides data required to improve decision-making indicators. Concerning transporters, they have access to future/historic routes, communicating their transportation means, viewing collection points, and communicating in which windows they are available to carry out services. Since the end consumer has the possibility of carrying out the transport, this becomes a specialization of the transporter, adding requirements such as communicating the leftovers they want to receive and the availability window for receiving them, and even viewing historical loads and future loads.

4.2. Data Model—Class Diagram

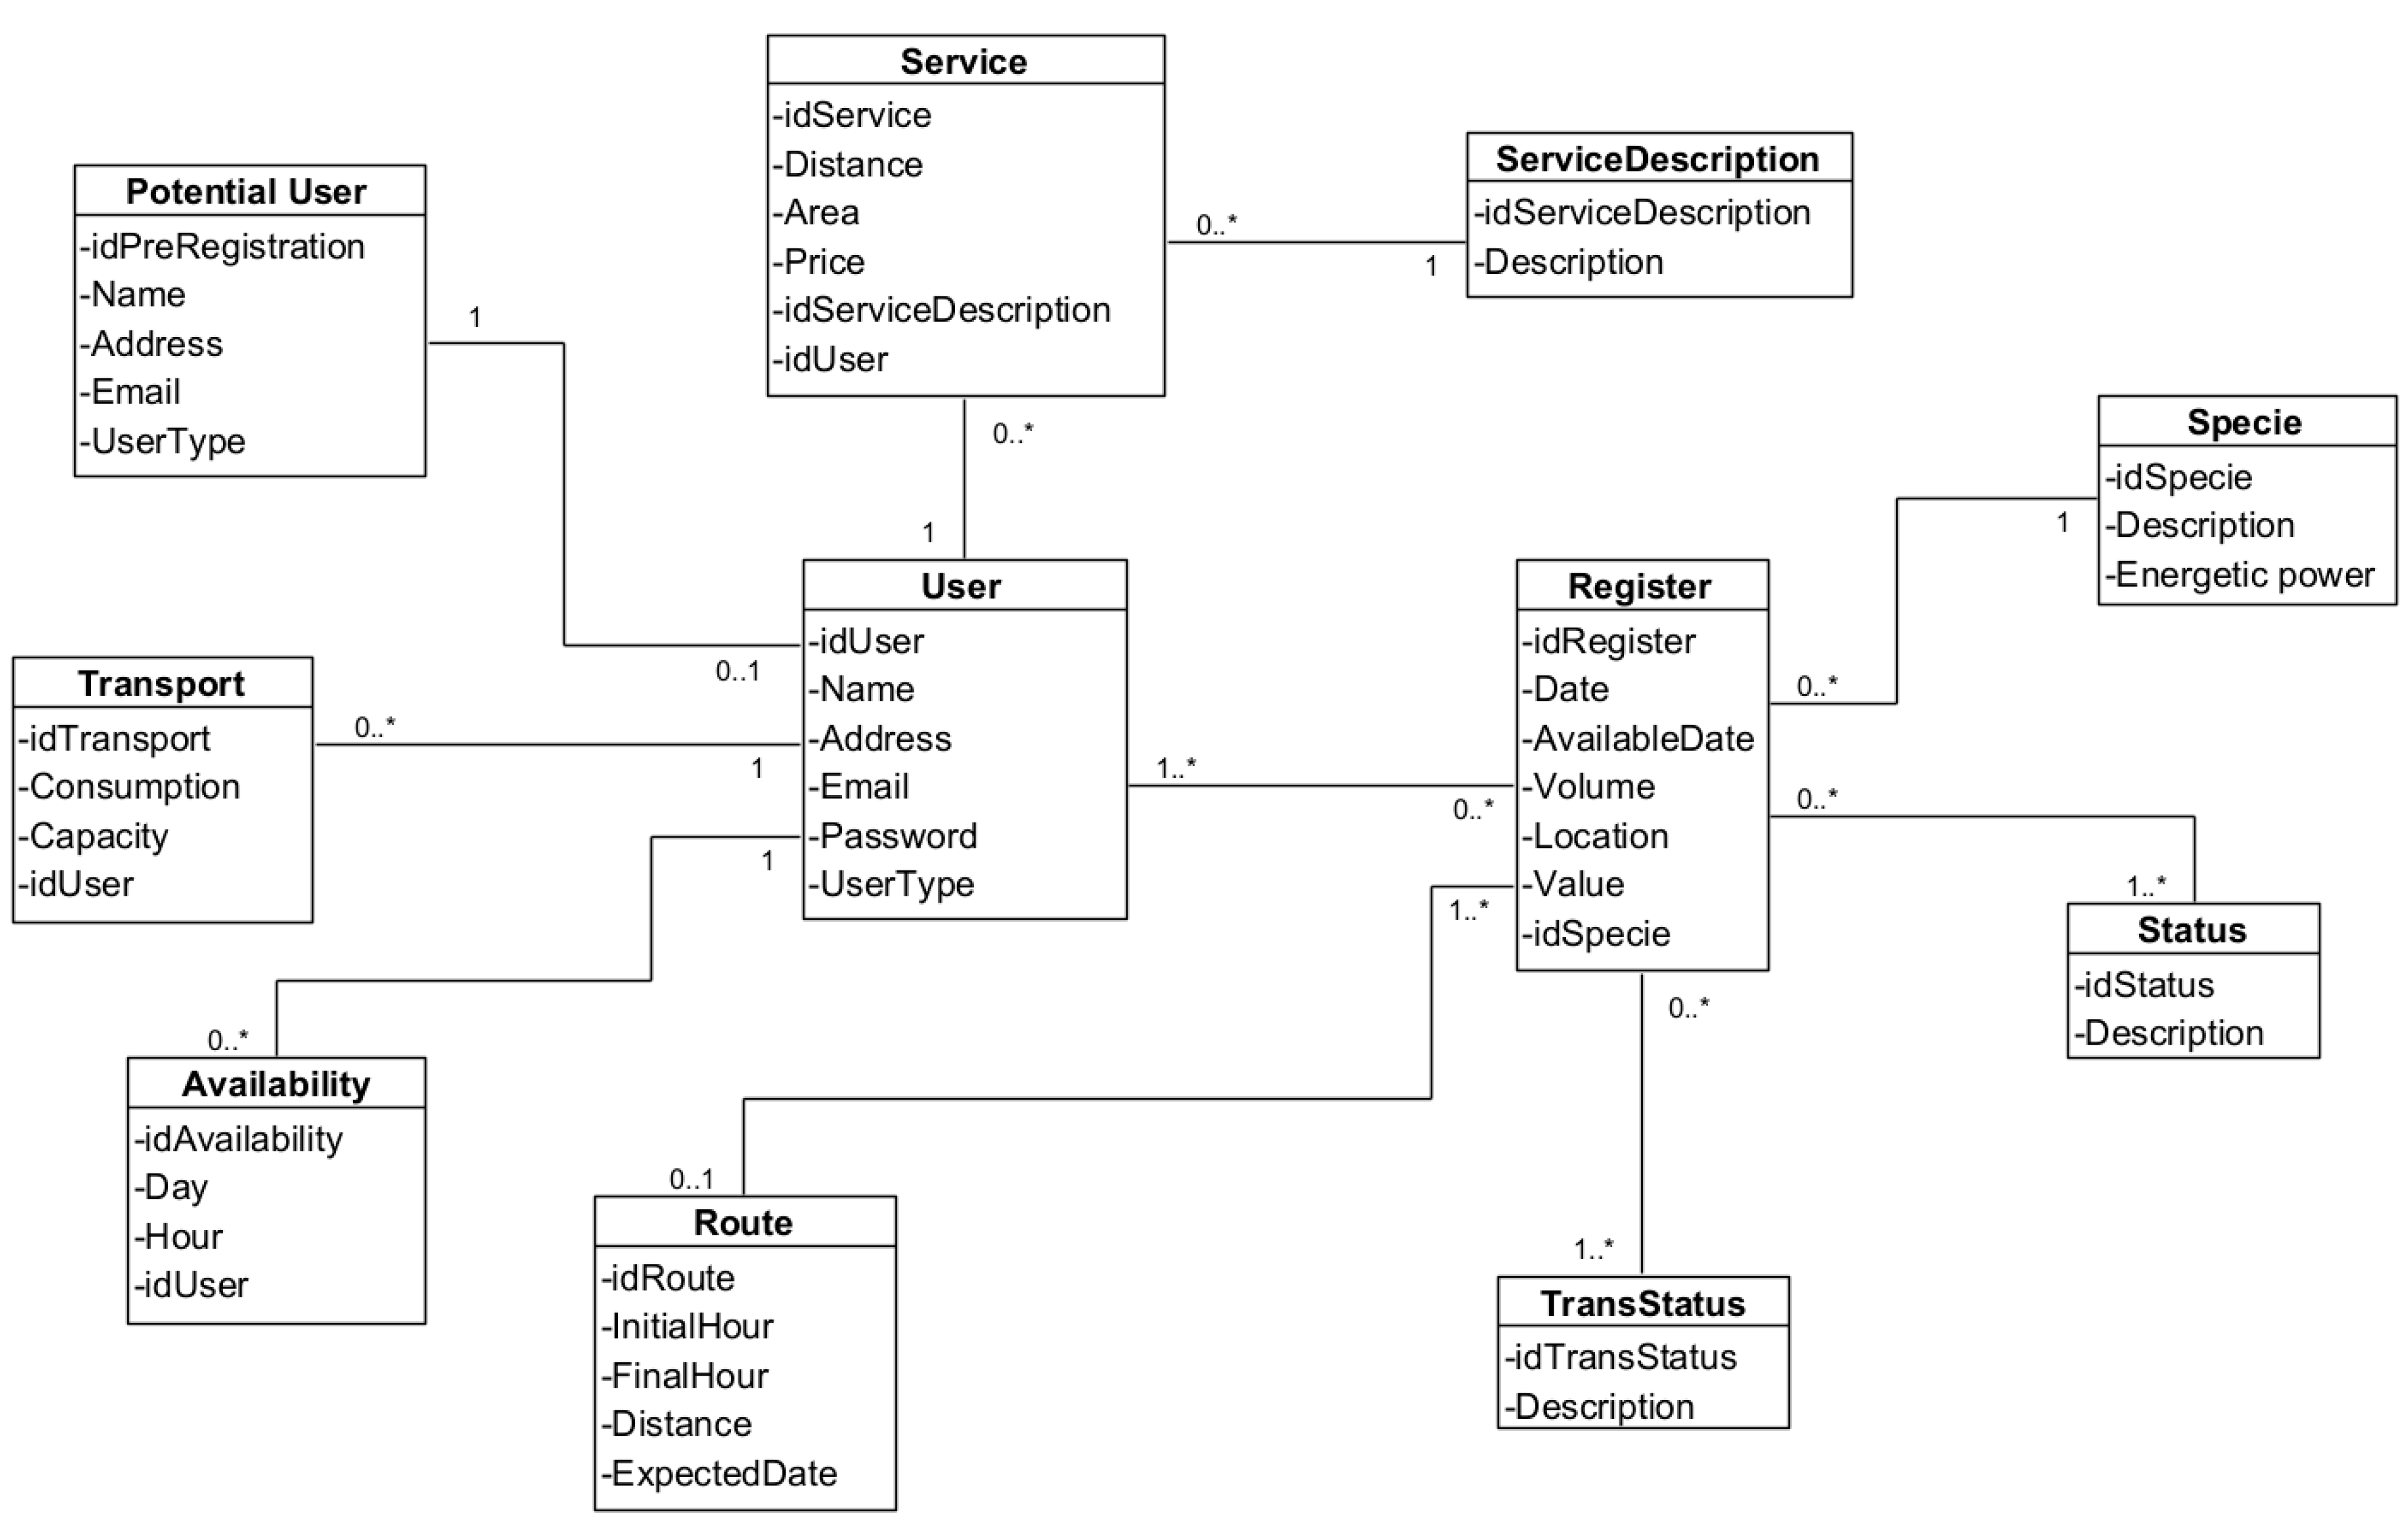
To complete the requirement model, the use-case, this next section will detail the data model, using the same notation, UML, which is why the class diagram is presented here, below, in Figure 5.
The central element of the solution data model is “User”, which refers to all the participants in the platform (RBSC stakeholders). The “UserType” attribute is responsible for distinguishing the role and functionalities presented to each user. The registration in the “User” table arises on acceptance/validation of a “PotentialUser” table entry, where information about potential users who pre-register is stored. The significant difference between the “Potential User” and “User” tables relies on the “Password” attribute, which is not included in first class. Producers who have leftovers record this information in the “Register” table. Here, the following attributes are stored: the date where registration was carried out, the biomass availability date (which may or may not be the registration date), the volume of leftovers, their location, and the “idSpecie”, which links the registration to the type of leftovers. This type of leftovers is stored in the “Specie” table, since the RB type will be chosen from a set of predefined species. Each record can have several statuses (“Status”), which can be of the following ones: “Not included in route”, “Included in route and not collected”, “In progress”, and “Delivered”. These four categories will be stored in the “Description” attribute from the “Status” table. It should be noted that this relationship between “Register” and “Status” allows for the possibility of there being states without records, for example, when there are uncollected leftovers; however, the opposite is not possible, as a record always has a state from the moment it is inserted into the system. “Registers” have a transaction status, “TransStatus”, which can be “Paid”, “In debt (scheduled)”, and “In debt”. Here, even if the valuation is 0, the information remains in the “Paid” status, and the value is stored in the “value” attribute from the “Register” table. These leftovers, stored in the “Register” class, are considered by the system to create collection routes, stored in class “Route”. The relationship between these tables can be understood as follows: a route can have one or more registers, while a register can have a maximum of one route. The “Route” table includes four essential attributes: the start and end times of the route, the “InitialRoute” and “FinalRoute”, the distance of the route, “Distance”, and the date on which it is expected to be collected, “ExpectedDate”. The objective of this attribute is to mitigate possible constraints on collection and delivery windows. To manage timetables, the system must store the availability windows for each user in the “Availability” table, where the availability start hour (“Hour”) is stored in an hourly structure, for example, assuming a 16:00 value in “Hour” attribute, this window refers to the slot between 16:00 and 17:00. To complete the “Avalaibility” class, it is required to communicate the availability day (“Day”). All users who will be carrying out transportation tasks must inform the system about their means of transport, as well as their characteristics, in the “Transport” table. Something similar can be applied to the case of services (“Services”), where a “User”, RBSC intermediaries, can have/communicate which services they provide (“idServiceDescription”) and specific conditions to perform their “Distance”, “Area”, and “Price”. The choice of service must be made from a repository, the “ServiceDescription” table, which acts as a repository table for the types of service.

4.3. Technological Prototype

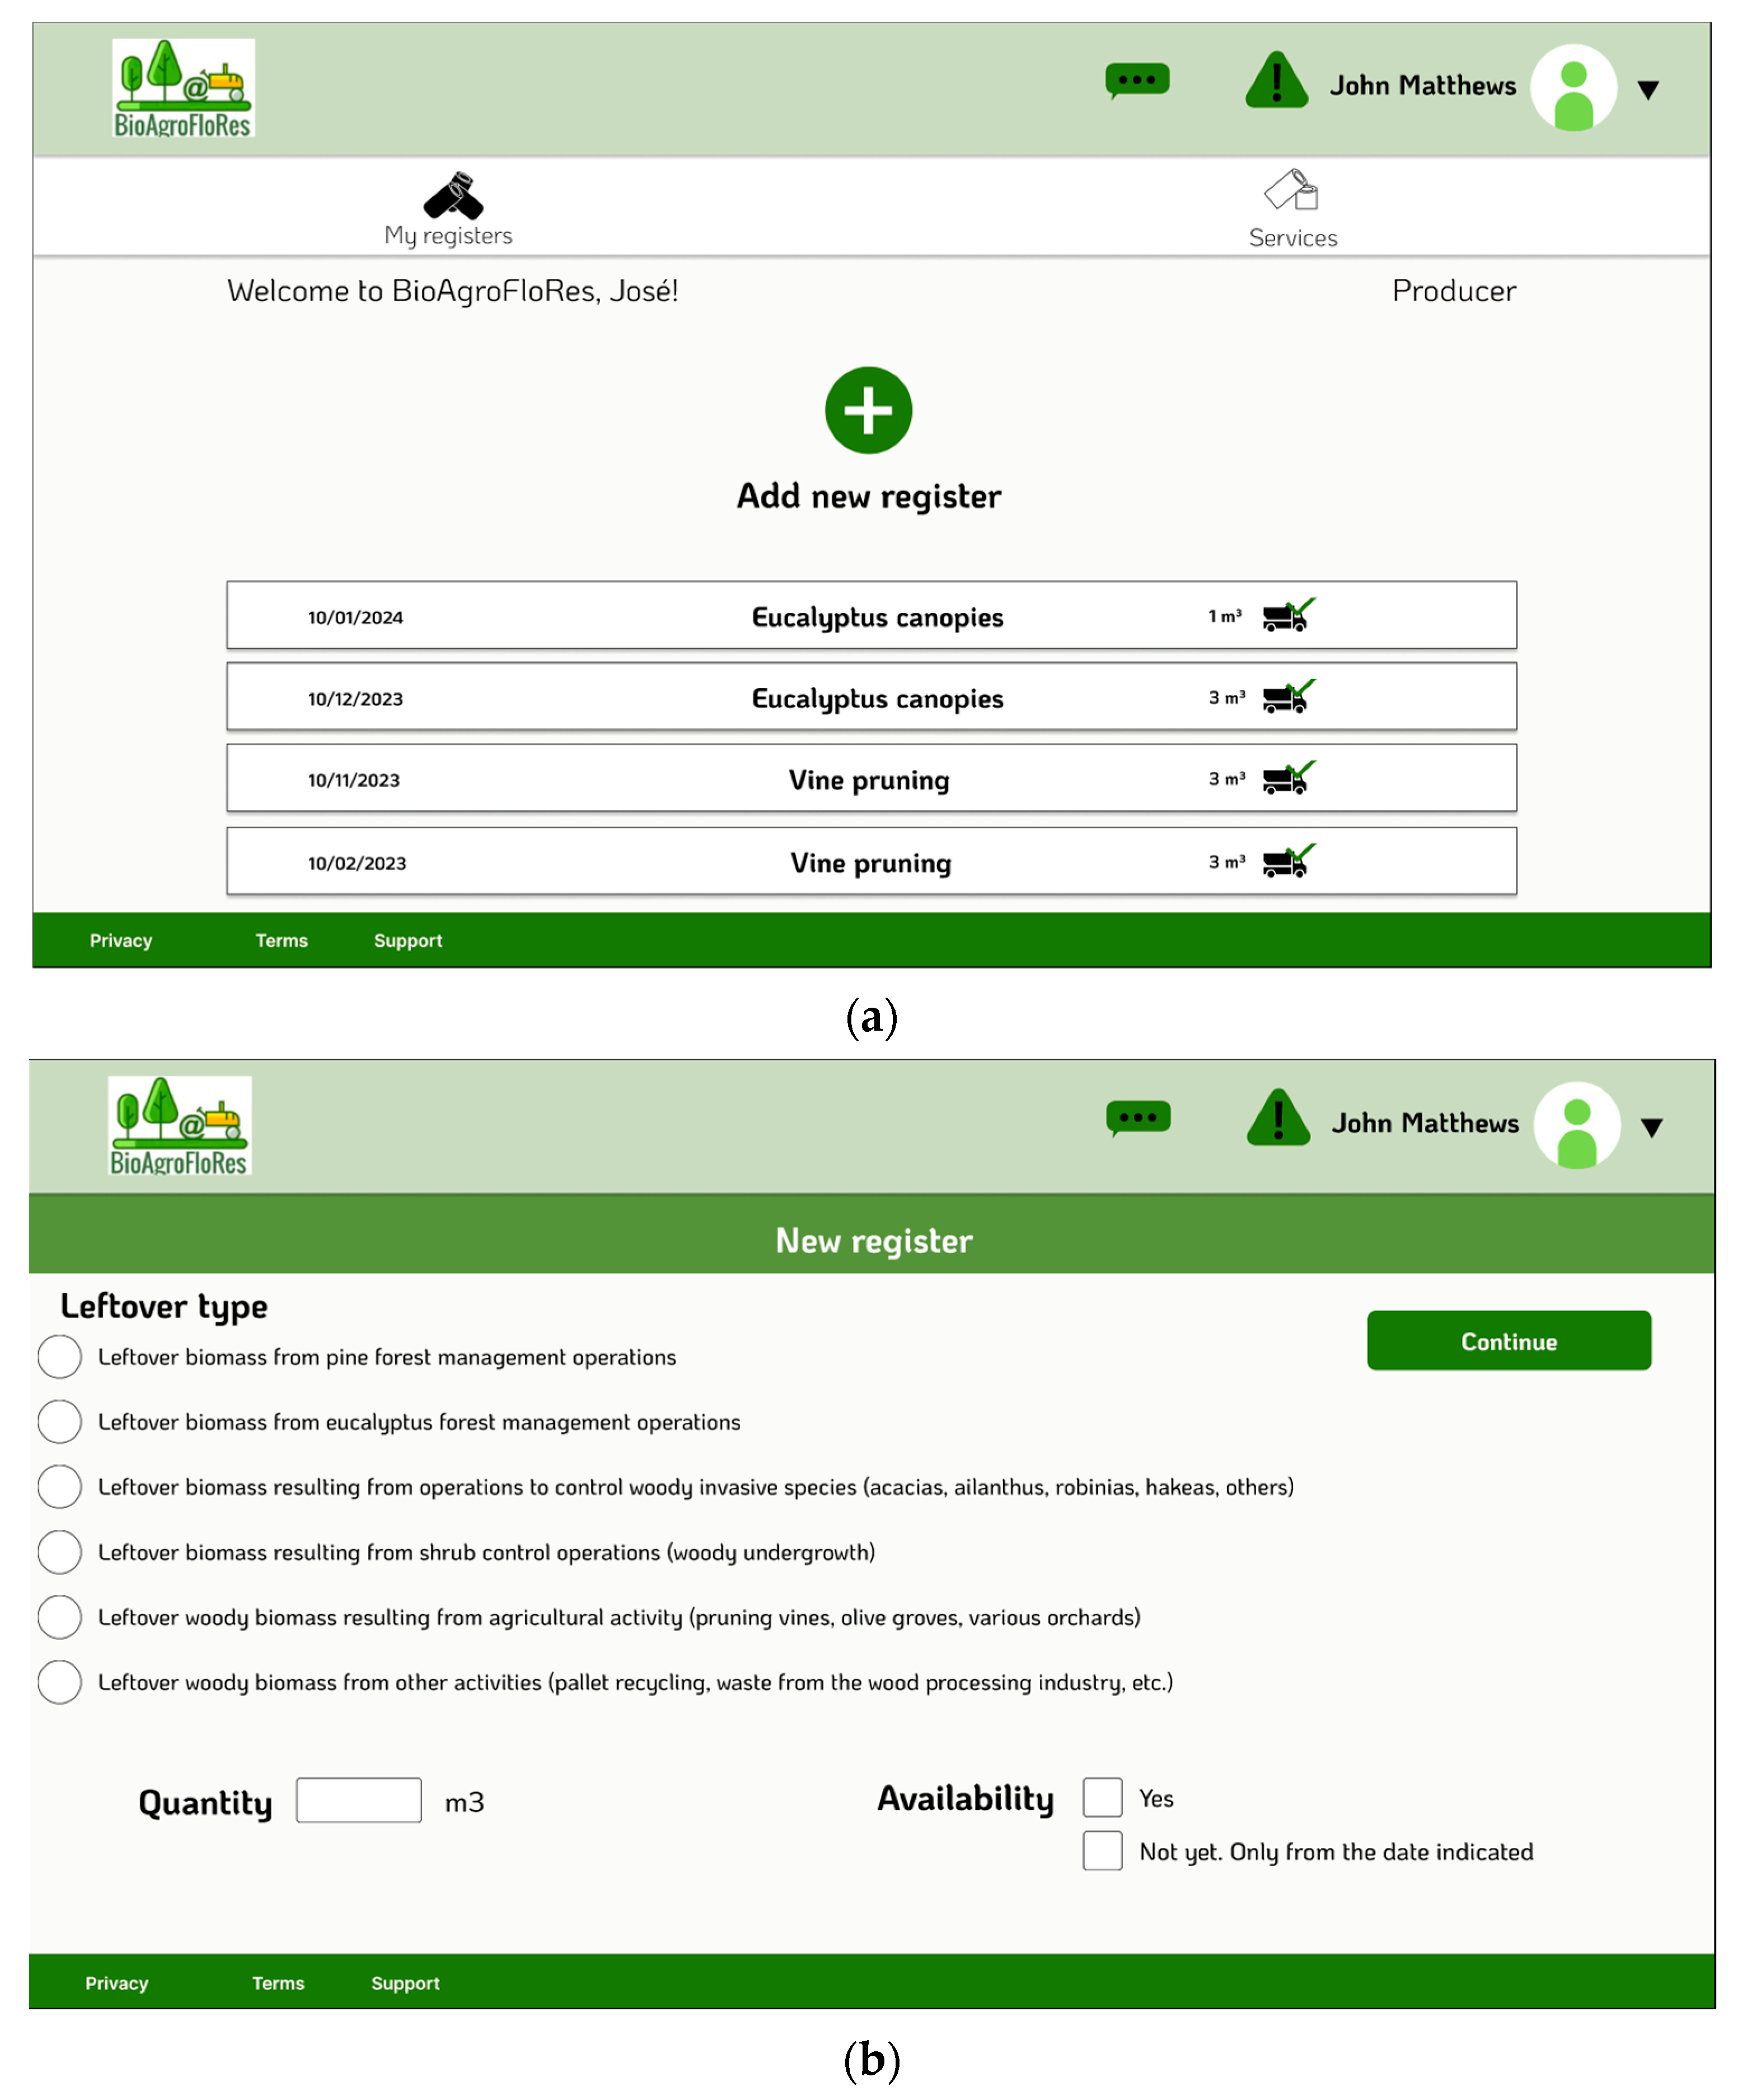
The prototype developed features a set of interfaces designed to meet the various requirements presented. Starting with the producer profile, it has a set of interfaces, as shown below in Figure 6.
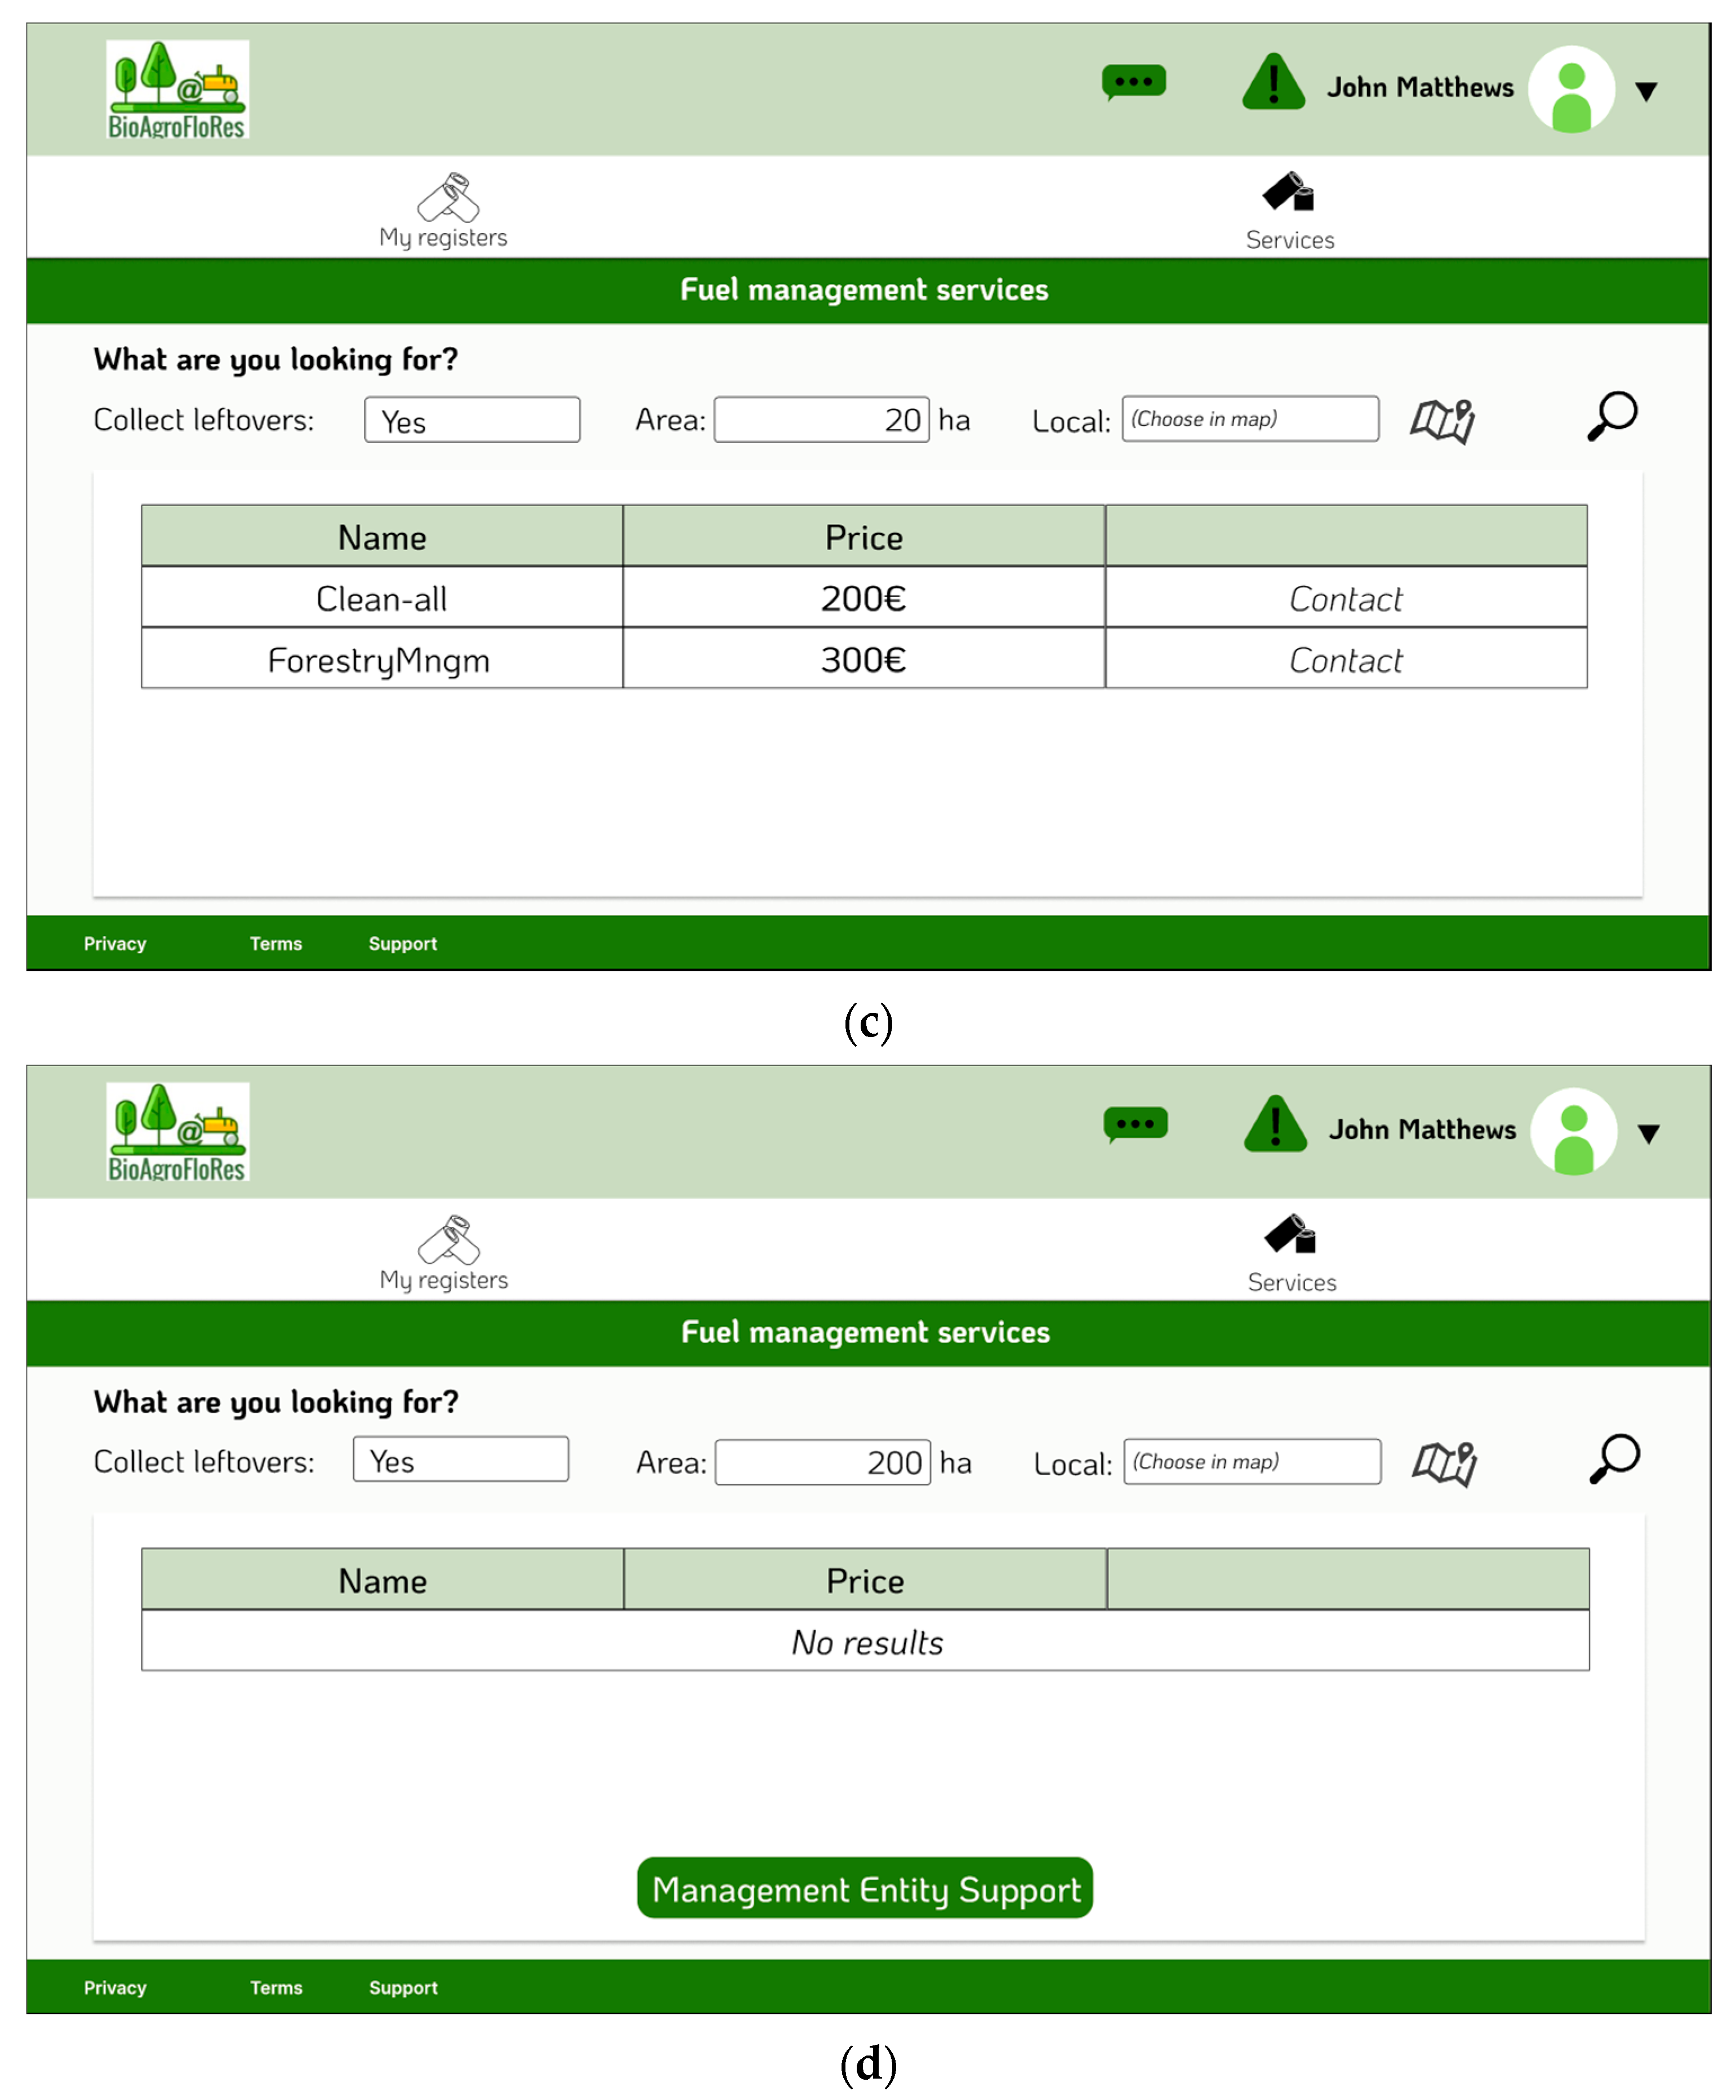
Figure 6a shows the main page of the producer profile, where the main plan shows the possibility for the producer to enter a new leftover register. At the bottom, the RB register’s history is visible. By pressing the “+” button on this interface, as shown in Figure 6b, all the information that is needed to register a new quantity of leftovers is displayed, such as the type of leftovers, the quantity in volume, and if the leftovers have already been collected or when they will be collected. Also, as shown in Figure 6b, pressing the “Continue” button brings up a section for communicating the RB location. Here, if the location is a biomass eco-point, the system will interpret this information, summing up the quantities, forming a spot with major RB extents. Returning to Figure 6a, below the header, a side bar appears, where the user can choose the tab, “Services”. There, the user has access to the interface in Figure 6c, where the user, given a certain set of requirements (area, location, and availability to collect leftovers), has access to a set of fuel management service providers, intermediary, and the price they will take. In Figure 6d it can be seen that, for certain requirements, no intermediaries appear. In this scenario, the platform displays a button to request ME support, where the platform communicates to the ME that there is a need for activities, since there are no intermediaries. It is important to note that locations can be communicated manually or using Geographically Information Systems. Below, Figure 7 presents the intermediary interfaces.
In the main interface of the intermediary profile (Figure 7a) two large sections are visible, a button for adding new services and, at the bottom, the list of services that the intermediary performs, indicating how far they perform the service, what is the maximum area of land, and what is the price for carrying out the service. In the header, a message balloon with a “1” is visible, which shows another functionality that cuts across all actors, a chat, a communication channel that allows all actors to be connected. Like what was seen in Figure 6, also in this profile, below in the header there is a side bar. Here, by moving to the Services tab, as shown in Figure 7b, the intermediary has access to a list of services that have already been performed and future ones. Below, Figure 8 presents the transporter interfaces.
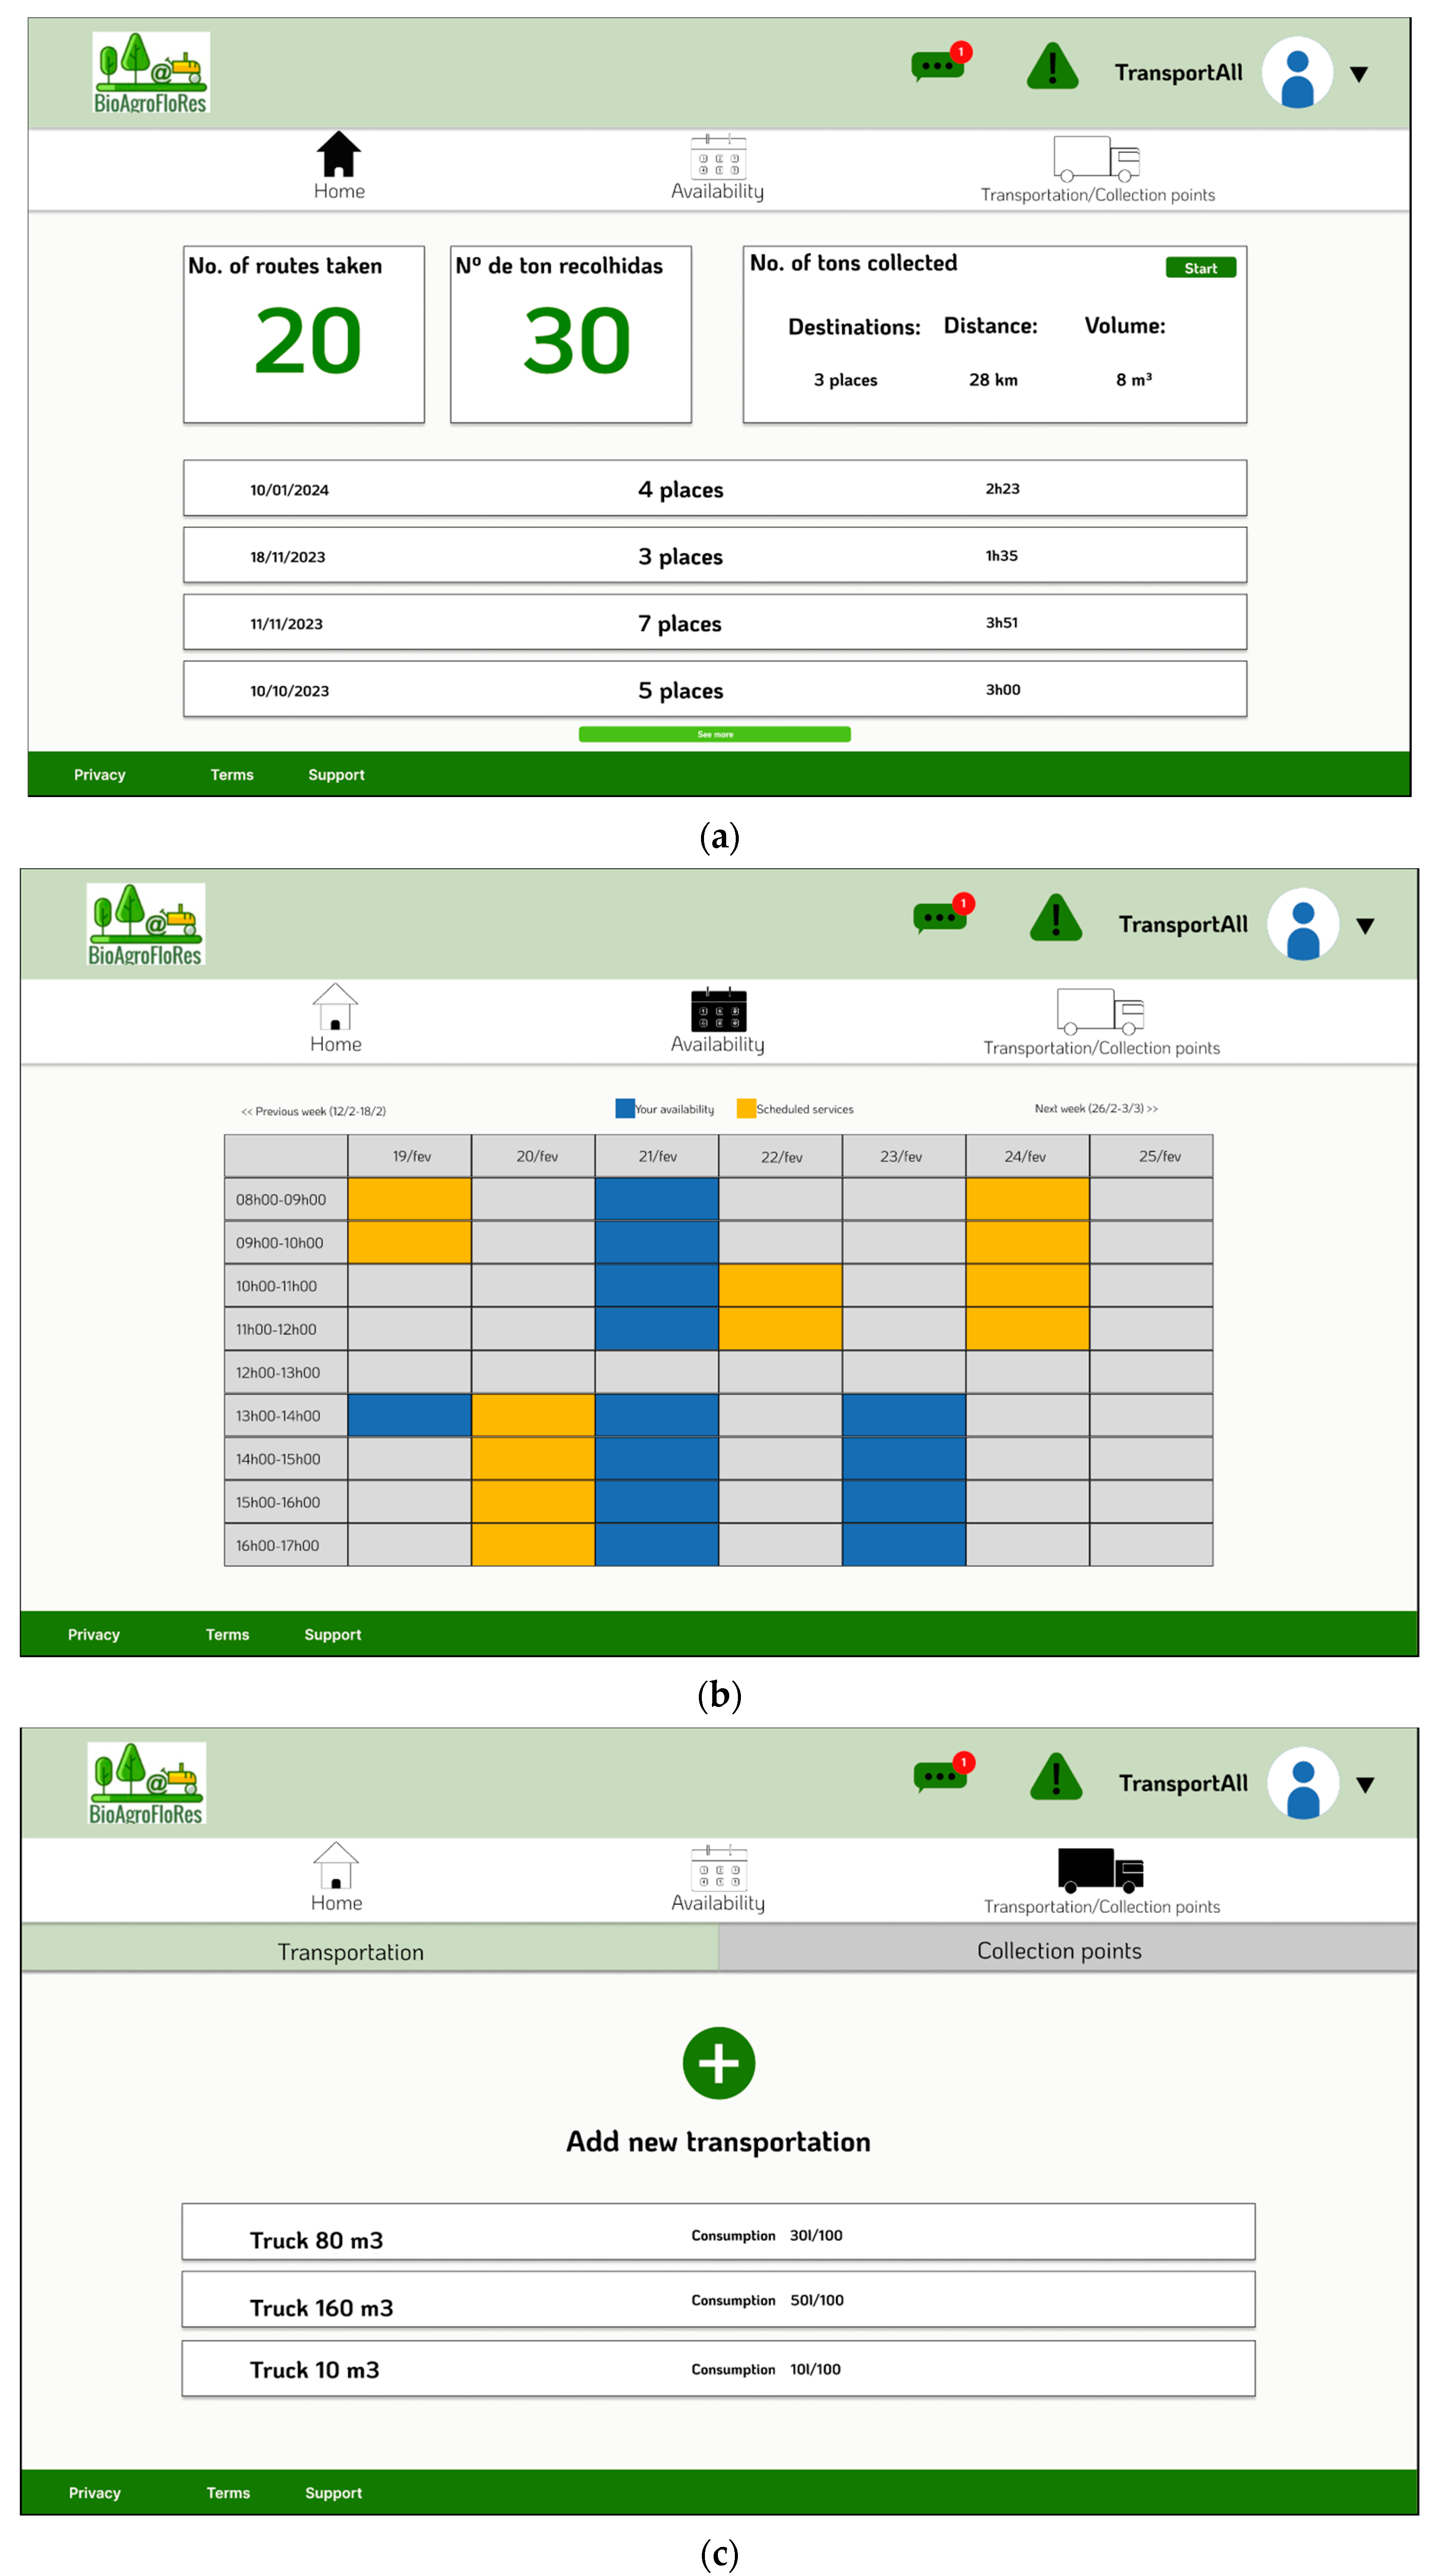
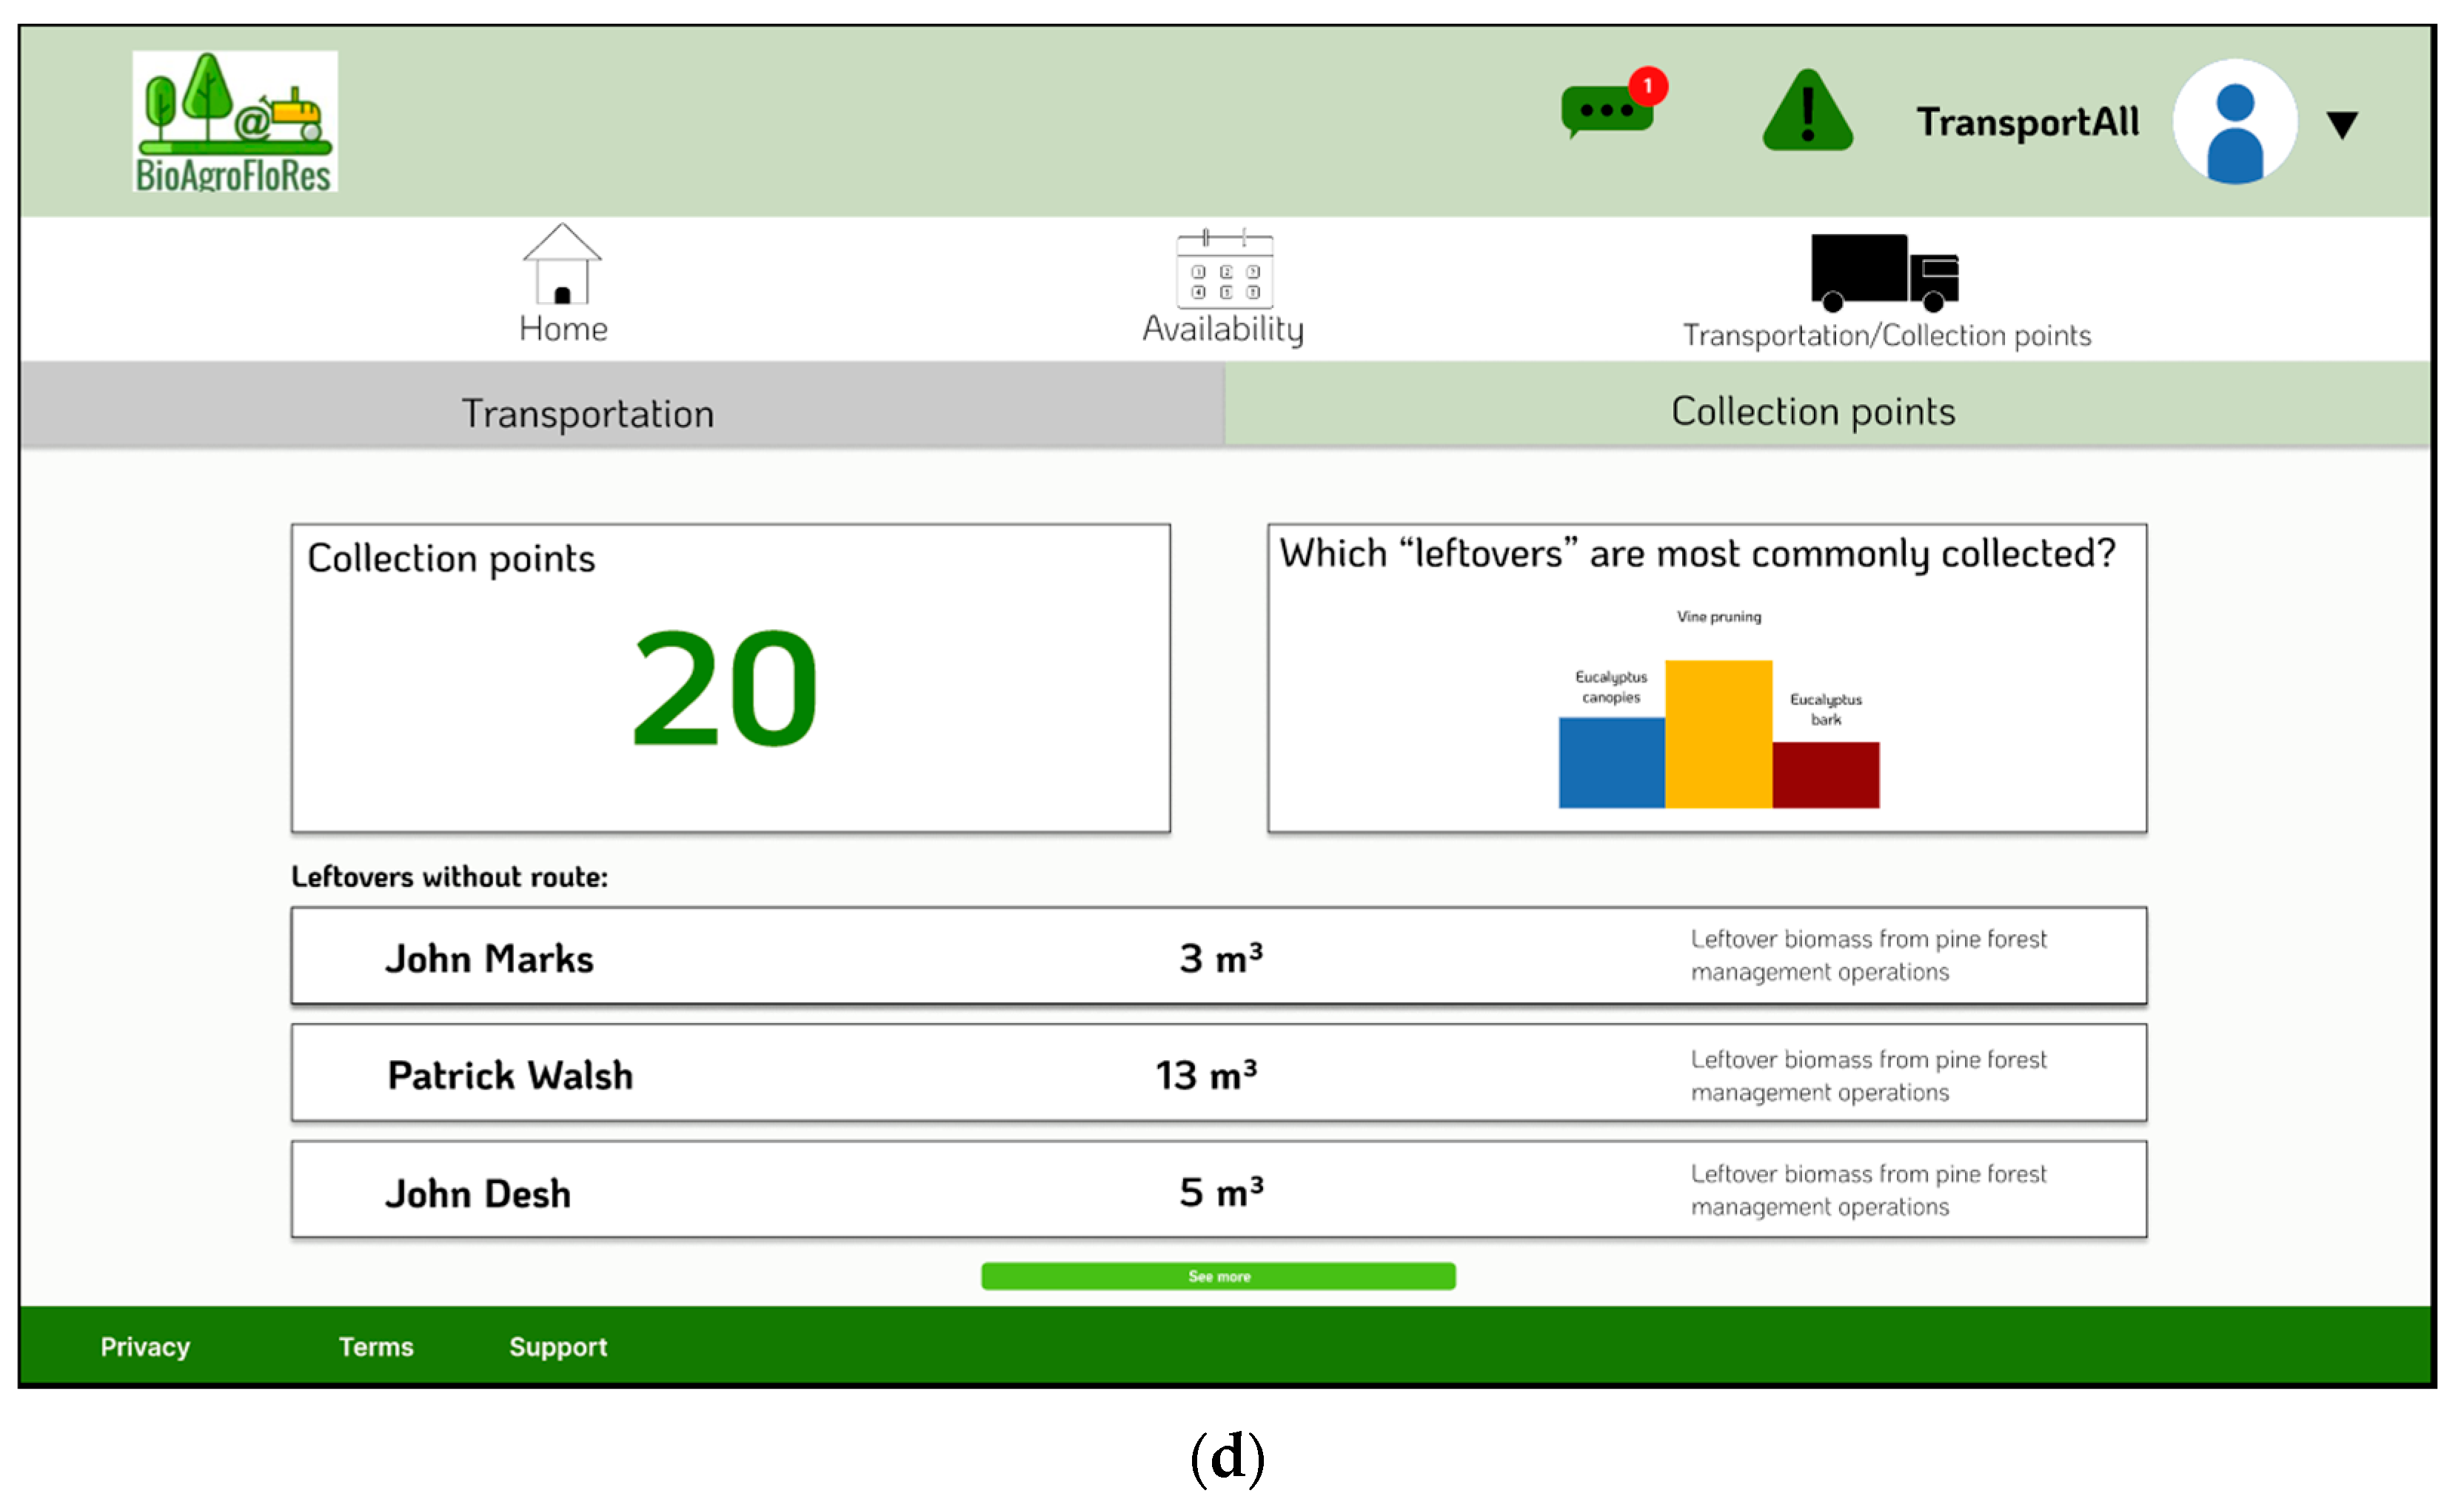
The third actor in this model is the transporter. This main interface is a set of indicators (Figure 8a) with the number of routes made and collected in tons visible at the top at left side. In the upper right part, the transporter has access to the next route, where they can press the “start” button to record the route initiation in the system. At the bottom, the transporter has access to the history of routes made, where the route time is made as a calculated field (final time–initial time). When pressing the “Availability” tab, it is possible to see a section where the transporter communicates its availability and views the services scheduled in each slot (Figure 8b). This availability communication is made in the respective slot. Note that this section may not make sense in certain contexts, since most of the time, the RB is deposited in the ditch and can be collected at any time. Parallel to this, certain end consumers also have biomass disposal parks open, and the transporter can leave them there at any time. However, if the end consumer has a load and discharge window, this section becomes central to optimizing those un/loading operations. The last tab allows for the means of transport and collection point management. Regarding means of transport, the transporter has the ability to communicate their means of transport characteristics (truck capacity and consumption), as shown in Figure 8c, to optimize the collection routes proposed by the system. In the other tab, as shown in Figure 8d, the transporter has access to see their collection points, seeing the total and which leftovers they collect the most. In addition, this section also provides information about uncollected leftovers. In other words, these leftovers are not allocated to routes; however, they can be important, and this information becomes an added value for the transporter. Moving on now to the functional requirements of the end consumer actor, we have the interfaces shown in Figure 9.
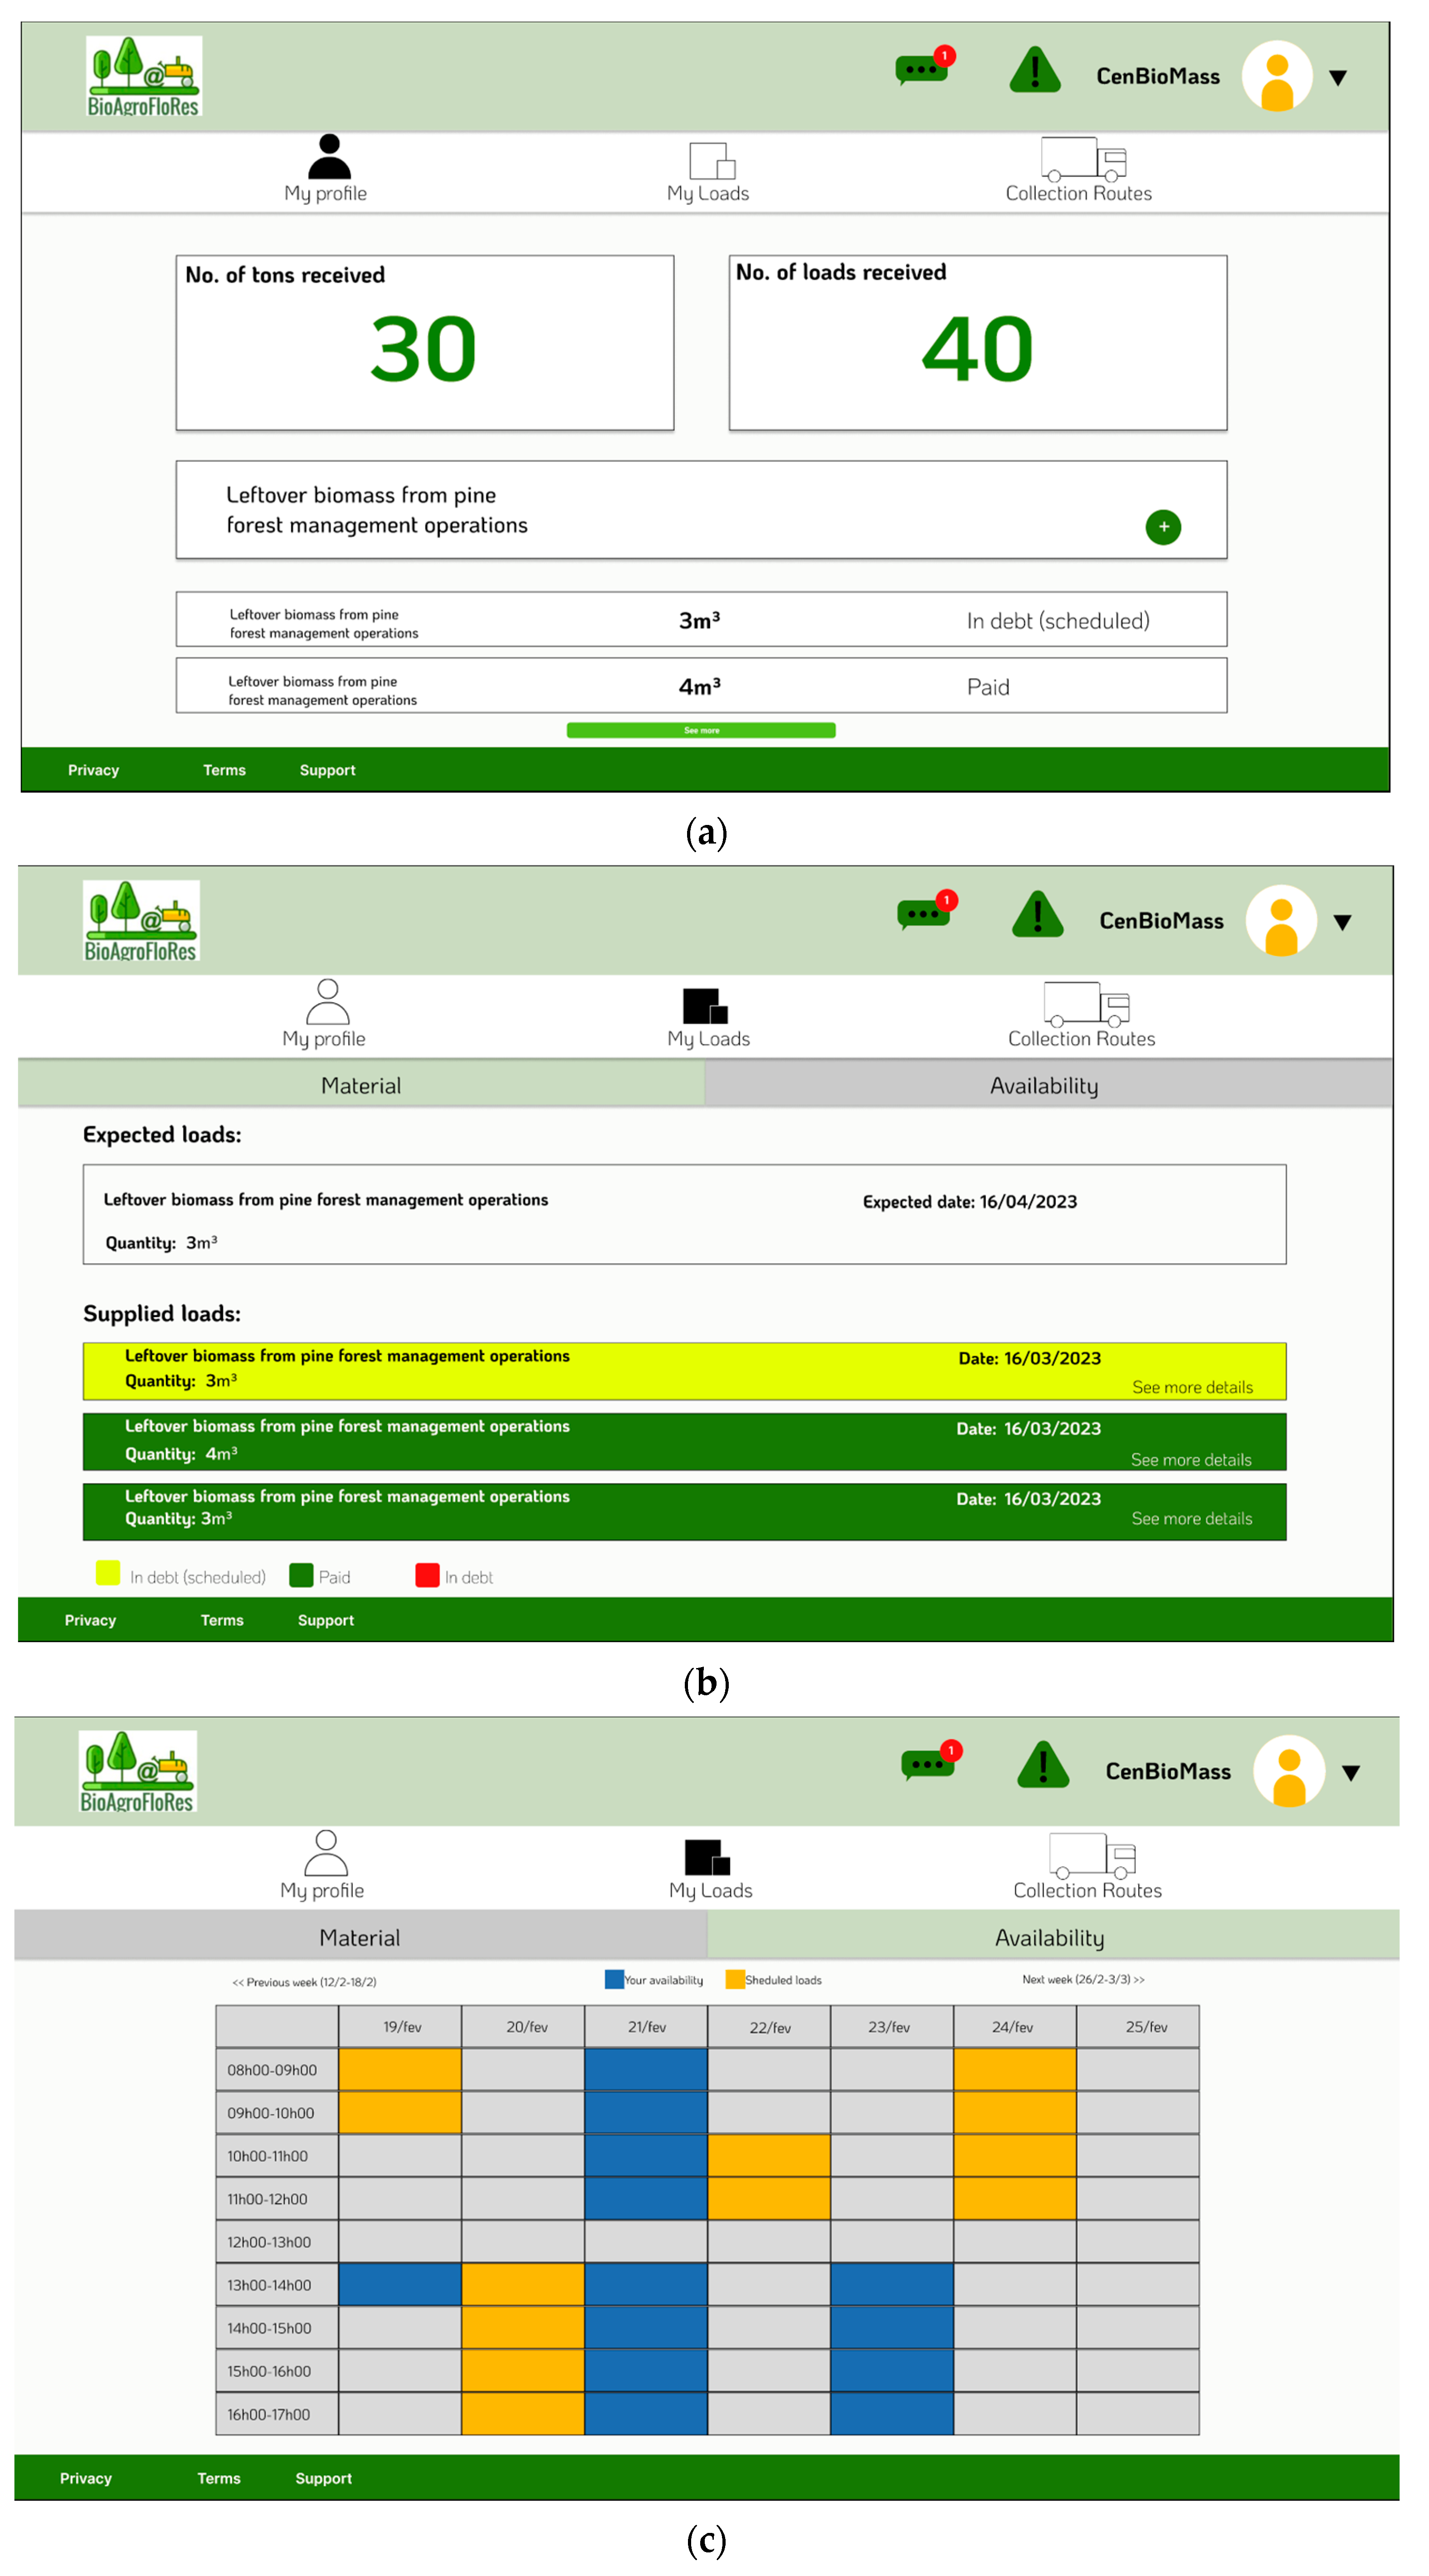
When the end consumer accesses the system, they reproduce Figure 9a, where they have access to a set of indicators (biomass purchased and number of loads), and the possibility of choosing which RB type they accept. Also in Figure 9a, the latest loads are visible. Switching to Figure 9b, this has two sections, material and availability. In the former, the end consumer can visualize what/when future/historical loads will be. Here, in this lower area, each history will be filled in with one of three traffic light colors, green, yellow, and red. The first, green, refers to monetary transactions associated with the load that has already taken place, which could be transfers that have already been made or loads that have been economically valued at 0. Yellow means that these loads have been economically valued, but this has not yet taken place, although a date has been set. Red, on the other hand, represents loads that have already been made, in which the economic transaction has not been made, and even has no scheduled date. In the other section of “My loads”, “Availability”, it redirects the user to an interface (Figure 9c) identical to the transporter (Figure 8b). Here, the end consumer can manage their availability window. The last button on the side bar, “Collection Routes”, gives the end consumer access to the same section as the transporter profile and its main function is to help end consumers who want to collect biomass. Figure 10, shown below, contains the interfaces designed to meet the requirements of the ME.
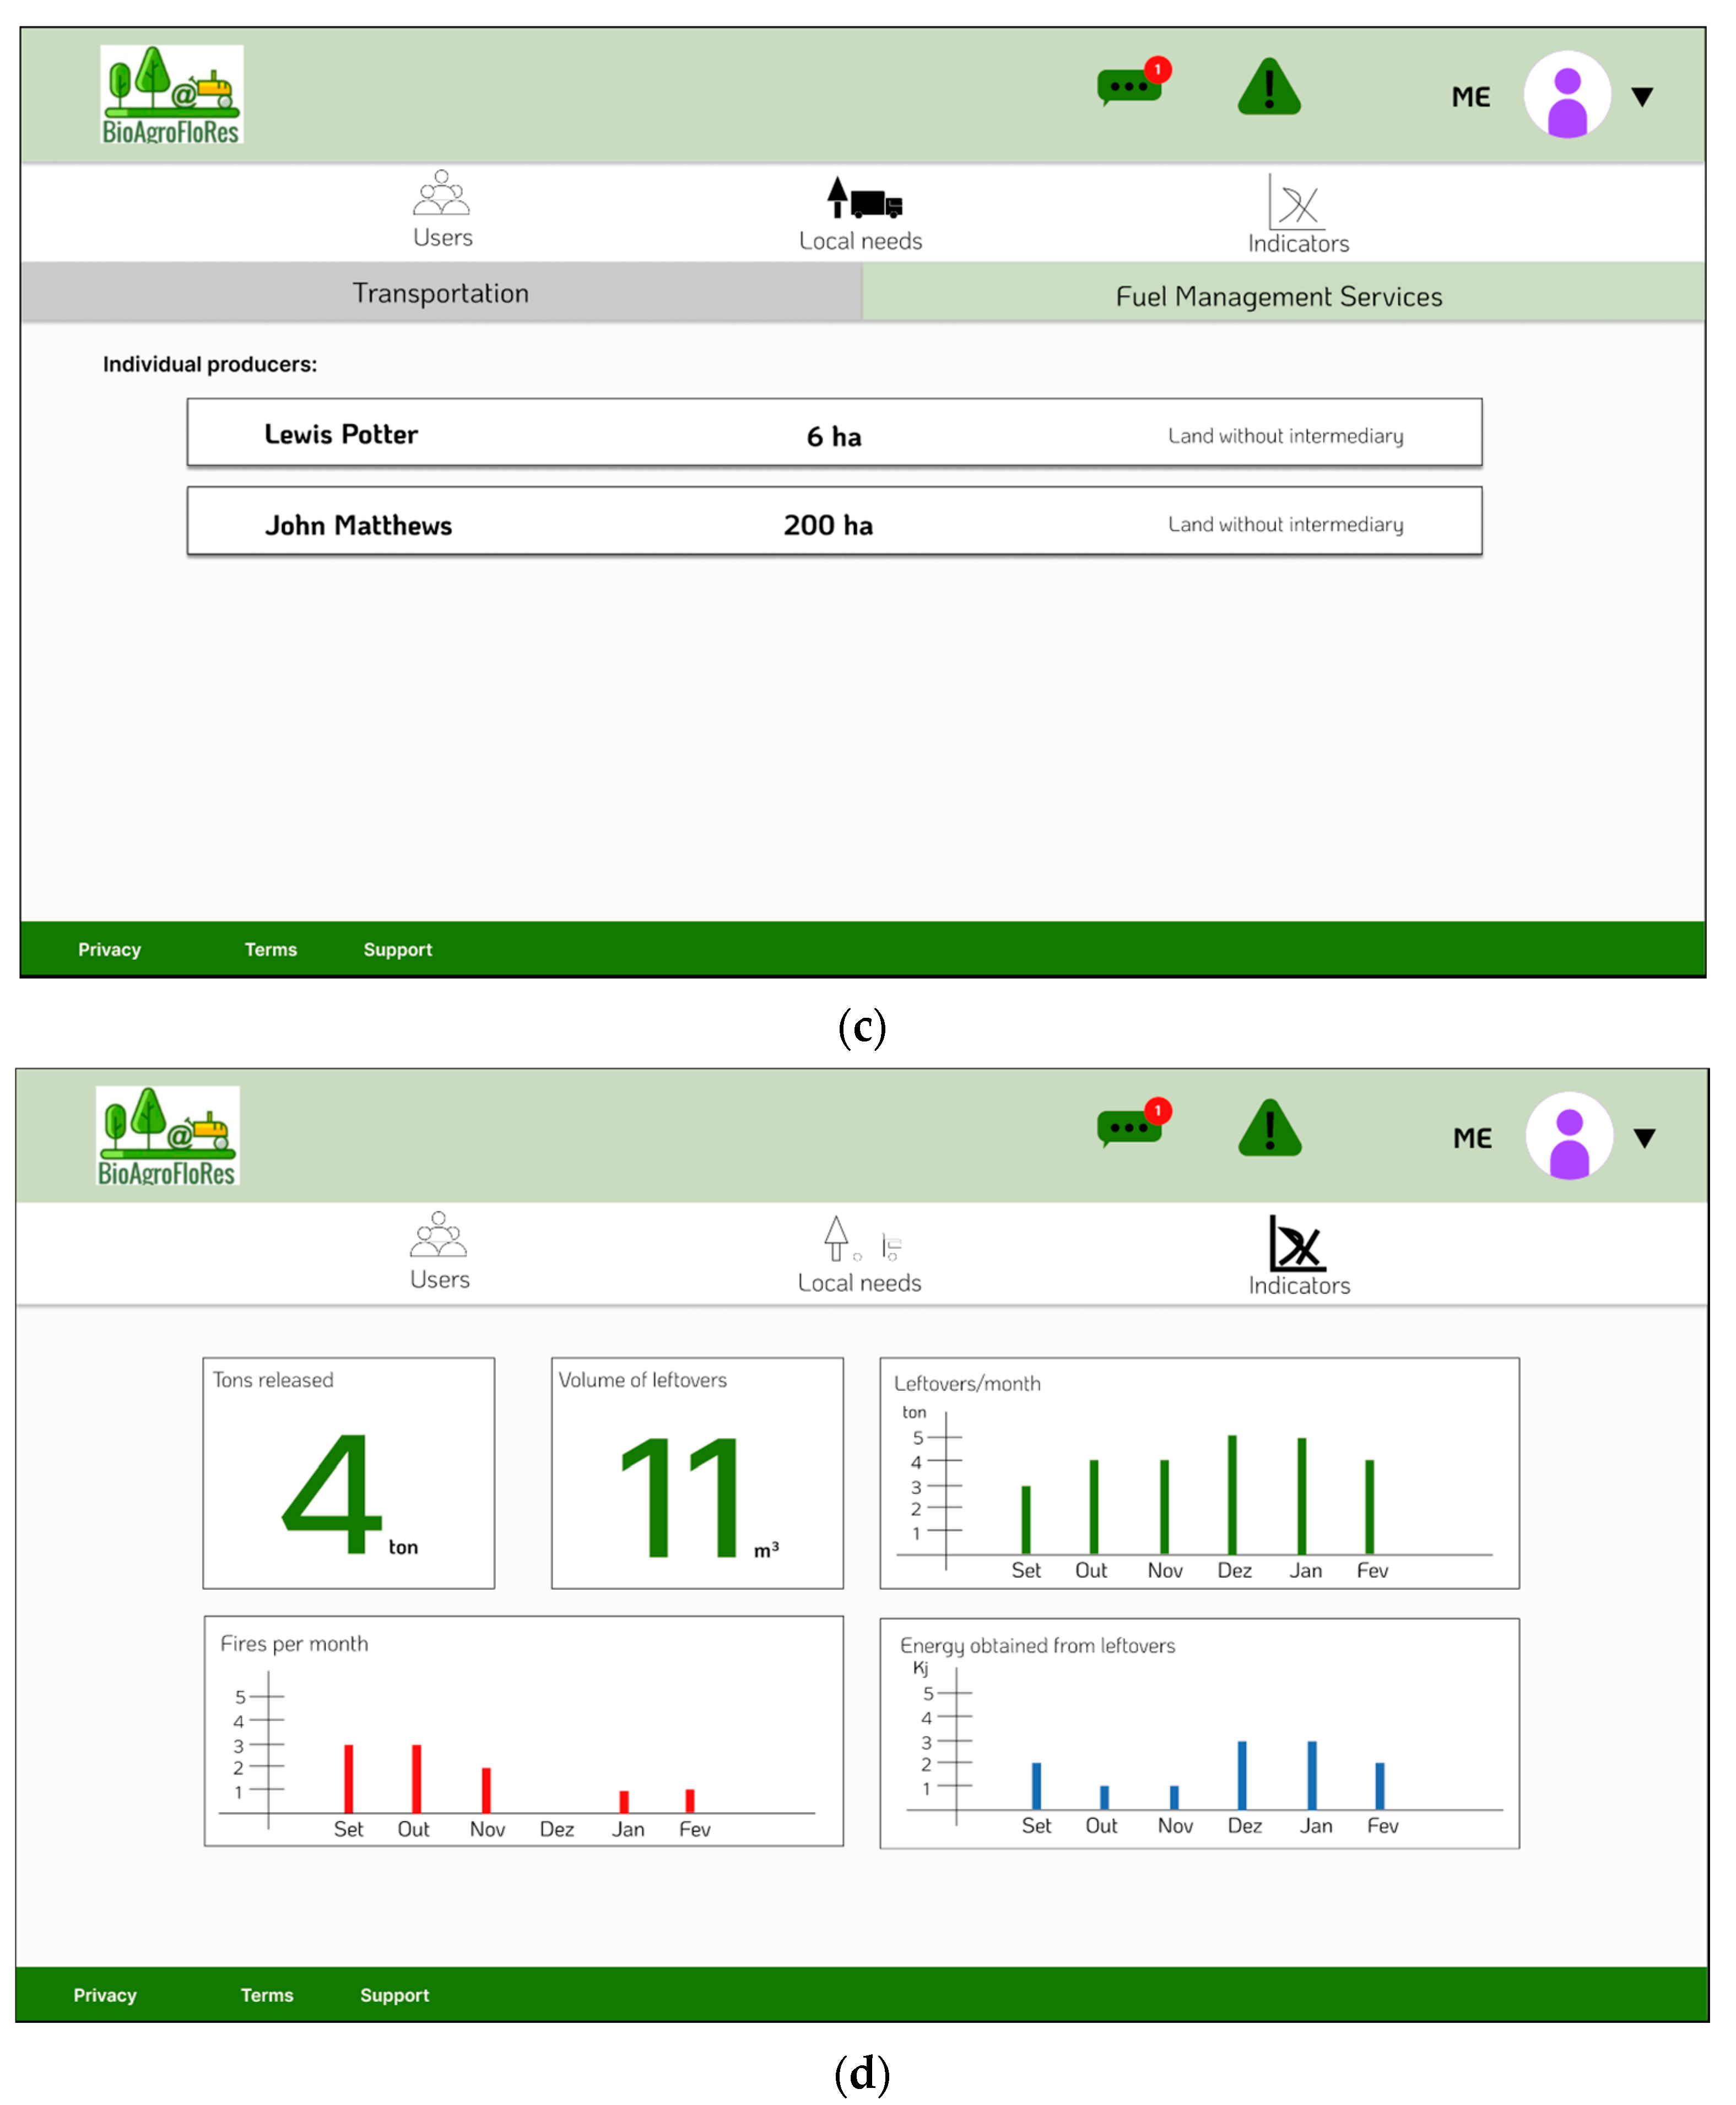
As far as the ME’s profile is concerned, its functionalities include user management. In this sense, the first interface of this profile (Figure 10a) shows a tab with two sections, where the first shows the users of the system and the second has the main function of validating potential users who have already pre-registered on the platform. In the “Platform users” section, the ME has the option of inserting new users who have not pre-registered using the “+” button. At the bottom of this interface, the ME can see a list of its users and can also register leftovers loads individually. These two features are particularly important to mitigate the possible lack of conditions on the part of certain users, due to the lack of digital skills or lack of technological devices. Changing the side bar to “Local Needs”, it also has two sections, “Transportation” and “Fuel Management Services”. In the case of the first (Figure 10b), this serves to inform the ME which points have leftovers without collection, being individual producers or biomass eco-points. This functionality can be particularly important for chains where some actors are missing or for leftover loads that are not economically viable and therefore have no one to collect them, with the being ME responsible for responding to this need. As for the “Fuel Management Services” tab (Figure 10c), this functions to inform the needs of the fuel management services communicated by producers in Figure 6d. The last ME tab aims to show indicators (Figure 10d) of the region such as the quantity of leftovers, quantity of loads, quantity of leftovers per month, fires per month, and energy generated per month. These indicators are intended to facilitate monitoring of the region, with the first three indicators being more focused on the exchange of leftovers and the last two focused on an indirect analysis of the consequences that this model can bring to the region. These indicators can be important for defining the platform’s future steps.

5. Discussion

Abandonment of land [30] and negligent attitudes towards fire associated with the eradication of leftovers [9] are the main causes of fire episode occurrences. Recovery RB becomes a path to decrease fire risk, acting in the three fire proliferation conditions [34], where IS can boost this occurrence due to SC optimization [44]. From a software engineering perspective, the UML models and prototype make strong contributions to the implementation of the functional solution.
The proposed concept contributes to rural fire mitigation, proposing a marketplace for a fuel management service, as well as connecting RBSC stakeholders to boost leftovers recovery. Regarding RBSC logistical challenges, the chain is complex and has several actors that are guided by individual decisions and misinformation [25,38,58]; the IS proposed contributes to overcoming this problem. From the conceptual model perspective, the results presented in this paper have a significant difference when compared with the previous ones [26], the intermediary requirements, which were not considered in [26]. The modified class diagram appears to be less complex, since only two tables were created to meet the intermediary’s needs. Another data model change was made in leftovers information storage. In the previous model, they were classified by type and species, while in the new version, leftovers will only be classified according to their species. This modification would reduce complexity and consequent computational resources, storing information with low relevance. This can impact fire risk reduction by making the application simpler, allowing for major acceptance by users with low digital skills. From the end consumer’s perspective, this change in information complexity has no impact, since the problem only considers residual biomass. Comparing this solution with the previously proposed one [27], the big differences lie in the proposal of a marketplace for fuel management services. Therefore, this solution proves to be more powerful in solving the problem of land abandonment (a fire risk promoter). At the same time, even though fuel management activities are mandatory, these areas still operate as per word of mouth, with prices being established by forestry operators. This problem can thus be mitigated, offering transparency in this market, fostering the social sustainability pillar, and reducing inequalities.
Given that most of the motivations of private forest owners are economic, this aspect is crucial to the success of the model [59]. However, financial motivations can be assessed from the perspective of biomass valorization or the reduction in fines (associated with not carrying out fuel management operations [24]). It is also important to note that the “liberalization” of the market inherent in the model will have an impact on the prices of intermediary services. Individual awareness of the model can be supported by associated long-term gains, as a result of reduced investment losses (e.g., forest plantations).
Thus, in terms of economic viability, this model leaves several scenarios open, for example, selling biomass or offering biomass annual compensation (cooperative logic). It is important to note that biomass recovery sometimes only offsets transportation costs, putting pressure on the economic viability of transportation. It is therefore expected that economic incentives will be important to minimize losses for RBSC stakeholders or regulations that force adherence to the model. With regard to younger generations, there is evidence that the economic pillar is not the only driver [2], allowing us to infer that motivations associated with environmental and social concerns may play a role in the adoption of the model.
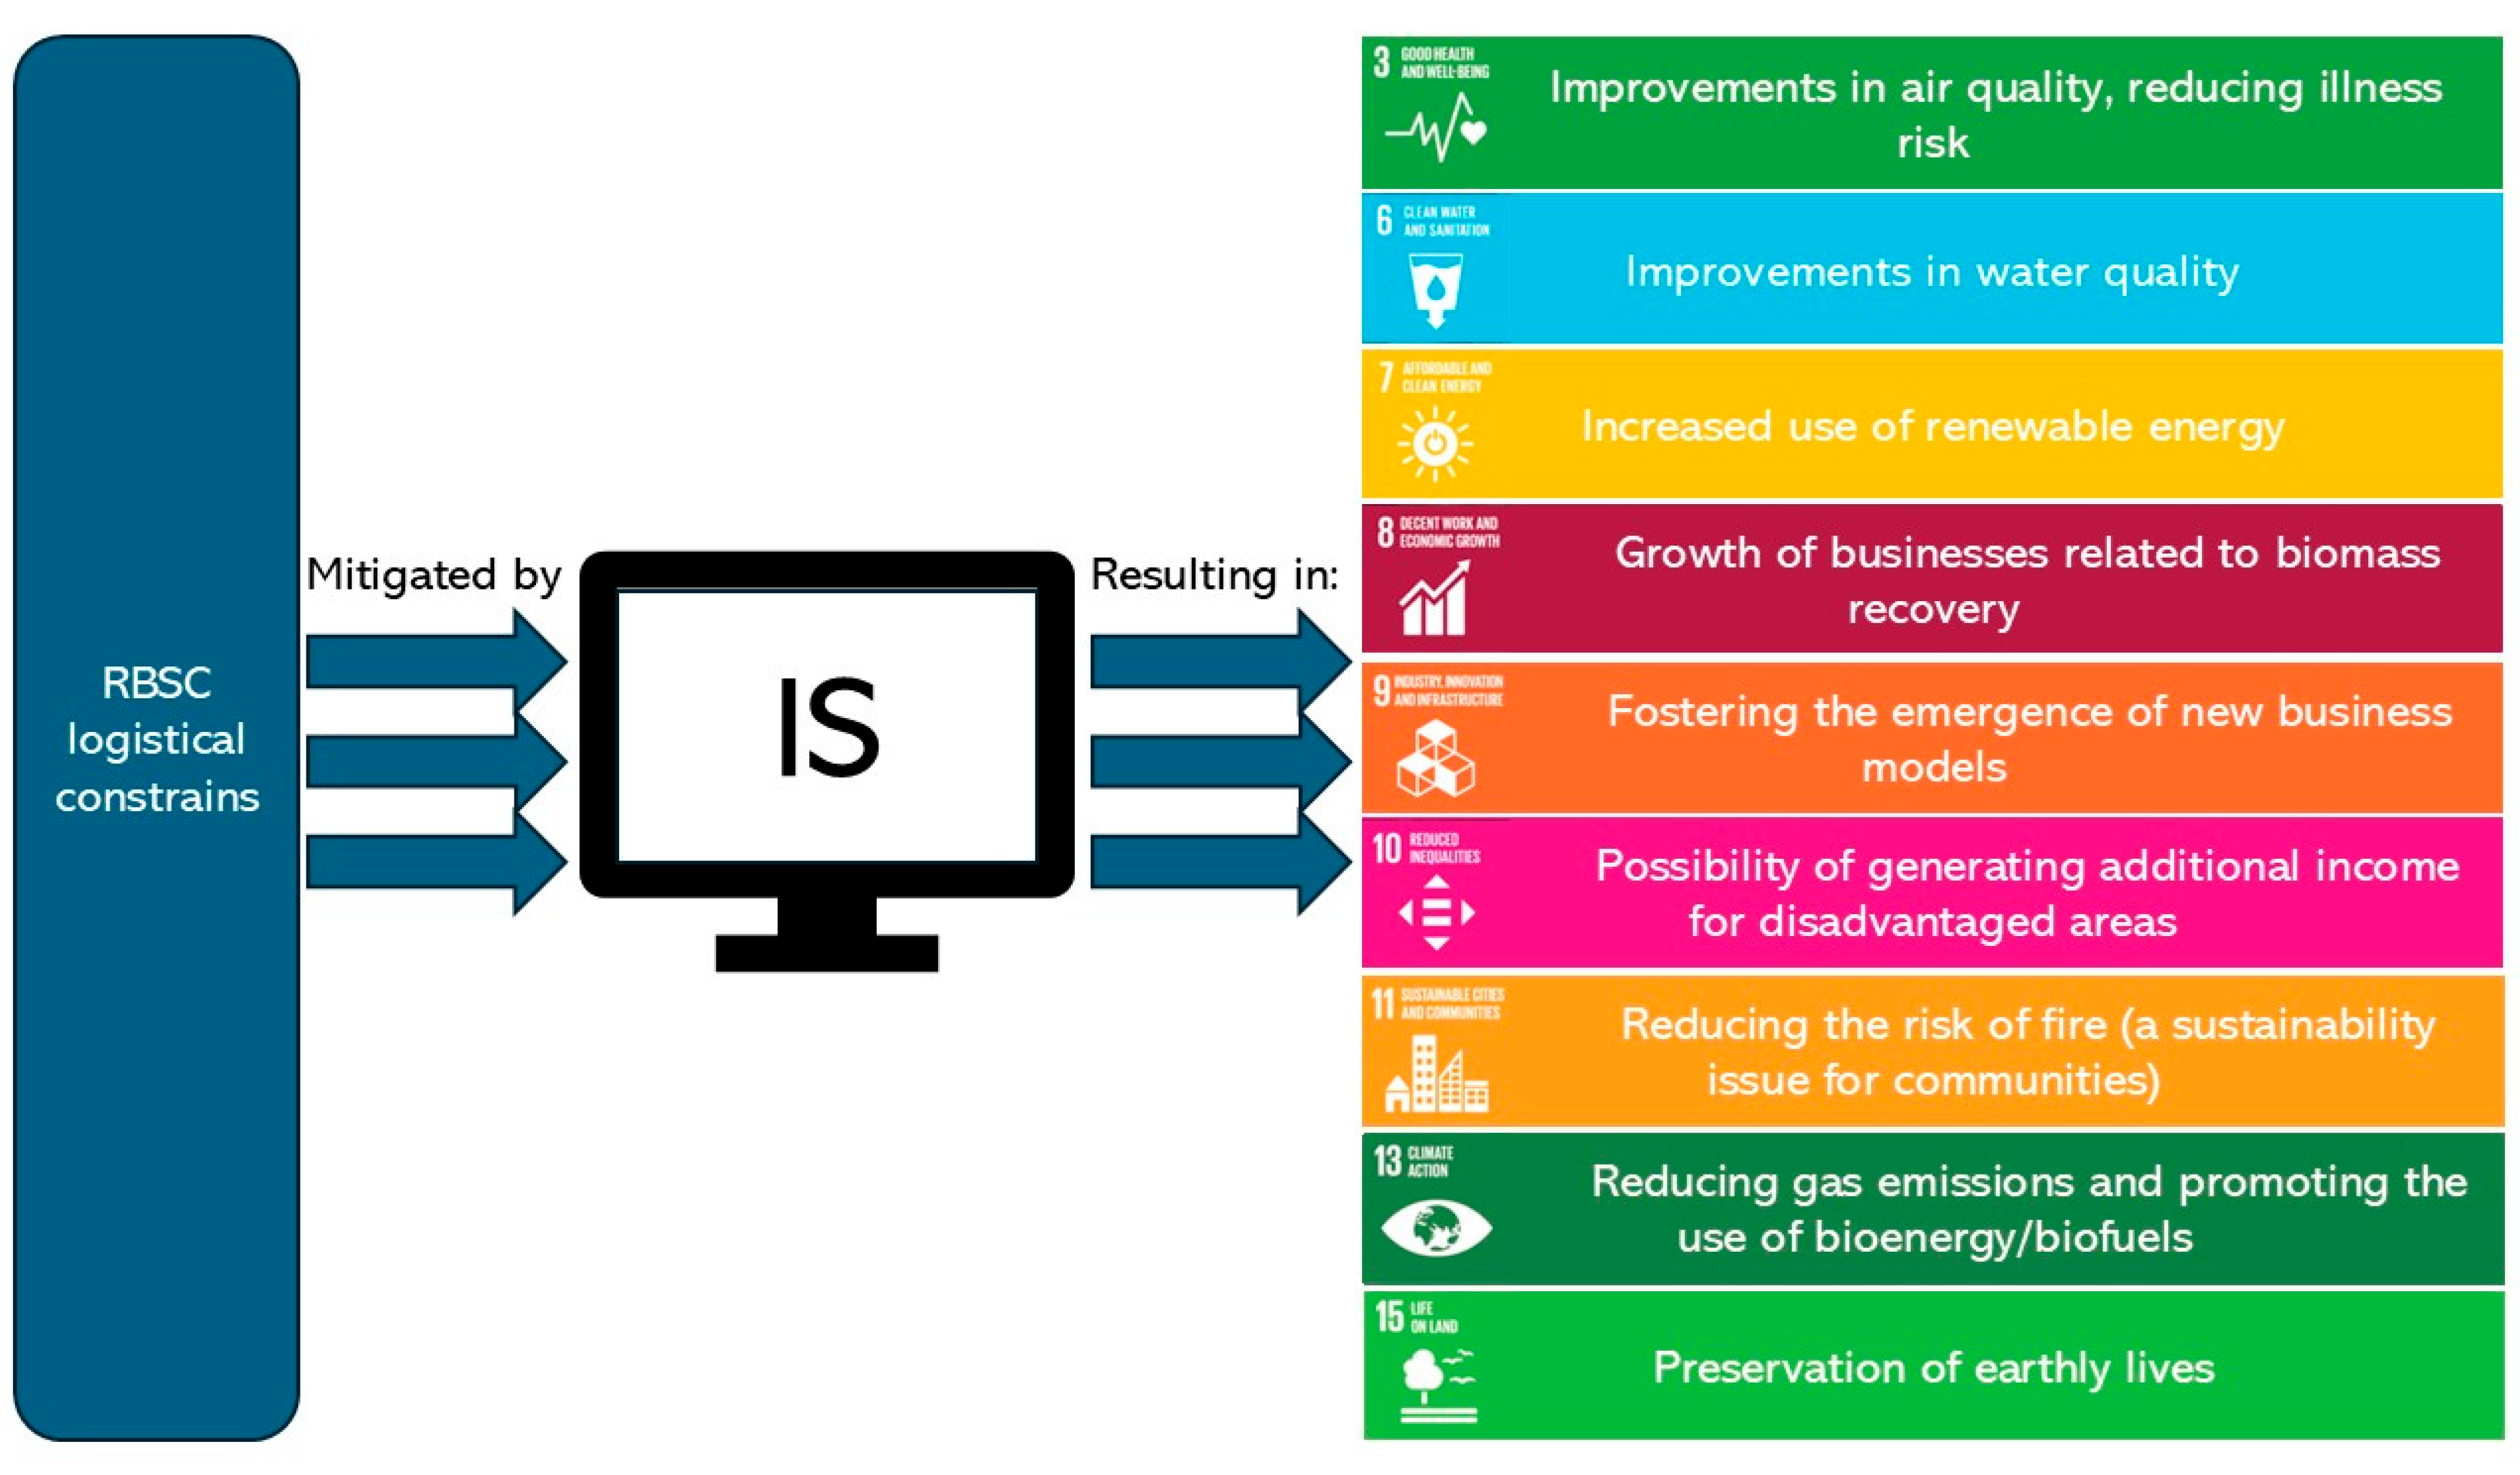
Despite not being implemented in a real context, it is possible to infer some sustainability outcomes, since the literature supports that the model can reduce negative impacts inherent to rural fire. Residual biomass recovery can promote SDG10—“Reduced Inequalities”—by fostering socioeconomic inclusion, creating jobs and income for vulnerable communities through leftovers valorization. This RBSC optimization with the proposed IS will foster the following SDGs: SDG7—“Affordable and Clean Energy”, which reinforces the importance of adopt renewable energies, visible in residual biomass recovery; SDG8—“Decent Work and Economic Growth” and SDG9—“Industry, Innovation and Infrastructure” since residual biomass recovery will foster the creation of new business models, e.g., selective residual biomass collection or the management of this kind of IS, prospering certain economic regions, the scope of the mentioned SDGs; SDG6—“Clean and Water Sanitation” will be supported by the model because fire affects water conditions; SDG3—“Good Health and Well-being”, SDG11—“Sustainable Cities and Communities”, SDG13—“Climate Action”, and SDG15—“Life on Land” since a non-fire scenario will protect communities, decrease emissions of gases, and mitigate climate changes, the basis of these goals. Figure 11 summarizes the contribution of technological solutions in terms of SDGs.
The proposed application allows for the connection of RBSC stakeholders, an important pillar for achieving smartness at the SC domain, allowing for the conclusion that this study presents a valuable contribution to the smartness of RBSC. Despite the low level of high technology of the presented solution (only uses IoT from the emerging technology bundle), this breakdown of barriers between actors can make it a solution within the I4.0 domain, fostering horizontal integration between SC [45,60].
The fire occurrence issue is one of the concerns inherent to smart cities (where technology is used to improve urban life and sustainability) [49]. In this sense, this application can contribute to achieving the concept of smart cities, where technology an IS is linked by IoT responses to a city concern (fire occurrence). Besides this, certain locations, areas with a higher risk of fire, may have connection problems [51], along with aging populations, low-income households, [61,62], or those who lack digital competency [63], which results in an need for simple steps, like this IS, to make the transition to more advanced solutions easier.

6. Conclusions

Recovering agroforestry leftovers have theoretical foundations to be key to solving one of the main sustainability concerns, acting on the three main conditions for fire proliferation. Logistical costs, mainly due to the lack of information/communication channels, represents one of the sizable obstacles in RB recovery phases, emphasizing the role of solutions that can boost information transparency and close RBSC stakeholders. Thus, this study provides an IS which aims to mitigate the discussed challenges, culminating in sustainability positive outcomes. This work also emphasizes the role of technology as a means to improve sustainability, fostering one vector of the smarter condition. Theoretically, this work corroborates the role of IS in SC optimization even in contexts where technology is still bordering on utopia. Still in the theoretical domain, this work adds a new perspective to managing the RBSC based on information models supported by emerging technology, bringing the concept of smartness to RBSC. Despite the contribution dimension regarding technology degree, these small steps become crucial to creating technology culture in RBSC. Furthermore, and given that these homes are traditionally in rural areas, it can be said that there is a contribution to the concept of smart cities by applying it to rural areas. In practical terms, this work presents a disruptive tool, which, besides its contribution, could be easily developed because of its level of maturation, and applied to real contexts, also providing contributions that can be applied in software engineering in terms of the modeling and prototyping chosen in this work. In terms of limitations, the possible lack of a case study to study more scenarios and consequently lack of requirements can be pointed out. Although the purpose of the article is not to address interface acceptance issues, the solution could be enriched if preliminary user testing results or performance evaluations in simulated scenarios were carried out. Therefore, the first piece of future work listed aims to carry out the aforementioned tests as a way of increasing the value of the solution and its acceptance by these users, who are characterized by low levels of technological use. The role of Lean can also be more explored in this work, as well as the validation of Lean Information Management assumptions. The economic feasibility of RBSC functioning may be interesting to study to perceive if IS are sufficient to ensure RB recovery or if regulations/incentives can get the system up and running.

Author Contributions

Conceptualization, T.B., L.J.R.N. and L.T.; methodology, L.J.R.N. and L.T.; validation, T.B., L.J.R.N. and L.T.; formal analysis, T.B., L.J.R.N. and L.T.; investigation, T.B., L.J.R.N. and L.T.; resources, L.J.R.N. and L.T.; data curation, T.B., L.J.R.N. and L.T.; writing—original draft preparation, T.B., L.J.R.N. and L.T.; writing—review and editing, T.B., L.J.R.N. and L.T.; visualization, T.B., L.J.R.N. and L.T.; supervision, L.J.R.N. and L.T.; project administration, L.J.R.N. and L.T. All authors have read and agreed to the published version of the manuscript.

Funding

This research was funded by the FCT—Fundação para a Ciência e Tecnologia/MCTES, through national funds and, when applicable, co-financed by the FEDER, under the new partnership agreement PT2020, grant number PCIF/GVB/0083/2019. The participation of the author Tiago Bastos in this work was financed by the Foundation for Science and Technology through financial support via funds from national budget and community budget through the FSE. The author Leonel J. R. Nunes’ participation in this work was financed by national funds through FCT—Fundação para a Ciência e a Tecnologia, I.P., within the scope of project UIDP/05975/2020 of the Research Unit on Materials, Energy, and Environment for Sustainability (PROMETHEUS), project UIDB/04058/2020, and UIDP/04058/2020 of the Research Unit on Governance, Competitiveness, and Public Policies (GOVCOPP). The author Leonor Teixeira was supported by the Institute of Electronics and Informatics Engineering of Aveiro (IEETA) and was supported by Portuguese funds through the FCT—Fundação para a Ciência e a Tecnologia, in the context of the project UIDB/00127/2020.

Institutional Review Board Statement

Not applicable.

Informed Consent Statement

Not applicable.

Data Availability Statement

The original contributions presented in this study are included in the article. Further inquiries can be directed to the corresponding author.

Conflicts of Interest

The authors declare no conflicts of interest.

Abbreviations

The following abbreviations are used in this manuscript:
SDGSustainable Development Goal
SCSupply Chain
RBSCResidual Biomass Supply Chain
I4.0Fourth Industrial Revolution or Industry 4.0
RBResidual Biomass
SSCMSmart Supply Chain Management
ISInformation System
IoTInternet of Things
AIArtificial Intelligence
UMLUnified Modeling Language
CSSCascading Style Sheets
MEManagement Entity

References

  1. Hong, A.Z.; Xiao, K. Digital economy structuring for sustainable development: The role of blockchain and artificial intelligence in improving supply chain and reducing negative environmental impacts. Sci. Rep. 2024, 14, 3912. [Google Scholar] [CrossRef]
  2. Bastos, T.; Teixeira, L. Digital Transition and Sustainable Development Goals: A Theoretical Reflection on the Impact of I4.0 Technologies. In Proceedings of the International Conference on Flexible Automation and Intelligent Manufacturing, Taichung, Taiwan, 23–26 June 2024; Springer: Berlin/Heidelberg, Germany, 2024; pp. 713–720. [Google Scholar] [CrossRef]
  3. Aravindaraj, K.; Chinna, P.R. A systematic literature review of integration of industry 4.0 and warehouse management to achieve Sustainable Development Goals (SDGs). Clean. Logist. Supply Chain. 2022, 5, 100072. [Google Scholar] [CrossRef]
  4. Silva, D.; Ferreira, T.M.; Rodrigues, H. Assessing the Accuracy of the Wildland–Urban Interface Index in Portuguese Rural Villages’ Context: A Case Study of the 2017 Pedrógão Grande Wildfire. Fire 2024, 7, 90. [Google Scholar] [CrossRef]
  5. Wibbenmeyer, M.; Sloggy, M.R.; Sánchez, J.J. Economic Analysis of Wildfire Impacts to Water Quality: A Review. J. For. 2023, 121, 374–382. [Google Scholar] [CrossRef]
  6. Oliveira, M.; Delerue-Matos, C.; Pereira, M.C.; Morais, S. Environmental particulate matter levels during 2017 large forest fires and megafires in the center region of Portugal: A public health concern? Int. J. Environ. Res. Public Health 2020, 17, 1032. [Google Scholar] [CrossRef]
  7. Kalogiannidis, S.; Chatzitheodoridis, F.; Kalfas, D.; Patitsa, C.; Papagrigoriou, A. Socio-Psychological, Economic and Environmental Effects of Forest Fires. Fire 2023, 6, 280. [Google Scholar] [CrossRef]
  8. Pierobon, F.; Sifford, C.; Velappan, H.; Ganguly, I. Air quality impact of slash pile burns: Simulated geo-spatial impact assessment for Washington State. Sci. Total Environ. 2022, 818, 151699. [Google Scholar] [CrossRef] [PubMed]
  9. Nunes, L.J.R.; Raposo, M.A.M.; Gomes, C.J.P. A historical perspective of landscape and human population dynamics in Guimarães (Northern Portugal): Possible implications of rural fire risk in a changing environment. Fire 2021, 4, 49. [Google Scholar] [CrossRef]
  10. de Oliveira, E.; Lobo-do-Vale, R.; Colaço, M.C. Incident analysis of traditional burns in Portugal. Int. J. Disaster Risk Reduct. 2023, 95, 103852. [Google Scholar] [CrossRef]
  11. Rijal, P.; Carvalho, H.; Matias, J.; Garrido, S.; Pimentel, C. Towards a Conceptual Framework for Agroforestry Residual Biomass Sustainable Business Models. In International Conference on Quality Innovation and Sustainability; Springer International Publishing: Cham, Switzerland, 2023; pp. 211–221. [Google Scholar] [CrossRef]
  12. Rijal, P.; Carvalho, H.; Matias, J.; Garrido, S.; Pimentel, C. Drivers and Barriers of Residual Agroforestry Biomass Valorization: A Bibliometric Analysis. In International Conference on Flexible Automation and Intelligent Manufacturing; Springer International Publishing: Cham, Switzerland, 2024; pp. 887–895. [Google Scholar] [CrossRef]
  13. Nunes, L.J.R.; Casau, M.; Dias, M.F.; Matias, J.C.O.; Teixeira, L.C. Agroforest woody residual biomass-to-energy supply chain analysis: Feasible and sustainable renewable resource exploitation for an alternative to fossil fuels. Results Eng. 2023, 17, 101010. [Google Scholar] [CrossRef]
  14. Chidozie, B.C.; Ramos, A.L.; Ferreira, J.V.; Ferreira, L.P. Residual Agroforestry Biomass Supply Chain Simulation Insights and Directions: A Systematic Literature Review. Sustainability 2023, 15, 9992. [Google Scholar] [CrossRef]
  15. Chidozie, B.; Ramos, A.; Vasconcelos, J.; Ferreira, L.P.; Gomes, R. Highlighting Sustainability Criteria in Residual Biomass Supply Chains: A Dynamic Simulation Approach. Sustainability 2024, 16, 9709. [Google Scholar] [CrossRef]
  16. Fernandez-Lacruz, R.; Eriksson, A.; Bergström, D. Simulation-based cost analysis of industrial supply of chips from logging residues and small-diameter trees. Forests 2020, 11, 1. [Google Scholar] [CrossRef]
  17. Paulson, J.; Kizha, A.; Han, H.-S. Integrating Biomass Conversion Technologies with Recovery Operations In-Woods: Modeling Supply Chain. Logistics 2019, 3, 16. [Google Scholar] [CrossRef]
  18. Casau, M.; Dias, M.F.; Teixeira, L.; Matias, J.C.O.; Nunes, L.J.R. Reducing Rural Fire Risk through the Development of a Sustainable Supply Chain Model for Residual Agroforestry Biomass Supported in a Web Platform: A Case Study in Portugal Central Region with the Project BioAgroFloRes. Fire 2022, 5, 61. [Google Scholar] [CrossRef]
  19. Rijal, P.; Carvalho, H.; Matias, J.; Garrido, S.; Pimentel, C. Drivers and barriers of residual agroforestry biomass valorization: A systematic literature review. Agrofor. Syst. 2025, 99, 81. [Google Scholar] [CrossRef]
  20. Demir, S.; Gunduz, M.A.; Kayikci, Y.; Paksoy, T. Readiness and Maturity of Smart and Sustainable Supply Chains: A Model Proposal. EMJ—Eng. Manag. J. 2023, 35, 181–206. [Google Scholar] [CrossRef]
  21. Moretti, L.; Milani, M.; Lozza, G.G.; Manzolini, G. A detailed MILP formulation for the optimal design of advanced biofuel supply chains. Renew. Energy 2021, 171, 159–175. [Google Scholar] [CrossRef]
  22. Piedra-Jimenez, F.; Torres, A.I.; Rodriguez, M.A. A robust disjunctive formulation for the redesign of forest biomass-based fuels supply chain under multiple factors of uncertainty. Comput. Chem. Eng. 2024, 181, 108540. [Google Scholar] [CrossRef]
  23. Basile, F.; Pilotti, L.; Ugolini, M.; Lozza, G.; Manzolini, G. Supply chain optimization and GHG emissions in biofuel production from forestry residues in Sweden. Renew. Energy 2022, 196, 405–421. [Google Scholar] [CrossRef]
  24. Bastos, T.; Teixeira, L.C.; Nunes, L.J.R. Forest 4.0: Technologies and digitalization to create the residual biomass supply chain of the future. J. Clean. Prod. 2024, 467, 143041. [Google Scholar] [CrossRef]
  25. Rijal, P.; Bras, P.; Garido, S.; Matias, J.; Pimentel, C.; Carvalho, H. Residual Forestry Biomass Supply Chain: A Mapping Approach. Int. J. Ind. Eng. Manag. 2023, 14, 244–256. [Google Scholar] [CrossRef]
  26. Bastos, T.; Teixeira, L.C.; Matias, J.C.O.; Nunes, L.J.R. Agroforestry Biomass Recovery Supply Chain Management: A More Efficient Information Flow Model Based on a Web Platform. Logistics 2023, 7, 56. [Google Scholar] [CrossRef]
  27. Bastos, T.; Teixeira, L.C.; Matias, J.C.O.; Nunes, L.J.R. Optimizing the agroforestry residual biomass supply chain: A disruptive tool for mitigating logistic costs and enhancing forest management. Results Eng. 2023, 20, 101500. [Google Scholar] [CrossRef]
  28. González-Pelayo, O.; Prats, S.; Amd, V.; Dcs, V.; Maia, P.; Keizer, J. Impacts of barley (Hordeum vulgare L.) straw mulch on post-fire soil erosion and ground vegetation recovery in a strawberry tree (Arbutus unedo L.) stand. Ecol. Eng. 2023, 195, 107074. [Google Scholar] [CrossRef]
  29. Scarpa, C.; Bacciu, V.; Ascoli, D.; Costa-Saura, J.M.; Salis, M.; Sirca, C.; Marchetti, M.; Spano, D. Estimating annual GHG and particulate matter emissions from rural and forest fires based on an integrated modelling approach. Sci. Total Environ. 2024, 907, 167960. [Google Scholar] [CrossRef] [PubMed]
  30. Tedim, F.; Samora-Arvela, A.; Coimbra, C.; Aranha, J.; Correia, F.; Pinto, D.M.; Figueiras, C.; Magalhães, C. Limitations and Opportunities of Spatial Planning to Enhance Wildfire Risk Reduction: Evidences from Portugal. Forests 2023, 14, 303. [Google Scholar] [CrossRef]
  31. Iglesias-Merchan, C.; López-Santiago, J.; Silván-Rico, R.; Millán-Castillo, R.S.; Gómez-Villarino, M.T. Impact of Depopulation on Forest Fires in Spain: Primary School Distribution as a Potential Socioeconomic Indicator. Forests 2024, 15, 1938. [Google Scholar] [CrossRef]
  32. Rodrigues, A.; Santiago, A.; Laím, L.; Viegas, D.X.; Zêzere, J.L. Rural Fires—Causes of Human Losses in the 2017 Fires in Portugal. Appl. Sci. 2022, 12, 12561. [Google Scholar] [CrossRef]
  33. Pippal, P.S.; Kumar, R.; Singh, A.; Singh, S.; Kumar, P.; Shrestha, S. Forest fire consequences under the influence of changing climate: A systematic review with bibliometric analysis in the context of sustainable development goals. Discov. Sustain. 2025, 6, 541. [Google Scholar] [CrossRef]
  34. Quishpe-Vásquez, C.; Oliva, P.; López-Barrera, E.A.; Casallas, A. Wildfires impact on PM2.5 concentration in galicia Spain. J. Environ. Manag. 2024, 367, 122093. [Google Scholar] [CrossRef] [PubMed]
  35. Habib, M.S.; Hwang, S.-J. Developing sustainable, resilient, and responsive biofuel production and distribution management system: A neutrosophic fuzzy optimization approach based on artificial intelligence and geographic information systems. Appl. Energy 2024, 372, 123683. [Google Scholar] [CrossRef]
  36. Alcocer-Garcia, H.; Segovia-Hernandez, J.G.; Sanchez-Ramirez, E.; Tominac, P.; Zavala, V.M. Coordinated markets for furfural and levulinic acid from residual biomass: A case study in Guanajuato, Mexico. Comput. Chem. Eng. 2022, 156, 107568. [Google Scholar] [CrossRef]
  37. Chidozie, B.; Ramos, A.; Vasconcelos, J.; Ferreira, L.P. Development of a Residual Biomass Supply Chain Simulation Model Using AnyLogistix: A Methodical Approach. Logistics 2024, 8, 107. [Google Scholar] [CrossRef]
  38. Nunes, L.J.R.; Silva, S. Optimization of the Residual Biomass Supply Chain: Process Characterization and Cost Analysis. Logistics 2023, 7, 48. [Google Scholar] [CrossRef]
  39. Sperandio, G.; Acampora, A.; Civitarese, V.; Bajocco, S.; Bascietto, M. Transport cost estimation model of the agroforestry biomass in a small-scale energy chain. Forests 2021, 12, 158. [Google Scholar] [CrossRef]
  40. Vittoria, B.; Simona, D.F.; Laura, V. Sustainable Energy Paths: Harnessing Residual Biomass Potential in Southern Italy. Int. J. Des. Nat. Ecodynamics 2024, 19, 1657–1663. [Google Scholar] [CrossRef]
  41. Nunes, L.J.R.; Nogueira, J.; Rodrigues, J.B.; Azevedo, J.C.; Oliveira, E.; de Figueiredo, T.; Picos, J. Modern Animal Traction to Enhance the Supply Chain of Residual Biomass. Agriengineering 2023, 5, 1039–1050. [Google Scholar] [CrossRef]
  42. Zhang, G.; Yang, Y.; Yang, G. Smart supply chain management in Industry 4.0: The review, research agenda and strategies in North America. Ann. Oper. Res. 2023, 322, 1075–1117. [Google Scholar] [CrossRef] [PubMed]
  43. Shi, T.; Lee, S.J.; Li, Q. Smart supply chain management in business education: Reflection on the pandemics. Decis. Sci. J. Innov. Educ. 2024, 22, 19–32. [Google Scholar] [CrossRef]
  44. Liu, Z.; Sampaio, P.; Pishchulov, G.; Mehandjiev, N.; Cisneros-Cabrera, S.; Schirrmann, A.; Jiru, F.; Bnouhanna, N. The architectural design and implementation of a digital platform for Industry 4.0 SME collaboration. Comput. Ind. 2022, 138, 103623. [Google Scholar] [CrossRef]
  45. Nayernia, H.; Bahemia, H.; Papagiannidis, S. A systematic review of the implementation of industry 4.0 from the organisational perspective. Int. J. Prod. Res. 2022, 60, 4365–4396. [Google Scholar] [CrossRef]
  46. Qian, X.; Chen, M.; Zhao, F.; Ling, H. An assessment framework of global smart cities for sustainable development in a post-pandemic era. Cities 2024, 150, 104990. [Google Scholar] [CrossRef]
  47. Wu, P.; Zhang, Z.; Peng, X.; Wang, R. Deep learning solutions for smart city challenges in urban development. Sci. Rep. 2024, 14, 5176. [Google Scholar] [CrossRef]
  48. Dixit, A.; Shaw, R. Smart Cities in Nepal: The concept, evolution and emerging patterns. Urban. Gov. 2023, 3, 211–218. [Google Scholar] [CrossRef]
  49. Reddy, P.D.K.; Margala, M.; Shankar, S.S.; Chakrabarti, P. Early fire danger monitoring system in smart cities using optimization-based deep learning techniques with artificial intelligence. J. Reliab. Intell. Environ. 2024, 10, 197–210. [Google Scholar] [CrossRef]
  50. Kaur, P.; Kaur, K.; Singh, K.; Kim, S.K. Early Forest Fire Detection Using a Protocol for Energy-Efficient Clustering with Weighted-Based Optimization in Wireless Sensor Networks. Appl. Sci. 2023, 13, 3048. [Google Scholar] [CrossRef]
  51. Maraveas, C.; Loukatos, D.; Bartzanas, T.; Arvanitis, K.G. Applications of artificial intelligence in fire safety of agricultural structures. Appl. Sci. 2021, 11, 7716. [Google Scholar] [CrossRef]
  52. Vatan, E.; Ardali, G.A.R.; Shahin, A. Selecting information systems development models based on organizational culture: An integrated approach of DEMATEL and ANP. VINE J. Inf. Knowl. Manag. Syst. 2022, 54, 531–560. [Google Scholar] [CrossRef]
  53. Almeida, F.; Simões, J.; Lopes, S. Exploring the Benefits of Combining DevOps and Agile. Future Internet 2022, 14, 63. [Google Scholar] [CrossRef]
  54. Teixeira, L.; Xambre, A.R.; Figueiredo, J.; Alvelos, H. Analysis and Design of a Project Management Information System: Practical Case in a Consulting Company. Procedia Comput. Sci. 2016, 100, 171–178. [Google Scholar] [CrossRef]
  55. Martikainen, S.; Kaipio, J.; Lääveri, T. End-user participation in health information systems (HIS) development: Physicians’ and nurses’ experiences. Int. J. Med. Inf. 2020, 137, 104117. [Google Scholar] [CrossRef]
  56. Zaki, T.; Islam, M.N.; Zaki, T. Neurological and physiological measures to evaluate the usability and user-experience (UX) of information systems: A systematic literature review. Comput. Sci. Rev. 2021, 40, 100375. [Google Scholar] [CrossRef]
  57. Kose, B.O. Business process management approach for improving agile software process and agile maturity. J. Softw. Evol. Process 2021, 33, e2331. [Google Scholar] [CrossRef]
  58. Guzmán-Bello, H.; López-Díaz, I.; Aybar-Mejía, M.; de Frias, J.A. A Review of Trends in the Energy Use of Biomass: The Case of the Dominican Republic. Sustainability 2022, 14, 3868. [Google Scholar] [CrossRef]
  59. Girona-García, A.; Cretella, C.; Fernández, C.; Robichaud, P.R.; Vieira, D.C.S.; Keizer, J.J. How much does it cost to mitigate soil erosion after wildfires? J. Environ. Manag. 2023, 334, 117478. [Google Scholar] [CrossRef]
  60. Karnik, N.; Bora, U.; Bhadri, K.; Kadambi, P.; Dhatrak, P. A comprehensive study on current and future trends towards the characteristics and enablers of industry 4.0. J. Ind. Inf. Integr. 2022, 27, 100294. [Google Scholar] [CrossRef]
  61. Leviäkangas, P.; Sønvisen, S.; Casado-Mansilla, D.; Mikalsen, M.; Cimmino, A.; Drosou, A.; Hussain, S. Towards smart, digitalised rural regions and communities—Policies, best practices and case studies. Technol. Soc. 2025, 81, 102824. [Google Scholar] [CrossRef]
  62. Alabdali, S.A.; Pileggi, S.F.; Cetindamar, D. Influential Factors, Enablers, and Barriers to Adopting Smart Technology in Rural Regions: A Literature Review. Sustainability 2023, 15, 7908. [Google Scholar] [CrossRef]
  63. Fernández, C.G.; Peek, D. Connecting the Smart Village: A Switch towards Smart and Sustainable Rural-Urban Linkages in Spain. Land 2023, 12, 822. [Google Scholar] [CrossRef]
Figure 1. An overview of the problem of rural fires.
Sustainability 17 07863 g001
Figure 2. Framework for use of agile methodology in software development.
Sustainability 17 07863 g002
Figure 3. Summary of methodological approach used in this study.
Sustainability 17 07863 g003
Figure 4. The main functionalities represented based on a use-case diagram.
Sustainability 17 07863 g004
Figure 5. Data model based on class diagram.
Sustainability 17 07863 g005
Figure 6. Set of producer interfaces: (a) main producer interface; (b) interface for reporting leftovers; (c) interface for requesting services; (d) interface for requesting services without intermediaries.
Sustainability 17 07863 g006aSustainability 17 07863 g006b
Figure 7. Set of intermediary interfaces: (a) main intermediary interface; (b) interface for services summary.
Sustainability 17 07863 g007
Figure 8. Set of transporter interfaces: (a) main transporter interface; (b) interface for communicating availability window; (c) interface for communicating characteristics of means of transport; (d) interface for visualizing collection points.
Sustainability 17 07863 g008aSustainability 17 07863 g008b
Figure 9. Set of end consumer interfaces: (a) main end consumer interface; (b) interface to manage their loads; (c) interface for communicating availability window.
Sustainability 17 07863 g009
Figure 10. Set of ME interfaces: (a) user management interface; (b) interface to manage local transportation needs; (c) interface to manage local fuel management operation’s needs; (d) interface for visualizing indicators.
Sustainability 17 07863 g010aSustainability 17 07863 g010b
Figure 11. Summary of technological solution in terms of SDGs.
Sustainability 17 07863 g011
Table 1. Summary of system actors (name, description, and specific requirements).
ActorDescriptionSpecific Requirements
ProducerThe owner of the biomass, whether it is land in need of fuel management activities or biomass that has already been cut.- Insert leftovers registration;
- Visualize financial transaction data;
- Visualize the intermediary services;
- Require fuel management services, specifying the service needs (cutting operations and/or leftovers collection);
- Require management entity (ME) help when no intermediaries.
IntermediaryResponsible for agricultural and fuel management activities. Can also carry out pre-treatment or transportation activities.- Communicate the service that they provide (vegetation cutting, leftovers collection, land conditions to carry out operations);
- Visualize services (future and history).
TransporterIt ensures the transportation of leftovers from the place of harvest to the place of destination and can incorporate just one or several producers.- Visualize indicators;
- Visualize the collection routes (future and already executed);
- Communicate the collection availability window;
- Communicate the transport type (capacity, fuel usage…);
- Visualize collection points.
End ConsumerFinal actor in the chain, they receive the biomass. This can be of various natures, from biomass plants to pellet industries.- Communicate the leftovers that they want;
- Visualize loads (future and history);
- Communicate the reception availability window;
- Visualize the collection routes (future and already executed);
- Communicate the collection availability window;
- Communicate the transport type (capacity, fuel usage…);
- Visualize collection points.
Management EntityEntity that manages the entire model (platform and leftovers recovery model), it also functions as a reactive entity, responsible for acting in the absence of actors, ensuring fuel management or transportation activities. It should be noted that this actor is reactive and should not create any kind of unfair competition with other actors.- Visualize the local town needs (transportation and fuel management operations);
- Add/validate new users;
- Insert leftovers registration from producers that have no access.
Disclaimer/Publisher’s Note: The statements, opinions and data contained in all publications are solely those of the individual author(s) and contributor(s) and not of MDPI and/or the editor(s). MDPI and/or the editor(s) disclaim responsibility for any injury to people or property resulting from any ideas, methods, instructions or products referred to in the content.