Article

Comparative Analysis of PM2.5- and O3-Attributable Impacts in China: Changing Trends and Driving Factors

School of Management, Qufu Normal University, Rizhao 276800, China
Sustainability 2025, 17(16), 7350; https://doi.org/10.3390/su17167350
Submission received: 25 June 2025 / Revised: 9 August 2025 / Accepted: 11 August 2025 / Published: 14 August 2025
(This article belongs to the Special Issue Environmental Pollution and Impacts on Human Health)

Abstract

China’s divergent fine particulate matter (PM2.5) and surface ozone (O3) pollution trends pose critical threats to sustainable development. This study quantifies the spatiotemporal evolution of health burdens (premature deaths) and economic costs across 333 cities during 2015–2023, integrating the Global Exposure Mortality Model (for PM2.5) and Log-linear Exposure-Response Model (for O3) with income- and age-adjusted Value of Statistical Life. The results revealed an 11% decrease in PM2.5-attributable premature deaths, but this benefit was partially offset (60%) by an 87% increase in O3-related deaths. Furthermore, the per capita economic loss from O3 exposure increased by 154%, far exceeding China’s 79% growth in per capita disposable income. Decomposition analysis revealed that while diverging exposure levels primarily drove differential PM2.5- and O3-related impacts, this disparity was significantly amplified by population aging. These findings underscore the need for air quality strategies to both sustain PM2.5 reduction achievements and implement rigorous O3 controls, while integrating pollution considerations into public health frameworks with special emphasis on protecting vulnerable populations.

1. Introduction

As fine particulate matter (PM2.5) and surface ozone (O3) are two major air pollutants sharing multiple common precursors, comparative studies of these two pollutants have been extensively conducted worldwide, examining both pollution characteristics [1,2] and their differential health consequences [3,4]. The severe PM2.5 and O3 pollution in China has made it a global research priority for these co-occurring pollutants [5,6].
Over the past few decades, China’s PM2.5-prioritized air pollution control policies have yielded contrasting trends in PM2.5 and surface O3 concentrations [7,8]. As documented in the 2023 China Report of the Lancet Countdown on Health and Climate Change, the annual mean PM2.5 concentration decreased by 41%, from 49 μg/m3 in 2015 to 29 μg/m3 in 2022, whereas the annual daily maximum 8-h average O3 concentration increased from 135 μg/m3 to 145 μg/m3 [9]. Xiao et al. [10] and Lyu et al. [11] reported similar findings. Given these divergent trends, a systematic assessment of related health and economic burdens is imperative to evaluate the efficacy of past regulatory measures and inform future policy formulations advancing Sustainable Development Goals.
Both PM2.5 and O3 pollution pose significant threats to public health [12,13]. Epidemiological evidence has established robust associations between PM2.5 exposure and adverse health outcomes, including lower respiratory infections (LRI) and all non-communicable diseases (NCD), and even impaired psychological well-being [14,15]. Exposure to O3 pollution is also believed to increase the risk of death from chronic respiratory diseases (RESP) and circulatory diseases (CIRC) [16,17]. Globally, ambient air pollution accounted for approximately 9.0 million premature deaths in 2019, with 4.14 million attributable to PM2.5 and 0.37 million to O3 [18]. China bears a disproportionate burden, experiencing more severe health losses from these pollutants than any other nation [19,20]. For example, Geng et al. [21] estimated 2.12 million premature deaths in China in 2017 due to PM2.5 exposure, while Yao et al. [22] reported 0.31 million premature deaths attributable to O3 pollution.
In view of the divergent evolution of PM2.5 and O3 pollution, some forward-looking scholars have conducted comparative analyses of their respective health impacts. Dang and Liao [23] found that rising O3 concentrations in eastern China during 2012–2017 contributed to 16.0 thousand additional respiratory deaths, a figure substantially outweighed by the 284.3 thousand deaths averted through PM2.5 mitigation. Lyu et al. [11] estimated the long-term population exposure risks to PM2.5 and O3 in China’s major urban agglomerations from 2015 to 2021, finding that while O3-induced premature mortality remained significantly lower than those from PM2.5, future projections indicate that O3-related mortality will increase in major urban areas, in contrast to the ongoing decline in PM2.5-related mortality during 2020–2060. Similarly, Xue et al. [24] tracked spatiotemporal variations in pollution-related mortality from 2013 to 2020, observing a decline in PM2.5-attributable deaths (from 1.31 million in 2013 to 1.06 million in 2020) alongside fluctuating O3-attributable mortality (from 0.102 million in 2013 to 0.116 million in 2020).
Beyond health detriments, air pollution imposes substantial economic costs, encompassing medical expenditures, hospitalization outlays, and lost labor productivity [25,26]. Current research predominantly focuses on economic losses caused by either PM2.5 or O3 pollution in isolation. For instance, in terms of PM2.5-related studies, Guan et al. [27] reported China’s economic losses increased marginally from 3205.1 to 3344.8 billion CNY (2015–2017), while Yang et al. [28] observed a decrease from 121.9 to 107.2 billion USD (2014–2016). Regarding O3 impacts, Maji et al. [29] assessed seasonal variations and associated economic impacts in 338 Chinese cities (2016), and Zhang et al. [30] analyzed spatiotemporal variations in ozone-related economic losses across China (2015–2018). Only a handful of studies have conducted comparative analyses of economic impacts associated with both pollutants [31,32].
Additionally, a growing body of research has focused on identifying drivers behind long-term trends in pollution-related impacts. In terms of health effects, pollution exposure levels constitute the most direct determinant of premature mortality attributable to air pollution [33,34]. Demographic factors, particularly population size and age structure, also significantly influence these outcomes. Notably, the exacerbating effect of population aging on pollution-related health burden has gained increasing recognition in recent studies [35,36]. According to prevailing health impact assessment models based on epidemiological cohort studies, the premature mortality caused by pollution is further modulated by baseline mortality rates [32,37]. For economic impacts, additional drivers come into play beyond the aforementioned factors. Economic growth, industrial restructuring, energy intensity and mix, as well as healthcare investments have all been demonstrated to shape the long-term evolution of pollution-related economic costs [21,38]. Recent multi-driver analyses reveal that while emission control measures reduced PM2.5 concentrations, concurrent economic expansion and aging populations partially offset these gains in economic burden reduction [21,36].
While existing studies have established a fundamental understanding of PM2.5 and O3 pollution variations and their health impacts in China, several critical gaps remain unresolved. First, although pre-pandemic research systematically characterized these pollutants’ distinct trends, the COVID-19 pandemic has dramatically altered pollution patterns through changes in industrial activity, transportation behaviors, and energy consumption [6,39]. This paradigm shift necessitates a fresh assessment of both pollutants’ dynamics and impacts in the post-pandemic era. Second, current research lacks comparative analysis of economic impacts between PM2.5 and O3 pollution. Given their differing chemical formation pathways and control requirements, quantifying their differential economic burdens—including healthcare costs, productivity losses, and mitigation expenditures—is crucial for policy prioritization [32,40]. Per capita disposable income (PDI) could be used as a key metric to evaluate these economic disparities in the comparative analyses of economic impacts between PM2.5 and O3 [27]. Third, while broad patterns were identified by previous national/regional analyses, critical inter-city variations may be masked. A city-scale approach could address this limitation by enabling tailored ‘one-city-one-policy’ solutions and providing data support for cross-regional coordinated governance, particularly important for ozone which exhibits stronger regional transport characteristics [41,42]. Furthermore, this multi-pollutant comparative assessment could provide new insights by emphasizing the growing health risks from population aging—the demographic factor amplifying vulnerability to both pollutants’ health effects [35,43].
In this study, these critical gaps were addressed by conducting a comprehensive, city-level analysis of PM2.5- and O3-related health and economic impacts across 333 Chinese cities during 2015–2023. The results provide the post-pandemic assessment of both pollutants’ evolving dynamics, while systematically comparing their differential economic burdens using income-adjusted metrics. City-scale estimates reveal previously masked spatial variations, enabling tailored pollution control strategies—particularly for regionally transported O3. The analysis further quantifies how population aging amplifies dual-pollutant vulnerabilities, offering new insights for coordinated multi-pollutant governance under demographic transition.

2. Materials and Methods

2.1. Data Sources

City-level daily 24-h average PM2.5, and maximum daily 8-h average (MDA8) O3 concentrations for 333 Chinese cities during 2015–2023 were obtained from the Data Center of the Ministry of Ecology and Environment of China. In accordance with the Technical Regulation for Ambient Air Quality Assessment (HJ 633-2013) [44], the annual PM2.5 concentrations were derived by computing the arithmetic mean of daily 24-h averages. For O3, the annual metric was defined as the 90th percentile of MDA8 concentrations, while the arithmetic mean of the MDA8 values was used to estimate O3-attributable premature mortality. City-specific PDI data for the study period are sourced from the National Economic and Social Development Bulletin. Age-stratified population data (for individuals aged ≥25 years, segmented into 5-year intervals: 25–29, 30–34, etc.) were provided by Zhang et al. [45]. Missing pollutant concentration and PDI data during the study period were filled using linear interpolation of adjacent-year measurements to ensure temporal continuity.
The estimation of pollution-related premature deaths requires baseline mortality rates for specific health endpoints (see Section 2.2 and Section 2.3). Given the limited availability of city-level mortality statistics, nationally aggregated data from the Global Burden of Disease (GBD) study (available at: http://ghdx.healthdata.org/gbd-results-tool, accessed on 15 December 2023) were employed. The GBD dataset provides comprehensive, age-stratified (5-year intervals for adults) baseline mortality rates in China for relevant health endpoints for the years 2015–2019 (Table A1, Table A2 and Table A3). For years with missing data, temporal linear interpolation was adopted to ensure temporal continuity.
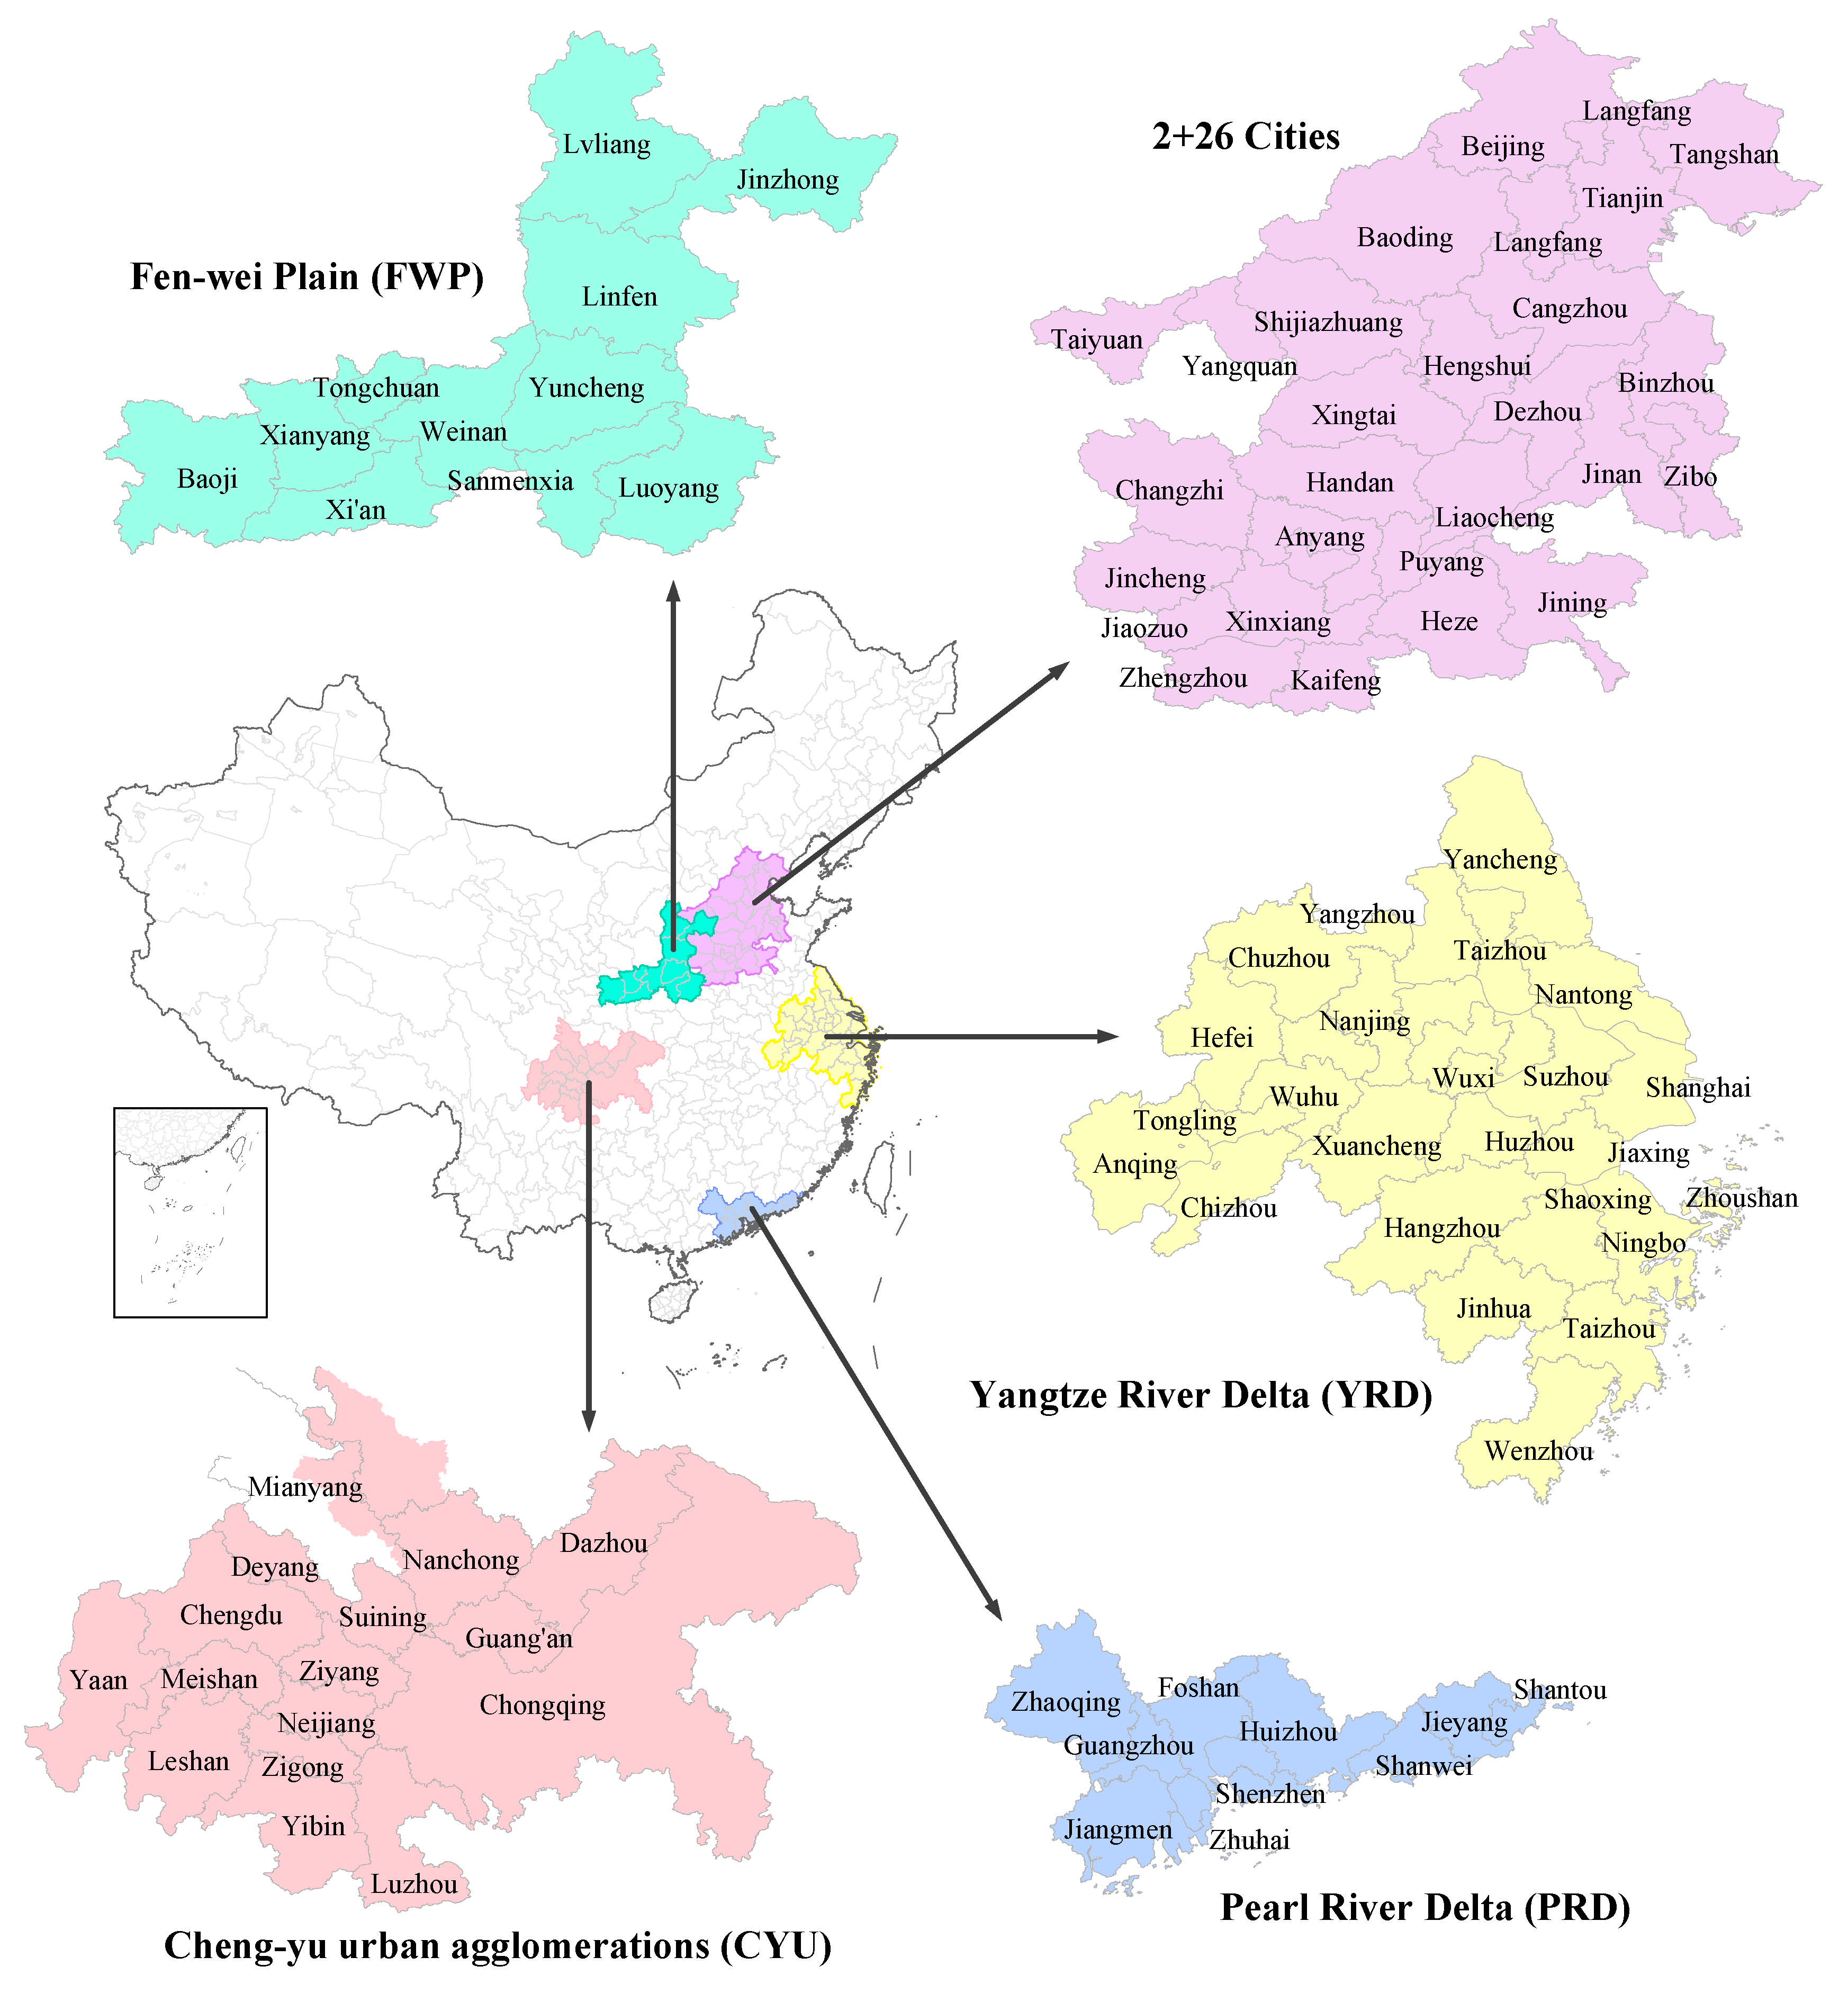
Furthermore, five major urban agglomerations: 2+26 Cities, Yangtze River Delta (YRD), Pearl River Delta (PRD), Fen-Wei Plain (FWP), and Cheng-Yu Urban Agglomeration (CYU) (Figure A1), were emphasized in the analysis, given their status as China’s most pollution-burdened regions [46,47].

2.2. Estimating the Premature Deaths Attributable to PM2.5 Exposure

The premature mortality attributable to PM2.5 pollution was estimated using the Global Exposure Mortality Model (GEMM), the most recent integrated exposure-response function [14,48]. Given that over 99% of non-accidental deaths in the 41 cohorts (spanning 16 countries, including China) underlying GEMM were attributable to NCD and LRI, these two conditions were selected as the relevant health endpoints for adults (aged >25 years). The relative risk function from the GEMM NCD+LRI model was employed. The age-specific relative risk represents the mortality probability ratio between the observed exposure levels and a theoretical counterfactual concentration threshold below which no adverse health effects are presumed to occur. Within the GEMM NCD+LRI, the city- and year-specific R R i , y is defined as:
R R i , y , a = e x p θ log ( z α + 1 ) 1 + e x p ( z μ v ) , w h e r e   z = m a x ( 0 ,   C i , y C 0 )
where i , y , and a refer to city, year, and age respectively; θ , α , μ , and ν are the age-specific and disease-specific parameters describing the shape of the GEMM function (Table A4); z denotes the difference between the annual average PM2.5 concentration of target city in year y ( C i , y ) and the counterfactual concentration C 0 (a uniform distribution between 2.4 μ g / m 3   and 5.9 μ g / m 3 ).
Accordingly, the PM2.5-attributable premature death in city i in year y is:
D i , y P M = a = 25 80 + ( B y , a N C D + L R I × P i , y , a × R R i , y , a 1 R R i , y , a )
where D i , y P M denotes the number of premature deaths attributable to PM2.5 in city c and year t ; P i , y , a is the city- and year-specific exposed population at age a ; B y , a N C D + L R I is the year- and age-specific Chinese national baseline mortality rate for NCD plus LRI.
To estimate the 95% confidence interval (CI) of the estimated annual premature deaths, the age-specific relative risk of each city was randomly and simultaneously sampled 1000 times using Python version 3.6.2. In each iteration, the annual premature deaths of the corresponding cities were summed to represent the annual total premature deaths of China or the urban agglomerations. The range between the 2.5th and 97.5th percentiles of 1000 iterative estimates was set as the 95% CI.

2.3. Estimating the Premature Deaths Attributable to O3 Exposure

Epidemiological evidence has identified two principal causes of O3-attributable premature mortality: chronic respiratory diseases (RESP) and circulatory diseases (CIRC, including diabetes mellitus) [17,29]. The Log-linear Exposure-Response Model (LERM) was first established by Jerrett et al. [16] through large-scale epidemiological studies. Based on their research, Turner et al. [17] demonstrated that the annual mean of the maximum daily 8-h average (AMDA8) O3 concentration provides a more robust metric for assessing long-term O3 exposure effects on cause-specific mortality than the summer-only daily 1-h maximum O3 metric employed in earlier studies. Since then, the LERM has been extensively applied in O3-related health impact assessments [49]. Especially, it has been used for China-specific analyses at city level [29,34,50]. Accordingly, in this study, the relative risk of death from a specific disease was calculated via the AMDA8 O3-based LERM, following the approach of Turner et al. [17]:
R R i , y = e x p β ( C i , y C 0 )
where C 0 is counterfactual concentration of O3, which follows a uniform distribution between 29.1 p p b and 35.7 p p b according to GBD [49]; β is the exposure-response coefficient that quantifies the change in disease-specific mortality risk per unit increase in O3 concentration, derived from the hazard ratio as follows:
β = l n H R / Δ C
where H R is the hazard ration; Δ C is the O3 concentration increment set at 10 p p b following Turner et al. [17]. H R was set to be 1.12 (95% CI: 1.08–1.16) for RESP and 1.03 (95% CI: 1.01–1.05) for CIRC, respectively, which are both controlled for PM2.5 to minimize double counting of attributable deaths [17]. To convert the monitored O3 concentration ( μ g / m 3 ) into the same metric as Δ C and C 0 , this study assumed that 1.96 μ g / m 3 = 1 p p b according to Yin et al. [51].
City-level annul premature deaths related to O3 pollution were estimated as:
D i , y o z o n e = a = 25 80 + ( B y , a R E S P / C I R C × P i , y , a × R R i , y 1 R R i , y )
where D i , y o z o n e is the city- and year-specific premature death attributable to O3 pollution; B y , a R E S P / C I R C is the year- and age-specific Chinese national baseline mortality rate of RESP or CIRC (including diabetes).
The 95% CI estimate of annual premature deaths attributable to O3 pollution in China and major urban agglomerations was similar to that of PM2.5. H R was randomly sampled 1000 times using Python version 3.6.2. In each iteration, the annual premature deaths of the corresponding cities were summed to represent the annual total premature deaths of China or urban agglomerations, and the range between the 2.5th and 97.5th percentiles of 1000 iterative estimates was set to be the 95% CI.

2.4. Valuing Economic Loss

The monetization of mortality has been operationalized through non-market valuation techniques because of the absence of a functional market for human life [52]. The concept of Value of Statistical Life (VSL) was introduced to establish a theoretical framework for mortality risk valuation, formally defined as the monetary equivalent of marginal mortality risk reduction derived from individuals’ revealed preferences regarding trade-offs between minor risk variations and income adjustments [53,54]. This metric has gained widespread application in quantifying the economic burden of public health deterioration caused by air pollution exposure [27,28,29]. Among the prevalent VSL estimation methodologies, the willingness-to-pay (WTP) approach has been employed extensively. WTP reflects the maximum monetary amount that individuals would expend for marginal reductions in mortality risk [55,56], exhibiting significant variation across age cohorts because of differences in remaining life expectancy, quality-adjusted life years, accumulated wealth, and socioeconomic positioning [57,58]. In contrast to conventional studies that applied uniform VSL estimates across all demographic strata to assess air pollution-related mortality costs, Yin et al. [35] pioneered an age-stratified VSL framework to evaluate the health economic burdens attributable to ambient PM2.5. Their methodology incorporates per capita GDP as a key parameter in age-specific VSL computations. Nevertheless, in this study, GDP was replaced by disposable income metrics through the application of an income-risk valuation approach, allowing a more robust economic characterization of health loss to be obtained. This refinement aligns with the fundamental economic premise that an individual’s WTP for mortality risk mitigation exhibits a positive elasticity with respect to personal income growth [27]. By integrating the age-stratified VSL framework [35] and income-risk valuation approach [27], the economic losses attributable to PM2.5 and O3 pollution can be calculated as:
A g e _ V S L Y i , y , a = V S L 0   ×   I N C O M E i , y I N C O M E 2019 e   ×   L E y , a L E m e a n   ×   w a w m e a n a = a g e T P y , a × ( 1 + 1 / ( 1 + γ ) T a 1 )
E L _ A g e _ V S L i , y , a = D i , y , a × t = 0 T a 1 A g e _ V S L Y i , y , a + t ( 1 + γ ) t
where A g e _ V S L Y i , y , a represents the city-, year-, and age-specific value of a statistical life year, and E L _ A g e _ V S L i , y , a denotes the corresponding economic loss calculated using the age-adjusted value of a statistical life year measure; D i , y , a denotes the premature deaths related to PM2.5 or O3 pollution;   V S L 0 (1.5 million CNY/person) is the baseline VSL of Chinese residents in 2019 [53]; I N C O M E 2019 (30733 CNY) is the national PDI of all Chinese residents in 2019 while I N C O M E i , y is the PDI of city i in year   y ; L E y , a is the age- and year-specific life expectancy of Chinese and L E m e a n refers to all ages-average life expectancy of Chinese; w a is the average wealth at age a , w m e a n is the average wealth, derived from Southwestern University of Finance and Economics [59] (Table A5); T is the age of expected death at age a ; λ is the elastic coefficient of WTP, implying the change of public’s willing to pay when the PDI increases by a certain extent. Referring to Qu et al. [60], λ was set to be 0.8 in this study.
As implemented in Equations (6) and (7), this study directly incorporates city-specific and year-specific PDI data to explicitly account for inter-city economic disparities in estimating pollution-related economic losses, thereby capturing both spatial heterogeneity and temporal dynamics in economic valuation.

2.5. The Contributions of Different Driving Factors

The decomposition analysis was used to quantify the relative contributions of key driving factors to variations in both PM2.5- and O3-attributable health burdens and their associated economic impacts.
For mortality impacts, four principal driving factors were examined: changes in exposure level (EXP), population aging (AGE), population growth (POP), and reduced baseline mortality rate (MOR). Referring to [61], the changes in pollution-related deaths can be expressed as:
D = f = 1 4 D f
where D denotes changes in PM2.5- or O3-attributable annual premature deaths; f refers to the four driving factors mentioned above; D f represents the f -driven death changes.
Following the GBD decomposition analysis [61], a stepwise substitution approach, transitioning each factor from its 2015 value to its 2023 counterpart, was employed to incrementally quantify the impacts of changes in each of these four factors on the change in premature mortality through sensitivity analysis. Technically, the decomposition with four factors has 24 decomposition sequences. For instance, one possible sequence to decompose changes between year 2015 to 2016 is expressed as:
D 2015 = E X P 2015 × A G E 2015 × P O P 2015 × M O R 2015
D 2015 = E X P 2016 × A G E 2015 × P O P 2015 × M O R 2015
D 2015 = E X P 2016 × A G E 2016 × P O P 2015 × M O R 2015
D 2015 = E X P 2016 × A G E 2016 × P O P 2016 × M O R 2015
D 2016 = E X P 2016 × A G E 2016 × P O P 2016 × M O R 2016
where D 2015 and D 2016 represent the premature deaths related to pollution exposure in year 2015 and 2016. The contribution of EXP to the change in pollution-related mortality from 2015 to 2016 can be computed by D 2015 D 2015 ; Similarly, contributions of AGE, POP, and MOR can be computed via D 2015 D 2015 , D 2015 D 2015 , and D 2016 D 2015 , respectively.
For pollution-related economic impacts, the same method was used to quantify the contributions of different driving factors. Especially, an additional factor, i.e., per capita disposable income growth (PDIG), was incorporated into the analytical framework.
It should be noted that the decomposition sequence introduced potential path dependency into the results. Therefore, the mean of all sequences was taken as the final contribution estimate. This comprehensive treatment ensures robust and sequence-invariant attributions of the driving factor influences.

3. Results

3.1. PM2.5 and O3 Pollution Exposure and the Relevant Premature Deaths

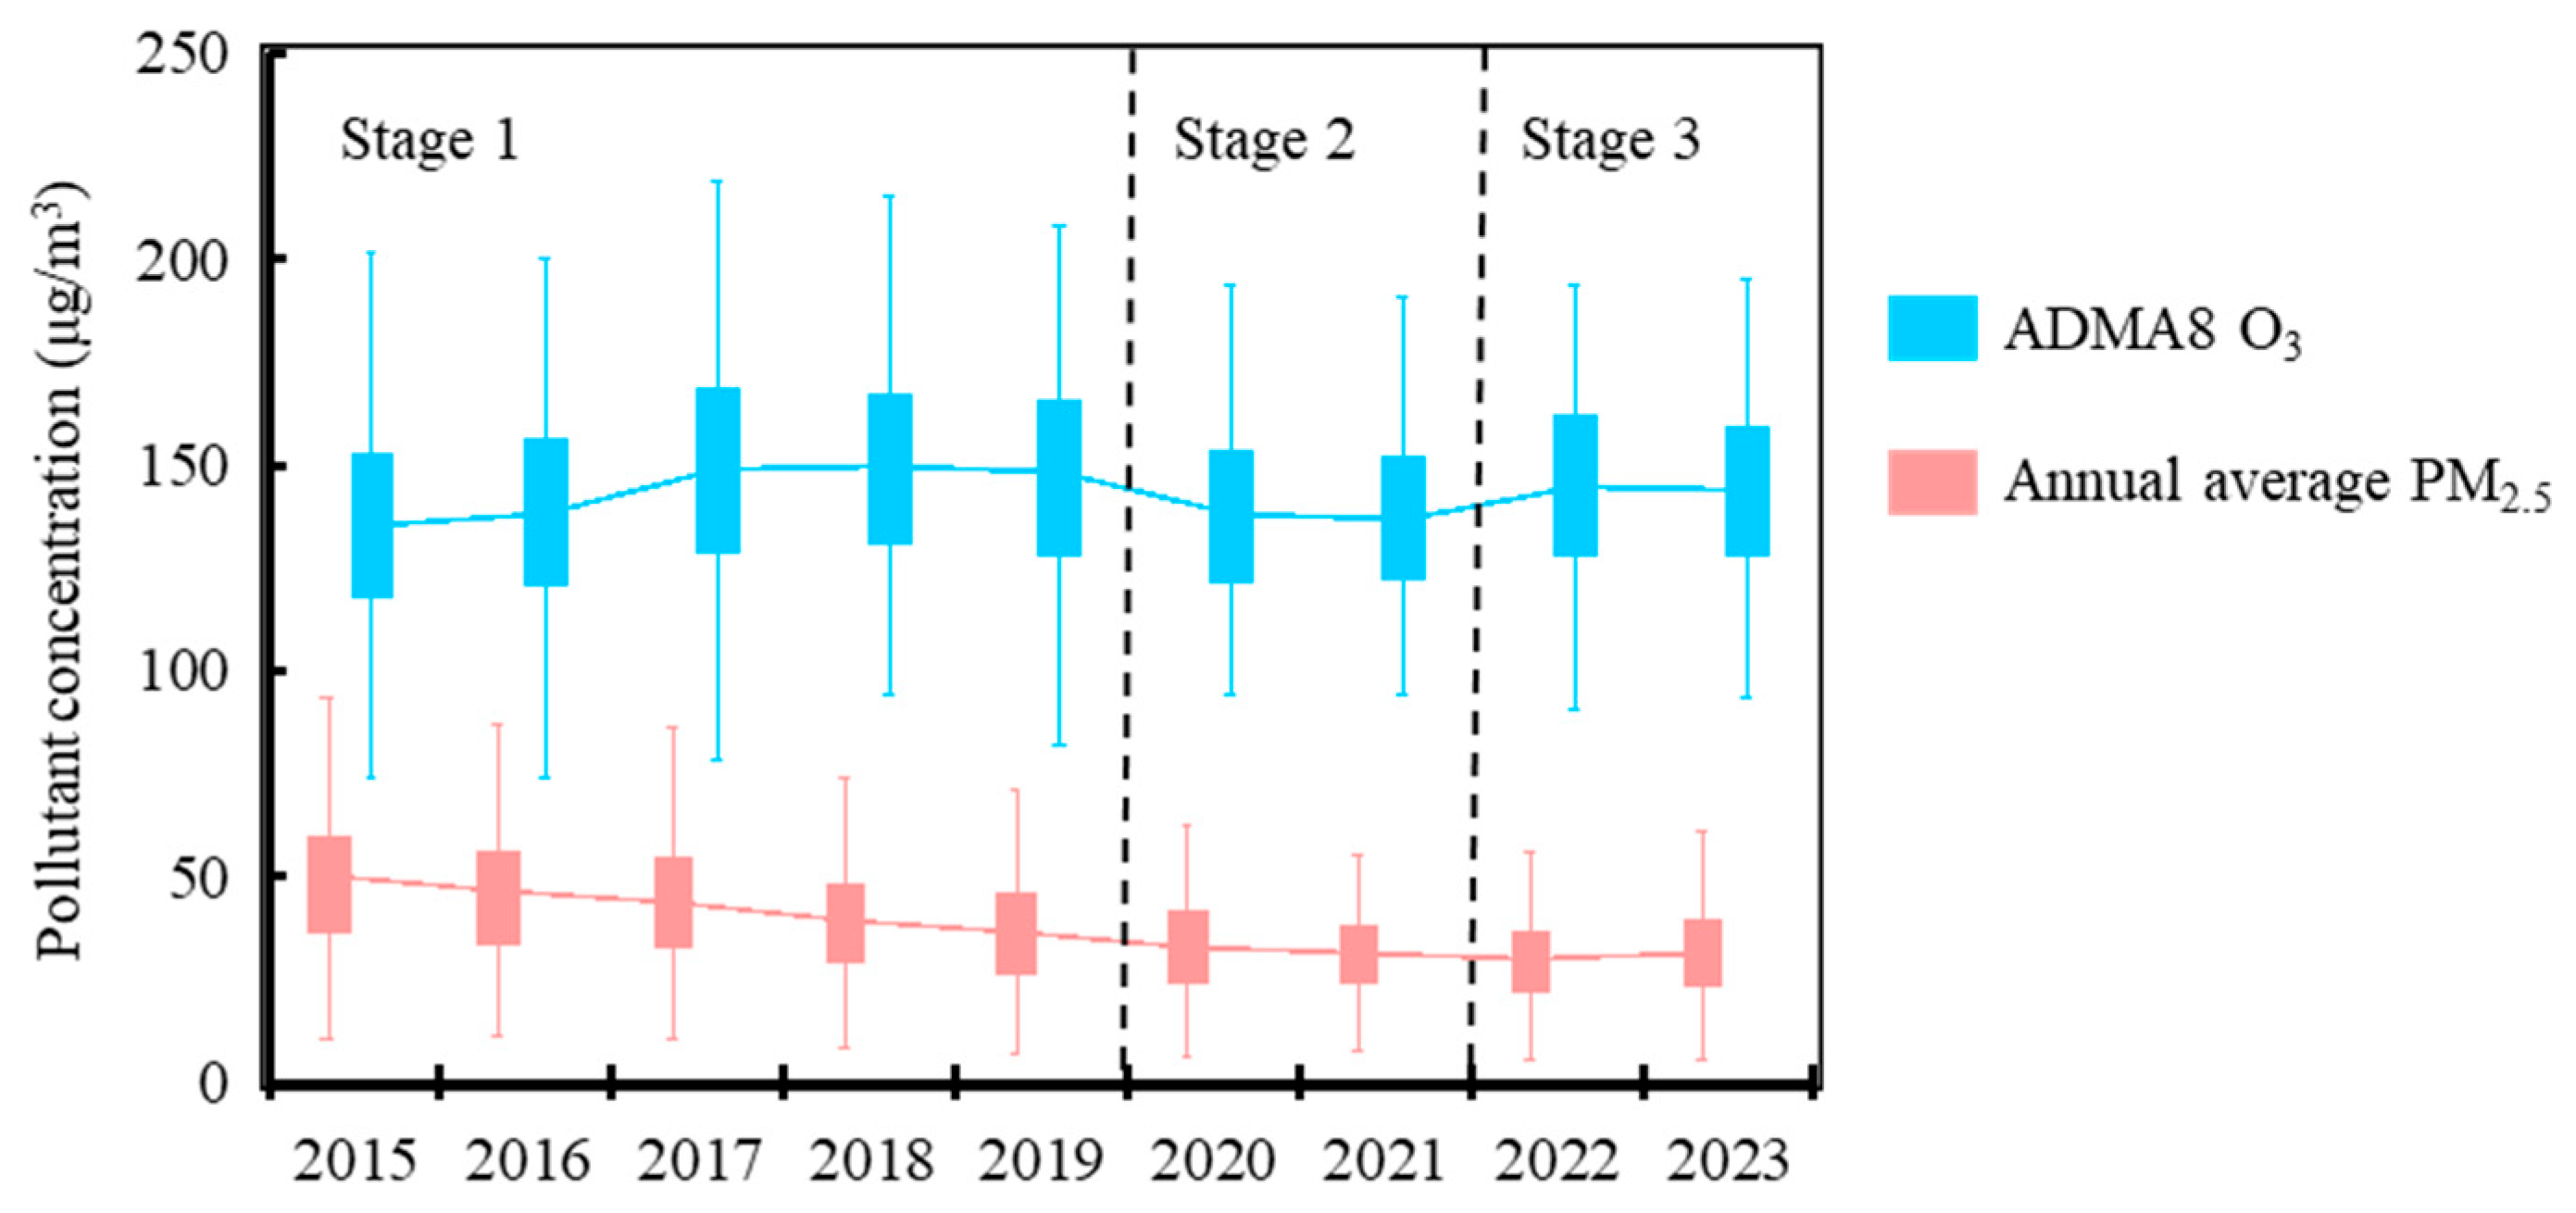
The implementation of rigorous air quality improvement policies, particularly the Three-Year Action Plan for Winning the Blue-Sky Defense Battle (hereafter referred to as the Three-Year Plan), has yielded significant mitigation of PM2.5 pollution across China. Empirical data demonstrate a 36% reduction in national PM2.5 concentrations from 2015 to 2023, with annual mean levels consistently remaining below the World Health Organization (WHO) Interim Target-1 threshold (35 μg/m3) since 2020. The number of cities that achieved compliance with WHO standards exhibited a substantial increase from 74 to 207 during the study period. In marked contrast to the PM2.5 reduction trajectory, O3 pollution displayed an opposing temporal pattern. The AMDA8 O3 concentration across Chinese cities increased from 135 μg/m3 in 2015 to 146 μg/m3 in 2017 and has maintained this elevated level throughout 2019. The enforcement of COVID-19 containment policies in 2020 triggered an immediate decrease in AMDA8 O3 to 136 μg/m3, which subsequently rebounded to 145 μg/m3 in 2022 owing to the ease of mobility restrictions and industrial resumption. Notably, PM2.5 improvements and O3 deteriorations were concurrently recorded in approximately 60% of the monitored cities (encompassing 58% of the national population) during 2015–2023. The spatial and temporal distributions of annual PM2.5 and AMDA8 O3 concentrations across 333 Chinese cities are presented in Figure A2, with corresponding statistical descriptors provided in Table A6 and Table A7.
The divergent pollution trends were accompanied by opposing trajectories in PM2.5- and O3-attributable health burdens during 2015–2023. Based on the COVID-19 pandemic timeline and the assessment results, the study period was divided into three distinct phases: 2015–2019 (pre-pandemic), 2020–2021 (pandemic transition), and 2022–2023 (post-pandemic recovery). Figure 1 illustrates the temporal evolution of pollution-related premature mortality at both national and regional scales regional scales across these phases, with particular focus on five major urban agglomerations. Nationally, PM2.5-associated premature deaths exhibited a consistent decline during the first two stages. The first stage (2015–2019) witnessed a 10% reduction from 2722.8 thousand (95% CI: 2518.4–2923.0) to 2459.4 thousand (95% CI: 2255.6–2661.9), followed by a further 6% decrease to 2308.4 thousand (95% CI: 2107.1–2510.7) in the second stage (2020–2021). Notably, two significant inflection points emerged: approximately 50% of the 2015–2019 mortality reduction occurred between 2017 and 2018, while the 2019–2020 decline coincided with marked improvements in PM2.5, during the COVID-19 containment measures. The third stage (2022–2023) demonstrated more complex dynamics, with PM2.5-related mortality firstly decreasing to 2276.6 thousand (95% CI: 2073.9–2481.2) in 2022 before rebounding to 2418.3 thousand (95% CI: 2205.7–2632.5) in 2023, mirroring contemporaneous fluctuations in PM2.5.
As shown in Figure 1, the temporal evolution of O3-attributable health burdens demonstrates an inverse relationship with PM2.5-related impacts. During the first stage (2015–2019), O3-induced premature mortality exhibited a substantial 60% increase from 202.2 thousand (95% CI: 148.9–256.0) to 326.0 thousand (95% CI: 261.2–388.4), effectively offsetting approximately 50% of the concurrent PM2.5-related health gains. The pandemic-induced emission reductions during 2020–2021 (second stage) temporarily reversed this trend, yielding a 7% decline in O3-attributable mortality to approximately 300 thousand cases. However, the post-pandemic economic recovery in 2022 precipitated a rapid resurgence of O3 pollution, driving the associated premature mortality to 366.0 thousand (95% CI: 297.8–431.4), exceeding pre-pandemic levels. Notably, while O3 concentrations stabilized in 2023, mortality continued to rise to 377.7 thousand (95% CI: 309.0–443.5), attributable to demographic factors including population aging. The analysis revealed that nearly 60% of the cumulative health benefits achieved through PM2.5 reduction during 2015–2023 were negated by concurrent O3 pollution deterioration.
The five major urban agglomerations consistently accounted for 43–49% of China’s aggregate PM2.5- and O3-induced premature mortality annually (see Figure 1). Among these regions, the 2+26 Cities exhibited the most severe atmospheric pollution and consequently bore the greatest health burden, representing 16–17% of nationwide pollution-attributable premature mortality, whereas the PRD demonstrated the most favorable air quality conditions and the lowest mortality impacts. With the exception of the FWP, the other four major urban agglomerations maintained a consistent downward trend in PM2.5 concentrations through 2022, whereas the FWP displayed a marked 39% increase in PM2.5 pollution levels accompanied by a 15% rise in associated mortality during 2015–2017. Regarding O3 pollution, all five regions exhibited a distinct triphasic temporal pattern: during the first stage (2015–2019), FWP experienced the most dramatic O3 pollution escalation with attributable premature mortality surging by nearly 200%, while the 2+26 Cities and PRD regions showed approximately two-fold increases in O3-related fatalities; in the second stage (2020–2021), despite pandemic-induced O3 concentration reductions across all regions, the corresponding mortality declines were limited, particularly in the PRD, CYU, and FWP; and during the third stage (2022–2023), CYU demonstrated the most rapid O3 pollution rebound with a 12% increase in AMDA8 O3 concentrations, driving a 78% surge in related mortality, while the 2+26 Cities, YRD, and FWP regions experienced increases of 25%, 25%, and 20%, respectively.

3.2. PM2.5- and O3-Related Economic Impacts

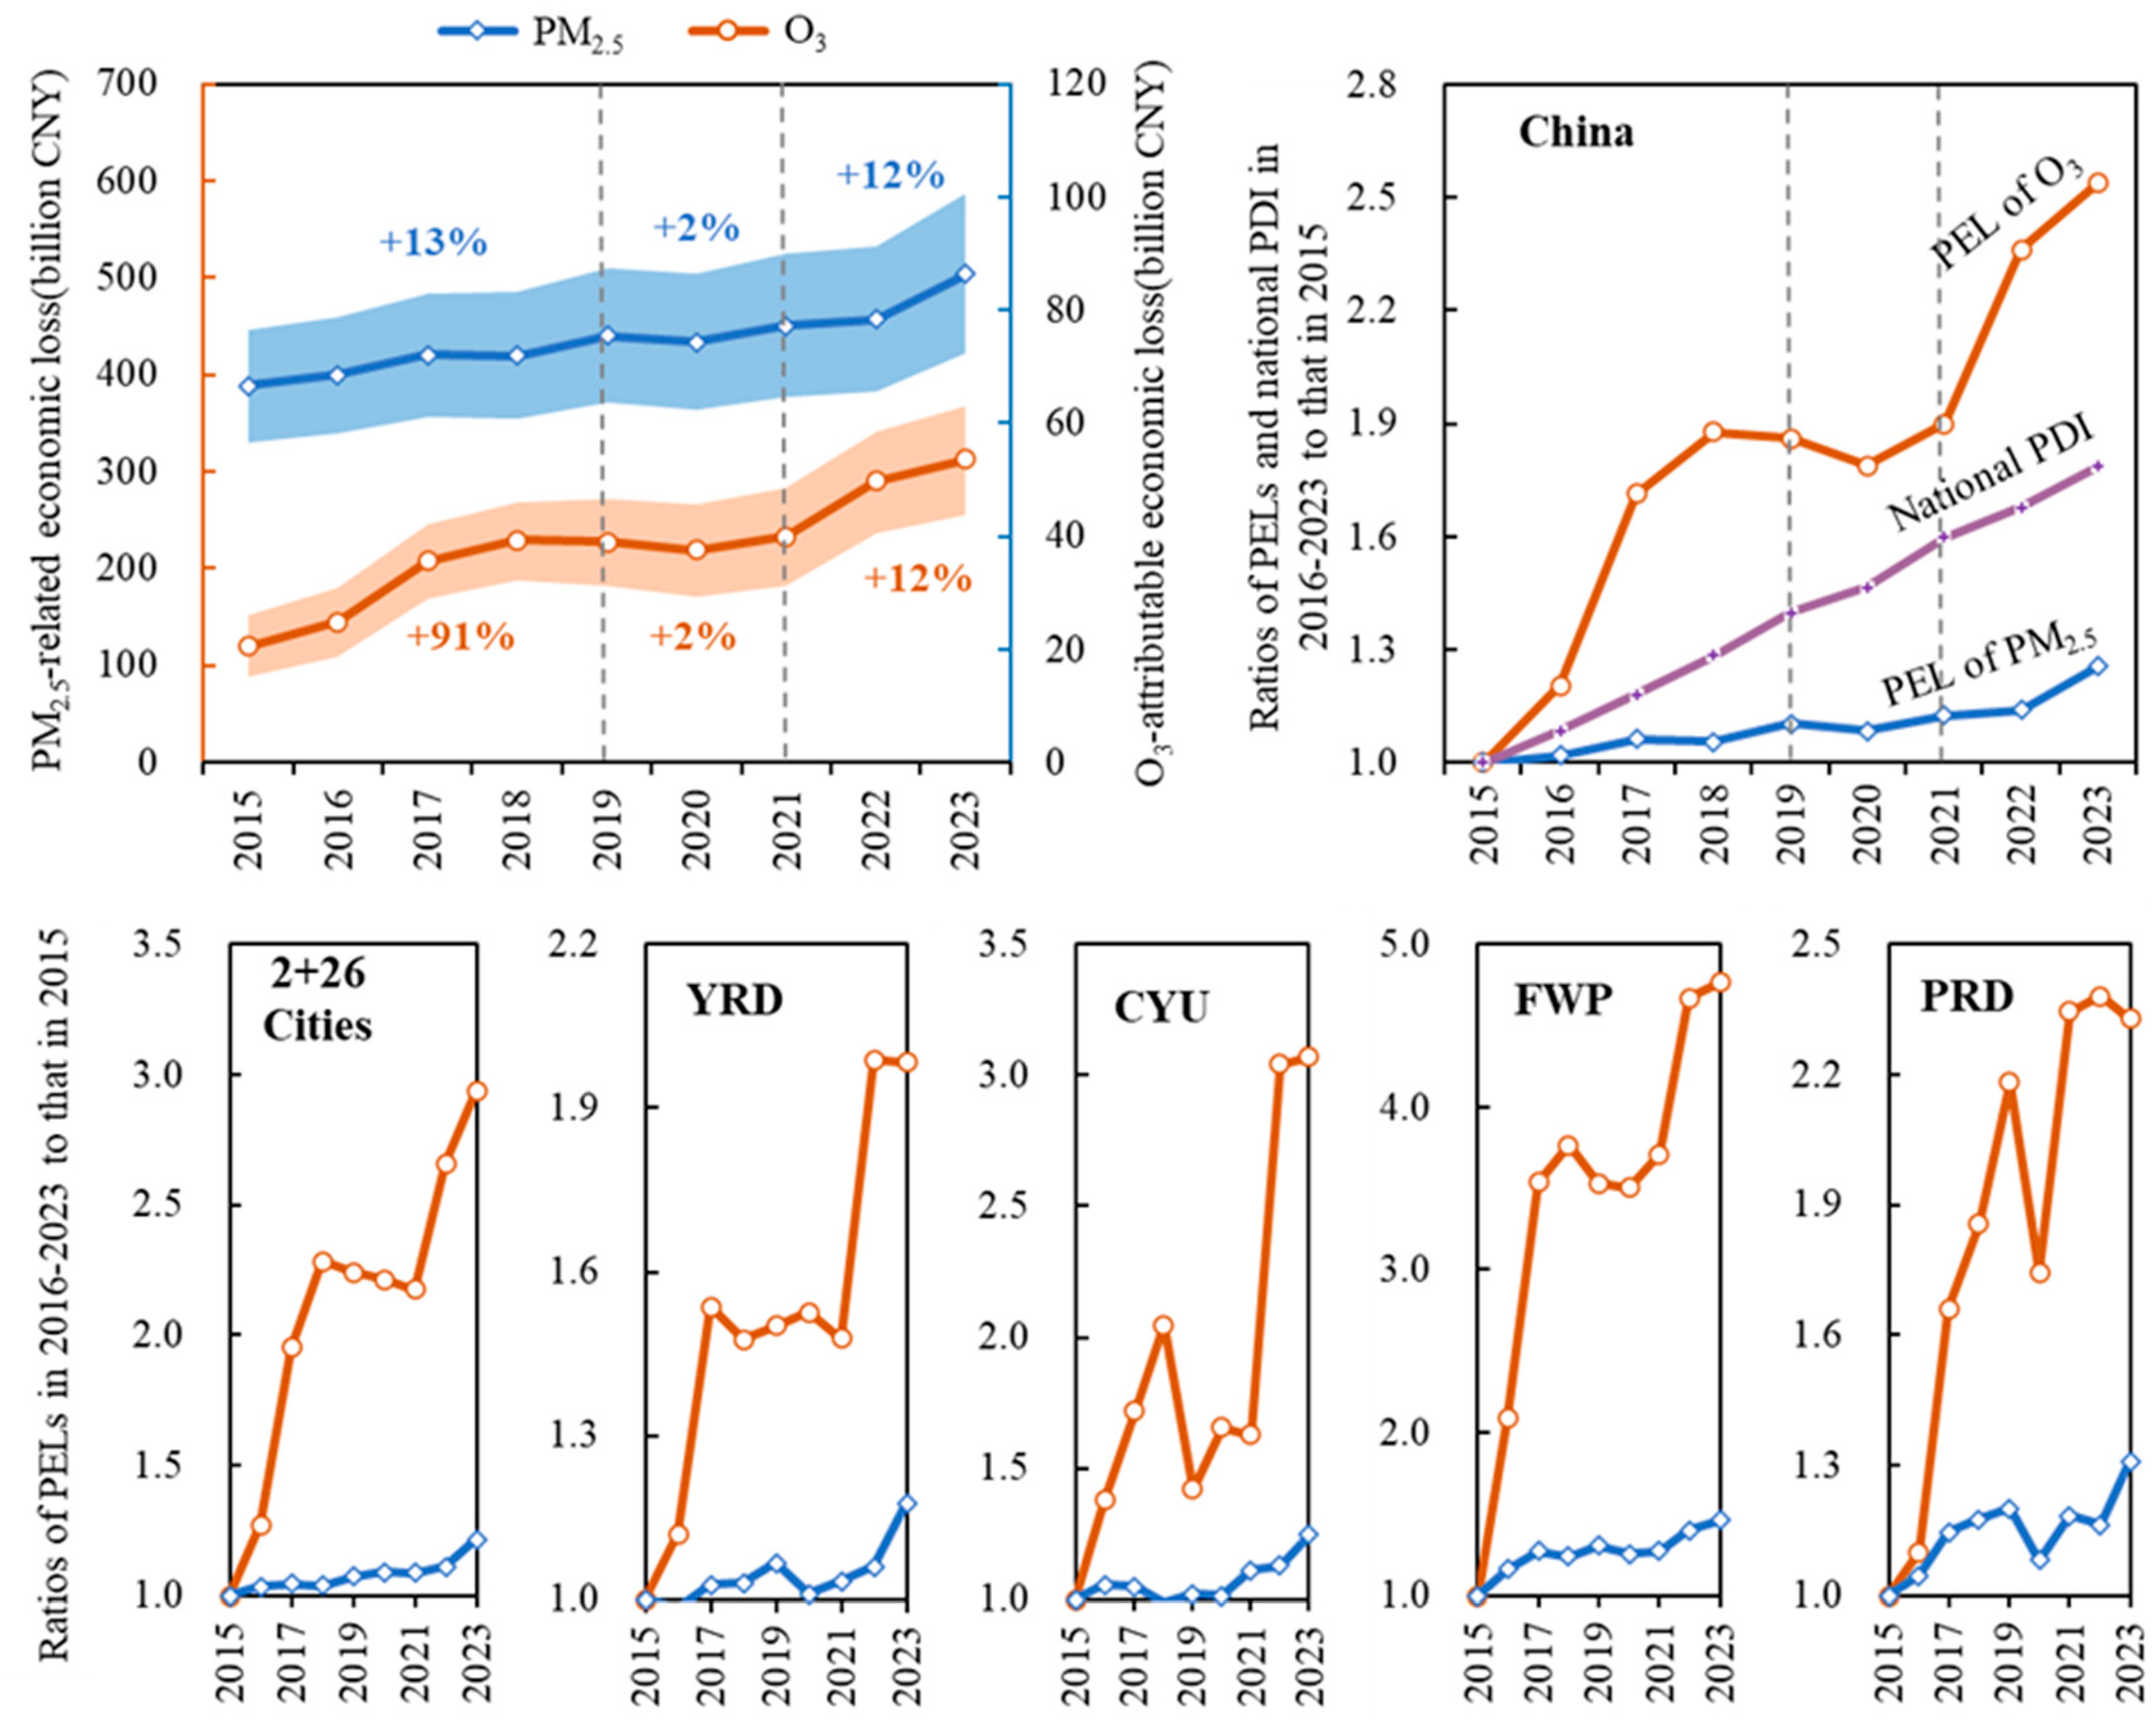
During the 2015–2023 period, China exhibited contrasting trends between air pollution reduction and associated economic impacts. While PM2.5 concentrations and related health burdens decreased, the estimated economic losses attributable to PM2.5-induced premature mortality rose from 389.1 (95% CI: 328.5–447.0) billion CNY to 504.2 (95% CI: 420.1–586.6) billion CNY, representing a 30% increase primarily driven by growth in residents’ disposable income. Although O3-related economic losses remained substantially lower in absolute terms compared to PM2.5, their relative increase was markedly more pronounced, with national totals escalating from 20.5 (95% CI: 15.1–25.9) billion CNY to 53.6 (95% CI: 43.9–62.9) billion CNY—an increase exceeding 150%. As illustrated in Figure 2 (top left), the temporal patterns differed significantly between pollutants: PM2.5-related economic losses grew predominantly during the first (2015–2019, +13%) and third stages (2021–2023, +12%), whereas O3-related losses showed the most dramatic increase (+90%) in the first stage. The pandemic-induced lockdown period (2020–2021) temporarily moderated these trends, with both PM2.5- and O3-associated economic impacts increasing by only 2% during this second stage, benefiting from improved air quality.
A comparative analysis of PM2.5- and O3-related long-term economic impacts was conducted, with differential trends relative to per capita disposable income growth visualized in Figure 2 (top right). Nationally, while PDI demonstrated a consistent annual growth of 5–9%, PM2.5-related per capita economic losses (PELs) reached 324 CNY/person by 2022, exhibiting modest annual fluctuations (−2% to +5%) that significantly lagged PDI growth. In contrast, O3-induced PELs displayed markedly different dynamics, increasing by over 150% nationally during the study period and substantially outpacing both PDI growth and PM2.5-related PEL trends. The temporal evolution of O3-related PELs followed distinct stages: a first escalation from 15 CNY/person to 28 CNY/person during 2015–2019, followed by continued growth to 35 CNY/person by 2022. Notably, both pollutant categories exhibited significant PEL increases in 2023 (PM2.5: +10%; O3: +8%), corresponding directly to deteriorating air quality conditions and associated health impacts. This parallel acceleration suggests emerging convergence in pollution-related economic pressures despite their historically divergent trajectories.
The 2+26 Cities and YRD regions consistently emerged as the most severely impacted, collectively representing approximately one-third of China’s total annual pollution-related economic losses. The observed reductions in PM2.5- and O3-related PELs across the 2+26 Cities, YRD, FWP, and CYU since 2017 (Figure 2, bottom) coincide with the implementation period of targeted pollution control policies (e.g., the Action Plan and Three-year Plan). Notably, all five urban agglomerations exhibited significantly faster growth in O3-related PELs compared to PM2.5-induced losses prior to this period, suggesting potential policy-driven mitigation effects that warrant further investigation. Following the relaxation of COVID-19 containment measures, worsening O3 pollution and associated mortality increases drove renewed PEL growth in 2022 across the four regions (excluding the PRD). This resurgence was particularly pronounced in CYU, where O3-related PELs surged by more than 87%, reflecting the region’s heightened vulnerability to the post-pandemic pollution rebound.

3.3. Effects of Driving Factors

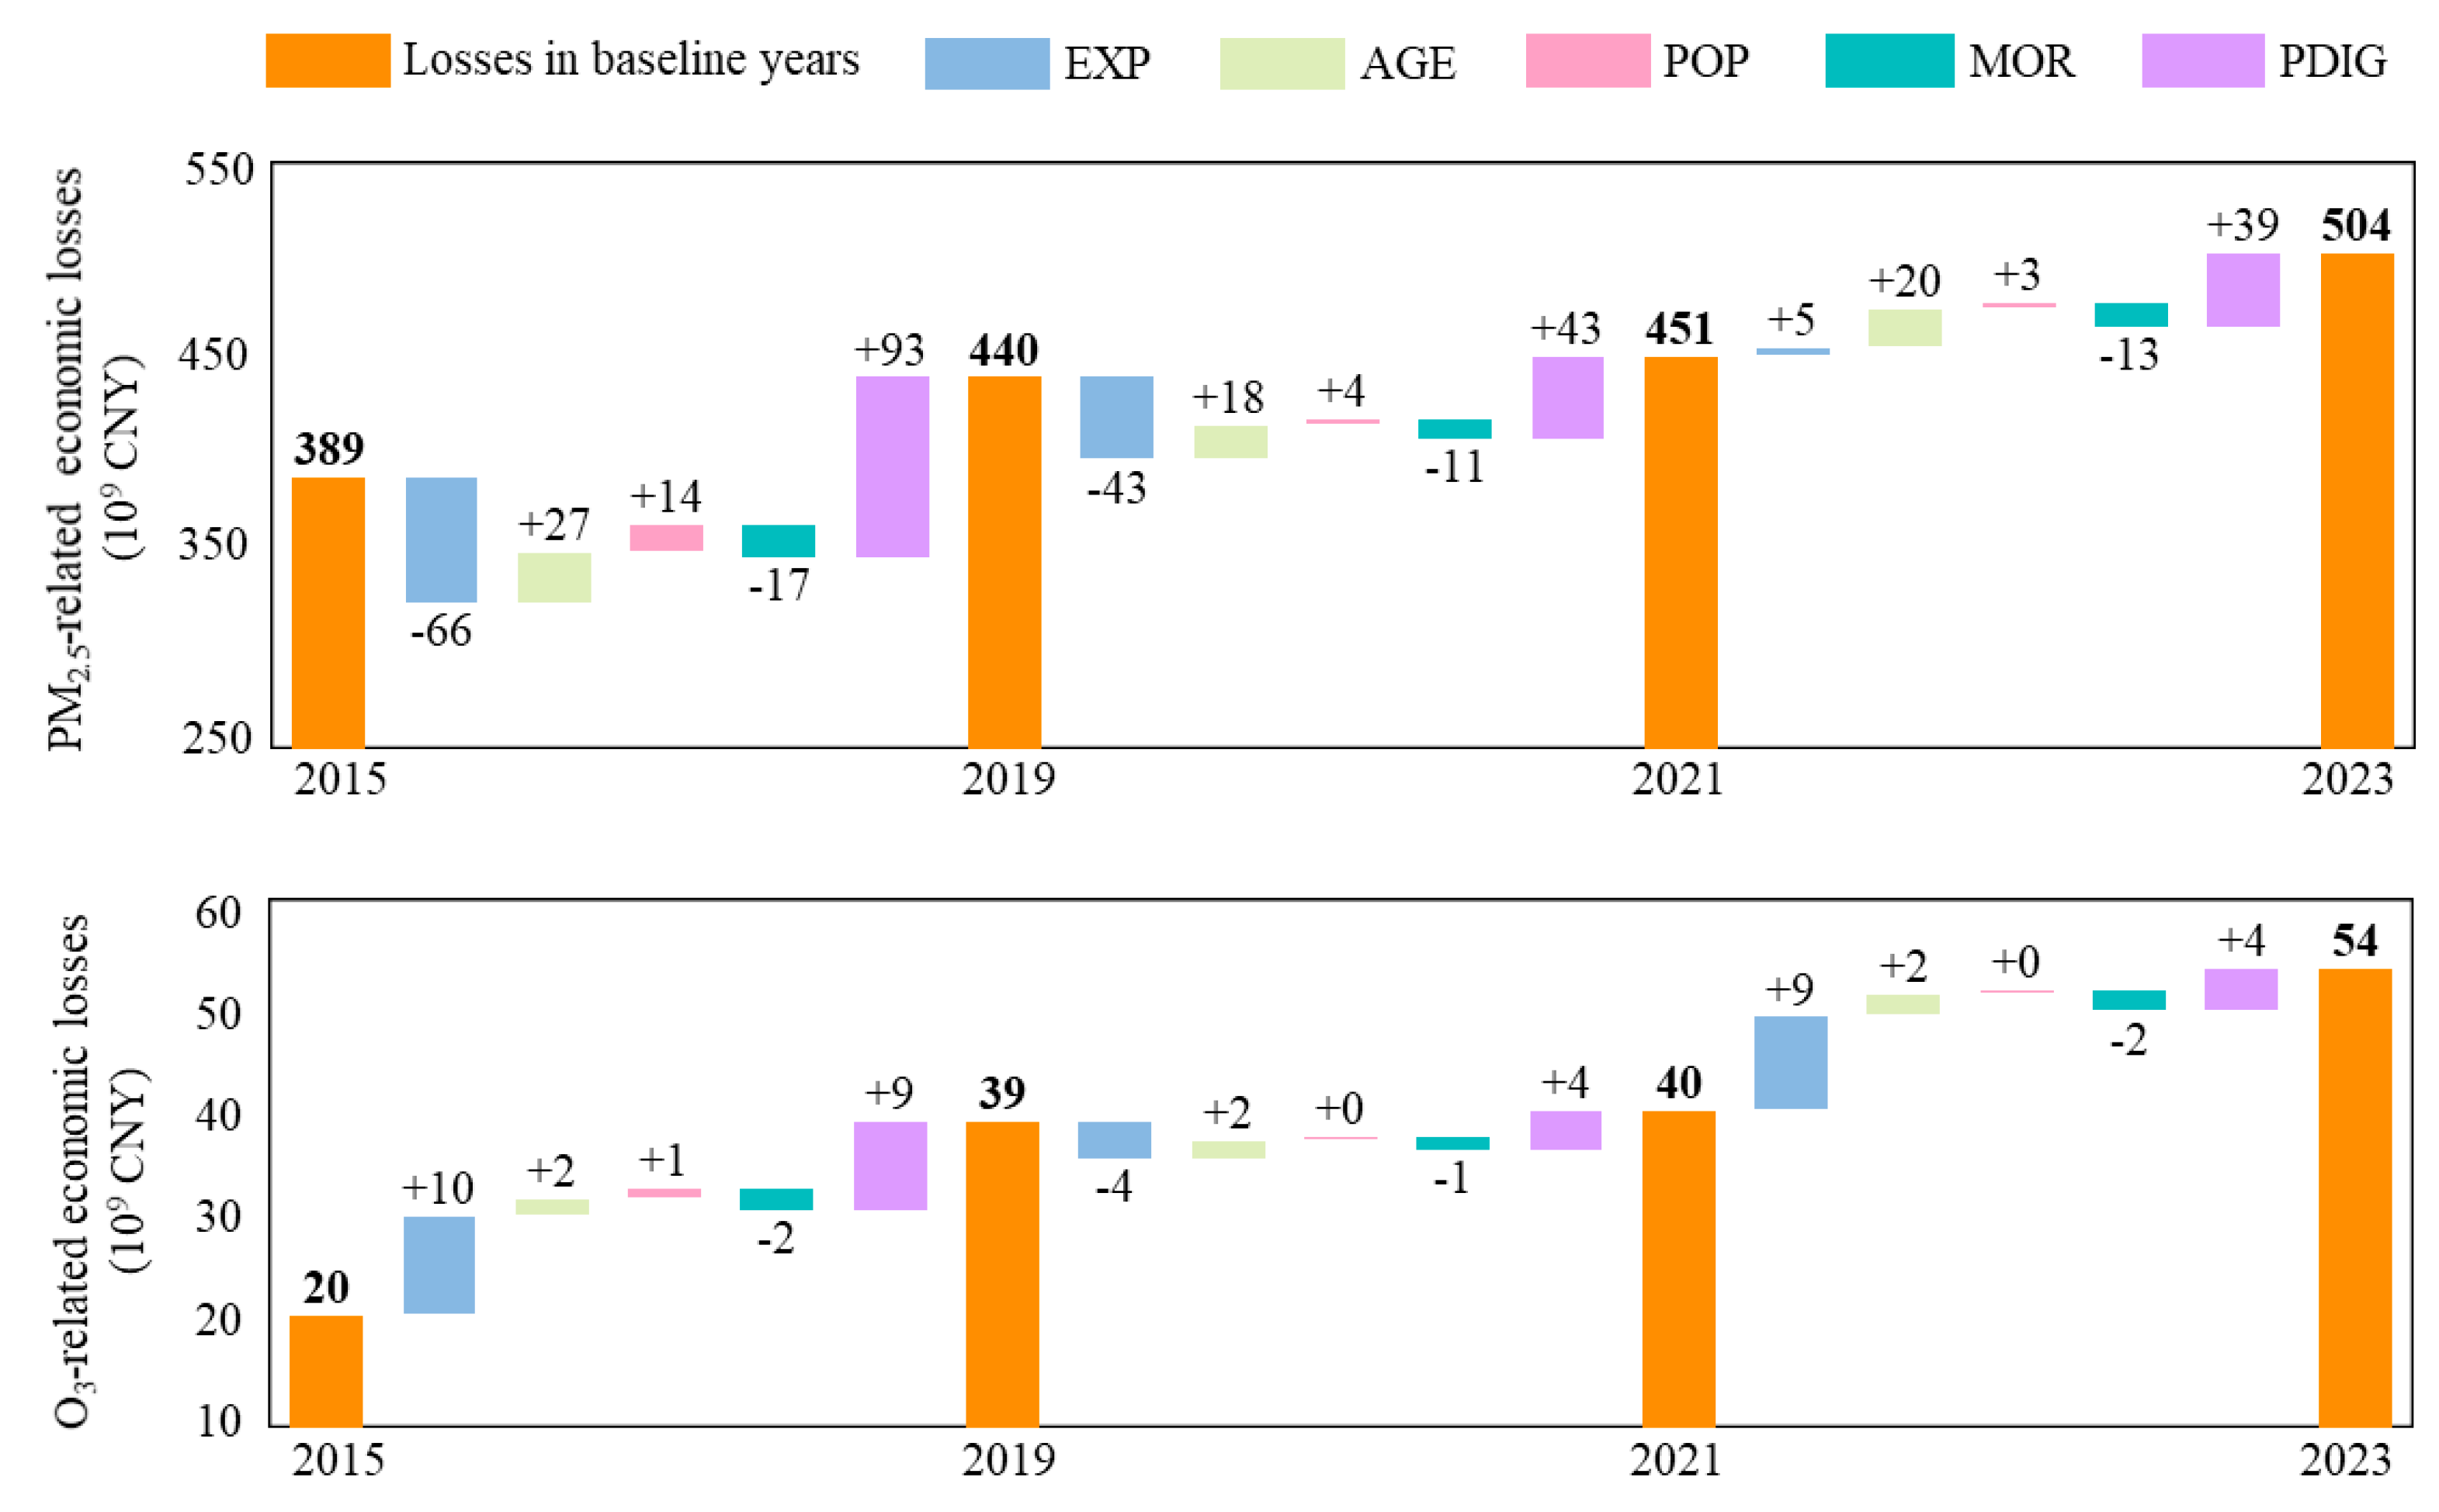
A quantitative decomposition analysis was conducted to assess the relative contributions of five driving factors, that is, EXP, AGE, POP, MOR, and PDIG (for economic impacts exclusively), to variations in PM2.5- and O3-attributable health and economic burdens across the three study stages. Figure 3 and Figure 4 show the decomposition results.
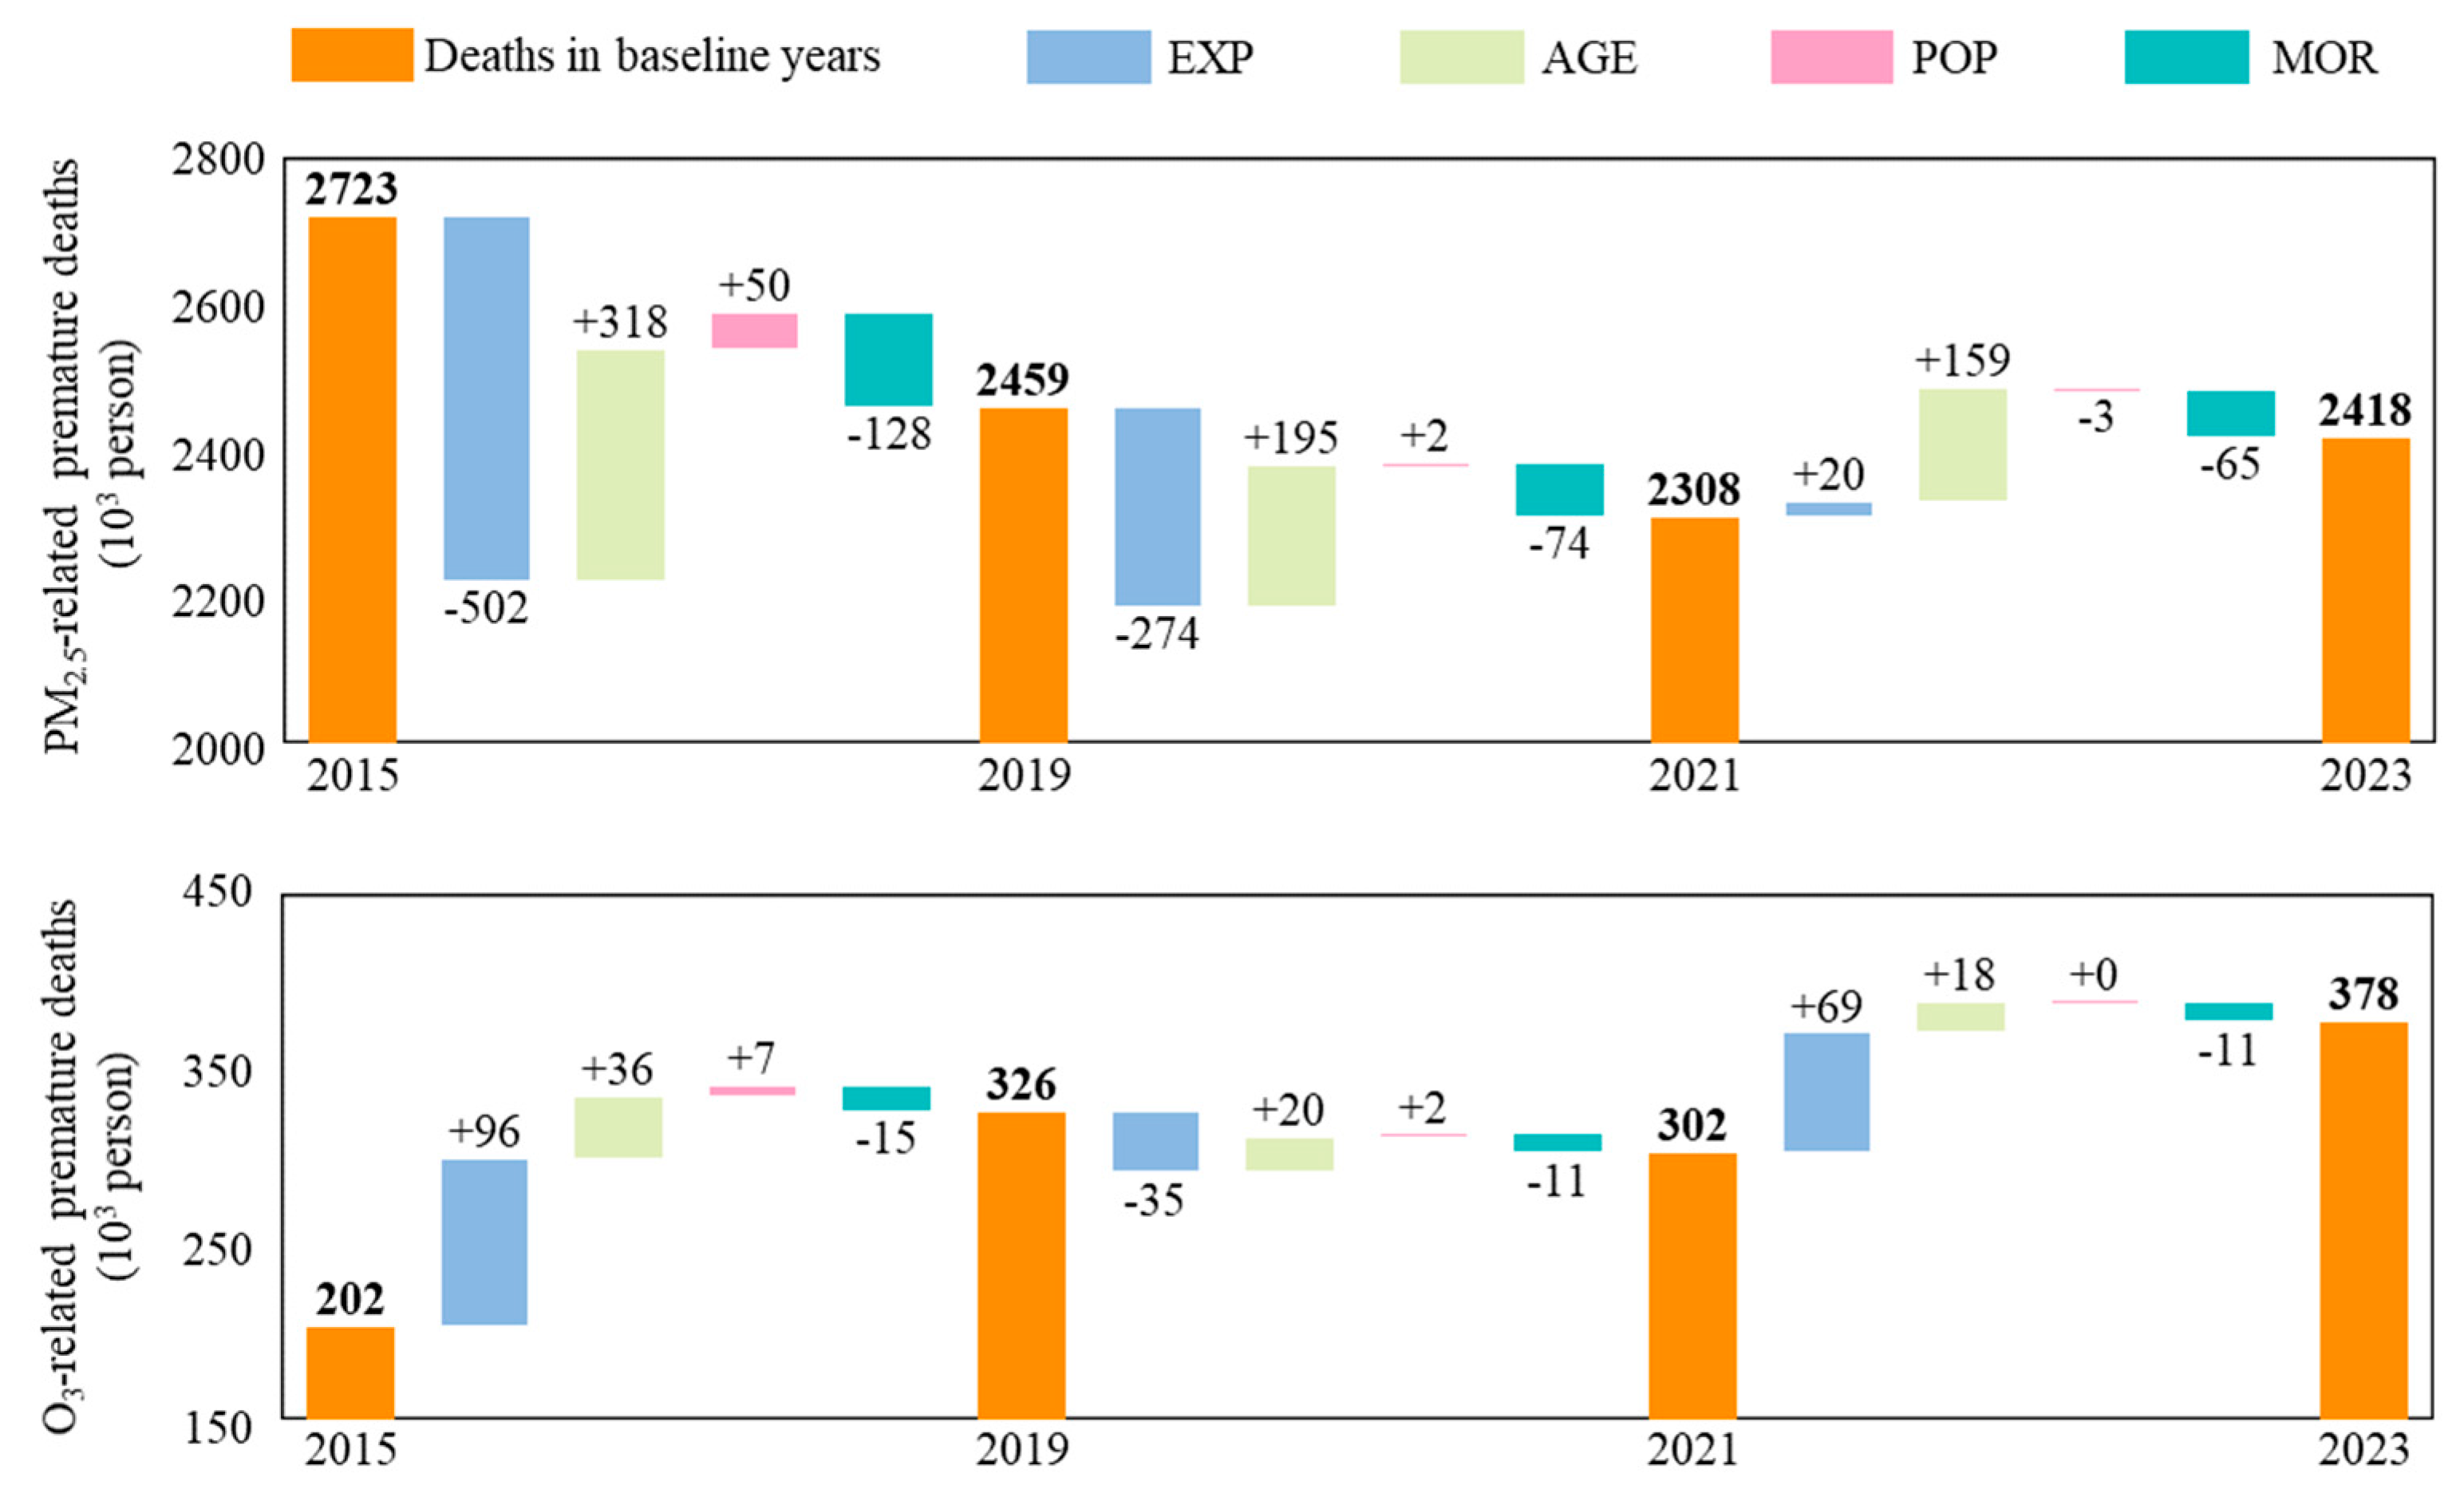
EXP was the predominant determinant of pollution-associated premature mortality (Figure 3). The reduction in PM2.5 exposure concentrations during 2015–2019 accounted for a decrease of 502 thousand PM2.5-attributable premature deaths—nearly double the net mortality change observed during this period. Conversely, elevated O3 exposure over the same timeframe generated incremental 96 thousand O3-related fatalities, equivalent to approximately 48% of the 2015 baseline value. During the 2019–2021 stage, EXP maintained the dominant influence, with declining PM2.5 and O3 exposures producing mortality reductions of 274 thousand and 35 thousand cases. Subsequently, the resurgence of O3 pollution exposure during 2021–2023 has contributed to an additional 69 thousand premature deaths.
Population aging represents a demographic shift toward greater proportions of vulnerable age cohorts exhibiting heightened mortality risk when exposed to air pollution, consequently increasing the annual air pollution-induced premature mortality in China. Quantitative analysis revealed that population aging contributed substantially to PM2.5-attributable mortality, with incremental fatalities of 318 thousand (2015–2019), 195 thousand (2019–2021), and 159 thousand (2021–2023) during the respective study periods (see Figure 3). Notably, during 2021–2023, AGE surpassed EXP as the dominant driver of increasing PM2.5-related mortality. Similarly, AGE emerged as the secondary influential factor (following EXP) for O3-attributable mortality, accounting for additional premature deaths of approximately 36 thousand, 20 thousand, and 18 thousand across the respective study periods.
Advances in healthcare infrastructure and medical technologies have contributed to the reduction of baseline mortality rates, thereby substantially mitigating premature mortality attributable to PM2.5 and O3 pollution exposure. This phenomenon was quantitatively demonstrated by MOR-driven reductions of 128 thousand and 15 thousand in PM2.5- and O3-attributable premature deaths, respectively, during the 2015–2019 period. Furthermore, the decomposition analysis revealed that POP exerted a comparatively minimal influence on pollution-related mortality trends relative to other determinants, particularly during recent years when China’s demographic growth has experienced a marked deceleration.
As illustrated in Figure 4, PDIG emerged as the principal determinant underlying the persistent escalation of PM2.5-related economic losses during the 2015–2023 period. In the first stage (2015–2019), a net economic loss of 93 billion CNY was generated by PDIG, offsetting 1.4-fold the 66 billion CNY gain from PM2.5 abatement. The subsequent stage (2019–2021) witnessed PDIG-induced economic losses of 43 billion CNY, which fully neutralized the gains from continued pollution mitigation. By 2023, the PDIG further augmented PM2.5-related economic losses by 39 billion CNY relative to 2021 levels. This pattern was similarly manifested in O3-related economic impacts, where PDIG exerted a comparable influence on EXP. In the first stage (2015–2019), the observed 19 billion CNY rise in O3-related losses was primarily induced by PDIG and EXP. During the second stages (2019–2021), the PDIG contributed an incremental 4 billion CNY in O3-attributable economic losses, a magnitude precisely offsetting the contemporaneous reduction in economic losses driven by the decreased O3 exposure level (EXP). Subsequently, the 2021–2023 period was characterized by concurrent EXP-driven (9 billion CNY) and PDIG-induced (4 billion CNY) increases in O3-related economic losses.

4. Discussion

This study systematically examined the spatiotemporal evolution and underlying determinants of PM2.5- and O3-attributable health burdens and the associated economic costs across Chinese cities from 2015 to 2023. Decomposition analysis was performed to quantify the contributions of five determining factors including exposure level, population aging, population size, baseline mortality rates, and per capita disposable income to variations in PM2.5- and O3-attrbutable health and economic impacts.
The results demonstrate a general declining trend in annual PM2.5-attributable premature deaths, decreasing by 11% from 2722.8 thousand cases in 2015 to 2418.3 thousand in 2023. In contrast, O3-related premature deaths increased by 87% from 202.2 thousand to 377.7 thousand during the same period. From 2015 to 2023, the deteriorating health burden from O3 pollution offset approximately 60% of the health gains achieved through PM2.5 reduction. Correspondingly, further analysis revealed a different trend in economic losses between the two different pollutants. O3-related per capita economic losses surged by over 150% during the study period, nearly doubling the 80% growth in disposable income, whereas PM2.5-associated losses showed a modest 25% increase. Notably, if it were not for the strict COVID-19 control measures implemented in 2020–2021 which reversed the deterioration trend of ozone pollution [62], PM2.5 and O3, as well as the socio-economic impact of the two, may show a more significant difference trend.
In densely populated and heavily polluted urban agglomerations like 2+26 Cities, YRD, and CYU, air pollution control measures were used to prioritize PM2.5 [63,64], leading to a significant reduction in regional PM2.5 pollution levels. Accordingly, the annual premature deaths attributable to PM2.5 exposure in 2+26 Cities, YRD, and CYU decreased by 17%, 17%, and 11%, respectively, from 2015 to 2023. Concurrently, 60% of the Chinese cities (encompassing 58% of the population) have experienced worsening O3 pollution. This deterioration translated into a 176% national increase in O3-attributable premature mortality from 2015 to 2023, with particularly severe impacts in FWP (248%), CYU (118%), and 2+26 Cities (110%). Even worse, several major urban agglomerations all exhibited accelerated growth in per capita O3-related economic losses following the cessation of COVID-19 restrictions, continuing a pre-pandemic trend of escalating impacts.
The variations in health and economic consequences attributable to PM2.5 and O3 exposure are driven by multiple factors. Among these factors, exposure level and population aging have emerged as the predominant drivers shaping the temporal patterns of PM2.5- and O3-related health impacts. Given the paramount importance of exposure reduction, policymakers should prioritize integrated governance strategies targeting both PM2.5 and O3 pollution, with particular emphasis on coordinated reductions of their common precursors especially like volatile organic compounds (VOCs) and nitrogen oxides (NOx). Current projections suggest that the potential benefits of end-of-pipe control measures will be largely depleted by 2030, necessitating more fundamental interventions such as energy-climate policy integration and economic structural reforms [21,65]. Notably, comprehensive sustainable energy transitions aligned with ambitious climate mitigation targets (e.g., the 1.5 °C warming limit) could potentially reduce China’s PM2.5 exposure levels below 10 μg/m3 (meeting WHO’s interim target-4) by 2060 [66], representing a viable pathway for long-term air quality improvement.
Effective regional air pollution mitigation requires coordinated yet tailored strategies that account for varying pollution characteristics and distinct health-economic impact profiles across cities. Previous research has tried to establish spatial variations in the multi-pollutant formation mechanisms. For instance, PRD and YRD regions were originally characterized as VOC-sensitive O3 regimes [46,67,68]. However, emerging evidence suggested that recent VOC emission controls may have transitioned the YRD and adjacent areas toward NOx-sensitive or mixed-sensitivity conditions [69,70]. This evolving sensitivity underscores the need for updated VOC-NOx-O3 sensitivity analyses to inform targeted O3 mitigation policies. Meanwhile, for China’s most heavily polluted regions, including the 2+26 Cities and FWP, where PM2.5 concentrations remain elevated despite recent improvements, comprehensive air quality management strategies that address both PM2.5 and O3 pollution remain critically important. From another perspective, implementing a cross-regional ecological compensation mechanism, whereby municipalities demonstrating concurrent deterioration in both PM2.5 and O3 levels provide financial transfers to those showing opposite trends, could simultaneously advance nationwide air quality improvements while addressing regional disparities.
Older individuals demonstrate disproportionate susceptibility to air pollution effects, and coupled with China’s sustained population aging process [35,71,72], this demographic transition has markedly increased both the public health burden and economic losses attributable to air pollution exposure. Results of this study reveal that, during 2021–2023, population aging exerts a driving effect on air pollution-attributable premature deaths that is much stronger than exposure level change. This underscores the urgent need for age-adaptive safeguards, such as targeted air pollution alert systems for elderly communities, to mitigate aging-driven health burdens and associated economic losses. Such interventions are particularly critical in cities where aging rates exceed 20%. Proactive policies aligning with Sustainable Development Goal 10 (Reduced Inequalities) must address the disproportionate vulnerability of aging populations to environmental risks, ensuring equitable health protection amid demographic shifts.
The findings demonstrate strong consistency with previous studies using comparable methodologies while providing new insights. For PM2.5-attributable mortality, the 2015 estimate of 2.722 million premature deaths in China shows general agreement with Burnett et al. [14] (2.47 million) and Lelieveld et al. [73] (2.20 million), with the moderately higher estimate being attributable to the updated city-scale population data from Zhang et al. [45] incorporating China’s Seventh National Population Census. Ozone estimates exhibit greater variability across studies: the 2017 assessment (325 thousand deaths) closely matches Yao et al. [22] (310 thousand) but differs more substantially from Yang et al. [34] (245 thousand) and Maji et al. [29] (74 thousand), reflecting methodological differences in exposure-response modeling. Regarding pollution-related economic losses, the assessment results are not directly comparable with previous studies due to the novel integration of income-risk and age-adjusted VSL methods in this study—an analytical approach not employed in prior research.
Several limitations of this study should be acknowledged, as with any comparable research. First, potential overlap represents an important limitation in multi-pollutant health impact assessments. For O3, a two-pollutant LERM adjusted for PM2.5 was employed, ensuring the assessment results of O3-attributable premature deaths are not affected by PM2.5 interference. The potential overlap originates from the GEMM application for PM2.5-related mortality, where potential O3 interference could theoretically occur. On the one hand, different health endpoints were used in PM2.5- and O3-related mortality estimates. On the other hand, the GEMM, developed through rigorous cohort studies, inherently minimizes O3 confounding with low-uncertainty parameters resistant to pollutant interference. Therefore, any overlap in health impacts between the two pollutants falls within acceptable limits. Second, while our city-scale income adjustments help mitigate regional disparities, the use of a uniform national baseline V S L 0 introduces inherent limitations. Although this approach may modestly underestimate economic burdens in high-income cities and overestimate them in less developed regions, these systematic biases preserve the relative rankings across cities. Most critically, as the same V S L 0 were consistently applied to both PM2.5 and O3 calculations, the comparative assessment of their differential economic impacts remains robust. The primary constraint lies in the absolute valuation of losses rather than their inter-city or inter-pollutant comparisons. Similar to V S L 0 , the application of national-level baseline mortality rates introduces inherent uncertainties in city-scale assessments. This methodological approach primarily affects the spatial dimension of our analysis, potentially attenuating inter-city disparities in absolute mortality estimates. However, it does not compromise the validity of temporal trend comparisons or the relative differences between PM2.5 and O3 impacts, given the fact that baseline mortality rates generally remain relatively stable temporally (e.g., <7% annual variation based on GBD data used here). Third, while city-level annual average concentrations provide nationally consistent metrics, they inherently mask intra-urban exposure heterogeneity. Specifically, this approach cannot capture: (1) pollution hotspots near emission sources, (2) seasonal peaks in pollutant concentrations (particularly relevant for O3), or (3) micro-environmental exposure differences (e.g., indoor vs. outdoor, occupational variations). These limitations likely introduce conservative bias in mortality estimates, as subpopulations experiencing higher exposures are statistically diluted in city-wide averages. Moreover, the lag between time of exposure and death is not considered since this study focuses on comparative analysis of PM2.5- and O3-attributable long-term impacts where influence of lag effects is negligible.

5. Conclusions

This study systematically quantified the health and economic burdens attributable to PM2.5 and O3 pollution across Chinese cities during 2015–2023, while elucidating their divergent trends and underlying determinants. The results revealed an 11% decrease in PM2.5-related premature deaths, but this benefit was partially offset (60%) by an 87% increase in O3-related premature deaths. In addition, the per capita economic loss from O3 exposure increased by 154%, far exceeding China’s 79% growth in per capita disposable income. The findings highlight the need for future air quality management strategies to not only maintain current PM2.5 reduction gains but also implement rigorous O3 control measures. Given the significant variations, locally tailored yet coordinated approaches are imperative to address the distinct air quality challenges faced by different cities and regions. Moreover, the compounding effects of air pollution and population aging demand greater research and policy attention to aging-related environmental vulnerabilities.

Funding

This research received no external funding.

Institutional Review Board Statement

Not applicable.

Informed Consent Statement

Not applicable.

Data Availability Statement

The raw data supporting the conclusions of this article will be made available by the authors on request.

Conflicts of Interest

The author declares no conflicts of interest.

Abbreviations

The following abbreviations are used in this manuscript:
PM2.5Fine particulate matter
O3Ozone
MDA8Maximum daily 8-h average
AMDA8Annual mean of the maximum daily 8-h average
YRDYangtze River Delta
PRDPearl River Delta
FWPFen-Wei Plain
CYUCheng-Yu Urban Agglomeration
GEMMGlobal exposure mortality model
LERMLog-linear exposure-response model
NCDNon-communicable diseases
LRILower respiratory infections
RESPChronic respiratory diseases
CIRCCirculatory diseases
VSLValue of statistical life
WTPWillingness-to-pay
EXPChanges in exposure level
AGEPopulation aging
POPPopulation growth
MORReduced baseline mortality rate
PDIPer capita disposable income
PDIGPer capita disposable income growth
GDPGross domestic product
CNYChinese Yuan
USDUnited States Dollars
GBDGlobal Burden of Disease
WHOWorld Health Organization
CIConfidence interval

Appendix A

Figure A1. Five major urban agglomerations in China.
Sustainability 17 07350 g0a1
Figure A2. Distribution of annual average PM2.5 and AMDA8 O3 concentrations across 333 Chinese cities during 2015–2023.
Sustainability 17 07350 g0a2
Table A1. Baseline mortality rates for noncommunicable diseases plus lower respiratory infections.
AgeYear
201520162017201820192020202120222023
25–290.00026910.00026690.00026530.00026330.00026330.00025820.00025610.00025390.0002517
30–340.00045800.00045530.00045980.00046200.00045940.00046150.00046270.00046360.0004646
35–390.00076680.00076520.00078740.00080290.00079780.00081340.00082390.00083390.0008439
40–440.00137100.00136090.00137630.00138630.00137780.00138560.00139000.00139390.0013978
45–490.00222040.00217680.00208940.00201350.00199330.00191450.00185170.00178990.0017281
50–540.00354760.00349310.00345750.00342950.00340270.00335980.00332470.00328940.0032540
55–590.00591640.00581970.00571440.00562660.00557040.00546490.00537560.00528710.0051986
60–640.01002850.00983900.00957230.00935640.00926870.00901380.00881210.00861190.0084117
65–690.01660400.01630340.01584450.01547800.01530470.01488200.01453740.01419500.0138526
70–740.02958980.02914890.02884360.02852970.02825450.02788640.02755740.02722840.0268995
75–790.05087960.05012690.04922420.04846670.04791030.04704190.04628210.04552220.0447623
80+0.12256770.12147150.11969810.11849870.11874820.11701320.11595200.11489080.1138296
Sources: Data for 2015–2019 are collected from the Global Burden of Diseases study (http://ghdx.healthdata.org/gbd-results-tool, accessed on 15 December 2023), while the rest are generated by linear extrapolation since they are not available at the time of the analysis.
Table A2. Baseline mortality rates for chronic respiratory diseases.
AgeYear
201520162017201820192020202120222023
25–290.00001150.00001130.00001070.00001020.00000990.00001040.00001020.00000990.0000097
30–340.00001500.00001450.00001380.00001310.00001260.00001270.00001220.00001180.0000113
35–390.00002020.00001980.00001930.00001860.00001780.00001820.00001770.00001730.0000169
40–440.00002840.00002790.00002690.00002590.00002500.00002580.00002520.00002470.0000242
45–490.00003810.00003700.00003390.00003190.00003090.00003260.00003150.00003040.0000292
50–540.00005400.00005250.00004990.00004770.00004620.00004640.00004480.00004330.0000418
55–590.00008630.00008460.00008020.00007640.00007390.00007780.00007610.00007440.0000728
60–640.00013960.00013630.00012850.00012300.00012020.00011390.00010870.00010350.0000983
65–690.00024980.00024200.00022680.00021600.00020950.00019680.00018610.00017550.0001648
70–740.00051550.00050000.00048020.00046260.00045180.00043260.00041610.00039960.0003831
75–790.00105860.00103410.00099290.00096140.00093830.00090310.00087180.00084040.0008091
80+0.00375410.00371130.00362170.00358780.00361770.00353960.00350000.00346040.0034208
Sources: Data for 2015–2019 are collected from the Global Burden of Diseases study (http://ghdx.healthdata.org/gbd-results-tool, accessed on 15 December 2023), while the rest are generated by linear extrapolation since they are not available at the time of the analysis.
Table A3. Baseline mortality rates for circulatory diseases (including diabetes).
AgeYear
201520162017201820192020202120222023
25–290.00008560.00008450.00008320.00008100.00007960.00008010.00007890.00007780.0000767
30–340.00015590.00015450.00015550.00015400.00015080.00014920.00014790.00014660.0001453
35–390.00027070.00026990.00027870.00028140.00027580.00028190.00028400.00028620.0002884
40–440.00050920.00050380.00050900.00050830.00050000.00050190.00050050.00049910.0004978
45–490.00085100.00083010.00078630.00074540.00072870.00068950.00065650.00062360.0005907
50–540.00139190.00136300.00133990.00131420.00129020.00126420.00123900.00121380.0011886
55–590.00236020.00231510.00225910.00220180.00215940.00210470.00205320.00200170.0019502
60–640.00419940.00410910.00398070.00386950.00381690.00369380.00359330.00349290.0033924
65–690.00748690.00734410.00711370.00690350.00678800.00657580.00639190.00620810.0060243
70–740.01438360.01415700.01396860.01376670.01358470.01337570.01317690.01297810.0127793
75–790.02640860.02603710.02553360.02501810.02461730.02414250.02368230.02322220.0227620
80+0.06912060.06869000.06773200.06688080.06685180.06595100.06531630.06468170.0640470
Sources: Data for 2015–2019 are collected from the Global Burden of Diseases study (http://ghdx.healthdata.org/gbd-results-tool, accessed on 15 December 2023), while the rest are generated by linear extrapolation since they are not available at the time of the analysis.
Table A4. Fit parameters for the Global Exposure Mortality Model (GEMM).
AgeGEMM Parameters
θStandard
Error θ
αμν
25–290.14300.018071.615.536.8
30–340.15850.014771.615.536.8
35–390.15770.014701.615.536.8
40–440.15700.014631.615.536.8
45–490.15580.014501.615.536.8
50–540.15320.014251.615.536.8
55–590.14990.013941.615.536.8
60–640.14620.013611.615.536.8
65–690.14210.013251.615.536.8
70–740.13740.012841.615.536.8
75–790.13190.012341.615.536.8
80+0.12530.011741.615.536.8
Table A5. Life expectancy and wealth of Chinese.
AgeLife Expectancy (Unit: Year)Wealth
(Unit: CNY)
201520162017201820192020202120222023
25–2945.1545.2445.3445.4545.5045.6145.7045.7945.8844,053.39
30–3440.6440.7240.8340.9340.9941.0941.1841.2841.3753,395.49
35–3936.2036.2936.4036.5036.5536.6636.7536.8436.9353,146.61
40–4431.8531.9432.0532.1632.2132.3232.4232.5132.6147,160.08
45–4927.6327.7227.8427.9528.0028.1128.2128.3128.4046,141.21
50–5423.5523.6323.7423.8423.8923.9924.0824.1724.2638,604.59
55–5919.6419.7119.8219.9219.9620.0720.1520.2420.3336,518.54
60–6415.9516.0216.1216.2116.2616.3516.4416.5216.6026,514.66
65–6912.5612.6212.7112.7912.8212.9112.9813.0513.1218,616.86
70–749.509.569.639.699.729.799.859.909.9616,804.35
75–796.926.967.037.097.127.187.237.287.3425,944.57
80+4.784.814.874.924.944.995.045.085.1213,076.67
All ages67.9968.1268.2868.4268.5368.6868.8268.9669.0942,990.65
Sources: Life expectancy data for 2015–2019 are collected from the Global Burden of Diseases study (http://ghdx.healthdata.org/gbd-results-tool, accessed on 15 December 2023), while the rest are generated by linear extrapolation since they are not available at the time of the analysis. Wealth data are derived from China Household Finance Survey [59].
Table A6. Statistical characteristics for the annual average PM2.5 concentrations of 333 cities during 2015–2023.
YearMaximum
( μ g / m 3 )
Minimum
( μ g / m 3 )
Median
( μ g / m 3 )
35   μ g / m 3
(Number of Cities)
10   μ g / m 3
(Number of Cities)
20151181049740
20161571144940
201710010421020
20181168381392
20191107351666
20201136321978
2021947302169
202210762923610
2023896312079
Table A7. Statistical characteristics for AMDA8 O3 concentrations of 333 cities during 2015–2023.
YearMaximum
( μ g / m 3 )
Minimum
( μ g / m 3 )
Median
( μ g / m 3 )
100   μ g / m 3
(Number of Cities)
> 160   μ g / m 3
(Number of Cities)
2015202621352759
2016200741382359
2017219781468104
2018215741476109
2019208821468102
2020194941361056
202119794135752
202219491145690
202319594142477

References

  1. Jiang, J.; Aksoyoglu, S.; Ciarelli, G.; Baltensperger, U.; Prévôt, A.S.H. Changes in ozone and PM2.5 in Europe during the period of 1990-2030: Role of reductions in land and ship emissions. Sci. Total Environ. 2020, 741, 140467. [Google Scholar] [CrossRef] [PubMed]
  2. Boari, A.; Pedruzzi, R.; Vieira-Filho, M. Air pollution trends and exceedances: Ozone and particulate matter outlook in Brazilian highly urbanized zones. Environ. Monit. Assess. 2023, 195, 1058. [Google Scholar] [CrossRef]
  3. Kheirbek, I.; Wheeler, K.; Walters, S.; Kass, D.; Matte, T. PM2.5 and ozone health impacts and disparities in New York City: Sensitivity to spatial and temporal resolution. Air Qual. Atmos. Health 2013, 6, 473–486. [Google Scholar] [CrossRef]
  4. Im, U.; Bauer, S.E.; Frohn, L.M.; Geels, C.; Tsigaridis, K.; Brandt, J. Present-day and future PM2.5 and O3-related global and regional premature mortality in the EVAv6.0 health impact assessment model. Environ. Res. 2023, 216, 114702. [Google Scholar] [CrossRef]
  5. Chen, Y.; Ebenstein, A.; Greenstone, M.; Li, H. Evidence on the impact of sustained exposure to air pollution on life expectancy from China’s Huai River policy. Proc. Natl. Acad. Sci. USA 2013, 110, 12936–12941. [Google Scholar] [CrossRef] [PubMed]
  6. Giani, P.; Castruccio, S.; Anav, A.; Howard, D.; Hu, W.J.; Crippa, P. Short-term and long-term health impacts of air pollution reductions from COVID-19 lockdowns in China and Europe: A modelling study. Lancet Planet. Health 2020, 4, e474–e482. [Google Scholar] [CrossRef]
  7. Gao, J.; Li, Y.; Xie, Z.; Hu, B.; Wang, L.; Bao, F.; Fan, S. The impact of the aerosol reduction on the worsening ozone pollution over the Beijing-Tianjin-Hebei region via influencing photolysis rates. Sci. Total Environ. 2022, 821, 153197. [Google Scholar] [CrossRef]
  8. Liu, Z.; Lei, Y.; Xue, W.; Liu, X.; Jiang, Y.; Shi, X.; Zheng, Y.; Zhang, Q.; Wang, J. Mitigating China’s Ozone Pollution with More Balanced Health Benefits. Environ. Sci. Technol. 2022, 56, 7647–7656. [Google Scholar] [CrossRef]
  9. Zhang, S.; Zhang, C.; Cai, W.; Bai, Y.; Callaghan, M.; Chang, N.; Chen, B.; Chen, H.; Cheng, L.; Dai, H.; et al. The 2023 China report of the Lancet Countdown on health and climate change: Taking stock for a thriving future. Lancet Public Health 2023, 8, e978–e995. [Google Scholar] [CrossRef]
  10. Xiao, Q.; Geng, G.; Xue, T.; Liu, S.; Cai, C.; He, K.; Zhang, Q. Tracking PM2.5 and O3 Pollution and the Related Health Burden in China 2013–2020. Environ. Sci. Technol. 2021, 56, 6922–6932. [Google Scholar] [CrossRef] [PubMed]
  11. Lyu, Y.; Wu, Z.; Wu, H.; Pang, X.; Qin, K.; Wang, B.; Ding, S.; Chen, D.; Chen, J. Tracking long-term population exposure risks to PM2.5 and ozone in urban agglomerations of China 2015–2021. Sci. Total Environ. 2023, 854, 158599. [Google Scholar] [CrossRef]
  12. Nuvolone, D.; Petri, D.; Voller, F. The effects of ozone on human health. Environ. Sci. Pollut. Res. 2018, 25, 8074–8088. [Google Scholar] [CrossRef]
  13. Jin, Y.; Andersson, H.; Zhang, S. Do preferences to reduce health risks related to air pollution depend on illness type? Evidence from a choice experiment in Beijing, China. J. Environ. Econ. Manag. 2020, 103, 102355. [Google Scholar] [CrossRef]
  14. Burnett, R.; Chen, H.; Szyszkowicz, M.; Fann, N.; Hubbell, B.; Pope, C.A.; Apte, J.S.; Brauer, M.; Cohen, A.; Weichenthal, S.; et al. Global estimates of mortality associated with long-term exposure to outdoor fine particulate matter. Proc. Natl. Acad. Sci. USA 2018, 115, 9592–9597. [Google Scholar] [CrossRef]
  15. Vohra, K.; Marais Eloise, A.; Bloss William, J.; Schwartz, J.; Mickley Loretta, J.; Van Damme, M.; Clarisse, L.; Coheur Pierre, F. Rapid rise in premature mortality due to anthropogenic air pollution in fast-growing tropical cities from 2005 to 2018. Sci. Adv. 2022, 8, eabm4435. [Google Scholar] [CrossRef] [PubMed]
  16. Jerrett, M.; Burnett, R.T.; Pope, C.A., III; Ito, K.; Thurston, G.; Krewski, D.; Shi, Y.; Calle, E.; Thun, M. Long-Term Ozone Exposure and Mortality. N. Engl. J. Med. 2009, 360, 1085–1095. [Google Scholar] [CrossRef] [PubMed]
  17. Turner, M.C.; Jerrett, M.; Pope, C.A., III; Krewski, D.; Gapstur, S.M.; Diver, W.R.; Beckerman, B.S.; Marshall, J.D.; Su, J.; Crouse, D.L.; et al. Long-Term Ozone Exposure and Mortality in a Large Prospective Study. Am. J. Respir. Crit. Care Med. 2016, 193, 1134–1142. [Google Scholar] [CrossRef] [PubMed]
  18. Fuller, R.; Landrigan, P.J.; Balakrishnan, K.; Bathan, G.; Bose-O’Reilly, S.; Brauer, M.; Caravanos, J.; Chiles, T.; Cohen, A.; Corra, L.; et al. Pollution and health: A progress update. Lancet Planet. Health 2022, 6, e535–e547. [Google Scholar] [CrossRef]
  19. Xue, T.; Geng, G.; Meng, X.; Xiao, Q.; Zheng, Y.; Gong, J.; Liu, J.; Wan, W.; Zhang, Q.; Kan, H.; et al. New WHO Global Air Quality Guidelines Help Prevent Premature Deaths in China. Natl. Sci. Rev. 2022, 9, nwac055. [Google Scholar] [CrossRef]
  20. Rentschler, J.; Leonova, N. Global air pollution exposure and poverty. Nat. Commun. 2023, 14, 4432. [Google Scholar] [CrossRef]
  21. Geng, G.; Zheng, Y.; Zhang, Q.; Xue, T.; Zhao, H.; Tong, D.; Zheng, B.; Li, M.; Liu, F.; Hong, C.; et al. Drivers of PM2.5 air pollution deaths in China 2002–2017. Nat. Geosci. 2021, 14, 645–650. [Google Scholar] [CrossRef]
  22. Yao, M.; Wu, G.; Zhao, X.; Zhang, J. Estimating health burden and economic loss attributable to short-term exposure to multiple air pollutants in China. Environ. Res. 2020, 183, 109184. [Google Scholar] [CrossRef]
  23. Dang, R.; Liao, H. Radiative Forcing and Health Impact of Aerosols and Ozone in China as the Consequence of Clean Air Actions over 2012–2017. Geophys. Res. Lett. 2019, 46, 12511–12519. [Google Scholar] [CrossRef]
  24. Xue, T.; Wang, R.; Wang, M.; Wang, Y.; Tong, D.; Meng, X.; Huang, C.; Ai, S.; Li, F.; Cao, J.; et al. Health benefits from the rapid reduction in ambient exposure to air pollutants after China’s clean air actions: Progress in efficacy and geographic equality. Natl. Sci. Rev. 2024, 11, nwad263. [Google Scholar] [CrossRef] [PubMed]
  25. Yang, S.Y.; Fang, D.L.; Chen, B. Human health impact and economic effect for PM2.5 exposure in typical cities. Appl. Energy 2019, 249, 316–325. [Google Scholar] [CrossRef]
  26. Hu, J.; Huang, L.; Chen, M.; Liao, H.; Zhang, H.; Wang, S.; Zhang, Q.; Ying, Q. Premature Mortality Attributable to Particulate Matter in China: Source Contributions and Responses to Reductions. Environ. Sci. Technol. 2017, 51, 9950–9959. [Google Scholar] [CrossRef]
  27. Guan, Y.; Kang, L.; Wang, Y.; Zhang, N.; Ju, M. Health loss attributed to PM2.5 pollution in China’s cities: Economic impact, annual change and reduction potential. J. Clean. Prod. 2019, 217, 284–294. [Google Scholar] [CrossRef]
  28. Yang, Y.; Luo, L.; Song, C.; Yin, H.; Yang, J. Spatiotemporal Assessment of PM2.5-Related Economic Losses from Health Impacts during 2014-2016 in China. Int. J. Environ. Res. Public Health 2018, 15, E1278. [Google Scholar] [CrossRef]
  29. Maji, K.J.; Ye, W.-F.; Arora, M.; Shiva Nagendra, S.M. Ozone pollution in Chinese cities: Assessment of seasonal variation, health effects and economic burden. Environ. Pollut. 2019, 247, 792–801. [Google Scholar] [CrossRef]
  30. Zhang, Z.; Yao, M.; Wu, W.; Zhao, X.; Zhang, J. Spatiotemporal assessment of health burden and economic losses attributable to short-term exposure to ground-level ozone during 2015-2018 in China. BMC Public Health 2021, 21, 1069. [Google Scholar] [CrossRef]
  31. Xie, Y.; Dai, H.; Zhang, Y.; Wu, Y.; Hanaoka, T.; Masui, T. Comparison of health and economic impacts of PM2.5 and ozone pollution in China. Environ. Int. 2019, 130, 104881. [Google Scholar] [CrossRef]
  32. Liu, J.; Yin, H.; Tang, X.; Zhu, T.; Zhang, Q.; Liu, Z.; Tang, X.; Yi, H. Transition in air pollution, disease burden and health cost in China: A comparative study of long-term and short-term exposure. Environ. Pollut. 2021, 277, 116770. [Google Scholar] [CrossRef]
  33. Zhu, C.; Zhu, C.; Qiu, M.; Gai, Y.; Li, R.; Li, L.; Wang, C.; Yang, N.; Wang, B.; Sun, L.; et al. Health Burden and Driving Force Changes Due to Exposure to PM2.5 and O3 from 2014 to 2060 in a Typical Industrial Province, China. Atmosphere 2023, 14, 1672. [Google Scholar] [CrossRef]
  34. Yang, Z.; Li, F.; Ye, R.; Ge, H.; Li, H.; Zhang, S.; Wang, J.; Zhao, Y.; Gao, H.; Huang, T.; et al. Health impacts and drivers of long-term ozone and nitrogen dioxide exposure in urban China. Atmos. Pollut. Res. 2025, 16, 102640. [Google Scholar] [CrossRef]
  35. Yin, H.; Brauer, M.; Zhang, J.; Cai, W.; Navrud, S.; Burnett, R.; Howard, C.; Deng, Z.; Kammen, D.M.; Schellnhuber, H.J.; et al. Population ageing and deaths attributable to ambient PM2.5 pollution: A global analysis of economic cost. Lancet Planet. Health 2021, 5, e356–e367. [Google Scholar] [CrossRef] [PubMed]
  36. Lian, L.; Chen, S.; Ma, J.; Li, T.; Yang, Y.; Huang, T.; Wang, Y.; Li, J. Population Aging Driven Slowdown in the Reduction of Economic Cost-Attributed to PM2.5 Pollution after 2013 in China. Environ. Sci. Technol. 2023, 57, 1237–1245. [Google Scholar] [CrossRef]
  37. Li, Y.; Ma, L.; Ni, M.; Bai, Y.; Li, C. Drivers of ozone-related premature mortality in China: Implications for historical and future scenarios. J. Environ. Manag. 2023, 345, 118663. [Google Scholar] [CrossRef] [PubMed]
  38. Liu, C.; Dai, H.; Zhang, L.; Feng, C. The impacts of economic restructuring and technology upgrade on air quality and human health in Beijing-Tianjin-Hebei region in China. Front. Environ. Sci. Eng. 2019, 13, 70. [Google Scholar] [CrossRef]
  39. Cooper, M.J.; Martin, R.V.; Hammer, M.S.; Levelt, P.F.; Veefkind, P.; Lamsal, L.N.; Krotkov, N.A.; Brook, J.R.; McLinden, C.A. Global fine-scale changes in ambient NO2 during COVID-19 lockdowns. Nature 2022, 601, 380–387. [Google Scholar] [CrossRef] [PubMed]
  40. Markandya, A.; Sampedro, J.; Smith, S.J.; Van Dingenen, R.; Pizarro-Irizar, C.; Arto, I.; González-Eguino, M. Health co-benefits from air pollution and mitigation costs of the Paris Agreement: A modelling study. Lancet Planet. Health 2018, 2, e126–e133. [Google Scholar] [CrossRef]
  41. Zhu, G.; Hu, W.; Liu, Y.; Cao, J.; Ma, Z.; Deng, Y.; Sabel, C.E.; Wang, H. Health burdens of ambient PM2.5 pollution across Chinese cities during 2006–2015. J. Environ. Manag. 2019, 243, 250–256. [Google Scholar] [CrossRef]
  42. Han, C.; Xu, R.; Gao, C.; Yu, W.; Zhang, Y.; Han, K.; Yu, P.; Guo, Y.; Li, S. Socioeconomic disparity in the association between long-term exposure to PM2.5 and mortality in 2640 Chinese counties. Environ. Int. 2021, 146, 106241. [Google Scholar] [CrossRef]
  43. Akritidis, D.; Bacer, S.; Zanis, P.; Georgoulias, A.K.; Chowdhury, S.; Horowitz, L.W.; Naik, V.; O’Connor, F.M.; Keeble, J.; Sager, P.L.; et al. Strong increase in mortality attributable to ozone pollution under a climate change and demographic scenario. Environ. Res. Lett. 2024, 19, 024041. [Google Scholar] [CrossRef]
  44. Ministry of Ecology and Environment of the People’s Republic of China. Technical Regulation for Ambient Air Quality Assessment (on Trial); Ministry of Ecology and Environment of the People’s Republic of China: Beijing, China, 2013; Volume HJ 663-2013. [Google Scholar]
  45. Zhang, S.; Zhao, M.; Liu, Z.; Yang, F.; Lu, B.; Zhao, Z.; Gu, K.; Zhang, S.; Lei, M.; Zhang, C.; et al. City-level population projection for China under different pathways from 2010 to 2100. Sci. Data 2023, 10, 809. [Google Scholar] [CrossRef] [PubMed]
  46. Lu, X.; Hong, J.; Zhang, L.; Cooper, O.R.; Schultz, M.G.; Xu, X.; Wang, T.; Gao, M.; Zhao, Y.; Zhang, Y. Severe Surface Ozone Pollution in China: A Global Perspective. Environ. Sci. Technol. Lett. 2018, 5, 487–494. [Google Scholar] [CrossRef]
  47. Gui, K.; Che, H.; Zeng, Z.; Wang, Y.; Zhai, S.; Wang, Z.; Luo, M.; Zhang, L.; Liao, T.; Zhao, H.; et al. Construction of a virtual PM2.5 observation network in China based on high-density surface meteorological observations using the Extreme Gradient Boosting model. Environ. Int. 2020, 141, 105801. [Google Scholar] [CrossRef]
  48. Chen, L.; Lin, J.; Martin, R.; Du, M.; Weng, H.; Kong, H.; Ni, R.; Meng, J.; Zhang, Y.; Zhang, L.; et al. Inequality in historical transboundary anthropogenic PM2.5 health impacts. Sci. Bull. 2022, 67, 437–444. [Google Scholar] [CrossRef]
  49. GBD 2019 Risk Factors Collaborators. Global burden of 87 risk factors in 204 countries and territories, 1990–2019: A systematic analysis for the Global Burden of Disease Study 2019. Lancet 2020, 396, 1223–1249. [Google Scholar] [CrossRef] [PubMed]
  50. Song, X.; Hao, Y. An assessment of O3-related health risks and economic losses in typical regions of China. Front. Public Health 2023, 11, 1194340. [Google Scholar] [CrossRef]
  51. Yin, P.; Chen, R.; Wang, L.; Meng, X.; Liu, C.; Niu, Y.; Lin, Z.; Liu, Y.; Liu, J.; Qi, J.; et al. Ambient Ozone Pollution and Daily Mortality: A Nationwide Study in 272 Chinese Cities. Environ. Health Perspect. 2017, 125, 117006. [Google Scholar] [CrossRef]
  52. OECD. Mortality Risk Valuation in Environment, Health and Transport Policies; OECD Publishing: Paris, France, 2012. [Google Scholar]
  53. Cao, C.; Song, X.; Cai, W.; Li, Y.; Cong, J.; Yu, X.; Gao, M.; Wang, C. Estimating the value of a statistical life in China: A contingent valuation study in six representative cities. Chin. J. Popul. Resour. Environ. 2023, 21, 269–278. [Google Scholar] [CrossRef]
  54. Freeman, R.; Liang, W.; Song, R.; Timmins, C. Willingness to pay for clean air in China. J. Environ. Econ. Manag. 2019, 94, 188–216. [Google Scholar] [CrossRef]
  55. Yin, H.; Pizzol, M.; Xu, L. External costs of PM2.5 pollution in Beijing, China: Uncertainty analysis of multiple health impacts and costs. Environ. Pollut. 2017, 226, 356–369. [Google Scholar] [CrossRef]
  56. Zhang, B.; Wu, B.; Liu, J. PM2.5 pollution-related Health Effects and Willingness to Pay for Improved Air Quality: Evidence from China’s Prefecture-level Cities. J. Clean. Prod. 2020, 273, 122876. [Google Scholar] [CrossRef]
  57. Huang, D.; Xu, J.; Zhang, S. Valuing the health risks of particulate air pollution in the Pearl River Delta, China. Environ. Sci. Policy 2012, 15, 38–47. [Google Scholar] [CrossRef]
  58. O’Brien, J. Age, autos, and the value of a statistical life. J. Risk Uncertain. 2018, 57, 51–79. [Google Scholar] [CrossRef]
  59. Southwestern University of Finance and Economics. China Household Finance Survey; Southwestern University of Finance and Economics: Chengdu, China, 2011. [Google Scholar]
  60. Qu, Z.; Wang, X.; Li, F.; Li, Y.; Chen, X.; Chen, M. PM2.5-Related Health Economic Benefits Evaluation Based on Air Improvement Action Plan in Wuhan City, Middle China. Int. J. Environ. Res. Public Health 2020, 17, 620. [Google Scholar] [CrossRef] [PubMed]
  61. Cohen, A.J.; Brauer, M.; Burnett, R.; Ross Anderson, H.; Frostad, J.; Estep, K.; Balakrishnan, K.; Brunekreef, B.; Dandona, L.; Dan-dona, R.; et al. Estimates and 25-year trends of the global burden of disease attributable to ambient air pollution: An analysis of data from the Global Burden of Diseases Study 2015. Lancet 2017, 389, 1907–1918. [Google Scholar] [CrossRef]
  62. Sun, Y.; Jiang, Y.; Xing, J.; Ou, Y.; Wang, S.; Loughlin, D.H.; Yu, S.; Ren, L.; Li, S.; Dong, Z.; et al. Air Quality, Health, and Equity Benefits of Carbon Neutrality and Clean Air Pathways in China. Environ. Sci. Technol. 2024, 58, 15027–15037. [Google Scholar] [CrossRef] [PubMed]
  63. Wang, Y.; Gao, W.; Wang, S.; Song, T.; Gong, Z.; Ji, D.; Wang, L.; Liu, Z.; Tang, G.; Huo, Y.; et al. Contrasting trends of PM2.5 and surface-ozone concentrations in China from 2013 to 2017. Natl. Sci. Rev. 2020, 7, 1331–1339. [Google Scholar] [CrossRef]
  64. Lu, X.; Ye, X.; Zhou, M.; Zhao, Y.; Weng, H.; Kong, H.; Li, K.; Gao, M.; Zheng, B.; Lin, J.; et al. The underappreciated role of agricultural soil nitrogen oxide emissions in ozone pollution regulation in North China. Nat. Commun. 2021, 12, 5021. [Google Scholar] [CrossRef]
  65. Gao, M.; Wang, F.; Xu, Y.; Chen, J.; Lu, X.; Carmichael, G.R. Future intensification of co-occurrences of heat, PM2.5 and O3 extremes in China and India despite stringent air pollution controls. Environ. Res. Lett. 2024, 20, 014044. [Google Scholar] [CrossRef]
  66. Cheng, J.; Tong, D.; Zhang, Q.; Liu, Y.; Lei, Y.; Yan, G.; Yan, L.; Yu, S.; Cui, R.; Clarke, L.; et al. Pathways of China’s PM2.5 air quality 2015-2060 in the context of carbon neutrality. Natl. Sci. Rev. 2021, 8, nwab078. [Google Scholar] [CrossRef]
  67. Wang, T.; Xue, L.; Brimblecombe, P.; Lam, Y.F.; Li, L.; Zhang, L. Ozone pollution in China: A review of concentrations, meteorological influences, chemical precursors, and effects. Sci. Total Environ. 2017, 575, 1582–1596. [Google Scholar] [CrossRef]
  68. Jin, X.; Holloway, T. Spatial and temporal variability of ozone sensitivity over China observed from the Ozone Monitoring Instrument. J. Geophys. Res. Atmos. 2015, 120, 7229–7246. [Google Scholar] [CrossRef]
  69. Wang, P.; Chen, Y.; Hu, J.; Zhang, H.; Ying, Q. Attribution of Tropospheric Ozone to NOx and VOC Emissions: Considering Ozone Formation in the Transition Regime. Environ. Sci. Technol. 2018, 53, 1404–1412. [Google Scholar] [CrossRef]
  70. Gong, C.; Liao, H.; Zhang, L.; Yue, X.; Dang, R.; Yang, Y. Persistent ozone pollution episodes in North China exacerbated by regional transport. Environ. Pollut. 2020, 265, 115056. [Google Scholar] [CrossRef] [PubMed]
  71. Orru, H.; Åström, C.; Andersson, C.; Tamm, T.; Ebi, K.L.; Forsberg, B. Ozone and heat-related mortality in Europe in 2050 significantly affected by changes in climate, population and greenhouse gas emission. Environ. Res. Lett. 2019, 14, 074013. [Google Scholar] [CrossRef]
  72. Tian, P.; Feng, K.; Sun, L.; Hubacek, K.; Malerba, D.; Zhong, H.; Zheng, H.; Li, D.; Zhang, N.; Li, J. Higher total energy costs strain the elderly, especially low-income, across 31 developed countries. Proc. Natl. Acad. Sci. USA 2024, 121, e2306771121. [Google Scholar] [CrossRef]
  73. Lelieveld, J.; Pozzer, A.; Pöschl, U.; Fnais, M.; Haines, A.; Münzel, T. Loss of life expectancy from air pollution compared to other risk factors: A worldwide perspective. Cardiovasc. Res. 2020, 116, 1910–1917. [Google Scholar] [CrossRef]
Figure 1. Temporal trends of PM2.5 and O3 pollution and related premature deaths during 2015–2023 over China and 2+26 Cities, Fen-Wei Plain (FWP), Yangtze River Delta (YRD), Cheng-Yu Urban Agglomeration (CYU), and Pearl River Delta (PRD). The percentage changes in pollution exposure and related deaths during 2015–2019, 2019–2021, and 2021–2023 are, respectively, labelled.
Sustainability 17 07350 g001
Figure 2. Temporal trends of PM2.5- and O3-related economic losses in China during 2015–2023. (Top left) National-scale absolute economic losses with percentage changes annotated for three periods (2015–2019, 2019–2021, 2021–2023). (Top right) Per capita economic losses (PELs) alongside national per capita disposable income (PDI), both normalized to 2015 baseline (2015 = 1) for China. (Bottom) Normalized PELs for five major urban agglomerations (2+26 Cities, Fen-Wei Plain (FWP), Yangtze River Delta (YRD), Cheng-Yu Urban Agglomeration (CYU), and Pearl River Delta (PRD)).
Sustainability 17 07350 g002
Figure 3. Contributions of four influencing factors to the changes in health impacts related to PM2.5 and O3 pollution during three stages (i.e., 2015–2019, 2019–2021, 2021–2023). EXP: exposure levels, AGE: population aging, POP: population size, MOR: baseline mortality rates.
Sustainability 17 07350 g003
Figure 4. Contributions of five influencing factors to the changes in economic impacts related to PM2.5 and O3 pollution during three stages (i.e., 2015–2019, 2019–2021, 2021–2023). EXP: exposure levels, AGE: population aging, POP: population size, MOR: baseline mortality rates, PDIG: per capita disposable income growth.
Sustainability 17 07350 g004
Disclaimer/Publisher’s Note: The statements, opinions and data contained in all publications are solely those of the individual author(s) and contributor(s) and not of MDPI and/or the editor(s). MDPI and/or the editor(s) disclaim responsibility for any injury to people or property resulting from any ideas, methods, instructions or products referred to in the content.