Article

Street Trees as Sustainable Urban Air Purifiers: A Methodological Approach to Assessing Particulate Matter Phytofiltration

1
Institute of Environmental Engineering, Warsaw University of Life Sciences—SGGW, Nowoursynowska St. 159, 02-787 Warsaw, Poland
2
Centre for Climate Research SGGW, Warsaw University of Life Sciences—SGGW, Nowoursynowska 166, 02-787 Warsaw, Poland
*
Authors to whom correspondence should be addressed.
Sustainability 2025, 17(16), 7451; https://doi.org/10.3390/su17167451
Submission received: 12 July 2025 / Revised: 3 August 2025 / Accepted: 13 August 2025 / Published: 19 August 2025
(This article belongs to the Special Issue Environmental Pollution and Impacts on Human Health)

Abstract

PM2.5 is an air pollutant that has a direct link to increased cardiovascular and respiratory morbidity and mortality, which has been demonstrated in numerous studies. Existing research highlights species-specific variations in the capacity of trees to capture and retain particulate matter (PM). However, a critical gap remains regarding sensitivity analyses of i-Tree Eco model assumptions. Such analyses are crucial for validating the model’s PM deposition estimates against empirically derived efficiencies, a deficiency that the present study addresses. The study consisted of two steps: a tree inventory was carried out at three selected sites, based on which, an ecosystem service analysis was performed using i-Tree Eco, and samples were taken from the leaves of trees at the analysed sites, which were the basis for comparing the data from the i-Tree Eco method and laboratory methods. The study focused on comparing PM2.5 and PM10 removal estimates derived from both the model and laboratory measurements. The results revealed significant discrepancies between the modelled and laboratory values. A comparison of the average annual PM10 accumulation measured using laboratory methods for individual tree species showed that Tilia sp. achieved 24%, Fraxinus sp. 47.6%, Aesculus sp. 50.77%, and Quercus robur 23.4% of the PM10 uptake efficiency estimated by the i-Tree Eco model. For PM2.5 uptake, the values obtained through both methods were more consistent. Furthermore, trees growing under more challenging environmental conditions exhibited smaller diameter at breast height (DBH) and lower PM10 and PM2.5 removal efficiency according to both methods. While I-Tree Eco incorporates tree biophysical characteristics and health status, its methodology currently lacks the resolution to reflect site-specific environmental conditions and local pollutant concentrations at the individual tree level. Therefore, laboratory methods are indispensable for calibrating, validating, and supplementing i-Tree Eco estimates, especially when applied to diverse urban environments. Only the combined application of empirical and model-based methods provides a comprehensive understanding of the potential of urban greenery to improve air quality.

1. Introduction

In recent years, PM2.5 has been recognized as one of the most dominant types of air pollution. Numerous studies have demonstrated a clear link between exposure and increased rates of morbidity and mortality due to cardiovascular and respiratory conditions, including chronic obstructive pulmonary disease (COPD) and pneumonia, particularly in densely populated urban areas [1,2,3,4,5,6]. A study conducted in Shenyang, China [7] on the relationship between mortality and particle size found that PM with a diameter of less than 0.5 µm has the most adverse effect on health. Research for the Global Burden of Disease Study [8] estimates that air pollution (PM and O3) may have caused 1.5 million deaths, accounting for 12.5% of all deaths in 2017. Furthermore, studies confirm the scale of PM’s impact on human health, indicating that it is the second leading factor after high blood pressure, smoking, and poor diet [9].
At the same time, extensive research on the ability of plants to remove PM [10] has demonstrated their positive impact on air quality, resulting from their effectiveness in absorbing pollutants [11]. This has been confirmed by numerous laboratory and field studies analysing species relationships and the impact of tree density [12,13,14,15]. In Shanghai, it was shown that in urban forestry 50–100 m deep into the forest, PM concentrations were 9.1% lower than outside of them [16].
Urban conditions, resulting from significant human interference with the landscape, lead to the formation of anthropogenic soils, whose properties hinder the proper growth and development of vegetation [17]. These conditions are also believed to reduce the effectiveness of PM accumulation [18]. Moreover, factors such as tree canopy cover [19], plant condition [20], and terrain roughness [21] will significantly influence the level of urban pollution reduction—either positively or negatively depending on the factor.
In studies of pollutant accumulation, various methods are used to estimate PM absorption. These include models such as CNT’s Green Values Calculator (greenvalues.cnt.org/national (accessed on 11 July 2024), the GreenSave Calculator (greenroofs.org (accessed on 11 July 2024)), the Street Tree Resource Analysis Tool for Urban Forest Managers (fs.fed.us/psw/programs/cufr/stratum.shtml (accessed on 11 July 2024)), The National Tree Benefit Calculator (www.treebenefits.com/calculator (accessed on 11 July 2024)) and the i-Tree Software Suite v6 (www.itreetools.org/index.php (accessed on 11 July 2024)), as well as laboratory methods such as static methods, dynamic methods, microscopic and spectroscopic methods, and methods based on weight and chemical analysis [22].
Key factors influencing the estimated pollutant absorption in these models include tree species, size (e.g., DBH, canopy spread), age, health condition, location (urban or suburban), and growth rate. Some models also incorporate site-specific data such as soil type, land use, and climatic conditions to verify estimations of ecosystem services provided by urban trees. However, these methods do not account for factors like the distance from pollution sources. Laboratory methods for estimating accumulated pollutants focus on the structure and morphology of leaf surfaces (e.g., trichomes, wax layer, stomatal density). These methods are applied to assess pollutant adsorption on a smaller time and spatial scale; gravimetric and chemical analyses quantify the mass and elemental content of deposited materials, while microscopic and spectroscopic techniques (e.g., scanning electron microscope Fourier transform infrared spectroscopy, and Energy Dispersive X-ray Spectroscopy) enable detailed visualization and identification of surface particulates and contaminant distribution.
To analyse the level of pollutants absorbed by trees, we chose the i-Tree Eco model [23], which is widely used in estimating PM absorption [24,25,26], as well as the laboratory method developed by Przybysz [27,28,29], which is well documented in the literature. However, there is a significant difference in the approach of both methods in solving the problem of estimating the amount of PM absorbed.
There is a lack of research results determining the effectiveness of air purification within certain species or in multi-species urban forests. Due to differences in leaf characteristics, tree species vary in their ability to capture and retain PM [30]. The properties that determine the ability of species to capture PM include epicuticular waxes [31], hair density [32], and surface roughness [33]. Empirical studies also show that conifers are generally more effective at capturing PM2.5 than deciduous species [34]. Research is currently being conducted on the sensitivity of i-Tree Eco assumptions, with the aim of comparing the model’s estimates with the deposition and resuspension mechanism in tree crowns [24].
It is the responsibility of landscape architects and urban forest managers to design street greenery in a way that ensures a diverse range of ecosystem services, including regulatory functions such as the absorption of air pollutants, including PM10 and PM2.5. While we assume that i-Tree Eco is available to urban forest managers and has the potential for widespread use, its suitability for local conditions remains uncertain. There is a possibility that the model’s results may be either overestimated or underestimated.
A comparison between laboratory measurements and estimates from the i-Tree Eco model could offer a deeper understanding of how effectively urban forests retain air pollutants, helping to validate or refine the model for local applications. The use of both methods for obtaining data on pollutant adsorption is aimed at obtaining more detailed information on the adequacy of using the widely available i-Tree Eco model in the context of air purification efficiency through the use of a selected laboratory method, and, as a result, to assess the potential of the widely used i-Tree Eco model in shaping tree plantings in urban green spaces in terms of their effectiveness in the absorption of PM10 and PM2.5. We hypothesize that the results obtained from the i-Tree Eco model could differ in comparison with laboratory methods, with the latter overestimating the effectiveness of trees in capturing PM10 and PM2.5 in urban conditions compared to empirically measured values and having a limited capability to demonstrate differences in the effectiveness of air phytofiltration by different plant species, due to its failure to take into account local habitat conditions and pollutant concentrations.

2. Materials and Methods

The study consisted of two distinct stages: The first phase comprised a detailed tree inventory carried out in three urban sites, selected for their representative spatial and environmental characteristics. The collected dendrometric and site-specific data served as input for modelling ecosystem services using the i-Tree Eco tool. The second stage involved laboratory testing of the PM absorption capacity of tree leaves, by using the same samples which were collected from the previously analysed locations. The laboratory results were used to compare the data from the i-Tree Eco method and their similarity analysed.
This research was conducted in Warsaw, the capital of Poland, the largest city (Figure 1) in the country with an area of 517.2 km2 and a population of 1,792,718 in 2022 [35]. The decision to choose this city was influenced by both its current, non-episodic poor air quality and its repeated frequent appearance in rankings of cities with the highest levels of particulate matter pollution. In January 2021, Warsaw ranked sixth in the global air pollution-ranking Air Quality Index [36], and then, in February of the same year, it was second in the World Air Quality Index [37]. As in many European cities, poor air quality in Warsaw poses a serious threat to public health and contributes to premature mortality [38].
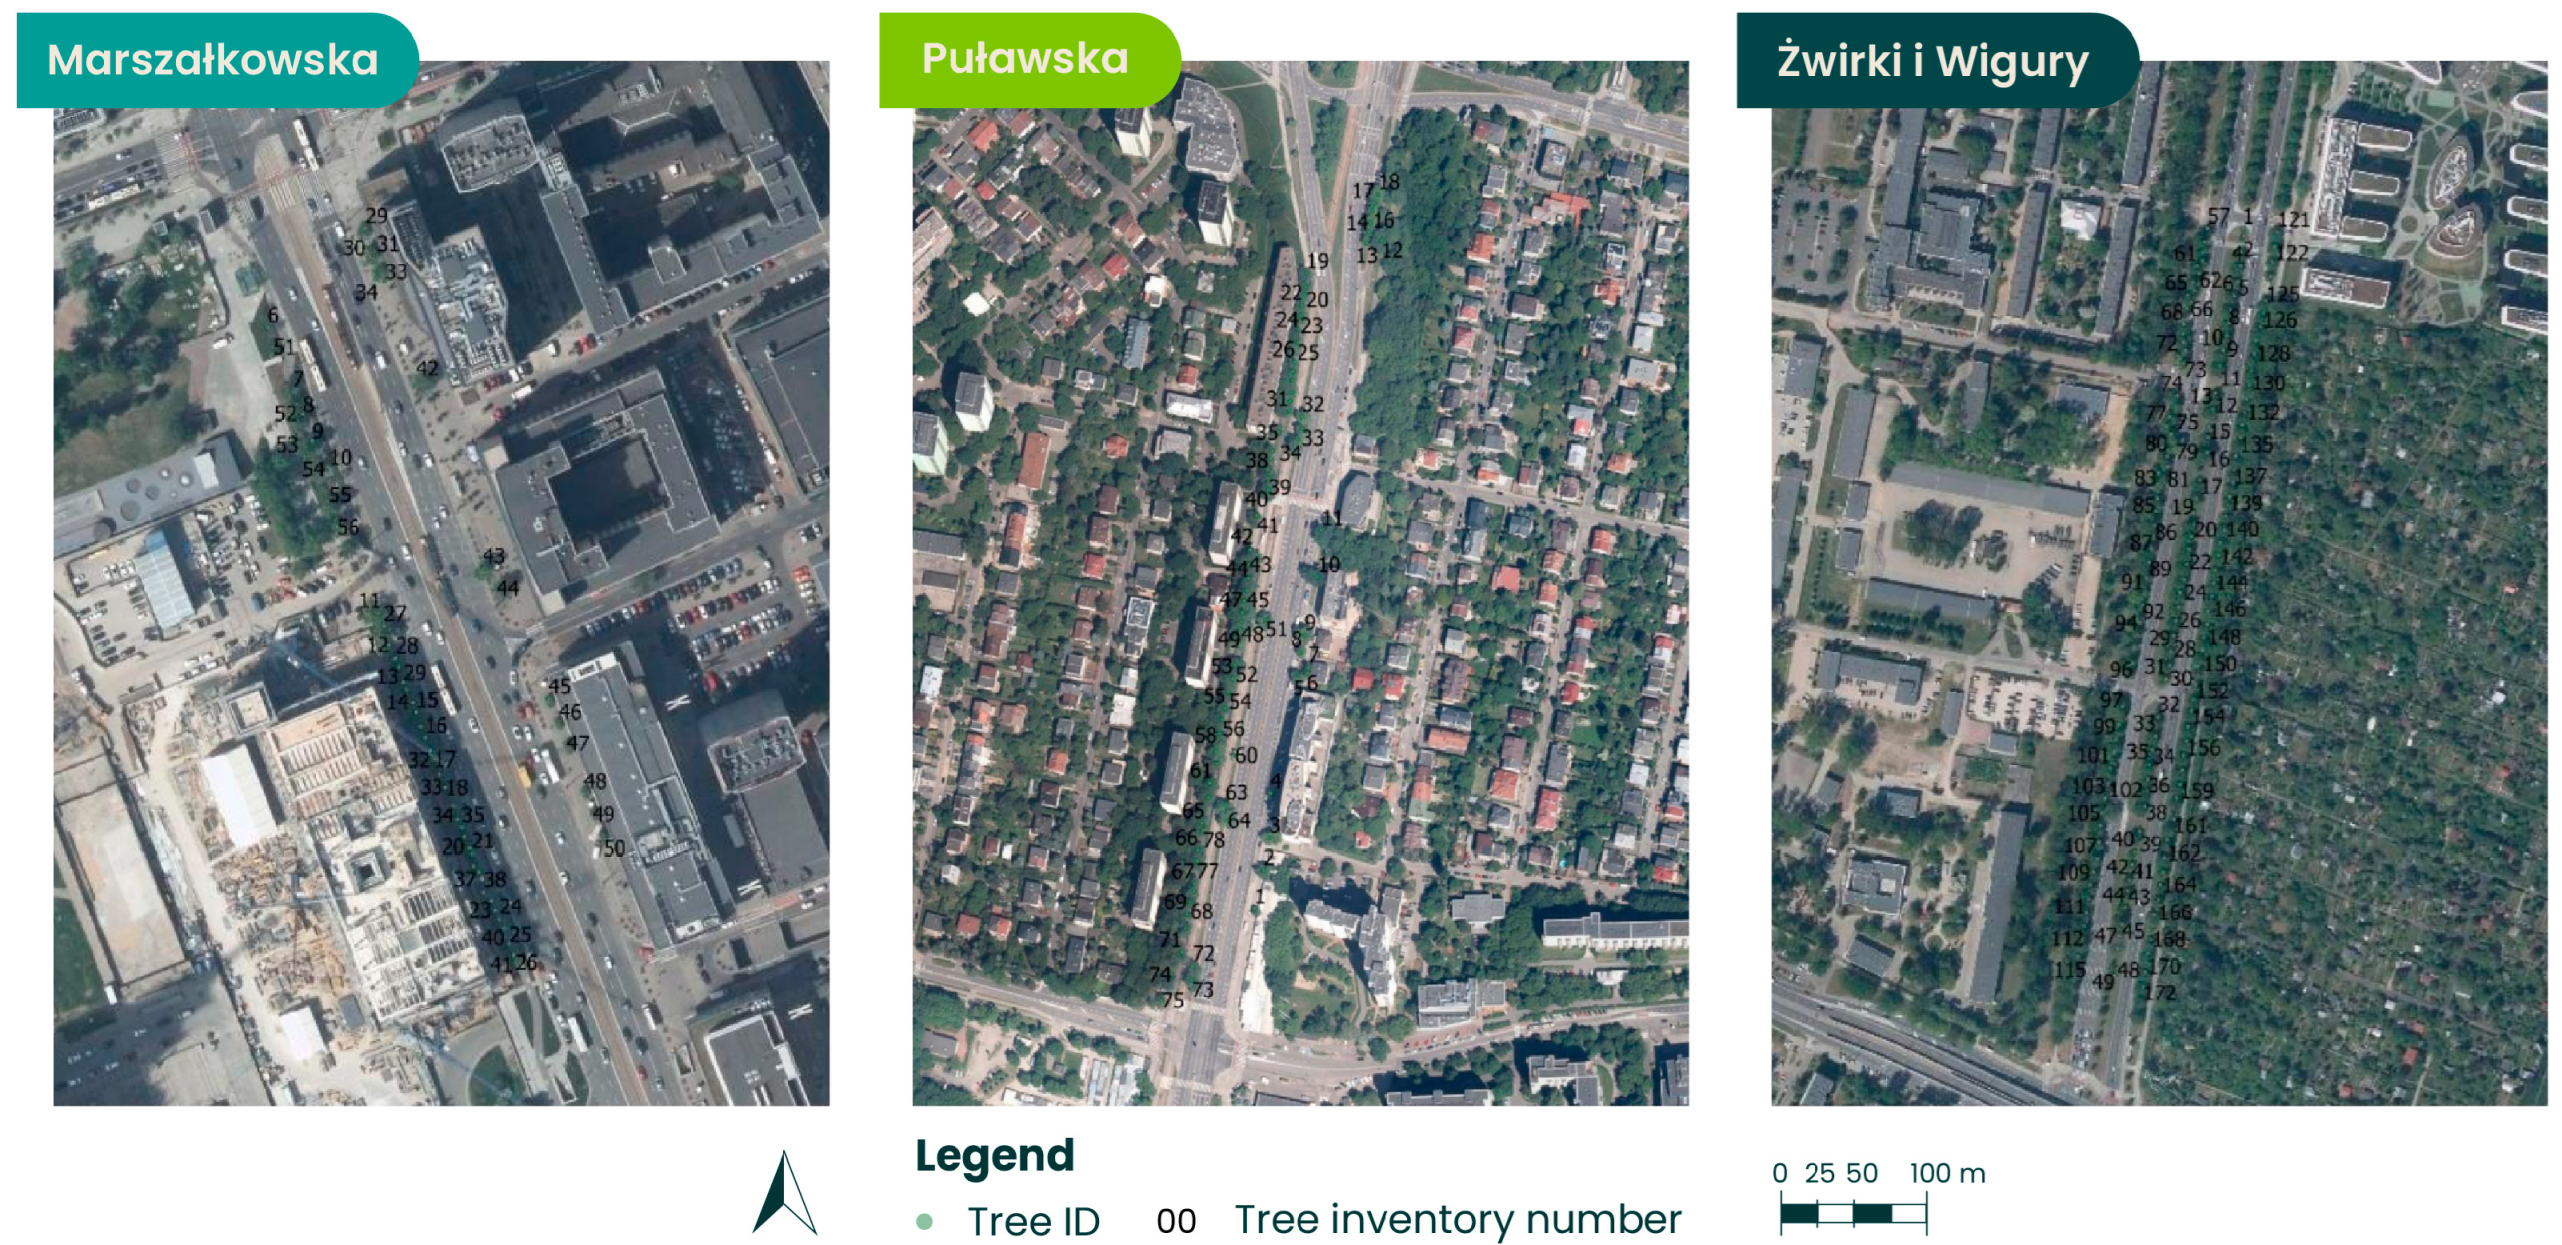
The inventory was carried out in three locations, on 700-metre sections of streets (Figure 2). Section 1 was located on Marszałkowska Street, in the immediate vicinity of the Palace of Culture and Science and the Centrum department store in the city centre. It consists of three lanes in each direction, with concrete squares and wide pavements on both sides, without any shrubbery. The area is enclosed on the eastern side by tall commercial and service buildings. The tree-lined avenue in this location consists of low small-leaved lime trees (Tilia cordata), which account for 100% of the species structure of the avenue, growing in 2 × 2 m planting beds between the road and the pavement. There are 100 trees along a 700-metre section, which gives an average of 143 trees per kilometre, resulting in a canopy cover of approximately 6%.
Another section formed by a triple row of small-leaved lime trees (Tilia cordata) was designated along Żwirki i Wigury Street, where the two-lane road is crossed by one of the rows of trees. Small-leaved lime trees (Tilia cordata) account for 100% of the trees in this avenue. The selected section is adjacent to military grounds, multi-family residential buildings, and allotment gardens. It is the main thoroughfare connecting the southern part of Warsaw with Chopin Airport and the city centre. The area along the street is located in a green belt and is more densely covered than in the first section, with grassy vegetation under the tree crowns. There are 187 trees along the 700 m section, which gives an average of 267 trees per kilometre, i.e., a crown cover ratio of approx. 31%.
The third section is located on Puławska Street, where the road consists of three lanes in each direction and is adjacent to multi-family residential buildings, a market, and commercial buildings. It is the main thoroughfare connecting the city centre with the southern part of Warsaw and is also the main exit road to towns located within the Warsaw agglomeration. The habitat conditions of the trees are varied: some of them have designated tree pits, 97% grow in designated cobblestone strips, and the remaining 3% are located in the strip next to the pavement. The predominant species on Puławska Street is Fraxinus, which accounts for 76.3% of the species structure. There are 79 trees per 700 m on this section, which gives an average of 112 trees per kilometre and a Tree Canopy Cover index of 19%.
According to traffic measurements by the City of Warsaw, the selected areas are characterized by similar traffic intensity and have comparable geometry, i.e., they are straight sections without bends or curves. In addition, all avenues run from north to south. On this basis, it was assumed that the conditions related to air movement are similar in all locations. They were selected for analysis due to their diversity in terms of canopy cover.

2.1. Tree Inventory

As already mentioned, the tree inventory was carried out in three locations in July 2022 when the trees on Marszałkowska, Puławska, Żwirki, and Wigury Streets were in full leaf. The data was collected in accordance with the i-Tree Eco User Manual [39]. Measurements were carried out using a measuring tape and a Bosch GLM120c rangefinder. The trees within the scope of the study were described in detail, and their species and exact location were determined. Dendrometric measurements such as the diameter at breast height (DBH), total tree height (TOTAL TREE HEIGHT), live tree height (LIVE TREE HEIGHT), crown base height (CROWN BASE), crown width from north to south (CROWN WIDTH N-S), crown width from east to west (CROWN WIDTH E-W), crown loss (CROWN%MISS), crown health (CROWN HEALTH), and light exposure (CROWN LIGHT EXPOSURE) were taken.
The quantitative structure of the trees in the studied locations is shown in Figure 3.
The average diameter of the tree trunks (DBH) on Marszałkowska Street was 17.20 cm, the average tree height was 5.2 m, and the average crown dieback was 12.2%. The average diameter of the trees on Żwirki i Wigury Street was 39.95 cm, the average tree height was 11.3 m, and the average crown dieback was 13.5%. For Puławska Street, the values are as follows: the average tree diameter was 46.37 cm, the average tree height was 12.3 m, and the average crown dieback was 18.3% (Figure 4).
Based on the inventory, it can be concluded that the largest trees are located on Puławska Street, while the smallest are on Marszałkowska Street. Crown dieback is at a similar level in all locations. The conclusions from the inventory form the basis for estimating the PM10 and PM2.5 absorption capacity of the plants.

2.2. The i-Tree Eco Model

The analysis using the i-Tree Eco model utilized weather data and air quality data from monitors located in Warsaw [39]. The results were obtained on the basis of inventoried data, as well as the Data Base i-Tree, which has access to meteorological data and air quality data. After running the model, results were obtained on the removal of pollutants by trees located in the study areas. Variable amounts of PM absorbed depending on the month or season were taken into account, which may be caused by, among other things, factors like the lack of leaves on trees for part of the year.

2.3. Assessment of Suspended Particulate Matter Accumulation Using Laboratory Methods

2.3.1. Plant Material and Data Harvesting

The content of water-insoluble PM deposited on leaves, individual trees, and entire rows was assessed. Plant material from locations analysed by i-Tree Eco was harvested in July 2023 at the end of growing season. Harvesting was preceded by six days of no precipitation and strong winds and during a high PM concentration event, ensuring a sufficient number of pollutants deposited on leaves for analysis. To ensure data comparability, leaf samples (500 cm2) with petioles were collected from the entire circumference of the plant and branches 1.5–2.0 m above the ground. Efforts were made to select leaves of similar age. For each species and location, material was harvested from four individual trees, with each tree serving as a biological replicate. The data were collected in accordance with the method presented in a publication by Przybysz [40].

2.3.2. Quantitative Assessment of PM per cm2 of Leaf

The plant material (150 cm2) was first washed for 60 s with 200 mL distilled water (PM water washable from leaf surfaces) and then for 45 s with 100 mL chloroform (PM retained in leaf wax). The fractionation was performed sequentially. The wash solutions were filtered through a 10 μm paper filter (Whatman, Maidstone, Kent, UK, type 91), followed by a 2.5 μm paper filter (Whatman, Maidstone, Kent, UK, type 42), and finally, a 0.2 μm Polytetrafluoroethylene membrane filter (Whatman, Maidstone, Kent, UK). Filtration was performed using a filtration set equipped with a 47 mm glass filter funnel (PALL Corp. Port, Washington, DC, USA; New York, NY, USA) connected to a vacuum pump. Two fractions of PM were collected and analysed: 0.2–2.5 μm (fine; PM2.5) and 2.5–10 μm (coarse; PM2.5–10). The sum of both PM fractions was designated as PM10 (total; 0.2–10 μm). The filters were dried at 60 °C for 45 min (KCW-100, PREMED, Marki, Poland), stabilized in the weighing room for 45 min, and weighed before and after filtration (balance XS105DU, Mettler-Toledo International Inc., and deionizer gate, HAUG, both Greifensee, Switzerland). For each species and location, material was harvested from four individual trees, with each tree serving as a biological replicate. Blind samples were used to validate the results. Filters were prepared and treated with solvents following the procedure, and one blind sample was analysed for every five experimental samples. The leaf area of the plant samples was measured (Image Analysis System equipped with Vista Protos CCTV camera (Vista CCTV, Reading, Berkshire, UK and Skye-Leaf v2 software, both Skye Instruments Ltd. Llandrindod Wells, Wales, UK).

2.3.3. Quantitative Assessment of PM per Tree and All the Trees in the Avenue

The total leaf areas of each tree and the entire spatial arrangement were obtained from i-Tree Eco. PM accumulation recorded in Section 2.3.2 was converted to tree and plant community levels, and then to the entire growing season, taking into account the length of the ecological functionality periods of individual plants (from the moment leaves develop on trees to the moment they lose their leaves) and precipitation washing PM off plant surfaces. It was assumed that rainfall of less than 5 mm, 5–10 mm, 10–20 mm, and more than 20 mm washes away 5%, 10%, 20% and 25% of PM deposited on plants, respectively [40]. The same weather data as in Section 4 was used.

2.3.4. Statistical Analysis

The variables related to pollution absorption underwent a Kolmogorov–Smirnov test to assess the normality of the distribution. The test revealed a lack of normality in the examined variables, necessitating non-parametric tests. In comparisons of the pollution absorption values in different group (street, tree species) tests, an independent-sample Kruskal–Wallis Test with a Dunn post-hoc test was employed. Additionally, a non-parametric Spearman correlation was conducted between the laboratory measurement method and the i-Tree Eco model, as well as between the absorption values of PM10 and PM2.5 in the i-Tree Eco method. All analyses were performed using the statistical software IBM SPSS v30.

3. Results

3.1. i-Tree Eco

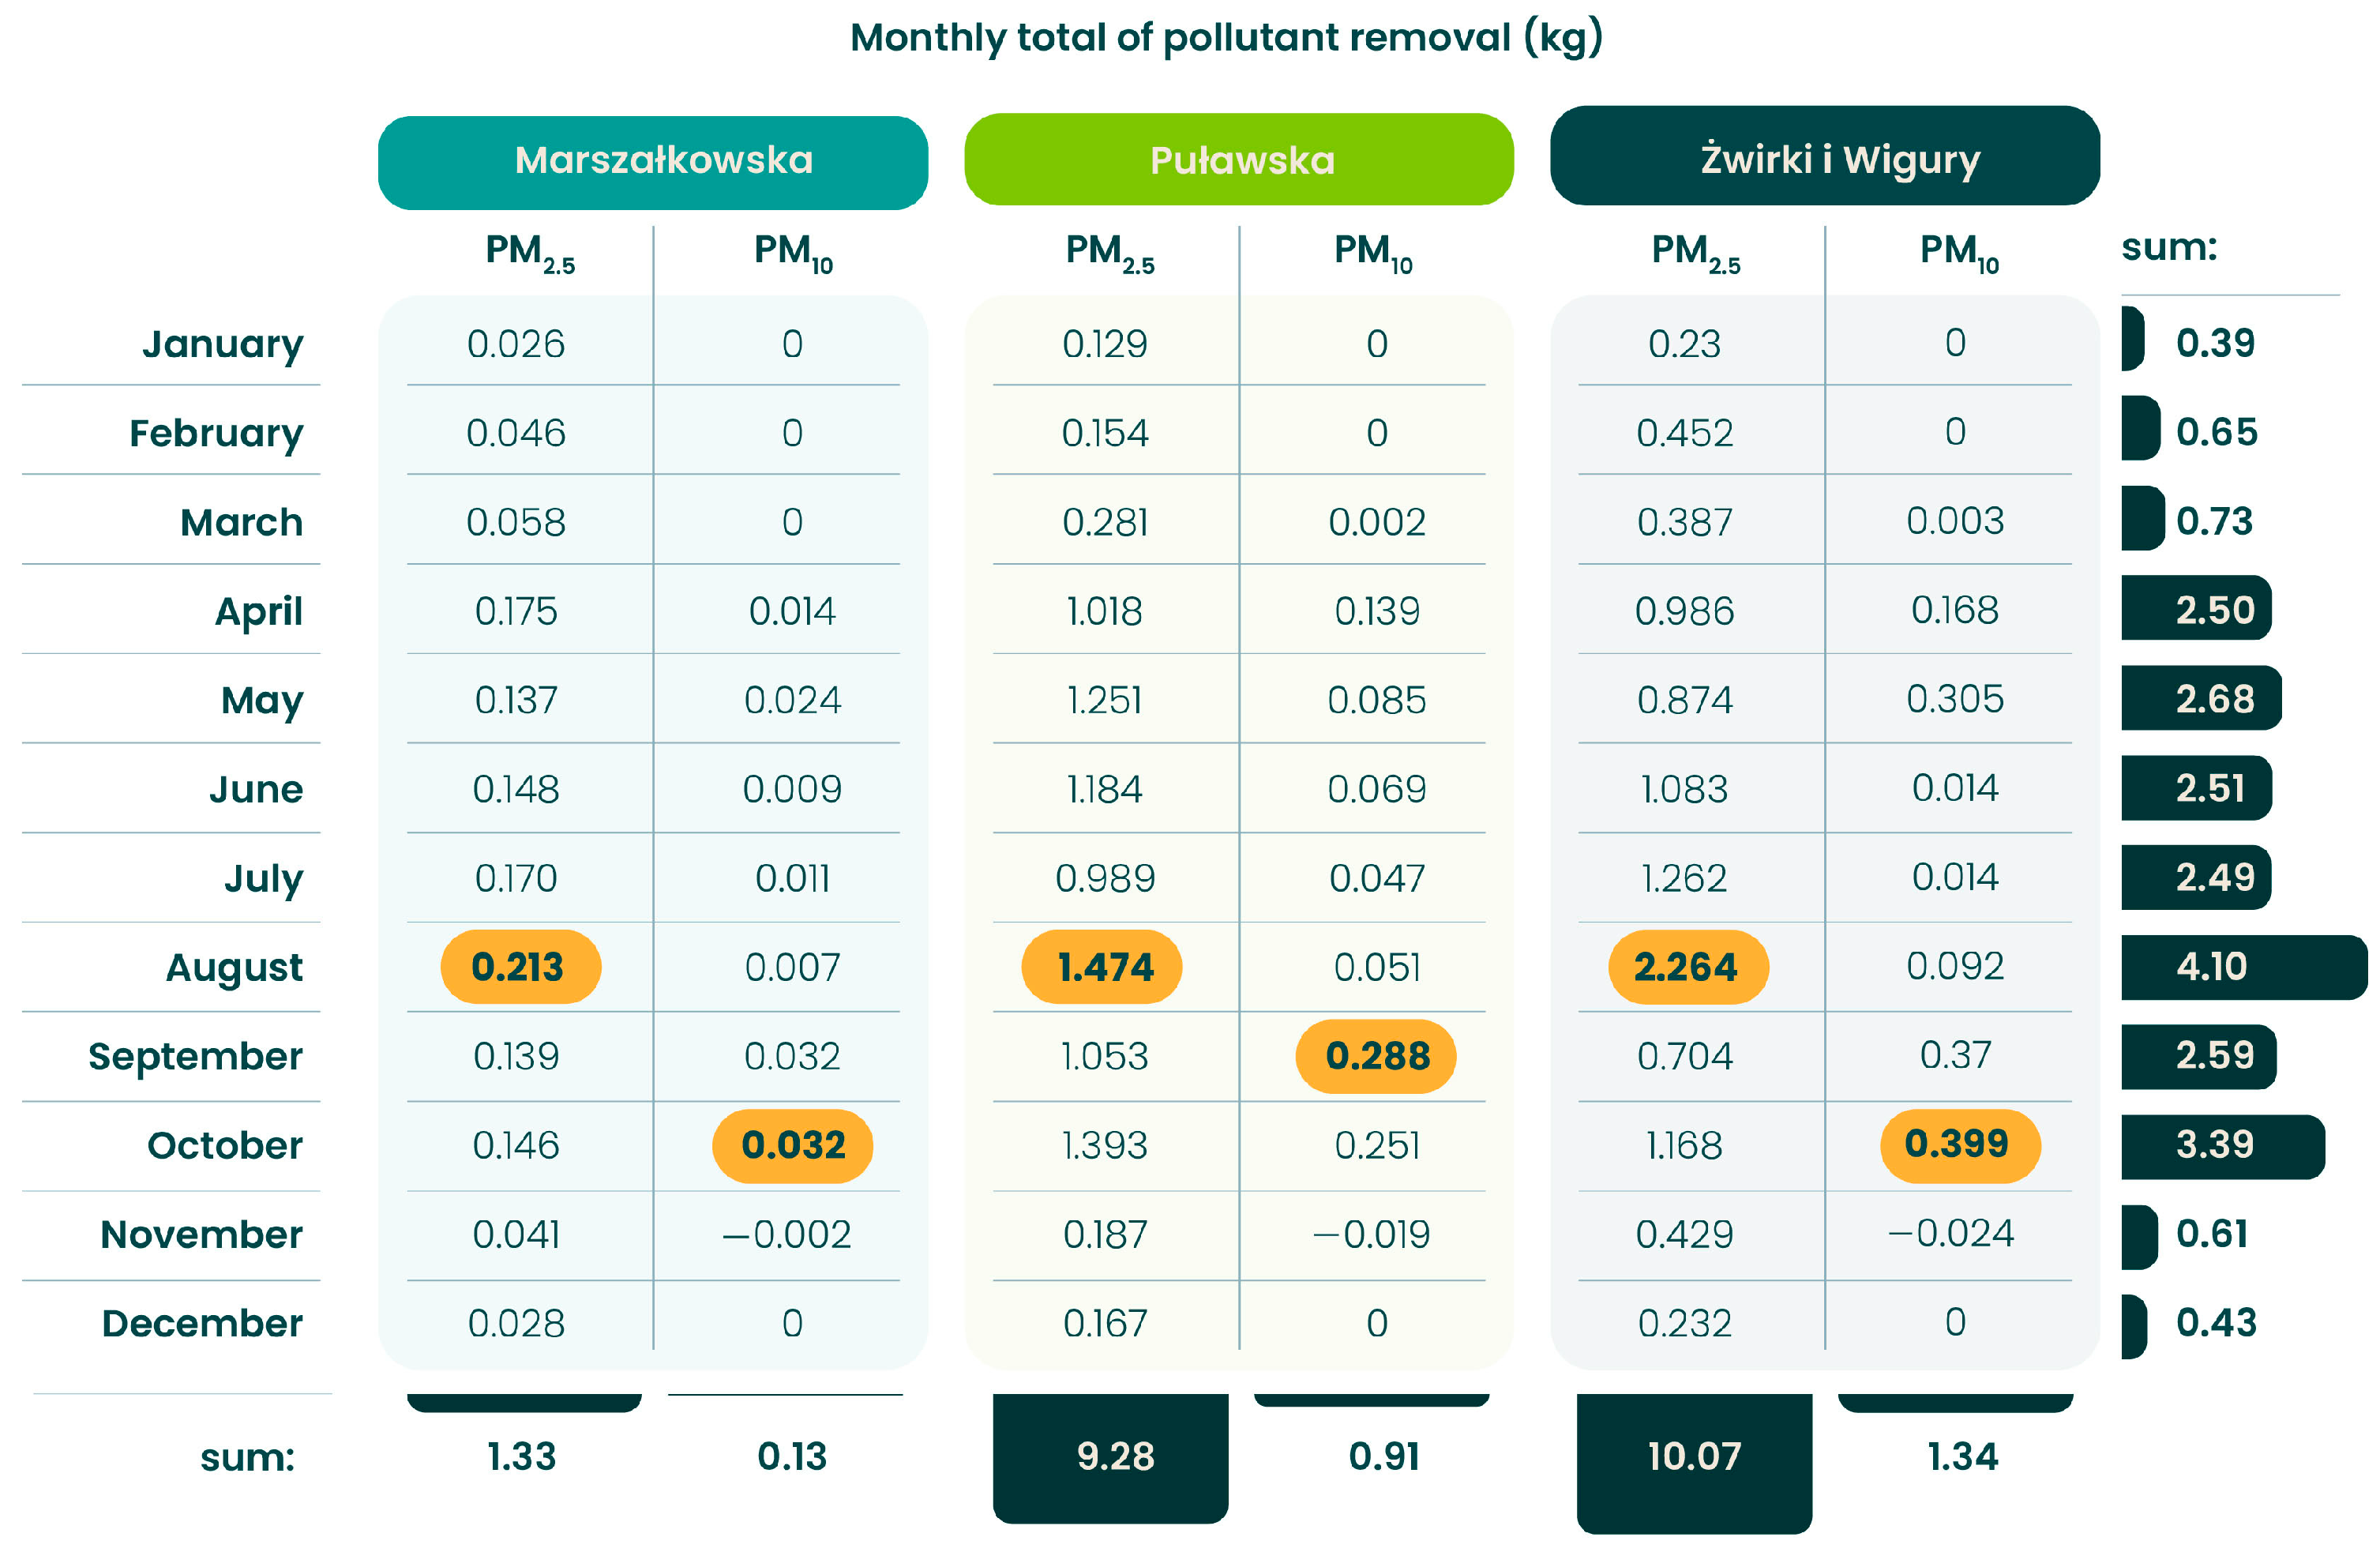
The highest total PM10 absorption value was recorded in August on Żwirki i Wigury Street (2.264 kg), Puławska Street (1.474 kg), and on Marszałkowska Street (1.097 kg). The highest PM2.5 absorption values were recorded in September on PuławskaStreet (0.288 kg), and in October on Żwirki i Wigury Street (0.399 kg) and on Marszałkowska Street (0.128 kg). Figure 5 shows the average PM10 and PM2.5 absorptions throughout the year.
On Marszałkowska Street, Tilia cordata absorbs 99.7% of PM10 and 99.6% of PM2.5. The percentage absorption of PM10 and PM2.5 by Tilia tomentosa is 0.002, while Quercus robur absorbs 0.0006% of PM10 and 0.001% of PM2.5. Average pollution removal value by street measured is also presented (Figure 6, Figure 7 and Figure 8).
At the Puławska Street location, the most effective species is Fraxinus sp., which is the predominant species in the area, and is responsible for absorbing 81.3% of both PM10 and PM2.5. The species that absorbs the least PM at the location is Robinia sp. It absorbs only 0.001% of both types of PM.
In the case of the study area at Żwirki i Wigury Street, the trees of the Tilia cordata species are 100% responsible for absorbing both types of PM.
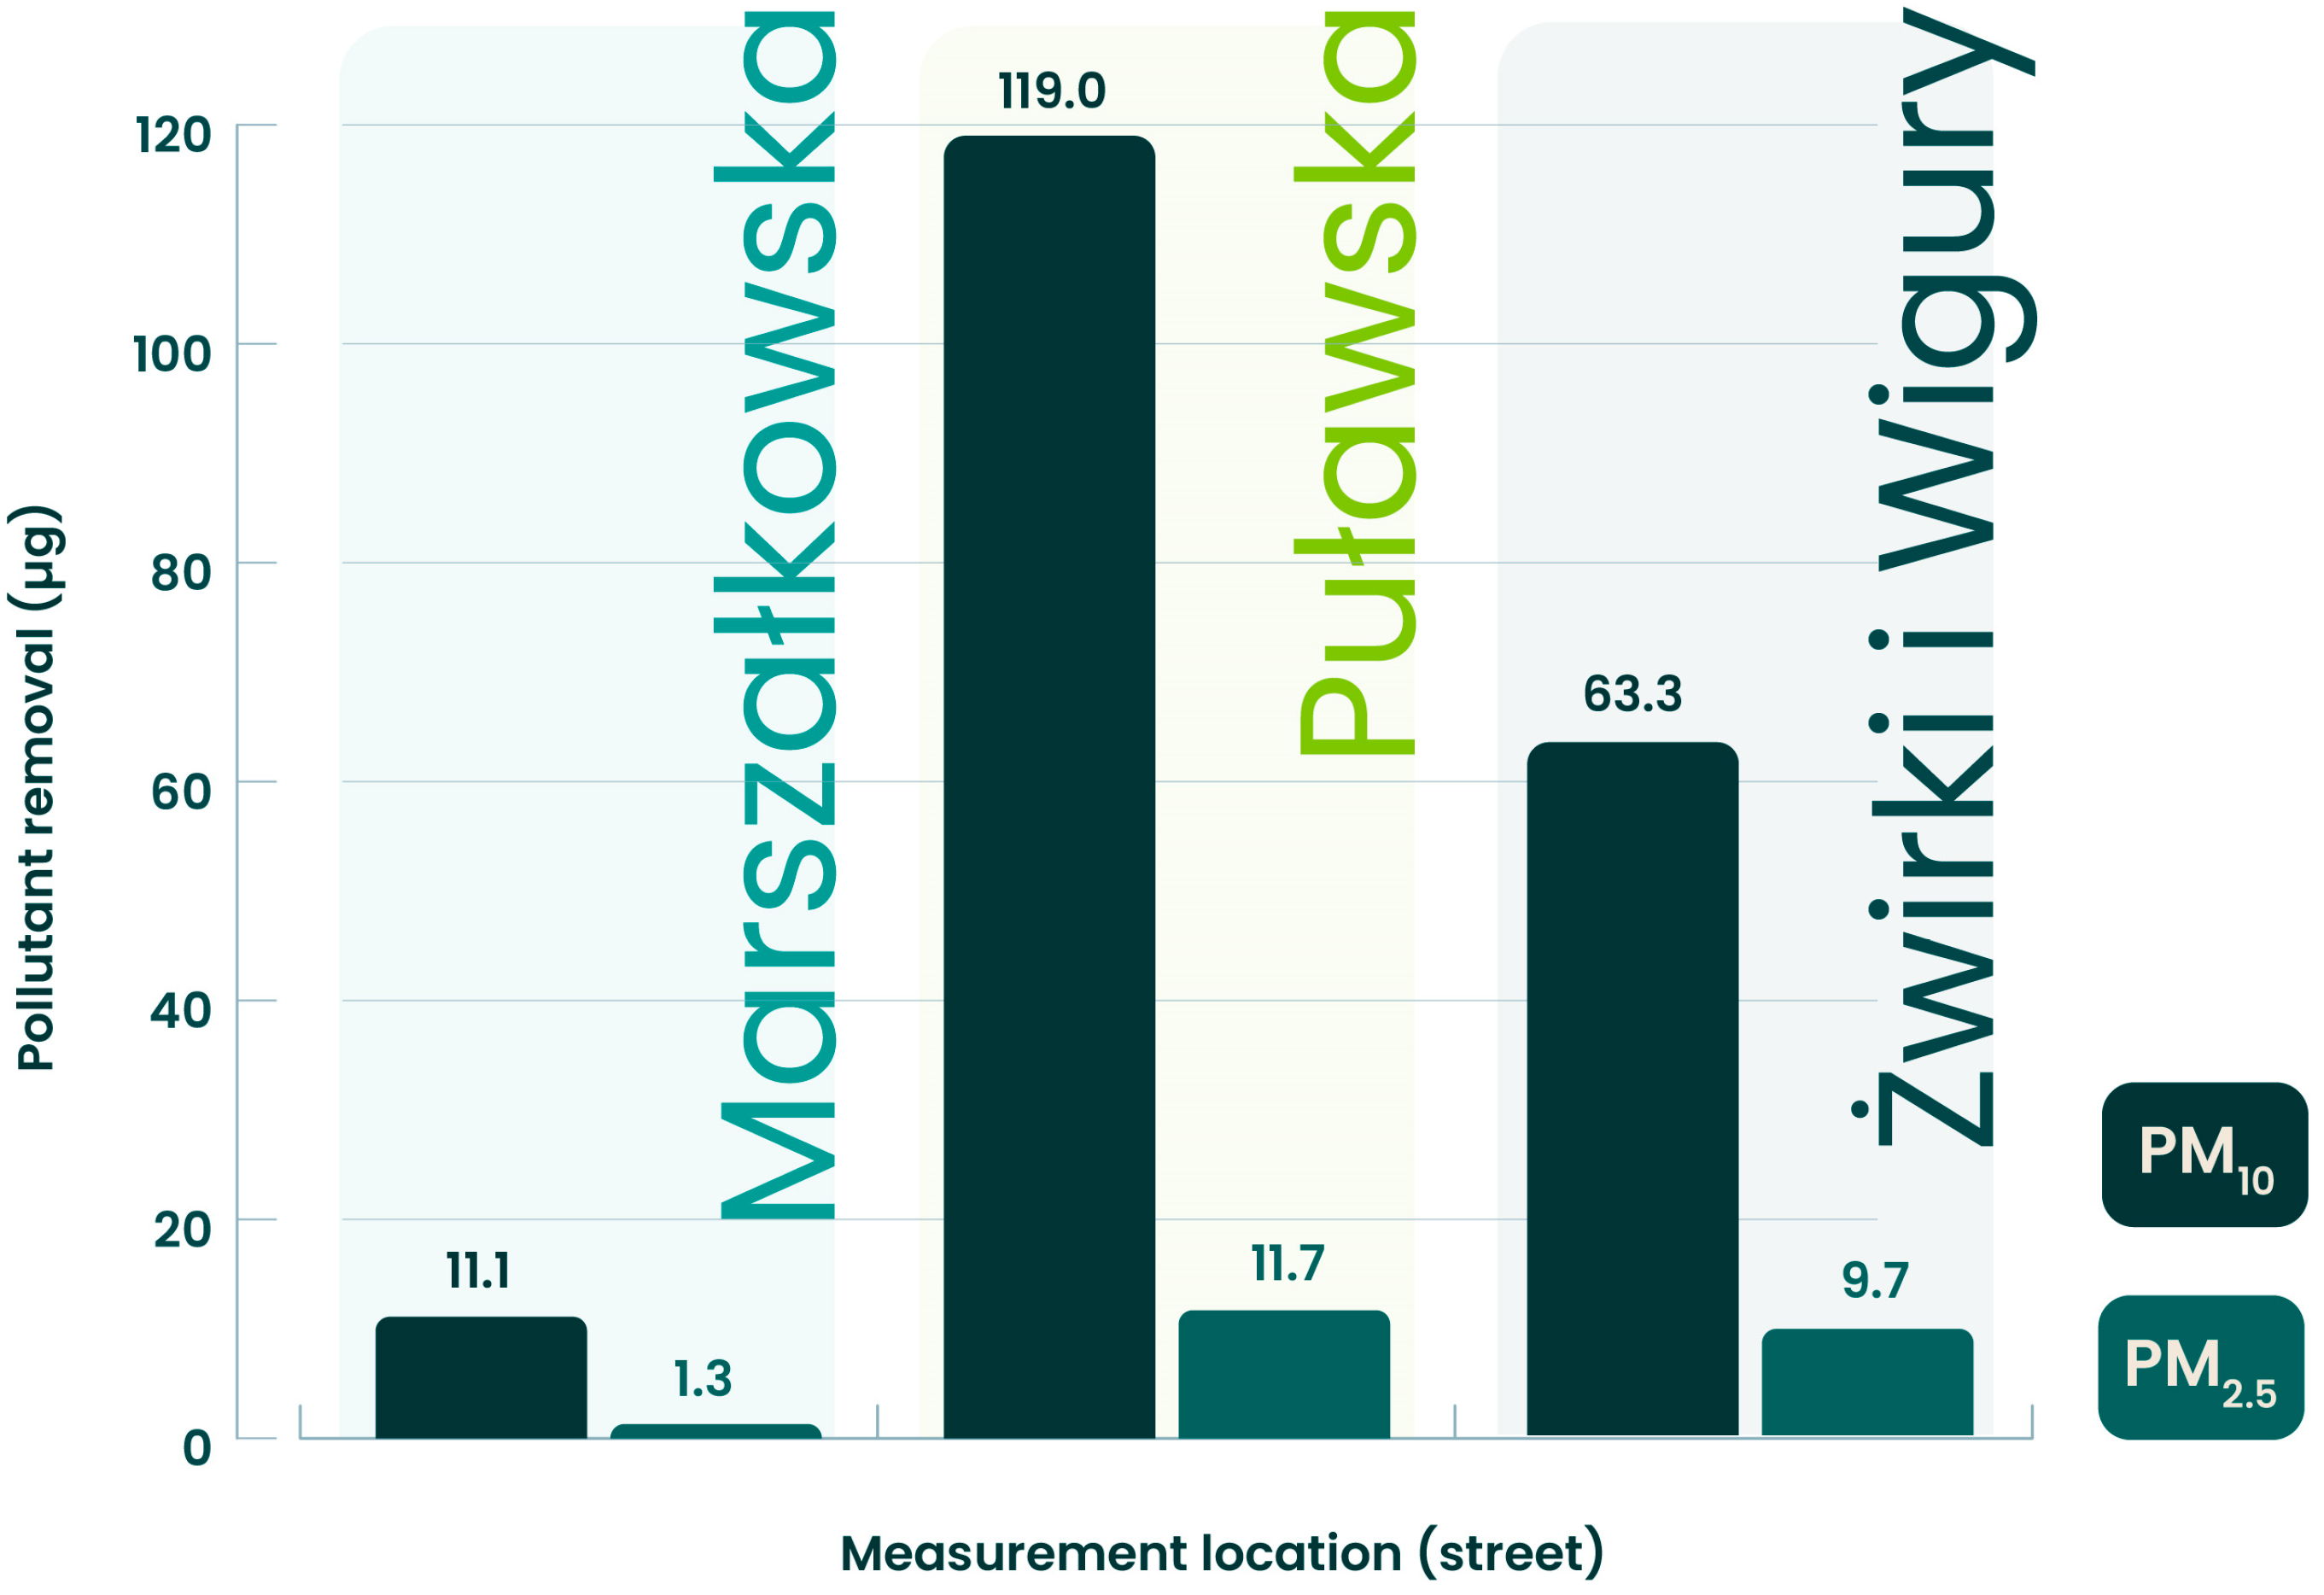
Absorption capacities on individual streets and for specific species were calculated to identify those that are most effective, and the average for a single tree was calculated. It was shown that the most effective trees are on Pulawska Street, with an average of 119.0 g PM10/tree (total uptake of 9280.9 g PM10/street) and 11.7 g PM2.5/tree (total uptake of 914.3 g PM2.5/street), followed by those on Żwirki i Wigury Street, with an average of 63.3 g PM10/tree (total uptake of 10,071.5 g PM10/street) and 9.7 g PM2.5/tree (total uptake of 1540.9 g PM2.5/tree). Trees located along Marszałkowska Street are the least effective in absorption, with an average of 11.0 g PM10/tree (total absorption of 1097.7 g PM10/street) and 1.28 g PM2.5/tree (total absorption of 128.20 g PM2.5/street) (Figure 5).
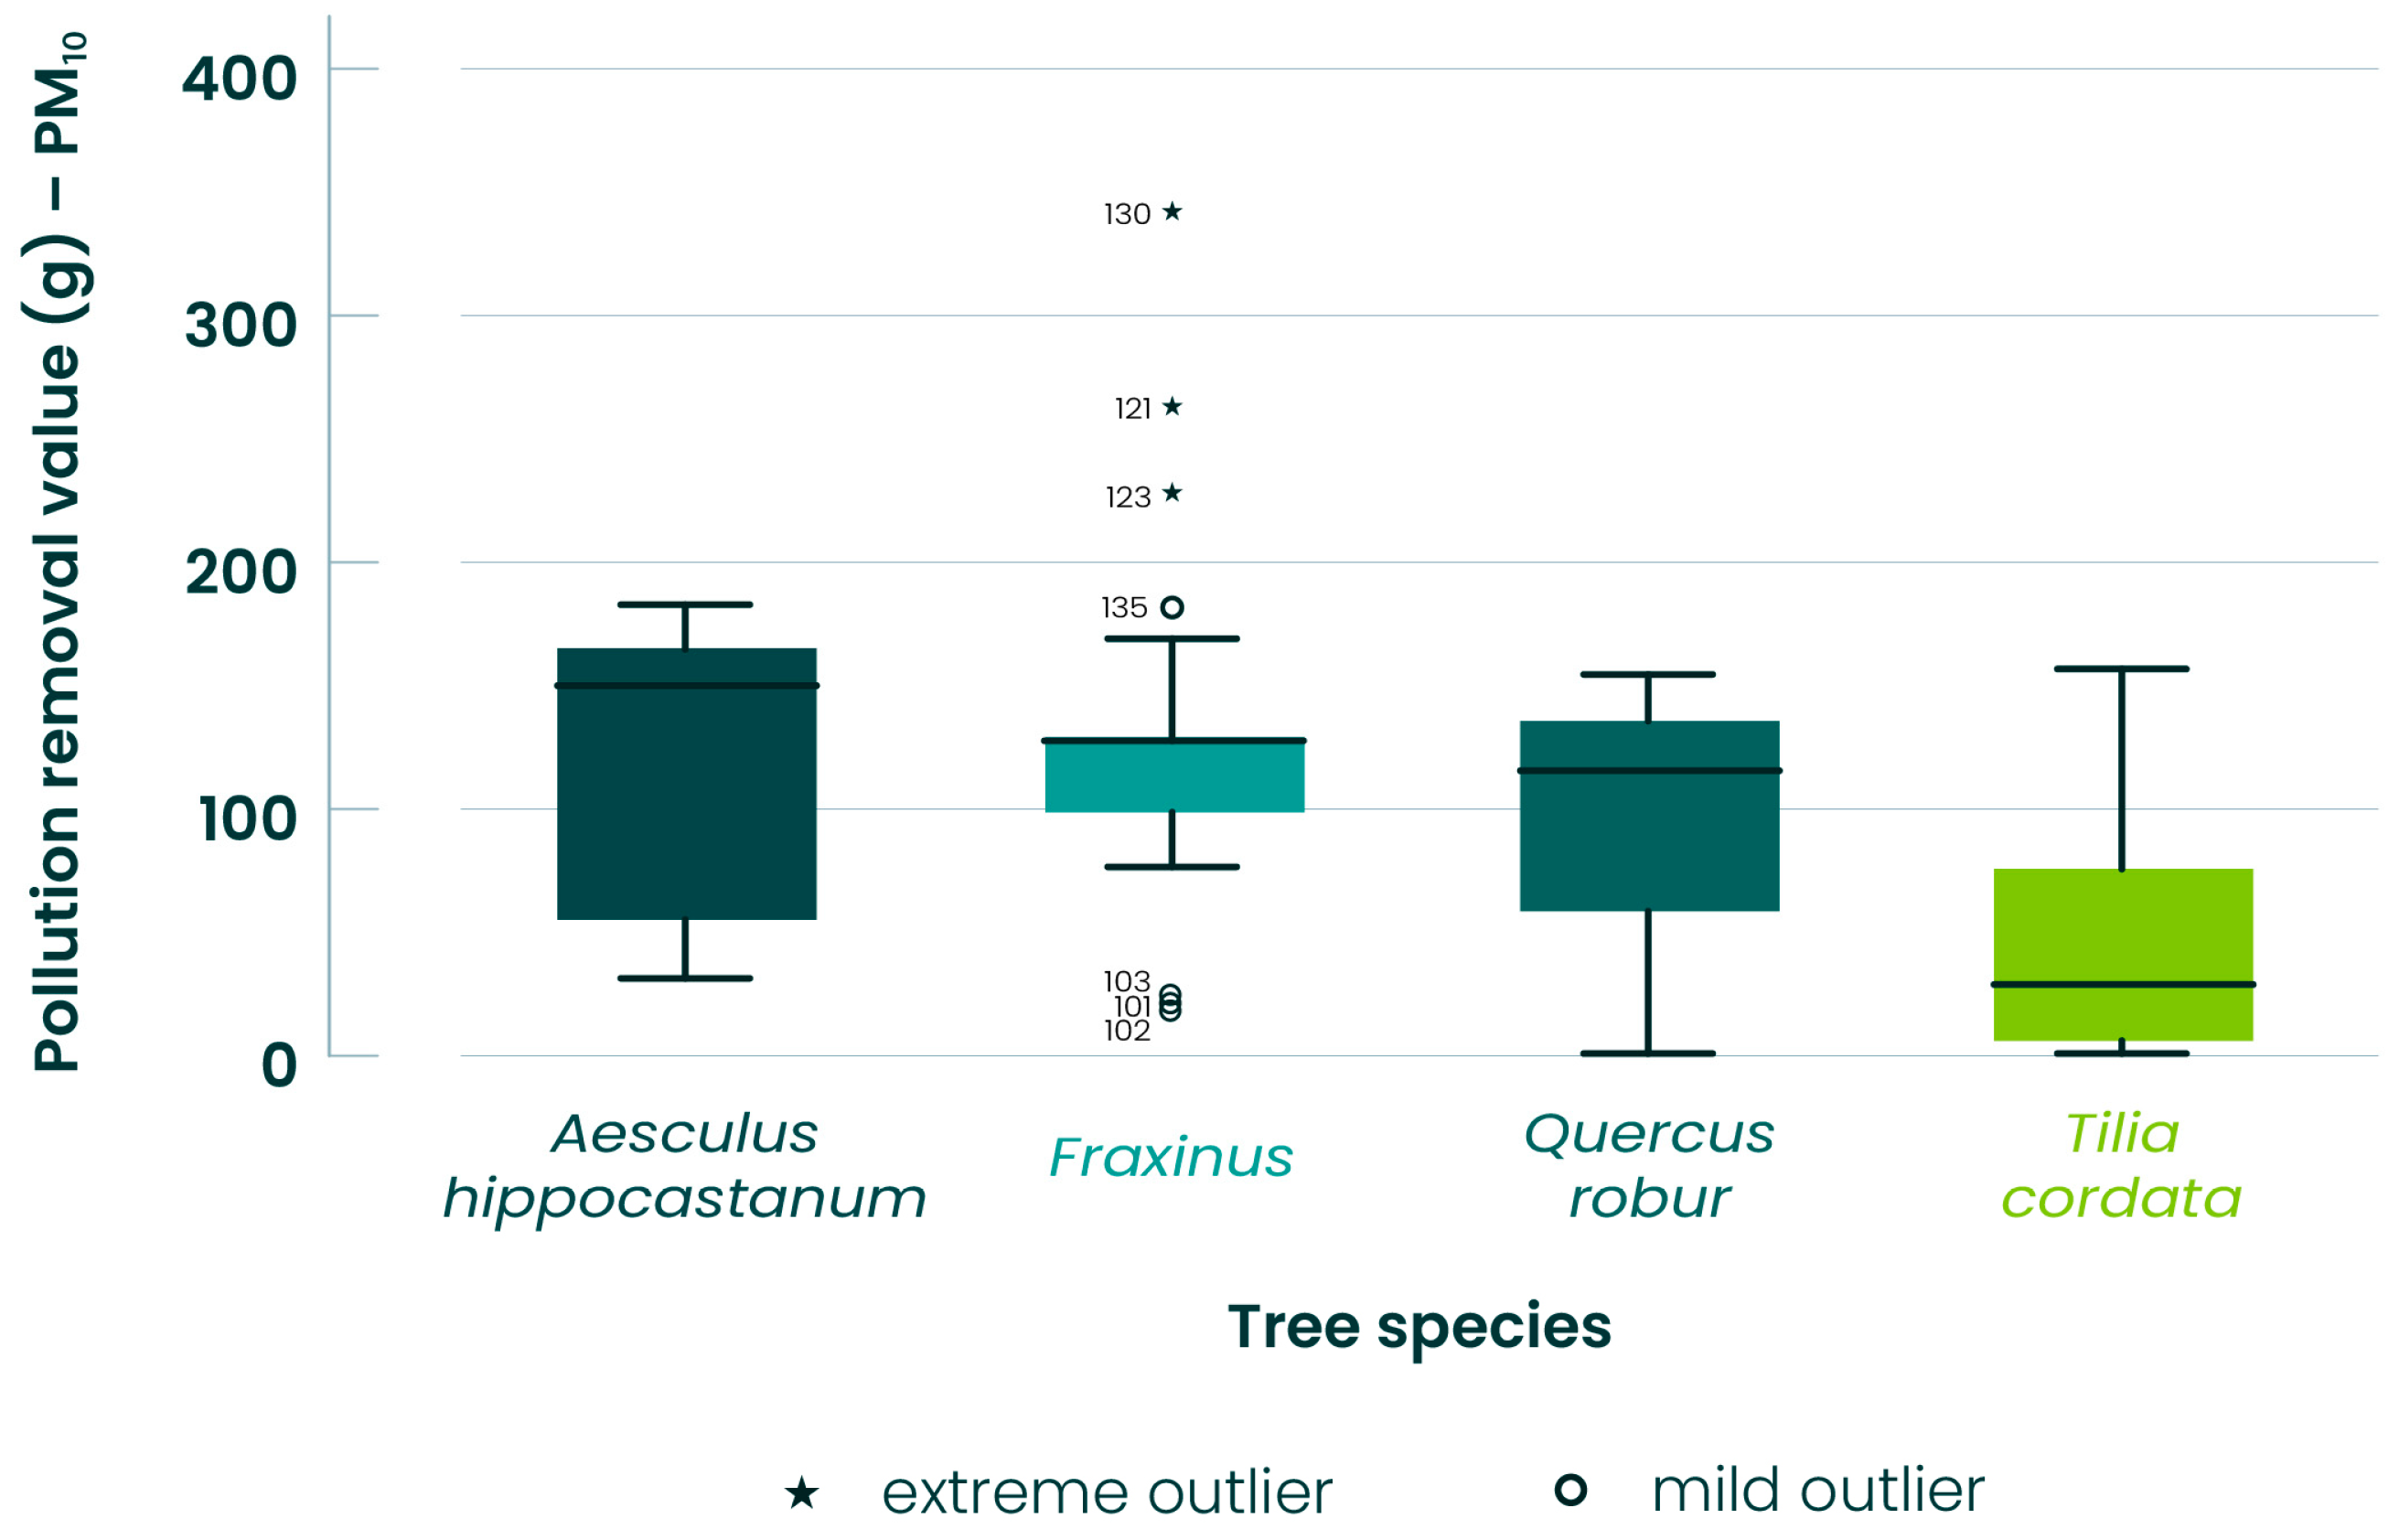
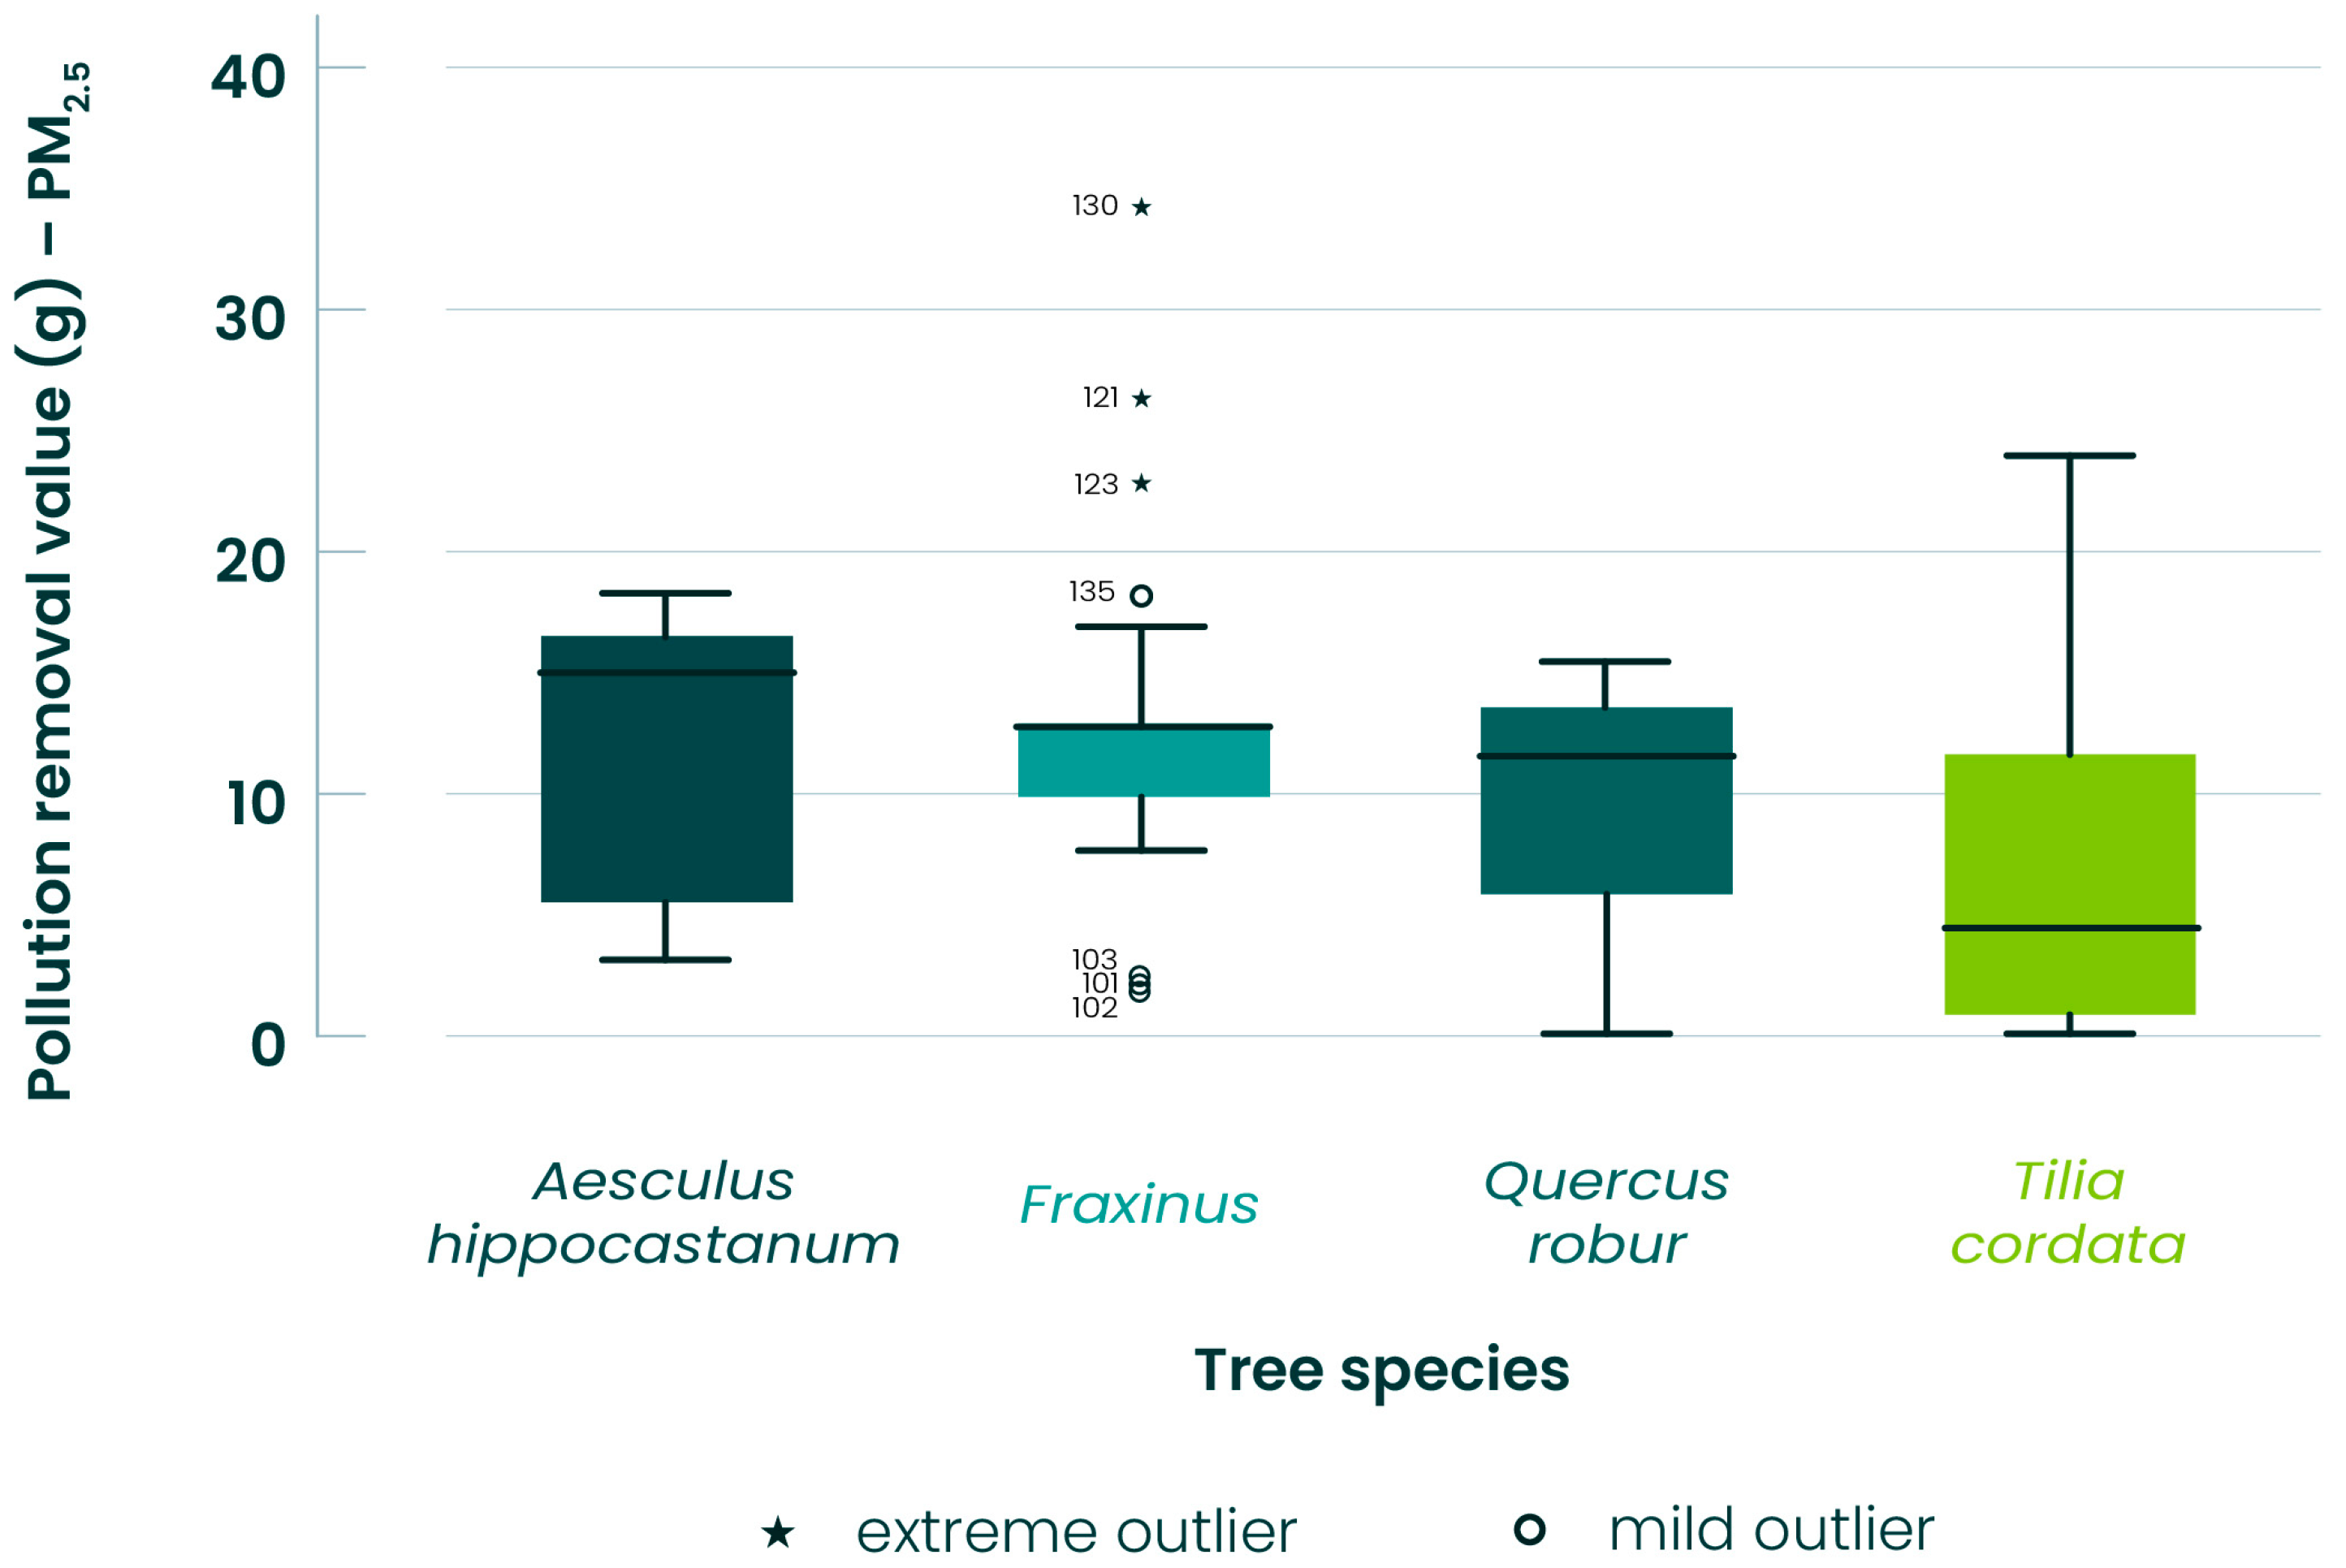
An analysis of the pollutant uptake capacity for each species is shown in Figure 9. It was noted that Aesculus hippocastanum removes an average of 116.6 g PM10/tree and 11.5 g PM2.5/tree. For Fraxinus excelsior, this figure is 123.7 g PM10/tree and 12.2 g PM2.5/tree, while Quercus robur absorbs an average of 90.0 g PM10/tree and 8.9 g PM2.5/tree. The last species analysed was Tilia cordata, with an average PM10 uptake of 50.5 g/tree and 7.6 g PM2.5/tree.
A Kruskal–Wallis test was performed and showed that there were significant differences between the PM10 uptake of Tilia cordata versus Aesculus hippocastanum and Tilia cordata versus Fraxinus excelsior, and significant differences in PM2.5 uptake for Tilia cordata versus Fraxinus excelsior.

3.2. Comparison of Methods

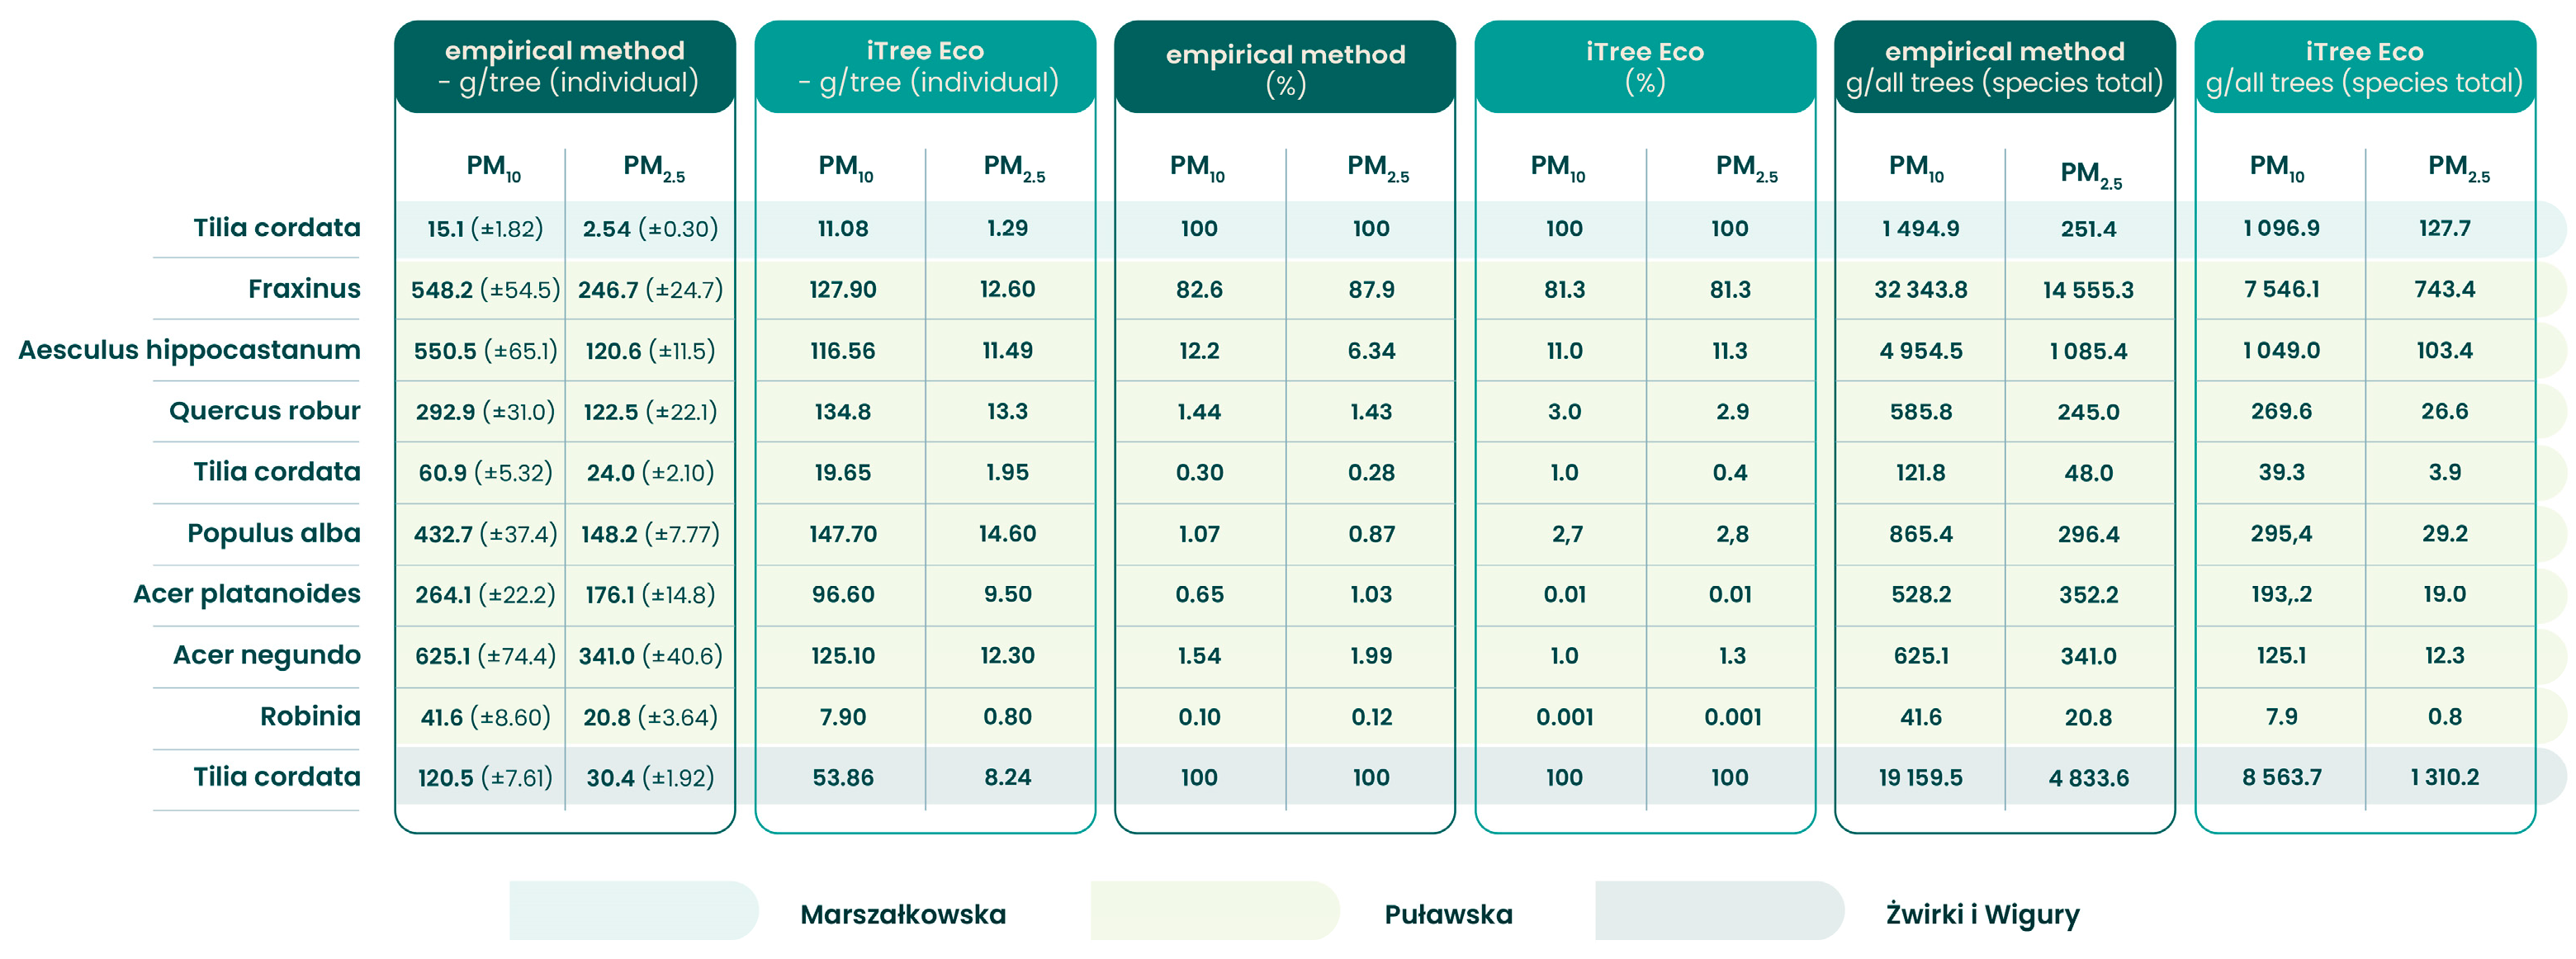
The results obtained for both the empirical study and those synthesised from the i-Tree Eco simulation were the starting data for the comparative analysis of the two methods. The combined results for both methods are shown in Figure 9. The comparison for individual tree species and both methods is shown in Figure 9.
When comparing the mean annual PM10 accumulation for individual tree species of the Aesculus hippocastanum species, the mean result for the laboratory method is 59.2 g/tree, and for i-Tree Eco it is 116.6 g/tree; for the Fraxinus species, the mean PM10 uptake result for the laboratory method is 58.9 g/tree and for i-Tree Eco it is 123.7 g/tree. For the species Quercus robur, the average accumulation calculated using the laboratory method is 21.1 g/tree and for i-Tree Eco it is 90.0 g/tree. The last species for which a comparison was made is Tilia cordata—the result of the mean annual accumulation with the laboratory method is 12.0 g/tree and with the i-Tree Eco method it is equal to 43.6 g/tree.
A similar comparison was made for PM2.5 uptake. The results obtained in the PM2.5 comparison were much closer to each other than for PM10. Accordingly, the following results were obtained for the species Aesculus hippocastanum—the average annual PM2.5 accumulation obtained with the laboratory method was 13.0 g/tree, while with the i-Tree Eco method, it was 11.5 g/tree. For Fraxinus, the average annual PM2.5 uptake obtained with the laboratory method was 13.8 g/tree and with the i-Tree Eco method it amounted to an average of 12.2 g/tree. For the Quercus robur species, the following results were obtained—the PM2.5 uptake with the laboratory method is 8.8 g/tree and with the i-Tree Eco method 8.9 g/tree. The last species that was analysed was Tilia cordata—the result obtained with the laboratory method was 3.0 g/tree and with the i-Tree Eco method it was 6.5 g/tree. This was the case in which the largest difference in results was obtained.

4. Discussion

4.1. Technical Aspects of the Methods Analysed

Studies of urban PM air pollution are currently largely shaped by the i-Tree Eco model [41,42]. A comparison of the results obtained from an analysis using the i-Tree Eco model and the analytical method has only been performed in a study by Pace et al. [24]. The model has the advantage of being able to assess and value factors other than European Union air purification, while the laboratory method used in our study focuses on one type of pollution—the removal of PM by trees [27,28].
However, for analytical methods, the determination of the actual amount of pollutant on the plants and the precision of the measurement is an important advantage [43]. In addition, the possibility to select experimental sites taking into account the distance from the pollutant source, the location of the tree in the community, and the location of the sample on the plant, is a major benefit. This, with the support of the Leaf Area Index (LAI), allows a more accurate estimation of the amount of PM deposition on the plant at the time of the study [44]. In contrast to the i-Tree Eco method, an experiment analysing the role of weather factors can be carried out with the inclusion of rainfall data to ensure the washed PM values are accurately captured. In addition, empirical methods allow measurements to be made on a variety of objects and not just trees, as is the case with i-Tree Eco.
The disadvantages of laboratory analyses include their poor availability compared to i-Tree Eco software, as well as them being labour-intensive and high in costs. Furthermore, particle extraction with solvents can cause contamination of the samples [45]. This leads to a risk of interfering with the results by said contamination or the use of very poorly dissociated acids [46,47].
The i-Tree Eco model, which is the most popular tool used to assess ecosystem services, is based on procedures relating to deposition rates and resuspension rates for all tree species on the basis of a total leaf count and wind speed [24]. Various methods are used in laboratory studies, including random sampling, the replicate method, determination of PM by differential weighting, and the analysis of leaf constituents by optical measurements at specific wavelengths [48].
The i-Tree Eco model uses standardised technologies and is based on a peer-reviewed methodology supported by field research; moreover, the application is freely available to the public and offers technical support [49]. These should be considered its significant advantages, as should the short time needed to obtain results [50].
One of the main disadvantages of the i-Tree Eco model is the need to determine the effects and values of urban forests through modelling approaches, as they are difficult to define and measure directly in the field. The dynamics of change in urban forests and the results being dependent on precise field and ancillary data and important aspects (e.g., pollution data) cause the values obtained in the model not to be absolute [51]. The differences between the methods are shown in Table 1.
When collecting field data for use in the i-Tree Eco model, it would be beneficial to take into account factors affecting the ability to consider terrain factors influencing pollutant absorption, which would improve the accuracy of the results. Construction works carried out within the root system of trees have a negative impact on soil condition, causing mechanical damage and soil compaction [53,54,55]. It is assumed that these conditions have a negative impact on tree growth, limiting their potential to only a few years of vegetation [56]. An additional burden on the well-being of urban trees is soil contamination with heavy metals and elevated pH levels [57,58]. Other signs of poor tree health in urban conditions include the necrosis of entire leaves and leaf margins, abnormal growth and development of the root system [59], as well as vigour, twig dieback, twig growth, and the extent and severity of leaf chlorosis and leaf scorch [60]. These properties, mainly due to leaf loss, are directly related to the lower value of the ecosystem services provided. The proposed solutions include the use of conversion factors in the calculations in order to obtain more comprehensive information about the habitat. The i-Tree Eco model processes information about the division of the tree crown area into impervious and shrubby areas [39]; however, it would also be worth including impermeable site types in the calculations. Impermeable sites may differ in terms of the available space for root development [60] and in the modification of the habitat using, among other things, structural soil mixtures [61], which should be taken into account when entering values for the algorithm.

4.2. Differences in the Results Obtained with the Two Methods–Model and Empirical Method

The i-Tree Eco method was based on empirical measurements. The PM10 uptake efficiency of the i-Tree Eco method was found to be overestimated when calculated for all species. A comparison of the average annual PM10 accumulation for individual tree species for Tilia sp. showed a laboratory value of 24% of the PM10 uptake efficiency claimed by i-Tree Eco, while for Fraxinus sp.., the empirical study indicated an efficiency of 47.6% compared to that claimed by i-Tree Eco; meanwhile, for Aesculus sp. it was 50.77% and for Quercus robur 23.4% of the efficiency claimed by i-Tree Eco. No significant overestimation was found for PM2.5 when comparing results obtained by the i-Tree Eco method and empirically. The differences in results ranged from 12% to 46% for the species studied, with the 46% difference being recorded for only one species.

4.3. Potential Reasons for Differences Between Methods

The i-Tree Eco method does not take into account the habitat stress factor—the condition is expressed by the percentage of dead branches in the crown at the time of the inventory [39]; it does not take into account phenology, such as the earlier leaf drop of trees [58] or reduction in leaf area [62] under stress conditions. Trees growing under habitat stress shed their leaves before the end of the growing season and differences between stressed and non-stressed trees can reach up to 30 days [63]. It seems important in the analyses to include the habitat stress factor in the calculation of PM uptake levels. The results obtained show a variety of pollutant uptake by linden trees in different locations. The results showed that environmental and, above all, habitat conditions are important. Despite the fact that, along with other urban conditions, PM negatively affects the photosynthetic process—so the efficiency of air purification will also be conditioned by the concentration of PM in the air [64]—it can be concluded that this is a necessary action to improve the habitat conditions of plants so that they can provide ecosystem services at a high level.
Research by Staples et al. highlights the importance of ecosystem restoration to increase biodiversity and consequently improve ecosystem services such as habitat creation and carbon sequestration [65]. Quigley [66], in his study, found that urban trees had smaller trunk diameters than rural trees of the same age, influenced by proximity to impervious areas, showing reduced growth rates and, consequently, reduced final size. In the case of deteriorated habitat conditions (small tree pits surrounded by the impermeable areas of Marszałkowska Street) and consequently weakened root systems, trees are in poorer condition due, for example, to the depletion of biodiversity within the rhizosphere [67], resulting in lower PM uptake values. Achieving a high level of ecosystem services therefore involves improving habitat conditions and enabling the potential to clean the air of PM but also to perform other ecosystem services independent of the species. The i-Tree Eco method only considers visual crown loss (the number of lost branches) and the visual percentage loss of leaves without taking specific stress factors into account when conducting the analyses.

4.4. Benefits of Urban Tree Planting

A significant trend in contemporary research is focused on assessing the ecological benefits of urban tree planting, with particular emphasis on air purification. In his research, Zhang [68] points to the benefits in terms of air quality improvement. Similar results were obtained in studies conducted by Riondato [69], which pointed to the potential of urban trees to remove PM2.5 when compared to a tree-free avenue. Absorption results were significantly higher in the tree-lined avenue than in the tree-free avenue.
Furthermore, biodiversity studies indicate links between health benefits and biodiversity. Studies conducted by Fuller [70] and Van der Berg [71] point to a link between biodiversity and mental health benefits. In addition, research conducted by Hanski [72] proved the impact of biodiversity on minimising the effects of allergies. Health risks caused by the inability of trees to purify the air and shade the area have also been linked to the possibility of heart attacks and asthma attacks [73]. In the above studies, Hopkins demonstrated the negative impact of the lack of trees on the increased incidence of these health risks. In summary, tree planting with biodiversity in mind should be particularly recommended to decision makers involved in the planning and approval of urban planting projects.
The study suggests that the compared methods have different applications. i-Tree Eco allows for research to be conducted in a broader spatio-temporal perspective. Laboratory methods are definitely more effective in small-scale case studies and when studying processes related to phytoremediation of PM from the air, e.g., PM retention on plants, the impact of PM on plants, etc. However, the results of laboratory studies should be used to improve i-Tree Eco models and to validate them.

5. Conclusions

Analysing the two methods, we can conclude that the i-Tree Eco method is limited by the risk of error due to, amongst other things, the lack of consideration of the local conditions in a wider context or the possibility of an error by the field worker during the collection of the inventory data. The main limitations of the empirical method, on the other hand, are the lack of standardisation and the dependence of the results on weather conditions.
A comparison of the results obtained with the two methods showed significant differences in the results for PM10. The differences in the results obtained occur in both directions—this means that the rule that i-Tree Eco over- or underestimates the results when compared with the laboratory method has not been confirmed. At the same time, biodiversity in tree-lined avenues enhances ecosystem services, which should be considered when planning plantings.
The results obtained indicate that trees which grow in the right habitat can guarantee a higher value of ecosystem services—the results obtained on Żwirki i Wigury confirm this assumption. The difference in habitat conditions is most evident on Marszałkowska Street, where the planted trees are not provided with the optimal conditions for growth and the uptake values are much lower than for the other streets. The Tilia cordata Mill. species planted in two different habitats behaves quite differently in terms of PM10 and PM2.5 uptake efficiency also due to the phytosanitary condition of the plants, which most likely influences their growth potential and thus their air purification efficiency.
To make the PM uptake result more realistic, one possible approach is to leverage the strengths of both methods, i.e., to compare the relatively easy-to-obtain i-Tree Eco results and the results obtained with the laboratory method. A comparison of this kind makes it possible to take local conditions, for example, habitat conditions, into account in the analysis and thus to ‘calibrate’ the i-Tree Eco model to a certain extent. It seems that the urban forest management process requires periodic verification of the PM uptake efficiency of urban forests using laboratory methods, especially in climate change dynamics.
Further research may focus on comparative analyses between the i-Tree Eco algorithms and both local habitat and the trees’ physiological conditions.

Author Contributions

Conceptualization, K.K.; Methodology, K.K. and A.P.; Software, K.K.; Validation, A.P.; Formal analysis, K.K.; Investigation, K.K.; Writing—original draft, K.K., M.S., O.B. and A.P.; Writing—review & editing, K.K., M.S., O.B. and A.P.; Visualization, O.B.; Supervision, M.S. and A.P.; Project administration, M.S. All authors have read and agreed to the published version of the manuscript.

Funding

This research received no external funding.

Institutional Review Board Statement

Not applicable.

Informed Consent Statement

Not applicable.

Data Availability Statement

The data presented in this study are available on request from the corresponding author.

Conflicts of Interest

The authors declare no conflicts of interest.

References

  1. Guyatt, A.L.; Cai, Y.S.; Doiron, D.; Tobin, M.D.; Hansell, A.L. Air pollution, lung function and mortality: Survival and mediation analyses in UK Biobank. ERJ Open Res. 2024, 10, 00093-2024. [Google Scholar] [CrossRef]
  2. Syuhada, G.; Akbar, A.; Hardiawan, D.; Pun, V.; Darmawan, A.; Heryati, S.H.A.; Siregar, A.Y.M.; Kusuma, R.R.; Driejana, R.; Ingole, V.; et al. Impacts of air pollution on health and cost of illness in Jakarta, Indonesia. Int. J. Environ. Res. Public Health 2023, 20, 2916. [Google Scholar] [CrossRef] [PubMed]
  3. Brook, R.D.; Franklin, B.; Cascio, W.; Hong, Y.; Howard, G.; Lipsett, M.; Luepker, R.; Mittleman, M.; Samet, J.; Smith, S.C., Jr.; et al. Air pollution and cardiovascular disease: A statement for healthcare professionals from the expert panel on population and prevention science of the American Heart Association. Circulation 2004, 109, 2655–2671. [Google Scholar] [CrossRef] [PubMed]
  4. Brook, R.D.; Rajagopalan, S.; Pope, C.A., 3rd; Brook, J.R.; Bhatnagar, A.; Diez-Roux, A.V.; Holguin, F.; Hong, Y.; Luepker, R.V.; Mittleman, M.A.; et al. Particulate matter air pollution and cardiovascular disease: An update to the scientific statement from the American Heart Association. Circulation 2010, 121, 2331–2378. [Google Scholar] [CrossRef]
  5. Pope, C.A., III.; Dockery, D.W. Health effects of fine particulate air pollution: Lines that connect. J. Air Waste Manag. Assoc. 2006, 56, 709–742. [Google Scholar] [CrossRef]
  6. Dockery, D.; Pope, C.; Xu, X.; Spengler, J.; Ware, J.; Fay, M. An association between air-pollution and mortality in 6 United-States cities. N. Engl. J. Med. 1993, 329, 1753–1759. [Google Scholar] [CrossRef] [PubMed]
  7. Meng, X.; Ma, Y.; Chen, R.; Zhou, Z.; Chen, B.; Kan, H. Size-fractionated particle number concentrations and daily mortality in a Chinese city. Environ. Health Perspect. 2013, 121, 1174–1178. [Google Scholar] [CrossRef]
  8. Stanaway, J.D.; Afshin, A.; Gakidou, E.; Lim, S.S.; Abate, D.; Abate, K.H.; Abbafati, C.; Abbasi, N.; Abbastabar, H.; Abd-Allah, F.; et al. Global, regional, and national comparative risk assessment of 84 behavioural, environmental and occupational, and metabolic risks or clusters of risks for 195 countries and territories, 1990–2017: A systematic analysis for the Global Burden of Disease Study 2017. Lancet 2018, 392, 1923–1994. [Google Scholar] [CrossRef]
  9. Vos, T.; Slim, S.; Abbafati, C.; Abbas, K.M.; Abbasi, M.; Abbasifard, M.; Abbasi-Kangevari, M.; Abbastabar, H.; Abd-Allah, F.; Abdelalim, A.; et al. Global burden of 369 diseases and injuries in 204 countries and territories, 1990–2019: A systematic analysis for the Global Burden of Disease Study 2019. Lancet 2020, 396, 1204–1222. [Google Scholar] [CrossRef]
  10. Pandey, A.; Behera, S.K.; Dwivedi, S.; Singh, V.K.; Pandey, V. Assessment of phytodiversity and phytoremediation potential of plants in the vicinity of a thermal power plant. Int. J. Phytoremediat. 2024, 26, 1863–1872. [Google Scholar] [CrossRef]
  11. Mandal, M.; Popek, R.; Przybysz, A.; Roy, A.; Das, S.; Sarkar, A. Breathing fresh air in the city: Implementing avenue trees as a sustainable solution to reduce particulate pollution in urban agglomerations. Plants 2023, 12, 1545. [Google Scholar] [CrossRef]
  12. Petrova, S. The added value of urban trees (Tilia tomentosa Moench, Fraxinus excelsior L. and Pinus nigra J.F. Arnold) in terms of air pollutant removal. Forests 2024, 15, 1034. [Google Scholar] [CrossRef]
  13. Chen, D.; Yan, J.; Sun, N.; Sun, W.; Zhang, W.; Long, Y.; Yin, S. Selective capture of PM2.5 by urban trees: The role of leaf wax composition and physiological traits in air quality enhancement. J. Hazard. Mater. 2024, 478, 135428. [Google Scholar] [CrossRef]
  14. Saadat, O.; Teiri, H.; Mohammadi, F.; Hajizadeh, Y. Accumulation of heavy metals in the leaves of different tree species and its association with the levels of atmospheric PM2.5-bond heavy metals in Isfahan. Int. J. Phytoremediat. 2025, 27, 260–270. [Google Scholar] [CrossRef]
  15. Steinparzer, M.; Schaubmayr, J.; Godbold, D.L.; Rewald, B. Particulate matter accumulation by tree foliage is driven by leaf habit types, urbanization-and pollution levels. Environ. Pollut. 2023, 335, 122289. [Google Scholar] [CrossRef]
  16. Shan, Y.; Shen, Z.; Zhou, P.; Zou, X.; Che, S.; Wang, W. Quantifying air pollution attenuation within urban parks: An experimental approach in Shanghai, China. Environ. Pollut. 2011, 159, 2155–2163. [Google Scholar] [CrossRef] [PubMed]
  17. Dazzi, C.; Lo Papa, G. Anthropogenic soils: General aspects and features. Ecocycles 2015, 1, 3–8. [Google Scholar] [CrossRef]
  18. McDonald, A.G.; Bealey, W.J.; Fowler, D.; Dragosits, U.; Skiba, U.; Smith, R.I.; Donovan, R.G.; Brett, H.E.; Hewitt, C.N.; Nemitz, E. Quantifying the effect of urban tree planting on concentrations and depositions of PM10 in two UK conurbations. Atmos. Environ. 2007, 41, 8455–8467. [Google Scholar] [CrossRef]
  19. Sicard, P.; Pascu, I.-S.; Petrea, S.; Leca, S.; De Marco, A.; Paoletti, E.; Agathokleous, E.; Calatayud, V. Effect of tree canopy cover on air pollution-related mortality in European cities: An integrated approach. Lancet Planet. Health 2025, 9, e527–e537. [Google Scholar] [CrossRef]
  20. Li, Y.; Chen, X.; Sonne, C.; Lam, S.S.; Yang, Y.; Ma, N.L.; Peng, W. Reduction and control of air pollution: Based on plant-microbe interactions. Environ. Pollut. Bioavailab. 2023, 35, 2173657. [Google Scholar] [CrossRef]
  21. Barnes, M.J.; Brade, T.K.; MacKenzie, A.R.; Whyatt, J.D.; Carruthers, D.J.; Stocker, J.; Cai, X.; Hewitt, C.N. Spatially-varying surface roughness and ground-level air quality in an operational dispersion model. Environ. Pollut. 2014, 185, 44–51. [Google Scholar] [CrossRef]
  22. Mazur, J. Plants as natural anti-dust filters—Preliminary research. Tech. Trans. 2018, 115, 165–172. [Google Scholar] [CrossRef]
  23. Nowak, D.J.; Crane, D.E.; Stevens, J.C. Air pollution removal by urban trees and shrubs in the United States. Urban For. Urban Green. 2006, 4, 115–123. [Google Scholar] [CrossRef]
  24. Pace, R.; Guidolotti, G.; Baldacchini, C.; Pallozzi, E.; Grote, R.; Nowak, D.J.; Calfapietra, C. Comparing i-Tree Eco estimates of particulate matter deposition with leaf and canopy measurements in an urban Mediterranean holm oak forest. Environ. Sci. Technol. 2021, 55, 6613–6622. [Google Scholar] [CrossRef]
  25. Vashist, M.; Kumar, T.V.; Singh, S.K. Assessment of air quality benefits of vegetation in an urban-industrial region of India by integrating air monitoring with i-Tree Eco model. Clean-Soil Air Water 2024, 52, 2300198. [Google Scholar] [CrossRef]
  26. Satoshi, H.; Kroll, C.N.; Nowak, D.J.; Endreny, T.A. I-Tree eco dry deposition model descriptions. Citeseer 2012, 36, 1–43. [Google Scholar]
  27. Nersisyan, G.; Przybysz, A.; Vardanyan, Z.; Sayadyan, H.; Muradyan, N.; Grigoryan, M.; Ktrakyan, S. Peculiarities of particulate matter absorption by urban tree species in the major cities of Armenia. Sustainability 2024, 16, 10217. [Google Scholar] [CrossRef]
  28. Popek, R.; Roy, A.; Mandal, M.; Przybysz, A.; Drążkiewicz, K.; Romanowska, P.; Sarkar, A. Enhancing urban sustainability: How spatial and height variability of roadside plants improves pollution capture for greener cities. Sustainability 2024, 16, 11131. [Google Scholar] [CrossRef]
  29. Roy, A.; Das, S.; Singh, P.; Mandal, M.; Kumar, M.; Rajlaxmi, A.; Vijayan, N.; Awasthi, A.; Chhetri, H.; Roy, S.; et al. Summer-time monitoring and source apportionment study of both coarse, fine, and ultra-fine particulate pollution in Eastern Himalayan Darjeeling: A hint to health risk during peak tourist season. MAPAN 2024, 39, 995–1009. [Google Scholar] [CrossRef]
  30. Sgrigna, G.; Baldacchini, C.; Dreveck, S.; Cheng, Z.; Calfapietra, C. Relationships between air particulate matter capture efficiency and leaf traits in twelve tree species from an Italian urban-industrial environment. Sci. Total Environ. 2020, 718, 137310. [Google Scholar] [CrossRef]
  31. Wang, L.; Gong, H.; Liao, W.; Wang, Z. Accumulation of particles on the surface of leaves during leaf expansion. Sci. Total Environ. 2015, 532, 420–434. [Google Scholar] [CrossRef]
  32. Muhammad, S.; Wuyts, K.; Samson, R. Atmospheric net particle accumulation on 96 plant species with contrasting morphological and anatomical leaf characteristics in a common garden experiment. Atmos. Environ. 2019, 202, 328–344. [Google Scholar] [CrossRef]
  33. Shao, F.; Wang, L.; Sun, F.; Li, G.; Yu, L.; Wang, Y.; Zeng, X.; Yan, H.; Dong, L.; Bao, Z. Study on different particulate matter retention capacities of the leaf surfaces of eight common garden plants in Hangzhou, China. Sci. Total Environ. 2019, 652, 939–951. [Google Scholar] [CrossRef]
  34. Zhang, Y.; Tang, L.; Croteau, P.L.; Favez, O.; Sun, Y.; Canagaratna, M.R.; Wang, Z.; Couvidat, F.; Albinet, A.; Zhang, H.; et al. Field characterization of the PM2.5 aerosol chemical speciation monitor: Insights into the composition, sources, and processes of fine particles in eastern China. Atmos. Chem. Phys. 2017, 17, 14501–14517. [Google Scholar] [CrossRef]
  35. Poland in Numbers. The City of Warsaw in Numbers. Available online: https://www.polskawliczbach.pl/Warszawa (accessed on 3 August 2025).
  36. Euractiv.pl. Available online: https://www.euractiv.pl/section/energia-i-srodowisko/news/mroz-smog-piec-warszawa-wroclaw-zanieczyszczenie-powietrze-miasta/ (accessed on 3 August 2025).
  37. NOIZZ Ekologia. Available online: https://noizz.pl/ekologia/warszawa-gorsza-niz-kalkuta-jest-na-2-miejscu-miast-z-najgorszym-powietrzem/c3jn196 (accessed on 3 August 2025).
  38. Climate Change, Impacts and Vulnerability in Europe 2012; EEA Report No 12/2012; An Indicator-Based Report; EEA: Copenhagen, Denmark, 2012; pp. 168–204.
  39. i-Tree Eco User’s Manual. Available online: https://www.itreetools.org/documents/275/EcoV6_UsersManual.2021.09.22.pdf (accessed on 3 August 2025).
  40. Przybysz, A.; Nersisyan, G.; Gawroński, S.W. Removal of particulate matter and trace elements from ambient air by urban greenery in the winter season. Environ. Sci. Pollut. Res. 2019, 26, 473–482. [Google Scholar] [CrossRef] [PubMed]
  41. Selmi, W.; Weber, C.; Rivière, E.; Blond, N.; Mehdi, L.; Nowak, D. Air pollution removal by trees in public green spaces in Strasbourg city, France. Urban For. Urban Green. 2016, 17, 192–201. [Google Scholar] [CrossRef]
  42. Gong, C.; Xian, C.; Ouyang, Z. Assessment of no2 purification by urban forests based on the i-tree eco model: Case study in beijing, china. Forests 2022, 13, 369. [Google Scholar] [CrossRef]
  43. Grandesso, E.; Ballesta, P.P.; Kowalewski, K. Thermal desorption GC–MS as a tool to provide PAH certified standard reference material on particulate matter quartz filters. Talanta 2013, 105, 101–108. [Google Scholar] [CrossRef] [PubMed]
  44. Gaglio, M.; Pace, R.; Muresan, A.N.; Grote, R.; Castaldelli, G.; Calfapietra, C.; Fano, E.A. Species-Specific Efficiency in PM2.5 Removal by Urban Trees: From Leaf Measurements to Improved Modeling Estimates. Sci. Total Environ. 2022, 844, 157131. [Google Scholar] [CrossRef] [PubMed]
  45. Galvão, A.; Segers, I.; Smitz, J.; Tournaye, H.; De Vos, M. In vitro maturation (IVM) of oocytes in patients with resistant ovary syndrome and in patients with repeated deficient oocyte maturation. J. Assist. Reprod. Genet. 2018, 35, 2161–2171. [Google Scholar] [CrossRef]
  46. Sarzanin, C. Recent developments in ion chromatography. J. Chromatogr. A 2002, 956, 3–13. [Google Scholar] [CrossRef]
  47. López-Ruiz, B. Advances in the determination of inorganic anions by ion chromatography. J. Chromatogr. A 2000, 881, 607–627. [Google Scholar] [CrossRef] [PubMed]
  48. Chaudhary, I.J.; Rathore, D. Dust Pollution: Its Removal and Effect on Foliage Physiology of Urban Trees. Sustain. Cities Soc. 2019, 51, 101696. [Google Scholar] [CrossRef]
  49. Nowak, D.; Crane, D.; Stevens, J.; Hoehn, R.; Walton, J.; Bond, J. A Ground-Based Method of Assessing Urban Forest Structure and Ecosystem Services. Arboric. Urban For. 2008, 34, 347–358. [Google Scholar] [CrossRef]
  50. Bagstad, K.J.; Semmens, D.J.; Waage, S.; Winthrop, R. A Comparative Assessment of Decision-Support Tools for Ecosystem Services Quantification and Valuation. Ecosyst. Serv. 2013, 5, 27–39. [Google Scholar] [CrossRef]
  51. Kim, G. Assessing Urban Forest Structure, Ecosystem Services, and Economic Benefits on Vacant Land. Sustainability 2016, 8, 679. [Google Scholar] [CrossRef]
  52. Przybysz, A.; Sæbø, A.; Hanslin, H.M.; Gawroński, S.W. Accumulation of Particulate Matter and Trace Elements on Vegetation as Affected by Pollution Level, Rainfall and the Passage of Time. Sci. Total Environ. 2014, 481, 360–369. [Google Scholar] [CrossRef]
  53. Pike, K.; O’Herrin, K.; Klimas, C.; Vogt, J. Tree Preservation during Construction: An Evaluation of a Comprehensive Municipal Tree Ordinance. Urban For. Urban Green. 2021, 57, 126914. [Google Scholar] [CrossRef]
  54. Suchocka, M.; Jankowski, P.; Błaszczyk, M. Tree Protection on Construction Sites—Knowledge and Perception of Polish Professionals. Urban For. Urban Green. 2019, 46, 126436. [Google Scholar] [CrossRef]
  55. Watson, G.W.; Kelsey, P. The Impact of Soil Compaction on Soil Aeration and Fine Root Density of Quercus palustris. Urban For. Urban Green. 2006, 4, 69–74. [Google Scholar] [CrossRef]
  56. Hilbert, D.R.; Roman, L.A.; Koeser, A.K.; Vogt, J.; van Doorn, N.S. Urban Tree Mortality: A Literature Review. Arboric. Urban For. 2019, 45, 167–200. [Google Scholar] [CrossRef]
  57. Olchowik, J.; Suchocka, M.; Jankowski, P.; Malewski, T.; Hilszczańska, D. The ectomycorrhizal community of urban linden trees in Gdańsk, Poland. PLoS ONE 2021, 16, e0237551. [Google Scholar] [CrossRef]
  58. Krzyżaniak, M.; Świerk, D.; Antoszewski, P. Factors Influencing the Health Status of Trees in Parks and Forests of Urbanized Areas. Forests 2021, 12, 656. [Google Scholar] [CrossRef]
  59. Martinez, C.; Coelho-Duarte, A. Hazard indicators in urban trees. case studies on platanus x hispanica mill. ex münchh and morus alba l. in mendoza city-argentina. Rev. De La Fac. De Cienc. Agrar. Uncuyo 2023, 55, 152–165. [Google Scholar] [CrossRef]
  60. Berrang, P.; Karnosky, D.F.; Stanton, B.J. The role of water stress in tree growth. Arboric. Urban For. 1985, 11, 185–189. [Google Scholar] [CrossRef]
  61. Kociel, H.; Kalaji, H.; Suchocka, M.; Tuchowska, Ż. Structural soil as one of the pro ecological solutions for cities. Ecol. Eng. Environ. Technol. 2018, 19, 81–90. [Google Scholar] [CrossRef] [PubMed]
  62. Suchocka, M.; Swoczyna, T.; Kosno-Jończy, J.; Kalaji, H.M. Impact of heavy pruning on development and photosynthesis of Tilia cordata Mill. trees. PLoS ONE 2021, 16, e0256465. [Google Scholar] [CrossRef]
  63. Górka, M.; Bartz, W.; Skuridina, A.; Potysz, A. Populus nigra Italica Leaves as a Valuable Tool for Mineralogical and Geochemical Interpretation of Inorganic Atmospheric Aerosols’ Genesis. Atmosphere 2020, 11, 1126. [Google Scholar] [CrossRef]
  64. Popek, R.; Przybysz, A.; Gawrońska, H.; Klamkowski, K.; Gawroński, S.W. Impact of Particulate Matter Accumulation on the Photosynthetic Apparatus of Roadside Woody Plants Growing in the Urban Conditions. Ecotoxicol. Environ. Saf. 2018, 163, 56–62. [Google Scholar] [CrossRef] [PubMed]
  65. Staples, T.; Dwyer, J.M.; Mayfield, M.M.; England, J.R. Productivity does not correlate with species and functional diversity in Australian reforestation plantings across a wide climate gradient. Glob. Ecol. Biogeogr. 2019, 28, 1003–1015. [Google Scholar] [CrossRef]
  66. Quigley, M.F. Street trees and rural conspecifics: Will long-lived trees reach full size in urban conditions? Urban Ecosyst. 2004, 7, 29–39. [Google Scholar] [CrossRef]
  67. Błońska, E.; Lasota, J.; Prażuch, W.; Ilek, A. Vertical variations in enzymatic activity and C:N:P stoichiometry in forest soils under the influence of different tree species. Eur. J. For. Res. 2025, 144, 83–94. [Google Scholar] [CrossRef]
  68. Zhang, B.; Wang, W.; He, X.; Zhou, W.; Xiao, L.; Lv, H.; Wei, C. Urban forest characteristics and ecological services in Harbin. Chin. J. Ecol. 2017, 36, 951–961. [Google Scholar]
  69. Riondato, E.; Pilla, F.; Sarkar Basu, A.S.; Sarkar Basu, B. Investigating the effect of trees on urban quality in Dublin by combining air monitoring with i-Tree Eco model. Sustain. Cities Soc. 2020, 61, 102356. [Google Scholar] [CrossRef]
  70. Fuller, R.A.; Irvine, K.N.; Devine-Wright, P.; Warren, P.H.; Gaston, K.J. Psychological benefits of greenspace increase with biodiversity. Biol. Lett. 2007, 3, 390–394. [Google Scholar] [CrossRef]
  71. van den Berg, M.; van Poppel, M.; van Kamp, I.; Andrusaityte, S.; Balseviciene, B.; Cirach, M.; Danileviciute, A.; Ellis, N.; Hurst, G.; Masterson, D.; et al. Visiting green space is associated with mental health and vitality: A cross-sectional study in four european cities. Health Place 2016, 38, 8–15. [Google Scholar] [CrossRef] [PubMed]
  72. Hanski, I.; von Hertzen, L.; Fyhrquist, N.; Koskinen, K.; Torppa, K.; Laatikainen, T.; Karisola, P.; Auvinen, P.; Paulin, L.; Mäkelä, M.J.; et al. Environmental biodiversity, human microbiota, and allergy are interrelated. Proc. Natl. Acad. Sci. USA 2012, 109, 8334–8339. [Google Scholar] [CrossRef] [PubMed]
  73. Hopkins, L.; January-Bevers, D.; Caton, E.I.; Campos, L. Prosty model sadzenia drzew w celu poprawy klimatu, zanieczyszczenia powietrza, zdrowia i upałów miejskich w lokalizacjach narażonych na zmiany klimatu z wykorzystaniem partnerów nietradycyjnych. Plants People Planet 2021, 4, 243–257. [Google Scholar] [CrossRef]
Figure 1. Location of the analysed streets in Warsaw, Poland (Source: Own elaboration).
Sustainability 17 07451 g001
Figure 2. Tree inventory locations and identification numbers on selected street segments: Marszałkowska, Puławska, and Żwirki i Wigury in Warsaw (Source: Own elaboration based on aerial imagery © GUGiK, Geoportal.gov.pl).
Sustainability 17 07451 g002
Figure 3. Number and percentage of inventoried street trees recorded along the three study locations: Marszałkowska, Puławska, and Żwirki i Wigury in Warsaw (Source: Own elaboration).
Sustainability 17 07451 g003
Figure 4. Average dendrometric parameters and predominant tree species on three inventoried streets in Warsaw (Source: Own elaboration).
Sustainability 17 07451 g004
Figure 5. Monthly total of PM2.5 and PM10 removal (kg) by street trees on three urban streets in Warsaw. Highlighted values indicate maximum removal recorded for each location (Source: Own elaboration).
Sustainability 17 07451 g005
Figure 6. Pollution removal values for PM10 and PM2.5 on three inventoried streets in Warsaw, expressed in micrograms (µg) due to method sensitivity (Source: Own elaboration).
Sustainability 17 07451 g006
Figure 7. Boxplot showing the average annual PM10 removal per tree by species, based on calculations from the i-Tree Eco model (Source: Own elaboration based on inventory and model output).
Sustainability 17 07451 g007
Figure 8. Boxplot showing the average annual PM2.5 removal per tree by species, based on calculations from the i-Tree Eco model (Source: Own elaboration based on inventory and model output).
Sustainability 17 07451 g008
Figure 9. Comparison of PM10 and PM2.5 removal by tree species using empirical and i-Tree Eco methods (Source: Own elaboration).
Sustainability 17 07451 g009
Table 1. Comparison of key characteristics of the empirical method (based on Przybysz et al. [52]) and the i-Tree Eco model for estimating PM accumulation.
Element/Stepi-Tree EcoEmpirical Laboratory Method
Data sourceTree inventory (dendrometric measurements), meteorological data, air quality (Warsaw)Leaf samples (500 cm2), collected from 4 trees/species across 3 urban locations
Analytical approachEcosystem modelling based on USDA data and i-Tree databaseLaboratory: PM quantification by fractionation and gravimetric analysis
PM type analyzedPM2.5 and PM10 (simulated values across the vegetative season)PM2.5 and PM10 (actual deposited mass on leaves)
Time referenceModelled for full vegetative seasonActual state during sampling (following high PM episode in July 2023), calculated per full vegetative season based on i-Tree Eco and precipitation data
Rainfall considerationYes—simulated wash-off based on precipitation dataYes—seasonal extrapolation using literature-based wash-off coefficients (Przybysz et al. [52])
Seasonal variabilityIncluded (e.g., leaf presence, precipitation, temperature)Not included—single sampling timepoint
OutputSimulated PM absorption per tree/alley/seasonMeasured PM mass per tree, extrapolated to vegetative season
StrengthsRapid assessment, applicable to large-scale urban areasHigh local accuracy, based on real environmental exposure
LimitationsCalibrated for US data; potential mismatch with local conditionsLabor-intensive; sensitive to sampling timing and individual tree selection
Disclaimer/Publisher’s Note: The statements, opinions and data contained in all publications are solely those of the individual author(s) and contributor(s) and not of MDPI and/or the editor(s). MDPI and/or the editor(s) disclaim responsibility for any injury to people or property resulting from any ideas, methods, instructions or products referred to in the content.