Comparative Analysis of PM2.5- and O3-Attributable Impacts in China: Changing Trends and Driving Factors
Abstract
1. Introduction
2. Materials and Methods
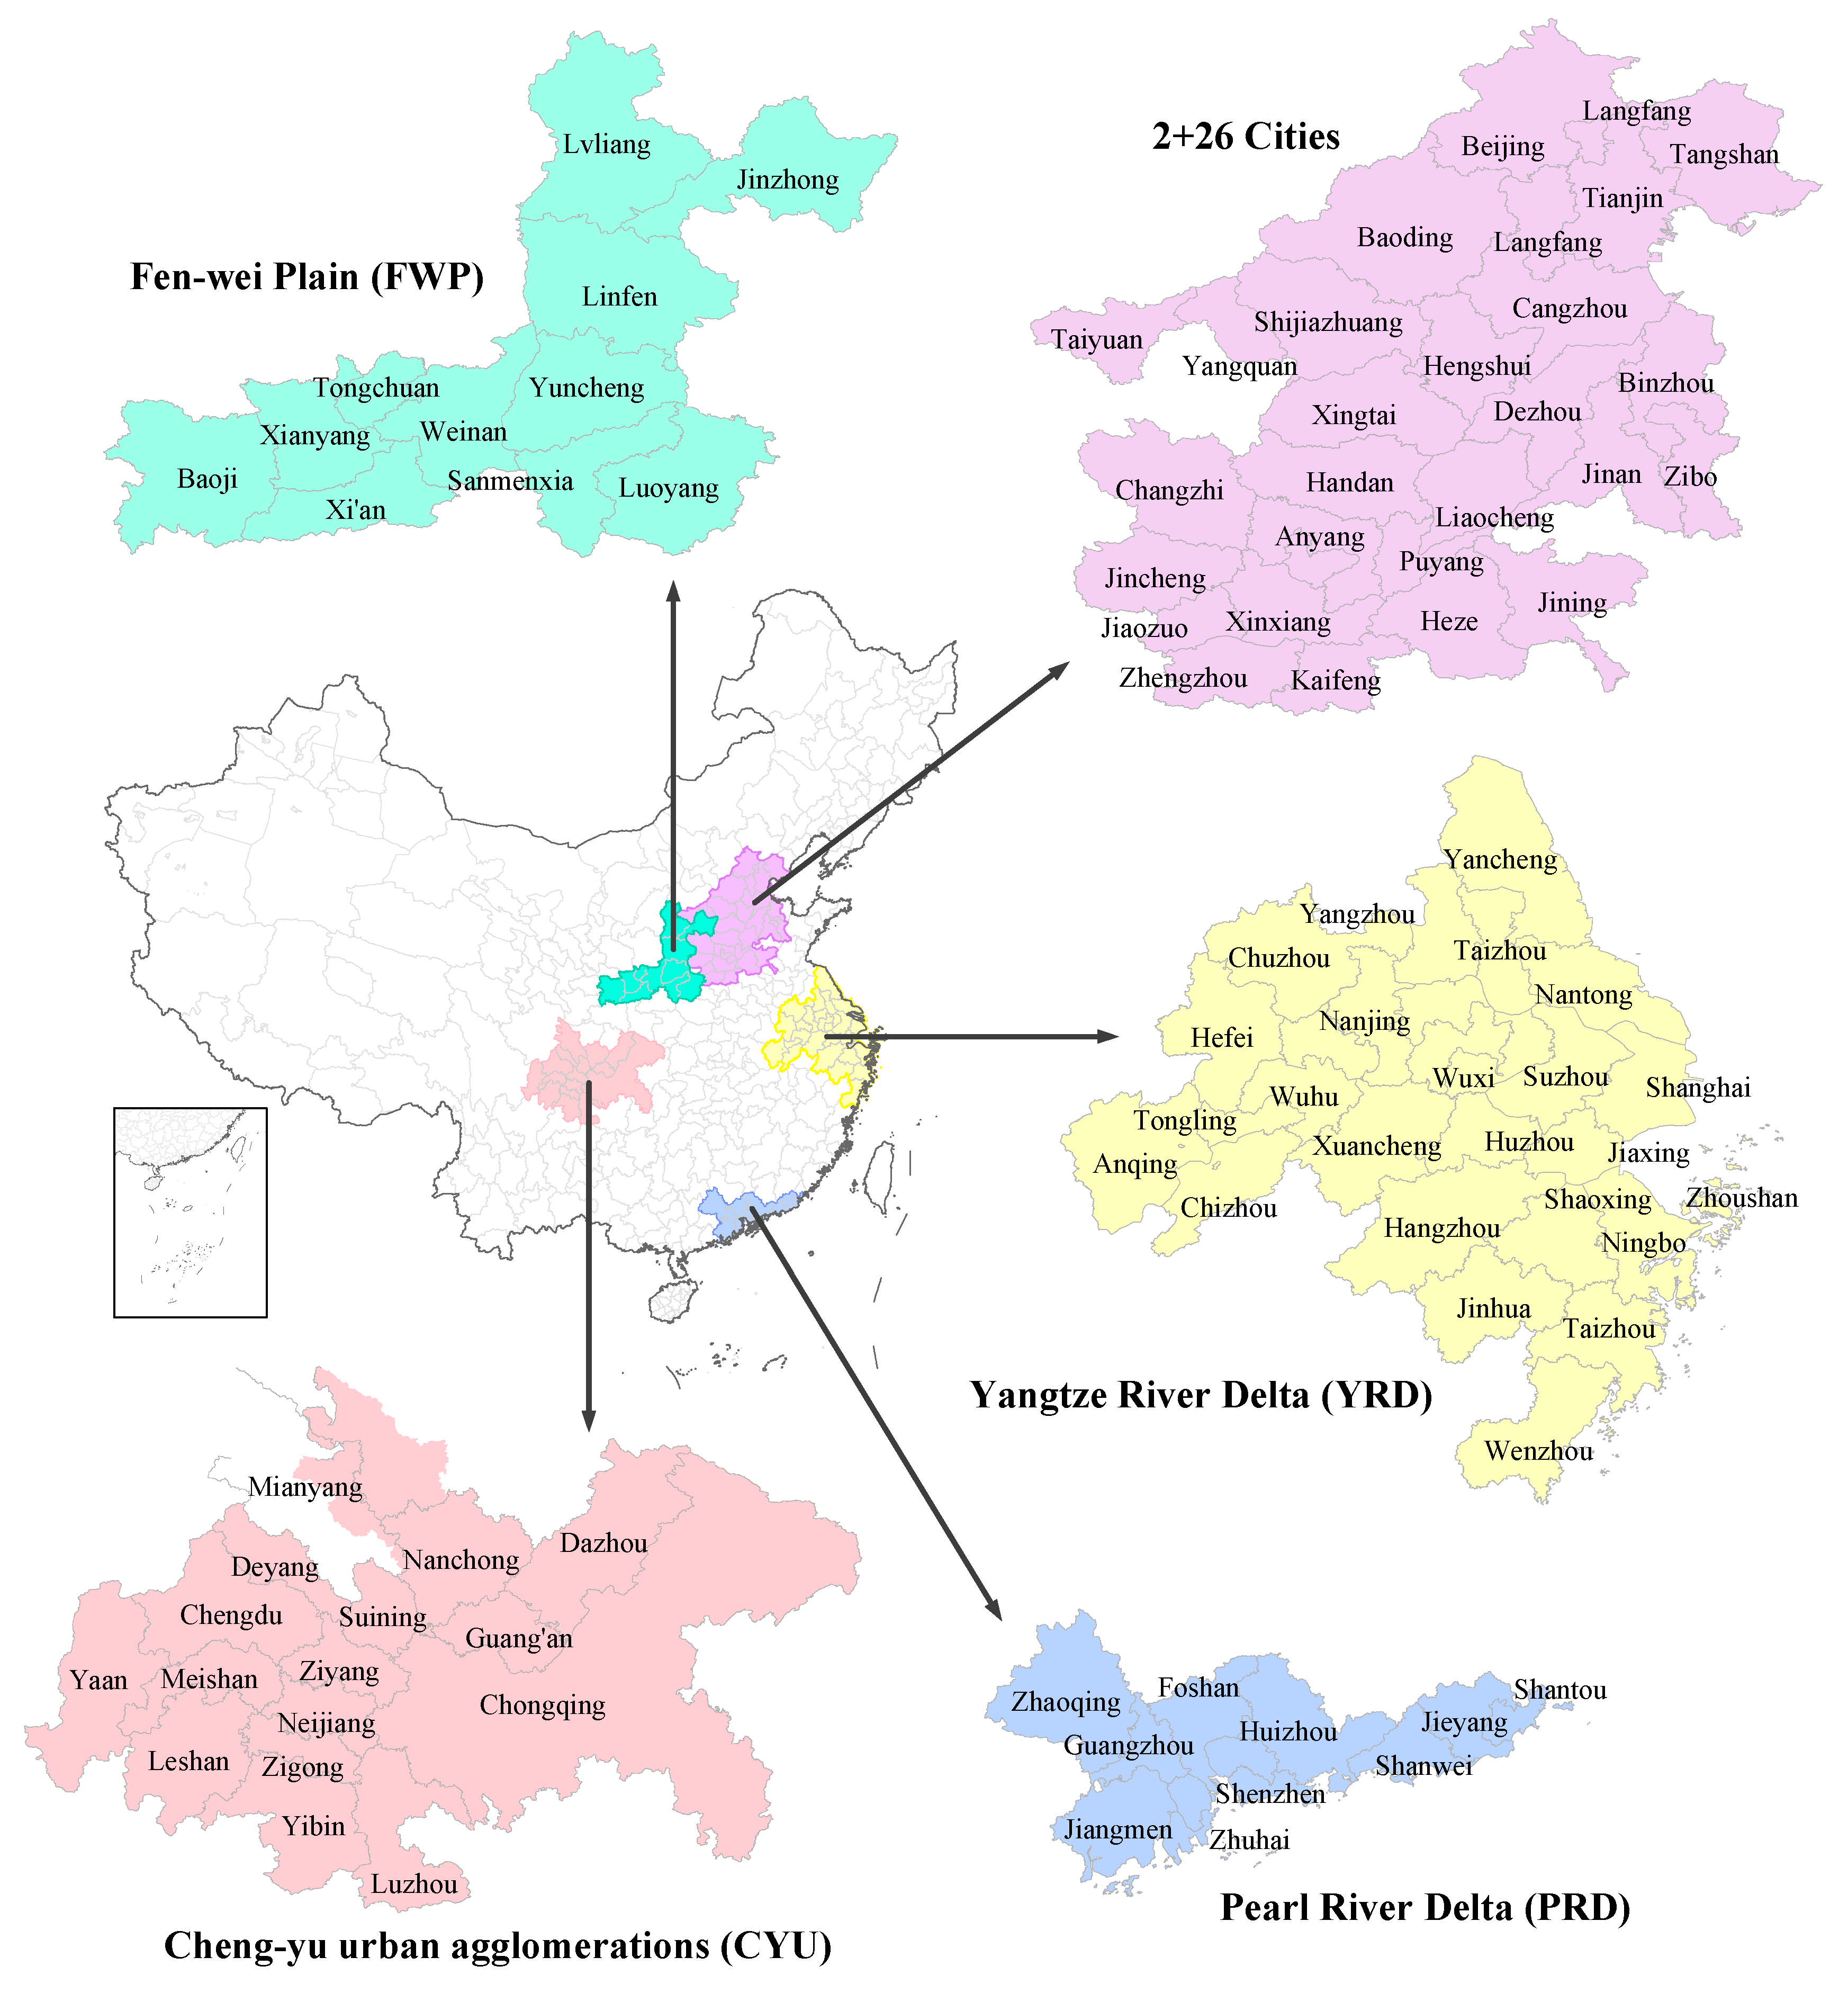
2.1. Data Sources
2.2. Estimating the Premature Deaths Attributable to PM2.5 Exposure
2.3. Estimating the Premature Deaths Attributable to O3 Exposure
2.4. Valuing Economic Loss
2.5. The Contributions of Different Driving Factors
3. Results
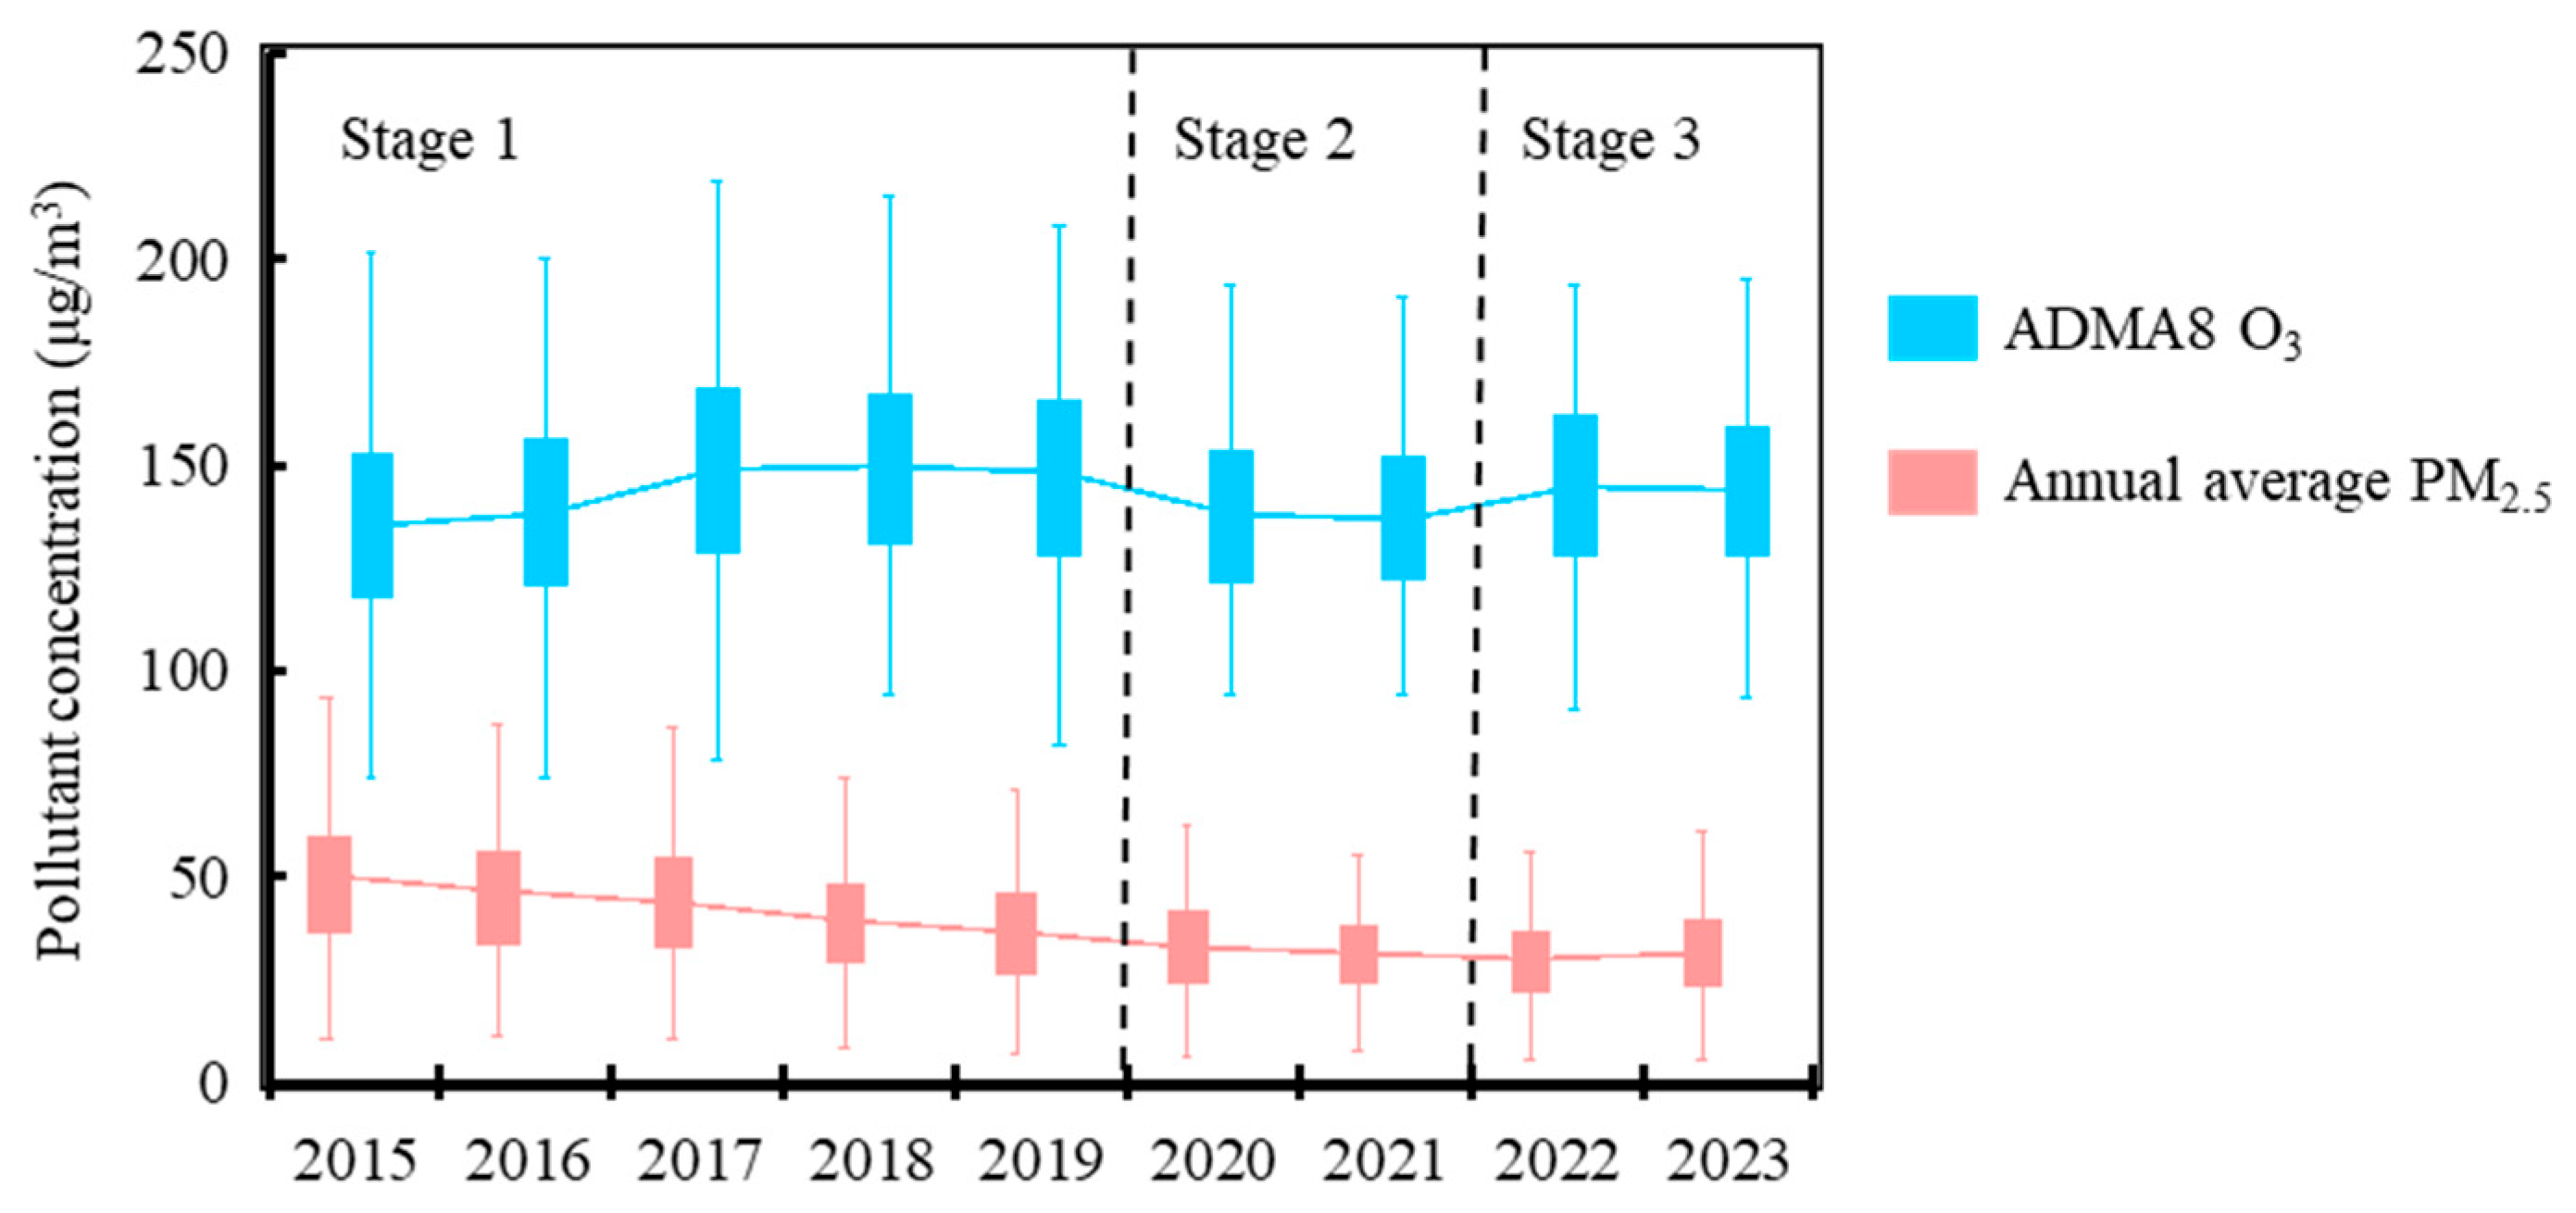
3.1. PM2.5 and O3 Pollution Exposure and the Relevant Premature Deaths
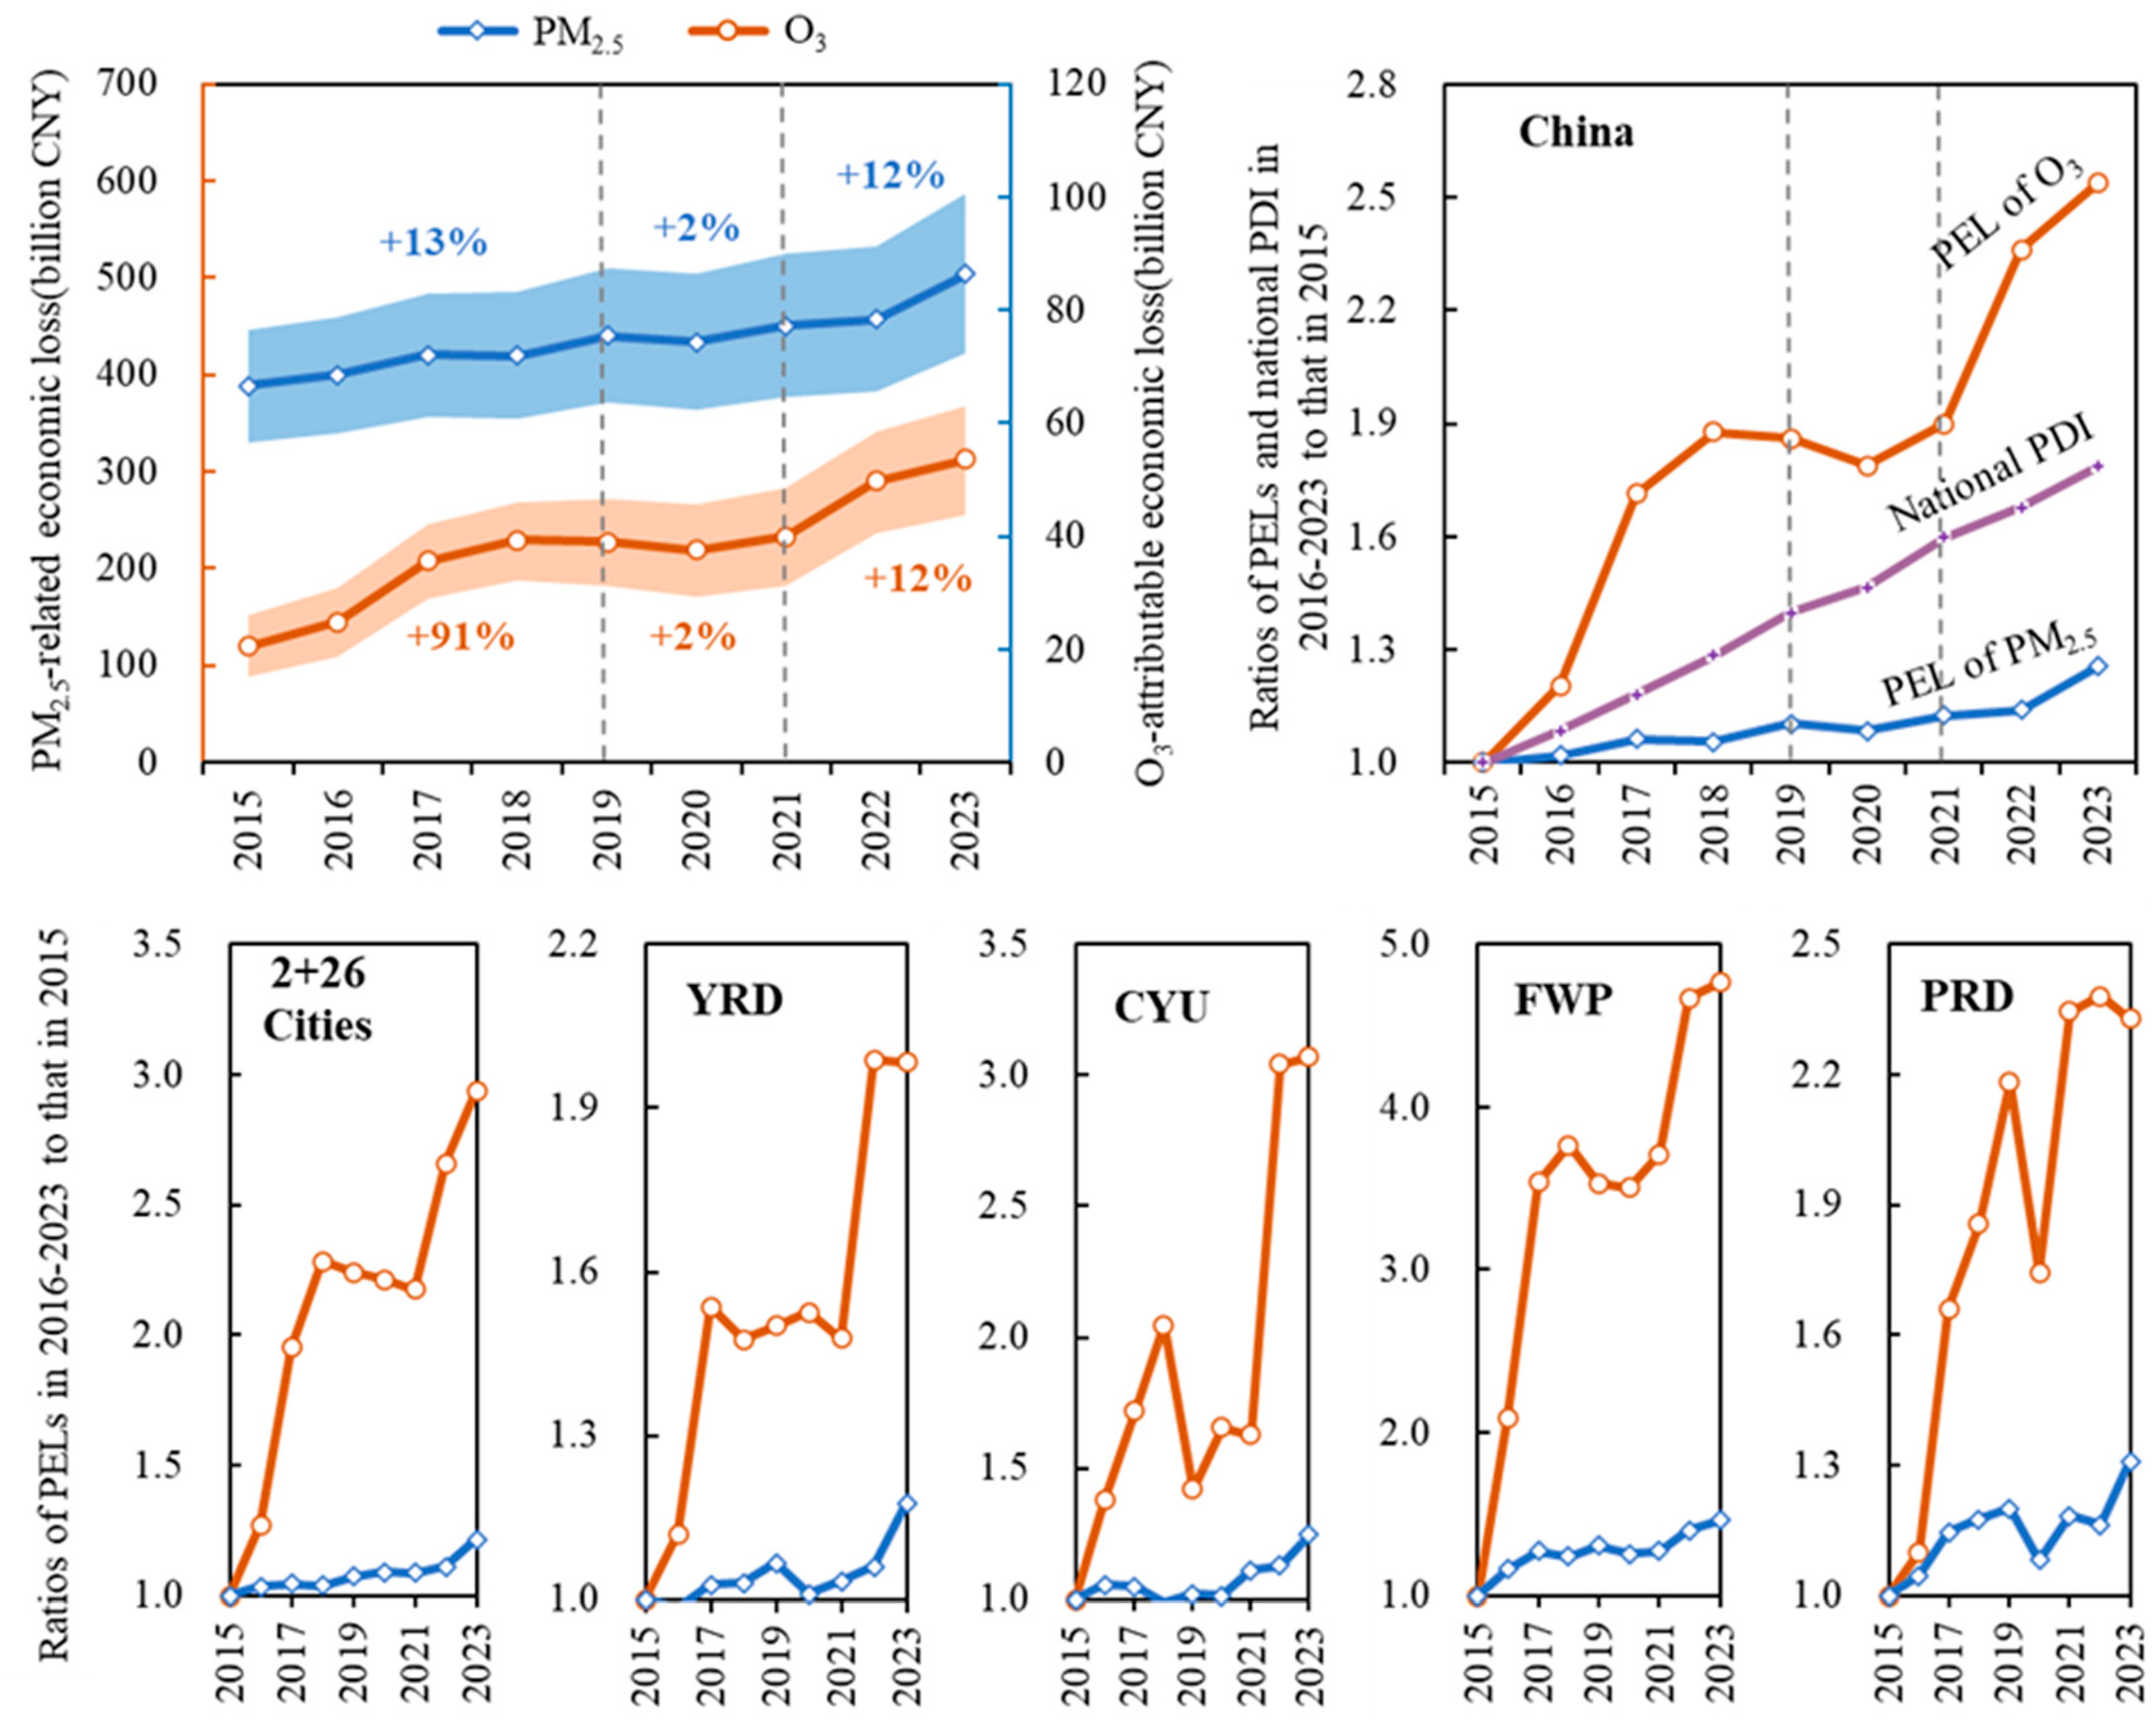
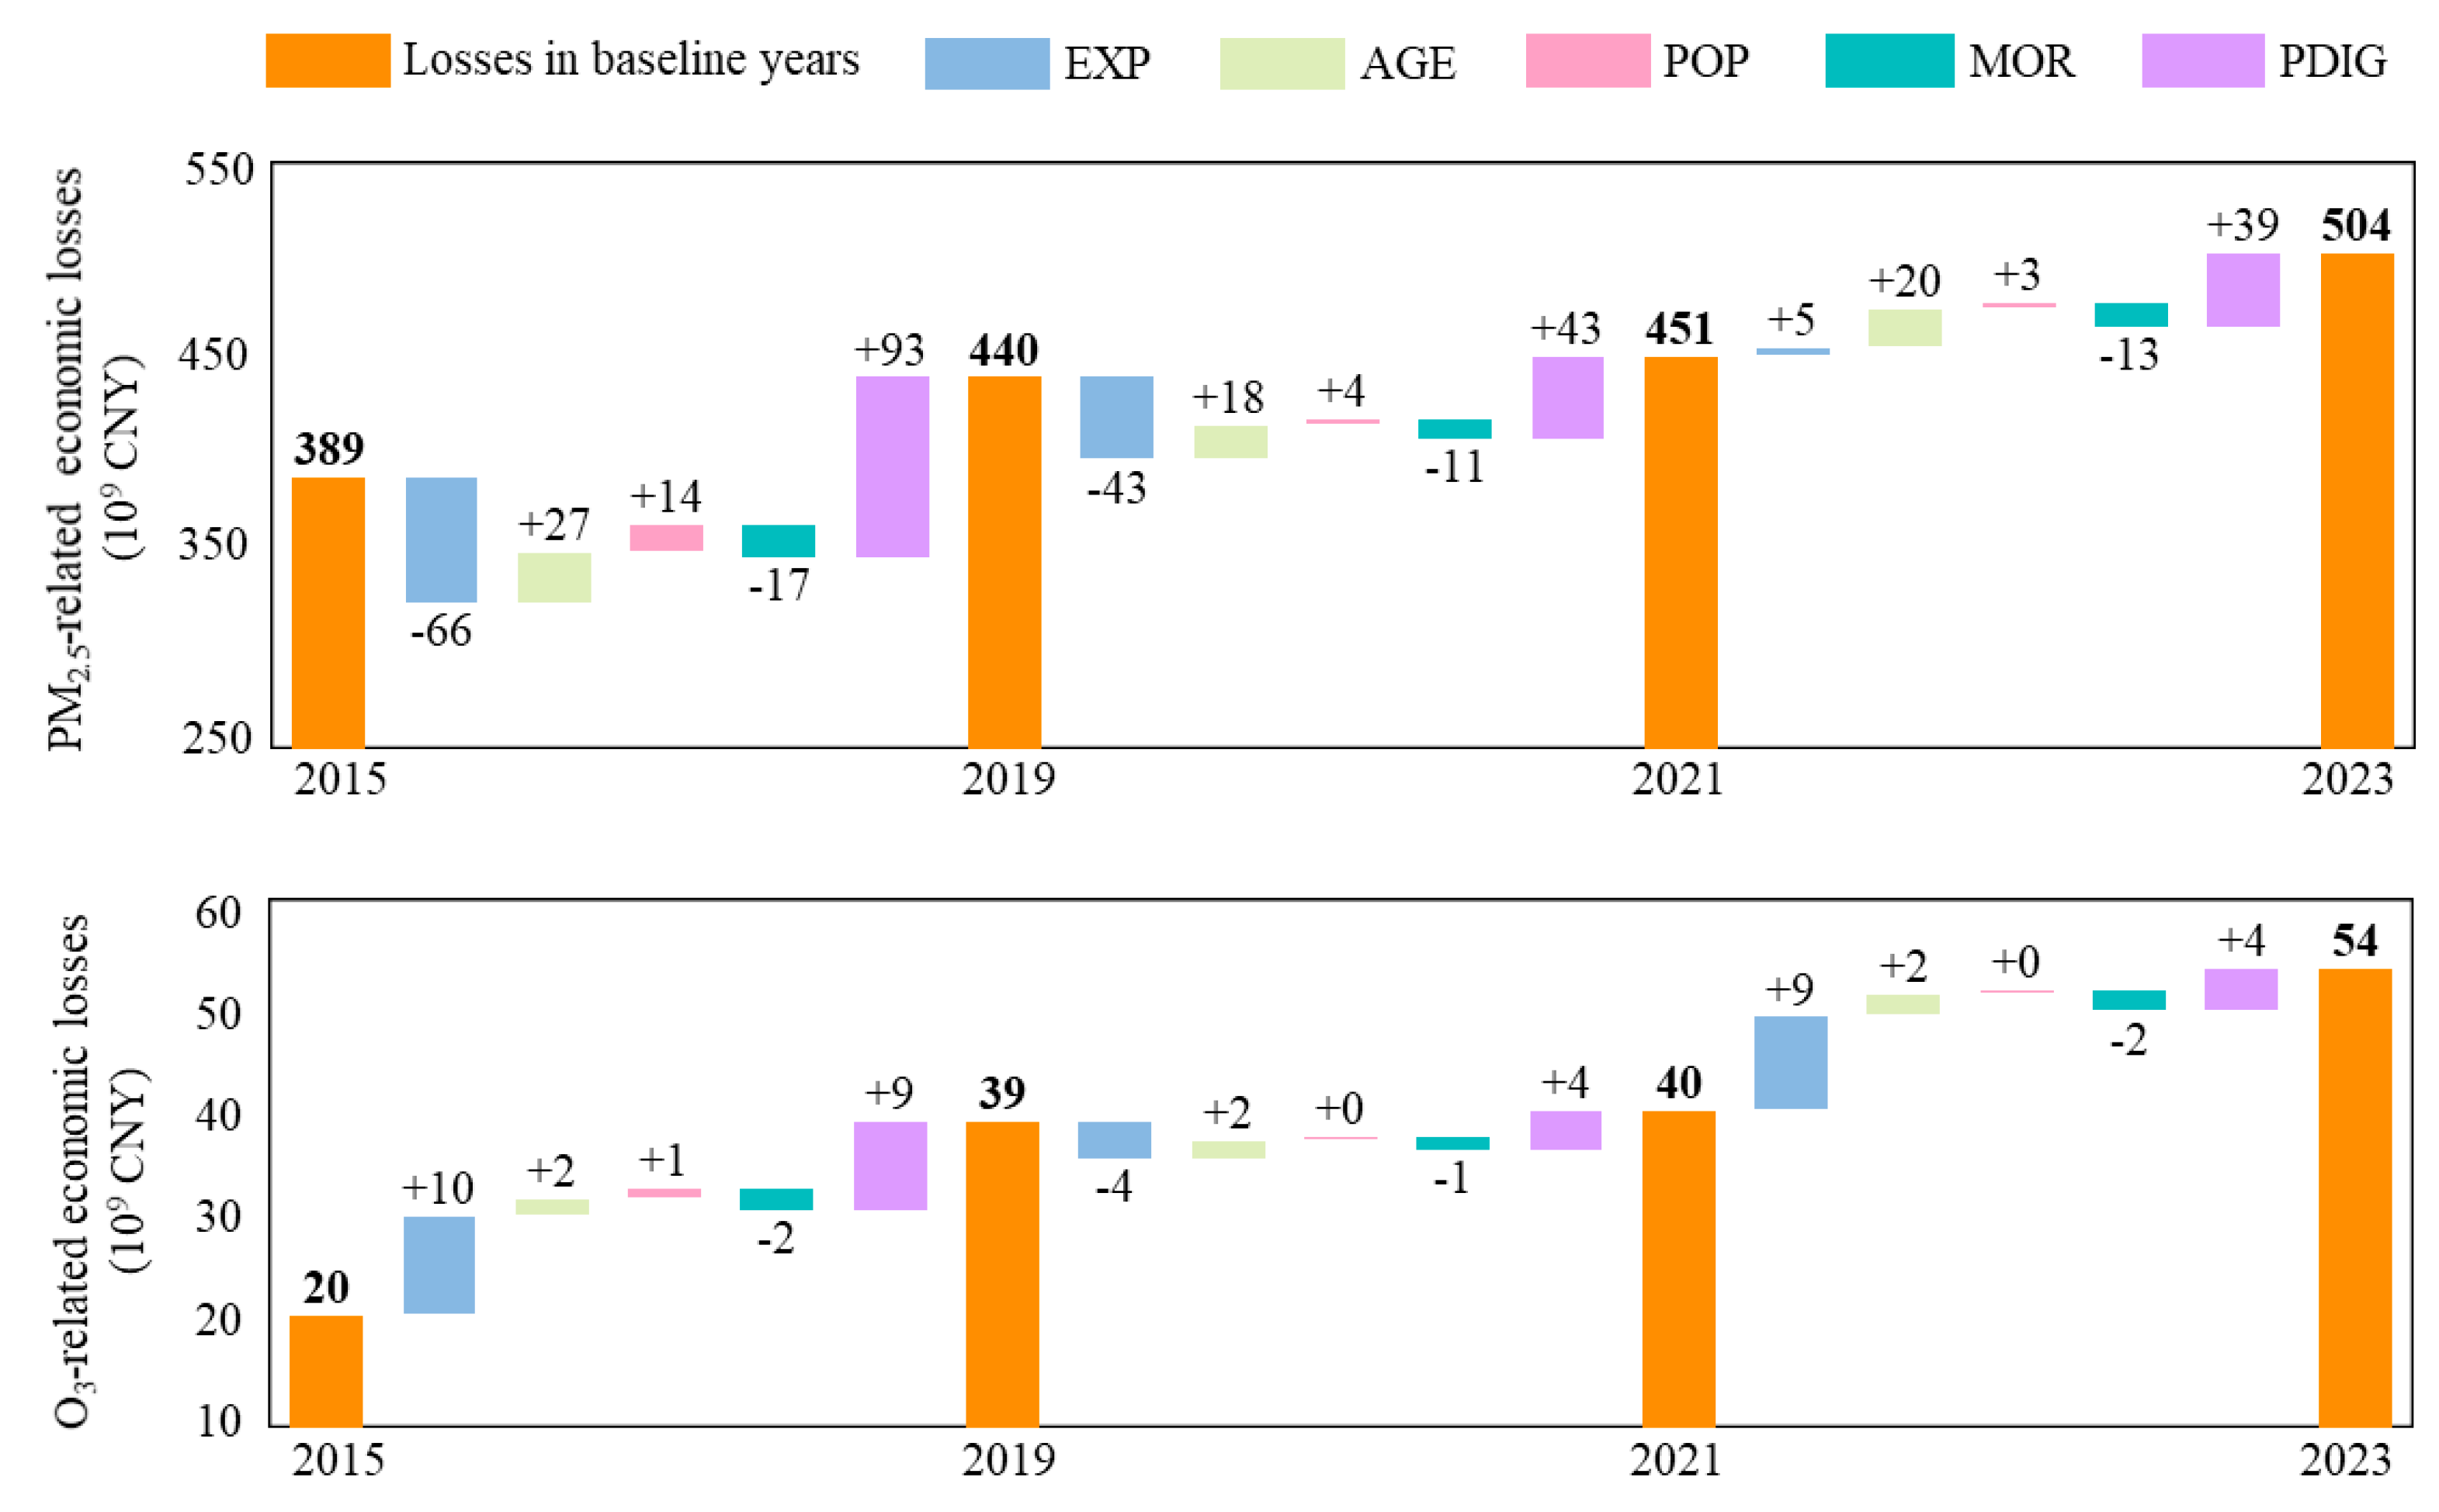
3.2. PM2.5- and O3-Related Economic Impacts
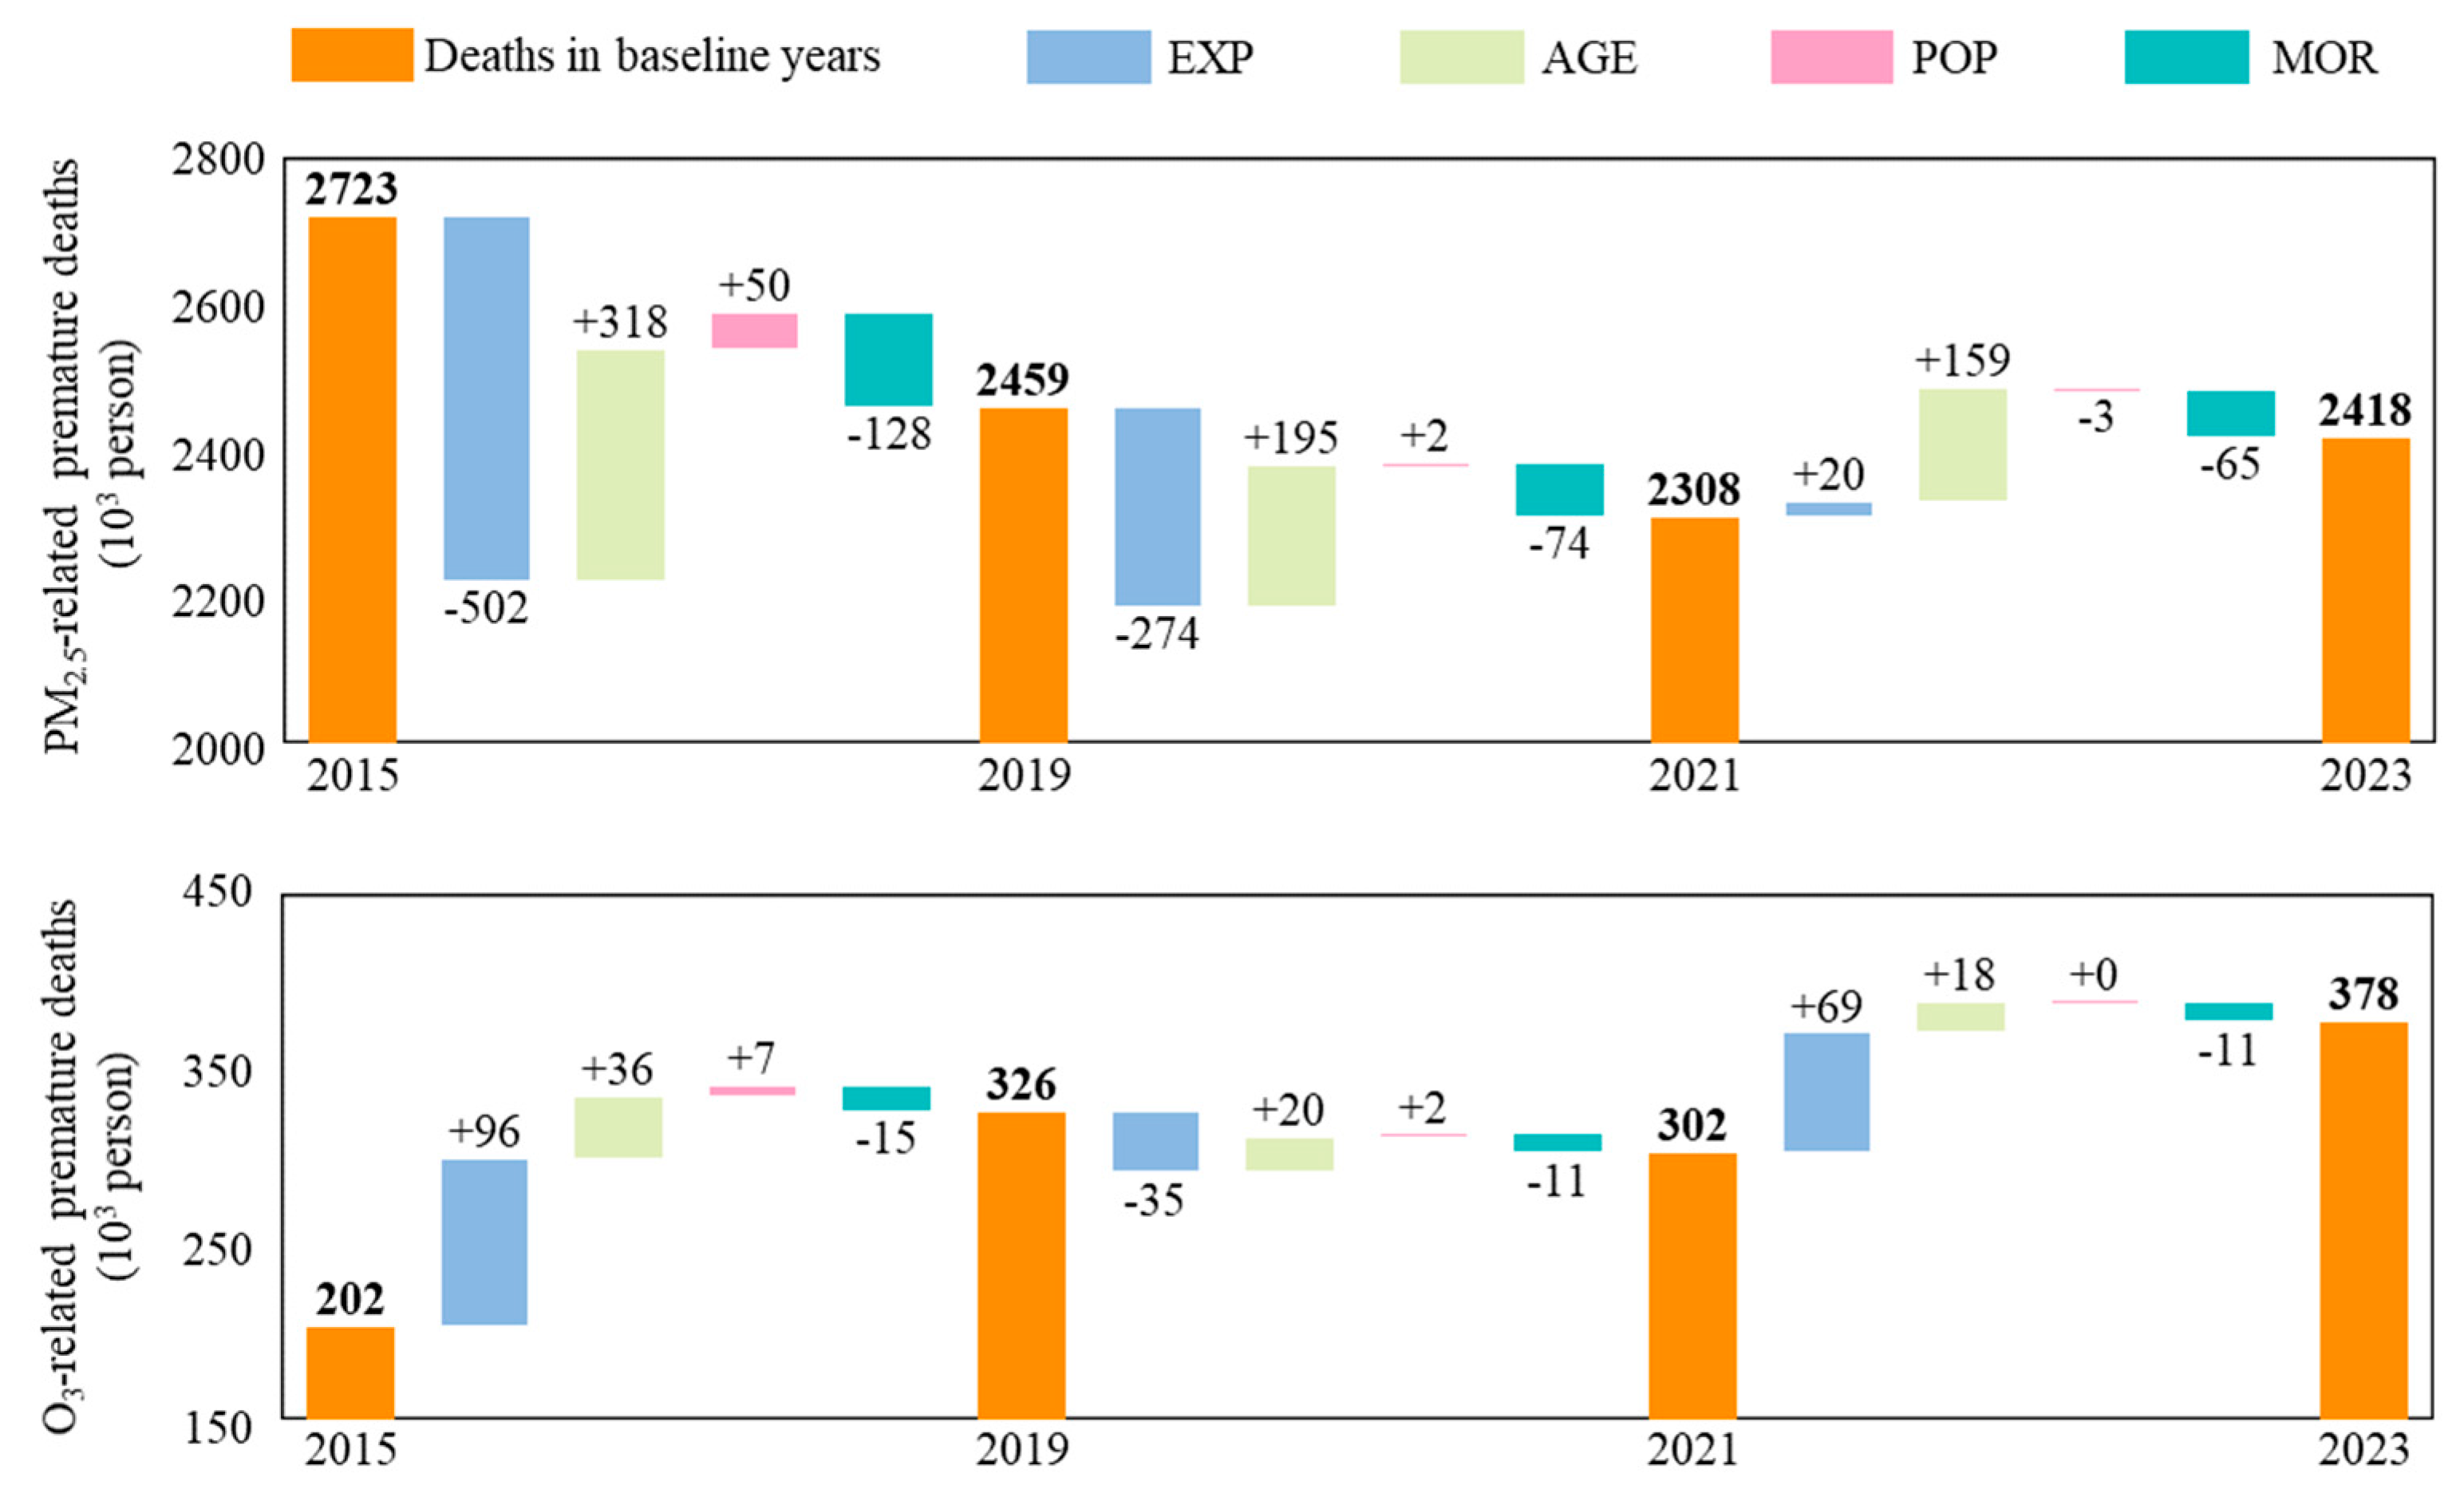
3.3. Effects of Driving Factors
4. Discussion
5. Conclusions
Funding
Institutional Review Board Statement
Informed Consent Statement
Data Availability Statement
Conflicts of Interest
Abbreviations
| PM2.5 | Fine particulate matter |
| O3 | Ozone |
| MDA8 | Maximum daily 8-h average |
| AMDA8 | Annual mean of the maximum daily 8-h average |
| YRD | Yangtze River Delta |
| PRD | Pearl River Delta |
| FWP | Fen-Wei Plain |
| CYU | Cheng-Yu Urban Agglomeration |
| GEMM | Global exposure mortality model |
| LERM | Log-linear exposure-response model |
| NCD | Non-communicable diseases |
| LRI | Lower respiratory infections |
| RESP | Chronic respiratory diseases |
| CIRC | Circulatory diseases |
| VSL | Value of statistical life |
| WTP | Willingness-to-pay |
| EXP | Changes in exposure level |
| AGE | Population aging |
| POP | Population growth |
| MOR | Reduced baseline mortality rate |
| PDI | Per capita disposable income |
| PDIG | Per capita disposable income growth |
| GDP | Gross domestic product |
| CNY | Chinese Yuan |
| USD | United States Dollars |
| GBD | Global Burden of Disease |
| WHO | World Health Organization |
| CI | Confidence interval |
Appendix A
| Age | Year | ||||||||
|---|---|---|---|---|---|---|---|---|---|
| 2015 | 2016 | 2017 | 2018 | 2019 | 2020 | 2021 | 2022 | 2023 | |
| 25–29 | 0.0002691 | 0.0002669 | 0.0002653 | 0.0002633 | 0.0002633 | 0.0002582 | 0.0002561 | 0.0002539 | 0.0002517 |
| 30–34 | 0.0004580 | 0.0004553 | 0.0004598 | 0.0004620 | 0.0004594 | 0.0004615 | 0.0004627 | 0.0004636 | 0.0004646 |
| 35–39 | 0.0007668 | 0.0007652 | 0.0007874 | 0.0008029 | 0.0007978 | 0.0008134 | 0.0008239 | 0.0008339 | 0.0008439 |
| 40–44 | 0.0013710 | 0.0013609 | 0.0013763 | 0.0013863 | 0.0013778 | 0.0013856 | 0.0013900 | 0.0013939 | 0.0013978 |
| 45–49 | 0.0022204 | 0.0021768 | 0.0020894 | 0.0020135 | 0.0019933 | 0.0019145 | 0.0018517 | 0.0017899 | 0.0017281 |
| 50–54 | 0.0035476 | 0.0034931 | 0.0034575 | 0.0034295 | 0.0034027 | 0.0033598 | 0.0033247 | 0.0032894 | 0.0032540 |
| 55–59 | 0.0059164 | 0.0058197 | 0.0057144 | 0.0056266 | 0.0055704 | 0.0054649 | 0.0053756 | 0.0052871 | 0.0051986 |
| 60–64 | 0.0100285 | 0.0098390 | 0.0095723 | 0.0093564 | 0.0092687 | 0.0090138 | 0.0088121 | 0.0086119 | 0.0084117 |
| 65–69 | 0.0166040 | 0.0163034 | 0.0158445 | 0.0154780 | 0.0153047 | 0.0148820 | 0.0145374 | 0.0141950 | 0.0138526 |
| 70–74 | 0.0295898 | 0.0291489 | 0.0288436 | 0.0285297 | 0.0282545 | 0.0278864 | 0.0275574 | 0.0272284 | 0.0268995 |
| 75–79 | 0.0508796 | 0.0501269 | 0.0492242 | 0.0484667 | 0.0479103 | 0.0470419 | 0.0462821 | 0.0455222 | 0.0447623 |
| 80+ | 0.1225677 | 0.1214715 | 0.1196981 | 0.1184987 | 0.1187482 | 0.1170132 | 0.1159520 | 0.1148908 | 0.1138296 |
| Age | Year | ||||||||
|---|---|---|---|---|---|---|---|---|---|
| 2015 | 2016 | 2017 | 2018 | 2019 | 2020 | 2021 | 2022 | 2023 | |
| 25–29 | 0.0000115 | 0.0000113 | 0.0000107 | 0.0000102 | 0.0000099 | 0.0000104 | 0.0000102 | 0.0000099 | 0.0000097 |
| 30–34 | 0.0000150 | 0.0000145 | 0.0000138 | 0.0000131 | 0.0000126 | 0.0000127 | 0.0000122 | 0.0000118 | 0.0000113 |
| 35–39 | 0.0000202 | 0.0000198 | 0.0000193 | 0.0000186 | 0.0000178 | 0.0000182 | 0.0000177 | 0.0000173 | 0.0000169 |
| 40–44 | 0.0000284 | 0.0000279 | 0.0000269 | 0.0000259 | 0.0000250 | 0.0000258 | 0.0000252 | 0.0000247 | 0.0000242 |
| 45–49 | 0.0000381 | 0.0000370 | 0.0000339 | 0.0000319 | 0.0000309 | 0.0000326 | 0.0000315 | 0.0000304 | 0.0000292 |
| 50–54 | 0.0000540 | 0.0000525 | 0.0000499 | 0.0000477 | 0.0000462 | 0.0000464 | 0.0000448 | 0.0000433 | 0.0000418 |
| 55–59 | 0.0000863 | 0.0000846 | 0.0000802 | 0.0000764 | 0.0000739 | 0.0000778 | 0.0000761 | 0.0000744 | 0.0000728 |
| 60–64 | 0.0001396 | 0.0001363 | 0.0001285 | 0.0001230 | 0.0001202 | 0.0001139 | 0.0001087 | 0.0001035 | 0.0000983 |
| 65–69 | 0.0002498 | 0.0002420 | 0.0002268 | 0.0002160 | 0.0002095 | 0.0001968 | 0.0001861 | 0.0001755 | 0.0001648 |
| 70–74 | 0.0005155 | 0.0005000 | 0.0004802 | 0.0004626 | 0.0004518 | 0.0004326 | 0.0004161 | 0.0003996 | 0.0003831 |
| 75–79 | 0.0010586 | 0.0010341 | 0.0009929 | 0.0009614 | 0.0009383 | 0.0009031 | 0.0008718 | 0.0008404 | 0.0008091 |
| 80+ | 0.0037541 | 0.0037113 | 0.0036217 | 0.0035878 | 0.0036177 | 0.0035396 | 0.0035000 | 0.0034604 | 0.0034208 |
| Age | Year | ||||||||
|---|---|---|---|---|---|---|---|---|---|
| 2015 | 2016 | 2017 | 2018 | 2019 | 2020 | 2021 | 2022 | 2023 | |
| 25–29 | 0.0000856 | 0.0000845 | 0.0000832 | 0.0000810 | 0.0000796 | 0.0000801 | 0.0000789 | 0.0000778 | 0.0000767 |
| 30–34 | 0.0001559 | 0.0001545 | 0.0001555 | 0.0001540 | 0.0001508 | 0.0001492 | 0.0001479 | 0.0001466 | 0.0001453 |
| 35–39 | 0.0002707 | 0.0002699 | 0.0002787 | 0.0002814 | 0.0002758 | 0.0002819 | 0.0002840 | 0.0002862 | 0.0002884 |
| 40–44 | 0.0005092 | 0.0005038 | 0.0005090 | 0.0005083 | 0.0005000 | 0.0005019 | 0.0005005 | 0.0004991 | 0.0004978 |
| 45–49 | 0.0008510 | 0.0008301 | 0.0007863 | 0.0007454 | 0.0007287 | 0.0006895 | 0.0006565 | 0.0006236 | 0.0005907 |
| 50–54 | 0.0013919 | 0.0013630 | 0.0013399 | 0.0013142 | 0.0012902 | 0.0012642 | 0.0012390 | 0.0012138 | 0.0011886 |
| 55–59 | 0.0023602 | 0.0023151 | 0.0022591 | 0.0022018 | 0.0021594 | 0.0021047 | 0.0020532 | 0.0020017 | 0.0019502 |
| 60–64 | 0.0041994 | 0.0041091 | 0.0039807 | 0.0038695 | 0.0038169 | 0.0036938 | 0.0035933 | 0.0034929 | 0.0033924 |
| 65–69 | 0.0074869 | 0.0073441 | 0.0071137 | 0.0069035 | 0.0067880 | 0.0065758 | 0.0063919 | 0.0062081 | 0.0060243 |
| 70–74 | 0.0143836 | 0.0141570 | 0.0139686 | 0.0137667 | 0.0135847 | 0.0133757 | 0.0131769 | 0.0129781 | 0.0127793 |
| 75–79 | 0.0264086 | 0.0260371 | 0.0255336 | 0.0250181 | 0.0246173 | 0.0241425 | 0.0236823 | 0.0232222 | 0.0227620 |
| 80+ | 0.0691206 | 0.0686900 | 0.0677320 | 0.0668808 | 0.0668518 | 0.0659510 | 0.0653163 | 0.0646817 | 0.0640470 |
| Age | GEMM Parameters | ||||
|---|---|---|---|---|---|
| θ | Standard Error θ | α | μ | ν | |
| 25–29 | 0.1430 | 0.01807 | 1.6 | 15.5 | 36.8 |
| 30–34 | 0.1585 | 0.01477 | 1.6 | 15.5 | 36.8 |
| 35–39 | 0.1577 | 0.01470 | 1.6 | 15.5 | 36.8 |
| 40–44 | 0.1570 | 0.01463 | 1.6 | 15.5 | 36.8 |
| 45–49 | 0.1558 | 0.01450 | 1.6 | 15.5 | 36.8 |
| 50–54 | 0.1532 | 0.01425 | 1.6 | 15.5 | 36.8 |
| 55–59 | 0.1499 | 0.01394 | 1.6 | 15.5 | 36.8 |
| 60–64 | 0.1462 | 0.01361 | 1.6 | 15.5 | 36.8 |
| 65–69 | 0.1421 | 0.01325 | 1.6 | 15.5 | 36.8 |
| 70–74 | 0.1374 | 0.01284 | 1.6 | 15.5 | 36.8 |
| 75–79 | 0.1319 | 0.01234 | 1.6 | 15.5 | 36.8 |
| 80+ | 0.1253 | 0.01174 | 1.6 | 15.5 | 36.8 |
| Age | Life Expectancy (Unit: Year) | Wealth (Unit: CNY) | ||||||||
|---|---|---|---|---|---|---|---|---|---|---|
| 2015 | 2016 | 2017 | 2018 | 2019 | 2020 | 2021 | 2022 | 2023 | ||
| 25–29 | 45.15 | 45.24 | 45.34 | 45.45 | 45.50 | 45.61 | 45.70 | 45.79 | 45.88 | 44,053.39 |
| 30–34 | 40.64 | 40.72 | 40.83 | 40.93 | 40.99 | 41.09 | 41.18 | 41.28 | 41.37 | 53,395.49 |
| 35–39 | 36.20 | 36.29 | 36.40 | 36.50 | 36.55 | 36.66 | 36.75 | 36.84 | 36.93 | 53,146.61 |
| 40–44 | 31.85 | 31.94 | 32.05 | 32.16 | 32.21 | 32.32 | 32.42 | 32.51 | 32.61 | 47,160.08 |
| 45–49 | 27.63 | 27.72 | 27.84 | 27.95 | 28.00 | 28.11 | 28.21 | 28.31 | 28.40 | 46,141.21 |
| 50–54 | 23.55 | 23.63 | 23.74 | 23.84 | 23.89 | 23.99 | 24.08 | 24.17 | 24.26 | 38,604.59 |
| 55–59 | 19.64 | 19.71 | 19.82 | 19.92 | 19.96 | 20.07 | 20.15 | 20.24 | 20.33 | 36,518.54 |
| 60–64 | 15.95 | 16.02 | 16.12 | 16.21 | 16.26 | 16.35 | 16.44 | 16.52 | 16.60 | 26,514.66 |
| 65–69 | 12.56 | 12.62 | 12.71 | 12.79 | 12.82 | 12.91 | 12.98 | 13.05 | 13.12 | 18,616.86 |
| 70–74 | 9.50 | 9.56 | 9.63 | 9.69 | 9.72 | 9.79 | 9.85 | 9.90 | 9.96 | 16,804.35 |
| 75–79 | 6.92 | 6.96 | 7.03 | 7.09 | 7.12 | 7.18 | 7.23 | 7.28 | 7.34 | 25,944.57 |
| 80+ | 4.78 | 4.81 | 4.87 | 4.92 | 4.94 | 4.99 | 5.04 | 5.08 | 5.12 | 13,076.67 |
| All ages | 67.99 | 68.12 | 68.28 | 68.42 | 68.53 | 68.68 | 68.82 | 68.96 | 69.09 | 42,990.65 |
| Year | Maximum ) | Minimum ) | Median ) | (Number of Cities) | (Number of Cities) |
|---|---|---|---|---|---|
| 2015 | 118 | 10 | 49 | 74 | 0 |
| 2016 | 157 | 11 | 44 | 94 | 0 |
| 2017 | 100 | 10 | 42 | 102 | 0 |
| 2018 | 116 | 8 | 38 | 139 | 2 |
| 2019 | 110 | 7 | 35 | 166 | 6 |
| 2020 | 113 | 6 | 32 | 197 | 8 |
| 2021 | 94 | 7 | 30 | 216 | 9 |
| 2022 | 107 | 6 | 29 | 236 | 10 |
| 2023 | 89 | 6 | 31 | 207 | 9 |
| Year | Maximum ) | Minimum ) | Median ) | (Number of Cities) | (Number of Cities) |
|---|---|---|---|---|---|
| 2015 | 202 | 62 | 135 | 27 | 59 |
| 2016 | 200 | 74 | 138 | 23 | 59 |
| 2017 | 219 | 78 | 146 | 8 | 104 |
| 2018 | 215 | 74 | 147 | 6 | 109 |
| 2019 | 208 | 82 | 146 | 8 | 102 |
| 2020 | 194 | 94 | 136 | 10 | 56 |
| 2021 | 197 | 94 | 135 | 7 | 52 |
| 2022 | 194 | 91 | 145 | 6 | 90 |
| 2023 | 195 | 94 | 142 | 4 | 77 |
References
- Jiang, J.; Aksoyoglu, S.; Ciarelli, G.; Baltensperger, U.; Prévôt, A.S.H. Changes in ozone and PM2.5 in Europe during the period of 1990-2030: Role of reductions in land and ship emissions. Sci. Total Environ. 2020, 741, 140467. [Google Scholar] [CrossRef] [PubMed]
- Boari, A.; Pedruzzi, R.; Vieira-Filho, M. Air pollution trends and exceedances: Ozone and particulate matter outlook in Brazilian highly urbanized zones. Environ. Monit. Assess. 2023, 195, 1058. [Google Scholar] [CrossRef]
- Kheirbek, I.; Wheeler, K.; Walters, S.; Kass, D.; Matte, T. PM2.5 and ozone health impacts and disparities in New York City: Sensitivity to spatial and temporal resolution. Air Qual. Atmos. Health 2013, 6, 473–486. [Google Scholar] [CrossRef]
- Im, U.; Bauer, S.E.; Frohn, L.M.; Geels, C.; Tsigaridis, K.; Brandt, J. Present-day and future PM2.5 and O3-related global and regional premature mortality in the EVAv6.0 health impact assessment model. Environ. Res. 2023, 216, 114702. [Google Scholar] [CrossRef]
- Chen, Y.; Ebenstein, A.; Greenstone, M.; Li, H. Evidence on the impact of sustained exposure to air pollution on life expectancy from China’s Huai River policy. Proc. Natl. Acad. Sci. USA 2013, 110, 12936–12941. [Google Scholar] [CrossRef] [PubMed]
- Giani, P.; Castruccio, S.; Anav, A.; Howard, D.; Hu, W.J.; Crippa, P. Short-term and long-term health impacts of air pollution reductions from COVID-19 lockdowns in China and Europe: A modelling study. Lancet Planet. Health 2020, 4, e474–e482. [Google Scholar] [CrossRef]
- Gao, J.; Li, Y.; Xie, Z.; Hu, B.; Wang, L.; Bao, F.; Fan, S. The impact of the aerosol reduction on the worsening ozone pollution over the Beijing-Tianjin-Hebei region via influencing photolysis rates. Sci. Total Environ. 2022, 821, 153197. [Google Scholar] [CrossRef]
- Liu, Z.; Lei, Y.; Xue, W.; Liu, X.; Jiang, Y.; Shi, X.; Zheng, Y.; Zhang, Q.; Wang, J. Mitigating China’s Ozone Pollution with More Balanced Health Benefits. Environ. Sci. Technol. 2022, 56, 7647–7656. [Google Scholar] [CrossRef]
- Zhang, S.; Zhang, C.; Cai, W.; Bai, Y.; Callaghan, M.; Chang, N.; Chen, B.; Chen, H.; Cheng, L.; Dai, H.; et al. The 2023 China report of the Lancet Countdown on health and climate change: Taking stock for a thriving future. Lancet Public Health 2023, 8, e978–e995. [Google Scholar] [CrossRef]
- Xiao, Q.; Geng, G.; Xue, T.; Liu, S.; Cai, C.; He, K.; Zhang, Q. Tracking PM2.5 and O3 Pollution and the Related Health Burden in China 2013–2020. Environ. Sci. Technol. 2021, 56, 6922–6932. [Google Scholar] [CrossRef] [PubMed]
- Lyu, Y.; Wu, Z.; Wu, H.; Pang, X.; Qin, K.; Wang, B.; Ding, S.; Chen, D.; Chen, J. Tracking long-term population exposure risks to PM2.5 and ozone in urban agglomerations of China 2015–2021. Sci. Total Environ. 2023, 854, 158599. [Google Scholar] [CrossRef]
- Nuvolone, D.; Petri, D.; Voller, F. The effects of ozone on human health. Environ. Sci. Pollut. Res. 2018, 25, 8074–8088. [Google Scholar] [CrossRef]
- Jin, Y.; Andersson, H.; Zhang, S. Do preferences to reduce health risks related to air pollution depend on illness type? Evidence from a choice experiment in Beijing, China. J. Environ. Econ. Manag. 2020, 103, 102355. [Google Scholar] [CrossRef]
- Burnett, R.; Chen, H.; Szyszkowicz, M.; Fann, N.; Hubbell, B.; Pope, C.A.; Apte, J.S.; Brauer, M.; Cohen, A.; Weichenthal, S.; et al. Global estimates of mortality associated with long-term exposure to outdoor fine particulate matter. Proc. Natl. Acad. Sci. USA 2018, 115, 9592–9597. [Google Scholar] [CrossRef]
- Vohra, K.; Marais Eloise, A.; Bloss William, J.; Schwartz, J.; Mickley Loretta, J.; Van Damme, M.; Clarisse, L.; Coheur Pierre, F. Rapid rise in premature mortality due to anthropogenic air pollution in fast-growing tropical cities from 2005 to 2018. Sci. Adv. 2022, 8, eabm4435. [Google Scholar] [CrossRef] [PubMed]
- Jerrett, M.; Burnett, R.T.; Pope, C.A., III; Ito, K.; Thurston, G.; Krewski, D.; Shi, Y.; Calle, E.; Thun, M. Long-Term Ozone Exposure and Mortality. N. Engl. J. Med. 2009, 360, 1085–1095. [Google Scholar] [CrossRef] [PubMed]
- Turner, M.C.; Jerrett, M.; Pope, C.A., III; Krewski, D.; Gapstur, S.M.; Diver, W.R.; Beckerman, B.S.; Marshall, J.D.; Su, J.; Crouse, D.L.; et al. Long-Term Ozone Exposure and Mortality in a Large Prospective Study. Am. J. Respir. Crit. Care Med. 2016, 193, 1134–1142. [Google Scholar] [CrossRef] [PubMed]
- Fuller, R.; Landrigan, P.J.; Balakrishnan, K.; Bathan, G.; Bose-O’Reilly, S.; Brauer, M.; Caravanos, J.; Chiles, T.; Cohen, A.; Corra, L.; et al. Pollution and health: A progress update. Lancet Planet. Health 2022, 6, e535–e547. [Google Scholar] [CrossRef]
- Xue, T.; Geng, G.; Meng, X.; Xiao, Q.; Zheng, Y.; Gong, J.; Liu, J.; Wan, W.; Zhang, Q.; Kan, H.; et al. New WHO Global Air Quality Guidelines Help Prevent Premature Deaths in China. Natl. Sci. Rev. 2022, 9, nwac055. [Google Scholar] [CrossRef]
- Rentschler, J.; Leonova, N. Global air pollution exposure and poverty. Nat. Commun. 2023, 14, 4432. [Google Scholar] [CrossRef]
- Geng, G.; Zheng, Y.; Zhang, Q.; Xue, T.; Zhao, H.; Tong, D.; Zheng, B.; Li, M.; Liu, F.; Hong, C.; et al. Drivers of PM2.5 air pollution deaths in China 2002–2017. Nat. Geosci. 2021, 14, 645–650. [Google Scholar] [CrossRef]
- Yao, M.; Wu, G.; Zhao, X.; Zhang, J. Estimating health burden and economic loss attributable to short-term exposure to multiple air pollutants in China. Environ. Res. 2020, 183, 109184. [Google Scholar] [CrossRef]
- Dang, R.; Liao, H. Radiative Forcing and Health Impact of Aerosols and Ozone in China as the Consequence of Clean Air Actions over 2012–2017. Geophys. Res. Lett. 2019, 46, 12511–12519. [Google Scholar] [CrossRef]
- Xue, T.; Wang, R.; Wang, M.; Wang, Y.; Tong, D.; Meng, X.; Huang, C.; Ai, S.; Li, F.; Cao, J.; et al. Health benefits from the rapid reduction in ambient exposure to air pollutants after China’s clean air actions: Progress in efficacy and geographic equality. Natl. Sci. Rev. 2024, 11, nwad263. [Google Scholar] [CrossRef] [PubMed]
- Yang, S.Y.; Fang, D.L.; Chen, B. Human health impact and economic effect for PM2.5 exposure in typical cities. Appl. Energy 2019, 249, 316–325. [Google Scholar] [CrossRef]
- Hu, J.; Huang, L.; Chen, M.; Liao, H.; Zhang, H.; Wang, S.; Zhang, Q.; Ying, Q. Premature Mortality Attributable to Particulate Matter in China: Source Contributions and Responses to Reductions. Environ. Sci. Technol. 2017, 51, 9950–9959. [Google Scholar] [CrossRef]
- Guan, Y.; Kang, L.; Wang, Y.; Zhang, N.; Ju, M. Health loss attributed to PM2.5 pollution in China’s cities: Economic impact, annual change and reduction potential. J. Clean. Prod. 2019, 217, 284–294. [Google Scholar] [CrossRef]
- Yang, Y.; Luo, L.; Song, C.; Yin, H.; Yang, J. Spatiotemporal Assessment of PM2.5-Related Economic Losses from Health Impacts during 2014-2016 in China. Int. J. Environ. Res. Public Health 2018, 15, E1278. [Google Scholar] [CrossRef]
- Maji, K.J.; Ye, W.-F.; Arora, M.; Shiva Nagendra, S.M. Ozone pollution in Chinese cities: Assessment of seasonal variation, health effects and economic burden. Environ. Pollut. 2019, 247, 792–801. [Google Scholar] [CrossRef]
- Zhang, Z.; Yao, M.; Wu, W.; Zhao, X.; Zhang, J. Spatiotemporal assessment of health burden and economic losses attributable to short-term exposure to ground-level ozone during 2015-2018 in China. BMC Public Health 2021, 21, 1069. [Google Scholar] [CrossRef]
- Xie, Y.; Dai, H.; Zhang, Y.; Wu, Y.; Hanaoka, T.; Masui, T. Comparison of health and economic impacts of PM2.5 and ozone pollution in China. Environ. Int. 2019, 130, 104881. [Google Scholar] [CrossRef]
- Liu, J.; Yin, H.; Tang, X.; Zhu, T.; Zhang, Q.; Liu, Z.; Tang, X.; Yi, H. Transition in air pollution, disease burden and health cost in China: A comparative study of long-term and short-term exposure. Environ. Pollut. 2021, 277, 116770. [Google Scholar] [CrossRef]
- Zhu, C.; Zhu, C.; Qiu, M.; Gai, Y.; Li, R.; Li, L.; Wang, C.; Yang, N.; Wang, B.; Sun, L.; et al. Health Burden and Driving Force Changes Due to Exposure to PM2.5 and O3 from 2014 to 2060 in a Typical Industrial Province, China. Atmosphere 2023, 14, 1672. [Google Scholar] [CrossRef]
- Yang, Z.; Li, F.; Ye, R.; Ge, H.; Li, H.; Zhang, S.; Wang, J.; Zhao, Y.; Gao, H.; Huang, T.; et al. Health impacts and drivers of long-term ozone and nitrogen dioxide exposure in urban China. Atmos. Pollut. Res. 2025, 16, 102640. [Google Scholar] [CrossRef]
- Yin, H.; Brauer, M.; Zhang, J.; Cai, W.; Navrud, S.; Burnett, R.; Howard, C.; Deng, Z.; Kammen, D.M.; Schellnhuber, H.J.; et al. Population ageing and deaths attributable to ambient PM2.5 pollution: A global analysis of economic cost. Lancet Planet. Health 2021, 5, e356–e367. [Google Scholar] [CrossRef] [PubMed]
- Lian, L.; Chen, S.; Ma, J.; Li, T.; Yang, Y.; Huang, T.; Wang, Y.; Li, J. Population Aging Driven Slowdown in the Reduction of Economic Cost-Attributed to PM2.5 Pollution after 2013 in China. Environ. Sci. Technol. 2023, 57, 1237–1245. [Google Scholar] [CrossRef]
- Li, Y.; Ma, L.; Ni, M.; Bai, Y.; Li, C. Drivers of ozone-related premature mortality in China: Implications for historical and future scenarios. J. Environ. Manag. 2023, 345, 118663. [Google Scholar] [CrossRef] [PubMed]
- Liu, C.; Dai, H.; Zhang, L.; Feng, C. The impacts of economic restructuring and technology upgrade on air quality and human health in Beijing-Tianjin-Hebei region in China. Front. Environ. Sci. Eng. 2019, 13, 70. [Google Scholar] [CrossRef]
- Cooper, M.J.; Martin, R.V.; Hammer, M.S.; Levelt, P.F.; Veefkind, P.; Lamsal, L.N.; Krotkov, N.A.; Brook, J.R.; McLinden, C.A. Global fine-scale changes in ambient NO2 during COVID-19 lockdowns. Nature 2022, 601, 380–387. [Google Scholar] [CrossRef] [PubMed]
- Markandya, A.; Sampedro, J.; Smith, S.J.; Van Dingenen, R.; Pizarro-Irizar, C.; Arto, I.; González-Eguino, M. Health co-benefits from air pollution and mitigation costs of the Paris Agreement: A modelling study. Lancet Planet. Health 2018, 2, e126–e133. [Google Scholar] [CrossRef]
- Zhu, G.; Hu, W.; Liu, Y.; Cao, J.; Ma, Z.; Deng, Y.; Sabel, C.E.; Wang, H. Health burdens of ambient PM2.5 pollution across Chinese cities during 2006–2015. J. Environ. Manag. 2019, 243, 250–256. [Google Scholar] [CrossRef]
- Han, C.; Xu, R.; Gao, C.; Yu, W.; Zhang, Y.; Han, K.; Yu, P.; Guo, Y.; Li, S. Socioeconomic disparity in the association between long-term exposure to PM2.5 and mortality in 2640 Chinese counties. Environ. Int. 2021, 146, 106241. [Google Scholar] [CrossRef]
- Akritidis, D.; Bacer, S.; Zanis, P.; Georgoulias, A.K.; Chowdhury, S.; Horowitz, L.W.; Naik, V.; O’Connor, F.M.; Keeble, J.; Sager, P.L.; et al. Strong increase in mortality attributable to ozone pollution under a climate change and demographic scenario. Environ. Res. Lett. 2024, 19, 024041. [Google Scholar] [CrossRef]
- Ministry of Ecology and Environment of the People’s Republic of China. Technical Regulation for Ambient Air Quality Assessment (on Trial); Ministry of Ecology and Environment of the People’s Republic of China: Beijing, China, 2013; Volume HJ 663-2013. [Google Scholar]
- Zhang, S.; Zhao, M.; Liu, Z.; Yang, F.; Lu, B.; Zhao, Z.; Gu, K.; Zhang, S.; Lei, M.; Zhang, C.; et al. City-level population projection for China under different pathways from 2010 to 2100. Sci. Data 2023, 10, 809. [Google Scholar] [CrossRef] [PubMed]
- Lu, X.; Hong, J.; Zhang, L.; Cooper, O.R.; Schultz, M.G.; Xu, X.; Wang, T.; Gao, M.; Zhao, Y.; Zhang, Y. Severe Surface Ozone Pollution in China: A Global Perspective. Environ. Sci. Technol. Lett. 2018, 5, 487–494. [Google Scholar] [CrossRef]
- Gui, K.; Che, H.; Zeng, Z.; Wang, Y.; Zhai, S.; Wang, Z.; Luo, M.; Zhang, L.; Liao, T.; Zhao, H.; et al. Construction of a virtual PM2.5 observation network in China based on high-density surface meteorological observations using the Extreme Gradient Boosting model. Environ. Int. 2020, 141, 105801. [Google Scholar] [CrossRef]
- Chen, L.; Lin, J.; Martin, R.; Du, M.; Weng, H.; Kong, H.; Ni, R.; Meng, J.; Zhang, Y.; Zhang, L.; et al. Inequality in historical transboundary anthropogenic PM2.5 health impacts. Sci. Bull. 2022, 67, 437–444. [Google Scholar] [CrossRef]
- GBD 2019 Risk Factors Collaborators. Global burden of 87 risk factors in 204 countries and territories, 1990–2019: A systematic analysis for the Global Burden of Disease Study 2019. Lancet 2020, 396, 1223–1249. [Google Scholar] [CrossRef] [PubMed]
- Song, X.; Hao, Y. An assessment of O3-related health risks and economic losses in typical regions of China. Front. Public Health 2023, 11, 1194340. [Google Scholar] [CrossRef]
- Yin, P.; Chen, R.; Wang, L.; Meng, X.; Liu, C.; Niu, Y.; Lin, Z.; Liu, Y.; Liu, J.; Qi, J.; et al. Ambient Ozone Pollution and Daily Mortality: A Nationwide Study in 272 Chinese Cities. Environ. Health Perspect. 2017, 125, 117006. [Google Scholar] [CrossRef]
- OECD. Mortality Risk Valuation in Environment, Health and Transport Policies; OECD Publishing: Paris, France, 2012. [Google Scholar]
- Cao, C.; Song, X.; Cai, W.; Li, Y.; Cong, J.; Yu, X.; Gao, M.; Wang, C. Estimating the value of a statistical life in China: A contingent valuation study in six representative cities. Chin. J. Popul. Resour. Environ. 2023, 21, 269–278. [Google Scholar] [CrossRef]
- Freeman, R.; Liang, W.; Song, R.; Timmins, C. Willingness to pay for clean air in China. J. Environ. Econ. Manag. 2019, 94, 188–216. [Google Scholar] [CrossRef]
- Yin, H.; Pizzol, M.; Xu, L. External costs of PM2.5 pollution in Beijing, China: Uncertainty analysis of multiple health impacts and costs. Environ. Pollut. 2017, 226, 356–369. [Google Scholar] [CrossRef]
- Zhang, B.; Wu, B.; Liu, J. PM2.5 pollution-related Health Effects and Willingness to Pay for Improved Air Quality: Evidence from China’s Prefecture-level Cities. J. Clean. Prod. 2020, 273, 122876. [Google Scholar] [CrossRef]
- Huang, D.; Xu, J.; Zhang, S. Valuing the health risks of particulate air pollution in the Pearl River Delta, China. Environ. Sci. Policy 2012, 15, 38–47. [Google Scholar] [CrossRef]
- O’Brien, J. Age, autos, and the value of a statistical life. J. Risk Uncertain. 2018, 57, 51–79. [Google Scholar] [CrossRef]
- Southwestern University of Finance and Economics. China Household Finance Survey; Southwestern University of Finance and Economics: Chengdu, China, 2011. [Google Scholar]
- Qu, Z.; Wang, X.; Li, F.; Li, Y.; Chen, X.; Chen, M. PM2.5-Related Health Economic Benefits Evaluation Based on Air Improvement Action Plan in Wuhan City, Middle China. Int. J. Environ. Res. Public Health 2020, 17, 620. [Google Scholar] [CrossRef] [PubMed]
- Cohen, A.J.; Brauer, M.; Burnett, R.; Ross Anderson, H.; Frostad, J.; Estep, K.; Balakrishnan, K.; Brunekreef, B.; Dandona, L.; Dan-dona, R.; et al. Estimates and 25-year trends of the global burden of disease attributable to ambient air pollution: An analysis of data from the Global Burden of Diseases Study 2015. Lancet 2017, 389, 1907–1918. [Google Scholar] [CrossRef]
- Sun, Y.; Jiang, Y.; Xing, J.; Ou, Y.; Wang, S.; Loughlin, D.H.; Yu, S.; Ren, L.; Li, S.; Dong, Z.; et al. Air Quality, Health, and Equity Benefits of Carbon Neutrality and Clean Air Pathways in China. Environ. Sci. Technol. 2024, 58, 15027–15037. [Google Scholar] [CrossRef] [PubMed]
- Wang, Y.; Gao, W.; Wang, S.; Song, T.; Gong, Z.; Ji, D.; Wang, L.; Liu, Z.; Tang, G.; Huo, Y.; et al. Contrasting trends of PM2.5 and surface-ozone concentrations in China from 2013 to 2017. Natl. Sci. Rev. 2020, 7, 1331–1339. [Google Scholar] [CrossRef]
- Lu, X.; Ye, X.; Zhou, M.; Zhao, Y.; Weng, H.; Kong, H.; Li, K.; Gao, M.; Zheng, B.; Lin, J.; et al. The underappreciated role of agricultural soil nitrogen oxide emissions in ozone pollution regulation in North China. Nat. Commun. 2021, 12, 5021. [Google Scholar] [CrossRef]
- Gao, M.; Wang, F.; Xu, Y.; Chen, J.; Lu, X.; Carmichael, G.R. Future intensification of co-occurrences of heat, PM2.5 and O3 extremes in China and India despite stringent air pollution controls. Environ. Res. Lett. 2024, 20, 014044. [Google Scholar] [CrossRef]
- Cheng, J.; Tong, D.; Zhang, Q.; Liu, Y.; Lei, Y.; Yan, G.; Yan, L.; Yu, S.; Cui, R.; Clarke, L.; et al. Pathways of China’s PM2.5 air quality 2015-2060 in the context of carbon neutrality. Natl. Sci. Rev. 2021, 8, nwab078. [Google Scholar] [CrossRef]
- Wang, T.; Xue, L.; Brimblecombe, P.; Lam, Y.F.; Li, L.; Zhang, L. Ozone pollution in China: A review of concentrations, meteorological influences, chemical precursors, and effects. Sci. Total Environ. 2017, 575, 1582–1596. [Google Scholar] [CrossRef]
- Jin, X.; Holloway, T. Spatial and temporal variability of ozone sensitivity over China observed from the Ozone Monitoring Instrument. J. Geophys. Res. Atmos. 2015, 120, 7229–7246. [Google Scholar] [CrossRef]
- Wang, P.; Chen, Y.; Hu, J.; Zhang, H.; Ying, Q. Attribution of Tropospheric Ozone to NOx and VOC Emissions: Considering Ozone Formation in the Transition Regime. Environ. Sci. Technol. 2018, 53, 1404–1412. [Google Scholar] [CrossRef]
- Gong, C.; Liao, H.; Zhang, L.; Yue, X.; Dang, R.; Yang, Y. Persistent ozone pollution episodes in North China exacerbated by regional transport. Environ. Pollut. 2020, 265, 115056. [Google Scholar] [CrossRef] [PubMed]
- Orru, H.; Åström, C.; Andersson, C.; Tamm, T.; Ebi, K.L.; Forsberg, B. Ozone and heat-related mortality in Europe in 2050 significantly affected by changes in climate, population and greenhouse gas emission. Environ. Res. Lett. 2019, 14, 074013. [Google Scholar] [CrossRef]
- Tian, P.; Feng, K.; Sun, L.; Hubacek, K.; Malerba, D.; Zhong, H.; Zheng, H.; Li, D.; Zhang, N.; Li, J. Higher total energy costs strain the elderly, especially low-income, across 31 developed countries. Proc. Natl. Acad. Sci. USA 2024, 121, e2306771121. [Google Scholar] [CrossRef]
- Lelieveld, J.; Pozzer, A.; Pöschl, U.; Fnais, M.; Haines, A.; Münzel, T. Loss of life expectancy from air pollution compared to other risk factors: A worldwide perspective. Cardiovasc. Res. 2020, 116, 1910–1917. [Google Scholar] [CrossRef]

Disclaimer/Publisher’s Note: The statements, opinions and data contained in all publications are solely those of the individual author(s) and contributor(s) and not of MDPI and/or the editor(s). MDPI and/or the editor(s) disclaim responsibility for any injury to people or property resulting from any ideas, methods, instructions or products referred to in the content. |
© 2025 by the author. Licensee MDPI, Basel, Switzerland. This article is an open access article distributed under the terms and conditions of the Creative Commons Attribution (CC BY) license (https://creativecommons.org/licenses/by/4.0/).
Share and Cite
Gao, T. Comparative Analysis of PM2.5- and O3-Attributable Impacts in China: Changing Trends and Driving Factors. Sustainability 2025, 17, 7350. https://doi.org/10.3390/su17167350
Gao T. Comparative Analysis of PM2.5- and O3-Attributable Impacts in China: Changing Trends and Driving Factors. Sustainability. 2025; 17(16):7350. https://doi.org/10.3390/su17167350
Chicago/Turabian StyleGao, Tong. 2025. "Comparative Analysis of PM2.5- and O3-Attributable Impacts in China: Changing Trends and Driving Factors" Sustainability 17, no. 16: 7350. https://doi.org/10.3390/su17167350
APA StyleGao, T. (2025). Comparative Analysis of PM2.5- and O3-Attributable Impacts in China: Changing Trends and Driving Factors. Sustainability, 17(16), 7350. https://doi.org/10.3390/su17167350


