Article

A Remote Sensing Approach for Biomass Assessment in Winter Wheat Using the NDVI Second Derivative in Terms of NIR

by
Asparuh I. Atanasov
1,*,
Atanas Z. Atanasov
2,* and
Boris I. Evstatiev
3
1
Department of Mechanics and Elements of Machines, Technical University of Varna, 9010 Varna, Bulgaria
2
Department of Agricultural Machinery, Agrarian and Industrial Faculty, University of Ruse “Angel Kanchev”, 7004 Ruse, Bulgaria
3
Department of Automatics and Electronics, Faculty of Electrical Engineering, Electronics and Automation, University of Ruse “Angel Kanchev”, 7004 Ruse, Bulgaria
*
Authors to whom correspondence should be addressed.
Sustainability 2025, 17(16), 7299; https://doi.org/10.3390/su17167299
Submission received: 9 July 2025 / Revised: 3 August 2025 / Accepted: 8 August 2025 / Published: 12 August 2025

Abstract

Traditional NDVI-based biomass estimation methods often suffer from saturation at high vegetation density and limited sensitivity during early crop growth, which reduces their effectiveness for precise monitoring. This study addresses these limitations by introducing the use of the second derivative of NDVI with respect to near-infrared (NIR) reflectance as a novel indicator of inflection points and dynamic changes in crop development. The proposed method is mathematically derived, and a corresponding index is calculated. Field trials were conducted on five winter wheat varieties over two growing seasons (2021–2023). The results demonstrated a strong correlation between the derived index and actual biomass measurements. To validate the findings, linear regression analysis between the second derivative of NDVI and biomass scores yielded R and R2 values equal to 1. These findings confirm the high predictive power and reliability of the method for non-destructive UAV-based biomass monitoring in precision agriculture.

1. Introduction

One of the key parameters of precision agriculture is the ability to estimate the amount of biomass. Remote sensing significantly accelerates this process, allowing for the assessment of plant mass accumulation throughout the vegetation period. This, in turn, supports effective planning of agrotechnical measures and improves yield forecasting. Traditionally, biomass assessment is based on representative field samples, which provide discrete data rather than a comprehensive spatial overview. Standard measurements of plant mass are often obtained at harvest using farmer-reported data, which are typically imprecise and collected after the completion of vegetation processes.
The importance of determining crop phenology for yield prediction has been discussed in [1,2], while the impact of climate change on crop development has been explored in [3]. The complexity of biomass assessment increases when dealing with multiple crops or cultivars [4]. Different studies have proposed and investigated methodologies for yield estimation [5], temporal–spatial modeling [6], spatial determination for various crops [7], and real-time monitoring applications [8], among others. Variations in temperature and their impact on biomass depending on location and timing were addressed in [9,10].
Remote sensing plays a crucial role in collecting data directly from the field [11], and numerous studies have explored satellite-based acquisition of reflective vegetation indices (VI) [12,13,14]. Some of these works have demonstrated their potential for identifying phenological stages and estimating biomass [15,16,17]. The analysis of these data is often performed using regression analysis [18,19], although this method may not fully capture the variability in crop development. To overcome these limitations, machine learning approaches have been introduced [20], enabling the use of multiple dependent and independent variables for yield prediction [21]. In recent years, many studies have proposed biomass assessment solutions based on deep learning and UAV-obtained hyperspectral [22] or visual spectrum imaging [23]. While deep learning has shown very promising results, it has its limitations, such as higher requirements for the volume and quality of training data, the hardware and software for data analysis, etc. [24]. Furthermore, its results could be difficult to understand by farmers who do not have the appropriate expertise.
Among vegetation indices, the normalized difference vegetation index (NDVI) is one of the most widely used [25], particularly for simulation-based data analysis [26]. This popularity stems from the integration of multispectral cameras on unmanned aerial vehicles (UAVs), which record near-infrared (NIR) wavelengths [27,28,29,30]. This way, a fast and efficient means of acquiring NDVI is provided, enabling repeated observations over the same area for in-depth analysis. NDVI has been successfully applied to estimate biomass, track phenological trends, and differentiate crop varieties, thus contributing to more accurate yield prediction [31,32]. Biomass estimation in wheat [33] and maize [34] using correlation analysis or mathematical modeling has also been used.
An alternative approach involves analyzing the first and second derivatives of different VI time series, such as NDVI and EVI, to assess phenological development, especially during early growth and rapid development stages [35,36]. It is capable of capturing the acceleration or deceleration of changes in the VI and enables early diagnosis of stress factors or disease before visible symptoms occur, including the detection of drought impacts and sudden vegetation changes.
In Ref. [37], the changes in the NDVI time series curve were explored to determine planting and harvesting dates for crops like corn and soybeans. Additionally, Ref. [38] investigates the use of the second derivative of the NDVI time series as an indicator of biomass, derived from data acquired via a multispectral camera mounted on an unmanned aerial system (UAS). Both studies estimate the second derivative of NDVI over time, denoted as NDVI(t). In Ref. [39], the first NDVI derivatives over time were used as an indicator for the most active tillering stage of rice growth, and the second derivative as an indicator for estimating the maturity stage. In another study [40], NDVI’s first derivative was used to form a criterion for the identification of degradation and disturbance in wooded areas, which relies on annual maximal pixel-level NDVI values. Other studies have used NDVI and its derivatives for biomass estimation and phenological monitoring [41,42,43].
Despite recent advances in the use of vegetation indices for remote biomass estimation, significant gaps remain. Standard NDVI-based approaches face limitations such as signal saturation in dense canopies and low sensitivity during early crop development. These issues restrict their effectiveness in capturing subtle but agronomically important changes in biomass accumulation. This problem is partially taken care of by the application of derivatives of NDVI time series; however, existing research has primarily focused on NDVI’s use in phenological differentiation, stress detection, or as a time-series indicator for crop monitoring. Furthermore, the application of other derivatives of NDVI for spatial biomass mapping, such as those with respect to near-infrared reflectance, remains practically unexplored.
To address these gaps, we want to explore the application of the second derivative of NDVI with respect to NIR reflectance and its ability to enhance responsiveness to structural and physiological variations in vegetation, which is the main contribution of this study. Our specific goal is to assess the potential of using the second derivative of NDVI with respect to NIR, derived from UAV-acquired multispectral imagery, as a quantitative indicator for biomass estimation in winter wheat. The main objectives are (1) to compute the NDVI second derivative in terms of NIR from UAV imagery collected over fields sown with multiple winter wheat varieties, (2) to obtain in-field biomass measurements through physical sampling, and (3) to analyze the statistical relationship between the computed NDVI derivative and the measured biomass data.

2. Materials and Methods

The study was conducted using remote sensing of different winter wheat varieties over two full growing seasons, corresponding to the 2021–2022 and 2022–2023 agricultural years. Agricultural fields were monitored throughout the entire wheat development period. To validate the remote sensing data, a visual assessment of the crops was performed in the field. Additionally, the results were compared with quantitative measurements of canopy coverage obtained from vertically captured UAV imagery, and biomass above the soil surface was estimated accordingly.

2.1. Study Area

The studied fields are located on the territory of the city of Dobrich, Republic of Bulgaria, and their coordinates are 43.553083N, 27.832161E and 43.548491N, 27.757799E. The locations of the experimental fields are shown in Figure 1. The fields were sown with common winter wheat (Triticum aestivum L.) during the studied periods.

2.2. UAV Flight Planning and Data Collection

The study was carried out using the DJI Mavic 2 Pro UAV [44], which has a take-off weight of 907 g and a maximum flight speed of 72 km/h. For data collection, the UAV was operated in “P” mode, limiting the flight speed to 10 m/s to ensure image stability. Mission planning was performed using the Pix4Dcapture software [45]. Flights were conducted at an altitude of 100 m above ground level, with an overlap of 80% both longitudinally and laterally to ensure optimal coverage for photogrammetric processing.
The UAV is equipped with an integrated RGB camera, capturing images in the red, green, and blue spectral bands. However, to calculate NDVI, NIR data are required. For this purpose, a multispectral Mapir Survey3W RGN camera [46] was mounted on the UAV. This camera captures data in the red (R), green (G), and NIR bands using a modified Sony Exmor R IMX117 12 MP sensor (Bayer RGB type). The lens features an 87° horizontal field of view (HFOV), 19 mm focal length, f/2.8 aperture, and −1% extreme low distortion non-fisheye optics.
The Survey3W operates autonomously and is not directly connected to the UAV’s flight controller. It was configured in automatic mode to capture images at 1 s intervals. Each image was georeferenced using a u-blox UBX-G7020-KT GPS module [47]. Figure 2 illustrates the planned flight path used to capture the study area. The meandering trajectory was calculated based on the sensor size, flight altitude, and image overlap parameters.
During a single mission over the test field, the built-in Mavic 2 Pro camera captured 132 images, while the Survey3W camera produced 337 images. The planned ground sampling distance (GSD) for the 20 MP built-in RGB camera was 2.34 cm/pixel, with a final processed resolution of 2.39 cm/pixel. For the Survey3W camera, the processed resolution was 3.71 cm/pixel. Both resolutions provided sufficient spatial detail to allow assessment of individual leaves and biomass distribution within the crop canopy.

2.3. Crop Evaluation

To verify the remote sensing results, field measurements were conducted during vegetation stages. These included plant height, crop volume estimation, plant density, and quantitative field coverage. A visual scoring system was used to assess biomass density and canopy coverage. A score of 10 was assigned to plots exhibiting dense, uniform vegetation with well-developed wheat, while a score of 1 represented areas with no visible crop cover.
The actual volumetric weight of the biomass was not measured as the evaluation was based solely on remote sensing data. This presents an inherent limitation of the method: it allows for the estimation of crop density and relative biomass distribution but not the precise biomass quantity. Nonetheless, theoretical biomass values can be derived through mathematical models incorporating plant height, density, and species-specific characteristics.

2.4. Data Analysis

The normalized difference vegetation index is used to quantify vegetation and estimate biomass changes of the vegetation processes in crops. Chlorophyll in vegetation reflects more NIR and green light compared to other wavelengths. It absorbs more red and blue light. It is calculated as the ratio between the red (R) and NIR values according to the formula [25]:
N D V I   =   N I R R N I R + R ,
where N I R is the reflectance in the near-infrared spectrum (850 nm) and R is the reflectance in the red spectrum (660 nm). NDVI values range from –1 to + 1, where higher values indicate more vigorous and dense vegetation.
The second derivative of NDVI is commonly denoted as NDVI (t) when based on a time series. It is interpreted as a measure of variation over time and is used to identify inflection points in the NDVI curve. These inflection points correspond to transitions in crop development and can signal abrupt changes in growth dynamics.
In this study, however, the second derivative is not derived in terms of time but is estimated instead in terms of the NIR reflectance. The second derivative in terms of NIR NDVI″ is calculated from the NDVI surface as a numerical approximation of curvature, allowing for the detection of local accelerations or decelerations in the NIR component of NDVI, which reflect underlying crop structure and biomass distribution. The specific formula used for this calculation is:
N D V I   =   𝜕 2 𝜕 N I R 2 N I R     R N I R   +   R
The mathematical solution to Equation (2) is:
N D V I =   𝜕 𝜕 N I R 𝜕 𝜕 N I R N I R     R N I R   +   R   =   2 ( N I R     R ) ( N I R   +   R ) 3   2 N I R   +   R 2
and it could be further simplified mathematically to:
N D V I =   4 R N I R   +   R 3
The result of this equation is then used to compute the mathematical value of the second derivative of the NDVI in terms of NIR, which provides insights into changes in vegetation growth dynamics. For simplicity, from now on in this study, when we say the second derivative of NDVI, it is assumed to be in terms of NIR, unless explicitly stated otherwise.
Additionally, the method applied for the remote estimation of soil water content is based on the reflectance vegetation index, normalized difference water index (NDWI), as proposed by [48].
N D W I = ( G N I R ) ( G + N I R ) ,
where N I R   i s   t h e   r e f l e c t a n c e   i n   t h e   n e a r i n f r a r e d   s p e c t r u m 850   n m ,   a n d   G denotes the reflectance in the green spectrum (550 nm).
NDWI is used to assess the surface water content and vegetation moisture. According to the findings reported by [48], NDWI values greater than 0.5 typically correspond to water bodies, while vegetated surfaces generally return lower index values, ranging between 0 and 0.2.
The second derivative of NDVI with respect to NIR was chosen for its ability to capture curvature and inflection points in the NDVI response curve. Unlike the standard NDVI, which may saturate or mask subtle variations, NDVI″ amplifies local changes in vegetation reflectance. This makes it particularly suitable for detecting early growth dynamics and differentiating biomass levels that would otherwise appear similar in NDVI values.

Uncertainty and Comparative Advantages of Vegetation Indices

Equations (1)–(4) rely on reflectance values obtained from multispectral imaging. Therefore, the accuracy of NDVI, NDVI″, and NDWI is subject to various uncertainties, including the following:
Sensor calibration and noise: Slight misalignments or inconsistencies in camera sensitivity across the NIR, red, or green bands can introduce bias into calculated indices.
Atmospheric conditions: Variability in lighting, cloud cover, and humidity at the time of UAV flights can affect reflectance values, especially in shorter wavelengths.
Viewing geometry and canopy structure: Shadows, leaf angle distribution, and flight altitude can affect reflectance measurements.
Georeferencing errors: Spatial mismatch between bands or overlapping images can distort index values at field boundaries.
NDVI, being a ratio-based index, partially mitigates some of these effects, but it saturates at high canopy densities and becomes less sensitive in mature crops. In contrast, NDVI″, as a second-order derivative, enhances sensitivity to small changes in reflectance, especially during early or transitional growth phases. This makes it particularly valuable for detecting growth acceleration/deceleration, even when NDVI remains stable or saturated.
NDWI, on the other hand, complements both indices by being responsive to vegetation water content. It is particularly effective in identifying water stress or evaluating surface moisture in early development stages or during dry periods—aspects that NDVI alone cannot resolve.
While NDVI provides a robust baseline for biomass estimation, NDVI″ improves responsiveness to physiological changes, and NDWI adds environmental context, particularly in water-limited scenarios. The use of NDVI″ and NDWI thus enhances the precision and diagnostic power of remote sensing-based crop monitoring.

2.5. Processing of Results

The software product Pix4Dfields, developed by Pix4D S.A. (Prilly, Switzerland) [49], was used to process the obtained results. A working window with superimposed positions of the photos from the RGN camera obtained during a flight over the field is shown in Figure 3. This camera takes pictures continuously from take-off to landing at an interval of 1 s; therefore, the photos from takeoff until the desired starting position and from the final position to the landing point were excluded from the analysis. This way, it is ensured that the different shooting heights do not impact the interpretation of the photos during the creation of an orthomosaic.
Set for the source data maximum ground sampling distance (GSD) = 0 sm/pix, maximum total megapixels = 50 MP.
The software product used for image processing generates a digital surface model (DSM) and a zoning map rapidly, owing to the use of cloud-based computational infrastructure. Based on these outputs, various reflectance indices, including NDVI and NDWI, are calculated. The software also allows for implementing custom index formulas as needed.

2.6. Mathematical Modeling

A regression analysis was performed using Microsoft Excel to examine the relationship between the dependent variable Y (biomass score) and the independent variable X (second derivative of NDVI in terms of NIR, denoted as NDVI″). This method was selected to provide a mathematical description of the correlation between the two variables and to estimate the regression coefficients b0 and b1 of a simple linear regression model, expressed as follows [50]:
Y i   =   b 0     +     b 1       X i  
The analysis aimed to determine the strength and direction of the linear relationship by estimating the correlation coefficient R and the coefficient of determination R2.

3. Results and Discussion

3.1. Results Obtained from Field Research

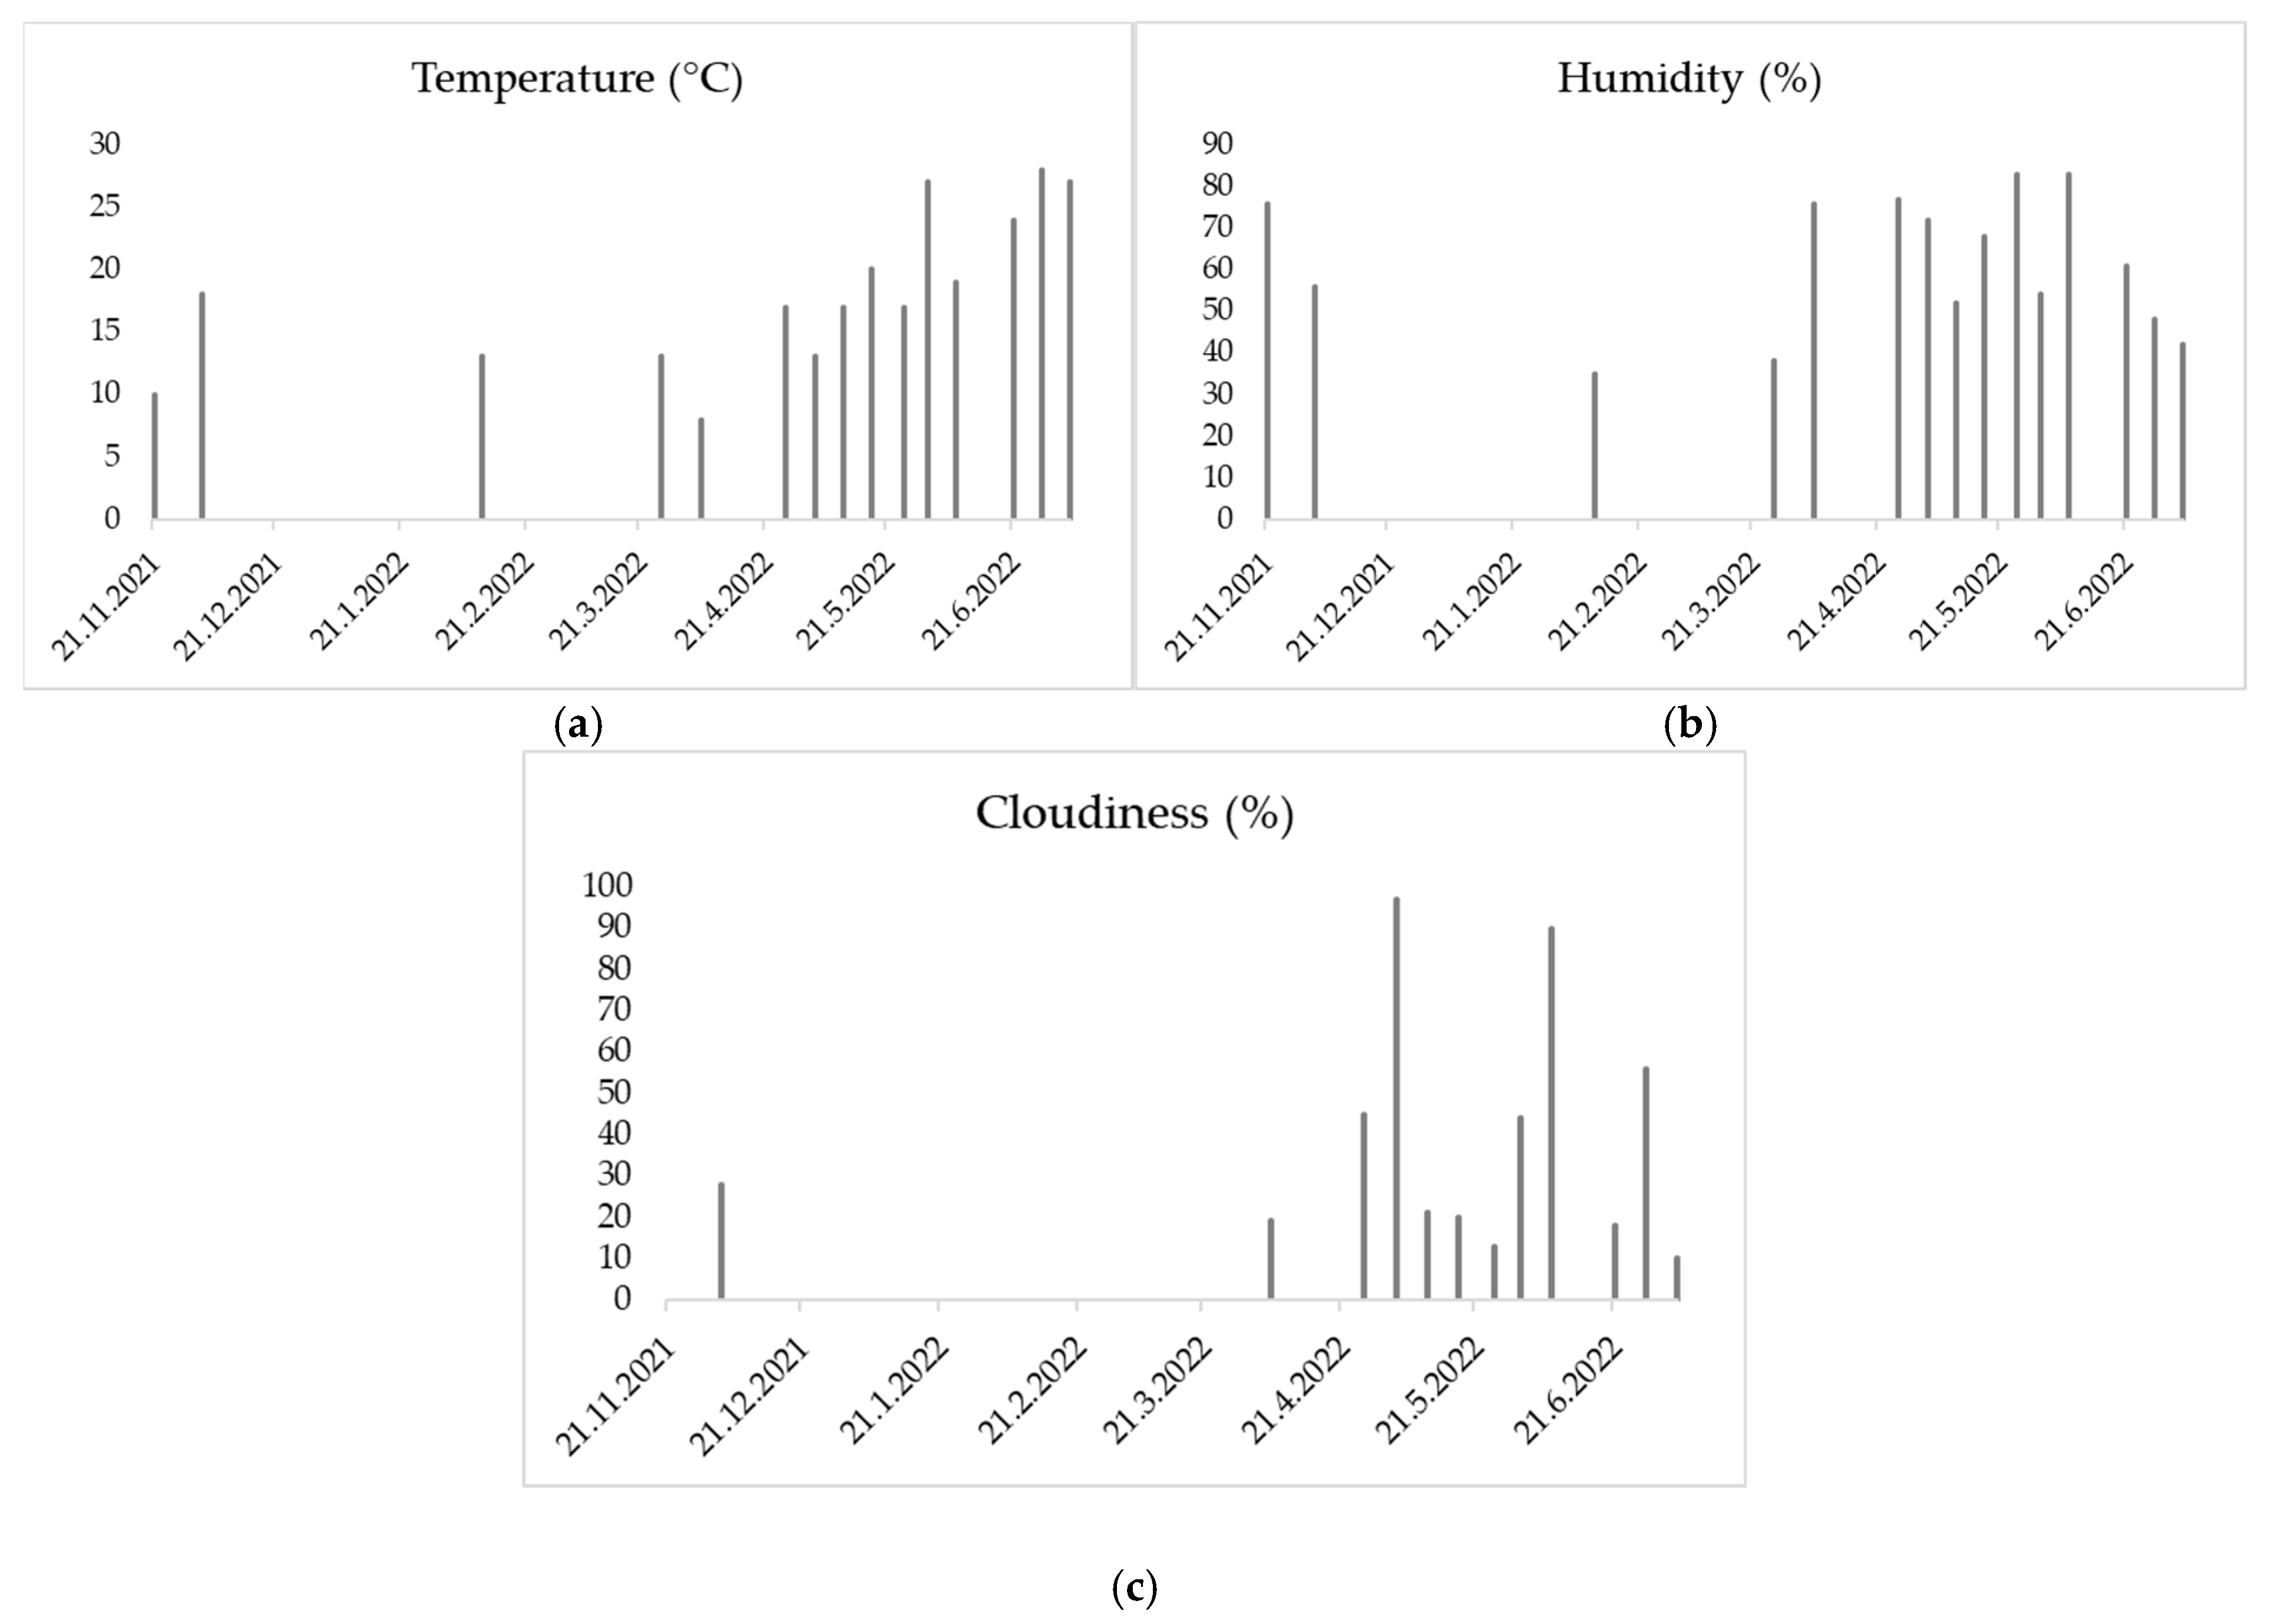
During the surveys, meteorological data from the observed field were also recorded to support the interpretation of the remote sensing results. For the 2021–2022 season, measurements were collected at field location 43.553083N, 27.832161E, including air temperature (Figure 4a), atmospheric humidity (Figure 4b), and cloud cover (Figure 4c).
These environmental parameters are not only relevant to the growth and development of winter wheat but also have a direct influence on the quality and reliability of the reflectance indices, such as NDVI and NDWI, derived from UAV imagery.
Wheat measurements related to physical parameters, collected on the days of filming, are presented in Table 1. The table includes measured values for stem diameter, density within a 30 cm segment, and a scoring value. The scoring system was developed to reflect the overall density of the plant biomass, which varies with an increasing number of leaves and their desiccation. The total stem volume, plant height, and inter-row spacing at the time of formation were also considered.
Although actual biomass was not directly measured through destructive sampling in this study, physical parameters were recorded in Table 1. These parameters are commonly used in biomass estimation models and can serve as proxies for evaluating crop structure and relative biomass development.
The decision to rely on remote sensing data and indirect field observations was based on the study’s objective to evaluate non-destructive, scalable monitoring techniques. Direct measurement of biomass (e.g., via oven-drying methods) was not feasible for this particular campaign due to time and labor constraints.
In future work, destructive sampling will be incorporated to validate and improve the remote estimates generated through spectral indices.
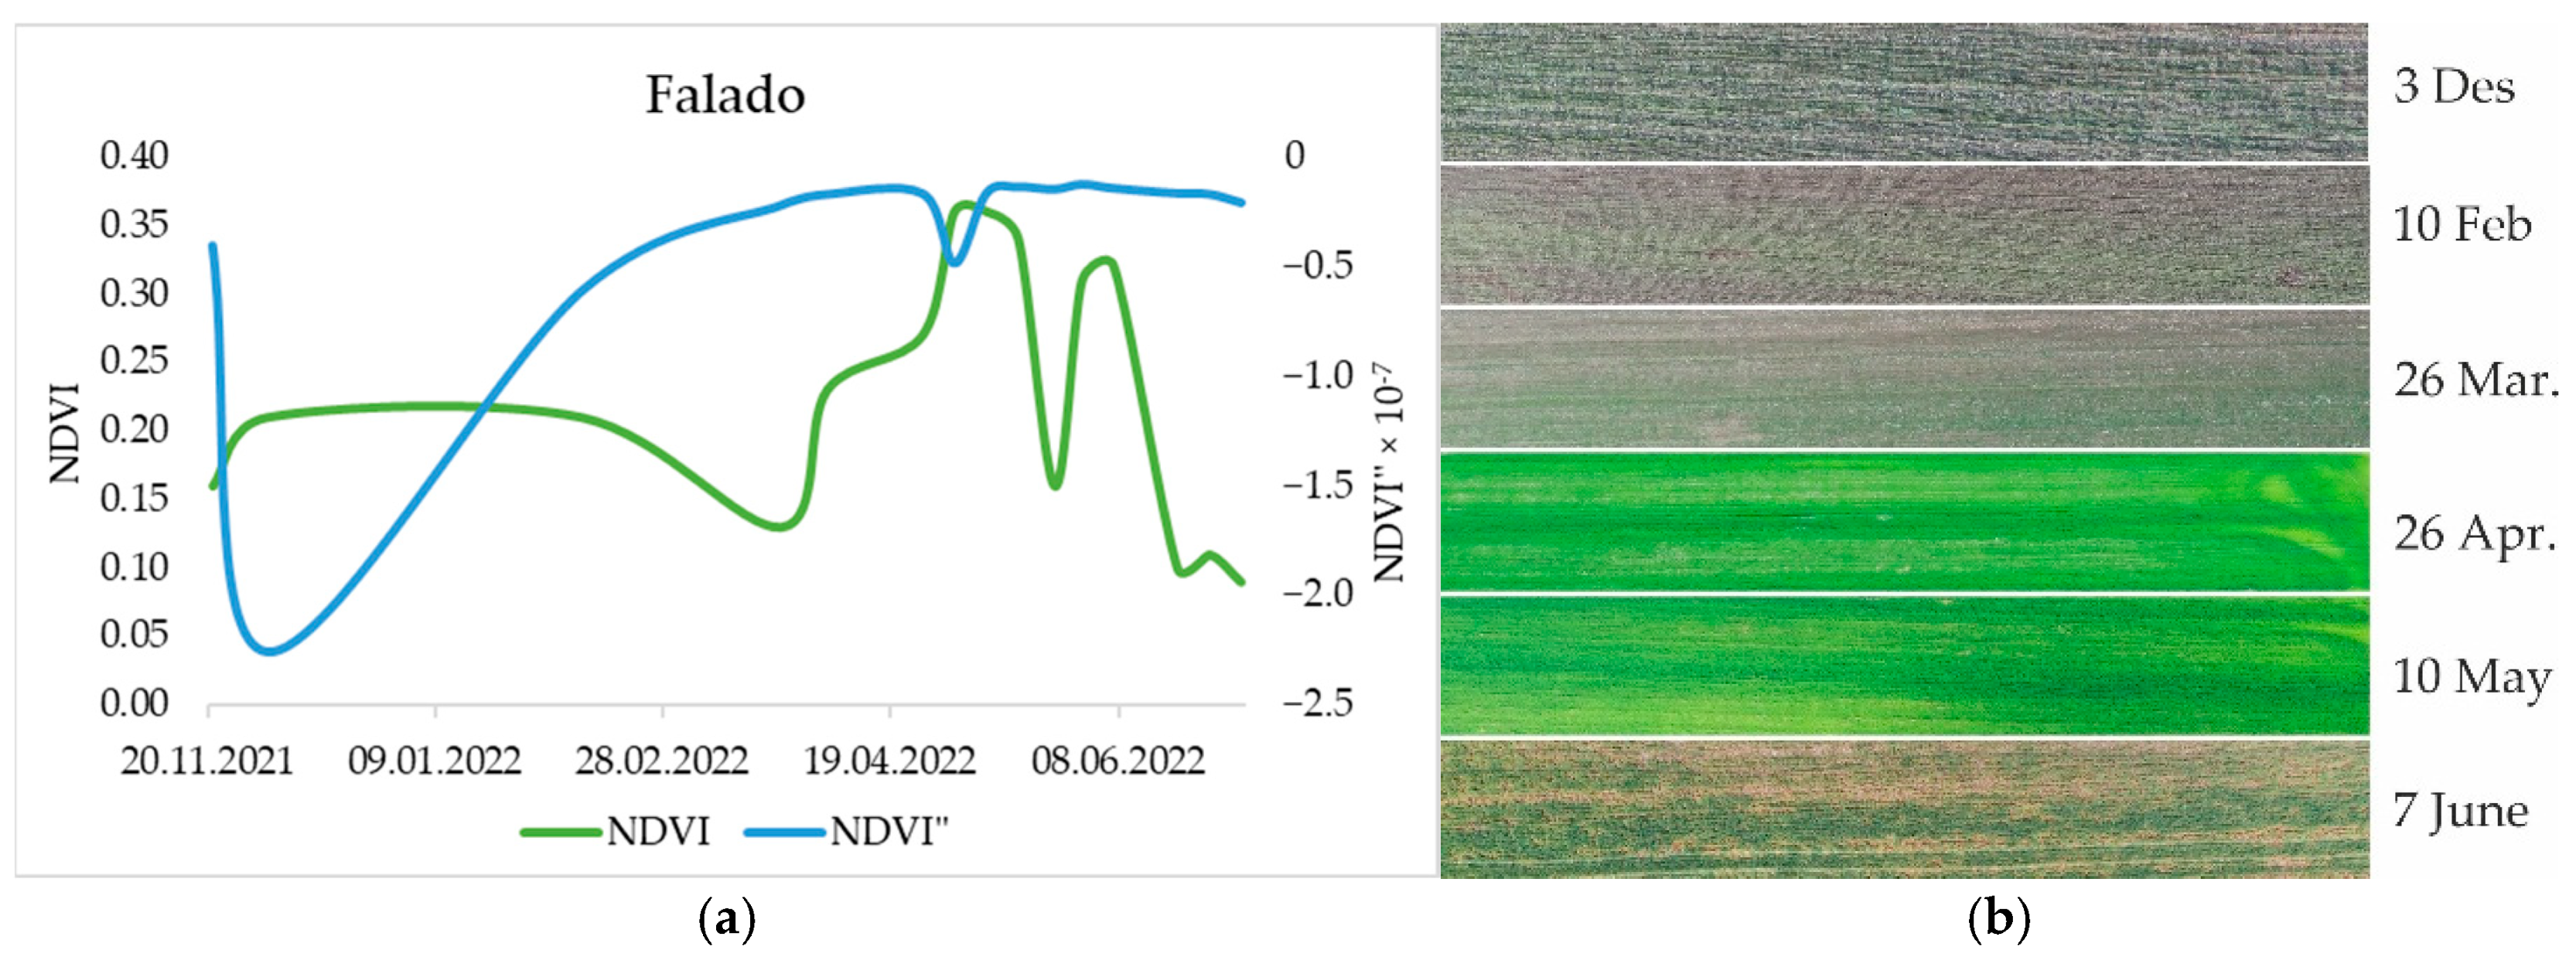
During the 2021–2022 growing season, the field was sown with the common winter wheat variety Falado. The results for the vegetation index NDVI and its second derivative NDVI″ obtained throughout the season are presented in Figure 5a. Representative photographs of the crop at various vegetation stages are shown in Figure 5b.
The measurements showed that after the tillering stage, due to unusually high seasonal temperatures, the vegetation did not enter dormancy but continued to develop. By mid-December, UAV imagery revealed that the wheat canopy covered 100% of the field. Biomass accumulation continued to increase until the heading stage and began to decline with the onset of maturity, characterized by foliage wilting. This pattern is also reflected in the graph of NDVI″, where values approach zero during the period following the spring revival of the wheat. Subsequent fluctuations are attributed to climatic variations such as temperature and precipitation, which influence the presence or absence of stress.
The NDWI index for the field during the 2021–2022 season is shown in Figure 6. The lowest NDWI value was recorded at the end of April. At the same time, a decrease in NDVI″ was observed, corresponding to the highest NDVI value during this period. This coincides with the wheat transition from the tillering phase to the spindle phase.
Meteorological parameters recorded for the field at coordinates 43.548491N, 27.757799E during the 2022–2023 season are presented in Figure 7, including air temperature (a), illumination (b), wind speed (c), humidity (d), and precipitation amount (e).
During the 2022–2023 season, four winter wheat varieties—Marilyn, Enola, Annapurna, and Avenue—were studied in the experimental field at coordinates 43.548491N, E27.757799 (Figures 8, 10, 12 and 14). The results of NDVI and NDVI″ for the Marilyn variety are presented in Figure 8a,b show UAV photographs of the crop at various vegetation stages from 100 m altitude.
The warm autumn contributes to the rapid development of the crop and the increase in NDVI after tillering. Wheat covers a large part of the soil (when photographed by a UAV), and with the accumulation of biomass, the NDVI″ increases sharply, which continues without interruption until mid-December. Spring frosts in early February lower the NDVI, which also lowers the NDVI″. The subsequent development of wheat has an intense change in NDVI due to climatic features (temperature and amount of precipitation). We have an increase in the index at the end of February with the accumulation of biomass and a subsequent drop due to climatic features. An increase was also registered during tillering in mid-April, followed by a sharp drop. We have the highest value at tillering in early May, followed by a decrease. This dynamic is directly related to the climatic features during the period (Figure 7), but this only changes the reflection in the NIR region, which diagnoses the presence of stress and does not change the amount of biomass, and the NDVI″ remains at high values. Field studies conducted in the field did not detect any visual change in the wheat because NIR is invisible to the human eye. The amount of biomass is maintained until maturity.
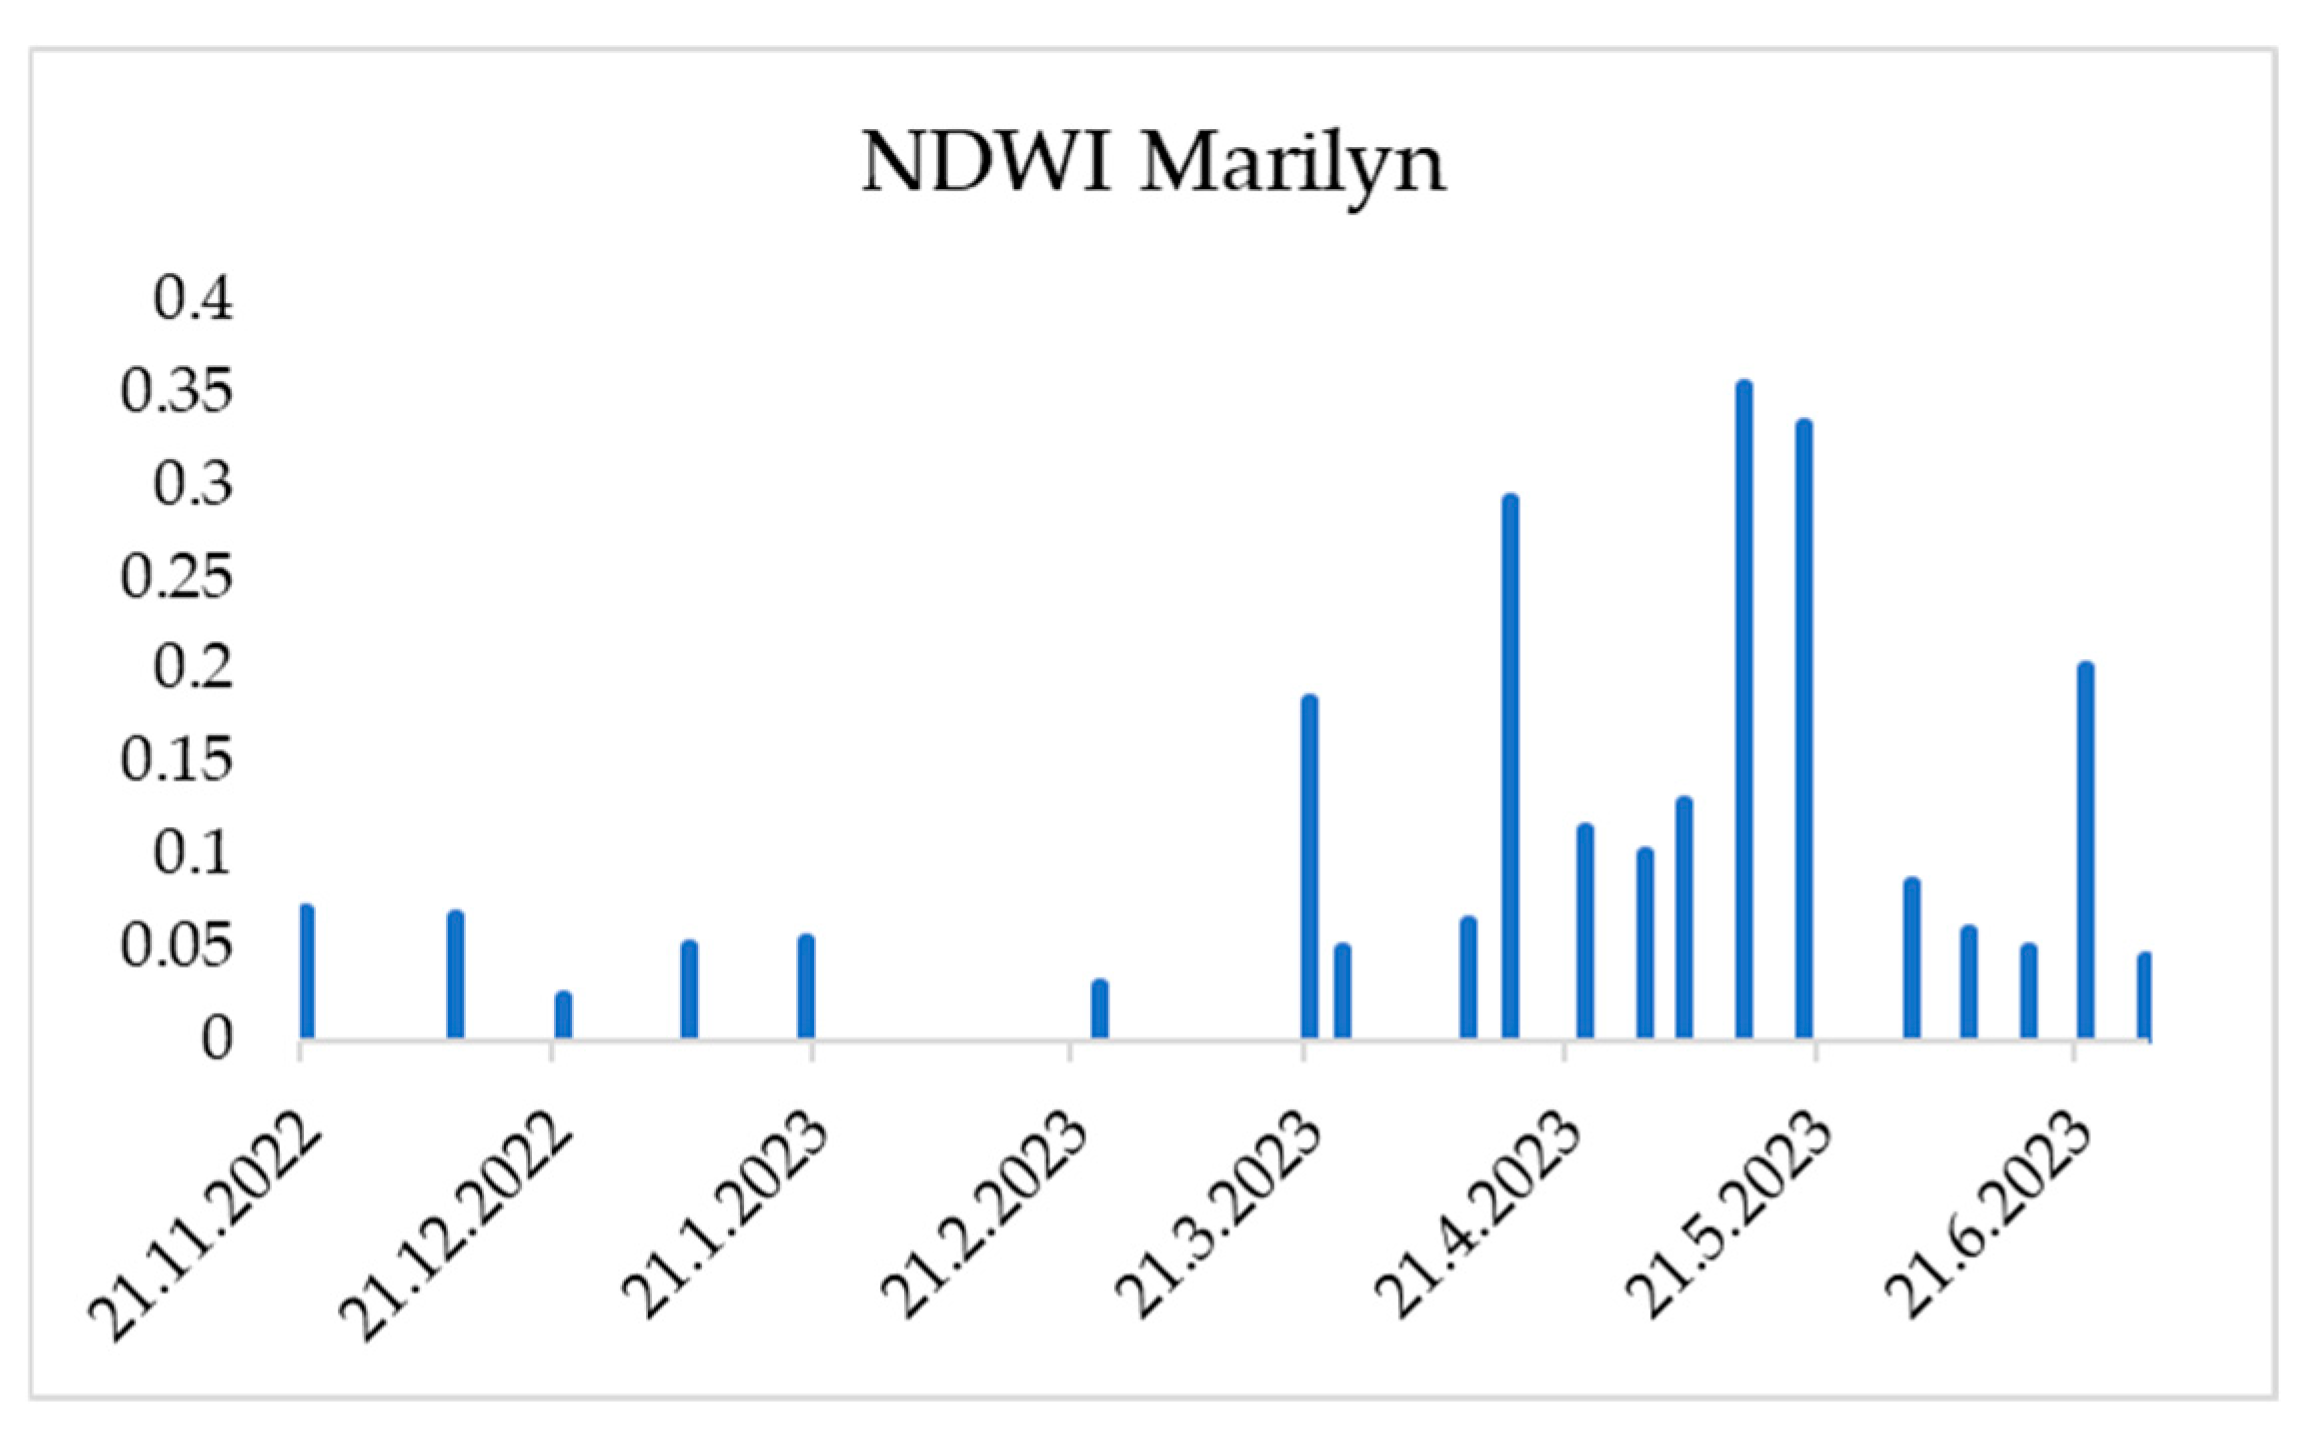
Figure 9 illustrates the variation in the NDWI index for the field sown with the Marilyn variety during the 2022–2023 season. The observed trend closely follows the patterns of precipitation (Figure 7d) and humidity (Figure 7e) and shows strong temperature dependence (Figure 7a), as remote sensing primarily captures surface moisture content, which is significantly influenced by air temperature and wind speed.
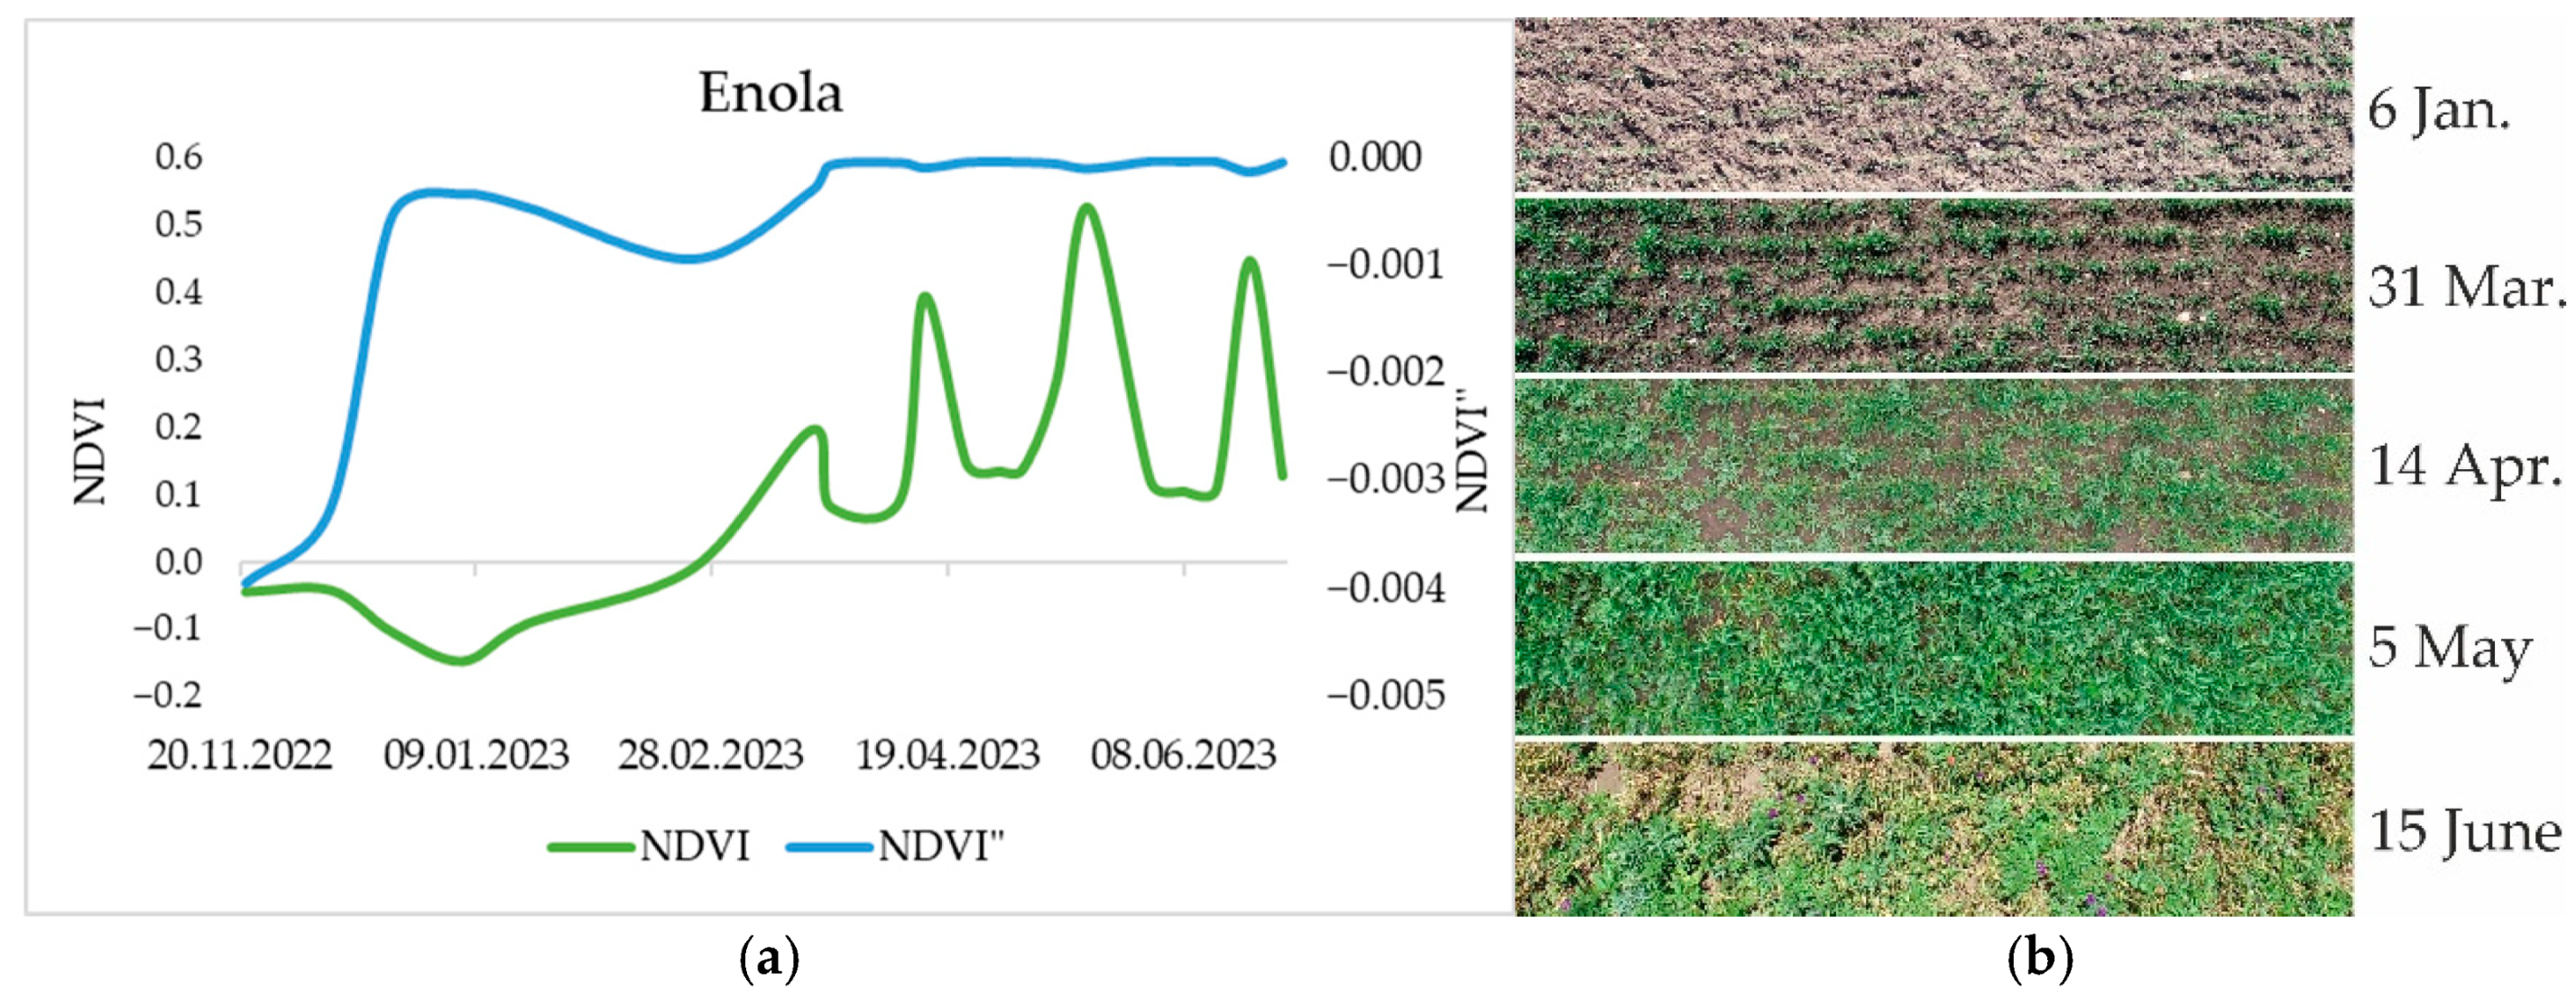
For the Enola variety, after the onset of tillering (observed around 3 December 2021), a period of dormancy began due to decreasing temperatures and adverse meteorological conditions. This phase led to a gradual decline in NDVI values. In mid-February 2022, with the rise in temperatures, active vegetation resumed, and NDVI increased again. However, a temporary drop in the index was recorded in mid-March, likely due to late spring frosts.
During April, continued biomass accumulation contributed to a new rise in NDVI, although minor fluctuations occurred in response to variable weather conditions. The highest NDVI value was recorded in early March, coinciding with the peak of vegetative growth.
NDVI″, the second derivative of NDVI, showed a sharp increase immediately following tillering, reflecting rapid biomass accumulation confirmed through field measurements. During dormancy, the NDVI″ index declined slightly. Upon resumption of growth in February, it increased again and remained relatively stable at a high level, despite NDVI fluctuations. The NDVI″ index effectively corresponds to the percentage of soil surface covered by wheat vegetation (Figure 10).
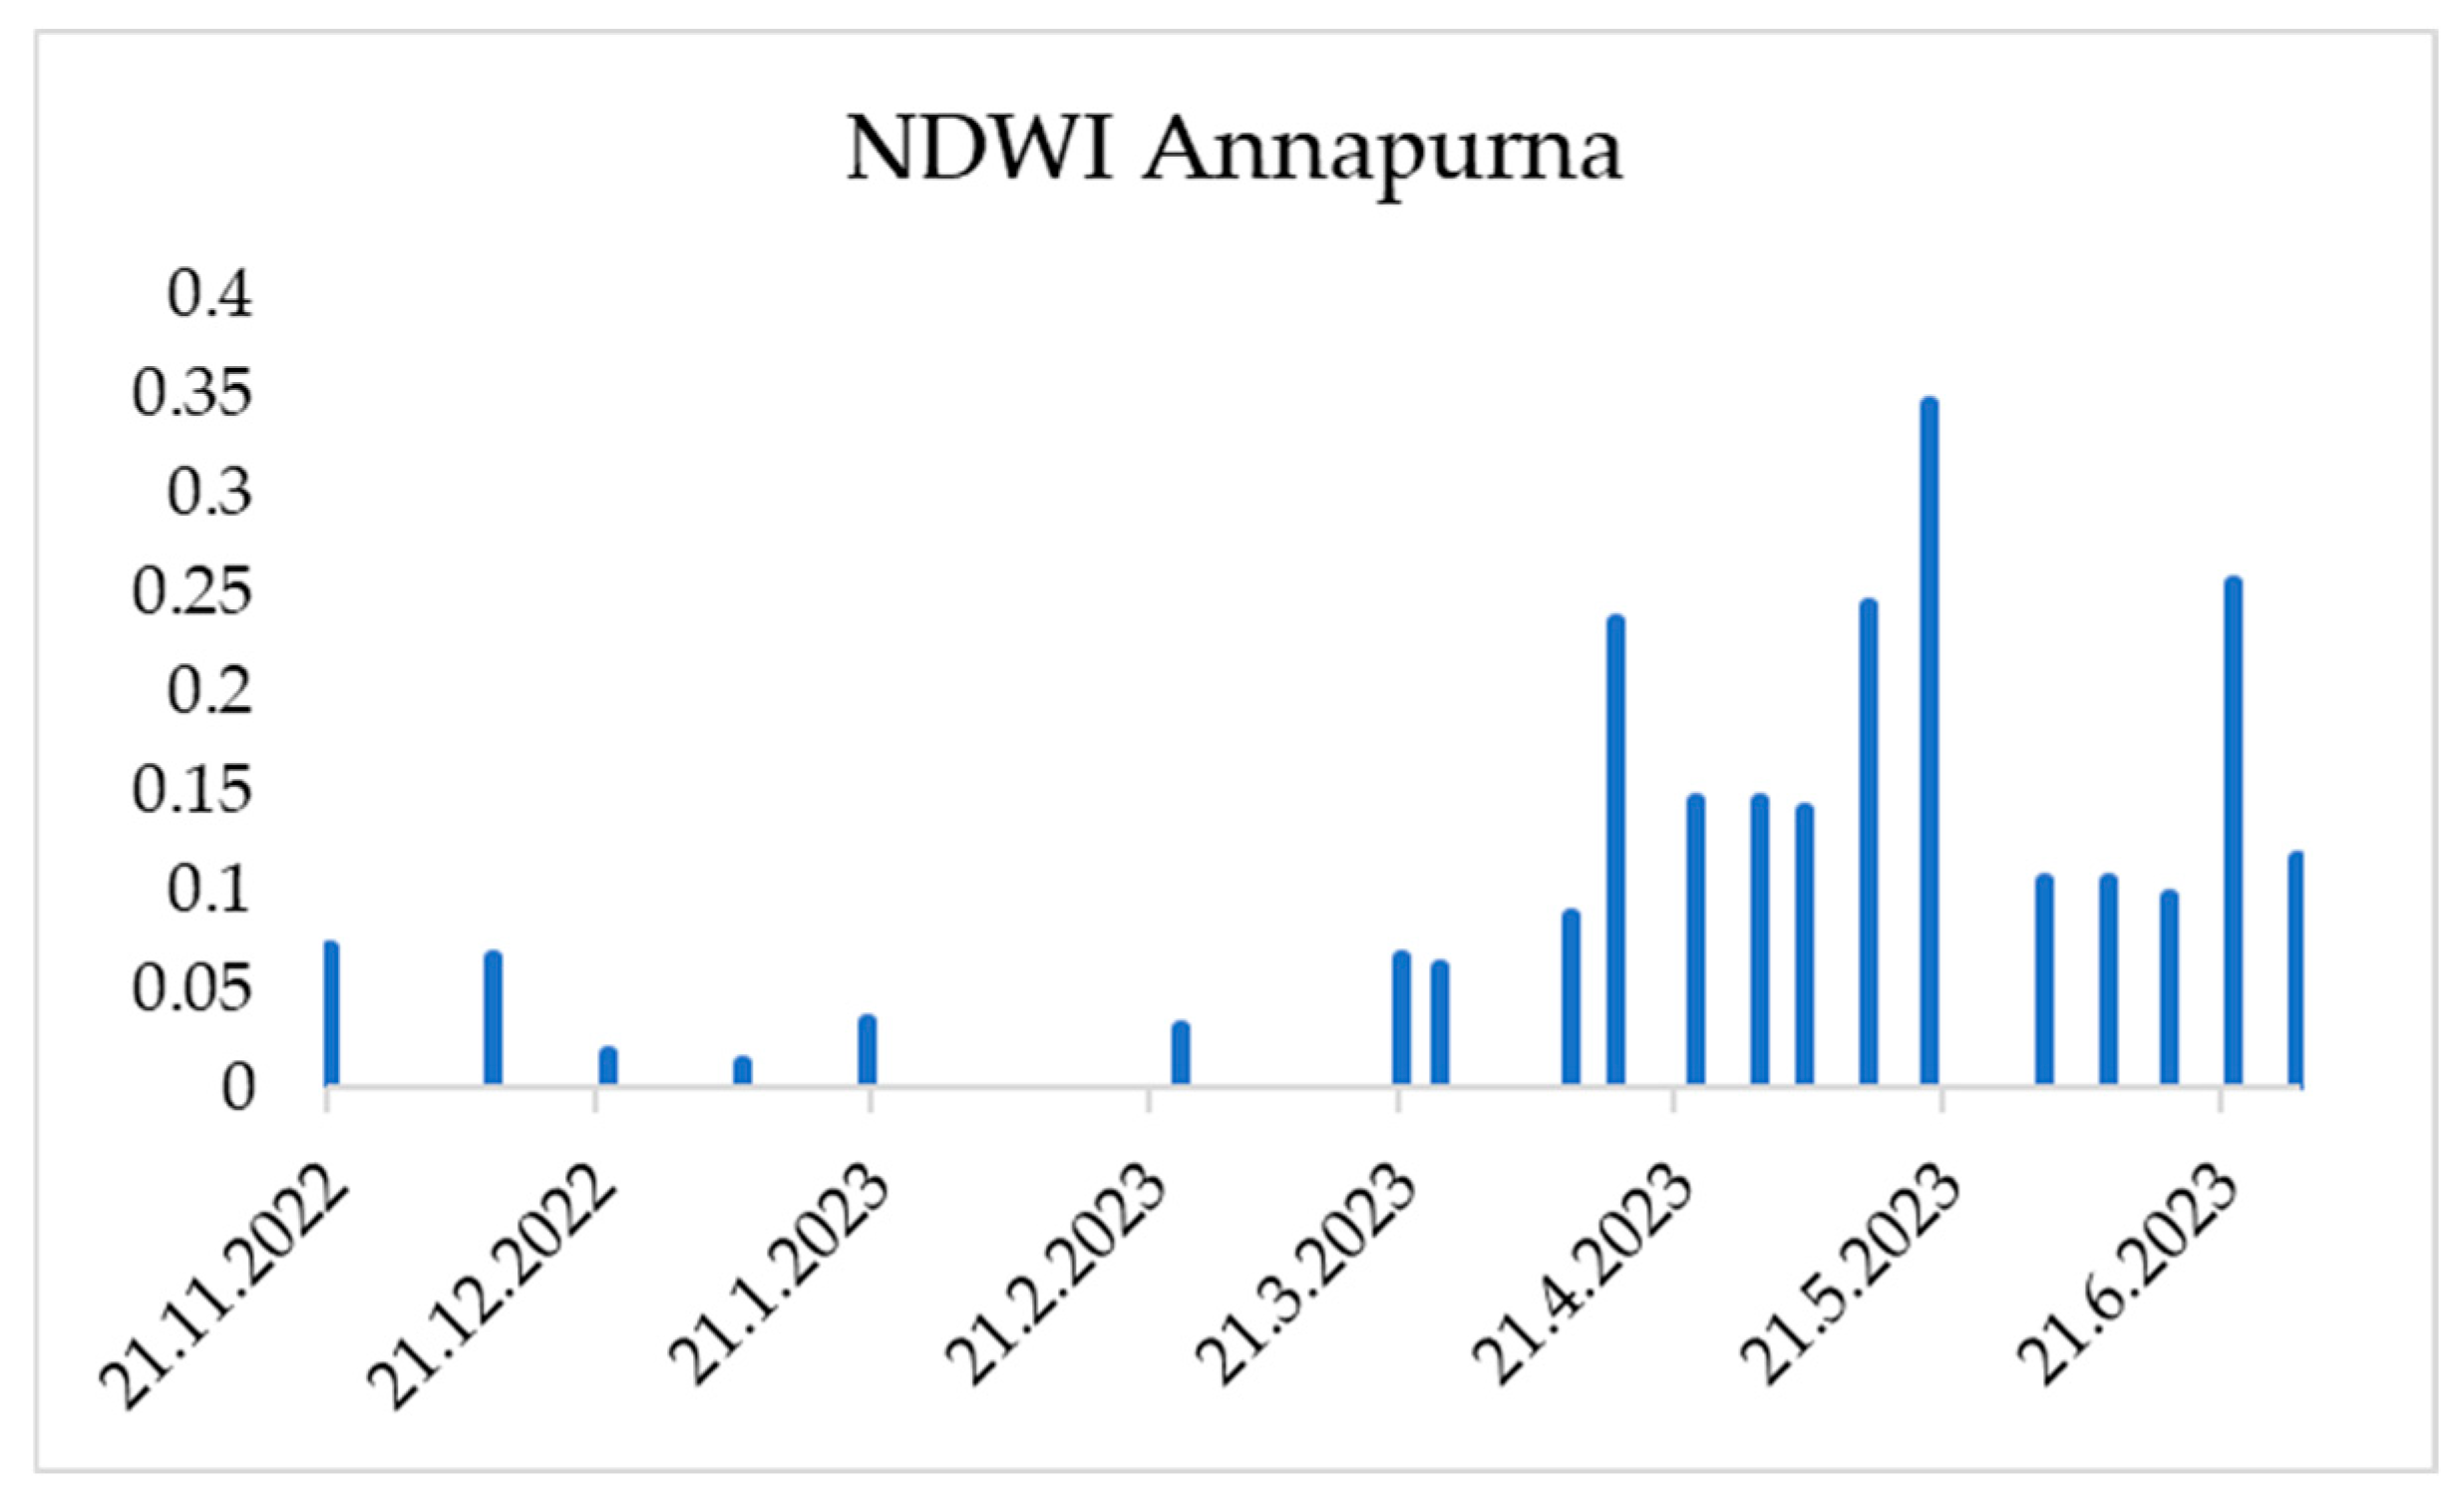
The variation in the NDWI index for the Enola variety during the 2022–2023 season is presented in Figure 11. The increase in index values during the spring months correlates with increased precipitation (Figure 7e), elevated humidity, and relatively moderate temperatures.
The Annapurna variety exhibited similar trends in both NDVI and NDVI″ indices to those observed in Enola (Figure 12). Field observations confirmed full soil coverage by the wheat crop, which was achieved by the end of the tillering stage. At the same time, a sharp increase in NDVI″ was recorded, with subsequent fluctuations remaining close to zero. Despite variations in NDVI, the NDVI″ values remained relatively stable. This consistency corresponds to the accumulated biomass, as also evident from the UAV-acquired images (Figure 12b).
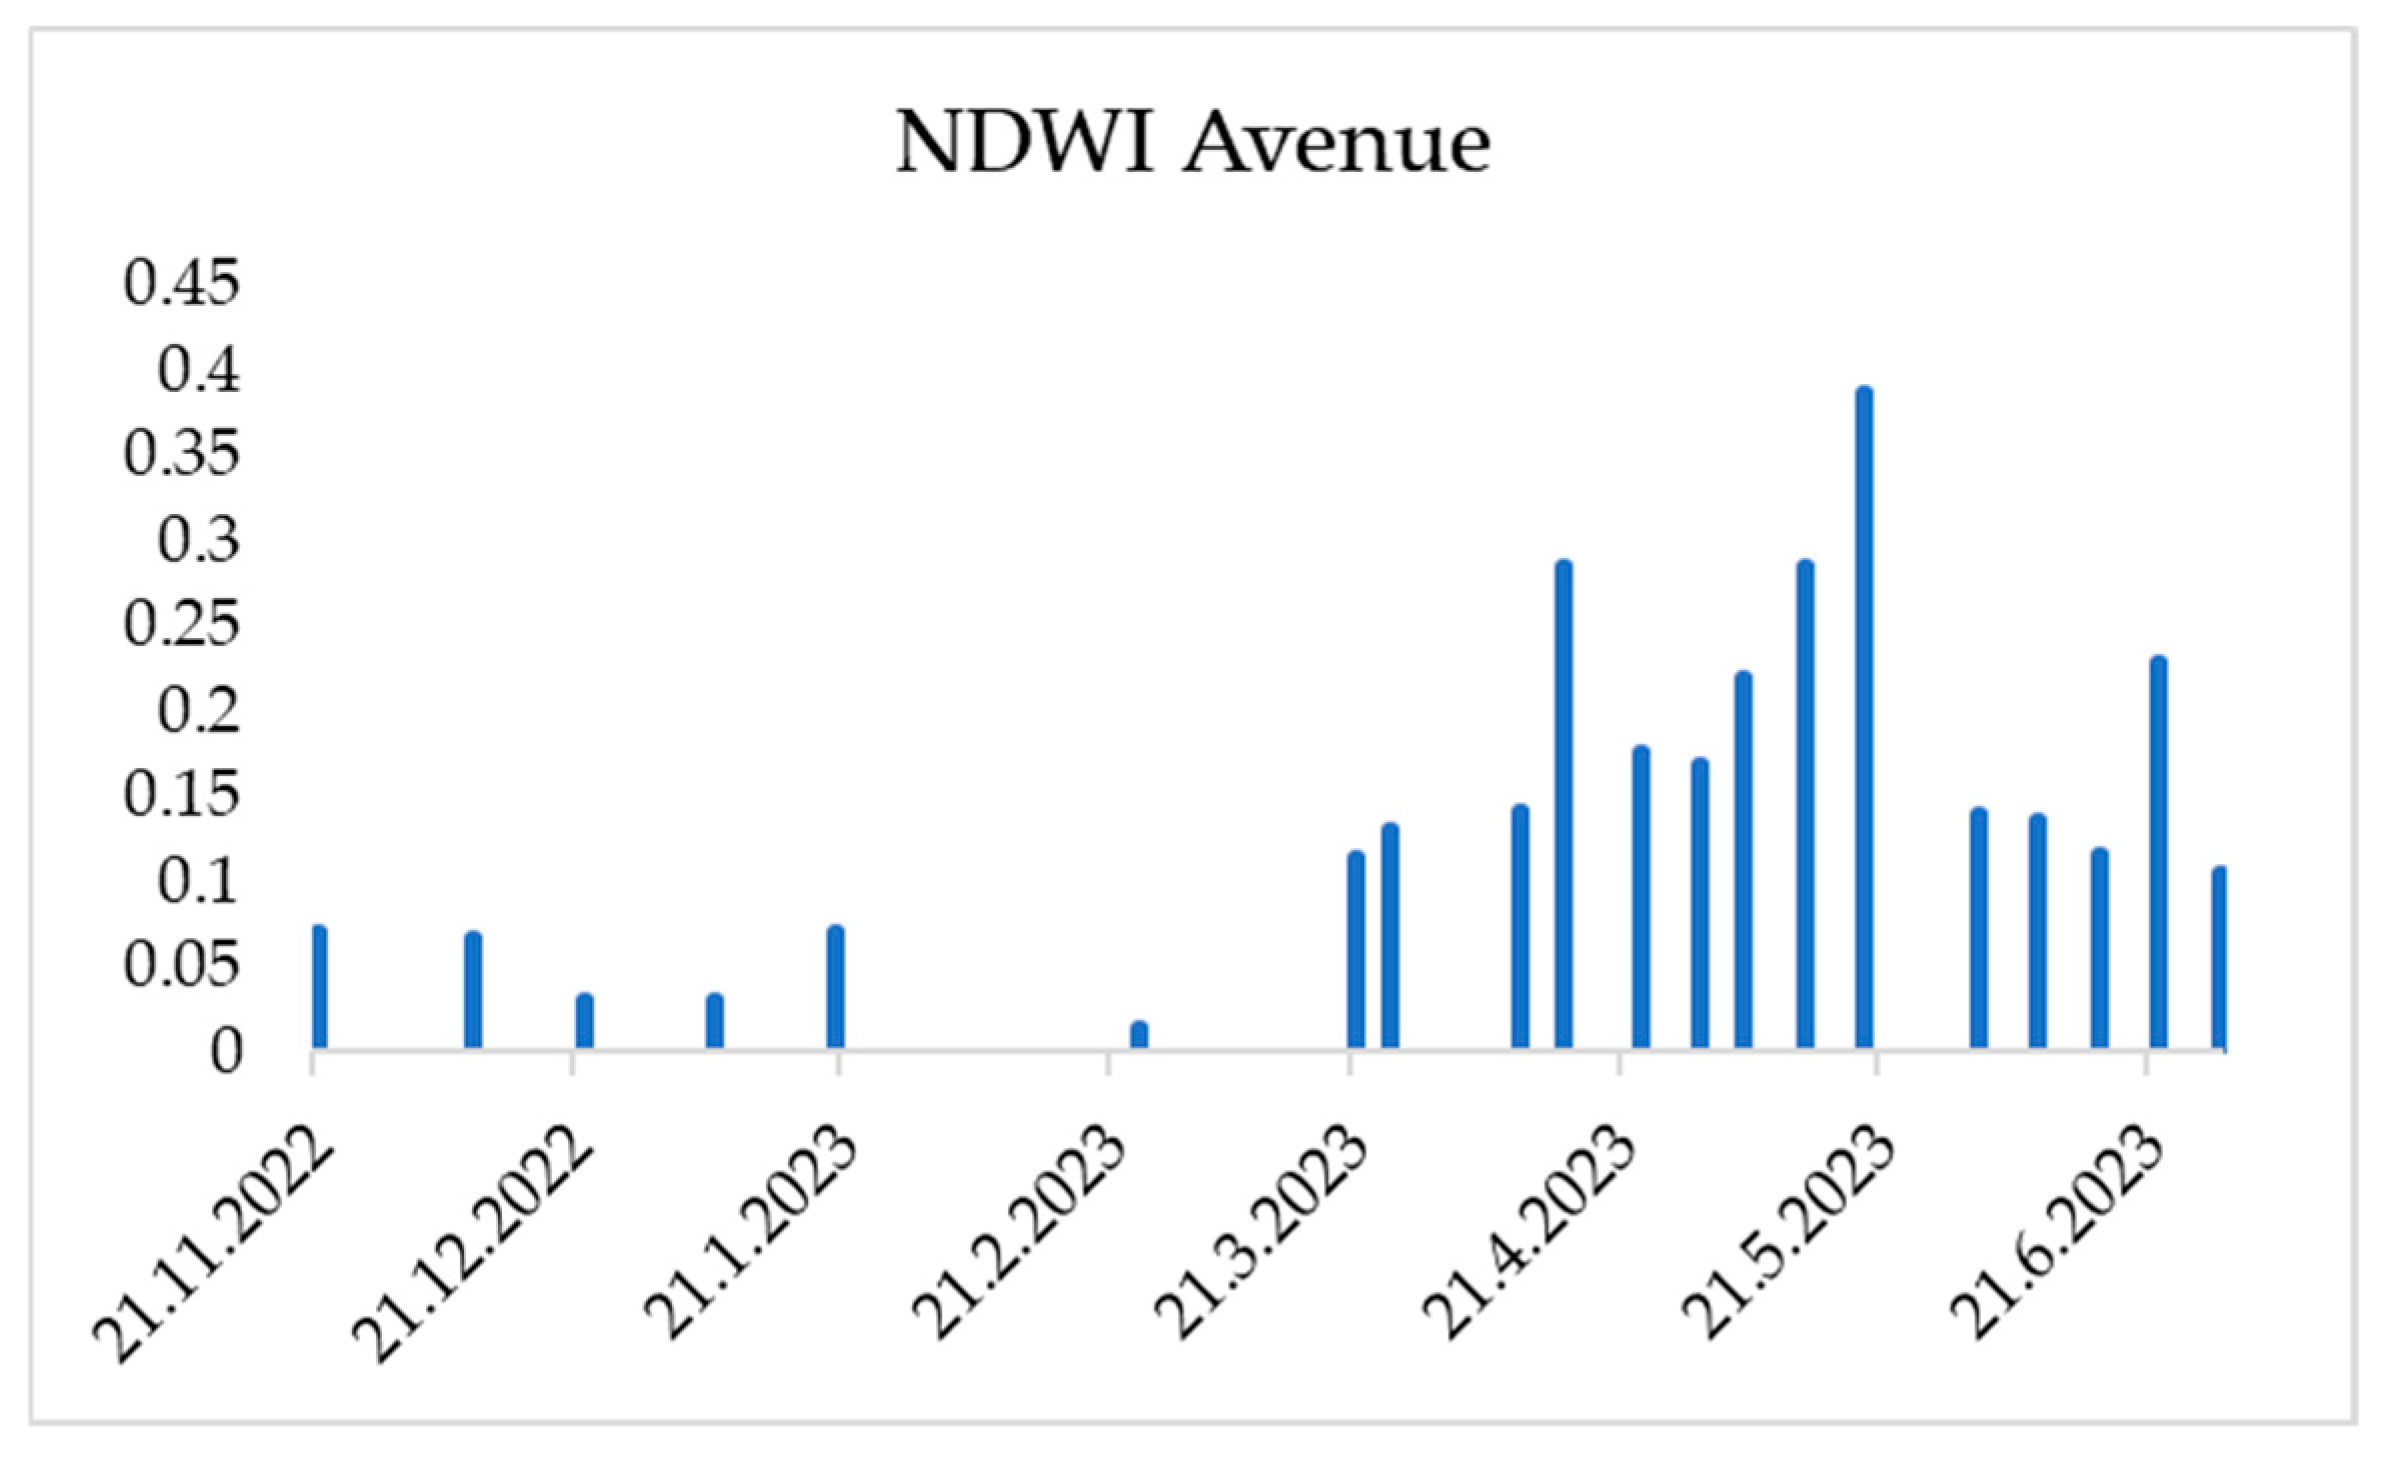
The change in the NDWI index in the Avenue variety field during the 2022–2023 season follows similar trends to those observed in the other studied varieties (Figure 13). This consistency is attributed to the experiment being conducted on a single field with uniform characteristics across its area. Figure 14 illustrates the changes in the NDVI and NDVI″ indices for the Avenue variety throughout the 2022–2023 season. The NDVI″ trend reaches its peak following the tillering stage, followed by a decline as the crop enters dormancy. After late February, with the resumption of active growth, the NDVI″ values stabilize near zero, exhibiting only slight fluctuations. These observations are supported by field assessments and UAV photographs shown in Figure 14b.
Figure 14 presents the change in the NDVI and NDVI″ index for the Avenue variety in the 2022–2023 season. Wheat is dormant until mid-January, which determines the low NDVI values. From the beginning of February, after coming out of dormancy, we have a smooth increase in NDVI due to tillering until reaching 0.5 on March 21, followed by a decrease due to spring frosts. When tillering in early April, we also have an increase, which is followed by a decrease in late April. On May 20, when grading, the highest index value was obtained. In early June, temperatures exceed 30 °C (Figure 7), as a result of which we have a decrease in the index. The resulting trend in NDVI″ changes reaches a maximum after the tillering period in early December. After this period, there is a decrease when entering dormancy. After the end of February, with the onset of active vegetation, the value remains stable around zero with slight fluctuations. This has been confirmed by field research and photographs taken by UAV Figure 14b.
The change in the NDWI index in the Avenue variety field for the 2022–2023 season, shown in Figure 15, follows the same features with high values in the spring, which corresponds to the amount of precipitation and high humidity.
The general trend shows a sharp increase in the value of NDVI″ after the complete coverage of the field by wheat. The changes in the NDVI index are caused by the registered stress. The second derivative can be used to estimate the quantitative coverage of the soil by wheat, but to estimate the biomass, it is necessary to know the height of the crop at the time of shooting.
A generated map of the NDVI index is shown in Figure 16a, and of the NDVI″ in Figure 16b. The selected field for visualization is sown with wheat and is presented in Figure 5. In this case, we have an alternation of areas with higher and lower NDVI due to different seeding densities. This is even more pronounced in NDVI″, which visualizes areas with low biomass density. In the lower part of Figure 16b, more green can be observed in contrast to the NDVI map; this is due to the corn crop that has accumulated a large amount of biomass. In the right part of both figures, there is a field buffer zone: in Figure 16a, almost solid green is visible, while in NDVI″ can be distinguished the crown of individual trees and the space between them, which have a lower index value.
In Figure 17a, a map of the NDWI index for 31 May 2022 is shown, and in Figure 17b, an RGN orthomosaic composed of 334 individual images is shown. A comparison with the NDVI index map reveals that areas with high crop density—indicative of substantial biomass—exhibit low moisture values. This phenomenon is attributed to the inability to observe the soil beneath dense vegetation cover, resulting in the recorded moisture values reflecting the water content within the wheat plants themselves.

3.2. Analysis of the Data Obtained

To analyze the data obtained from the respective field, both the stage of wheat development and the amount of accumulated biomass at the time of measurement were examined. Based on these parameters, a scoring system was established to represent the biomass level at each observation point, where the highest biomass was assigned a score of 10 and the lowest a score of 1. The maximum score was recorded in May, corresponding to the peak of the vegetative stage. As the crop entered the maturity phase, leaf senescence occurred, leading to a gradual decline in biomass score toward a value of 1.
The analysis was conducted using Microsoft 365 Excel, Version 2503 (Build 18,623.20208) [51]. Linear regression was performed via the Data Analysis tool pack using the Regression function. The analysis examined the relationship between NDVI values and the biomass score derived from field observations. A total of n = 28 observations (from multiple dates and each wheat varieties studied across two growing seasons) were used in the regression. The resulting regression statistics are summarized in Table 2.
It can be observed that the values for multiple R and R-squared are both equal to 1, indicating a perfect linear correlation (100% dependency) between the variables. The obtained standard error is 1.2 × 10⁻¹⁵, representing the average deviation of the observed values from the fitted regression line. Such a strong correlation underscores the potential of using the NDVI″ derived from remote sensing data as an efficient and non-destructive proxy for estimating crop biomass. This capability enables enhanced monitoring of crop growth dynamics and supports timely decision-making in precision agriculture, including optimized fertilization, irrigation, and yield forecasting.
Table 3 presents the ANOVA results for the linear regression model. For the results to be considered statistically significant, the value of the significance F criterion must be less than 0.05, indicating that the model is adequate and effectively describes the relationship between the dependent and independent variables. In this case, the obtained value is F = 1.84 × 10⁻²⁹, which confirms the validity and statistical significance of the model. The residuals show a deviation from the predicted regression line of 2.6 × 10⁻¹⁵, indicating a minimal error in the model’s predictions.
These results are received for p-value = 7.71709976187206 × 10−203, which is much less than 0.05 and is considered statistically significant and indicates that there is strong evidence against the null hypothesis. The derived NDVI″ index does not directly capture the temporal dynamics of vegetation growth but is instead correlated with the accumulated biomass. The analysis reveals that following wheat germination, NDVI″ increases sharply. However, in subsequent stages, its values fluctuate around zero and do not align with the progression pattern typically observed in standard NDVI trends.
A key requirement for accurate biomass estimation using this approach is prior knowledge of the crop type and average plant height. These parameters are essential for calibrating the mathematical model and ensuring the reliability of the derived biomass estimates. Nonetheless, the proposed methodology allows for rapid, non-destructive assessment of crop condition using UAV-mounted multispectral imaging systems. The resulting NDVI″ maps offer a high-resolution spatial representation of field variability, enabling precise identification of zones with differing biomass levels.
The proposed approach has significant practical value for precision agriculture by supporting informed decision-making related to irrigation, fertilization, and yield forecasting. It also provides a cost-effective and scalable alternative to labor-intensive field surveys. However, some limitations of the study should be noted. The approach relies on high-quality multispectral data and accurate temporal sampling to capture key phenological stages. Variability in sensor calibration, atmospheric conditions, and canopy structure may affect the precision of NDVI″ calculations. Furthermore, the model was tested on winter wheat varieties under specific climatic and soil conditions; thus, its applicability to other crops or regions requires further validation.
However, the proposed NDVI″ calculation method is not crop-specific and relies solely on Red and NIR reflectance data. Therefore, it can be adapted for other crop types and UAV platforms, provided that calibrated multispectral imagery is available. The formula is software-independent and may be implemented in any environment that supports raster operations or index calculation, including open-source tools such as Python, QGIS, or commercial platforms like ENVI and Pix4DFields.
A linear regression analysis (presented in Table 4) was performed to examine the relationship between the NDWI index and the amount of precipitation (Figure 6a,b). The field was sown with common winter wheat, variety Falado, during the 2021–2022 season. The regression statistics show that the multiple R is 0.5, indicating a 50% correlation, while the R-squared value is 0.25, corresponding to a 25% degree of explained variance.
This result is expected, as precipitation increases soil moisture in the deeper layers. However, the NDWI index reflects moisture content only in the upper soil layer. The moisture of this surface layer cannot be directly determined by precipitation alone; it is also influenced by air temperature, cloud cover, wind speed, and wind strength. These factors have a direct impact on the surface soil moisture content.
Table 5 shows the analysis of variance (ANOVA) between the NDWI and rainfall.
These results are received for p-value = 0.00172, which is much less than 0.05 and is considered statistically significant and indicates that there is strong evidence against the null hypothesis.
An analysis of the relationship between NDWI and precipitation was conducted for the period before the wheat canopy covered more than 50% of the field surface (as seen from above). The results show a perfect linear correlation, with multiple R = 1, R-squared = 1, and standard error = 0.
These results indicate that the NDWI can provide reliable data before the field is more than 50% covered by vegetation. Monitoring the index during this early stage may offer valuable information during the sowing period, when wheat seeds are typically placed at a depth of 3 to 5 cm.

3.3. Comparative Analysis of Vegetation Indices

In the context of this study, the NDVI, its second derivative (NDVI″), and NDWI were used as key indicators for assessing vegetation status, biomass accumulation, and surface moisture dynamics. While their mathematical definitions are provided earlier in the manuscript, this section summarizes their practical use cases, advantages, and limitations.
The NDVI is a well-established vegetation index that reflects the overall greenness and vigor of crops. It is most effective during the mid to late vegetative stages when canopy closure is sufficient. The NDVI is widely used due to its simplicity and strong correlation with leaf area and biomass. However, in dense vegetation, it tends to saturate, making it less sensitive to further increases in biomass.
The NDVI″, the second derivative of the NDVI with respect to NIR reflectance, provides an additional insight into the dynamics of crop development. It is particularly sensitive to structural and physiological changes, making it useful in detecting early growth trends or stress responses before visible symptoms appear. Compared to the NDVI, NDVI″ is less prone to saturation and better reflects variations in canopy structure. However, its computation requires high-quality spectral data and may amplify noise if not carefully processed.
The NDWI serves as an indicator of water content in vegetation and soil. It complements NDVI-based analysis by identifying areas experiencing moisture stress or excessive wetness. While not directly linked to biomass, the NDWI helps interpret drops or fluctuations in NDVI/NDVI″ values in relation to environmental conditions such as drought, rainfall, or irrigation. Its effectiveness is highest when the vegetation cover is not too dense, as dense canopies may obscure soil moisture signals.
These three indices function best when used in combination. NDVI establishes the general vegetation condition, NDVI″ enhances sensitivity to developmental changes, and NDWI provides environmental context, especially regarding water availability. Together, they enable a more comprehensive understanding of crop status and improve the reliability of remote biomass estimation.
In this study, the application of the second derivative of the NDVI (NDVI″) is introduced as a novel approach. To the best of the authors’ knowledge, no prior research has investigated this specific variant of the index. The ongoing analysis aims to further evaluate its potential capabilities and limitations. These limitations may include factors such as the spatial resolution of the input data or vertical heterogeneity in canopy density within the studied crop.

4. Conclusions

This study demonstrated that the second derivative of the NDVI with respect to NIR (NDVI″) is a reliable indicator for estimating aboveground biomass in winter wheat using UAV-acquired multispectral data. Field trials conducted over two seasons and across five wheat varieties showed a strong correlation between NDVI″ values and biomass scores derived from physical measurements and visual assessments.
Regression analysis revealed an almost perfect linear relationship (R ≈ 0.99999999), indicating the model’s strong predictive power under the tested conditions. While direct biomass sampling was not performed, the field-derived parameters provide a practical basis for relative biomass estimation.
The proposed method is non-destructive, scalable, and suitable for application in precision agriculture.
Future work will focus on including destructive biomass sampling to calibrate and validate the NDVI″ model with absolute biomass values. Testing the method across different crop types and environmental conditions helps assess its generalizability. Additional vegetation indices and machine learning techniques are integrated to improve accuracy and automation. These advancements would contribute to the development of robust, adaptive tools for monitoring biomass dynamics across a wider range of crops and agroecological conditions.

Author Contributions

Conceptualization, A.I.A. and A.Z.A.; methodology, A.I.A.; software, A.I.A.; validation, A.I.A., A.Z.A. and B.I.E.; formal analysis, A.I.A. and A.Z.A.; investigation, A.I.A.; resources, A.I.A.; data curation, A.I.A.; writing—original draft preparation, A.I.A. and A.Z.A.; writing—review and editing, A.Z.A. and B.I.E.; visualization, A.I.A.; supervision, A.Z.A.; project administration, A.Z.A.; funding acquisition, A.Z.A. All authors have read and agreed to the published version of the manuscript.

Funding

This study is financed by the European Union—NextGenerationEU, through the National Recovery and Resilience Plan of the Republic of Bulgaria, project No. BG-RRP-2.013-0001.

Institutional Review Board Statement

Not applicable.

Data Availability Statement

The data presented in this study are available upon request from the corresponding authors.

Acknowledgments

The authors are very grateful to the anonymous reviewers whose valuable comments and suggestions improved the quality of the paper.

Conflicts of Interest

The authors declare no conflicts of interest.

Abbreviations

The following abbreviations are used in this manuscript:
NDVINormalized difference vegetation index
NDVI″Second derivative of NDVI in terms of NIR
NDWINormalized difference water index
NIRNear-infrared
RGNRed + Green + Near Infrared
RGBRed + Green + Blue
HFOV Horizontal field of view

References

  1. Yang, L.; He, X.; Shen, F.; Zhou, C.; Zhu, A.X.; Gao, B.; Chen, Z.; Li, M. Improving prediction of soil organic carbon content in croplands using phenological parameters extracted from NDVI time series data. Soil Tillage Res. 2020, 196, 104465. [Google Scholar] [CrossRef]
  2. Wang, H.; Magagi, R.; Goïta, K.; Trudel, M.; McNairn, H.; Powers, J. Crop phenology retrieval via polarimetric SAR decomposition and Random Forest algorithm. Remote Sens. Environ. 2019, 231, 111234. [Google Scholar] [CrossRef]
  3. Anwar, M.R.; Liu, D.L.; Farquharson, R.; Macadam, I.; Abadi, A.; Finlayson, J.; Wang, B.; Ramilan, T. Climate change impacts on phenology and yields of five broadacre crops at four climatologically distinct locations in Australia. Agric. Syst. 2015, 132, 133–144. [Google Scholar] [CrossRef]
  4. FAO Handbook on Crop Statistics: Improving Methods for Measuring Crop Area, Production and Yield; Pasetto, L., Ed.; FAO Statistics Division (ESS): Rome, Italy, 2018. [Google Scholar]
  5. Biazin, B.; Wondatir, S.; Tilahun, G.; Asaro, N.; Amede, T. Using AquaCrop as a Decision-Support Tool for Small-Scale Irrigation Systems Was Dictated by the Institutional and Market Incentives in Ethiopia. Front. Water 2021, 3, 96. [Google Scholar] [CrossRef]
  6. Lorite, I.J.; García-Vila, M.; Santos, C.; Ruiz-Ramos, M.; Fereres, E. AquaData and AquaGIS: Two Computer Utilities for Temporal and Spatial Simulations of Water-Limited Yield with AquaCrop. Comput. Electron. Agric. 2013, 96, 227–237. [Google Scholar] [CrossRef]
  7. Han, C.; Zhang, B.; Chen, H.; Wei, Z.; Liu, Y. Spatially Distributed Crop Model Based on Remote Sensing. Agric. Water Manag. 2019, 218, 165–173. [Google Scholar] [CrossRef]
  8. Liu, L.; Zhang, X.; Yu, Y.; Gao, F.; Yang, Z. Real-Time Monitoring of Crop Phenology in the Midwestern United States Using VIIRS Observations. Remote Sens. 2018, 10, 1540. [Google Scholar] [CrossRef]
  9. Tian, H.; Ren, W.; Tao, B.; Sun, G.; Chappelka, A.; Wang, X.; Pan, S.; Yang, J.; Liu, J.S.; Felzer, B.M.; et al. Climate extremes and ozone pollution: A growing threat to China’s food security. Ecosyst. Health Sustain. 2016, 2, e01203. [Google Scholar] [CrossRef]
  10. Cho, S.J.; McCarl, B.A. Climate change influences on crop mix shifts in the United States. Sci. Rep. 2017, 7, 40845. [Google Scholar] [CrossRef]
  11. Ortiz-Monasterio, J.I.; Lobell, D.B. Remote sensing assessment of regional yield losses due to sub-optimal planting dates and fallow period weed management. Field Crops Res. 2007, 101, 80–87. [Google Scholar] [CrossRef]
  12. De Castro, A.; Six, J.; Plant, R.; Peña, J. Mapping Crop Calendar Events and Phenology-Related Metrics at the Parcel Level by Object-Based Image Analysis (OBIA) of MODIS-NDVI Time-Series: A Case Study in Central California. Remote Sens. 2018, 10, 1745. [Google Scholar] [CrossRef]
  13. Kotsuki, S.; Tanaka, K. SACRA-A method for the estimation of global high-resolution crop calendars from a satellite-sensed NDVI. Hydrol. Earth Syst. Sci. 2015, 19, 4441–4461. [Google Scholar] [CrossRef]
  14. Pan, Y.; Nie, Y.; Watene, C.; Zhu, J.; Liu, F. Phenological Observations on Classical Prehistoric Sites in the Middle and Lower Reaches of the Yellow River Based on Landsat NDVI Time Series. Remote Sens. 2017, 9, 374. [Google Scholar] [CrossRef]
  15. Boschetti, M.; Stroppiana, D.; Brivio, P.A.; Bocchi, S. Multi-year monitoring of rice crop phenology through time series analysis of MODIS images. Int. J. Remote Sens. 2009, 30, 4643–4662. [Google Scholar] [CrossRef]
  16. Huang, X.; Liu, J.; Zhu, W.; Atzberger, C.; Liu, Q. The Optimal Threshold and Vegetation Index Time Series for Retrieving Crop Phenology Based on a Modified Dynamic Threshold Method. Remote Sens. 2019, 11, 2725. [Google Scholar] [CrossRef]
  17. Sakamoto, T.; Wardlow, B.D.; Gitelson, A.A.; Verma, S.B.; Suyker, A.E.; Arkebauer, T.J. A two-step filtering approach for detecting maize and soybean phenology with time-series MODIS data. Remote Sens. Environ. 2010, 114, 2146–2159. [Google Scholar] [CrossRef]
  18. Shammi, S.A.; Meng, Q. Use Time Series NDVI and EVI to Develop Dynamic Crop Growth Metrics for Yield Modeling. Ecol. Indic. 2021, 121, 107124. [Google Scholar] [CrossRef]
  19. Johnson, D.M.; Rosales, A.; Mueller, R.; Reynolds, C.; Frantz, R.; Anyamba, A.; Pak, E.; Tucker, C. USA Crop Yield Estim. MODIS NDVI: Are Remote. Sensed Models Better Than Simple Trend Anal. Remote Sens. 2021, 13, 4227. [Google Scholar] [CrossRef]
  20. Lischeid, G.; Webber, H.; Sommer, M.; Nendel, C.; Ewert, F. Machine Learning in Crop Yield Modelling: A Powerful Tool, but No Surrogate for Science. Agric. For. Meteorol. 2022, 312, 108698. [Google Scholar] [CrossRef]
  21. van Klompenburg, T.; Kassahun, A.; Catal, C. Crop Yield Prediction Using Machine Learning: A Systematic Literature Review. Comput. Electron. Agric. 2020, 177, 105709. [Google Scholar] [CrossRef]
  22. Hu, H.; Zhou, H.; Cao, K.; Lou, W.; Zhang, G.; Gu, Q.; Wang, J. Biomass Estimation of Milk Vetch Using UAV Hyperspectral Imagery and Machine Learning. Remote Sens. 2024, 16, 2183. [Google Scholar] [CrossRef]
  23. Vahidi, M.; Shafian, S.; Thomas, S.; Maguire, R. Pasture Biomass Estimation Using Ultra-High-Resolution RGB UAVs Images and Deep Learning. Remote Sens. 2023, 15, 5714. [Google Scholar] [CrossRef]
  24. Yang, Z.-Y.; Xia, W.-K.; Chu, H.-Q.; Su, W.-H.; Wang, R.-F.; Wang, H. A Comprehensive Review of Deep Learning Applications in Cotton Industry: From Field Monitoring to Smart Processing. Plants 2025, 14, 1481. [Google Scholar] [CrossRef] [PubMed]
  25. Rouse, J.W.; Haas, R.H.; Shell, J.A.; Deering, D.W.; Harlan, J.C. Monitoring the Vernal Advancement and Retrogradation (Green Wave Effect) of Natural Vegetation; Texas A & M University, Remote Sensing Center: College Station, TX, USA, 1974. [Google Scholar]
  26. Atanasov, A.I.; Atanasov, A.Z.; Evstatiev, B.I. Application of NDVI for Early Detection of Yellow Rust (Puccinia striiformis). AgriEngineering 2025, 7, 160. [Google Scholar] [CrossRef]
  27. Kyratzis, A.; Skarlatos, D.; Fotopoulos, V.; Vamvakousis, V.; Katsiotis, A. Investigating Correlation among NDVI Index Derived by Unmanned Aerial Vehicle Photography and Grain Yield under Late Drought Stress Conditions. Procedia Environ. Sci. 2015, 29, 225–226. [Google Scholar] [CrossRef][Green Version]
  28. Duan, B.; Fang, S.; Zhu, R.; Wu, X.; Wang, S.; Gong, Y.; Peng, Y. Remote Estimation of Rice Yield with Unmanned Aerial Vehicle (Uav) Data and Spectral Mixture Analysis. Front. Plant Sci. 2019, 10, 204. [Google Scholar] [CrossRef]
  29. Atanasov, A.I.; Mihova, G.M.; Atanasov, A.Z.; Vlăduț, V. Long-Term Assessment of NDVI Dynamics in Winter Wheat (Triticum aestivum) Using a Small Unmanned Aerial Vehicle. Agriculture 2025, 15, 394. [Google Scholar] [CrossRef]
  30. Hassan, M.A.; Yang, M.; Rasheed, A.; Yang, G.; Reynolds, M.; Xia, X.; Xiao, Y.; He, Z. A Rapid Monitoring of NDVI across the Wheat Growth Cycle for Grain Yield Prediction Using a Multi-Spectral UAV Platform. Plant Sci. 2019, 282, 95–103. [Google Scholar] [CrossRef]
  31. White, M.A.; Nemani, R.R. Real-Time Monitoring and Short-Term Forecasting of Land Surface Phenology. Remote Sens. Environ. 2006, 104, 43–49. [Google Scholar] [CrossRef]
  32. Atkinson, P.M.; Jeganathan, C.; Dash, J.; Atzberger, C. Inter-Comparison of Four Models for Smoothing Satellite Sensor Time-Series Data to Estimate Vegetation Phenology. Remote Sens. Environ. 2012, 123, 400–417. [Google Scholar] [CrossRef]
  33. Marti, J.; Bort, J.; Slafer, G.A.; Araus, J.L. Can Wheat Yield Be Assessed by Early Measurements of Normalized Difference Vegetation Index? Ann. Appl. Biol. 2007, 150, 253–257. [Google Scholar] [CrossRef]
  34. Seo, B.; Lee, J.; Lee, K.D.; Hong, S.; Kang, S. Improving Remotely-Sensed Crop Monitoring by NDVI-Based Crop Phenology Estimators for Corn and Soybeans in Iowa and Illinois, USA. Field Crops Res. 2019, 238, 113–128. [Google Scholar] [CrossRef]
  35. Misra, G.; Buras, A.; Menzel, A. Effects of Different Methods on the Comparison between Land Surface and Ground Phenology—A Methodological Case Study from South-Western Germany. Remote Sens. 2016, 8, 753. [Google Scholar] [CrossRef]
  36. Tan, B.; Morisette, J.T.; Wolfe, R.E.; Gao, F.; Ederer, G.A.; Nightingale, J.; Pedelty, J.A. An Enhanced TIMESAT Algorithm for Estimating Vegetation Phenology Metrics from MODIS Data. Remote Sens. 2011, 4, 361–371. [Google Scholar] [CrossRef]
  37. Yang, Y.; Tao, B.; Liang, L.; Huang, Y.; Matocha, C.; Lee, C.D.; Sama, M.; Masri, B.E.; Ren, W. Detecting Recent Crop Phenology Dynamics in Corn and Soybean Cropping Systems of Kentucky. Remote Sens. 2021, 13, 1615. [Google Scholar] [CrossRef]
  38. Sánchez, N.; Plaza, J.; Criado, M.; Pérez-Sánchez, R.; Gómez-Sánchez, M.Á.; Morales-Corts, M.R.; Palacios, C. The Second Derivative of the NDVI Time Series as an Estimator of Fresh Biomass: A Case Study of Eight Forage Associations Monitored via UAS. Drones 2023, 7, 347. [Google Scholar] [CrossRef]
  39. Liu, T.; Liu, X.; Liu, M.; Wu, L. Evaluating Heavy Metal Stress Levels in Rice Based on Remote Sensing Phenology. Sensors 2018, 18, 860. [Google Scholar] [CrossRef]
  40. Ghilardi, F.; De Petris, S.; Torti, V.; Giacoma, C.; Borgogno-Mondino, E. A possible role of NDVI time series from Landsat Mission to characterize lemurs habitats degradation in Madagascar. Sci. Total Environ. 2025, 974, 179243. [Google Scholar] [CrossRef]
  41. Lumbierres, M.; Méndez, P.F.; Bustamante, J.; Soriguer, R.; Santamaría, L. Modeling Biomass Production in Seasonal Wetlands Using MODIS NDVI Land Surface Phenology. Remote Sens. 2017, 9, 392. [Google Scholar] [CrossRef]
  42. Schucknecht, A.; Meroni, M.; Kayitakire, F.; Boureima, A. Phenology-Based Biomass Estimation to Support Rangeland Management in Semi-Arid Environments. Remote Sens. 2017, 9, 463. [Google Scholar] [CrossRef]
  43. Perry, E.; Sheffield, K.; Crawford, D.; Akpa, S.; Clancy, A.; Clark, R. Spatial and Temporal Biomass and Growth for Grain Crops Using NDVI Time Series. Remote Sens. 2022, 14, 3071. [Google Scholar] [CrossRef]
  44. DJI. 2025. Available online: https://www.dji.com/bg/mavic-2/info (accessed on 25 June 2025).
  45. Pix4Dcapture. 2025. Available online: https://www.pix4d.com/product/pix4dcapture/ (accessed on 25 June 2025).
  46. Mapir. 2025. Available online: https://www.mapir.camera/collections/survey3/products/survey3w-camera-red-green-nir-rgn-ndvi (accessed on 25 June 2025).
  47. Mapir. 2025. Available online: https://www.mapir.camera/en-gb/products/survey3-gps-receiver?srsltid=AfmBOoqfvv5La7_44iDyEXSN6rLrOeX0T_pT29XgFU01rYAn8PdA-Ikp (accessed on 25 June 2025).
  48. McFEETERS, S.K. The Use of the Normalized Difference Water Index (NDWI) in the Delineation of Open Water Features. Int. J. Remote Sens. 1996, 17, 1425–1432. [Google Scholar] [CrossRef]
  49. Pix4Dfields. 2025. Available online: https://www.pix4d.com/product/pix4dfields/ (accessed on 25 June 2025).
  50. Dimitrov, S.D. Example application of a simple linear regression and correlation in transportation studies using MS Excel. Mech. Transp. Commun. 2010, 2, BG-3.9–BG-3.16. (In Bulgarian) [Google Scholar]
  51. Microsoft, 2025. Available online: https://www.microsoft.com/en-us/microsoft-365 (accessed on 25 June 2025).
Figure 1. Geographical locations of the experimental fields.
Sustainability 17 07299 g001
Figure 2. The flight plan used for aerial image acquisition over the experimental field, with the positions and orientations of individual images overlaid on the field map included.
Sustainability 17 07299 g002
Figure 3. A working window of the Pix4Dfields software with the positions of the photos from the RGN camera.
Sustainability 17 07299 g003
Figure 4. Meteorological features for the 2021–2022 season for the field at 43.553083N, 27.832161E: Air temperature (a), Humidity (b) and Cloudiness (c).
Sustainability 17 07299 g004
Figure 5. Changes in the NDVI and second derivative NDVI″ indices for a wheat field during the 2021–2022 growing season (a); aerial photographs of the field taken from 100 m altitude (b).
Sustainability 17 07299 g005
Figure 6. Changes in the NDWI index during the 2021–2022 season (a) and precipitation levels for the same season (b).
Sustainability 17 07299 g006
Figure 7. Meteorological parameters for the field at coordinates N43.548491, E27.757799 during the 2022–2023 season: air temperature (a), illumination (b), wind speed (c), humidity (d), and precipitation amount (e).
Sustainability 17 07299 g007
Figure 8. Variations in NDVI and NDVI″ indices for a field with winter wheat variety Marilyn during the 2022–2023 season (a); aerial photographs of the field from 100 m altitude taken during different vegetation stages (b).
Sustainability 17 07299 g008
Figure 9. Variations in the NDWI index in the field sown with the Marilyn variety during the 2022–2023 season.
Sustainability 17 07299 g009
Figure 10. Variations in NDVI and NDVI″ indices for the field sown with wheat variety Enola during the 2022–2023 crop year (a); aerial photographs of the field taken from 100 m altitude at different vegetation stages (b).
Sustainability 17 07299 g010
Figure 11. Variations of the NDWI index in the field planted with winter wheat variety Enola during the 2022–2023 season.
Sustainability 17 07299 g011
Figure 12. Variations in NDVI and NDVI″ indices for the field planted with winter wheat variety Annapurna during the 2022–2023 crop year (a); UAV-acquired images of the field at 100 m altitude during vegetation stages (b).
Sustainability 17 07299 g012
Figure 13. Variations in the NDWI index in the field planted with winter wheat variety Avenue during the 2022–2023 season.
Sustainability 17 07299 g013
Figure 14. Variations in NDVI and NDVI″ indices for the field planted with winter wheat variety Avenue during the 2022–2023 crop year (a); UAV-acquired images of the field at 100 m altitude during vegetation stages (b).
Sustainability 17 07299 g014
Figure 15. Variations in the NDWI index in the Avenue variety field for the 2022–2023 season.
Sustainability 17 07299 g015
Figure 16. Maps of the NDVI index (a) and NDVI″ (b) for 31 May 2022.
Sustainability 17 07299 g016
Figure 17. NDWI index map (a) and RGN orthomosaic (b).
Sustainability 17 07299 g017
Table 1. Measured values from a field experiment with the winter wheat variety Falado during the 2021–2022 season.
Data21
Nov 2021
3
Dec 2021
10
Feb 2022
26
Mar 2022
5
Apr 2022
26
Apr 2022
3
May 2022
10
May 2022
17
May 2022
25
May 2022
31
May 2022
7
Jun 2022
21
Jun 2022
28
Jun 2022
5
Jul 2022
Average stem diameter [mm]11.31.722.62.72.92.92.92.92.92.92.92.92.9
Layer Density of 300 [mm]12.224.436.648.86185.412212212212212285.485.485.473.2
biomass scoring12345710101010107776
Table 2. Regression statistics between the NDVI″ and biomass score.
Multiple R1
R-Squared1
Adjusted R-Squared−1.0769231
Standard Error1.1899 × 10−15
Observations1
Table 3. Analysis of variance (ANOVA) results for the linear regression model examining the relationship between the NDVI″ and biomass score.
dfSSMSF
Regression14180.772812.912341.28 × 1032
Residual131.84 × 10−291.42 × 10⁻³⁰
Total27180.7728
Table 4. Regression statistics between the NDWI and the amount of rainfall.
Multiple R0.503136403
R-Squared0.25314624
Adjusted R-Squared−1.142857143
Standard Error0.170729714
Observations1
Table 5. Analysis of variance (ANOVA) results for the linear regression model examining the relationship between the NDWI and rainfall.
dfSSMSF
Regression80.0691595530.0086449442.372651487
Residual70.2040404470.029148635-
Total150.2732--
Disclaimer/Publisher’s Note: The statements, opinions and data contained in all publications are solely those of the individual author(s) and contributor(s) and not of MDPI and/or the editor(s). MDPI and/or the editor(s) disclaim responsibility for any injury to people or property resulting from any ideas, methods, instructions or products referred to in the content.