Abstract
Supercritical carbon dioxide (Sc-CO2) thermal shock fracturing emerges as an innovative rock fragmentation technology combining environmental sustainability with operational efficiency. This study establishes a thermo-hydro-mechanical coupled model to elucidate how in situ stress magnitude and anisotropy critically govern damage progression and fluid dynamics during Sc-CO2 thermal shock fracturing. Key novel findings reveal the following: (1) The fracturing mechanism integrates transient hydrodynamic shock with quasi-static pressure loading, generating characteristic bimodal pressure curves where secondary peak amplification specifically indicates inhibited interwell fracture coalescence under anisotropic stress configurations. (2) Fracture paths undergo spatiotemporal reorientation—initial propagation aligns with in situ stress orientation, while subsequent growth follows thermal shock-induced principal stress trajectories. (3) Stress heterogeneity modulates fracture network complexity through confinement effects: elevated normal stresses perpendicular to fracture planes reduce pressure gradients (compared to isotropic conditions) and delay crack initiation, yet sustain higher pressure plateaus by constraining fracture connectivity despite fluid leakage. Numerical simulations systematically demonstrate that stress anisotropy plays a dual role—enhancing peak pressures while limiting fracture network development. This demonstrates the dual roles of the technology in enhancing environmental sustainability through waterless operations and reducing carbon footprint.
1. Introduction
The progressive depletion of China’s conventional shallow hydrocarbon reservoirs has intensified the focus on the nation’s substantial unconventional oil and gas resources. These geologically complex formations exhibit ultralow permeability and tight matrix characteristics that fundamentally limit the effectiveness of traditional extraction and fracture stimulation technologies. Operational challenges are further compounded by formation tightness, reservoir water sensitivity, and arid environmental conditions prevalent in major sedimentary basins including Ordos, Junggar, Tarim, and Qaidam [1]. These constraints have stimulated intensive research into alternative anhydrous fracturing fluids, with supercritical carbon dioxide (Sc-CO2) demonstrating particular promise for thermal shock fracturing due to its unique combination of low viscosity, high diffusivity, and minimal interfacial tension [2], combining technical efficacy in tight formations with significant environmental advantages following earlier investigations into waterless fracturing systems [3].
In terms of environmental protection, Supercritical CO2 fracturing eliminates freshwater consumption, enables higher flowback rates, reduces groundwater contamination risks, and facilitates geological carbon sequestration.
In terms of fracturing, Supercritical CO2 (Sc-CO2) combines high density with low viscosity, making it particularly effective for fracture initiation in tight geological formations. Compared to conventional hydraulic fracturing, Sc-CO2 demonstrates reduced fracture initiation pressures [4], enhancing operational efficiency for coiled tubing applications while remaining sensitive to formation stress heterogeneity [5]. The fluid’s enhanced penetration capability facilitates interaction with microscale rock porosity and pre-existing fractures, generating hybrid tensile-shear failure modes through preferential microfracture activation [6]. Experimental comparisons under equivalent injection conditions confirm the superior fracture propagation characteristics for Sc-CO2, with consistent parametric dependencies on nozzle configuration and jetting geometry observed across multiple studies [7].
The fracture mechanics of Sc-CO2 stimulation have been rigorously investigated through computational modeling and experimental validation. Cheng et al. [8] developed a multiphase flow model using the Span–Wagner equation of state, demonstrating reduced energy dissipation during fracture propagation compared to conventional fluids. Microstructural analyses reveal that Sc-CO2 generates fractures with enhanced surface roughness and geometric complexity compared to hydraulic methods [9], creating interconnected flow networks through secondary fracture branching. This permeability enhancement correlates with measurable reductions in rock mechanical strength, exhibiting pressure- and temperature-dependent weakening behavior that intensifies under elevated stimulation conditions [10].
The environmental advantages of Sc-CO2 fracturing derive from its fundamental physicochemical properties and operational characteristics. The technology significantly reduces water contamination risks through enhanced flowback recovery compared to hydraulic fracturing, while simultaneously mitigating formation damage and induced seismicity [11,12,13]. This approach aligns with carbon management strategies through methane displacement and permanent geological CO2 storage, creating synergies between energy production and climate change mitigation.
The microstructural characterization of Sc-CO2-shale interactions has been advanced through multi-scale analytical techniques. Fei et al. [14] employed CT scanning coupled with SEM/EDX, XRD, and XRF analyses to identify nanoscale mineral dissolution and pore structure modifications that degrade mechanical integrity. Complementary numerical investigations by Liu and Zhang et al. [4,15] have addressed experimental limitations through the computational modeling of critical parameters. The development of discrete element methods [13], particle flow simulations [16], and hybrid finite volume-boundary element approaches [17] has enabled the comprehensive analysis of fracturing dynamics under varying reservoir temperatures, in situ stress differentials, and CO2 phase behavior [4].
Current research on Sc-CO2 fracturing mechanisms has identified two primary operational methodologies: gas-phase detonation and jet-based systems. In gas-phase detonation fracturing, the phase transition from liquid to supercritical state occurs during rock fragmentation through rapid energy release following controlled ignition. This process generates distinct damage zones—a central crushing zone formed by stress waves exceeding the dynamic compressive strength of coal matrices, and a peripheral fracture network created through combined gas-wedging effects and circumferential tensile failure [16]. The fracture density and propagation distance exhibit direct proportionality to detonation pressure intensity. Jet-based systems employ pre-supercritical fluid stored in pressurized chambers, where nozzle ejection creates dual mechanical actions: kinetic energy conversion into impact potential energy within the stagnation zone induces primary rock failure, while subsequent wall jet formation generates maximum impact pressures through fluid momentum transfer [18]. Industrial implementation requires precise downhole pressure-temperature management, with studies demonstrating nonlinear thermal gradients during coiled tubing injection—rapid near-surface temperature increases followed by asymptotic stabilization at depth, contrasted against linear pressure accumulation [19,20]. Permeability enhancement under varied injection parameters has been quantitatively established through comparative fluid analyses [21,22].
Despite these advancements, a critical knowledge gap persists regarding the specific influence of in situ stress magnitude and anisotropy on fracture propagation dynamics. This investigation employs numerical modeling to systematically analyze how principal stress magnitudes and differentials regulate pressure evolution and crack network development under these thermal activation conditions.
2. Numerical Modeling Framework
The computational model replicates high-pressure Sc-CO2 fracturing processes in massive tight sandstone formations under controlled in situ stress conditions. The simulation framework incorporates thermal activation mechanisms where pressurized CO2 undergoes phase transformation through external heating, subsequently fracturing the rock matrix upon achieving critical pressure thresholds.
2.1. Geometric Configuration and Boundary Conditions
The geometric configuration of the numerical model is presented in Figure 1, simulating CO2-impact rock fragmentation during rectangular tunnel excavation with free boundary surfaces. The 1500 mm × 1000 mm domain incorporates constrained boundary conditions along the left and bottom edges, with stress boundary conditions applied to the remaining surfaces. Two symmetric boreholes feature iron fracture tubes containing liquid CO2 (L-CO2), each housing centrally positioned electromagnetic induction heating elements that replicate experimental activation protocols through calibrated thermal power inputs.
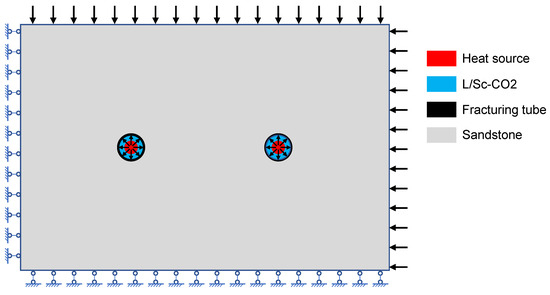
Figure 1.
Model of Sc-CO2 fracturing tight sandstone.
The model represents deep low-permeability sandstone characterized by high strength and minimal porosity/permeability, with material properties detailed in Table 1. CO2 parameters, sourced from the NIST database, include temperature- and pressure-dependent density (ρ), thermal conductivity (k), isobaric heat capacity (CP), isochoric heat capacity (CV), and dynamic viscosity (μ), exhibiting temperature/pressure-dependent variations as illustrated in Figure 2. Five sets of simulations were specifically compiled to distinguish stress magnitude (A–C) and anisotropy effects (D–E):

Table 1.
Simulated group parameters [23].
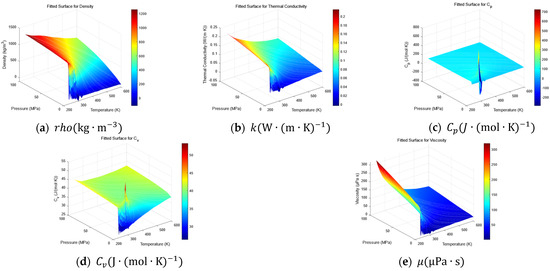
Figure 2.
Physical parameter diagram of Sc-CO2.
2.2. Governing Equations
The computational framework addresses coupled thermo-hydro-mechanical processes including: rock deformation under fluid pressure and confining stress; damage evolution within rock matrices; CO2 phase transitions during thermal pressurization; multiphase heat transfer (convection/conduction); fracture-dominated CO2 flow dynamics; stress–strain relationships that derive from dynamic elasticity theory [24] (Equations (1)–(3)):
where the expressions of and were (Equation (4)):
where = total stress(MPa); = total strain; = volume strain; denotes volume force(N); = rock density(kg/m3); = rock displacement(m); & denotes the displacement component(m); = Kronecker symbol; = shear modulus(MPa); = Lame coefficient; (MPa) = the elastic modulus(MPa); and = Poisson’s ratio.
Damage mechanics constitutes a discipline that quantitatively analyzes time-dependent material fracture through the evolution of microscopic defects. This approach employs effective stress theory to characterize defect progression, wherein the actual load-bearing cross-sectional area diminishes during damage evolution. Consequently, the effective stress (representing true stress distribution) systematically exceeds the nominal stress derived from geometric cross-section calculations [25]. The progressive reduction in load-bearing capacity is quantified through the damage variable .
where = the effective stress areas (MPa), d = the damage variable, and = the initial area.
The damage variable dd fundamentally quantifies the progressive degradation of rock integrity through micro-crack density evolution, whereas macroscopic fractures represent physical voids formed by interconnected crack networks. This study establishes their intrinsic relationship: Damage as Precursor: The continuum damage field (0 ≤ d < 1) captures distributed micro-fracturing that weakens rock cohesion but does not necessarily create connected flow paths. Macrofractures as Critical Manifestation: When damage accumulation reaches critical thresholds (d ≥ 0.9), localized failure transitions to macroscopic voids with measurable volumes.
The present model exclusively accounts for elastic-based damage mechanisms, incorporating Equation (6) to establish the functional relationship between damage variables and elastic modulus degradation. This formulation enables rigorous coupling between damage parameters and fundamental physical governing equations.
where is really elastic modulus (MPa), and corresponds to the initial elastic modulus (MPa).
While no universal macroscopic damage definition exists, the phenomenon manifests through measurable indicators: macroscopically as reductions in deformation capacity, strength parameters, and elastic moduli; microscopically as the nucleation and propagation of microvoids and fissures. The damage evolution law is therefore formally expressed through strain threshold-dependent equations incorporating strain-softening parameters, as mathematically defined in Equation (7) [2].
where corresponds to the fracture energy per unit area of the material (N/m), represents the tensile strength of the material (MPa), and signifies the characteristic size of the induced fracture (m).
The damage variable is mathematically expressed as Equation (8).
where is the equivalent strain, and is the strain threshold.
The Navier–Stokes equations govern unconfined fluid flow prior to pore entry (Equation (9)).
where = fluid density (kg/m3); = gravitational acceleration (m/s2); = fluid velocity(m/s); = fluid pressure (MPa); = hydrodynamic viscosity (Pa·s); and = identity matrix.
Brinkman equations describe fluid transport through interconnected pores and fractures under high-pressure gradients (Equation (10)).
where = rock porosity; = rock permeability; = isothermal compression coefficient; and = heat source item (W/m3).
Progressive damage evolution induces microstructural alterations manifested through the following: (1) the continuous enlargement and interconnection of microvoids/fractures; (2) corresponding increases in porosity and permeability.
The porosity-permeability relationship follows Chilingar’s [26] empirical formulation (Equation (11)).
where corresponds to the effective diameter of rock matrix particles.
The constitutive relationship derived from Equation (11) yields
In the parameters of this model, the rock porosity was only 2%, so in Formula (12), was about 1, from which we could obtain the following:
Given the model’s baseline porosity of =2%, the term ≈1 in Equation (12), leading to the simplified form (Equation (12)).
To account for nonlinear fracture propagation observed in rock failure experiments, porosity is defined as an exponential function of damage (Equation (14)).
where ξ is a dimensionless porosity notch coupling coefficient and represents the influence coefficient of damage on porosity.
The corresponding permeability relationship becomes (Equation (15))
CO2 compressibility necessitates energy conservation coupling between thermal and flow fields (Equation (16)):
where = thermal conductivity of the fluid (W/(m·K)); = heat source power(W/m3); and = temperature(K).
Neglecting thermal expansion effects due to transient fracturing durations (<<1 s), the rock heat conduction equation is (Equation (17))
where = constant pressure heat capacity of rock (J/(mol·K)); = Seepage velocity(m/s); = thermal conductivity of rock (W/(m·K)); and = thermoelastic damping (W/m3), here is zero.
2.3. Simulation Protocol
This investigation systematically evaluates in situ stress effects on damage evolution during the Sc-CO2 fracturing of low-permeability sandstone through parametric studies of stress magnitude and anisotropy. Stress anisotropy is quantified via the dimensionless lateral pressure coefficient (Equation (18)).
3. Results
3.1. Damage Evolution Process
The model quantifies fracture propagation under Sc-CO2 impact through damage variables, with macroscopic fracture zones defined at damage thresholds exceeding 0.9. Figure 3 illustrates the evolution under 6 MPa isotropic in situ stress: initial radial fractures nucleate uniformly around the borehole under increasing pressure, subsequently propagating outward. Dominant fractures develop along the inter-borehole axis, ultimately forming through-going fractures. Secondary fractures emerge at φ = 20°–30° (as shown in Figure 3) orientations during late-stage propagation, while boundary-initiated fractures at the specimen periphery exhibit arrested growth without achieving full connectivity.
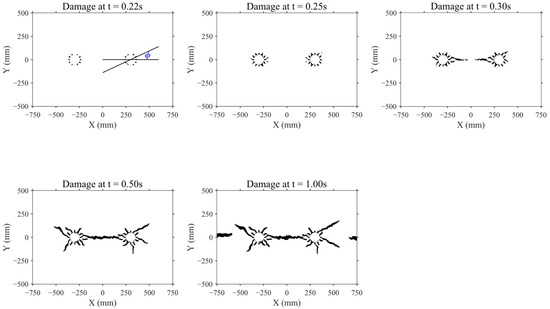
Figure 3.
Damage evolution sequence (Group A).
The thermal-fluid coupling mechanism induces continuous pressure escalation as heat release persists. Figure 4 demonstrates that damage initiation (defined as the first occurrence of d > 0.9 at t = 0.145 s) coincides with the equivalent strain exceeding the critical threshold. Post-initiation, damage progression exhibits strong pressure correlation, rapidly approaching unity (d ≈ 1) as pressure peaks at 56.1 MPa. The pressure curve exhibits a distinct bimodal characteristic, and is thus divided into the rising phase, the inter-peak phase, and the falling phase. It initially undergoes a parabolic rise to the first peak, followed by a relatively flat stage that represents the primary phase of crack propagation, before gradually decaying. It takes a 20 ms latency between peak pressure and damage onset to match a threshold stress to generate microcracking, typical for brittle failure models.
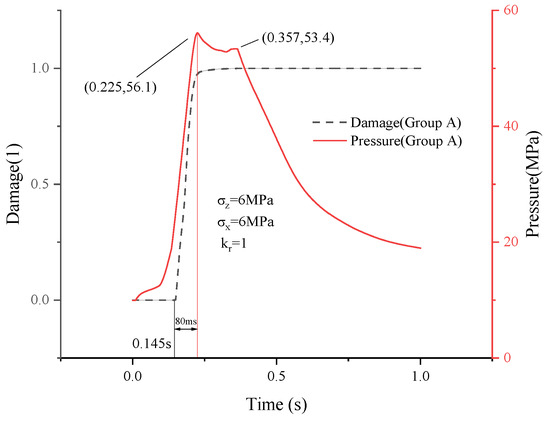
Figure 4.
Damage-pressure temporal correlation (Group A).
The damage rate is quantified as the areal proportion of critically damaged zones (area% with d > 0.9) relative to the total domain, with quantitative results provided in Table 2. It refers to “macro” cracks that cause significant permeability changes, with a volume slightly smaller than the actual fracture volume.
Table 2.
Damage rate quantification results.
3.2. In Situ Stress Magnitude Effects
This investigation examines the dual influence of confining stress magnitude and anisotropy on Sc-CO2-induced damage evolution. Through controlled variation in boundary load magnitudes (= 6–10 MPa) while maintaining stress isotropy (= 1), three simulation cases were analyzed (Table 3).
Table 3.
Basic mechanical parameters of rock.
Figure 5 demonstrates congruent evolutionary trajectories across all cases: post-threshold strain acceleration followed by asymptotic stabilization near d = 1. Critical differentiation emerges in damage initiation chronology—higher confining stresses delay damage onset. Cross-referencing with pressure histories in Figure 6 reveals proportional increases in damage initiation pressure with confining stress.
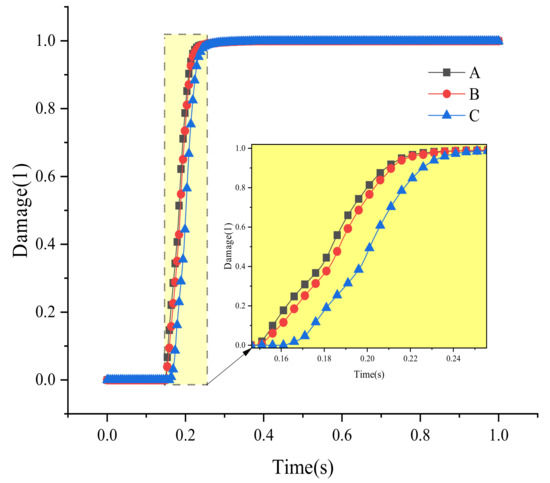
Figure 5.
Damage progression under varying confining stress.
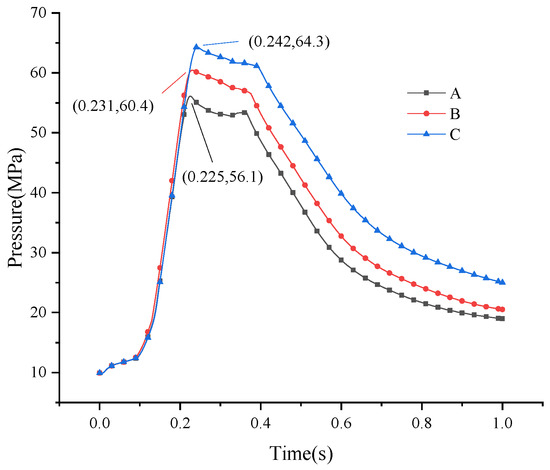
Figure 6.
Pressure transients under differential loading.
Notably, equivalent 2 MPa stress increments (6→8 MPa vs. 8→10 MPa) produce nonlinear initiation time delays, with the latter interval exhibiting greater temporal separation. Pressure dynamics further differentiate these regimes: higher confining stresses (1) elevate peak pressures, and (2) reduce interpeak pressure fluctuation amplitudes. Cases B-C exhibit truncated bimodal pressure signatures compared to baseline Group A.
3.3. Lateral Pressure Coefficient Effects
Three simulation cases with fixed vertical stress (= 10 MPa) and varying lateral pressure coefficients (= 0.5, 0.7, 1) were established (Table 1). Figure 7 demonstrates bifurcated damage evolution patterns under stress anisotropy: under isotropic conditions (= 1), damage progression follows a monotonic trend consistent with the baseline in Figure 5, while anisotropic configurations (< 1) exhibit biphasic evolution characterized by immediate damage initiation (<0.1 s) reaching an intermediate plateau, followed by secondary damage acceleration after a thermal equilibration delay (Δt = 0.8–1 s).
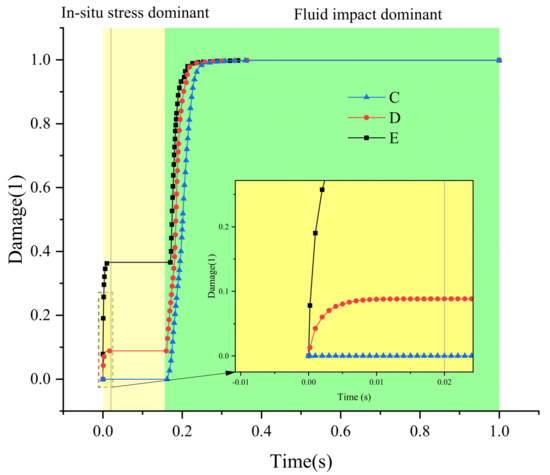
Figure 7.
Stress anisotropy effects on fracture progression.
Stress anisotropy inversely correlates with damage initiation chronology, where reduced values induce earlier primary damage onset and accelerated secondary fracture propagation.
Pressure evolution (Figure 8) reveals conserved bimodal characteristics across all cases. Anisotropic groups (D–E) exhibit elevated secondary pressure peak intensities, reduced interpeak pressure differentials, and improved pre-peak curve alignment relative to = 1 cases.
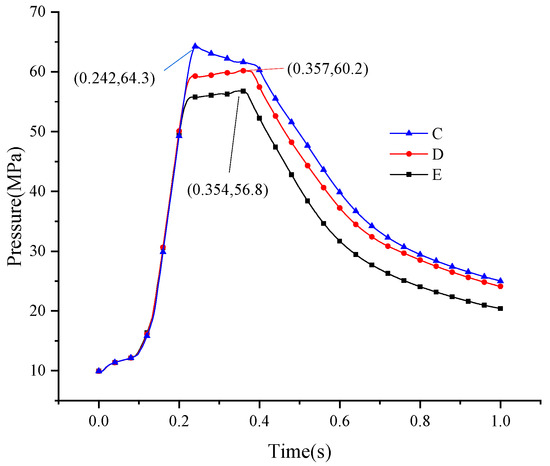
Figure 8.
Pressure response under differential lateral constraints.
4. Mechanistic Analysis
The simulation results demonstrate that Sc-CO2 thermal shock-induced damage evolution exhibits strong in situ stress dependence, manifesting through both quantitative parameter shifts (peak pressures: 48–56 MPa) and qualitative curve morphology alterations. These stress-controlled patterns extend to pressure transient characteristics, necessitating deeper mechanistic interrogation. Prior to detailed analysis, model validity is established through fracture pressure verification.
4.1. Model Validation
Fracture pressure predictions from the damage model are benchmarked against established rock failure criteria. The Hubbert–Willis (H-W) criterion (Equation (19)), derived from triaxial compression tests, provides the theoretical foundation.
Subsequent refinement by Haimson and Fairhurst yielded the H-F model (Equation (20)), incorporating poroelastic effects under isotropic reservoir assumptions.
where = formation fracture pressure (MPa); = in situ pore pressure (MPa); and = elastic constants of pores.
Given the tight low-permeability lithology under study, the H-W criterion demonstrates superior applicability. Model validation compares theoretical fracture pressures (Equation (19)) against simulated values corresponding to initial damage occurrence (d > 0.9 threshold activation). As Table 4 documents, the maximum inter-method deviation remains below 5.5%, confirming model fidelity. This sub-5.5% error tolerance validates the damage evolution framework’s capacity to physically characterize fracture propagation dynamics.
Table 4.
H-W criterion vs. damage model fracture pressure comparison.
4.2. In Situ Stress Effects on Damage Evolution
Stress concentration effects [27] induce weak zone formation between adjacent fracture initiation points. As evidenced in Figure 3, microcrack nucleation preferentially occurs along inter-hole axes, with subsequent propagation toward neighboring voids. Under isotropic conditions (single borehole, = 1), maximum pressure attenuation occurs along φ = 45° orientations. However, multi-hole configurations exhibit altered fracture trajectories due to inter-hole stress interference, reducing dominant crack angles to <45°.
The biphasic damage evolution under anisotropic stress (≠ 1) manifests through distinct primary and secondary growth phases separated by extended temporal intervals. To elucidate this mechanism, line probes were positioned along φ = 90° ± 45° orientations in Group E (Figure 9), tracking principal stress distributions across 445 mm transects from fracture boundaries.
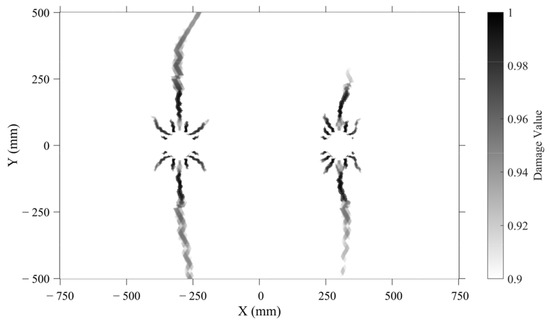
Figure 9.
Damage progression topology (Group E).
As shown in Figure 10, Figure 11 and Figure 12, at t = 0.1 s, φ = 90 ° ± 45 ° orientations dominate. By 0.17 s, when Group E has begun to experience secondary damage growth, the stress in the 90 ° direction has shown a dominant tendency, and by 0.2 s, the stress in the 90 ° direction completely exceeds the 90° ± 45° direction.
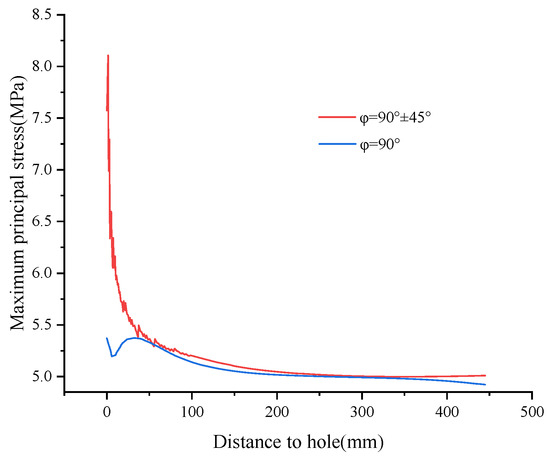
Figure 10.
Principal stress profile at 0.1 s.
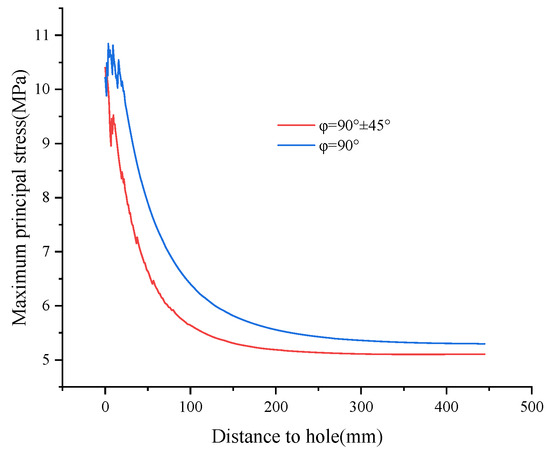
Figure 11.
Stress evolution at 0.17 s.
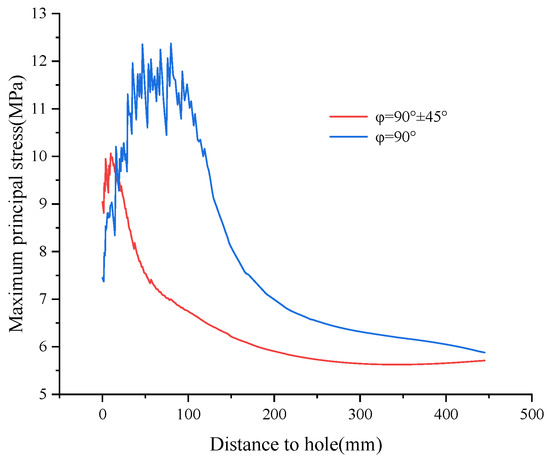
Figure 12.
Stress evolution at 0.2 s.
The biphasic damage evolution under anisotropic stress arises from compressive stress dominance. Crucially, crack trajectories undergo a dynamic transition: initial propagation aligns with in situ stress orientation (e.g., subvertical paths at high σz), while subsequent growth follows thermal shock-induced principal stress trajectories. This reorientation—driven by progressive fluid pressurization and near-field stress redistribution—is a distinctive low strain-rate phenomenon (<10−3 s−1) absent in high-rate events like blasting. Thus, fracture path evolution in Sc-CO2 fracturing is governed by competing stress fields: in situ stresses dominate initiation, while thermal shock stresses control late-stage propagation.
Analysis of damage range dependencies (Table 2) reveals two key trends: isotropic stress conditions ( = 1) exhibit reduced damage areas with increasing confining pressure, while anisotropic cases ( < 1) demonstrate smaller damage extents compared to isotropic scenarios. The lower damage contrast in Group A relative to Group D confirms that horizontal stress reduction does not drive damage enhancement in these configurations (Figure 13 and Figure 14).
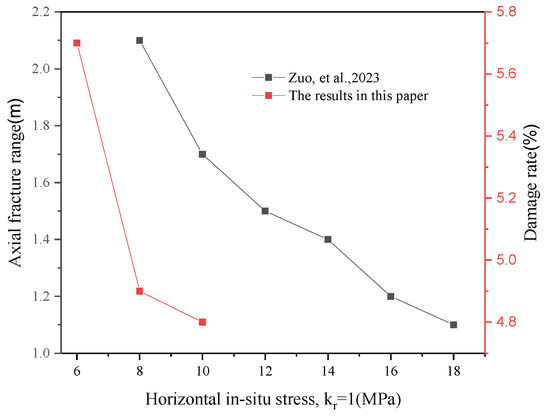
Figure 13.
In situ stress effects on fracture propagation extents [28].
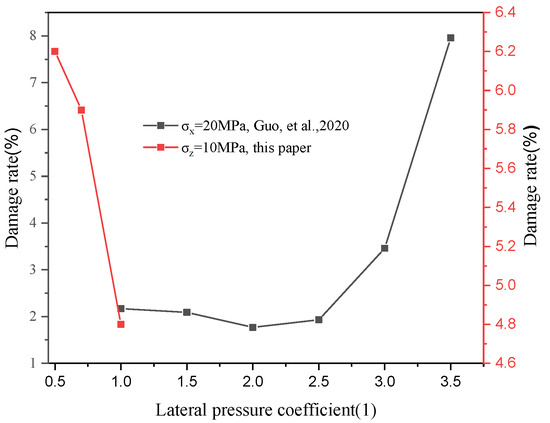
Figure 14.
Lateral constraint-damage correlation [29].
Comparative evaluation with existing studies demonstrates alignment with Zuo’s isotropic stress findings [28] but reveals divergence from Guo et al.’s fracture model [29]. While the current study identifies minimum damage at = 1, Guo et al.’s model predicts minimal damage at = 2, attributable to distinct boundary constraints in their experimental configuration (Figure 15). Specifically, the roller-supported base design in Guo et al.’s setup preferentially enhances vertical fracture propagation under horizontal stress dominance.
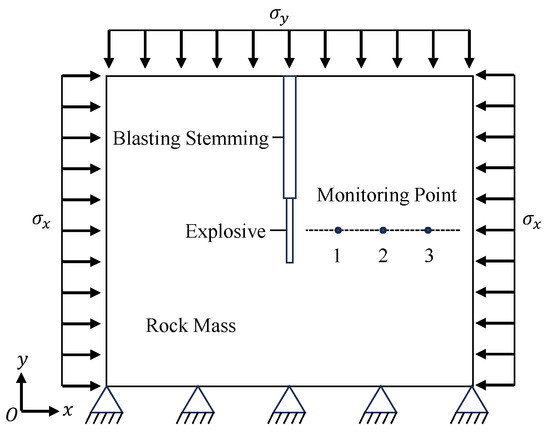
Figure 15.
Boundary-constrained fracture model schematic [29].
4.3. In Situ Stress Effects on Fluid Pressure
The pressure evolution process is systematically analyzed through the time–history curve shown in Figure 4. During the initial heating phase, temperature and pressure are progressively elevated until reaching the first pressure peak (Phase I). A distinct inflection point emerges in this phase, characterized by accelerated pressurization rates following the supercritical phase transition of CO2. Post-peak pressure behavior bifurcates based on lateral stress conditions (= 1 vs. ≠ 1). For isotropic stress configurations ( = 1), rapid pressure decline is observed, whereas anisotropic cases (≠ 1) exhibit attenuated pressure reduction rates. This divergence is mechanistically linked to fracture network development: localized damage saturation initiates primary crack formation, enabling fluid migration and subsequent pressure dissipation.
Secondary pressure peaks correlate with stabilized fracture lengths, as evidenced by permeability evolution (Figure 16) and normalized fluid mass loss profiles (Figure 17). The dimensionless density metric () in Figure 17 quantifies relative fluid retention. Under anisotropic stress (≠ 1), vertical stress dominance promotes subvertical fracture propagation (Figure 9), constraining mid-plane crack connectivity and reducing pressure relief efficiency. This limited fracture network development sustains elevated pressure plateaus despite continuous fluid leakage, manifesting as apparent pressure curve “uplift” in time-history profiles.
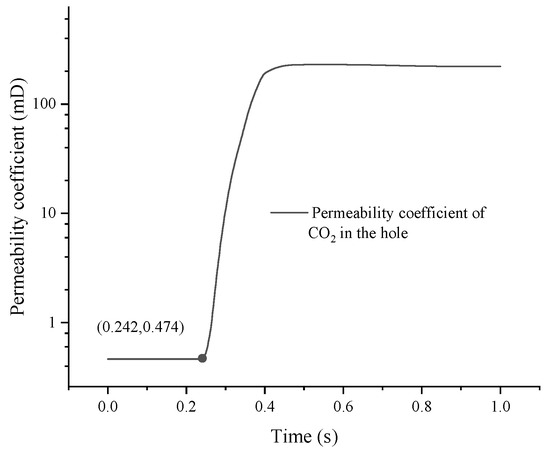
Figure 16.
Permeability evolution in Group E.
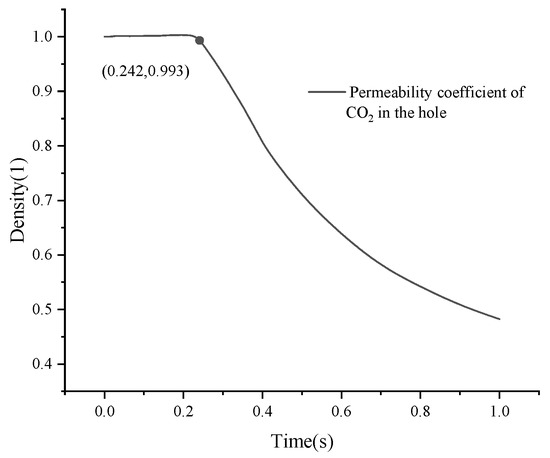
Figure 17.
Normalized fluid mass variation (Group E).
To further investigate the mechanism behind the ‘bimodal’ pressure phenomenon, this study employs the area-integrated total potential energy of surrounding rock, Js (J·m2) to characterize fracture aperture. The total potential energy represents the sum of rock strain energy and load-induced potential energy (in COMSOL 6.3 imulations, the solid mechanics potential energy increases under tension and decreases under compression).
As shown in Figure 18, as fluid pressure gradually increases, the surrounding rock undergoes compressive deformation, leading to a decrease in potential energy. This decline accelerates sharply after damage initiation, indicating the formation of initial cracks. When the damage reaches its maximum extent (complete rock failure in the damaged zone), cracks enter the macroscopic propagation stage, triggering rapid fluid pressure release and elastic rebound of the surrounding rock. Correspondingly, the potential energy curve exhibits an inflection point.
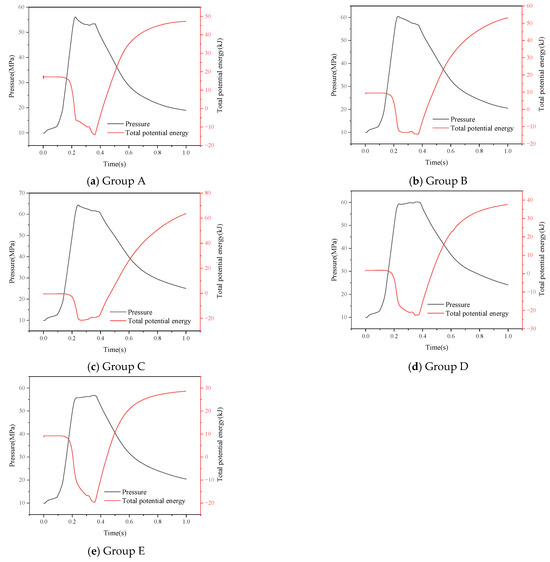
Figure 18.
Pressure–energy curve.
In Figure 18b,c, the potential energy changes remain relatively stable or even show slight increases during the interpeak phase of their corresponding pressure curves. This suggests sustained heat supply converting into fluid pressure energy, which is then transformed into kinetic energy through fluid leakage, resulting in slower crack propagation.
Conversely, Figure 18d,e display rapid potential energy declines, signifying slower crack propagation and further increases in fluid pressure on the rock.
Figure 18a exhibits a distinct pattern under low in situ stress—an initial gradual decline followed by an accelerated drop—aligning with its pressure trend of initial decrease followed by interpeak recovery. As the lowest-load simulation group, its damage zone initially expanded rapidly. This caused excessive energy release that hindered further crack propagation near the secondary pressure peak, ultimately leading to pressure rebound.
5. Discussion and Conclusions
5.1. Discussion
This study employs a two-dimensional plane strain model to balance computational efficiency with parametric analysis of stress effects. Key simplifications warrant careful consideration: The 2D assumption effectively captures stress anisotropy’s control over fracture paths but inherently limits characterization of three-dimensional fracture branching behavior. While the exponential permeability-damage coupling was calibrated through uniaxial tests, its applicability to shear-dominated failure modes requires further verification and lacks micro-CT validation of pore evolution processes. The adiabatic thermal treatment neglects heat dissipation to surrounding formations during transient fracturing (<1 s), potentially amplifying near-wellbore thermal stresses though partially mitigated by the brief operational window. Furthermore, fixed-displacement boundary conditions suppress stress shadowing effects critical for field-scale multi-cluster fracturing. These intentional simplifications prioritize the mechanistic understanding of in situ stress influences over field-predictive accuracy while preserving physical insights into thermo-hydromechanical coupling.
Environmentally, Sc-CO2 thermal fracturing provides near-total freshwater replacement versus hydraulic fracturing, and enables measurable CO2 storage potential through stress-constrained fracture networks in reactive formations. Challenges include ensuring CO2 sourcing sustainability and mitigating long-term leakage risks via caprock integrity monitoring—key foci for field-scale implementation.
5.2. Conclusions
The principal findings of this study are summarized as follows:
(1) Bimodal Pressure Peaks Require Anisotropy: ** Controlled parametric simulations reveal two characteristic pressure peaks during thermal shock fracturing. While the first peak magnitude correlates with stress isotropy, secondary peak enhancement occurs *exclusively* under anisotropic in situ stress conditions ($k_r \neq 1$), signifying inhibited fracture coalescence.
(2) Fracture Path Reorientation Governed by Competing Stresses:** Fracture propagation under anisotropic stress exhibits a distinct spatiotemporal transition: initial crack orientation is governed by the in situ stress field, while subsequent growth dynamics are dominated by Sc-CO2 thermal shock-induced stress reorientation, leading to discrete path adjustments.
(3) Confinement Effects Modulate Network vs. Pressure: ** Stress orientation critically controls fracture network development. Confinement from elevated normal stresses perpendicular to prospective fracture planes suppresses crack coalescence and reduces pressure gradients, delaying initiation. Conversely, this confinement sustains higher pressure plateaus despite leakage, demonstrating stress anisotropy’s dual role in enhancing peak pressures while limiting network complexity.
Using the surrounding rock potential energy as a characteristic variable, this study reveals the pressure-energy coupling mechanism during impact fracturing processes, thereby providing a novel indicator for assessing anisotropy in local in situ stress fields at construction sites. In addition, this anisotropy optimization to stress, thanks to this technique, extends, beyond wider crack containment, to water savings and the permanent sequestration of CO2, pushing double-mission energy-ecological strategies.
Author Contributions
Y.C.: Writing—original draft, Visualization. Y.J.: Supervision, Investigation, Writing—review and editing. S.H.: Conceptualization, Funding acquisition, Methodology. J.S.: Investigation, Validation. Y.Y.: Project administration, Resources. All authors have read and agreed to the published version of the manuscript.
Funding
The authors declare that financial support was received for the research and/or publication of this article. This research was financially supported by The National Key R&D Program for International Science and Technology Innovation Cooperation between Governments, grant number 2023YFE0120500, The State Key Laboratory Open Fund Project, grant number HKLBEF202004, The Surface Project of the Natural Science Foundation of Jiangsu Province, grant number BK20201313, and the Science and technology program of the Ministry of housing and urban rural development, grant number 2021-K-087.
Institutional Review Board Statement
Not applicable.
Informed Consent Statement
Not applicable.
Data Availability Statement
The original contributions presented in this study are included in the article. Further inquiries can be directed to the corresponding author.
Conflicts of Interest
The authors declare that the research was conducted in the absence of any commercial or financial relationships that could be construed as potential conflicts of interest.
References
- Zheng, M.; Li, J.; Wu, X.; Wang, S.; Guo, Q.; Chen, X.; Yu, J. Potential of Oil and Natural Gas Resources of Main Hydrocarbon Bearing Basins and Key Exploration Fields in China. Earth Sci. 2019, 03, 833–847. (In Chinese) [Google Scholar]
- Hu, S.; Cai, Y.; Zhang, L.; Yan, Z.; Pang, S. Numerical simulation of rock breaking by high-temperature and high-pressure water under thermal driving. Geofluids 2022. [Google Scholar] [CrossRef]
- Li, N.; Yu, J.; Zhang, H.; Zhang, Q.; Kang, J.; Zhang, N.; Wang, C. Simulation of wellbore temperature and pressure field in supercritical carbon dioxide fracturing. Pet. Sci. Technol. 2024, 42, 190–210. [Google Scholar] [CrossRef]
- Liu, L.; Zhu, W.; Wei, C.; Elsworth, D.; Wang, J. Microcrack-based geomechanical modeling of rock-gas interaction during supercritical CO2 fracturing. J. Pet. Sci. Eng. 2018, 164, 91–102. [Google Scholar] [CrossRef]
- Yin, B.; Lou, Y.; Liu, S. Mechanism of fracture propagation for SC-CO2 fracturing and phase-change process. J. CO2 Util. 2024, 80, 102691. [Google Scholar] [CrossRef]
- Wang, L.; Yang, D.; Meng, Q.; Zhao, Y.; He, L. Effects of supercritical carbon dioxide under different conditions on mechanical properties and energy evolution of coal. Geomech. Geophys. Geo-Energy Geo-Resour. 2022, 8, 93. [Google Scholar] [CrossRef]
- Du, Y.; Wang, R.; Ning, H.; Huo, H.; Huang, Z.; Yue, W.; Zhao, H.; Zhao, B. Rock-breaking experiment with supercritical carbon dioxide jet. J. China Univ. Pet. 2012, 4, 93–96. (In Chinese) [Google Scholar]
- Cheng, Y.; Li, G.; Wang, H.; Shen, Z.; Tian, S.; Cai, C. Flow field character in cavity during supercritical carbon dioxide jet fracturing. J. China Univ. Pet. 2014, 4, 81–86. (In Chinese) [Google Scholar]
- Jia, Y.; Lu, Y.; Elsworth, D.; Fang, Y.; Tang, J. Surface characteristics and permeability enhancement of shale fractures due to water and supercritical carbon dioxide fracturing. J. Pet. Sci. Eng. 2018, 165, 284–297. [Google Scholar] [CrossRef]
- Du, Y.; Wang, R.; Chen, X.; Ni, H.; Li, M.; Lin, P.; Chen, Y.; Ye, T. Determination of the effect of supercritical carbon dioxide jet on the rock strength. In Proceedings of the Second Conference of Global Chinese Scholars on Hydrodynamics, Wuxi, China, 12–13 November 2016. [Google Scholar]
- López-Comino, J.A.; Cesca, S.; Jarosławski, J.; Montcoudiol, N.; Heimann, S.; Dahm, T.; Lasocki, S.; Gunning, A.; Capuano, P.; Ellsworth, W.L. Induced seismicity response of hydraulic fracturing: Results of a multidisciplinary monitoring at the Wysin site, Poland. Sci. Rep. 2018, 8, 8653. [Google Scholar] [CrossRef]
- Pan, J.; Du, X.; Wang, X.; Hou, Q.; Wang, Z.; Yi, J.; Li, M. Pore and permeability changes in coal induced by true triaxial supercritical carbon dioxide fracturing based on low-field nuclear magnetic resonance. Energy 2024, 286, 129492. [Google Scholar] [CrossRef]
- Shi, W.; Zhu, L.; Guo, M.; Huang, Z.; Wang, G.; Lin, L.; He, L.; Liao, Y.; He, H.; Gong, J. Assessment of CO2 fracturing in China’s shale oil reservoir: Fracturing effectiveness and carbon storage potential. Resour. Conserv. Recycl. 2023, 197, 107101. [Google Scholar] [CrossRef]
- Fei, H.; Yiyu, L.; Jiren, T.; Xiang, A.; Yunzhong, J. Research on erosion of shale impacted by supercritical carbon dioxide jet. Chin. J. Rock Mech. Eng. 2015, 04, 787–794. (In Chinese) [Google Scholar]
- Zhang, Q.; Tian, S.; Chen, L.; Li, J.; Liu, H. Parameter sensitivity of supercritical CO2 swirling-round jet based on grey correlation degree method. Pet. Geol. Oilfield Dev. Daqing 2021, 04, 63–72. (In Chinese) [Google Scholar]
- Sun, K.M.; Xin, L.W.; Wang, T.T.; Wang, J.Y. Simulation research on law of coal fracture caused by supercritical CO2 explosion. J. China Univ. Min. Technol. 2017, 3, 501–506. (In Chinese) [Google Scholar]
- He, Y.; Yang, Z.; Jiang, Y.; Li, X.; Zhang, Y.; Song, R. A full three-dimensional fracture propagation model for supercritical carbon dioxide fracturing. Energy Sci. Eng. 2020, 8, 2894–2906. [Google Scholar] [CrossRef]
- Liu, Y.; Zhang, J.; Wei, J.; Wang, C.; Cui, J. Impact pressure distribution of an SC-CO2 jet used in rock breakage. Geomech. Geophys. Geo-Energy Geo-Resour. 2022, 8, 27. [Google Scholar] [CrossRef]
- Wang, R.; Huo, H.; Huang, Z.; Song, H.; Ni, H. Experimental and numerical simulations of bottom hole temperature and pre-ssure distributions of supercritical CO2 jet for well-drilling. J. Hydrodyn. Ser. B 2014, 2, 226–233. [Google Scholar] [CrossRef]
- Song, W.; Ni, H.; Wang, R.; Sun, B.; Shen, Z. Pressure transmission in the tubing of supercritical carbon dioxide fracturing. J. CO2 Util. 2017, 21, 467–472. [Google Scholar] [CrossRef]
- Yang, J.; Lian, H.; Li, L. Fracturing in coals with different fluids: An experimental comparison between water, liquid CO2, and supercritical CO2. Sci. Rep. 2020, 1, 18681. [Google Scholar] [CrossRef]
- Zuo, J.; Song, W.; Zou, D. Experimental Study on the Permeability Change of Sandstone Under Supercritical Carbon Dioxide Jet. J. Inst. Eng. India Ser. A. 2018, 4, 671–675. [Google Scholar] [CrossRef]
- SY/T 6285-2011; Evaluation Method of Oil and Gas Reservoir. Petroleum Industry Press: Beijing, China, 2011. (In Chinese)
- Chen, M.; Jin, N.; Zhang, G. (Eds.) Rock Mechanics of Petroleum Engineering; Science Press: Beijing, China, 2008. [Google Scholar]
- Golub, V.P. Constitutive Equations in Nonlinear Damage Mechanics. Int. Appl. Mech. 1993, 10, 794–804. [Google Scholar] [CrossRef]
- Chilingar, G.V. Relationship between porosity, permeability, and grain-Size distribution of sands and sandstones. In Developments in Sedimentology; Elsevier: Amsterdam, The Netherlands, 1964; pp. 71–75. [Google Scholar]
- Cheng, S. Surrounding Rock Deformation Mechanism and Application of Non-Penetrating Presplitting on Roof of Small Coal Pillar Roadway Under Stress Superposition. Ph.D. Thesis, China University of Mining and Technology, Xuzhou, China, 2022. [Google Scholar]
- Zuo, L. Mechanism of Carbon Dioxide Phase Change Blasting with Side Wall Energy Release. Master’s Thesis, China University of Mining and Technology, Xuzhou, China, 2023. [Google Scholar]
- Guo, Y.; Sun, C.; Kang, Y.; Meng, H.; Xue, L. Numerical Simulation Analysis of Rock Mass Blasting Under High Geo-stress. Railw. Eng. 2020, 12, 74–77. (In Chinese) [Google Scholar] [CrossRef]
Disclaimer/Publisher’s Note: The statements, opinions and data contained in all publications are solely those of the individual author(s) and contributor(s) and not of MDPI and/or the editor(s). MDPI and/or the editor(s) disclaim responsibility for any injury to people or property resulting from any ideas, methods, instructions or products referred to in the content. |
© 2025 by the authors. Licensee MDPI, Basel, Switzerland. This article is an open access article distributed under the terms and conditions of the Creative Commons Attribution (CC BY) license (https://creativecommons.org/licenses/by/4.0/).