1. Introduction
The over-reliance on resource consumption and emissions since global industrial civilization has caused environmental degradation and resource depletion, causing a major ecological and existential crisis for humanity [
1,
2]. In response to this environmental issue, the concept of “sustainable development” was first mentioned in the World Charter for Nature [
3] and expanded in “Our Common Future” [
4] and “Agenda 21 of the 1992 Earth Summit” [
5]. Since 1995, the World Summit for Social Development in Copenhagen has stressed the importance of sustainable development in global society [
6]. All UN member states adopted “the 2030 Agenda for Sustainable Development” on 25 September 2015, which establishes 17 SDGs [
7] to address economic, social, and environmental issues that impede global sustainable development [
8]. Businesses, industries, governments, non-governmental organizations, and regional organizations use the SDGs as a roadmap for global development by 2030 [
9].
Large modern cities are the centers of closely connected and pioneering modern civilizations around the world. They occupy only 3% of the world’s land surface but consume over 75% of human-used natural resources and emit 60–80% of global greenhouse gases [
10]. The use of urban resources threatens humans and the environment as humanity builds cities [
11]. Cities must become closed-loop, circular resource use systems to be compatible with natural systems. To ensure the ability of cities to develop sustainably, it becomes essential to maintain environmental, economic, and social development [
12,
13]. Thus, international scholars are increasingly concerned about city sustainability, and many reports and scientific publications address it [
14,
15,
16,
17,
18,
19]. Many international scholars have used multidimensional indicator frameworks to assess urban sustainability to help countries or regions formulate implementation strategies, allocate resources, and monitor progress (
Table 1). Assessment methods vary, but environmental, economic, and social dimensions are the same.
One of the important characteristics of Chinese-style modernization is “the modernization of harmonious coexistence between humans and nature (MHCHN)”, and there is a profound and essential internal connection between the concept of sustainable development and MHCHN. The latter is a localized interpretation, deepening, and practice of sustainable development. They suggest a new development model that prioritizes long-term prosperity and environmental health over industrialization. In the new development stage of China’s comprehensive construction of a modern socialist country, the modernization of harmonious coexistence between humans and nature (MHCHN) has become a significant objective and responsibility [
25].
Following the proposal of the concept of MHCHN, Chinese scholars conducted extensive and in-depth studies on its connotation and characteristics [
26,
27], generative logic [
28,
29,
30,
31], and practical pathways [
32,
33,
34]. The fundamental implications of MHCHN are as follows:
(1) Modernization that supports the idea of a community of life between humans and nature. MHCHN positions both entities equally, highlighting their symbiotic relationship while rejecting both natural-centrism and anthropocentrism.
(2) Modernizing the coordinated development between economic growth and ecological protection. Critically examine the West’s uncritical pursuit of short-term, high-efficiency production methods and reject the early modern, extensive development model of New China. It is essential to avoid compromising environmental integrity for transient economic gains, highlighting the need for economic development and ecological protection to progress in a coordinated and mutually reinforcing manner.
(3) Modernization aims to address the needs of individuals for an improved quality of life. Emphasize a people-centered development approach, prioritizing the demand for high-quality ecological products and a beautiful ecological environment, while continuously enhancing the populace’s sense of gain, security, and satisfaction.
To achieve sustainable urban development, it is necessary to engage the scientific community and conduct pertinent research to offer rational solutions and a better understanding of current issues. MHCHN and the sustainable development of cities can be more effectively guided by the exploration of the dynamic evolution process and driving factors of MHCHN at the urban level. This paper endeavors to establish an evaluation index system for MHCHN at the urban level, which encompasses three dimensions of nature, economic, and social development. It also investigates the dynamic evolution process and driving mechanism of this system, drawing on the research of previous scholars and the fundamental connotation of MHCHN.
2. Materials and Methods
2.1. Materials
2.1.1. Overview of the Study Area
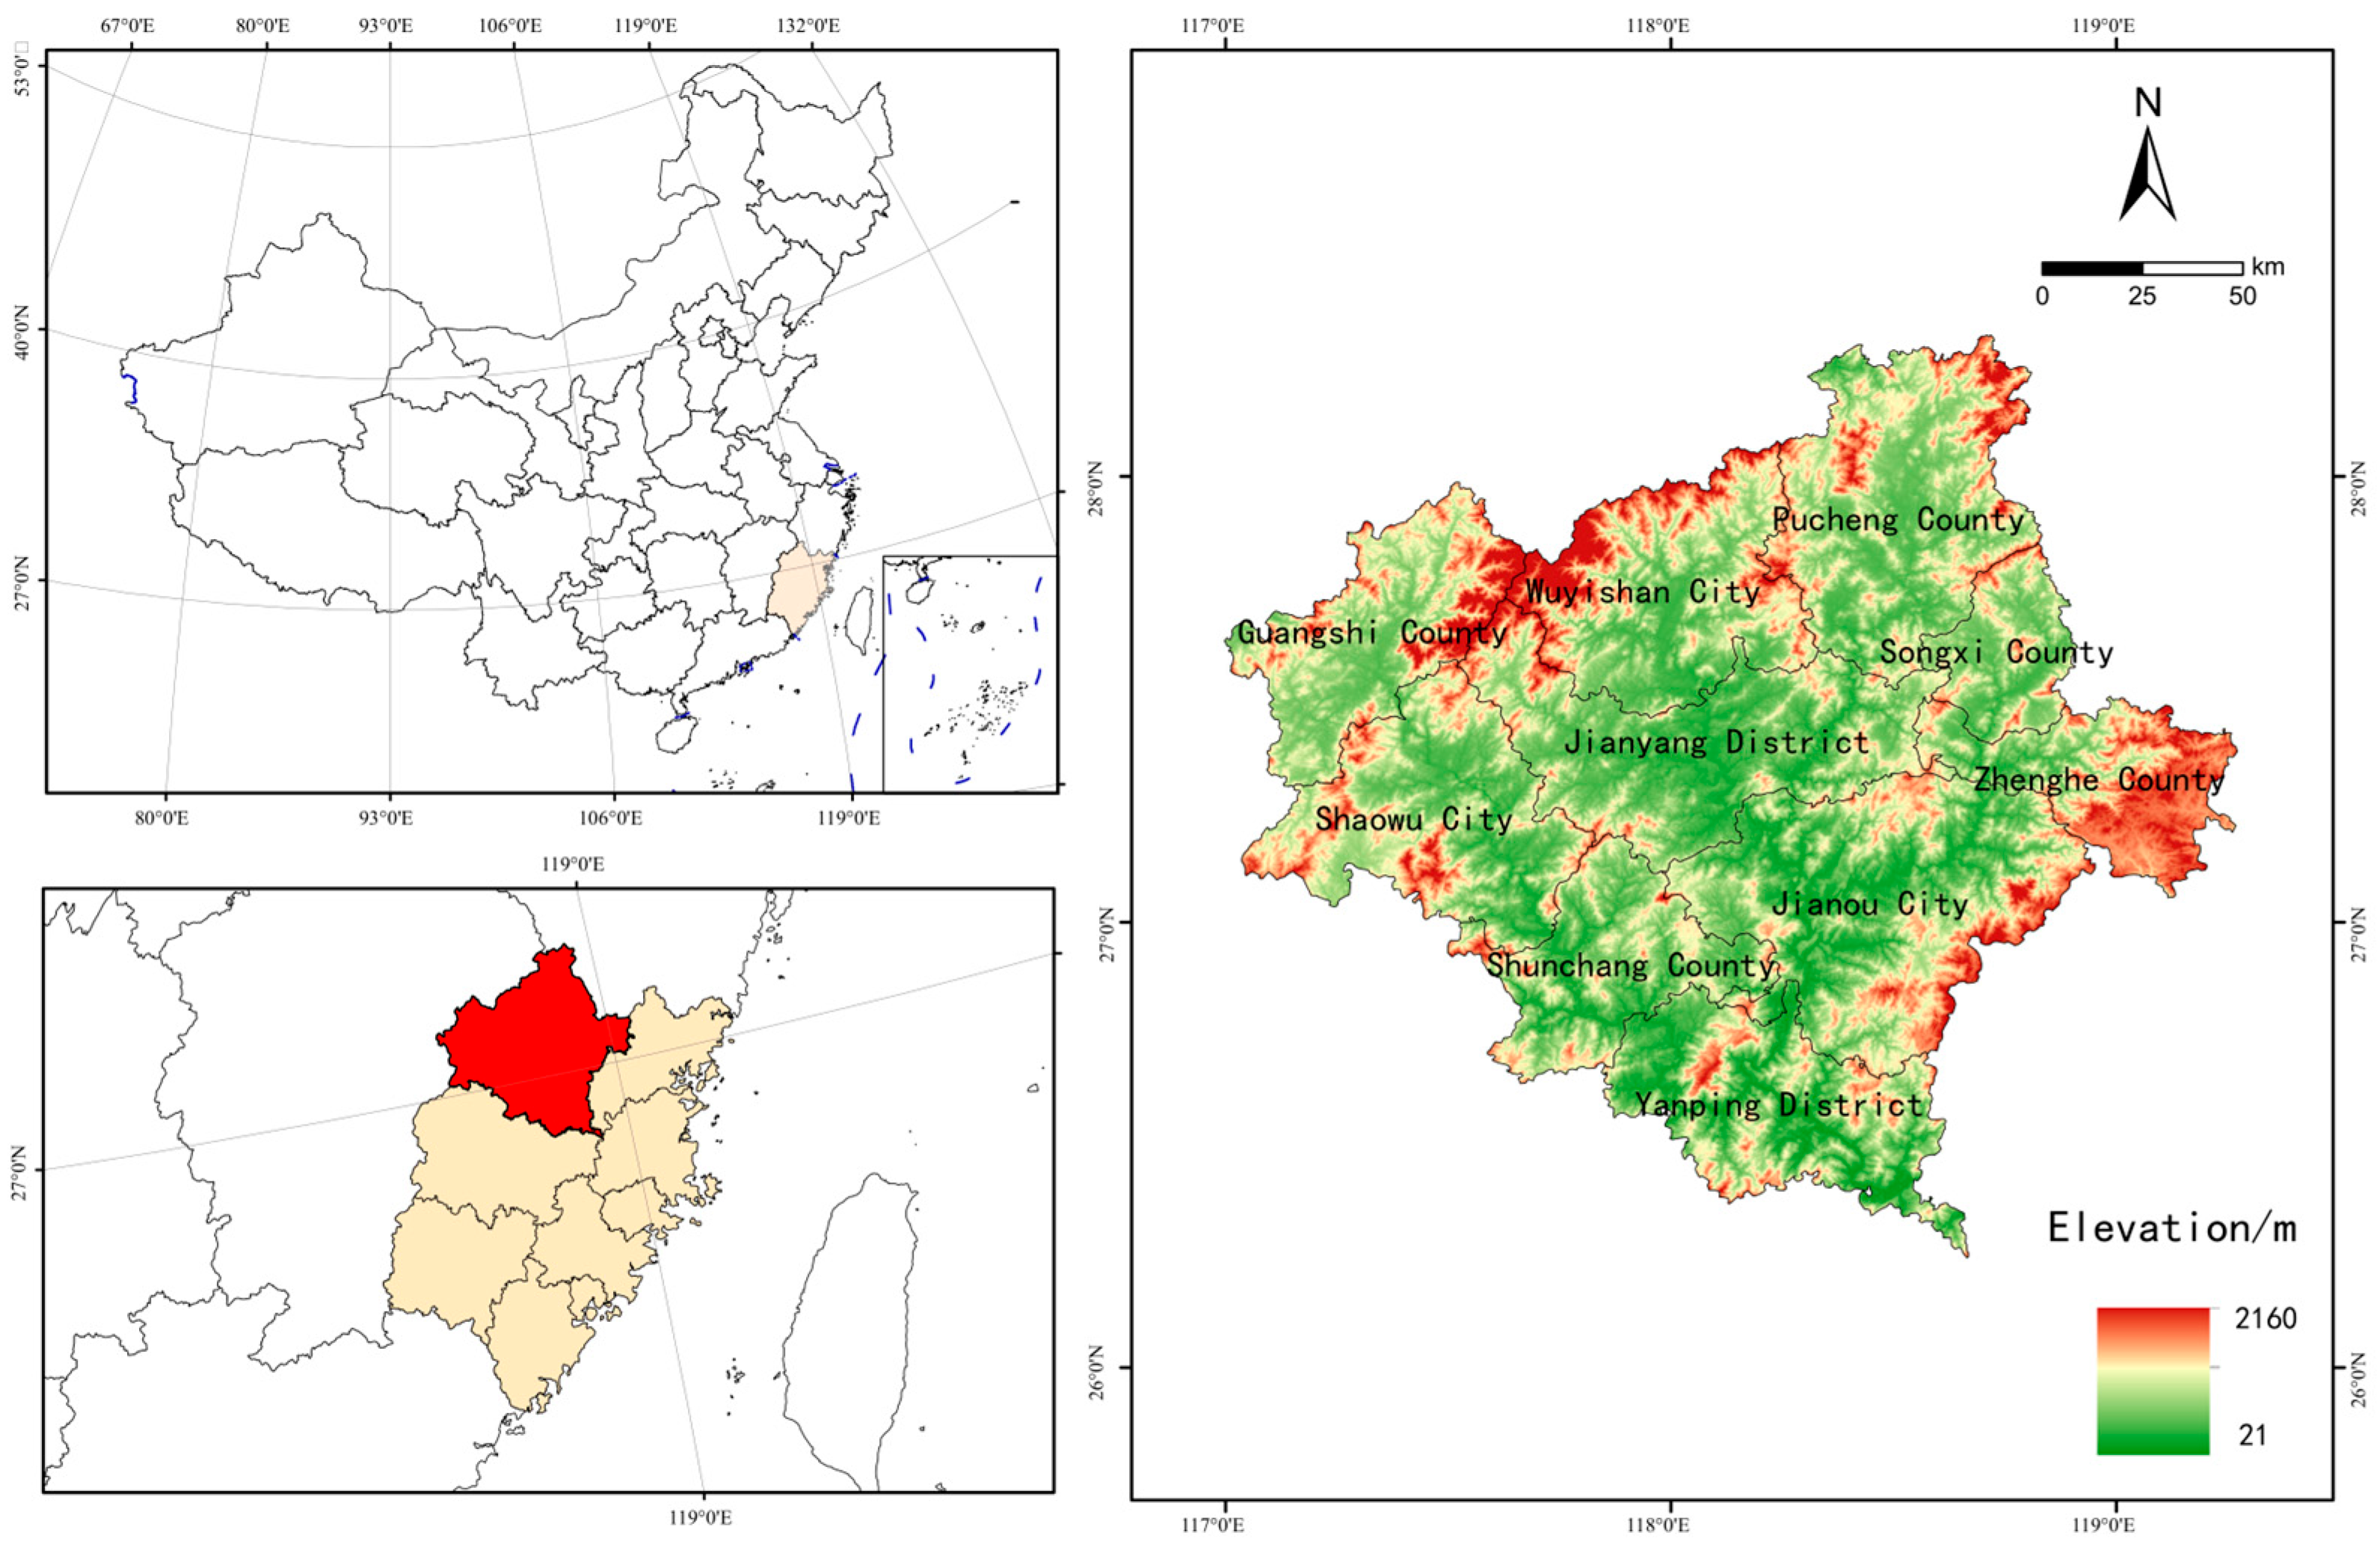
Nanping City, the source of the Min River, located in northern Fujian Province, is rich in natural resources and has an outstanding ecological environment (
Figure 1). It is a national ecological demonstration zone and green development demonstration zone with one of the best ecological environments at the same latitude. Nanping City, in southern China, is a key forest area known as “Southern Forest Sea” and “Green Treasury” with a forest coverage rate of 78.89%, ranking second in Fujian Province, and a forest reserve of 193 million m
3, ranking first. It has an extensive natural water system with many streams, large runoff, and wide basins due to its rich forest and water resources. Recently, Nanping City has deeply practiced Xi Jinping Thought on Ecological Civilization, focused on resource advantage transformation, scientifically planned the construction of the protection and development belt around Wuyishan National Park, built a green development system guided by the assessment and evaluation system, and explored a new path of green development of ecological industrialization and industrial ecology.
2.1.2. Construction of Evaluation Index System
Based on the basic connotation of MHCHN discussed in previous studies [
20,
21,
22,
23,
24], a comprehensive evaluation system with a structure of target layer (A), criteria layer (B), sub-criteria layer (C), and indicator layer (D) is constructed, which is consistent with the core of the three pillars of sustainable development (nature, economy, and society) (as shown in
Table 2).
(1) Ecological environmental protection B1
According to the Ministry of Ecology and Environment of the People’s Republic of China’s 2021 Measures for Regional Ecological Environment Assessment (Trial), this study assesses a region’s ecological environmental protection through ecological pattern, function, and stress. Since Nanping City is an important forest area in southern China and the headwaters of the Minjiang River, the forest coverage rate and water network density index are added to the ecological land area and habitat quality index to measure ecological pattern. Nanping City is important for water conservation, soil and water conservation, and forest carbon storage due to its abundant water and forest resources, so these three indicators were chosen to indicate its ecological function. Monitoring greenhouse gas emissions is important for scientific decision-making in response to climate change and for economic transformation and industrial upgrading. PM2.5 and O3 are the main air pollutants in Nanping City, so they should also be considered. Per capita daily domestic water consumption can indicate the pressure on water resources and water use efficiency.
(2) Economic green transformation B2
Green economic transformation must be measured through industrial structure, energy conservation, consumption reduction, and scientific empowerment. The transformation and upgrading of the industrial structure is an important sign of high-quality economic development, and per capita GDP can intuitively reflect a region’s economic development level. The per capita output value of agriculture, forestry, animal husbandry, and fishery, the proportion of industrial added value in GDP, and the proportion of tertiary industry added value in GDP are used to indicate the proportion of agriculture, industry, and service industry in the economy. Industrial waste gas emissions and wastewater emissions per unit of GDP reflect the intensity of pollutant emissions in industrial production, the comprehensive utilization rate of industrial solid waste reflects resource utilization and harmless treatment, and the construction land area per unit of GDP. The number of invention patents granted by 10,000 people is a comprehensive indicator of scientific research output and market application, as is the R&D expenditure of industries above a certain size.
(3) Enhancement of people’s livelihood B3
Quality of life and habitat environment reflect people’s livelihood enhancement. The quality of life involves economic income, employment, infrastructure construction, leisure and entertainment, medical care, education, etc. The urban-rural income ratio measures the income gap between urban and rural residents, reflects social equity and regional development balance, and the urban registered unemployment rate reflects urban labor market conditions, which affects employment safety and social stability. The per capita area of park green space measures urban greening and residents’ leisure space, which affects the urban ecological environment and quality of life. Urbanization is an important indicator of a region’s economic and social development and lifestyle changes. The number of doctors per 10,000 people measures medical services, which affects residents’ health security and accessibility. Education expenditure in the general public budget reflects the government’s investment in education, which directly affects education and personnel training. The proportion of days with good air, the harmless treatment rate of domestic waste, and the capacity of municipal solid waste treatment and urban domestic sewage treatment can be used to improve human settlement quality by monitoring and improving these indicators.
2.1.3. Data Sources
The study data is sourced from the Nanping City Statistical Yearbook, the China County and City Construction Statistical Yearbook, the Nanping City Ecological Environment and Condition Bulletin, and the National Economic and Social Statistical Bulletin, as well as the Ecological Environment and Condition Bulletin of various counties, cities, and districts. This includes metrics such as the average PM2.5 concentration, the rate of harmless domestic waste treatment, and the domestic sewage treatment rate for the period from 2014 to 2024. Additional data was acquired indirectly through arithmetic calculations, including the ecological land area ratio, water network density index, habitat quality index, water source conservation index, and soil and water conservation index, which were computed using the formulas outlined in the “Regional Ecological Environment Evaluation Methods (Trial)” published by the Ministry of Ecology and Environment of the People’s Republic of China in 2021. Some missing data were supplemented using the linear interpolation method.
2.2. Methods
2.2.1. The Vertical and Horizontal Pull-Out Method
Calculating indicator weights is essential for quantitative system analysis because they can greatly affect evaluation results. Analytic hierarchy process (AHP), principal component analysis (PCA), and entropy weight (EW) have been used to evaluate indicator systems in most studies. When comparing multi-level and multi-year time series data, periods are essential for dynamic comparability. The vertical and horizontal pull-out method is a dynamic evaluation method that emphasizes indicator differences between years by incorporating time factors into weight calculation. However, this method only uses the evaluation matrix to weight indicators and cannot reflect their information content. To overcome this limitation, we combine the vertical and horizontal pull-out method and the entropy weight method to weight indicators based on their information content [
35].
The “vertical and horizontal” pull-out method is a dynamic, comprehensive evaluation technique appropriate for “three-dimensional” panel data, unaffected by subjective color and entirely reliant on observational data mining [
36]. This study aims to accurately characterize the multi-period dynamic temporal variations in HMCHN, while also examining its spatial characteristics. To achieve this, the research employed the vertical and horizontal pull-out method introduced by Guo Yajun in 2002 to ascertain the index weights [
37]. Its advantages stem from its reliance on observational data, the elimination of bias from subjective weighting, and its adherence to the principles of data mining with robust objectivity. The steps for the calculation are as follows:
(1) Dimensionless nature of data
Assume there are
n evaluation objects
and
m evaluation indicators
, organized according
to constitute the time series data table data
(
Table 3).
To reduce the dimensionality of the data, the extreme value processing method is employed to achieve dimensionless processing of the original panel data
, with the positive index utilizing the method outlined in Equation (1) and the negative index employing the method specified in Equation (2).
where,
.
(2) Determination of weights
The evaluation function for determining
n evaluation objects is:
where
is the weight of the index, and
is the comprehensive evaluation value of the evaluation object
at time
. The overall difference of each evaluation object in the vertical and horizontal data
can be depicted by
, which is the sum of squares of the total dispersion of
:
Since the original data has been normalized,
, Equation (5) becomes:
The variables in the above equation are calculated as follows:
It can be seen that H is a symmetry matrix of the order of m × m, and the eigenvector corresponding to the maximum eigenvalue of the matrix H is the weight vector W, and the weight of each index is obtained after normalization, in which takes the maximum value.
2.2.2. The Entropy Weight Method
The entropy weight method is an information theory-based multi-metric weighting method used to handle complex multidimensional data, especially when weights cannot be determined or prior knowledge is lacking. It calculates each indicator’s “information entropy” to determine its weight in the comprehensive evaluation, reflecting its variation and importance. The steps for the calculation are as follows:
(1) The feature weight
is calculated according to the standardized data calculated by Equations (1) and (2).
where
represents the eigen weight of the
i th evaluation object under item
j at time
k.
(2) Calculate the
of information entropy value and the
of information utility value
(3) Calculate the index weight
The weights
are determined by vertical and horizontal slotting methods, and weights
are determined by the entropy method for each indicator per year are organized into a matrix
by year:
The final weight of each indicator
can be obtained by adding the elements of each row in
and taking the arithmetic average (
Table 2), and after weighting and summarizing layer by layer through the linear weighting method, the comprehensive evaluation value of each county (city, district) in each year (
) can be obtained.
2.2.3. Modified Coupled Coordination Degree Model
The degree of coupling coordination is a crucial metric for assessing the comprehensive synergistic advancement of the system, transitioning from disorder to order and from a low level to a high level during the processes of development, evolution, and interaction [
38]. The conventional degree of coupling coordination fails to accurately represent the concept of differentiated development, resulting in significant discrepancies in system values, despite a persistently high degree of coupling. Consequently, to more accurately represent the extent of coupling for assessing system value divergence, this paper employs the modified coupling coordination degree model proposed by Mr. Fan Dongjun, Equation (1) [
39]. According to the studies conducted by Weng Yijing et al. and Sun Huangping et al., the degree of coupling coordination is categorized into four categories of state spaces (
Table 4) [
40,
41].
where
n represents the number of Criteria layers;
denotes the complete assessment value of these layers;
D signifies the degree of coupling coordination;
C indicates the degree of coordinated development; and
refers to the coordination index. This study posits that “ecological environmental protection,” “economic green transformation,” and “enhancement of people’s livelihoods” hold equal significance. Consequently, when
n = 3,
a1,
a2, and
a3 are assigned the value of 1/3, respectively.
2.2.4. Sensitivity Analysis
Does the index weight change the coupling coordination degree of each county (city, district) in Nanping City when the original evaluation information objectively weights the evaluation index? How did it change? Sensitivity analysis helps us determine if changing the weight of the evaluation index will affect evaluation results, which is crucial to model use and quantitative decision-making. We used the perturbation method to analyze the evaluation index weights’ sensitivity to improve the model’s explanatory power and adaptability. The calculation steps are as follows:
(1) Assume that the initial weight of the evaluation index
is
, which is denoted as
after perturbation, where
. The normalization of the weights reveals that the weights of the other indicators adjust following the change in
, which is represented by
and satisfies:
It can be obtained according to the above formula:
(2) When a different parameter is selected, the modified coupling coordination degree model is employed to determine the coupling coordination degree level of each county (city, district). The weights of 33 evaluation indicators in this study are then disturbed, and is randomly selected 3, 2, 1/2, and 1/3. A total of 33 experiments are conducted.
Of the 3300 experimental results in 33 experiments, only 146 coupling coordination degrees changed the coordination level, with a change rate of 0.044%. This showed that the modified coupling coordination degree model adopted in this study was relatively insensitive to index weight changes and had strong explanatory power and adaptability.
2.2.5. Non-Parametric Kernel Density Estimation
The present study delineates the dynamic evolution of indicators by
-convergence,
-convergence, the coefficient of variation technique, and non-parametric kernel density estimation [
42]. Non-parametric kernel density estimation can adaptably fit a smooth, continuous density estimate without making any assumptions about the data’s distribution and capture its complex structure (e.g., multimodality), making it more flexible than other methods. Due to its extreme smoothness, robustness to outliers, and mature theoretical foundation, the Gaussian kernel function is one of the most widely used and reliable kernel functions in non-parametric and density estimation. In this work, the Gaussian kernel function is employed to estimate the dynamic evolution of the comprehensive evaluation value and the coordinated development level of each criterion layer, with the calculation formula presented as follows:
where
is the Gaussian kernel density function;
h is the bandwidth;
n is the number of study subjects within the bandwidth;
m is the data dimension.
2.2.6. Markov Chain Model
The traditional Markov chain model can discretize continuous data into K categories and, given the discrete nature of both time and state, statistically allocate the probability distribution and evolutionary trajectory of each developmental stage type, thereby elucidating the characteristics of various developmental stages of the contemporary harmonious coexistence between humans and nature in the counties (cities and districts) of Nanping City during the study period. Its representation is:
where
is the transfer probability from development stage
i to development stage
j during the study period;
is the number of counties that have transferred from development stage
i at the beginning of the study to development stage
j at the end of the study; and
is the number of counties in the development stage
j at the beginning of the study.
The traditional Markov chain model neglects the geographical “spillover effect”; thus, Sergio J. Rey integrates standard Markov chains with local spatial statistics, adds the notion of “spatial lag”, and develops a spatial Markov chain model [
43]. The spatial Markov chain fully accounts for the spatial spillover impact exerted by nearby units on the target unit regarding a specific characteristic or state, and it can examine the patterns of spatial state transition of geographic phenomena. Its representation is:
where
represents the number of modernization development stage types for the harmonious coexistence of humanity and nature.
signifies the spatial transfer probability of MHCHN in county
A, conditioned on the spatial lag of
k, transitioning from development stage
i to development stage
j. The spatial lag value of county
A represents the weighted average of the attribute values from its physically adjacent counties, as expressed by the following formula:
where
is the spatial lag value of county
A, the size of which determines what type of spatial lag county
A belongs to,
is the spatial weight matrix, and
is the coupling coordination degree of county
B.
Comparing the values derived from the traditional Markov chain model and the spatial Markov chain model allows for an analysis of whether the modernization development stage of adjacent counties, in alignment with human and environmental considerations, influences the progression of the development stage within the region. For instance, indicates that the likelihood of upward transfer of counties in the main stage diminishes when adjacent counties are in the non-transformed stage.
To ascertain the statistical significance of the spatial lag effect, a hypothesis test must be conducted, presuming that the transfer of the development stage of modernization concerning the harmonious coexistence of humanity and nature is independent of one another, as well as independent of the development stages of neighboring counties. The formula for the test is:
where
represents the number of development stage types for MHCHN;
signifies the traditional Markov transfer probability;
indicates the probability of spatial Markov transfer associated with domain type
;
denotes the number of counties exhibiting spatial Markov transfer with neighborhood type
; and
refers to the chi-square distribution that conforms to
.
2.2.7. The Optimal Parameters Geographical Detector
GeoDetector is a spatial analysis tool that detects spatial hierarchical heterogeneity and identifies driving factors based on the assumption that the independent variable significantly impacts the dependent variable and that the two have similar spatial distributions. It measures the independent variable’s explanatory strength to the dependent variable’s change. Traditional geographic detectors artificially discretize continuous variables, which is subjective and imprecise, but the optimal parameters geographical detector (OPGD) discretizes the data using the parameter combination with the highest driving value of the independent variable (classification method and discontinuity), which improves statistical analysis. Thus, we investigate driving factors using OPGD [
44].
3. Results
3.1. Characterization of the Kernel Density Distribution
Figure 2 shows that from 2014 to 2024, the main peak of the kernel density curve of the comprehensive evaluation value of “ecological environmental protection” increased in the left and right fluctuations and decreased in peak width, indicating that the absolute difference in ecological environmental protection in each county gradually decreased and tended to the same level. During the study period, several secondary peaks appeared steadily in each year, indicating that ecological and environmental protection in each county had a multipolar trend that was stable.
The kernel density curve of the comprehensive evaluation values of “economic green development” and “enhancement of people’s livelihood” showed a trend of “continuous increase-temporary decline-continuous increase” from 2014 to 2024, and the peak width of the main peak decreased slightly, indicating that each county’s level of economic green development and improvement increased. Green economic development and livelihood enhancements have decreased. The comprehensive evaluation value of “economic green development” had a unimodal kernel density curve, indicating that each county’s economic green development level was not polarized. Except for the obvious right-tailing feature in 2015, the kernel density curve of the comprehensive evaluation value of “enhancement of people’s livelihood” had no tailing feature, indicating that some regions’ improvement levels were much higher in 2015 than in other years, and that other years’ levels were relatively balanced.
Except for 2020, the kernel density curve of coupling coordination degree showed a rightward shift from 2014 to 2024, raising the peak of the main peak, decreasing the width, and increasing the coupling and coordinated development level of ecology, economy, and people’s livelihood. In 2020, the curve shifted left, and the peak value decreased.
3.2. The Spatial Distribution Characteristics of the Comprehensive Evaluation Value of Each Criterion Layer and Its Coupling Coordination Degree
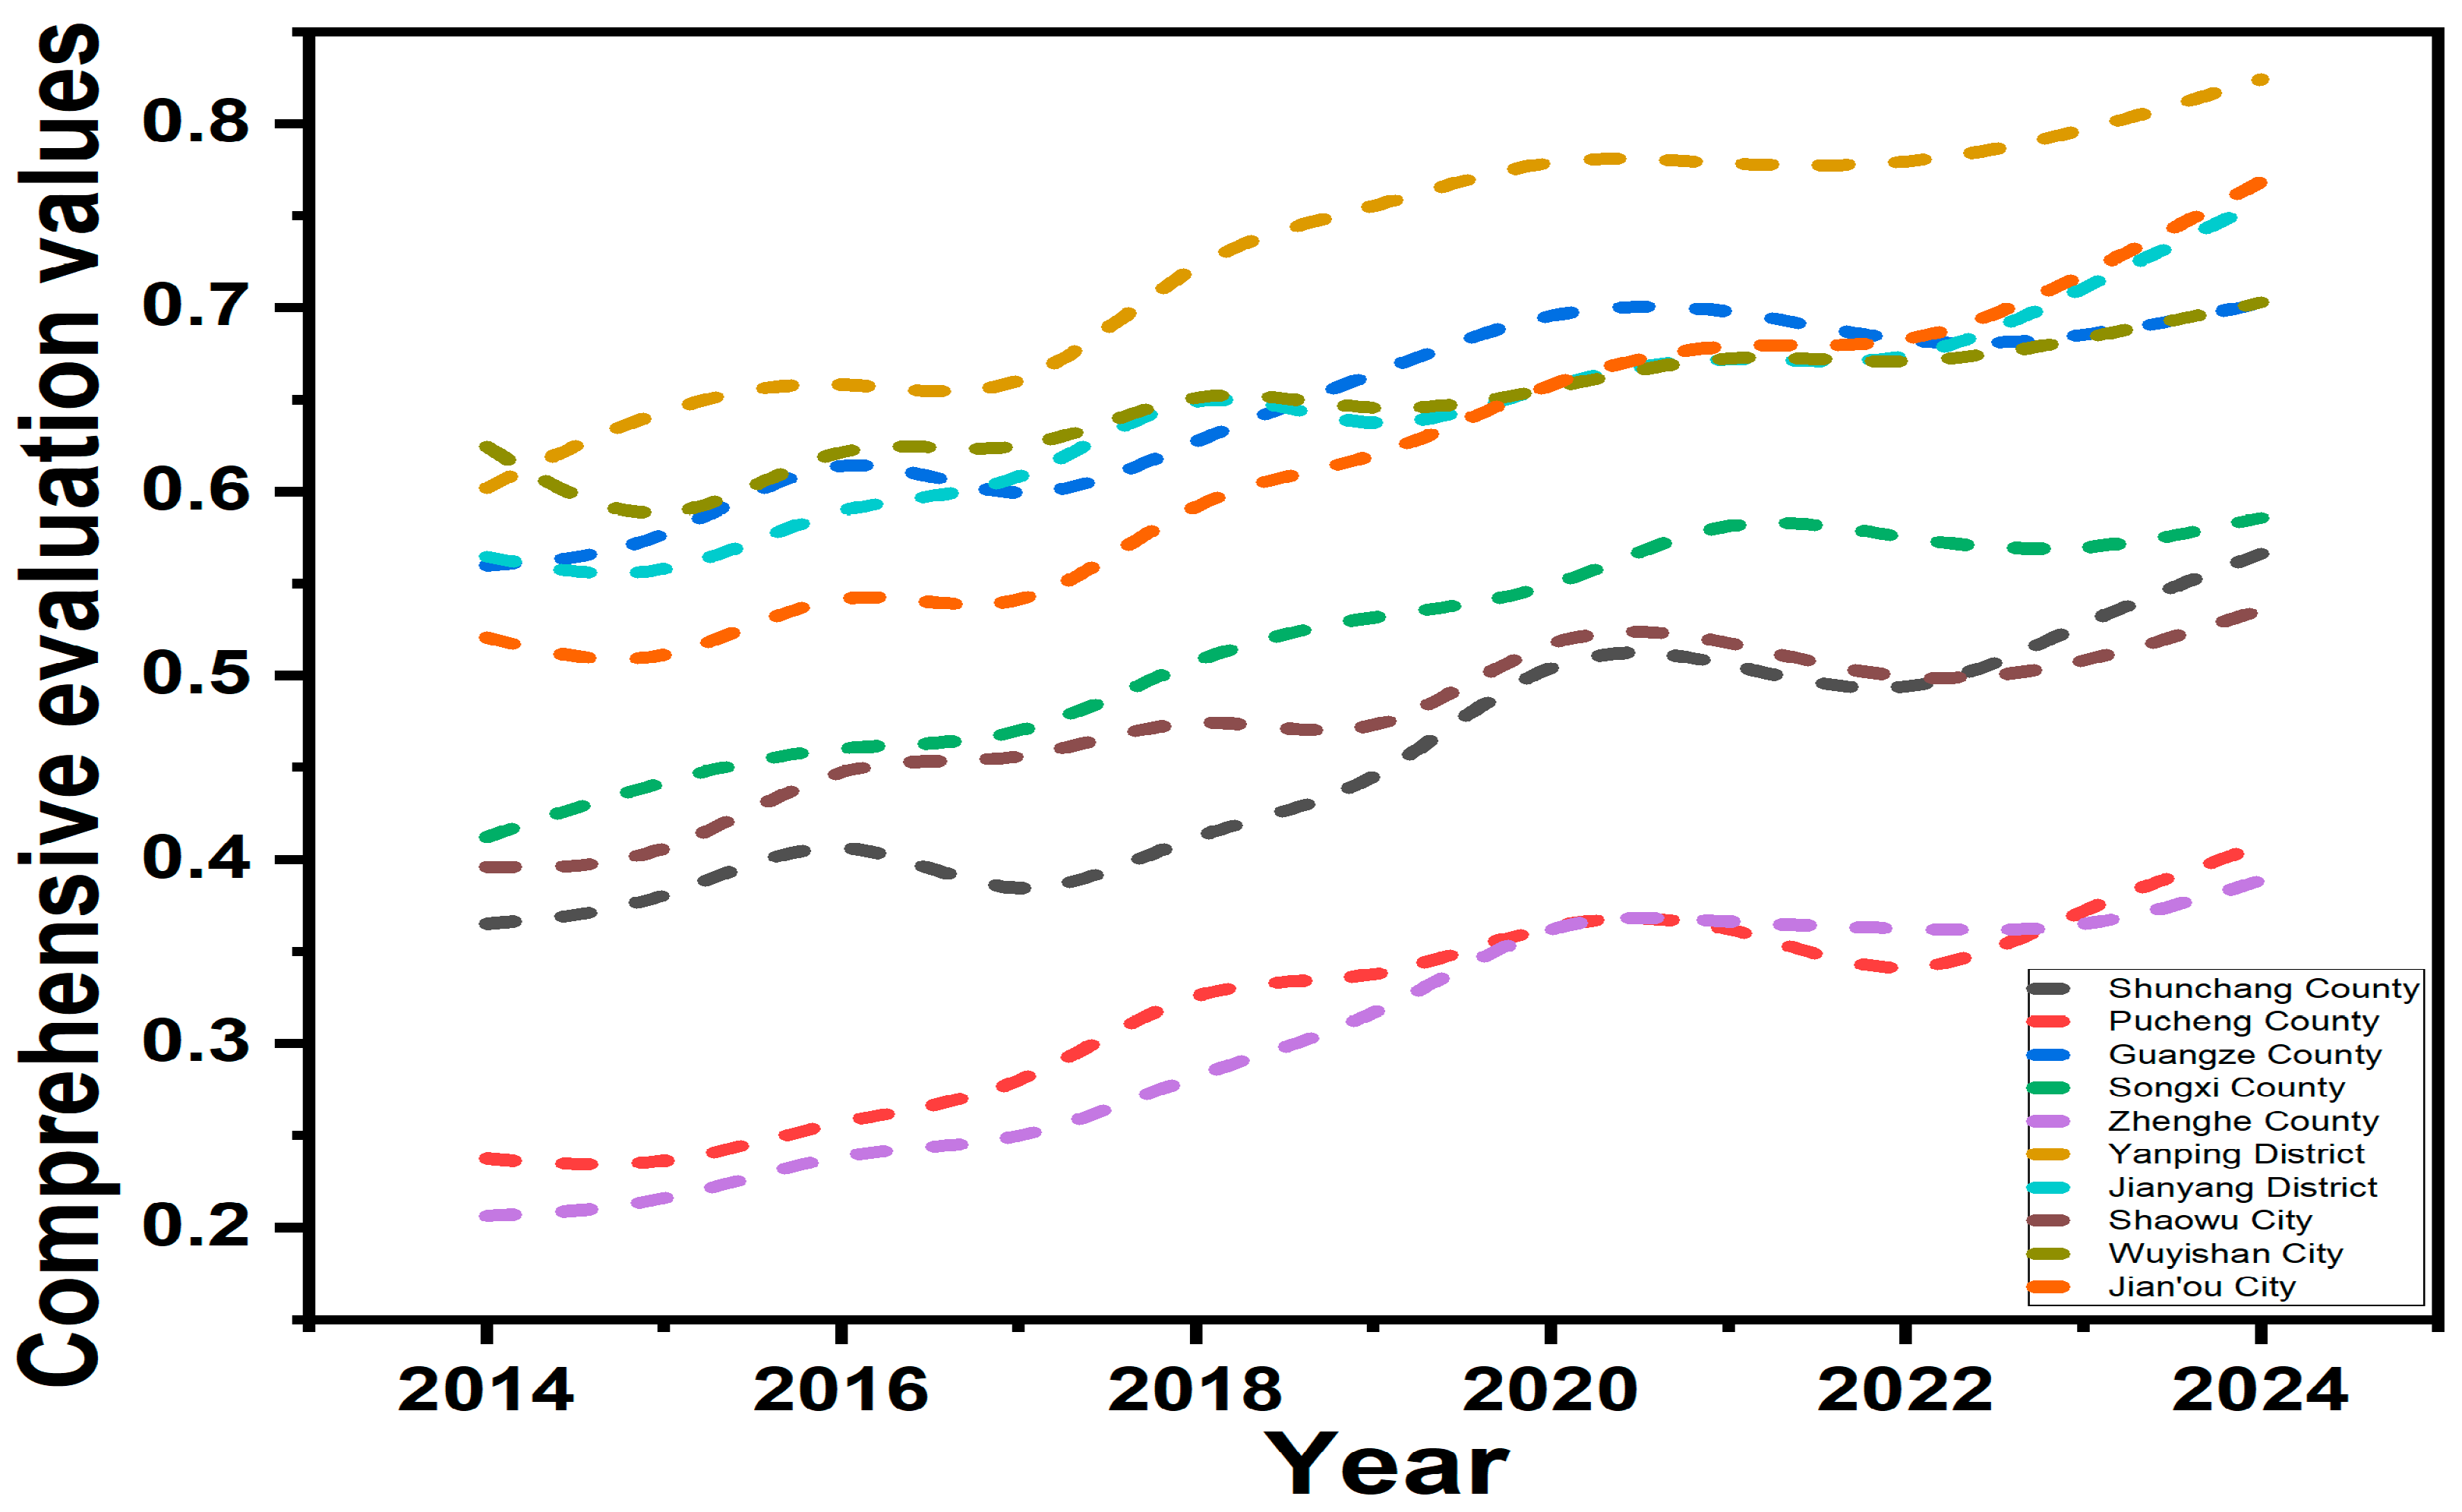
From 2014 to 2024, the comprehensive evaluation value of ecological and environmental protection in all counties (cities, districts) of Nanping City showed a fluctuating growth trend (
Figure 3). The increase of forest coverage, ecological land area, and forest carbon storage, and the improvement of the atmospheric environment (the average concentration of PM
2.5 and O
3 decreases) are the main reasons for the improvement of its ecological and environmental protection level. The number of places with high ecological environmental protection increased, mostly in the central and northern regions (
Figure 4). In 2024, Yanping District, Jian’ou City, Jianyang District, Wuyishan City, and Guangguang County have relatively high ecological environmental protection, indicating that these counties have significant ecological advantages. Through systematic ecological restoration projects and conservation policies, mountains, rivers, forests, fields, lakes, and grasslands have been gradually protected.
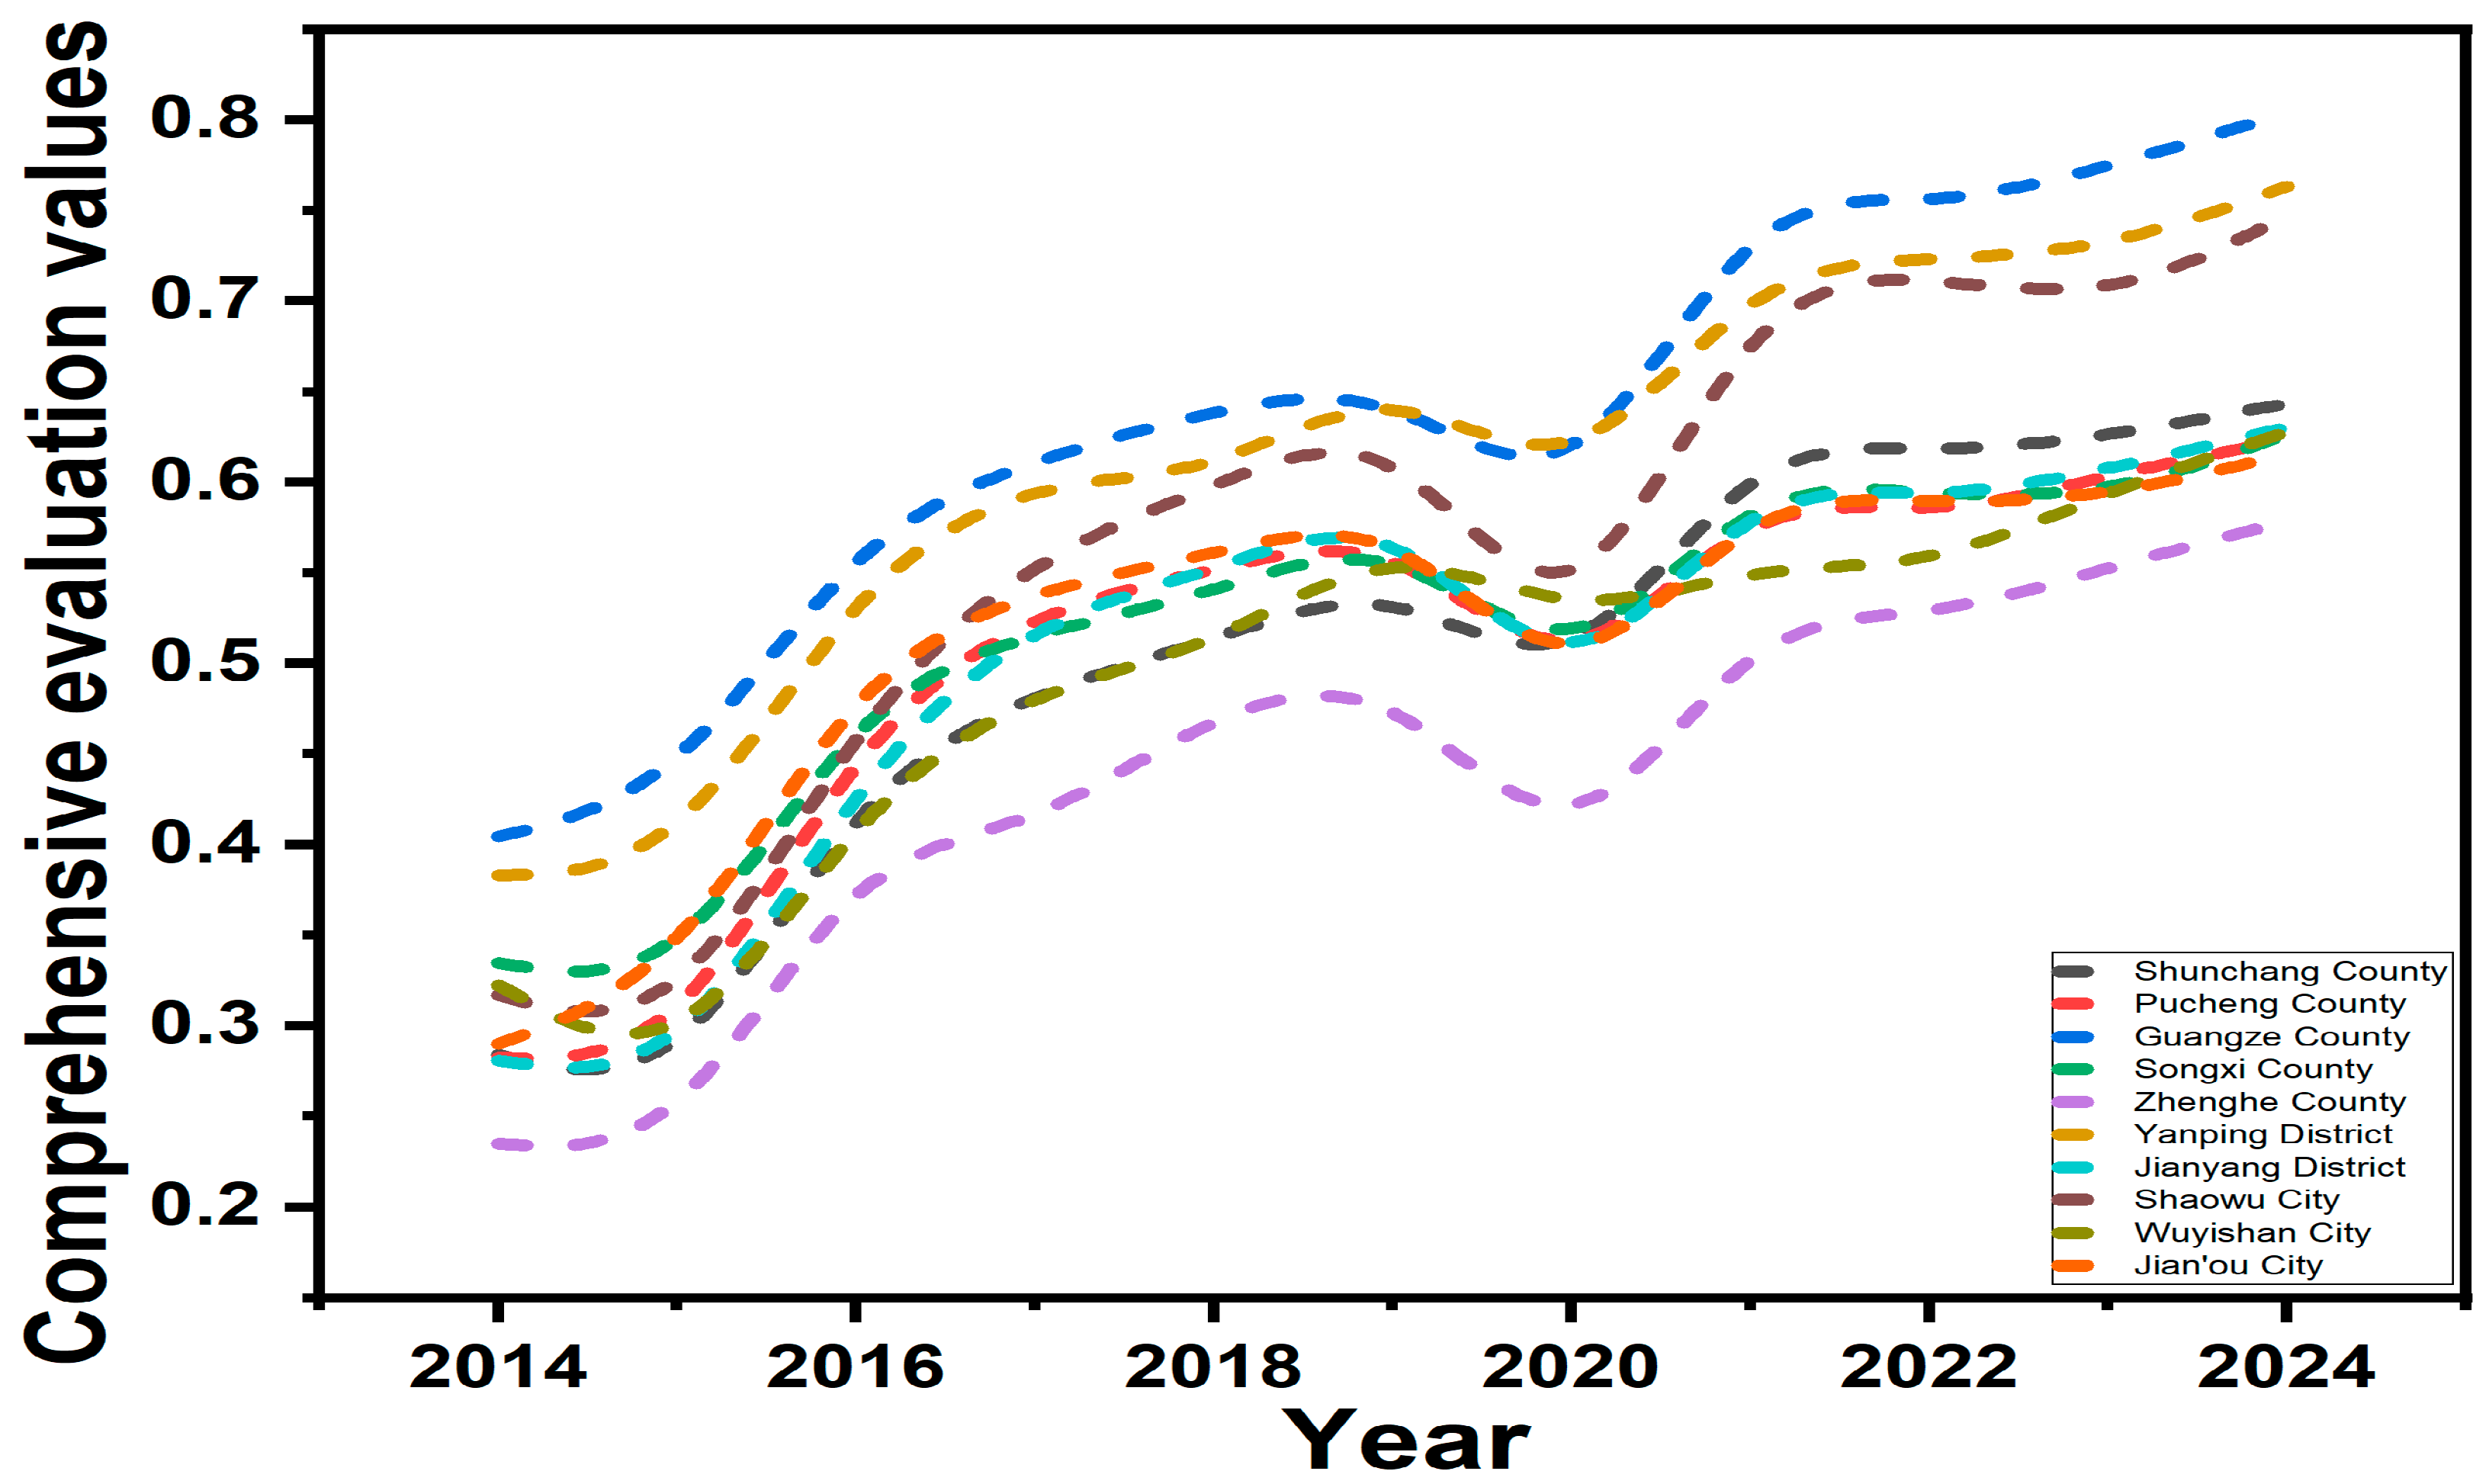
Figure 5 shows that in 2020, the comprehensive evaluation value of economic green transformation in all counties (cities, districts) of Nanping City has declined significantly, which may be due to the impact of the COVID-19 epidemic: for example, the number of tourists in Wuyishan City and Jianyang District, which are the core of natural tourism resources, has plummeted due to the impact of the epidemic, scenic spots have been closed intermittently, and the income of homestays, catering and other industries has dropped sharply; tea, edible mushrooms and other characteristic agricultural products in Guangze County and Shunchang County are facing unsalable due to logistics blockages; Enterprises in industrial concentration areas such as Shaowu City and Yanping District have experienced shutdowns, especially labor-intensive industries (such as textiles, bamboo and wood processing) have experienced a decline in output value due to supply chain disruptions and labor shortages, and the urban unemployment rate has also increased. Except for Zhenghe County, the level of economic green development in other counties has improved significantly from 2014 to 2024, with Guangze County performing particularly well (
Figure 6). This shows that these counties have made remarkable progress in industrial structure adjustment, energy conservation and consumption reduction, technological innovation, etc., and the production mode has gradually become ecological and green, to promote the high-quality development of the local economy.
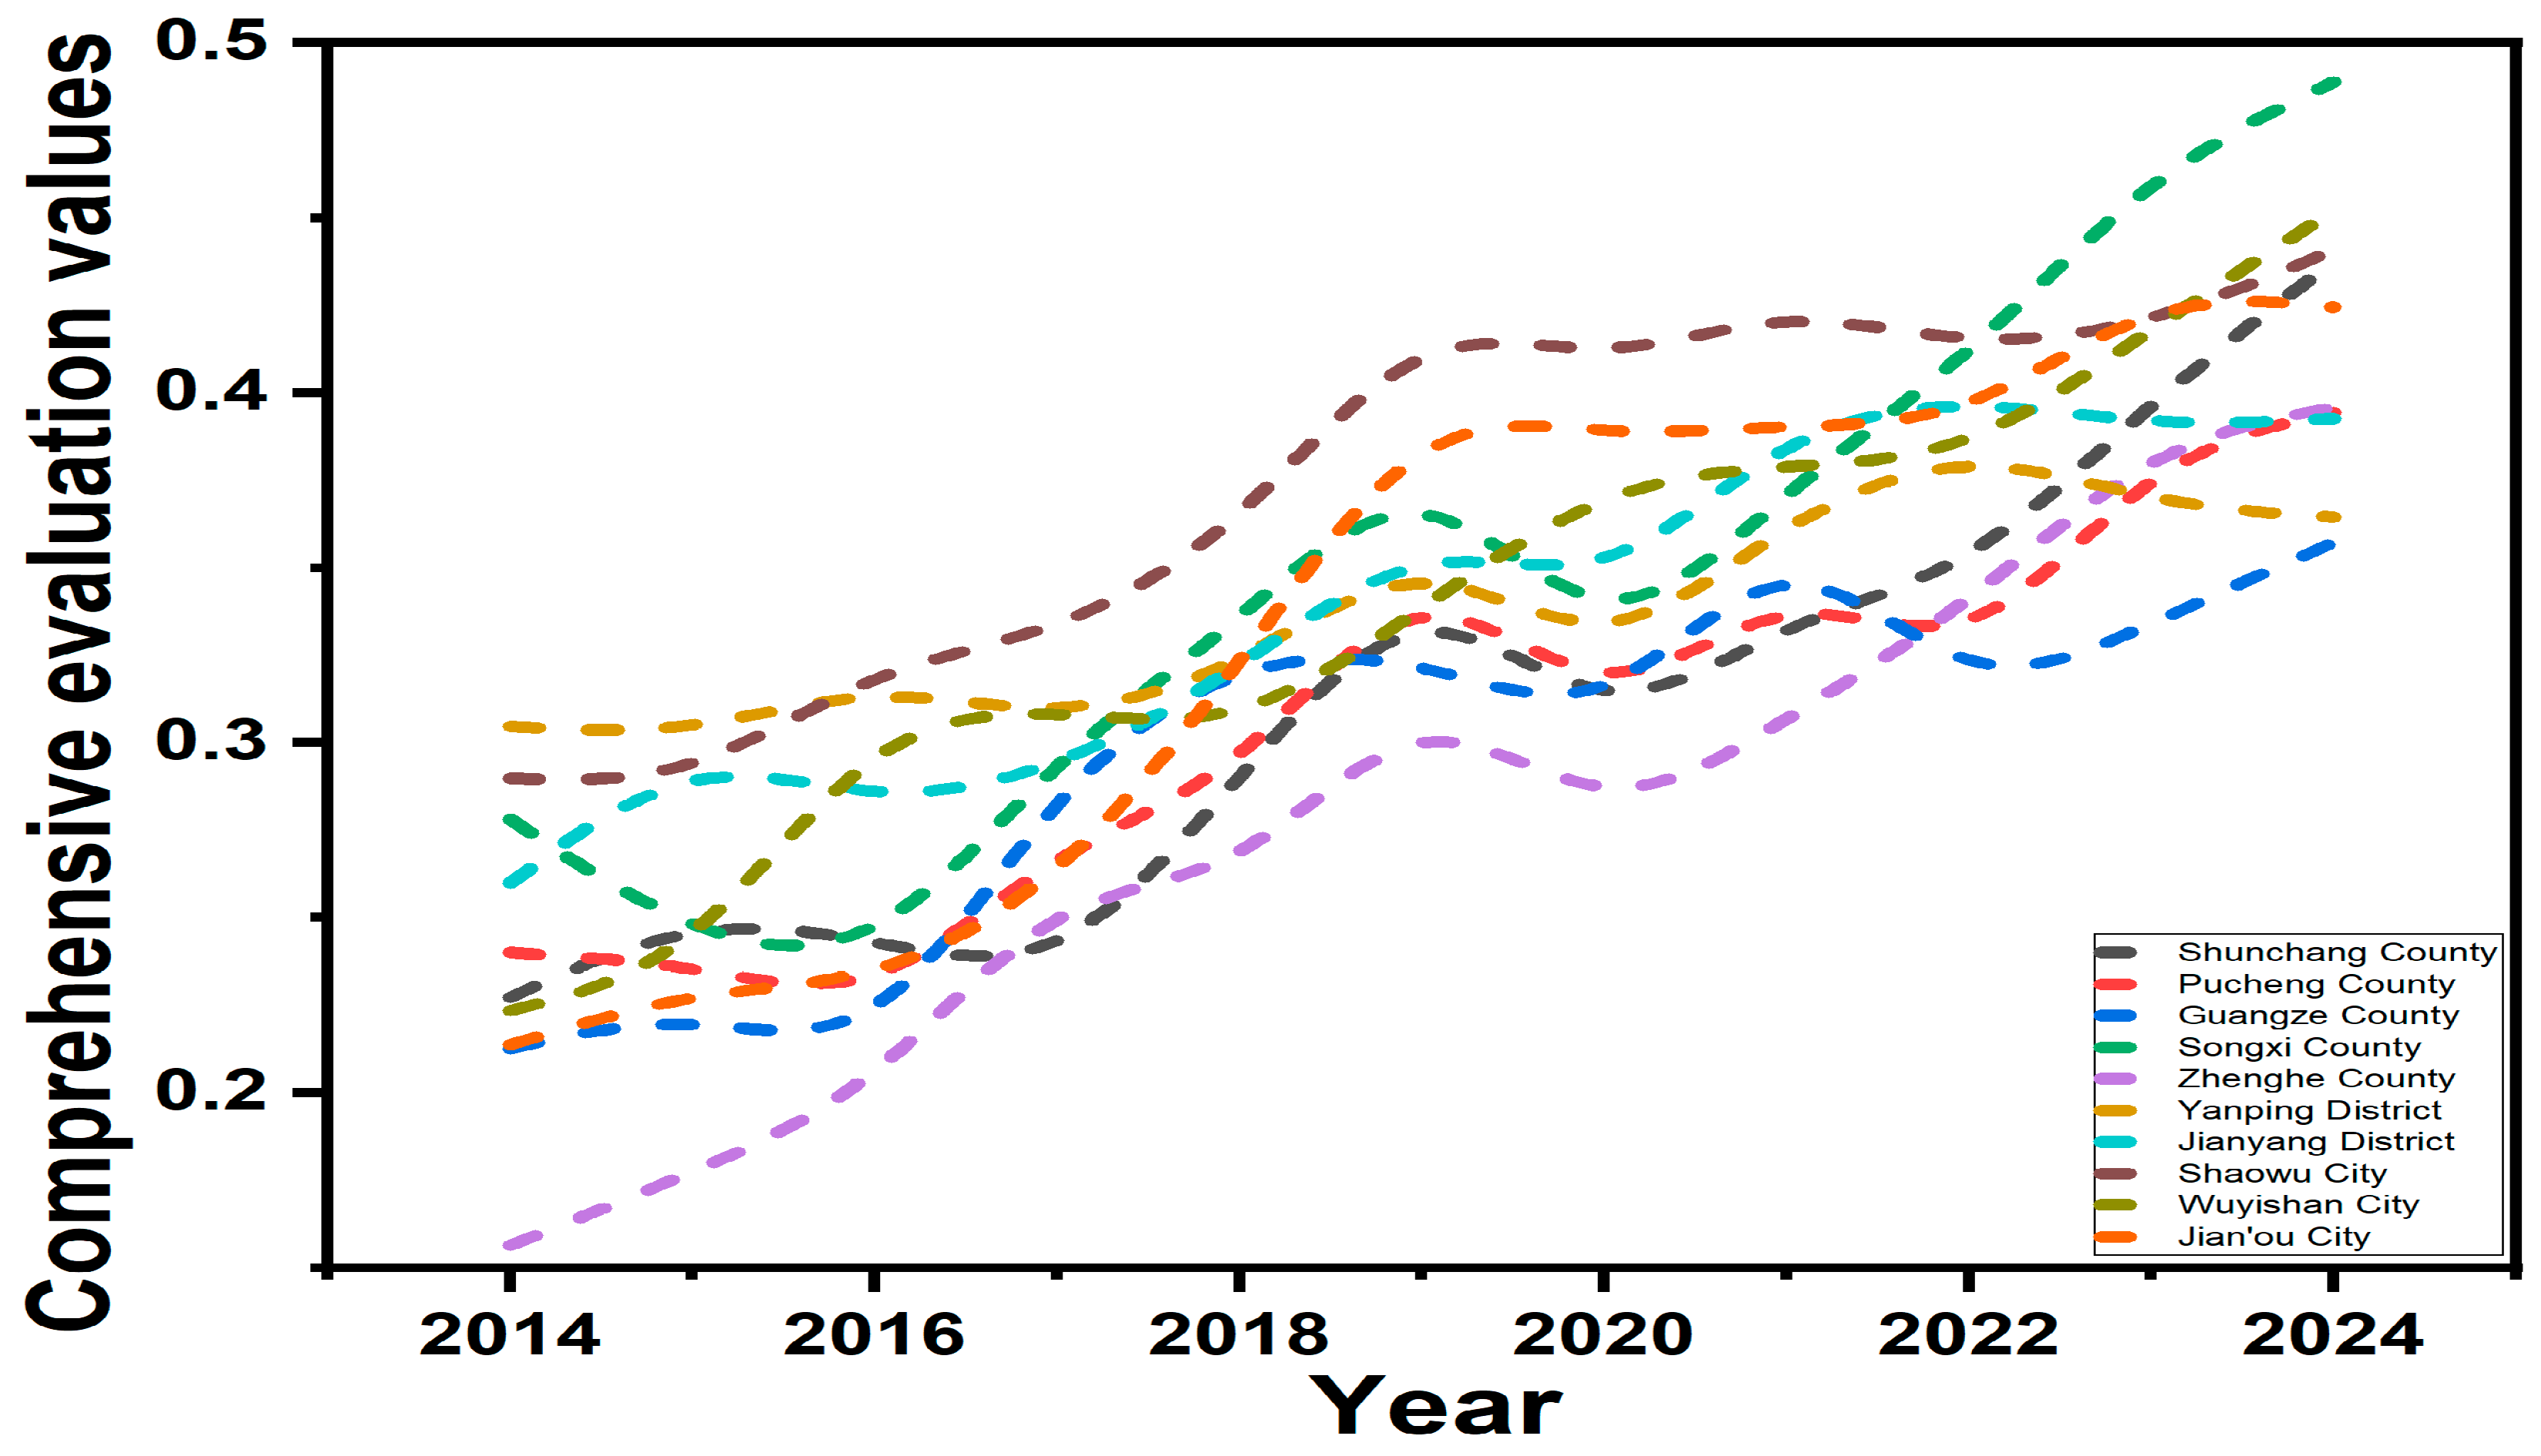
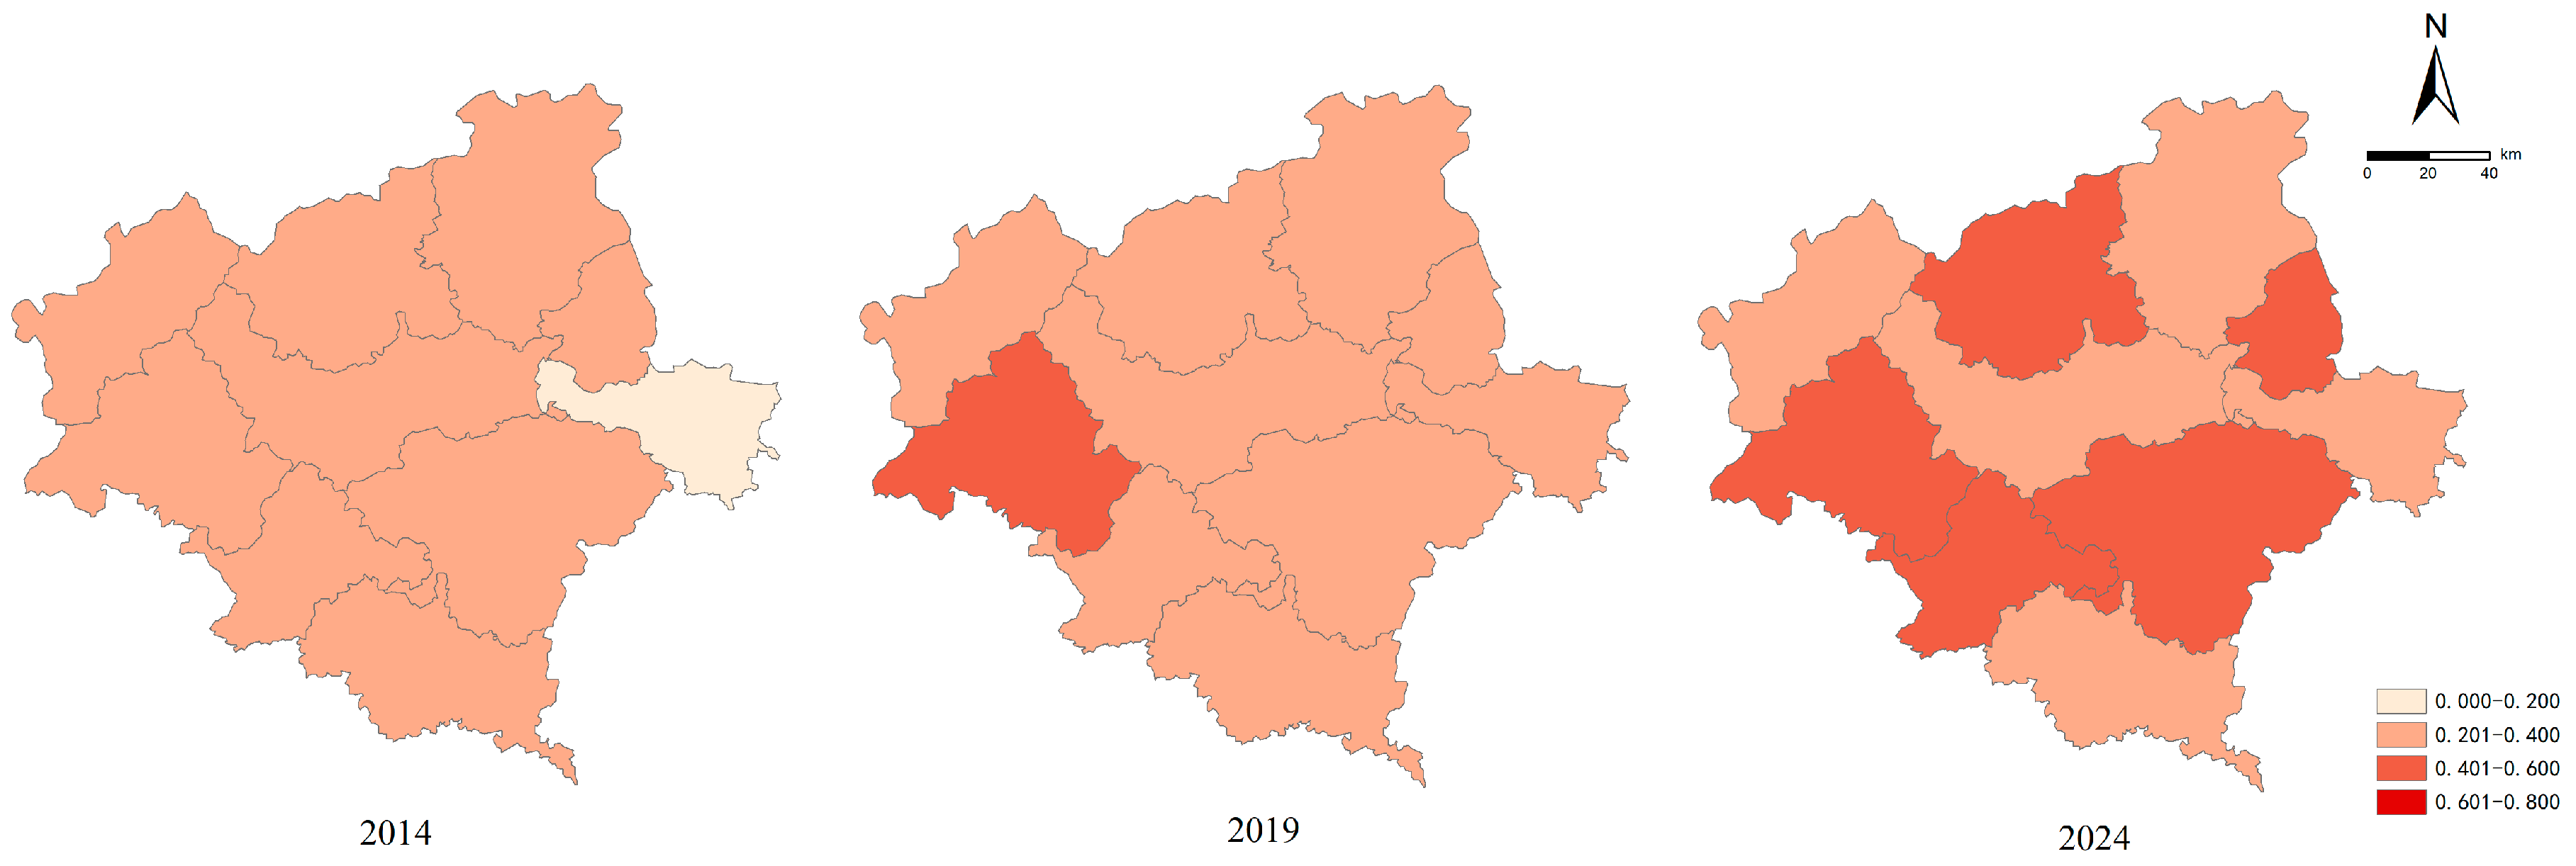
The comprehensive evaluation value of the enhancement of people’s livelihood in various counties (cities, districts) in Nanping City from 2014 to 2024 exhibited a fluctuating growth trend, with an evaluation value ranging from 0.1 to 0.5 (
Figure 7). This value is lower than the comprehensive evaluation value range of ecological environmental protection and economic green transformation. This indicates that the counties (cities, districts) of Nanping City were subject to specific mountainous geographical conditions, inconvenient transportation, poor medical conditions, low urbanization and education levels, and a significant urban-rural gap. The level of improvement in the well-being and livelihood of individuals must be further enhanced. In 2024, Jian’ou City, Shaowu City, Wuyishan City, Songxi County, and Shunchang County had good results in improving residents’ living environments and quality of life (
Figure 8).
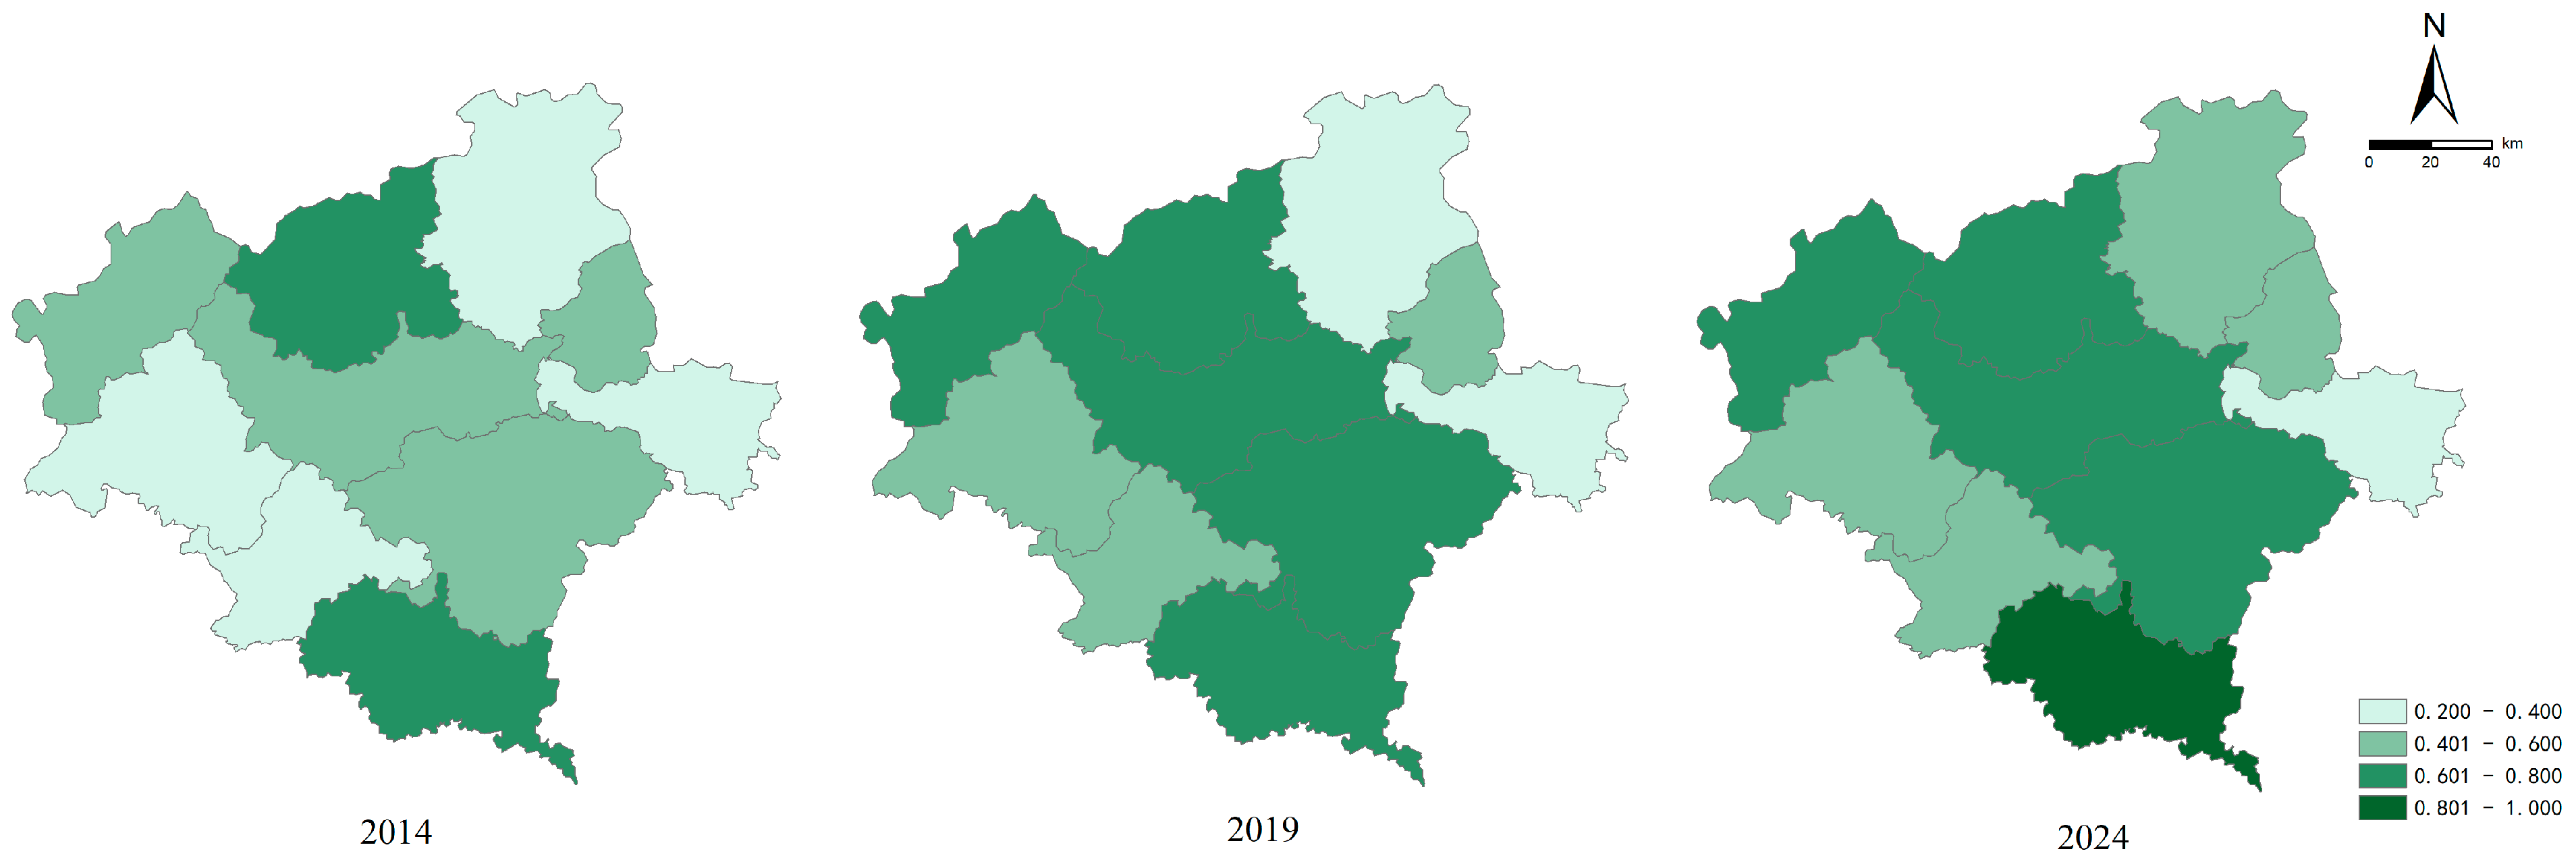
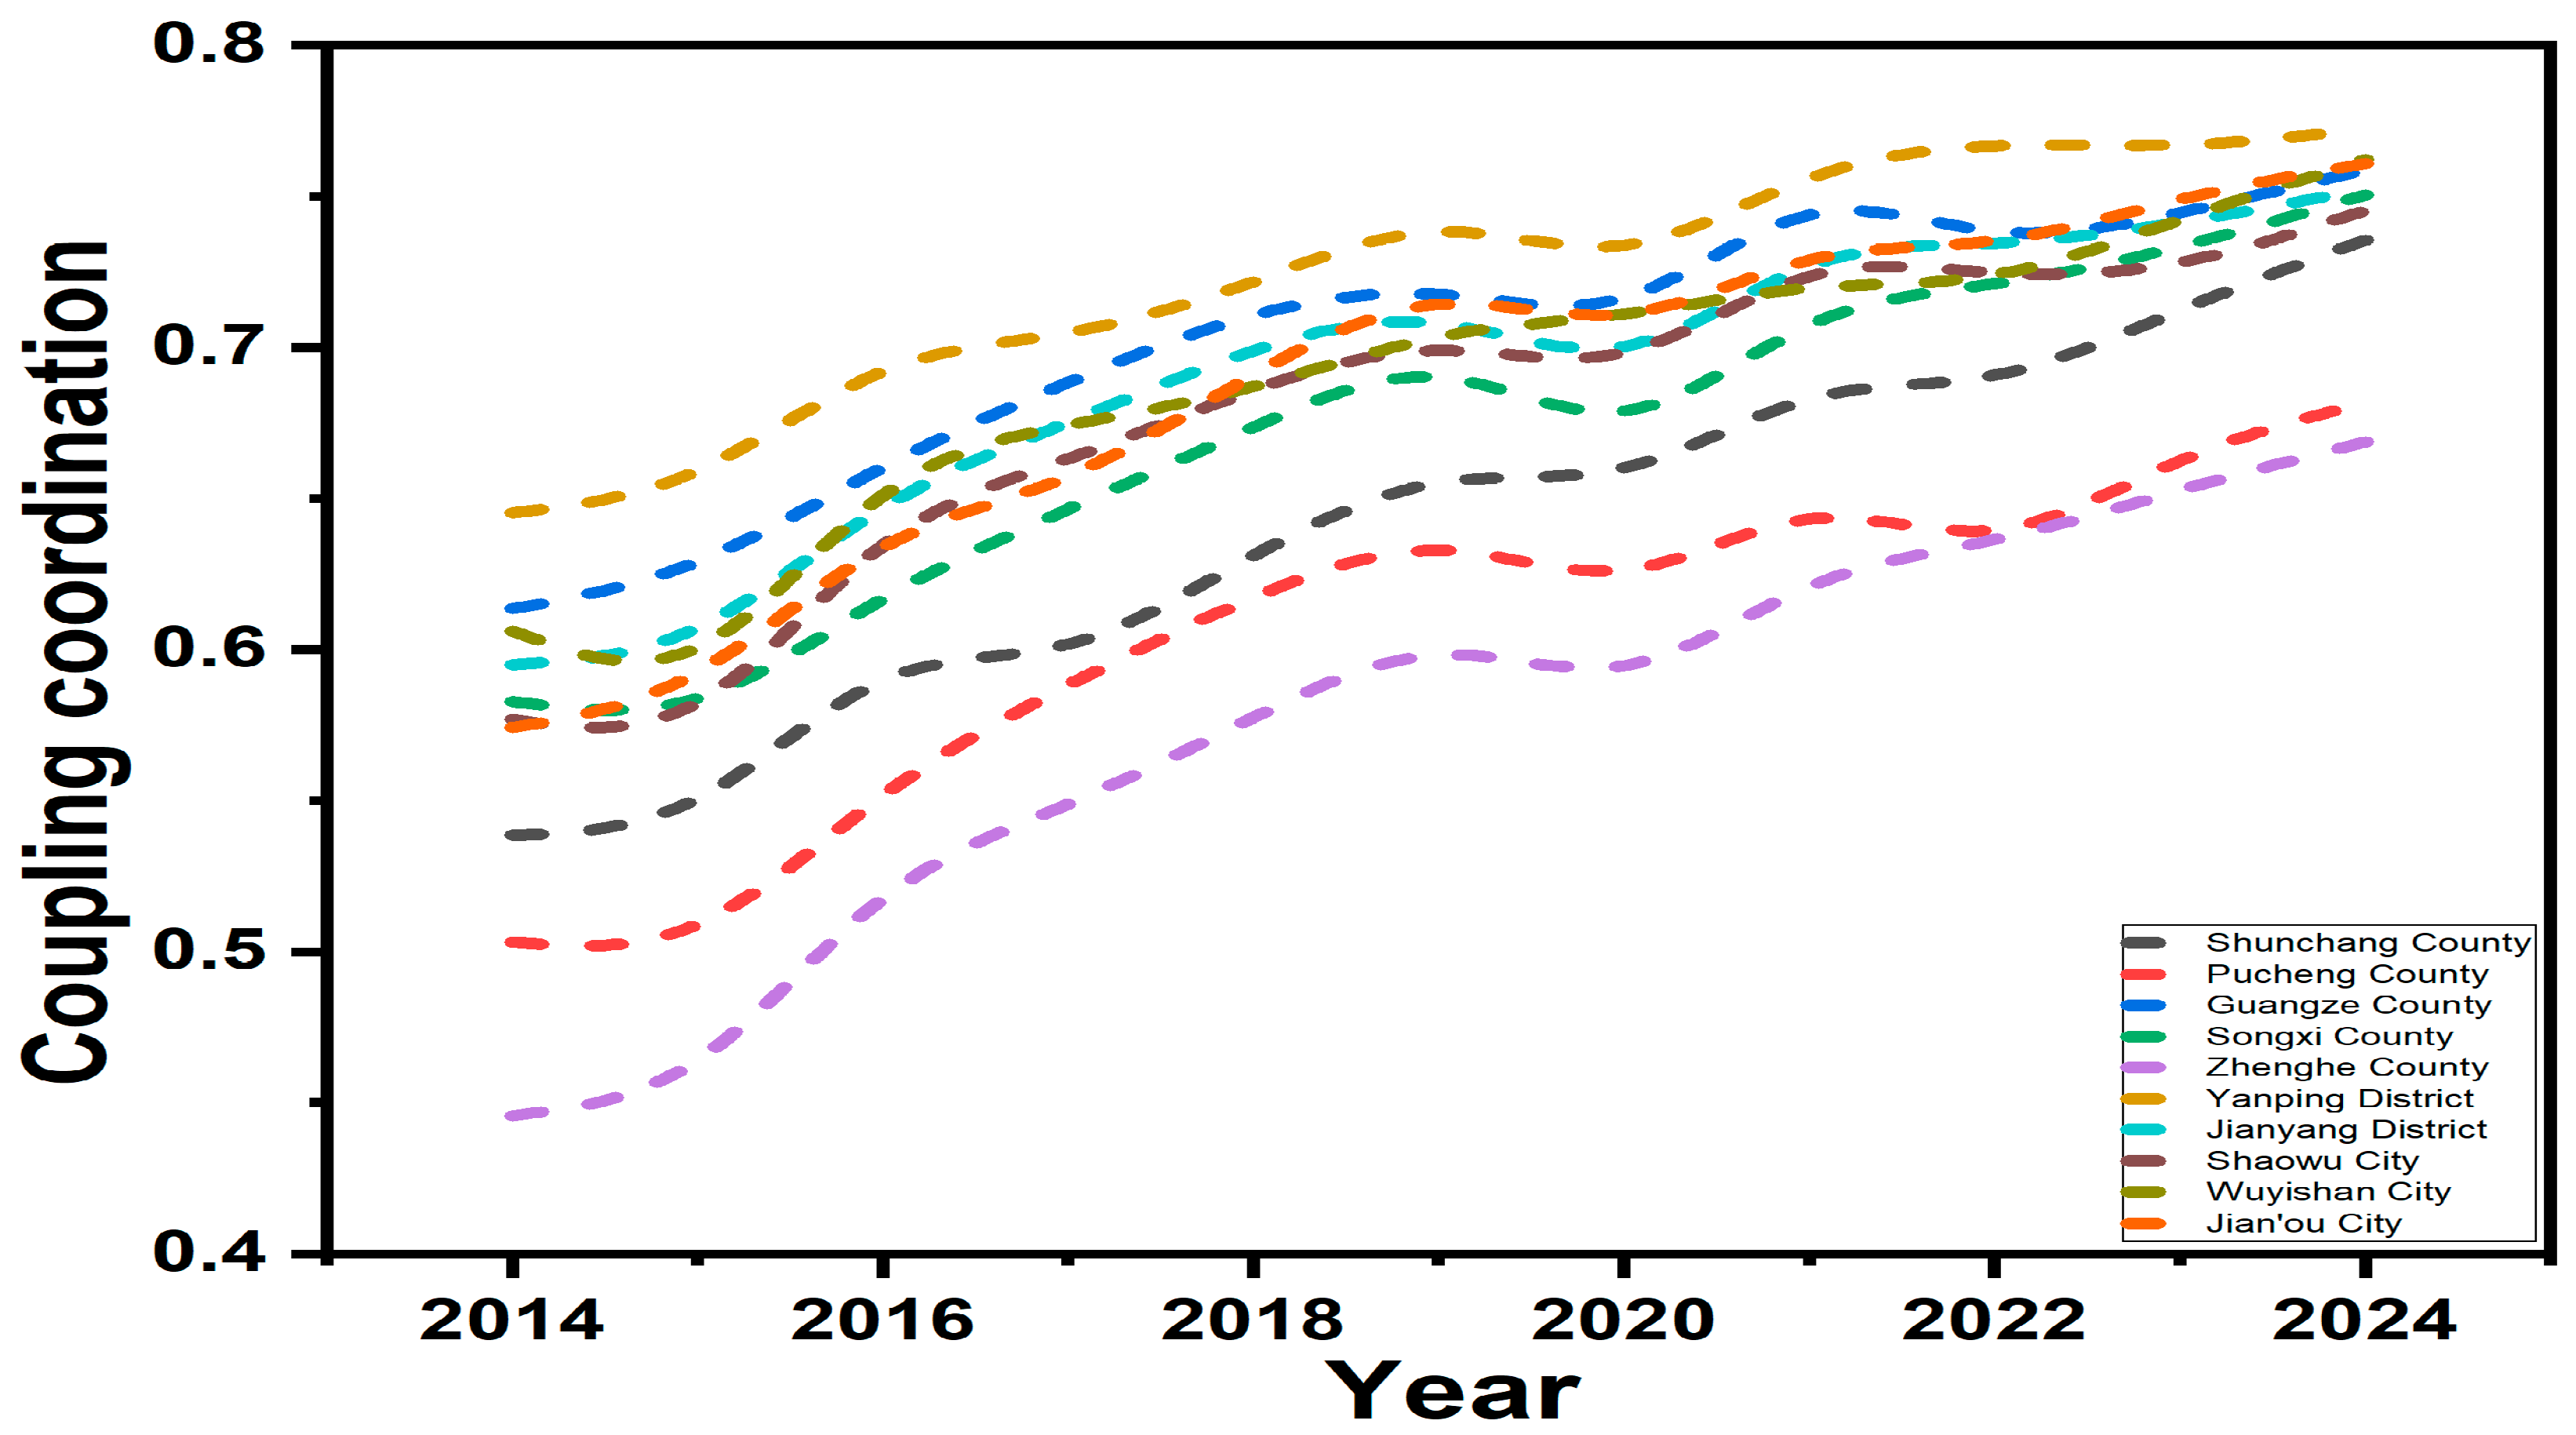
Figure 9 shows that the coupling and coordination degree of the criterion layer of each county (city, district) in Nanping City shows a trend of increasing year by year. In 2014, Zhenghe County was in
US, Yanping District was in
IS, and other counties were in
PS. Yanping District, Jianyang District, Jian’ou City, and Guangguang County were in
IAS in 2019, forming a northwest-southeast belt in the central part of Nanping City. Other counties were in
IS and maintained a block-like accumulation continuity. In 2024, only Pucheng County and Zhenghe County remain in
IS, while the rest were in
IAS (
Figure 10).
The spatial distribution of coupling coordination degree shows a trend of “high in the middle, low in the east and west, high in the south and low in the north” and increasing spatial directivity. The east-west trend line is always “convex” and “high in the middle and low in the east”. Results show that the central county is more prominent in MHCHN than the eastern and western counties. For example, Jianyang District and Jian’ou City outperform Shaowu City and Zhenghe County in economic scale, transportation hub status, green industry innovation, and policy resource acquisition. In the north-south direction, the trend line gradually changed from “low in the middle and high in the north and south” to “high in the south and low in the north”, indicating that central and southern counties performed better than northern counties in MHCHN. For example, Yanping District’s pivotal status and industrial agglomeration effect, and Shunchang County’s river basin management experience and ecological agriculture model provide a modern model of MHCHN with the coordinated promotion of “ecological protection, economic development, and improvement of people’s livelihood” in northern Fujian.
3.3. Dynamic Transfer Characteristics of Coupled Coordination Degrees
3.3.1. Dynamic Transfer of Coupled Coordination Degree Under Unconstrained Conditions
Table 5 shows that: (1) The probability values on the right side of the main diagonal are much higher than those on the left, indicating that the probability of upward transfer of development stage type is significantly greater than that of downward shift, and that coupling coordination is increasing over time. (2) The probability of the
IS remaining in its original state is much higher than the probability of upward transfer, indicating that the “path dependence” and “self-reinforcing lock-in effect” still limit MHCHN in Nanping City’s counties (cities and districts).
3.3.2. Dynamic Transfer of Coupling Coordination Degree Under Geographic Neighborhood Constraints
Table 6 shows that: (1) adding the spatial lag factor significantly changes the transition probability of each development stage type compared to the traditional Markov transfer probability matrix. Under different spatial lag types, the probabilities of
US to remain unchanged are 0, 0.333, 0, 0, respectively, the
PS to remain unchanged is 0, 0.462, 0.5, the
IS to remain unchanged is 0, 1, 0.684, 1, and the
IAS to remain unchanged is 0, 0, 0.813, 1, while in the traditional Markov transfer probability matrix, the probabilities of the
US,
PS,
IS and
IAS remaining unchanged are 0.333, 0.476, 0.75, and 0.893. (2) The type of development stage is synergistic with the degree of coupling coordination. The number of counties in
PS,
IS, and
IAS is significantly higher than the number of counties in other types during the t period when the domain types are
PS,
IS, and
IAS. (3) The probability of the county’s development stage type shifting downward increases when it is situated near a county with a lower development stage. For instance,
. In contrast, the probability of the county’s development stage type moving upward increases when it is situated near a county with a high development stage. For instance,
. (4) The probability of upward transfer of the development stage type is greater when adjacent to a county with a high development stage and less when adjacent to a county with a low development stage, such as
,
.
As shown in
Table 7, the
values are greater than the critical value of the threshold value of
, and the
value is less than 0.005, therefore, reject the assumption that the type of transition of the development stage is spatially independent of each other.
3.4. Drivers of Modernization of Harmonious Coexistence Between Humans and Nature in Nanping Counties (Cities and Districts)
3.4.1. Temporal Heterogeneity Analysis of Drivers
The previous research results [
45,
46,
47,
48,
49,
50], the actual situation of Nanping City, and relevant expert opinions were used to finally explore the driving mechanism of MHCHN in each county (city, district) of Nanping City from five dimensions:
(1) Economic driving force. MHCHN depends on a solid economic foundation, transforming the industrial structure into a green, low-carbon, and circular system and creating a coordinated development pattern of green economic development, ecological security, and livelihood improvement. Thus, the county’s economic growth and industrial structure transformation are measured by per capita GDP and the proportion of the added value of the secondary and tertiary industries in GDP.
(2) Social facilitation. Social concepts, population quality, and other factors affect MHCHN, so strengthening social education and public awareness of environmental protection is essential for promoting ecological environmental protection. The number of ordinary middle school students per 10,000 people is used to measure social civilization.
(3) Scientific and technological support. Science and technology are the main productive forces that can upgrade industries and move production towards low-energy, low-emission models. Thus, science and technology spending in the general public finance reflects innovation.
(4) Resource agglomeration. Resource agglomeration affects regional economic development, and population agglomeration or diffusion affects MHCHN. Thus, population density reflects resource agglomeration.
(5) Government regulation and control. The government can regulate and control macroeconomics through policy guidance and financial support, and optimize resource allocation to ensure the harmonious coexistence of man and nature in modern development. The proportion of fiscal expenditure in GDP reflects government regulation and control.
The final inquiry factors are shown in
Table 8.
Per capita GDP has always been an important factor in MHCHN, as shown in
Table 9. Other factors vary by year. In 2014, per capita GDP and population density were the main factors affecting MHCHN. In 2019, the number of ordinary middle school students per 10,000 people and per capita GDP were the main factors. In 2024, the impact of per capita GDP, the proportion of added value of secondary and tertiary industries in GDP, and the proportion of fiscal expenditure in GDP gradually increased, becoming key influencing factors. The time series analysis of the influencing factors shows that MHCHN in Nanping City’s counties (cities and districts) has the development characteristics of resource agglomeration, social civilization progress, economic development, and government policy regulation and control at different times.
3.4.2. Spatial Heterogeneity Analysis of Drivers
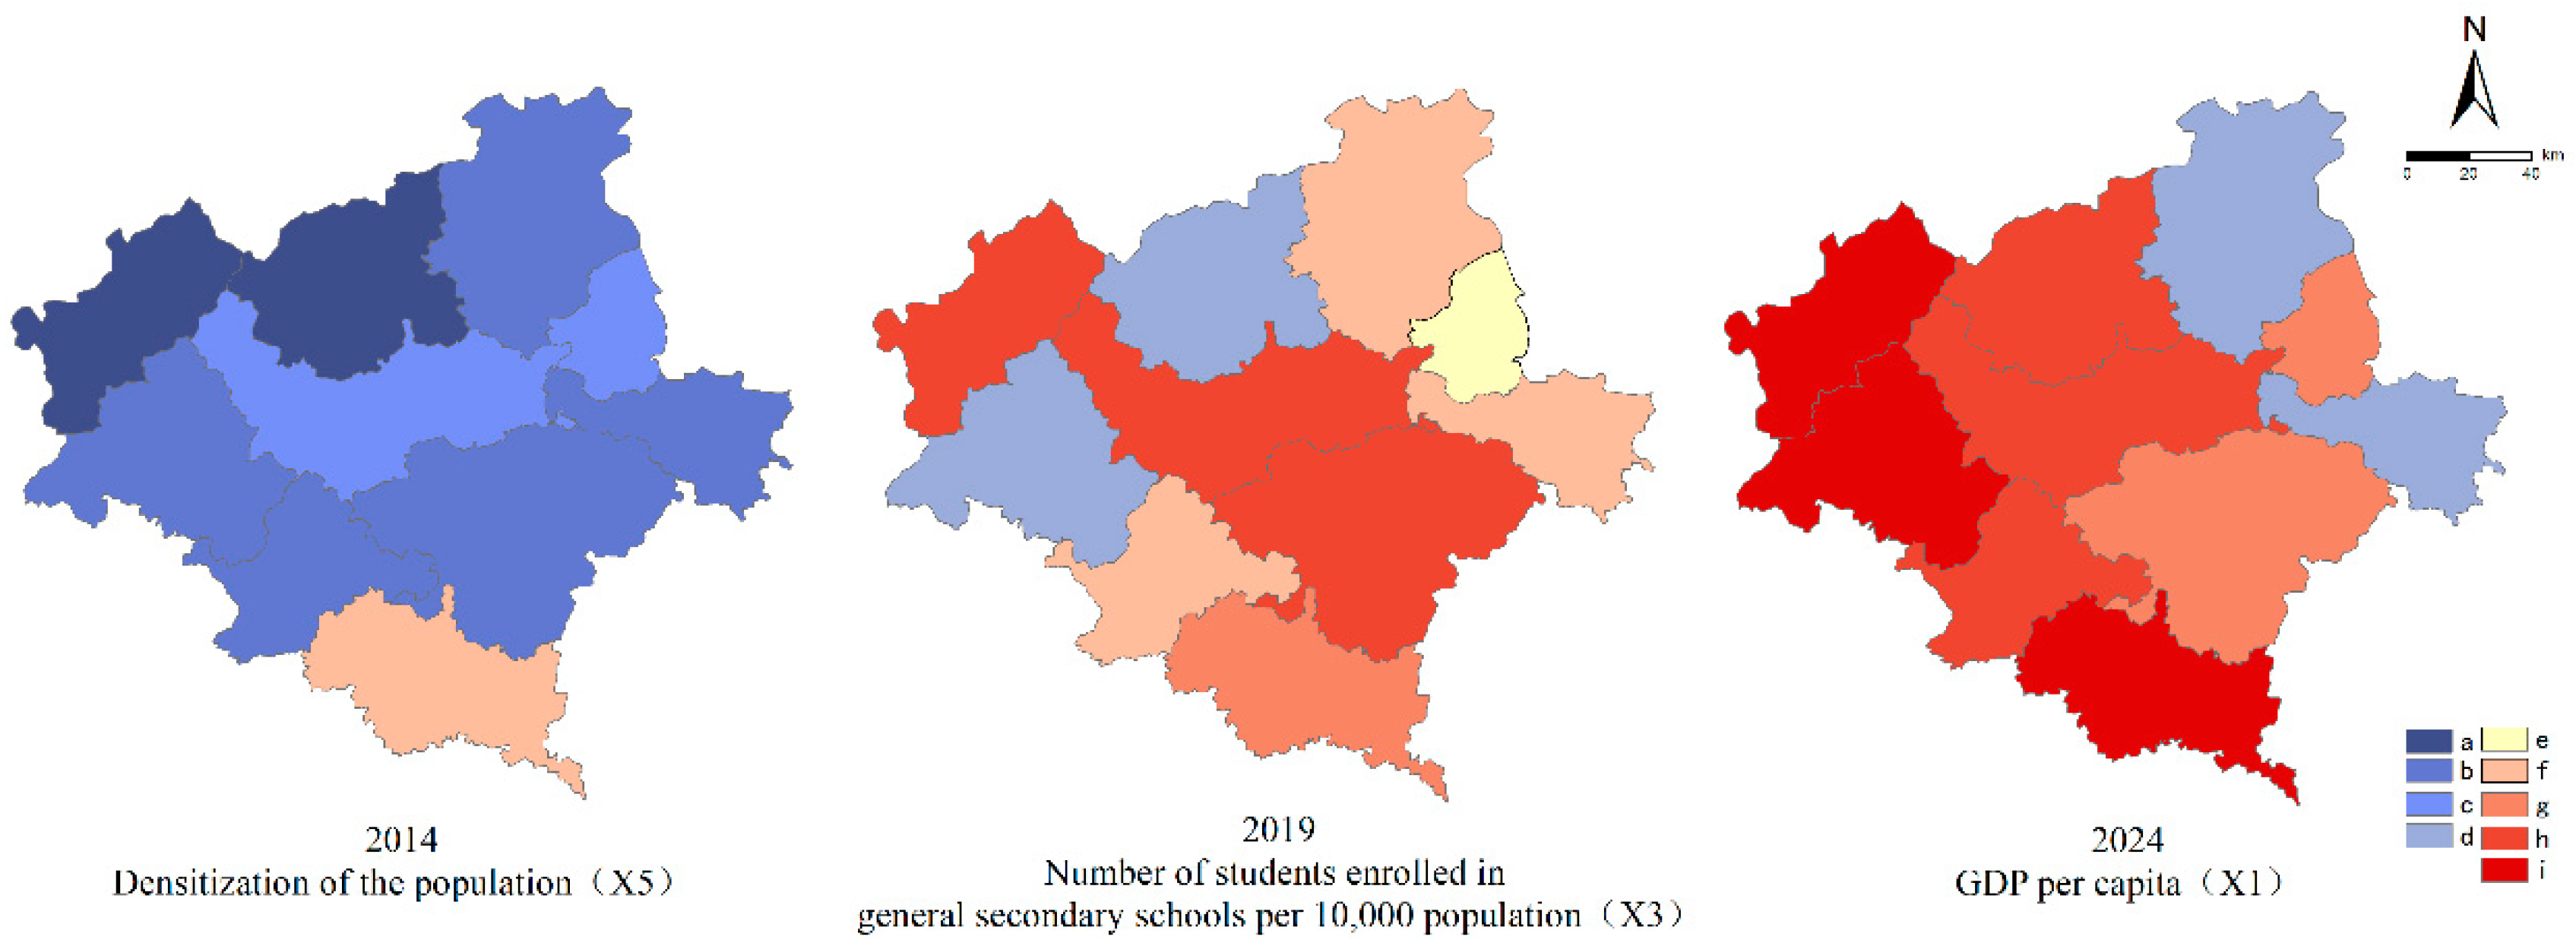
To further examine the regional disparities in the influencing factors and the current state of MHCHN, the significant influencing factors from 2014 and the principal influencing factors from 2019 and 2024 (to prevent redundancy) were identified. ArcGIS 10.8 was employed to align the coupling coordination degree classification with the cluster classification of each detection factor.
Figure 11 shows that in 2014, most counties had low coordination with low factor level and low coordination with medium factor level, Jianyang District and Songxi County had low coordination with high factor level, and Yanping District had medium coordination with high factor level. Guangguang County, Jianyang District, and Jian’ou City had high coordination with high factor level in 2019, while Shunchang, Zhenghe, and Pucheng counties had medium coordination with high factor level. Wuyishan, Jianyang, and Shunchang counties had high coordination with medium factor level in 2024, while Guangguang, Shaowu, and Yanping districts had high coordination with high factor level.
4. Discussion
4.1. The Dynamic Evolution of the Modernization of Harmonious Coexistence Between Humans and Nature
MHCHN is gradually achieving results, and the development gap between counties is gradually decreasing. From 2014 to 2024, all counties (cities and districts) in Nanping City were promoting ecological environmental protection, green economic transformation, and the improvement of people’s livelihood through overall promotion. For example, Yanping District adheres to the development path of “ecological priority, circular economy, and technology empowerment”; Shaowu City adheres to the development strategy of “ecological priority and green development” as the core; Guangguang County is committed to building a “zero-waste city” and “China Ecological Food City”, and promoting the “Xingfuli Community Elderly Care Model”. However, the economic development and social livelihood of numerous counties have been impacted by the COVID-19 epidemic in 2020, resulting in a decline in development.
Pucheng County and Zhenghe County, which are currently in the
IS, have a generally favorable ecological environment. However, they are currently facing the challenges of agricultural and industrial pollution and environmental protection. The economy is primarily driven by agriculture and tourism, and the industrial structure requires diversification and modernization. While the urban-rural gap and the balanced development of public services are improving, the existence of “path dependence” and “lock-in effect” restricts their evolution in the IAS. Over time, counties in the US and PS disappeared, while counties in the IS evolved from block aggregation to point aggregation, and counties in the IAS evolved from point dispersion to block aggregation. This spatial pattern evolves due to spatial synergistic response and balanced coupling coordination, similar to Liu Yunda’s results on agricultural green development in Jilin Province [
51].
High-development counties radiate and drive surrounding counties by cooperating and exchanging in areas such as ecological and environmental protection, industrial cooperation, infrastructure construction, and public service sharing, thereby promoting their development. This is consistent with the research results of Song Chengzhen et al. on urban transformation in the Yellow River Basin [
52]. Jianyang District, Wuyishan City, Shaowu City, and Guangguang County signed the “Framework Agreement on Joint River Protection and Water Purification and Chaos Control Action” to protect the Minjiang River headwaters; Yanping, Shaowu, Shunchang, and Guangguang jointly conducted the Futun River patrol operation to coordinate the crackdown on illegal sewage discharge and sand mining, and implemented a regional poverty alleviation coordination mechanism. Thus, to promote MHCHN in Nanping City’s counties (cities and districts), spatial factors must be fully considered, counties in the high development stage must play their leading role, inter-regional cooperation and exchanges must be strengthened, and resource sharing and complementary advantages must be realized.
4.2. Drivers of the Modernization of Harmonious Coexistence Between Humans and Nature
The population factor was necessary for MHCHN at the start of the study due to the unique mountainous geographical conditions. Yanping District, Nanping City’s government station, economic powerhouse, transportation hub, and population gathering place, supports the harmonious coexistence of man and nature in modern development and has a development level far above other counties. By the middle of the study, population and resource factors decreased, and the social civilization promotion force increased. Chen Meijing et al. [
53] researched green transformation in Guizhou Province, proving the important impact of social change and development on the green transformation of the “three livelihoods” system. Guangze County, Jianyang District, Jian’ou City, Shunchang County, Zhenghe County, and Pucheng County increased public awareness and participation in environmental protection through ecological and environmental protection education, spread green lifestyles, and effectively promoted MHCHN. At the end of the study, the economic driving force and government regulation force have become the main influencing factors for MHCHN. Wei Guoen et al. [
54] further emphasized the key role of economic growth in the study of the mechanism of transformation of the “three livelihood space” pattern in Poyang Lake District. Guangze County, Shaowu City, Yanping District, Wuyishan City, Jianyang District, and Shunchang County focus on green economy and industrial upgrading according to their characteristics and implement active financial policies to support industrial development. However, Jian’ou City, Songxi County, Zhenghe County, and Pucheng County are facing the common dilemma of economic development of “slow transformation of large agricultural counties and difficult upgrading of small industrial counties.”
5. Conclusions and Recommendations
Scientific indicators to assess MHCHN are essential to turning abstract ecological civilization into actionable and measurable governance practices. This study analyzes the dynamic evolution and driving factors of Nanping’s harmonious man-nature coexistence from 2014 to 2024. The main conclusions are:
(1) From 2014 to 2024, as society developed and ecological civilization deepened, the coordinated development level of the three sustainable pillars of nature, economy, and society in all counties (cities, districts) of Nanping City increased, narrowing the coupling and coordination gap and balancing overall development. The spatial distribution of coupling coordination degree is “high in the middle, low in the east and west, high in the south and low in the north” and block-patterned, indicating synergistic response.
(2) Path dependence and lock-in effects affect the coupling coordination degree. The spatial hysteresis factor influences the coupling coordination type, and the spatial spillover effect and heterogeneity are clear.
(3) Overall, economic driving force, social promotion, scientific and technological support, resource agglomeration, and government regulation and control promote harmonious coexistence between man and nature.
To promote the further improvement of the level of MHCHN in all counties (cities, districts) of Nanping City and achieve sustainable development, based on the above analysis and combined with the actual situation of Nanping City, several countermeasures and suggestions are put forward:
(1) Prioritize ecology and protect the environment
Promote the “clear water, blue sky, and pure land” project by systematically integrating mountains, rivers, forests, fields, lakes, and grasslands, ensuring that the proportion of high-quality water quality and excellent days meets the standard remains stable and tends to increase, and modernizing the ecological environment governance system and governance capacity; Promote soil and water conservation in Nanping City, build comprehensive soil erosion control projects, and actively promote and educate young people about soil and water conservation; To maintain the area of nature reserves, prioritize ecological protection and accelerate the creation of a nature reserve system with Wuyishan National Park as the core, nature reserves as the foundation, and various natural parks as supplements.
(2) Grow green industries and increase eco-product supply
Follow the idea that “green waters and green mountains are golden mountains and silver mountains”, prioritize the development of seven complementary green industries, accelerate the construction of a new green industry system, and increase the added value of green industry scale; take advantage of the country’s first pilot district and city of the ecological product value realization mechanism in natural resources, explore the diverse path of ecological product value, formulate implementation plans, and promote ecological product investigation, confirmation, quantification, and evaluation. Protect natural capital, actively respond to national energy conservation and emission reduction policies, eliminate backward and low-energy production capacity, and invest in sewage, air, solid waste, and other facilities. While building green industry innovation service platforms, deepen green industry scientific and technological innovation incentive policies to encourage enterprises to improve their capabilities and cultivate new quality productivity for green industry development.
(3) Improve livelihoods, well-being, and residents’ gains and happiness
Promote urbanization, give urban residents a variety of employment and income options from urban and industrial development, and ensure steady income growth. The local governments of Nanping City should continue to strengthen guidance, encourage more villages to develop edible mushrooms, grapes, tea, and other local industries, drive the village collective to increase income and the masses to get rich, improve rural infrastructure and public services, promote educational equity, and implement regional coordinated development strategies to improve rural residents’ living standards.
6. Deficiency
This study only briefly discusses the dynamic evolution process and driving factors of MHCHN in Nanping City’s counties (cities, districts) based on 10-year data. The deeply interconnected relationship and influencing factors between the three sustainable pillars of nature, economy, and society have not been fully examined due to the short research period. MHCHN involves ecological environmental protection and restoration, scientific and technological innovation and industrial development, ecological civilization infrastructure construction, ecological cultural system construction, and other aspects. To ensure the comprehensiveness and reliability of the research results, in the future, we will expand the period, consider more indicators, and deeply analyze the driving mechanism of various factors for MHCHN.
