1. Introduction
Biocomposites are now well recognized for their role in promoting sustainability across multiple manufacturing industries such as automotive, construction, packaging, textiles, etc. [
1]. Researchers are increasingly focusing on biocomposite material options to meet the demand for lighter structural products while addressing environmental concerns. These materials, which combine natural fibers such as jute, hemp, flax, and cotton with bio-based polymer matrices, offer a renewable and biodegradable alternative to traditional composites [
2,
3]. Among plant-based natural fibers, hemp with legally permitted cultivation in Canada has received growing interest for biocomposites production given its impact on economic development and supporting the Canadian economy [
4]. The integration of hemp into composite products not only supports sustainability goals but also presents cost-saving opportunities by reducing reliance on synthetic fibers [
4]. Moreover, hemp’s strong mechanical and thermal properties highlight its potential in eco-friendly, structural (as well as non-structural) applications, reinforcing the importance of biocomposites in reducing environmental footprints [
5].
Biocomposites production is a multifaceted process that involves interconnected operations within each given supply chain (SC). A typical SC includes critical stages such as the collection, transportation, and pre-processing of the agri-industrial feedstock and conversion of the feedstock to value-added product [
6]. The overall effectiveness of the SC depends on strategic decisions regarding location, equipment, and materials during production [
7]. Notably, the bulk of research published in such SC activities has considered purchasing, encompassing supplier sourcing, evaluation, development, and logistics between supplier and customer sites (for instance, 41.96% of the research has focused primarily on addressing supplier and facility location decisions [
8,
9]). In the context of biocomposites, the natural fiber pre-processing, comprising particle size reduction and mechanical separation decisions, is a critical step in production [
10]. Moreover, for the commercial application of biocomposites, the economic and environmental viability of these materials throughout the SC and during service is crucial [
11], which can be assessed by examining techno-economic analysis (TEA) and life cycle assessment (LCA) models [
12]. While many studies have stated that biocomposites are more environmentally friendly than fossil fuel-based alternatives, only a limited number have utilized comprehensive tools such as TEA and LCA within the SCs to substantiate these notions in detail [
2]. A primary focus has been on the functional properties’ assessment of biocomposites [
13,
14] and, separately, the economic and environmental aspects [
15,
16,
17]. The natural fibers in such case studies have been considered as reinforcement, including wood fibers [
18], bagasse fiber [
19], flax fiber [
20], vine shoots [
21], sugarcane [
22], etc. The study by Schmehl et al. [
23] investigated a bus body component utilizing natural fibers combined with a plant-based thermoset resin, emphasizing its positive environmental impact [
23]. Another study by Haylock and Rosentrater [
24] conducted a combined TEA-LCA approach focusing solely on the energy demand and environmental impacts associated with PLA biocomposite production, taking into account various fillers, processing techniques, and end-of-life scenarios [
25].
From a managerial point of view, although economic and environmental evaluations are typically included in SC design, the lack of uncertainty analysis in sustainability metrics can restrict the strategic value needed for informed and resilient decision-making. This dimension has been also overlooked in prior SC methodologies considering biocomposites [
26].
Furthermore, integrating social considerations, while increasingly recognized, remains largely overlooked in quantitative SC models, particularly those using multi-criteria decision-making (MCDM) frameworks [
27]. For instance, a systematic review by Barbosa-Póvoa et al. [
28] found that only 5% of over 120 SC sustainability studies addressed social indicators, compared with 28% and 9% focusing on environmental and economic aspects, respectively. Although a few recent studies such as Rutitis et al. [
29] considered the social dimension qualitatively, quantitative integration of social criteria into SC design models remains limited. While 17% studies address the triple bottom line (TBL) approach, 40% examine the interplay between economic and environmental factors. Moreover, sustainability is often evaluated using a single metric, which varies by study, further limiting comprehensive assessments [
28,
30].
Chen et al. [
31] investigated both the economic and social implications of biocomp osites derived from potato pulp. In addition to TBL impacts (integrating the three pillars of sustainability), the life cycle engineering (which includes the technical or functional aspect) is another critical factor for ensuring the success of biocomposites in industrial applications [
32,
33]. High-performing biocomposites must maintain their mechanical properties and durability while offering sustainability advantages that attract both consumers and industries [
33]. Product quality is essential for ensuring the material’s suitability for applications like injection molding. Maintaining quality not only contributes to environmental sustainability but also enhances the economic feasibility of biocomposites in commercial production [
33,
34]. Furthermore, the definition and selection of criteria indicators play a critical role in positively influencing the overall sustainability score. These indicators can be qualitative or quantitative, adding complexity to the decision-making phase [
32].
In order to address the current gap on integrating the four sustainability dimensions of the biocomposites SC including
economic,
environmental,
social, and
technical aspects, MCDM approaches are deemed the most common tool, helping with resolving conflicting criteria and reaching key decisions among the feasible options/alternatives [
35,
36]. For instance, in the study by Chanpuypetch et al. [
37], an integrated analytic hierarchy process (AHP)-technique for order preference by similarity to ideal solution (TOPSIS) framework is used to assess bamboo-based products, highlighting its application in SC management for sustainable materials. By concurrently evaluating criteria such as production cost, market demand, and environmental impact, their model provided a systematic approach for product selection that could be adopted to biocomposites. Similarly, focusing on product quality, in a recent study, Saha et al. [
38] used the VIKOR (VlseKriterijumska Optimizacija I Kompromisno Resenje) method to assess the properties of different biocomposites for use in automobile interiors. By considering tensile strength, thermal stability, and moisture resistance, their research highlighted how bamboo-based biocomposites meet both performance requirements and sustainability goals [
39]. Far too little attention has been paid to objectively evaluating the sustainability of biocomposites, focusing on the decisions involved in the pre-processing stage of biocomposite production [
40]. These assessments are crucial for the industrial production and application of hemp, as they offer valuable sustainable insights into the research and capital investments needed to develop the infrastructure required to expand the industry [
41].
Among different MCDM methods, some studies have applied the analytic network process (ANP) method as an effective and well-established tool based on pairwise comparisons to address the interdependencies between decision factors [
42]. The ANP method integrates both quantitative and qualitative criteria, yielding more realistic outcomes and providing managerial insights when systematically selecting suppliers, for example in [
19,
43]. The use of the ANP approach in SC decision-making underscores its importance in navigating complex trade-offs, making it a valuable tool in biocomposite production [
17].
In MCDM models, especially involving both qualitative and quantitative factors, results are often influenced by input data affected by personal opinions, cognitive biases, and measurement errors [
44]. Hence, in such cases, sensitivity analysis is crucial for understanding how changes in criteria weights would impact decision rankings [
44]. Several researchers have developed sensitivity analysis models for MCDM methods. For example, Masuda [
45] and Huang [
46] proposed models for the AHP, while Chen and Kocaoglu [
47] introduced an algorithm for hierarchical decision models. More recently, studies by Badi et al. [
39] and Bouraima et al. [
48] analyzed the impacts of adjusting the most important criteria weights on the rankings of alternatives, offering insight into the stability of MCDM models. Other approaches, including those that calculate standard deviation in scores or define consistency intervals [
29,
49,
50], further underscore the importance of robustness testing. In the context of sustainable SC management, the ANP method has been widely used for tasks like sustainable supplier selection and prioritizing performance indicators across environmental, economic, and social dimensions. For example, prior studies by Nisrina et al. [
51] and Theißen and Spinler [
52] applied ANP frameworks to identify key sustainability drivers and evaluate supplier partnerships. While these studies successfully applied the ANP approach to sustainability-focused SCs, their sensitivity analyses were performed manually, often by varying selected weights in isolation to observe ranking changes.
1.1. Research Gaps and Motivation
Despite the above progress in sustainability assessment and MCDM modeling in the context of green manufacturing SCs, critical gaps remain unaddressed.
First, limited research has holistically evaluated the sustainability of biocomposite material SCs with a focus on strategic-level decisions, such as the selection of pre-processing equipment. Current research has largely emphasized product-level LCA or end-of-life scenarios, without exploring upstream operational strategies (e.g., feedstock size reduction, baling method) and their implications across all four pillars of sustainability: economic, environmental, social, and technical [
32]. Only the study by Ribeiro et al. [
34] has focused on flax fiber biocomposites, but the study covered limited indicators (e.g., product cost, environmental impact categories, and a few technical properties) without accounting for interdependencies among criteria.
Second, the role of interdependencies among decision criteria and alternatives remains underexplored. While the ANP is uniquely suited to model such complex interactions, very few sustainability-focused applications in the biocomposites domain have leveraged its full capabilities. Most MCDM studies to date rely on the AHP, which assumes independence among criteria and alternatives, thus potentially oversimplifying the decision context.
Third, in terms of sensitivity analysis, most studies manually adjust criteria weights to test robustness of their decision model. Although some prior work, such as Wolters and Mareschal [
53] and Sowlati and Asadi [
54], implemented optimization-driven models to identify the smallest changes needed to reverse rankings, no study developed an optimization-based sensitivity analysis framework for ANP modeling. Given the ANP’s higher dimensional complexity and the presence of multiple clusters and feedback loops, such a tool is deemed critical to enable efficient and automated robustness assessments.
1.2. Objective and Contribution of the Present Study
To address the abovementioned gaps, this paper presents an integrated (multi-pillar) and automated (optimization-driven) robust decision support framework aimed at enhancing the sustainability of biocomposite SC design. The key objectives are:
To develop an MCDM model using an ANP approach that incorporates interdependencies among economic, environmental, social, and technical criteria.
To evaluate strategic equipment configurations in the feedstock pre-processing stage (i.e., hammer mill and baler combinations) to guide SC design decisions based on sustainability trade-offs.
To compare the ANP with the conventional AHP in terms of decision certainty, robustness, and efficiency and demonstrate how the consideration of interdependencies (in the ANP) can affect the prioritization outcomes in the present biocomposite SC.
To implement a non-linear programming (NLP)-based sensitivity analysis tool that determines the minimum weight changes required for rank reversal. This automation addresses the complexity of ANP models and allows for systematic exploration of uncertainty across a high number of criteria and clusters.
The framework is applied to a real-world industrial case study involving hemp-based biocomposites, evaluating four strategic alternatives for pre-processing:
- (A)
Full-screen hammer mill with round baler (Full-Round);
- (B)
Full-screen hammer mill with square baler (Full-Square);
- (C)
Half-screen hammer mill with round baler (Half-Round);
- (D)
Half-screen hammer mill with square baler (Half-Square).
Overall, the study contributes to both the methodological advancement of MCDM and practical sustainable SC design, offering a robust, data-driven approach to support strategic decision-making in the biocomposites sector.
2. Materials and Methods
Overview: The proposed scenario-based framework of sustainability assessment consisted of a two-stage approach: (1) the identification of a set of alternatives and criteria relevant to the selected case study (
Section 2.1 and
Section 2.2); and (2) the selection of the best alternative using an MCDM model coupled with the evaluation of solution robustness using sensitivity analysis (
Section 2.3 and
Section 2.4). The foundational frameworks of sustainability assessment is often defined by four pillars: economic, environmental, and social, also incorporating underlying technical performance criteria in decision-making [
55,
56]. In this work, economic and environmental criteria are derived from the earlier studies of the authors using techno-economic analysis (TEA) and life cycle assessment (LCA) modeling within the same case study [
57,
58], while social and technical indicators rely on industry expert interviews and the literature. Given the requirement for balancing conflicting criteria under interdependencies, an ANP model is used, being a commonly known advanced decision tool for complex systems [
59]. Then, an NLP model is developed for the sensitivity analysis of the ANP, namely, to determine the minimum changes in the criteria weights that would make a second-ranked alternative be the top-ranked one (i.e., rank reversal analysis). A representation of the entire model is shown in
Figure 1 conceptually, and more detailed explanations for each phase will be presented in the following sub-sections.
2.1. Case Study Description
The worldwide use of biocomposite pellets (for efficient downstream manufacturing processes like injection molding and sheet extrusion) is rising, especially in the automotive sector, for efficient downstream processes such as injection molding and sheet extrusion, driven by benefits like conserving natural fiber resources and incorporating eco-friendly materials [
60]. Canada is one of the highest producers of industrial hemp in the world. Approximately 34,262 hectares (84,660 acres) of hemp were farmed in 2015. Also, hemp stands out as a promising material for biocomposites due to its superior tensile properties and modulus as well as high growing period (70–140 days) compared with many other natural fibers [
41]. These characteristics, coupled with its bio-based nature, make hemp an ideal choice for use as either a matrix or reinforcement component in sustainable composite materials [
61]. To exemplify the application potential, in Saskatchewan, Canada, seedlings occurred on about 15,335 hectares (37,892 acres), with over 400 total licenses being issued to grow hemp in 2015 [
62].
In this industrial case study, it has been of interest to produce and scale up a commercial plant producing sustainable (bio)plastics from hemp feedstock for downstream 3D printing products in a 20-year planning horizon. These bioplastics need to be non-toxic, biodegradable, and carbon-negative with engineered-grade quality (i.e., strong, not flammable, high heat and moisture resistance), which help to mitigate climate change and environmental issues. In our case study, the production of biocomposite pellets focused on two primary components derived from hemp: hemicellulose and lignin. This assumption is based on the fact that the entire hemp plant is used for biocomposites production. A processing facility designed to handle 300 tonnes of hemp per day for lignin and hemicellulose extraction is considered, based on input from industry executives.
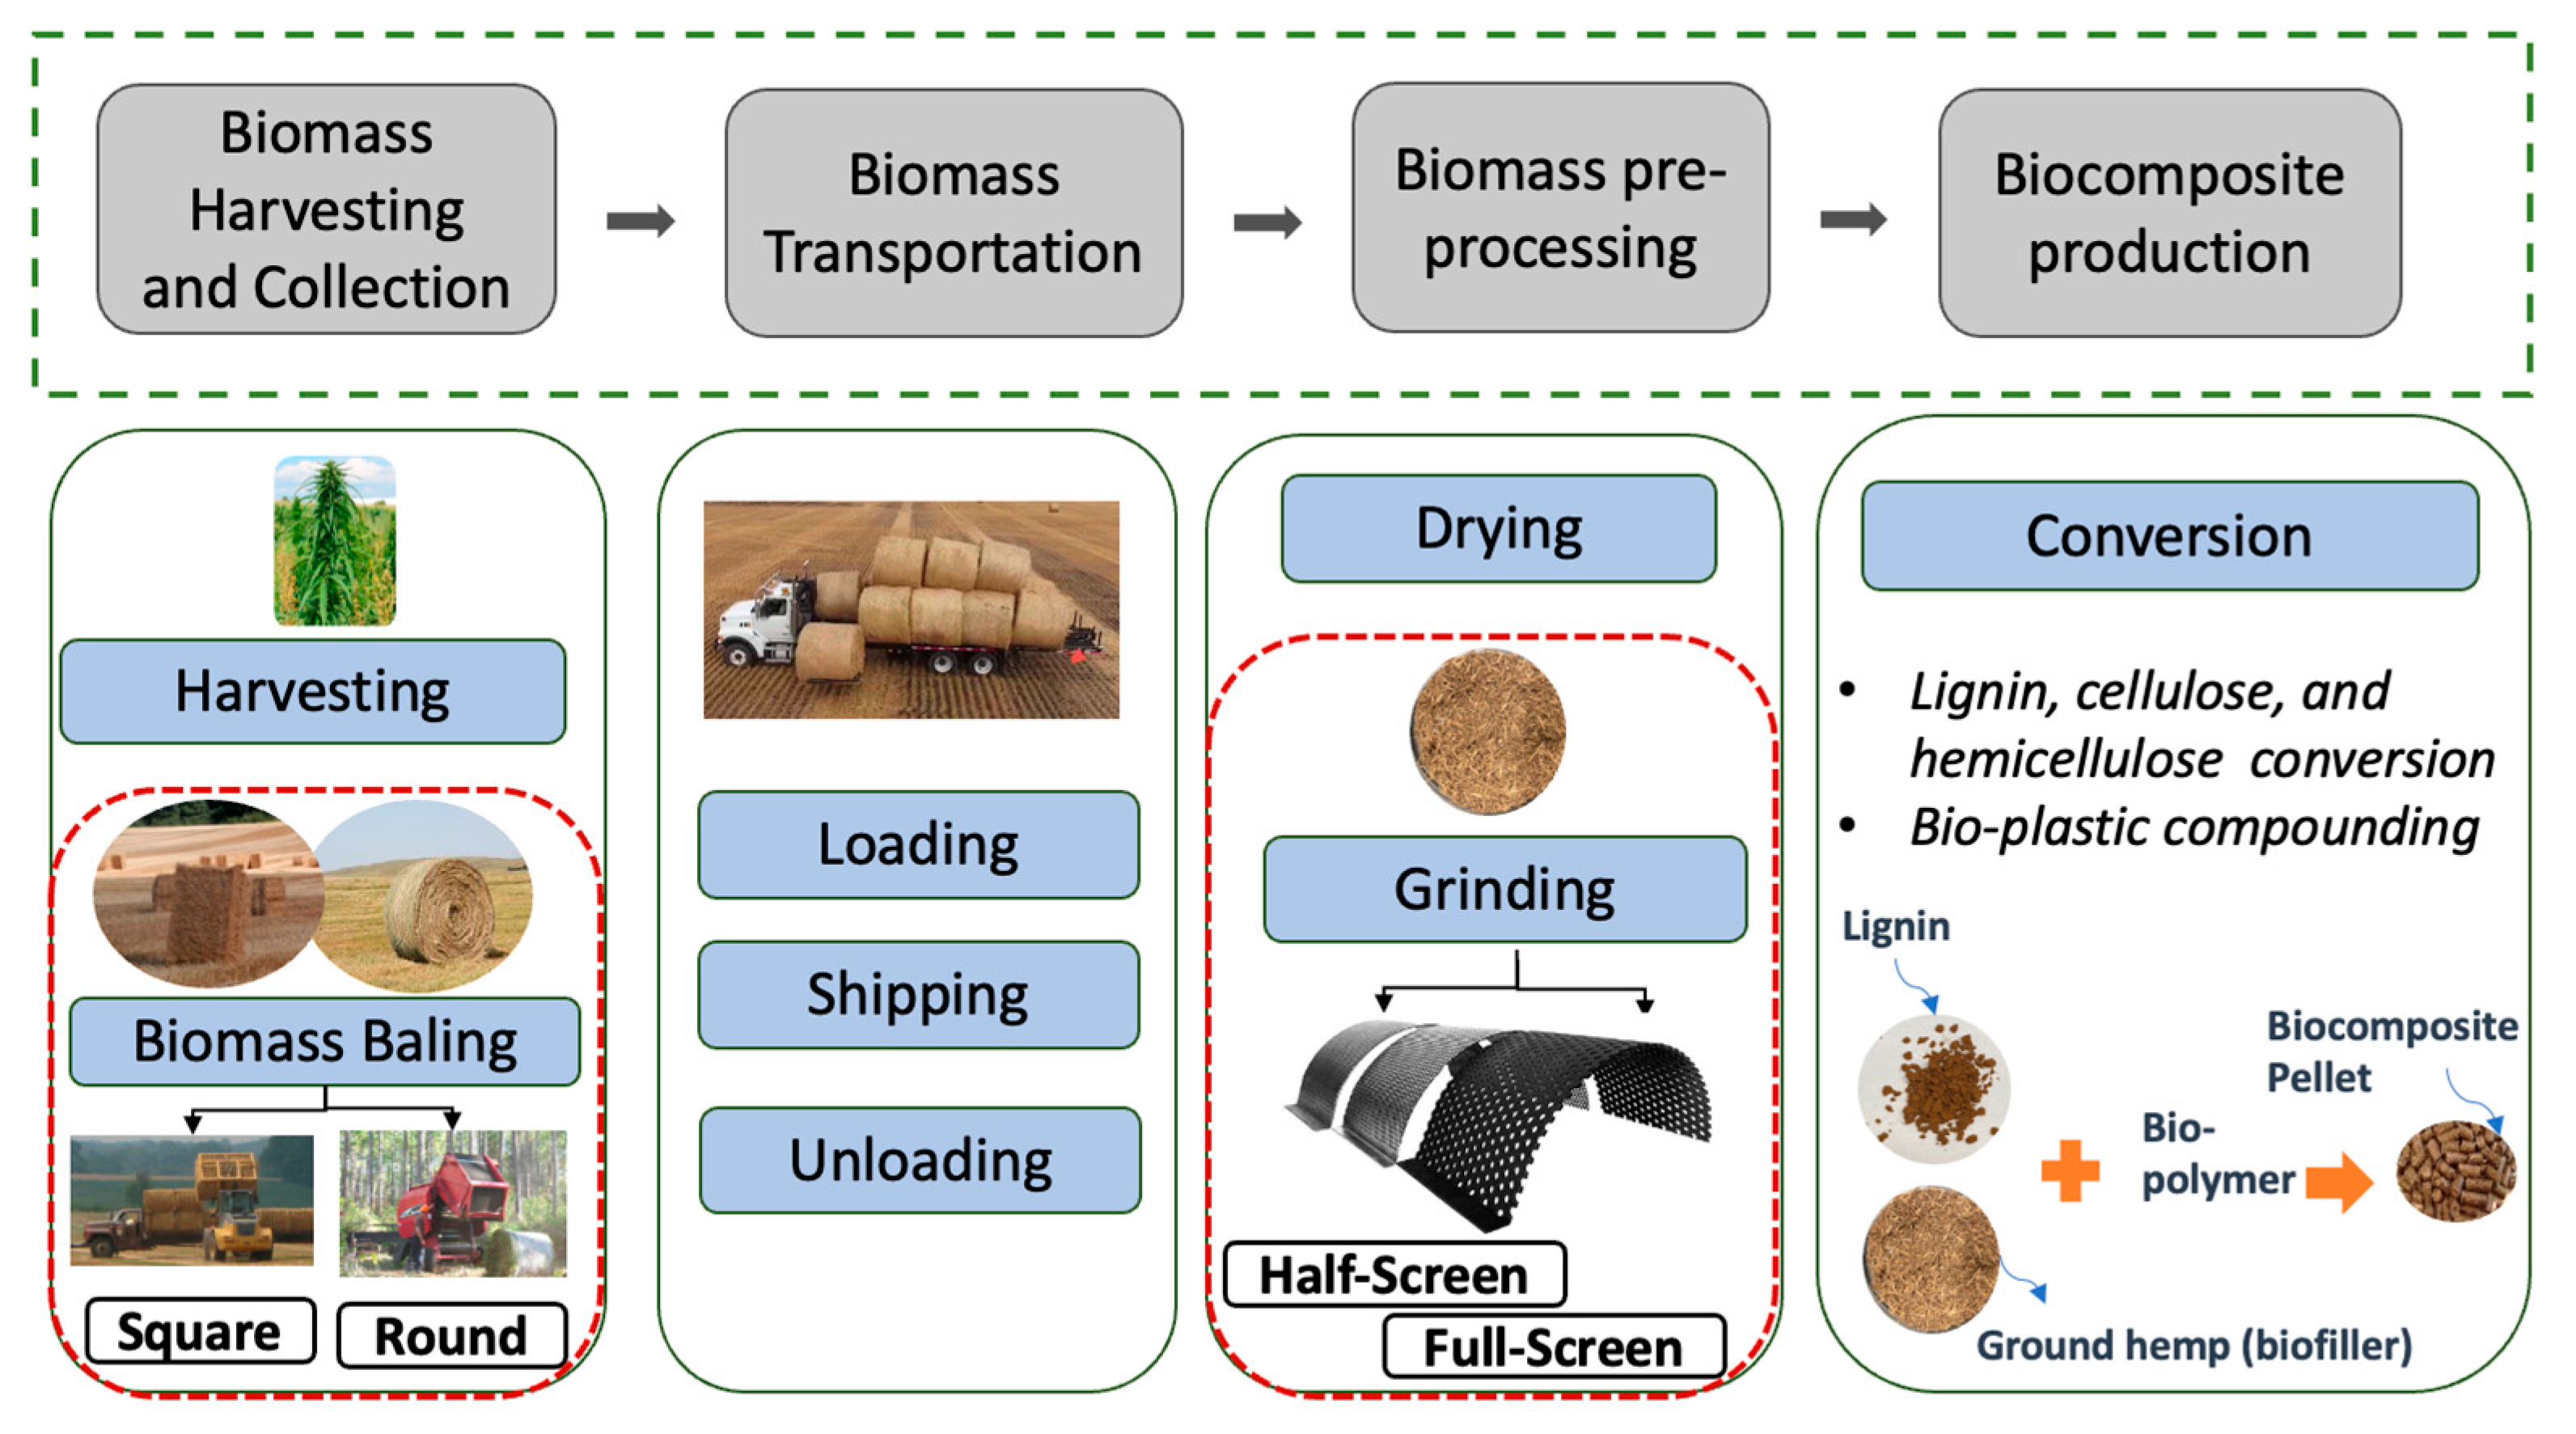
The process flow diagram for the ligno-chemical biorefinery commercial plant located in Saskatchewan, Canada, is shown in
Figure 2. The activity starts with the harvesting of the entire hemp plant and then the baling of it using baler machines. For the purposes of this study, it is assumed that hemp availability is consistent across all seasons, ensuring a continuous supply for the production process. No resource shortages are considered in the model, as it is assumed that sufficient quantities of hemp are readily accessible in the region throughout the year. Next, the baled hemp is transported to an intermediate facility, where it is size-reduced using a hammer mill (25% of hemp used as the composites reinforcement) and shredder (75% of hemp to be processed for the biopolymer conversion) before undergoing the biopolymer conversion process.
Pre-processing at the field or facility could reduce the SC costs and provide higher-value feedstock. The majority of previous studies focused on using hammer mills due to lower maintenance than any other size reduction machine [
59]. Self-unloading trucks are used to transport and unload hemp bales. The travel distance is assumed to be around 50 km. In the biorefinery facility, hemp ingredients including lignin and cellulose/hemicellulose are extracted, and then the biopolymer is produced with further processing of the cellulose/hemicellulose [
63]. To enhance the mechanical properties of biocomposites, natural fibers are recognized as one of the most effective green fillers for polymer matrices [
64,
65]. Ultimately, the blend of ground hemp (biofiller), lignin, and the biopolymer undergo compounding and extrusion processes, which yield biocomposite pellets.
2.1.1. Biomass Harvesting and Collection
Regarding the biomass collection, baling can be performed using square or round balers [
66]. Round balers require smaller tractors compared with large square balers, which is an advantage for smaller farms [
67]. However, square balers have a wider pickup area, leading to higher efficiency than round balers [
37,
68,
69]. Also, the wrap and eject time of round balers reduces their throughput capacity to 50%. These differences in baler efficiency result in variations in the amount of biomass fed into each type. While square balers consume approximately 1.25 times more energy per hour than round balers, their higher throughput makes them more energy-efficient on a per-tonne basis, as demonstrated in a study by Lemos et al. [
70]. Additionally, round balers produce bales with lower density, facilitating better drying in the field, which improves biomass quality, a critical factor in enhancing the overall quality of the final biocomposite [
41]. In contrast, square balers compress biomass into “flakes” before forming compact bales [
66].
2.1.2. Biomass Pre-Processing
From a size reduction standpoint, both full-screen and half-screen hammer mills can be employed to produce biofillers for biocomposite reinforcement [
60,
71]. These machines are energy-intensive, with energy consumption significantly influenced by screen size and particle size [
72]. The finer outputs require substantially more energy [
21]. Full-screen hammer mills offer higher efficiency, greater throughput, and lower power demand compared with half-screen models [
72], which may consume up to five times more energy [
71,
73]. Increasing screen size (e.g., from 1 mm to 1.5 mm) can boost efficiency by at least 50% [
74], while finer mesh sizes reduce capacity due to longer grinding times [
75]. Equipment producing finer particles also incurs nearly double the maintenance cost [
68]. However, finely ground hemp enhances homogeneity and surface area, improving biocomposite sample quality and extraction performance [
76]. Therefore, assessing the economic trade-offs of various hammer mill and baler combinations is essential for informed decision-making.
2.1.3. Biocomposites Production
Finally, within biorefinery facilities, lignin is extracted using the organosolv process, which involves mixing hemp with an organic solvent, typically ethanol, in a proprietary bioreactor. The mixture is pressurized and cooked, after which the resulting black liquor is cooled, filtered, and dried to yield lignin. Subsequently, the remaining hemp material is washed to obtain a cellulose-/hemicellulose-rich solution, which is then fermented using bacteria to produce a biopolymer. This biopolymer is subsequently polymerized and utilized in bioplastic compounding. For producing biocomposites pellets, the lignin and biopolymers along with biofillers (hemp grinds) are compounded using a compounder (twin-screw extruder).
2.2. Decision-Making Model Development
This section outlines the development of the decision-making model used to evaluate alternative SC configurations. It begins by detailing the definition of alternatives based on pre-processing equipment followed by the identification and classification of sustainability-related criteria across economic, environmental, social, and technical dimensions.
2.2.1. Supply Chain Configurations (Alternatives) Considered
Given the difference of the pre-processing equipment for biomass collection and size-down, particularly in terms of energy consumption, efficiency, and capacity [
77], a combination of square/round balers and half/full-screen hammer mills, was considered, affecting the total SC costs [
78]. These assumptions resulted in the definition of four alternative configurations for the SC: (1) full-screen hammer mill with round baler (Full-Round), (2) full-screen hammer mill with square baler (Full-Square), (3) half-screen hammer mill with round baler (Half-Round), and (4) half-screen hammer mill with square baler (Half-Square).
The capacities for the full-screen hammer mill and square baler were determined based on daily production requirements and expert input. The capacities and energy needs of the remaining equipment options were then calibrated relative to these reference points, using data from existing studies.
Table 1 summarizes the key parameters for the different types of hammer mills and balers.
2.2.2. Identification of Decision Criteria and Sub-Criteria
The process of selecting suitable criteria plays a paramount role in any MCDM endeavor [
79]. The identified sub-criteria for each sustainability dimension in the present case study was as follows:
Economic: To identify relevant economic factors and sub-criteria, deterministic engineering economics methods were applied to compare the alternatives. In line with Akbarian-saravi et al. [
57], the net present value (NPV), annual worth (AW), internal rate of return (IRR), return on investment (RoI), and payback period of each alternative were calculated using a spreadsheet-based model. This analysis relied on technical and cost data, including equipment efficiency, bioplastic demand, and capital and operational costs (e.g., feedstock, energy, labor, maintenance), drawn from literature, as well as expert consultations (
Table A1,
Table A2 and
Table A3,
Appendix A). Given the project’s early development stage, production demand was assumed to match design capacity. To account for uncertainty in the TEA, a Monte Carlo (MC) simulation was performed, with the final results being summarized in
Table A4 in
Appendix A. The finalized economic metrics using stochastic TEA include the mean NPV and the NPV under risk, including the average of worst-case scenarios, which are quantified using the conditional value at risk (CVaR)-NPV metric, along with the selling price range given the unstable market and demand. CVaR is used to calculate the expected worst outcome (potential profit loss) under market instability and fluctuating demand [
57].
Environmental: For the environmental impacts, the LCA model using TRACI method based on ISO 14044 [
80] was implemented in Akbarian-Saravi et al. [
58]. The input parameters data for the environmental assessment is presented in
Table A5 along with the results being presented in
Table A6. The most contributing impact categories (5% cut-off) are selected in this study as the environmental criteria, relating to human and ecosystem impacts, which consist of carcinogenic, non-carcinogenic, ecotoxicity, and eutrophication impact categories.
Social: For the social dimension, “job quantity” was selected as the representative criterion based on expert agreement and data availability (as a sample representative of social factors). Although occupational health concerns and community acceptance are also relevant, the lack of consistent, quantifiable data specific to each equipment configuration limited their inclusion in this analysis. As a result, job creation was used as a measurable and comparable proxy for social benefit, acknowledging that broader social factors should be explored in future studies. The social impact is predominantly influenced by activities within the agricultural sector, which accounts for the highest proportion of employment hours [
31]. In this study, social factors are assessed by estimating the number of jobs created under different operational configurations. Specifically, these jobs are calculated based on biomass pre-processing equipment usage, including the capacity and hours of operation per machine (such as hammer mills or balers) and the number of shifts assumed per day for each piece of equipment. The total number of employment hours needed for equipment operation is determined based on the amount of material required to meet the production demand for each configuration. Once the equipment hours are estimated, the number of workers needed for each configuration is calculated. This approach links the operational requirements directly to job creation, which is considered a key social factor in this study. Therefore, the number of jobs created is considered a proxy for social impacts.
Technical: Another key characteristic of a sustainable SC is the technical aspect, for which
product quality, system reliability, and technology readiness level (TRL) are included in the present problem. From the current literature, clearly there is an essential variability in the quality of the processed biocomposites as well as system reliability and TRL under different pre-processing equipment [
81]. All the qualitative data are collected using industry experts’ opinions, as shown in
Table 2. These experts provided insights based on their experience and knowledge of the equipment and processes involved in biocomposite material production.
Product quality: Product quality in biocomposites is significantly influenced by the properties of base biofillers used as reinforcement [
82]. Namely, the mechanical characteristics of these biofillers are affected by various factors across multiple stages including filler production (grinding) and the hemp storage processes. The quality of biofillers, such as hemp grinds, particularly plays a critical role in determining the modulus (stiffness) of the final biocomposite product. A higher-quality biofiller, with smaller particle size and well-preserved fiber integrity, can enhance the modulus of the composite by providing better reinforcement to the polymer matrix. Conversely, poor-quality biofillers, with irregularities or degradation due to improper handling, may result in weaker bonding with the matrix, reducing the product’s stiffness and overall mechanical performance [
83].
System reliability: Reliability is often quantified as the percentage of time the system operates without failure within that period. One key reliability metric, mean time to repair (MTTR), measures the average time required to restore the system to full functionality after a failure [
84]. For instance, comparing the maintenance time of square and round balers, the criteria have been assessed. It indicates the level at which the system maintains the level of quality over time. Square balers need more maintenance and repair compared with round balers, leading to a higher maintenance cost of square balers compared with round balers. Due to a less complicated handling system for round balers to tie the bales, they require less frequent maintenance [
70]. Moreover, storing square bales is more challenging than round bales, as they require protection from weather to prevent mass loss caused by exposure [
85]. Failure of the equipment, on the other hand, can be a major contribution to the maintenance costs [
86]. Therefore, the equipment with the most maintenance costs has less reliability. From the hammer mill’s perspective, the components of a hammer mill that experience the most wear are its screens, which may appear costly to replace at first glance. Typically, depending on factors like the material being processed and screen hole size, a set of high-quality, hard-faced hammer mill screens will wear out after 2–4 replacements before the hammers need attention. Smaller screen hole sizes may necessitate even more frequent replacements [
87], which makes the half-screen hammer mill system less reliable compared with the full-screen hammer mill according to the MTTR factor.
Technology readiness level (TRL): Another qualitative technical factor considered is the TRL, which is a framework that has been used in many variations across industries to provide a measurement of technology maturity from idea generation (basic principles) to commercialization [
88]. TRL can also be adapted to support understanding of the capabilities and resources required to develop technologies at different stages of development. The TRL stages are based on the Government of Canada assessment [
61]. As shown in
Table 2, when evaluating the qualitative criteria for the combination of the hammer mill and baler equipment, the baler’s importance is deemed more significant than the hammer mill due to the proportion of raw materials processed by each. Specifically, only 25% of the raw materials are processed using the hammer mill. The TRL stages are based on the Government of Canada assessment [
61]. The evaluation for the analysis shown in
Table 2 is based on the expert evaluation.
The MCDM methods systematically account for the abovementioned influential factors and their relative significance in prioritizing alternatives. While using such methods, the account of interdependence between some criteria can also be critical [
61]. For instance, as concluded in the TEA model, the selling price range significantly impacts both the mean NPV and CVaR-NPV, as variability in prices directly affects the expected value and risk-adjusted outcomes.
2.3. Analytical Network Process (ANP) MCDM Model
The ANP, introduced by Saaty [
59], is an MCDM method to address the limitations of the AHP by incorporating interdependencies and feedback among decision criteria and alternatives. While the AHP uses a strict hierarchical structure to analyze decision-making problems, the ANP allows for the modeling of a decision problem using a network-based structure [
59].
In this work, we have adopted the ANP-based valuation framework for the selection of the best SC alternative. The ANP is widely used in the literature due to the following reasons [
63]: (1) analyzing complex (network-based) multi-criteria decision problems, (2) incorporating interdependencies among decision factors (instead of some independency assumptions, e.g., in the AHP), and (3) the subjectiveness of some of the criteria can make it challenging for a decision-maker to directly derive a weighting for each criterion. The basic assumption of this study is that economic, environmental, social, and technical aspects can be seen as subsystems of a larger, integrated performance management system, hence potentially making the ANP a suitable MCDM candidate.
The method first involves pairwise comparisons to quantify the relative importance of criteria and alternatives, using Saaty’s fundamental scale as shown in
Table 3 [
64]. A supermatrix is constructed to capture the interrelationships among the sustainability pillars, with a specific focus on the economic cluster. This matrix is then normalized and raised to successive powers until convergence, providing global priorities for the alternatives. For detailed explanations and mathematical formulations, readers are referred to Saaty’s works [
64,
73] and other foundational studies [
65]. Here, through the criteria
inner dependence (looping) feature of the ANP [
61], the correlation between the selling price range, the mean NPV, and CVaR-NPV criteria was considered.
To capture the inner dependence among economic criteria, pairwise comparisons were conducted using Saaty’s 1–9 fundamental scale to reflect the perceived influence each criterion has over the others within the economic cluster. Three local pairwise comparison matrices were developed, where each criterion was treated as a controlling element in turn. For instance, when mean NPV is the controlling factor, the selling price range has a greater influence (entry value is 5) compared with CVaR-NPV (entry value as 1). Each local matrix was then normalized by a column, and the resulting eigenvectors (average of each row in the normalized matrix) were computed, representing the relative influence of other economic criteria under the control of each criterion. These eigenvectors form the columns of the unweighted supermatrix for the economic cluster.
By incorporating these numbers into the supermatrix structure, the model reflects the internal feedback (looping) between the economic sub-criteria, a key advantage of the ANP over the traditional AHP. This structured approach ensures that the model captures the dynamic interdependencies among economic indicators.
2.3.1. Incorporating Qualitative (Expert Opinion-Based) Data Uncertainty Under the ANP’s Outer Dependence Feature
Theoretically, an ANP network could be applicable compared with a hierarchy-based framework (e.g., the AHP) in cases where the expert, during qualitative data collection in evaluating a given alternative, may have more/less reliable data/confidence compared with the other alternatives under a same given criterion. Accordingly, the decision-maker may wish to assign a varying weight to this criterion for a more reliable decision-making process (note that in the standard MCDM methods, the weight of a given criterion is fixed regardless of alternatives, and it cannot vary with respect to one alternative to another; this is where the ANP method present a great advantage over many MCDM methods [
43]).
To better exemplify, assume we are comparing two alternatives for an SC strategy (
A1 and
A2) under two criteria (
C1 and
C2) with the goal of choosing the better strategy. Inspired by the work of Milani et al. [
89], the expert prefers to use the additional information (e.g., past data availability/experience/reliability/etc.) they may have and define a higher weight for
while scoring
(as more reliable alternatively, i.e., with more certain data), while considering a lower weight for
while scoring A
2 (less reliable alternative). In the present decision-making case study, the level of confidence of the decision-maker (e.g., during qualitative data collection) is likely to be influenced by how the combination of pre-processing equipment contributes to the overall performance under specific criteria, such as
product quality. For example, the combination of the
half-screen hammer mill and round baler (Alternative C) demonstrates consistently
high product quality for both equipment components, leading to a high overall score and greater confidence in its selection. In contrast, the
full-screen hammer mill and round baler (Alternative A) presents a mix of extremes, with high quality for the round baler but low quality for the full-screen hammer mill, making it difficult to determine whether the overall performance is
medium or
low. This variability introduces uncertainty and lowers confidence in evaluation of this alternative. Similarly, the
half-screen hammer mill and square baler (Alternative D) exhibits a trade-off, where the high product quality of the half-screen hammer mill is offset by the lower quality of the square baler, resulting in uncertainty about whether the overall score should be medium, low, or even different, ultimately depending on the decision-maker’s confidence level. By dynamically adjusting the weights based on system reliability and product quality qualitative criteria, the model allows decision-makers to prioritize specific criteria and balance trade-offs, ensuring that decisions align with their confidence in the robustness and performance of the selected SC configuration. In this case, for an ANP model, the adjusted aggregated score for each alternative
is as follows [
90].
where
is the weighted metrics for the alternatives
and criteria
based on the normalized pairwise metrics in the ANP model (elements from supermatrix in ANP);
is the average performance value of each alternative
under criteria
; and
, defined as the
unreliability factor (UF), is the adjusting weight representing the extent of the unreliability of
for
; 0
. To incorporate uncertainty in qualitative data assessments (e.g., product quality, system reliability), we introduced the UF, which adjusts the importance weight of each criterion–alternative pair based on confidence scores. Confidence scores were gathered using a continuous 10-level confidence scale, ranging from 0.1 (very low confidence) to 1.0 (full confidence). The scores were collected during an interview with a senior industry expert involved in strategic planning (only one expert was consulted). These UF scores were directly applied as multiplicative adjustment weights to the pairwise comparison results.
Therefore, in this case study, the ANP method is used to not only respond to the interdependency of criteria but also to respond to the unreliability in assessing some alternatives under specific criteria. Note that the depends on the alternative. In this case, lower weights () are assigned to alternatives with lower confidence. For example, Alternative A (full-screen hammer mill and round baler) and Alternative D (half-screen hammer mill and square baler) receive reduced weights (reflected by multiplying with UF) because their product quality varies; one equipment performs well while the other does not. Conversely, Alternative C (half-screen hammer mill and round baler), which demonstrates consistently high product quality, is assigned higher weights, reflecting greater confidence in its performance. This decision-making flexibility is a key advantage of the ANP approach, which is often unattainable using earlier the MCDM SC selection methods. Additionally, the ANP can accommodate a large number of criteria and alternatives simultaneously, making it possibly suitable for complex networks and large scale.
Incorporating the UF into the decision-making process introduces a practical and adaptive approach to account for uncertainties in data quality or external dependencies. By using the UF to adjust the criteria weights for specific alternatives, the model can better reflect real-world decision-making conditions where not all criteria are equally reliable or equally relevant for every alternative. This method allows for a more flexible evaluation of alternatives, adapting to different degrees of reliability or uncertainty associated with the criteria.
The rationale behind using the UF to modify the criteria weights is that it allows decision-makers to systematically explore how increasing or decreasing uncertainty impacts the performance of alternatives. By scaling the importance of specific criteria according to their unreliability (i.e., using smaller UF values to represent greater uncertainty), the model becomes more realistic in handling external factors that might not always be predictable or stable. The UF can be derived from expert confidence levels, depending on the decision context. This integration enables decision-makers to prioritize robustness rather than just optimality, especially in sustainable SC design where data uncertainty and system variability are inherent.
After adjusting the criteria weights with the UF, these modified weights are integrated into the supermatrix to calculate the final results. The supermatrix in the ANP captures the outer dependencies among criteria and alternatives, and by incorporating UF-adjusted weights, the model dynamically reflects how changes in uncertainty affect the relative importance of each criterion for each alternative.
An interdependencies among the network elements under economic criteria is assumed in this case study. The focus of the study is on specific relationships within one cluster (e.g., economic impact), and limited data or expert judgment are available for other clusters. These interdependencies modify the priority weights assigned to each criterion in the network. Unlike the traditional AHP (where criteria are assumed independent), the ANP allows these relationships to modify the relative importance of each criterion dynamically.
The evaluation issue was addressed using two different scenarios through an Excel spreadsheet and a Python (version 3.10.9) programming-based model. Scenario 1 allows interdependencies between variables and alternatives, which is to be represented in the next section. Scenario 2, on the other hand, assumes that the explanatory variables are independent, structuring the evaluation problem as a hierarchical model and solving it using the AHP.
2.3.2. Supply Chain Configuration Scenario 1
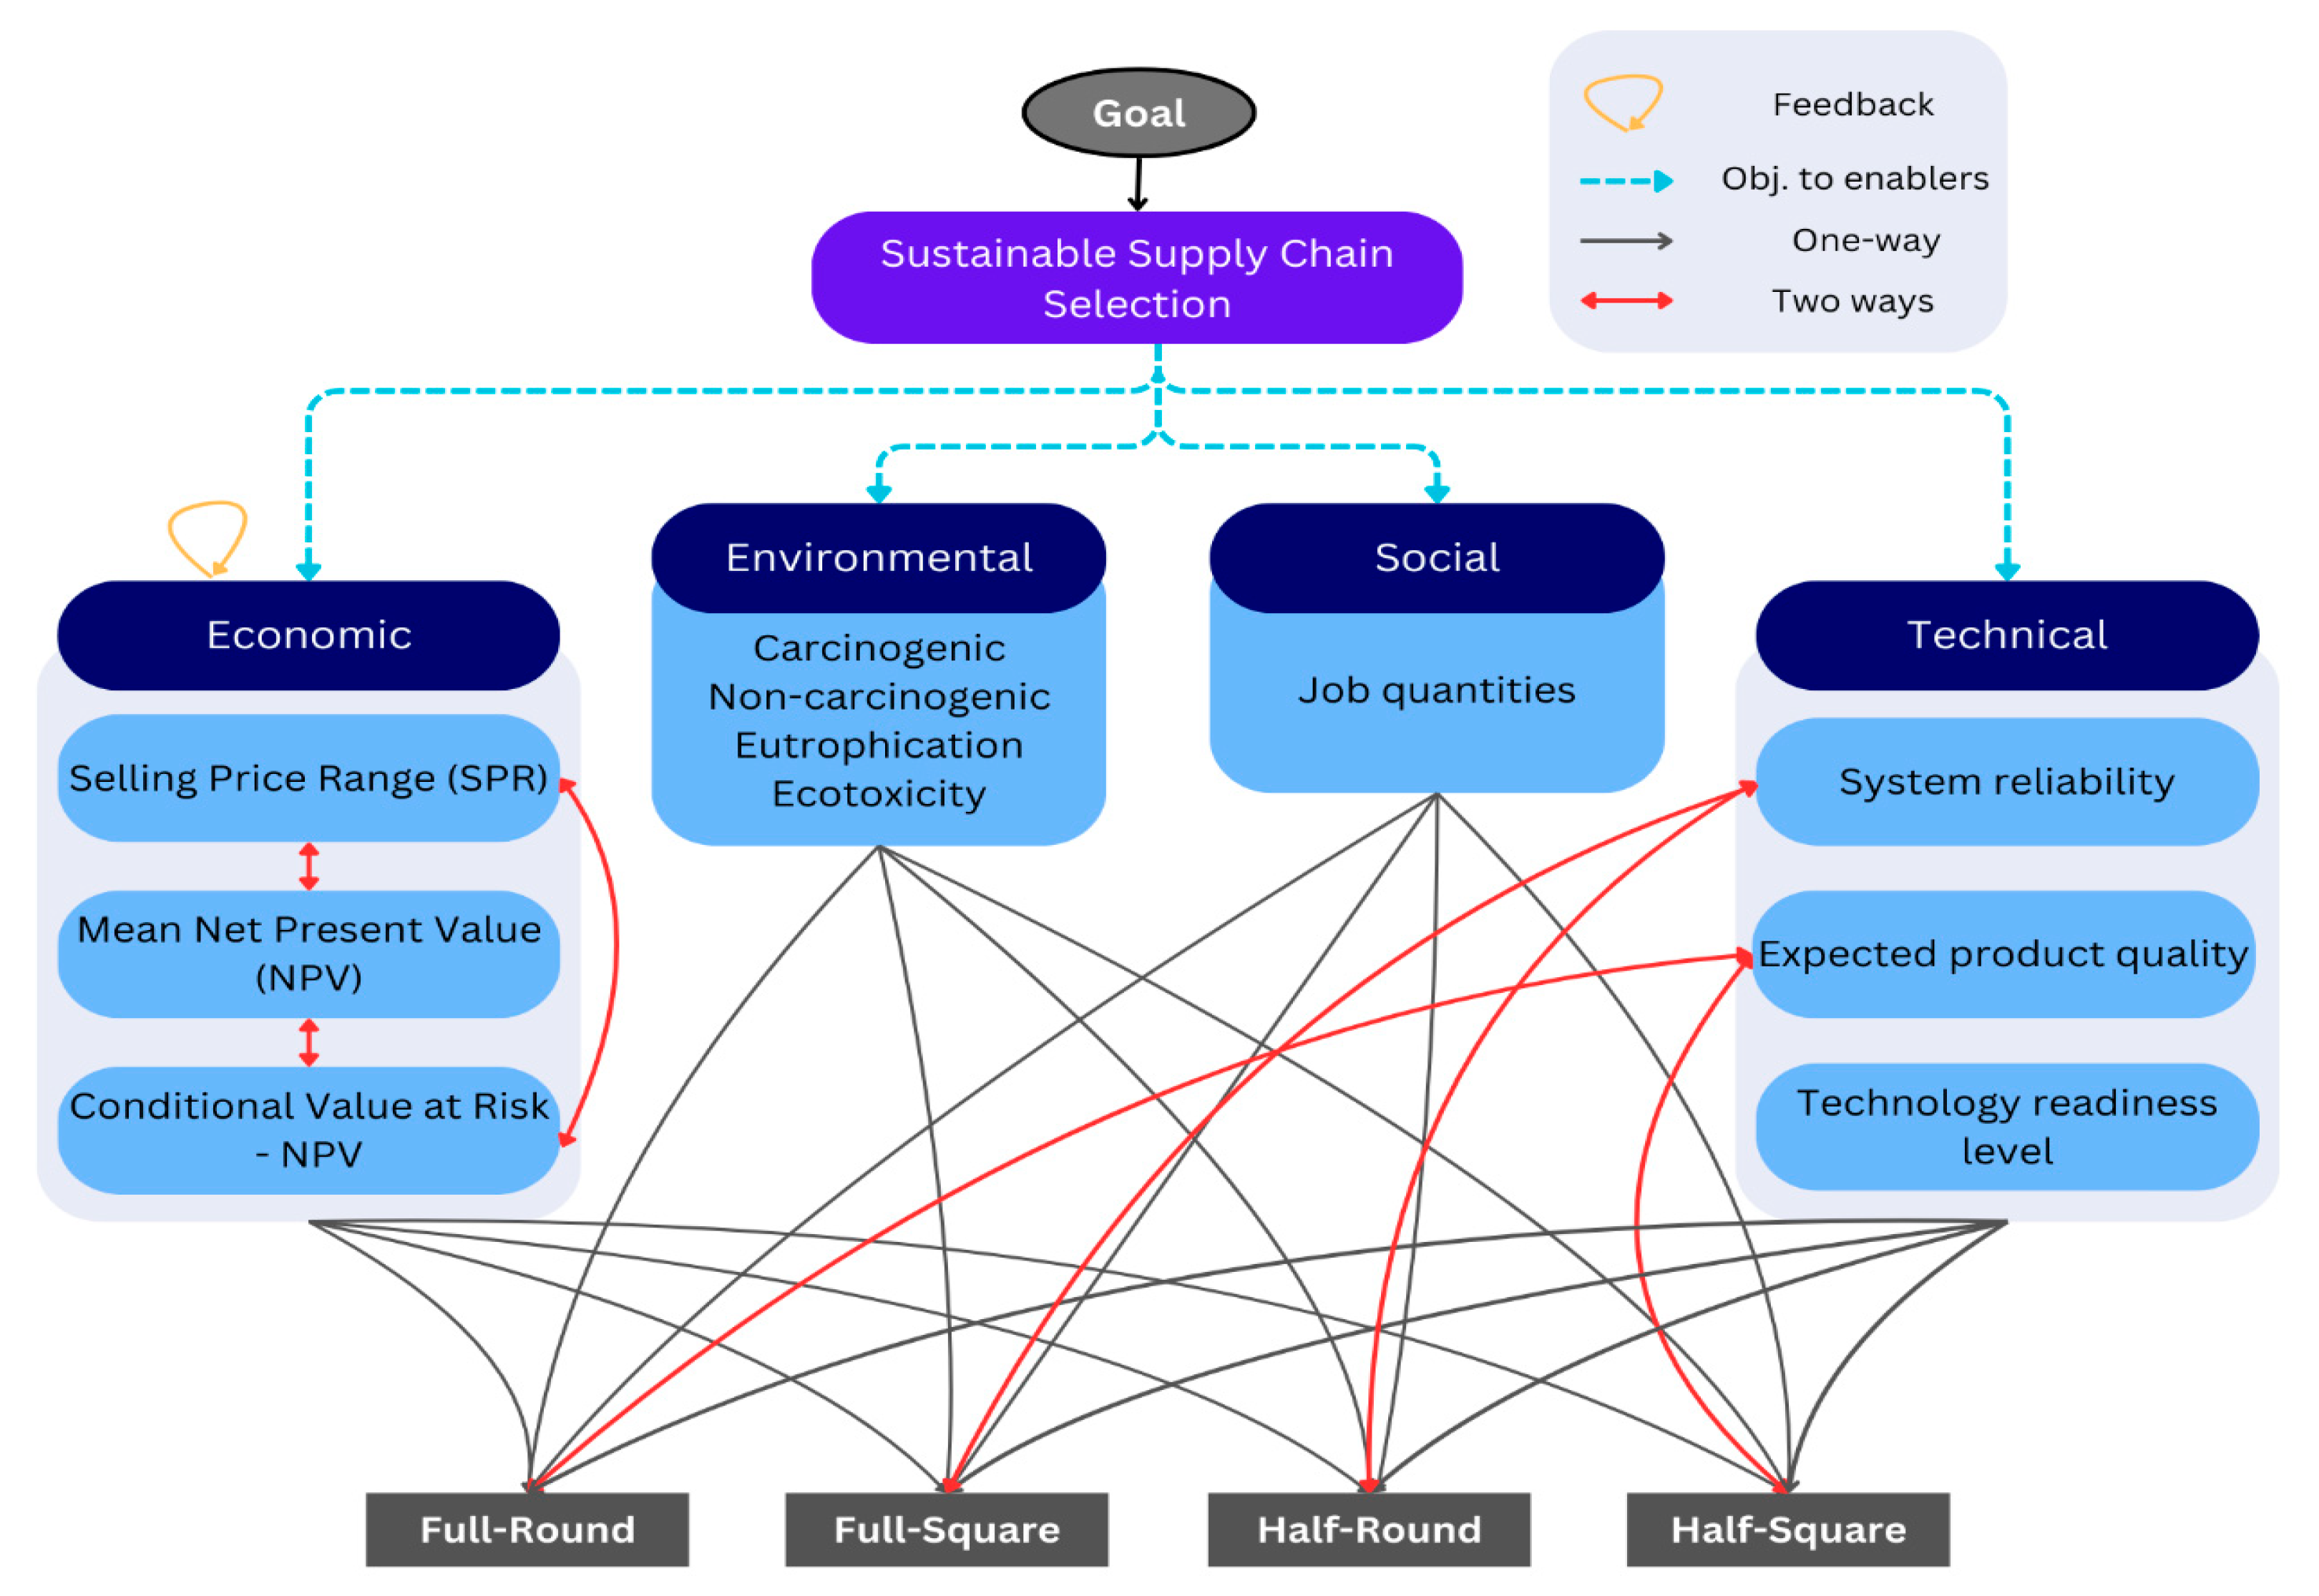
In this scenario, it is assumed that the expert and decision-maker have unequal preference over criteria and that their relative importance can change from one alternative to another depending on the specific unreliability factors raised in assessing those alternatives (refer to Equation (2)). For this case, we developed an ANP framework to evaluate the sustainable performance of SC as shown in
Figure 3.
Focusing on one cluster, the interdependencies among the mean NPV, CVaR-NPV, and selling price range are determined using expert opinion and the TEA results. A higher mean NPV indicates greater profitability, which generally reduces financial risk (CVaR) and allows for more flexible pricing and larger selling price range. CVaR-NPV measures the risk of extreme losses; a higher CVaR suggests greater uncertainty, which can lower NPV as future cash flows are discounted more heavily. This risk could also limit the selling price range, leading to more conservative pricing to avoid losses. Finally, the selling price range impacts both mean NPV and CVaR-NPV. A wider range or higher prices improve revenue and NPV, while a narrower or lower range increases financial risk, raising CVaR. In summary, a high NPV reduces risk (CVaR-NPV) and results in higher pricing flexibility and range, while higher prices boost NPV and affect risk.
2.3.3. Supply Chain Configuration Scenario 2
In this scenario, it is assumed that the decision-maker has no preference for one criterion over another one, and no additional information on each alternative is present. Hence, the question of, e.g., comparing
to
with respect to
, yields a similar value for all alternatives (refer to
Figure 4).
2.4. Non-Linear Programming Model Used for Sensitivity Analysis
After ranking alternatives using the ANP method and determining the rank of alternatives, the proposed non-linear mathematical model can be used to assess the extent to which the weight of each criterion has to change so as to make an alternative the top-ranked one by the ANP. The proposed approach is inspired by a similar analysis for the AHP, originally pioneered by Sowlati and Asadi [
54] for decision-making problems in management. Such results can provide valuable insights into the robustness of the rankings by a given MCDM method. The objective function and required constraint for performing the sensitivity analysis are shown in Equations (3)–(9).
Table 4 lists the sets, parameters, and variables used in the model.
Objective function (3) minimizes the sum of deviations of the new weights from the existing weights of criteria. Constraint (4) guarantees that the new global weight of alternative
under criterion
in the limit matrix
must be greater than the global weight of any other alternative
(
under the same criterion
. As the final step of the ANP model, the supermatrix is raised to powers through multiplication until it converges into a limit matrix (
. Convergence indicates that the values in each row have stabilized, reflecting the long-term influence priorities [
59]. Constraint (5) ensures that the summation of new weight of all criteria is equal to 1. Constraint (6) and (7) ensure that each new criteria weight under the specific alternative must be within a range of 0 and 1. Constraint (8) specifies that under each alternative, any increase in the weight of one criterion must be offset by a corresponding decrease in the weight of another criterion to maintain the overall balance. Lastly, the non-negativity constraint for criteria weights changes is also stated in constraint (9).
The specified NLP formulation includes
variables and approximately
constraints excluding variable bounds. To solve the mathematical model, Python programming was employed, and the corresponding code is publicly available in the author’s GitHub (
https://github.com/, accessed on 19 June 2025) repository [
91]. The open-source Python (version 3.10.9) script used for the robustness analysis can be applied to replicate the procedure with any generic dataset, ensuring transparency and reproducibility. Due to the non-linear nature of the model, the “IPOPT” solver was used to handle its non-linearity.
The percentage variation in the weight of each criterion (
CW) required to make the second alternative a top-ranked one can be calculated using Equation (10).
To compare the robustness of the ANP with the AHP, the linear programming (LP) mathematical optimization model shown in Equations (11)–(17), inspired by Sowlati and Asadi [
54], is utilized (specifically for the AHP) and developed using Python programming [
54,
91]. In this model, due to the linear nature of the model, the “GLPK (GNU Linear Programming Kit)” solver can be used, which is an open-source solver designed for linear programming problems.
where
is the weight of alternative
under criteria
.
Similar to the ANP-based sensitivity analysis model, the objective is to minimize changes in criteria weights (as per Equation (11)) while ensuring that the second alternative ranks first (constraint (12)); and ensure the total weight distribution remains balanced (constraint (13) and individual weights are non-negative and do not exceed 1, maintaining logical consistency and preventing any disproportionate influence (constraints (14)–(17)). Also, the percentage variation in the weight of each criterion (
CW) required to make an alternative a top-ranked one can be calculated using Equation (18).
3. Results and Discussion
As discussed in
Section 2.3, the ANP is an extension of the AHP that incorporates feedback loops (inner dependence) and interactions (outer dependence) between decision elements. Following the screening of alternatives and the selection of relevant criteria as discussed previously in
Table 2, a normalized decision matrix was created from the raw data in
Table 2 by converting all cost-related criteria into benefit-related criteria. Moreover, each row is normalized by dividing by the sum of the values. The resulting normalized values are presented in
Table 5. Subsequently, pairwise comparisons between the alternatives for each criterion were calculated directly from the normalized decision matrix by determining the ratio of values for each pair of alternatives based on the corresponding criterion.
For the pairwise comparisons including interdependencies among economic sub-criteria,
Table 6 illustrates one such case. The weighted priority (e-Vector) is calculated through the pairwise comparisons. By adding a feedback relationship between alternatives and criteria, a more complex decision situation should be solved. In the case of assuming scenario 1, the decision-maker has the preference of one criterion over another one (e.g., comparing
to
with respect to
is calculated). Under the same conditions applied to all pairwise comparisons in the feedback analysis, a weighted supermatrix is generated as shown in
Table 7, where the sum of each column is equal to one.
In this weighted matrix, the normalized weights for each criterion are located in the top-right section. The unreliability factor for the product quality and system reliability under specified alternatives is assumed to be 0.5 (as per Equation (2)). The normalized data from
Table 5 appears in the bottom-left section of
Table 7. The zero values in
Table 7 indicate that no interdependence was defined within either the criteria cluster or the alternatives cluster. Next, the limit matrix is presented in
Table 8, where the final scores and rankings of the candidate materials are outlined. The supermatrix reaches convergence at a power of 5. Each row of the limit matrix represents the global score for the alternatives and criteria. The normalized criteria and alternative scores are then calculated as shown in
Figure 5a and
Figure 6.
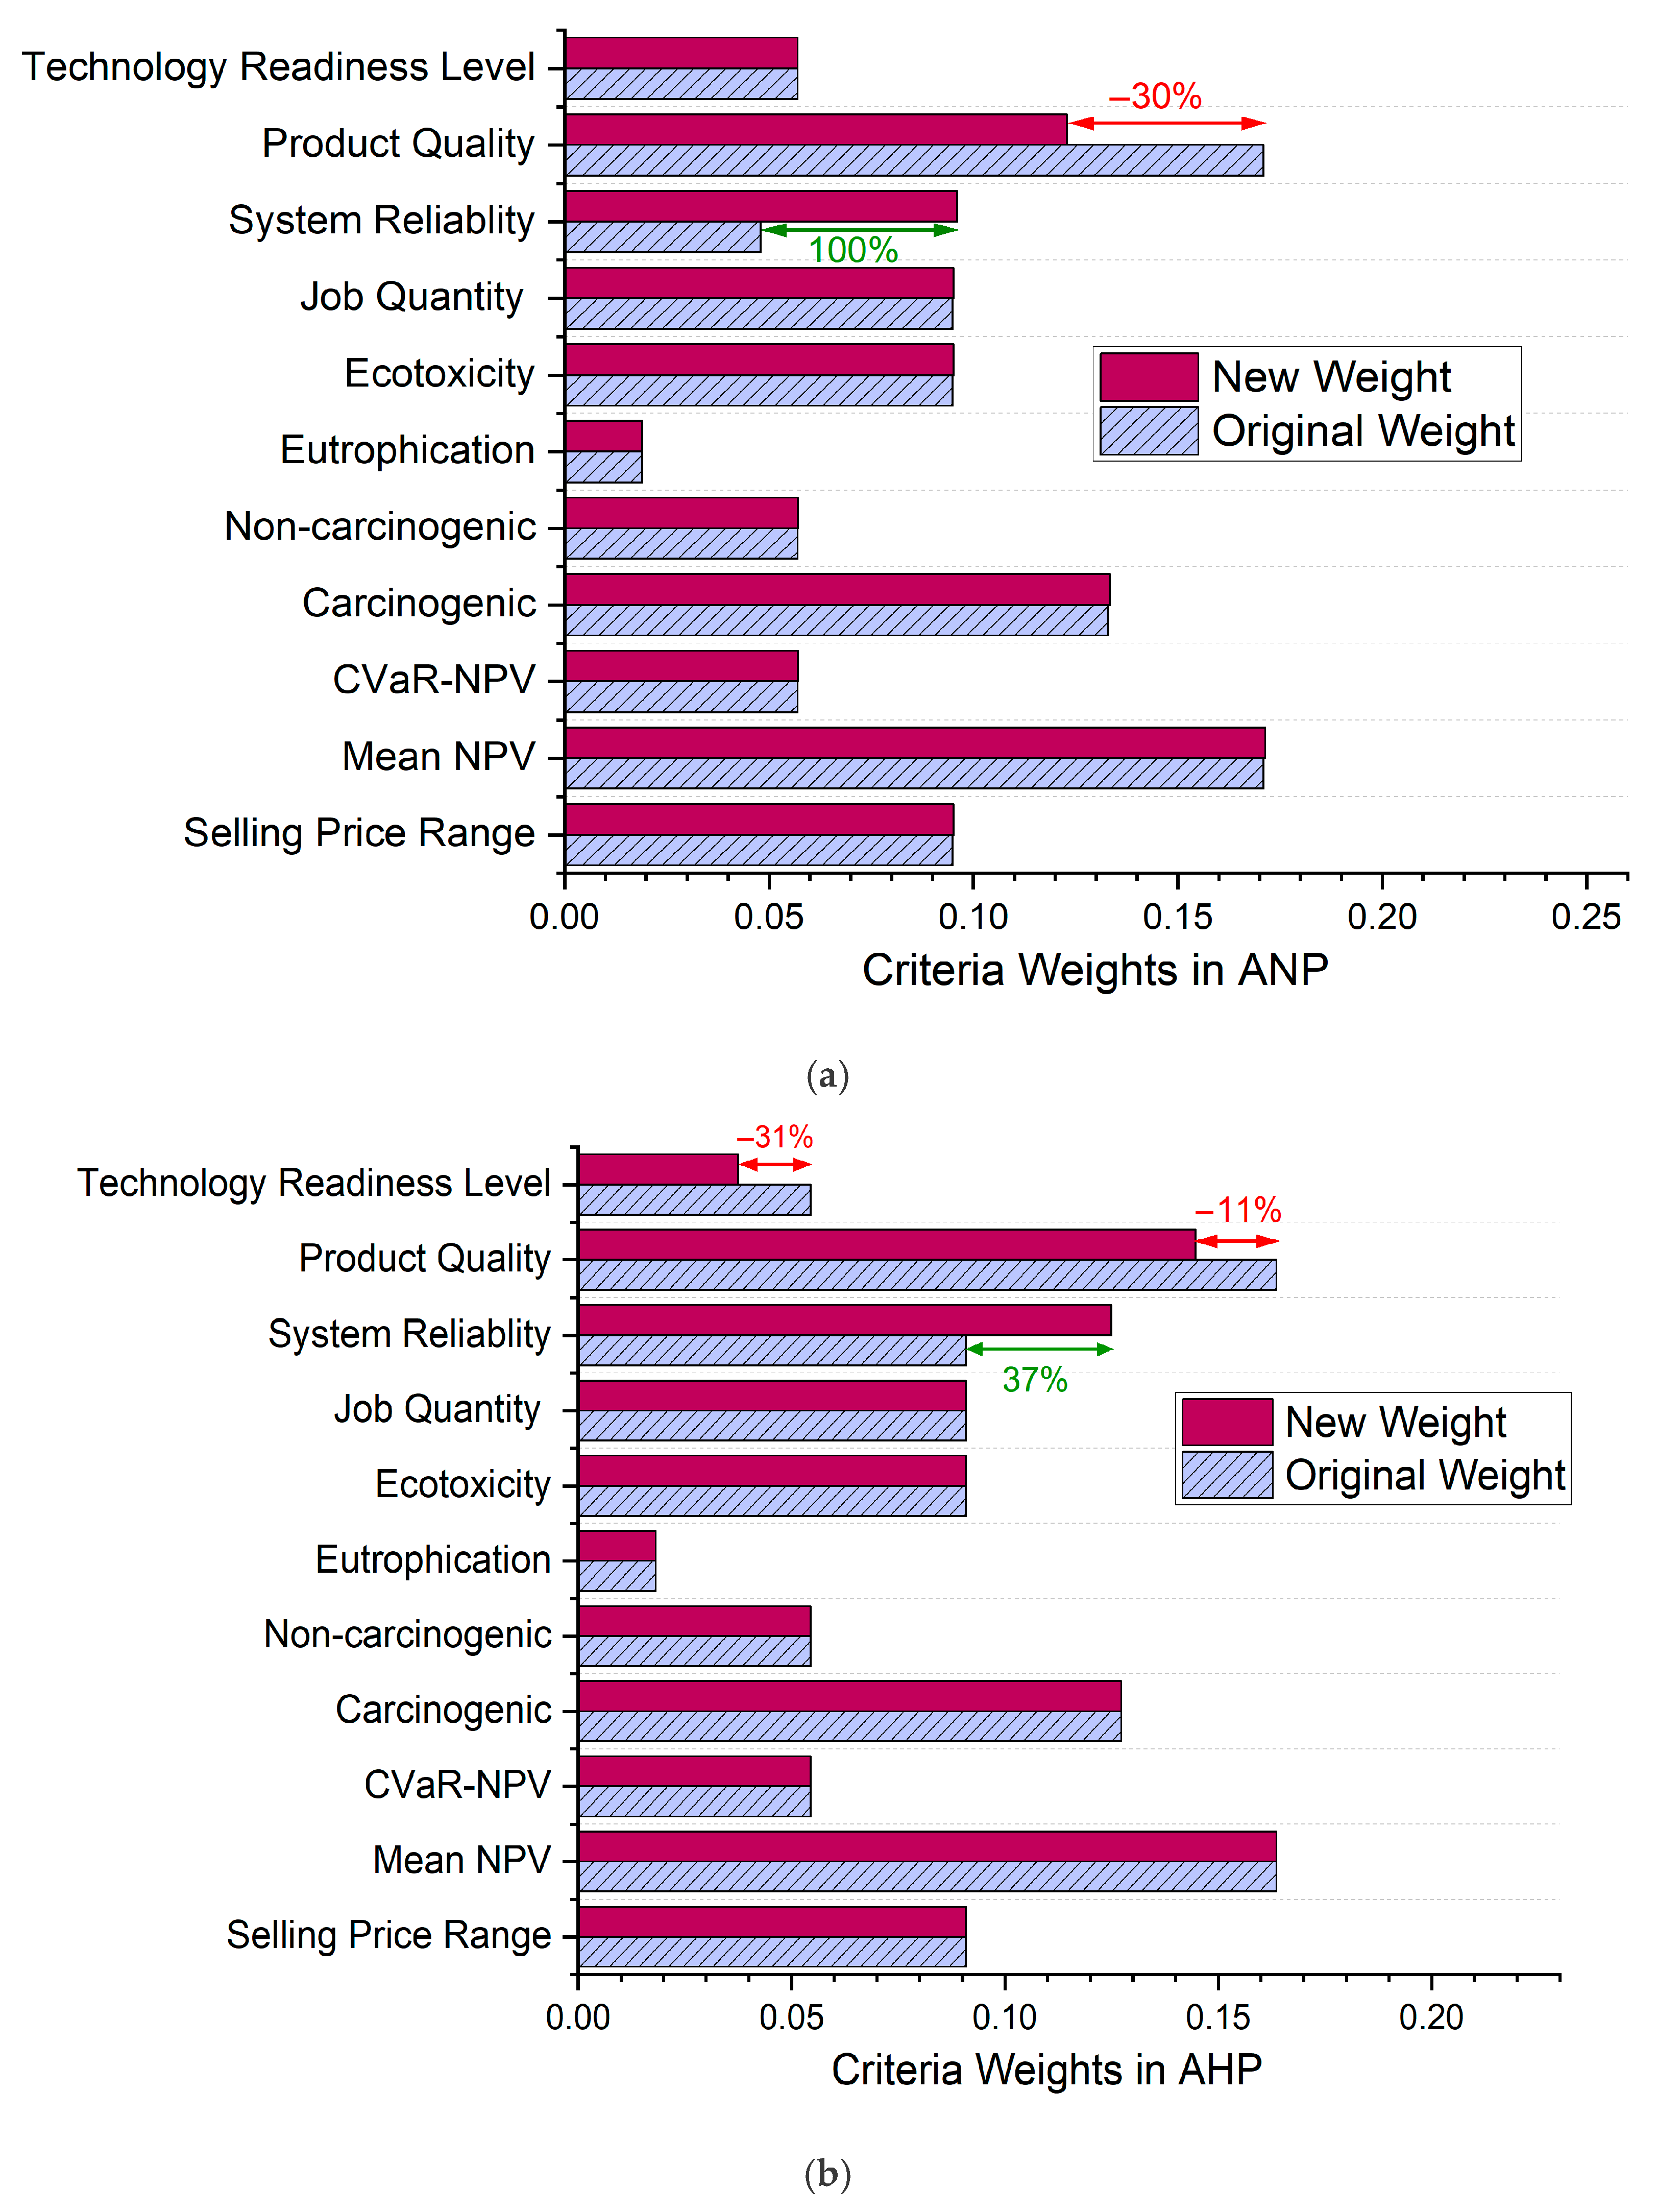
As illustrated in
Figure 5a, the ANP analysis identified the top four most important criteria for sustainable SC evaluation as follows: selling price range in the economic cluster, carcinogenic impact (a human health risk) within the environmental category, product quality from the technical aspect of sustainability assessment, and job quantity in the social cluster. When comparing these rankings with the local weights produced using the AHP model (as shown in
Figure 5b), the only notable difference is mean NPV, which ranked as the top criterion in the economic cluster when interdependencies were disregarded. This emphasizes the crucial role of interdependencies in the ANP for accurately capturing the relationships between criteria, which are often overlooked in simpler models like the AHP. Additionally, in the global weights produced by the ANP, selling price range and CVaR-NPV rank higher than that of the AHP, likely due to the strong interdependencies between economic metrics and other sustainability dimensions, which the ANP is positioned to capture. Furthermore, as shown in
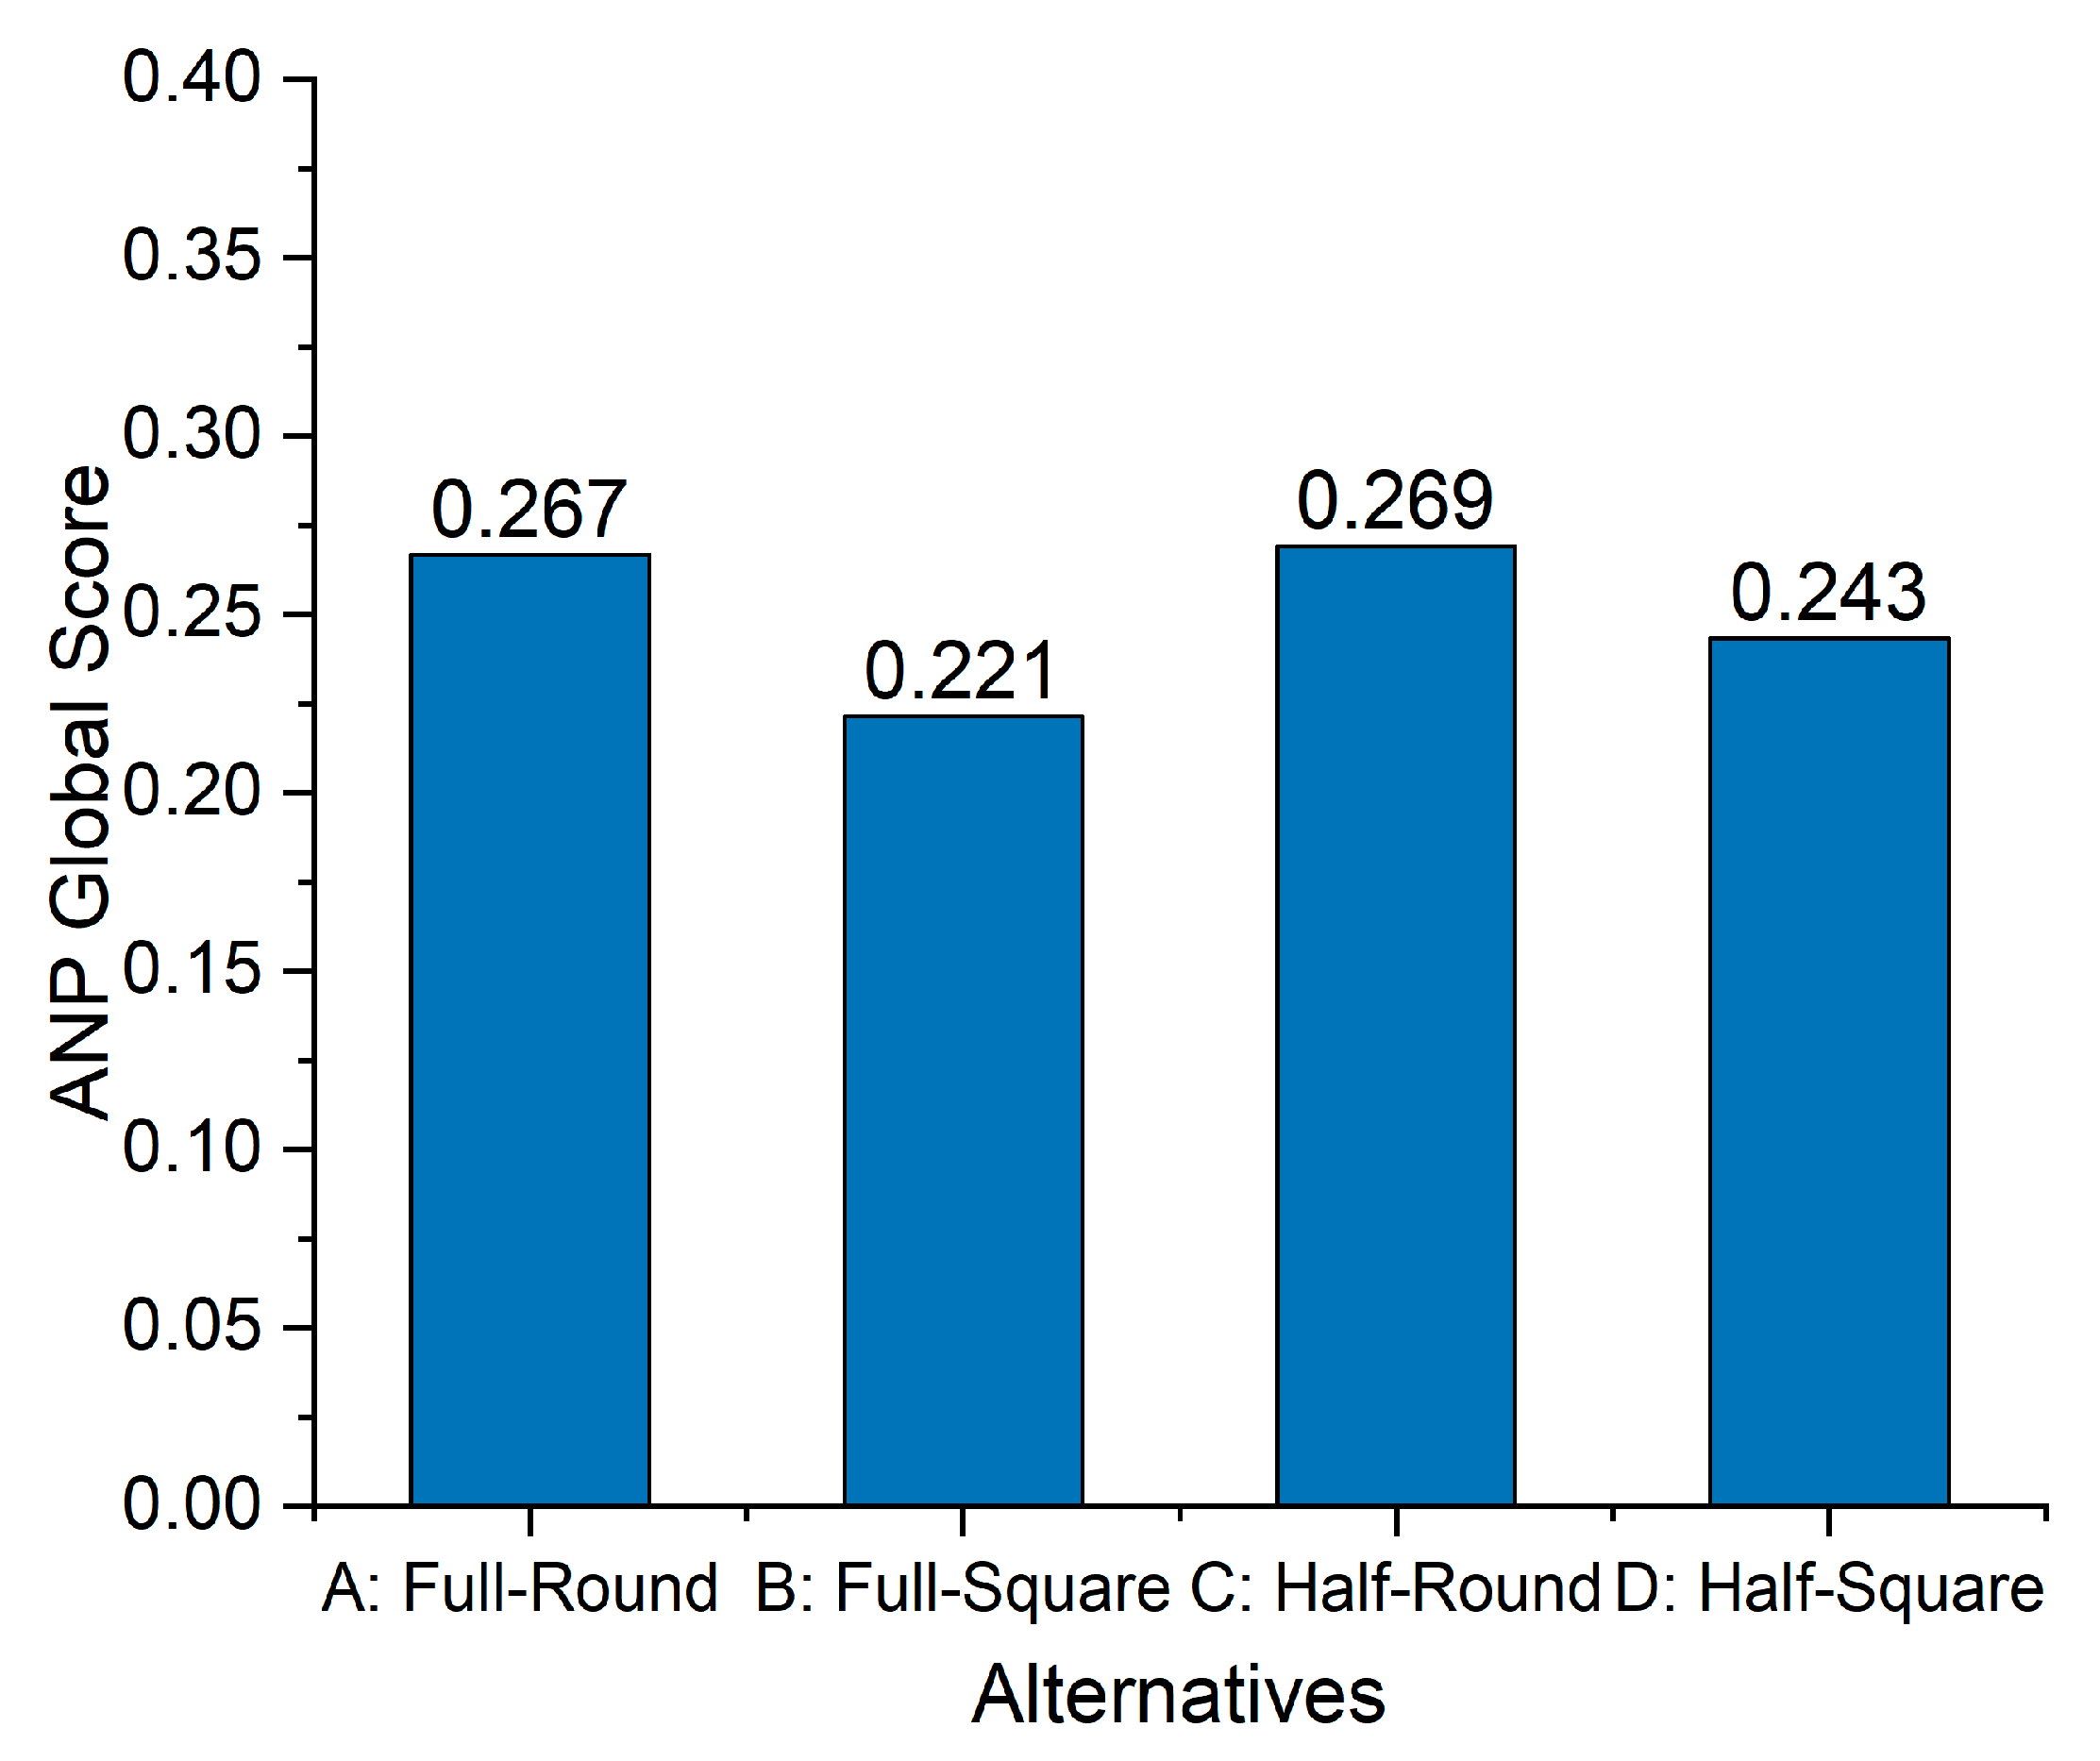
Figure 6, Alternative C slightly outperformed the other alternatives, although its difference over Alternative A was marginal (0.002), indicating a comparable overall performance. This slightly higher performance for Alternative C was primarily driven by its higher mean NPV of CAD 65.28 M and superior product quality, which carried greater weights in the local supermatrix.
Additionally, this alternative offers the most substantial job quantities (14 jobs), further underscoring its social dimension. These factors underscore the economic and technical strengths of this alternative, contributing significantly to its overall rankings. However, the environmental impacts of this alternative is worse compared with that of other alternatives, especially due to the lower efficiency and capacity of equipment affecting the energy and resource consumption, as supported by previous work. The high negative environmental impacts are mainly due to the fertilizer and diesel use in the agricultural stage of production [
41]. Environmental emissions of productions can be further reduced by replacing the nitrogen fertilizer with compost, as analyzed in the previous work by Akbarian-Saravi et al. [
58].
The Full-Round alternative is positioned closely in second place, achieving a score of 0.267. Although its mean NPV (CAD 61.65 M) is slightly lower than Half-Round, it still ranks highly. This alternative also performs well in product quality (medium) and has strong system reliability (high). Despite having more moderate environmental impacts and job quantities (13 jobs), its moderate performance across multiple categories leads to a competitive ranking just behind Half-Round. With a score of 0.221, the Full-Square alternative ranks lowest, primarily due to its poor performance in key areas such as product quality and job quantity. Although it has the lowest environmental impacts, including eutrophication (26.05 kg N eq) and carcinogenic impact (0.00049 CTUh), its weaker economic performance, especially mean NPV (CAD 53.96 M) and other technical disadvantages, lead to this alternative’s lower ranking. The difference between the top two alternatives and the fourth-ranked Full-Square is more significant, reflecting a reduction in performance, particularly in the technical and social dimensions.
The closeness in scores between the Half-Round and Full-Round alternatives indicates that small changes in criteria weights or performance can significantly affect the rankings. This sensitivity analysis underscores the value of using an optimization model to evaluate the minimal adjustments needed to alter the rankings. Furthermore, as shown in
Table 9, although both the AHP and ANP methods result in the same ranking of alternatives, their final scores differ, which has important implications for decision-making. For example, Alternative C has the highest global weight (0.2797 and 0.269) under the AHP and ANP methods, respectively, but achieves this differently due to the criteria interdependencies considered in the ANP. Slightly lower global scores in the ANP compared with the AHP is because of the interdependencies among economic criteria such as selling price range, mean NPV, and CVaR-NPV. The ANP approach, by accounting for interdependencies between economic criteria, can produce more nuanced results that may better reflect the complex relationships between different factors. Accordingly, by applying the optimization model, the robustness of these rankings is tested. By comparing how sensitive the AHP and ANP models are to such changes, the stability and reliability of rankings are assessed.
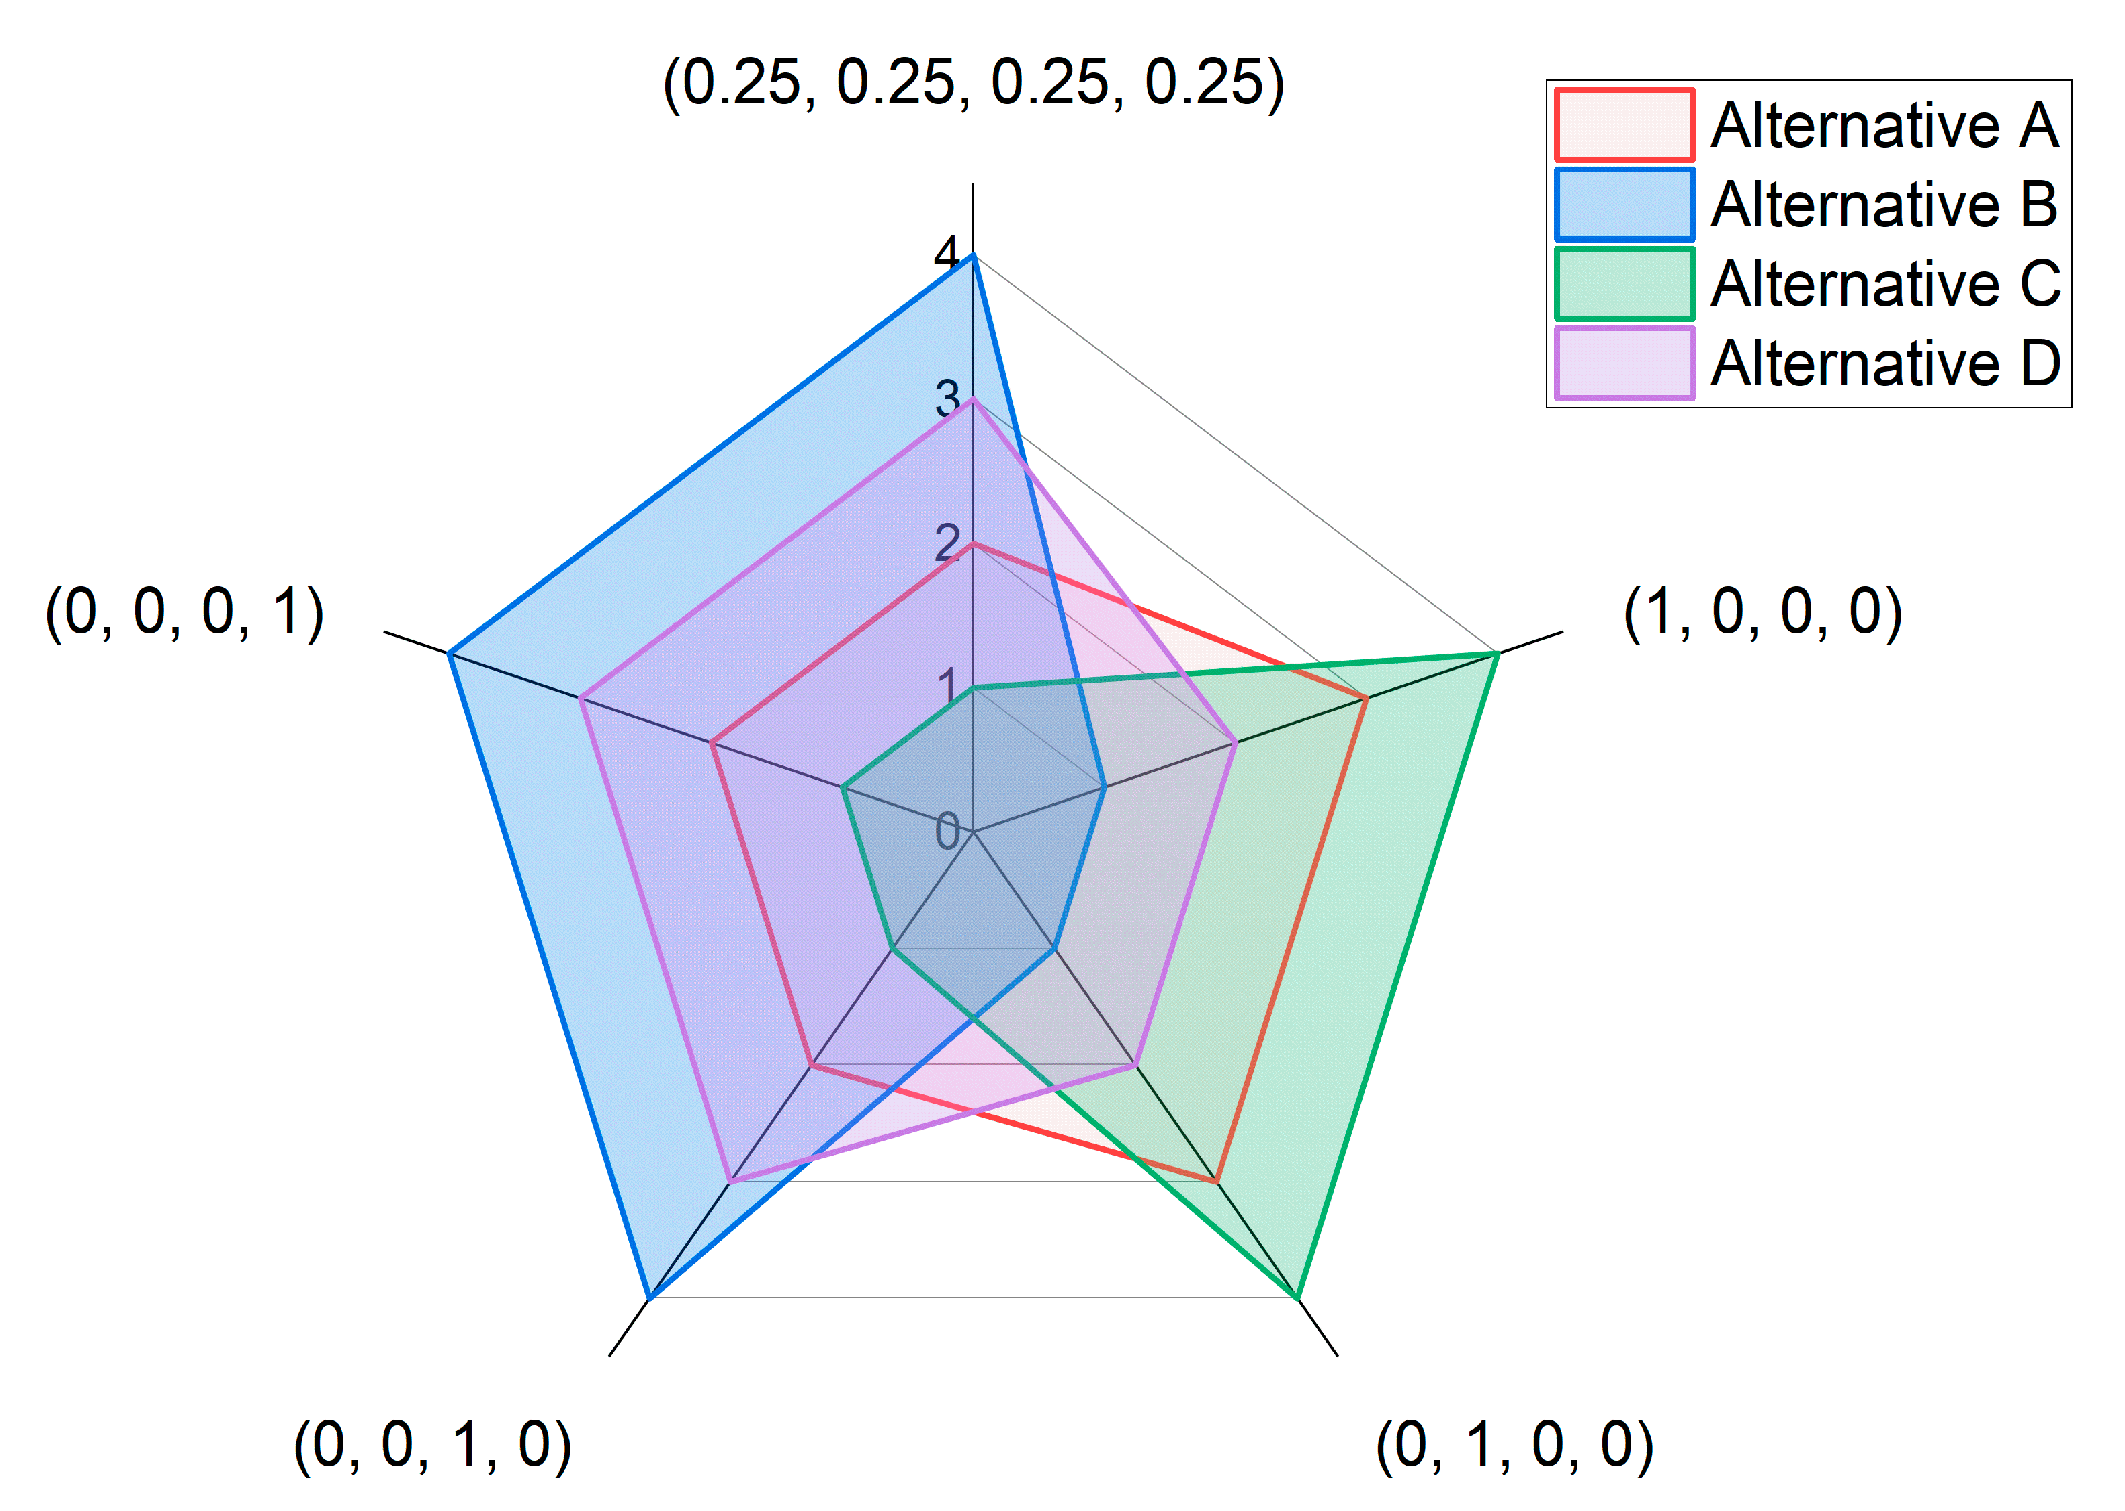
Presenting decision-making problems through performance clusters, as shown in
Figure 7, is particularly useful for large-scale SC selection processes. This approach facilitates assessing alternatives based on specific clusters, such as economic, environmental, social, and technical properties. By adjusting the weight of a particular cluster to one while setting the others to zero, the decision-maker can repeat the same model. For instance, to evaluate alternatives merely on economic performance, the weight for the economic cluster is set to one and others to zero, where Alternative B performs best. Under environmental considerations, Alternative B is selected due to its superior environmental performance. In another scenario, equal weights may be assigned to all clusters. As presented in
Figure 7, the rankings demonstrate the model’s adaptability across various scenarios. While the results shift depending on the importance of different criteria clusters, Alternative C consistently ranks as a top alternative, particularly when social and technical factors are given priority.
To test the robustness of ANP ranking results, a sensitivity analysis was conducted by varying the UF within the 0.1–1 range. As shown in
Figure 8, the ranking of the top alternatives remained largely stable across UF values. It was only at the lowest tested UF (0.1) that a minor shift in ranking between Alternative A and C was detected. In this case, Alternative A overtakes Alternative C, highlighting how greater uncertainty can lead to a shift in rankings. This shift shows that when uncertainty is significant, the model becomes sensitive to the slightest variations in the criteria’s influence, resulting in ranking changes that are closer to real-world unpredictability. For the final analysis, a UF of 0.5 was selected to represent a balanced level of uncertainty, ensuring that the results are reliable while still accounting for realistic uncertainty.
As explained in
Section 2.4, in order to test the robustness of the MCDM model (namely, finding the solution’s resistance limit against changes in criteria weights and causing rank reversals), an optimization-based programming model is developed on the ANP and AHP. The new criteria weights and the corresponding percentage changes have been calculated and are detailed based on the model solution in
Table 10 and
Figure 9.
As shown in
Figure 9a, the sensitivity analysis reveals that in the ANP model, significant weight adjustments are required for Alternative A (originally ranked second) to become the top-ranked option. Specifically, the weight of “system reliability” criterion would need to increase by 100%, while the weight of “product quality” would need to decrease by 30%. While theoretically feasible, such a large shift (+100% “system reliability” weight) may not be practically justifiable in most real-world contexts without substantial changes in system design or operating priorities. This insight reinforces the robustness of the original ranking under reasonable variations in input weight. These recalibrated weights and their impacts on alternative scores are presented in detail in
Table 10. This implies that if “system reliability” is prioritized over “technology readiness level”, Alternative A (Full-Round) could surpass the other alternatives, given its strength in that criterion.
In contrast, in the AHP model, as indicated in
Figure 9b, smaller adjustments are necessary for Alternative A to rank first. A 37% increase in the weight of “system reliability”, along with decreases of 11% and 31% in “product quality” and “technology readiness level”, respectively, would suffice to change the rankings. The AHP assumes no interdependencies between criteria, which simplifies the problem and allows for smaller changes to criteria weights to affect the rankings.
The analysis highlights that the ANP model demands more substantial changes in criteria weights to alter the rankings, indicating a higher level of stability and resilience to variations in input parameters compared with the AHP. This robustness makes the ANP a preferred choice in decision-making processes where stability is critical. Additionally, the developed non-linear programming model for the ANP approach, solved using the IPOPT solver in Python, offers the capability to estimate the minimum changes required to alter alternative rankings.
This sensitivity analysis reinforces that while the AHP and ANP may yield similar rankings under stable conditions, the ANP approach demonstrates greater resilience when facing changes in criteria or weightings. This makes it a more robust choice for complex decision-making processes like sustainability assessments, where criteria interdependencies and external factors can play a crucial role. The optimization model further enhances the decision-making process by quantifying the minimum changes needed to shift rankings, confirming the reliability and adaptability of the ANP in dynamic scenarios.
In terms of computational efficiency, the AHP model completed its analysis in approximately 1 s, whereas the ANP model required around 5 s using the same Python implementation. While both runtimes are negligible for the present case study, the difference becomes more relevant for large-scale problems or real-time decision environments involving numerous alternatives, criteria, and interdependencies. In such contexts, the trade-off between comprehensive modeling capability (as offered by the ANP) and faster processing (as provided by the AHP) should be considered based on each given application needs.
Although the AHP method is often favored for its simplicity and transparency, the ANP method provides greater modeling depth by capturing inner and outer dependencies among criteria. This enhanced capability, however, comes with increased computational demand and data preparation complexity. To strengthen decision quality under both approaches, our analysis incorporated an NLP-based sensitivity analysis. This step improves interpretability and robustness by identifying how weight changes affect final rankings, offering valuable insights regardless of the method used.
Overall, the results demonstrate that the ANP offers deeper insight against rank reversal, whereas the AHP remains preferable when simplicity and runtime are paramount.
4. Conclusions
In this study, a comprehensive ANP-based MCDM framework was developed for evaluating the sustainable SC selection for a hemp-based biocomposite production. The framework accounted for economic, environmental, social, and technical dimensions while explicitly addressing the dependencies decision elements, particularly within the economic cluster, an aspect often overlooked in traditional MCDM methods such as the AHP approach. The dependencies within the economic cluster include the relationships between criteria such as selling price range, mean NPV, and CVaR-NPV. For example, selling price directly influences both mean NPV and CVaR-NPV, reflecting its role in determining both the profitability (NPV) and the financial risk (CVaR), underscoring how adverse fluctuations in selling price can significantly impact average NPV and financial risk under worst-case scenarios. The analysis of four biomass pre-processing alternatives identified the Half-Round option as the top choice, primarily due to its strong economic performance, notably in mean NPV and product quality. Its positive contributions to job creation further strengthened its ranking in the social dimension. The Full-Round option closely followed, performing well across multiple dimensions, including system reliability and product quality. Conversely, the Full-Square alternative ranked lowest due to its weaker performance in technical and social criteria, despite some environmental benefits.
In addressing uncertainties in qualitative data in criteria weights under specific alternatives, the unreliability factor (UF) was introduced. For example, lower weights were assigned to alternatives with lower confidence in their evaluation by the decision-maker, such as Alternative A (full-screen hammer mill and round baler) and Alternative D (half-screen hammer mill and square baler), due to inconsistent product quality within the respective baler or hammer mill equipment. While rankings remained stable across most UF values, a higher uncertainty (e.g., UF = 0.1) caused significant shifts, particularly between the top two alternatives ranking. Under increased uncertainty, the Full-Round alternative overtook Half-Round, illustrating how uncertainty can impact outcomes. This underscores the importance of incorporating uncertainty in decision models, especially in qualitative factors assessment. The final analysis used a balanced UF of 0.5, providing both reliability and realism.
To evaluate the robustness of the ANP method against the AHP method due to criterial weights changes, a non-linear programming (NLP) model was developed as part of ANP sensitivity analysis, alongside a linear programming (LP) model for the AHP. The results demonstrated that the ANP approach required significant changes in criteria weights to alter/reverse the rankings, indicating its stability in decision-making with variable inputs. Conversely, the AHP method, while simpler, required smaller weight adjustments to affect rankings, suggesting that it may be less effective in handling complex interdependencies. This robustness makes the ANP approach particularly valuable for industries facing dynamic sustainability challenges, where decision stability is essential despite fluctuating criteria weights or external conditions.
In conclusion, the proposed ANP-based framework, combined with optimization-based sensitivity analysis, provided a robust tool for decision-makers aiming to ensure the sustainable development of biocomposite SCs. By incorporating dependencies and conducting sensitivity analysis, this framework could offer a more reliable and adaptable decision-making process, ensuring that selected alternatives align with both economic viability and sustainability goals. From a practical standpoint, the framework is well suited for early-stage planning and policy evaluation but may face limitations in contexts with limited data or expert access. In future research, integrating simulation models into SC data gathering is recommended to improve the accuracy and precision of sustainability measurements, addressing a gap in previous research, as noted by Perez et al. [
8]. Furthermore, it is needed to explore and test the extension of this model to other biocomposite industries and SCs, as well as integrate dynamic (time-dependent) criteria to further enhance its applicability in rapidly evolving environments. Additionally, examining the interdependencies among all criteria and sub-criteria through the ANP approach can provide a deeper, more comprehensive understanding of the relationships between these various elements. Future work should also aim to incorporate additional social sustainability indicators, such as occupational health risks or community-level impacts, as more operational and contextual data become available. This would support a more holistic representation of the social dimension in equipment-related decision-making. The developed robustness NLP model for the ANP can also be extended to more advanced techniques such as DANP (DEMATEL-based ANP), as studied by Shao and Lo [
92] and Shao et al. [
93].


