Article

The Nexus Between Economic Growth and Water Stress in Morocco: Empirical Evidence Based on ARDL Model

by
Mariam El Haddadi
*,
Hamida Lahjouji
and
Mohamed Tabaa
Multidisciplinary Laboratory of Research and Innovation (LPRI), Casablanca 20250, Morocco
*
Author to whom correspondence should be addressed.
Sustainability 2025, 17(15), 6990; https://doi.org/10.3390/su17156990 (registering DOI)
Submission received: 1 July 2025 / Revised: 19 July 2025 / Accepted: 23 July 2025 / Published: 1 August 2025

Abstract

Morocco is facing a situation of alarming water stress, aggravated by climate change, overexploitation of resources, and unequal distribution of water, placing the country among the most vulnerable to water scarcity in the MENA region. This study aims to investigate the dynamic relationship between economic growth and water stress in Morocco while highlighting the importance of integrated water management and adaptive economic policies to enhance resilience to water scarcity. A mixed methodology, integrating both qualitative and quantitative methods, was adopted to overview the economic–environmental Moroccan context, and to empirically analyze the GDP (gross domestic product) and water stress in Morocco over the period 1975–2021 using an Autoregressive Distributed Lag (ARDL) approach. The empirical analysis is based on annual data sourced from the World Bank and FAO databases for GDP, agricultural value added, renewable internal freshwater resources, and water productivity. The results suggest that water productivity has a significant positive effect on economic growth, while the impacts of agricultural value added and renewable water resources are less significant and vary depending on the model specification. Diagnostic tests confirm the reliability of the ARDL model; however, the presence of outliers in certain years reflects the influence of exogenous shocks, such as severe droughts or policy changes, on the Moroccan economy. The key contribution of this study lies in the fact that it is the first to analyze the intrinsic link between economic growth and the environmental aspect of water in Morocco. According to our findings, it is imperative to continuously improve water productivity and adopt adaptive management, rooted in science and innovation, in order to ensure water security and support the sustainable economic development of Morocco.

Graphical Abstract

1. Introduction

Access to clean water is one of the most basic human needs. The United Nations’ 2023 World Development Report revealed that one in four people in the world (approximately 2 billion people) do not have access to safe drinking water. Additionally, almost half of the global population does not have access to adequate sanitation.
However, nowadays, the sustainable management of water resources represents a major occupation that arouses the interest of governments, practitioners, and researchers around the world. Nationally, the World Resources Institute [1] ranked Morocco 27th among countries most at-risk of water shortage. The WRI indicates that Morocco will reach an extremely high level of water stress by 2040. To rebuild and restore water availability across the country, Morocco implemented a “National Water Plan” (PNE) in 2020, setting out an ambitious action plan to invest nearly USD 40 billion into the water sector. In 2022, an additional budget was allocated to support the National Program for Drinking Water Supply and Irrigation 2020–2027 (a subset of the National Water Plan).
This strategy is crucial given that the agriculture sector in Morocco, which contributes around 10.1% of national GDP [2] and consumes almost 87% of the country’s water [3] (HCP, 2020), is directly impacted.
Faced with this economic dependence and agriculture’s vulnerability to climatic hazards, this study aims to respond to the following core research question: How do water productivity and water stress affect economic growth in Morocco?
To address this question, three hypotheses were proposed:
H1. 
Water productivity is associated with economic growth.
H2. 
Agriculture value added is associated with economic growth.
H3. 
Renewable fresh water is associated with economic growth.
This study makes an original contribution to understanding the link between economic growth and water stress in Morocco, a country facing increasing challenges in terms of water scarcity. While a great deal of research exists at the global and regional (MENA) level [4,5,6], there is a lack of studies regarding the existing background that analyze the Moroccan case, using advanced time-series econometric methods.
This study makes a significant research contribution to sustainability and environmental concerns by using the ARDL model to investigate the interaction between GDP, agricultural value added, renewable water resources, and water productivity. Unlike existing studies that predominantly use CO2 emissions to validate the Environmental Kuznets Curve (EKC) hypothesis in Morocco, this research focuses only on water stress as an environmental factor that could impact economic growth and the agriculture sector. This study offers a fresh perspective emphasizing, empirically, the importance of water resources in Morocco’s economic and agricultural sectors. The approach not only addresses a significant gap in the current literature but also delivers critical insights for policymakers striving to achieve sustainable economic growth while managing water resources effectively.
This study is presented in four sections: After the introduction, Section 2 presents a description of the existing literature related to economic growth, agriculture water use, and water stress in Morocco. Section 3 presents a spatial analysis of the Moroccan water warries context, challenges, and policies adopted by the country. Section 4 presents the data and the empirical approach employed in this research. Section 6 provides the empirical findings of the ARDL Model. In Section 7, some concluding remarks and recommendations are made.

2. Literature Review

The international literature on the link between economic growth and environmental degradation has expanded considerably since the concept of the Environmental Kuznets Curve (EKC) was formalized by Grossman and Krueger [7], following on from the seminal work of Kuznets [8]. The EKC postulates an inverted U-shaped relationship between economic wealth (generally measured by GDP per capita) and indicators of pollution or pressure on the environment: at the beginning of the development process, economic growth is accompanied by environmental deterioration, then above a certain income threshold, stricter policies, better environmental governance, and the adoption of clean technologies promote improvements in environmental quality [7,9].
Initially applied to air pollutant emissions, the EKC was then tested on multiple environmental dimensions, including water management and water stress. For example, David Katz [10] shows that, in several regions of the world, freshwater withdrawals increase with growth, but tend to stabilize, or even decrease, as societies reach a certain level of development and invest in water efficiency and reuse.
Numerous recent works have set out to explore this dynamic in a variety of geographical contexts:
-
Esen et al. [11], focusing on the Eurozone, confirms the existence of an EKC between GDP per capita and water stress indicators, highlighting the key role of European regulation, investment in innovation, and the rise in environmental policies.
-
Gu et al. [12], for China, observe that the rapid transition to a more tertiary economy and the strengthening of water-saving public policies have reversed the upward trend in water withdrawals, especially in large metropolises and intensive agricultural basins.
-
Katz [10], through a multi-country analysis, demonstrates that the exact shape of the curve (inverted U or not) depends on the type of indicator used (total abstraction, water stress, and per capita availability) and the level of institutional development.
Furthermore, the literature insists that the EKC relationship can be influenced by sectoral factors: Saidamatmatov et al. [13] in Central Asia, Dai, D. et al. [14] in China, and Arbulu et al. [15] for the Eurozone, highlight that water consumption in sectors such as agriculture, industry, and tourism plays a decisive role in the evolution of water stress.
For example, irrigated agriculture is identified as the main driver of water stress in developing economies, whereas in advanced economies, improved water productivity and technological innovation enable a partial decoupling between growth and water consumption [10,16].
The econometric method favored for these studies varies, from dynamic panel models (GMM and FMOLS) to the ARDL approach to capture short- and long-term effects [13]. The inclusion of explanatory variables such as the sectoral structure of GDP, energy consumption, investment in clean technologies, or public water allocation policies enriches the analysis and refines our understanding of the phenomenon [9,11].
Finally, some works warn against a mechanical reading of the EKC: the drop in pressure on water observed in certain advanced countries can also be explained by the relocation of water-intensive industries to emerging countries, or by trade-offs that are sometimes unfavorable to certain ecosystems [10]. As a result, we need to think in terms of the global water footprint and integrate the notion of international trade into the analysis.
In Morocco, the literature on the relationship between economic development and water stress has developed more recently, in response to the worsening national water deficit and growing awareness of water security issues. The major empirical contribution in this scope is conducted by Moussaid et al. [17], who test the Environmental Kuznets curve hypothesis over the period 1980–2017 using Tapio decoupling index to link real GDP per capita, water demand, urbanization, and sectoral structure. Their results reveal an inverted U-shaped relationship, with a turning point located at an intermediate level of per capita income, beyond which pressure on water resources tends to decrease. This dynamic is mainly attributed to improved water governance, economic diversification, and the rise in water-saving irrigation technologies (drip irrigation, desalination plants, etc.).
Taheripour et al. [18] conduct a study by using a computable general equilibrium (CGE) model, that water scarcity and changes in crop yields induced by climate change could reduce the GDP of Morocco up to 6.7 billion US dollars per year at 2016 constant prices and eliminate many job opportunities, particularly in the rural region.
Elame et al. [19] develop an economic model based on positive mathematical programming for showing that the basin’s water resources, in Sous-Massa (Morocco), are substitutable and that a sound water management policy has to integrate both surface and groundwater resources to reduce the price of water.
On the other hand, Boudhar et al. [20] use an input-output (I-O) model of water use to analyze the intricate relationships between economic sectors and water resources in Morocco, and found that the agriculture, hunting, and forestry sector exhibits high direct water use compared to secondary and tertiary sectors that display low direct use and high indirect water use.
Other studies, such as Et-Touil [21], qualitatively extend the analysis by incorporating additional factors such as water stress, food security, and population growth. The author shows that Moroccan agriculture remains the sector most vulnerable to water scarcity, but that significant progress has been made in water use efficiency thanks to proactive public policies (Plan Maroc Vert, Programme National d’Économie d’Eau d’Irrigation—PNEEI). Nevertheless, the persistence of recurrent droughts, demographic pressure, and dependence on irrigated crops continue to pose a major risk to the sustainability of the agricultural development model.
National literature also points to the importance of institutional determinants and adaptation strategies: recent analyses stress the need for integrated resource management, strengthened local water governance, and better coordination between agricultural, environmental, and industrial policies [17,21]. Some studies, fewer in number, propose broadening the research spectrum to include the impact of foreign trade on the country’s water footprint, or the effect of technology transfers on water use intensity [22].
Overall, the previous studies that have discussed the interaction between water and economic growth in Morocco lack an econometric model that could analyze the long-run (cointegrating) and short-run relationships between those variables. Furthermore, the existing literature does not adopt a mixed methodology that could advance a qualitative and quantitative analysis, to highlight the overview of Moroccan environmental and economic context and policies, and investigate empirically the effect of water scarcity on economic growth.
The present research is unique compared to previous studies in both methodological approach and econometric methods. Unlike the existing literature, our research advances a mixed methodology and adopts a rigorous empirical approach based on the ARDL model. In addition, this research fills a gap in the literature by proposing an updated long-term analysis, considering recent policy developments and climate variability.

3. Overview of the Moroccan Context

Sustainable water management is one of the major challenges facing global development today. Some 2 billion people still do not have access to safe drinking water, according to the United Nations World Development Report [23], highlighting the extent of water inequalities [24]. The situation is worrying as the demand for fresh water continues to grow because of urbanization and the expansion of the industrial and agricultural sectors [2].
Sanitation infrastructures also show major disparities. Statistics highlight that only 54% of the world’s population had access to safely managed sanitation facilities in 2020 [25], while over 3.6 billion people lived in areas with inadequate access to sanitation. This limited access to water and sanitation has considerable implications on public health, human development, and socio-economic stability [23].
According to the FAO report, nearly 70% of the world’s freshwater withdrawals are used for irrigation, accentuating competition for resources with the domestic and industrial sectors [16]. This dependence of agriculture on water, particularly in arid and semi-arid regions, highlights the sensitivity of food security to variations in water availability [24]. Moreover, the impacts of climate change, which are accentuated by the increasing frequency and intensity of droughts, soil degradation, and reduced rainfall, are further aggravating global water stress [26].
Morocco, as a developing country, has achieved significant strides in economic growth, driven by strategic reforms that have enhanced its competitiveness [3]. However, the nation faces pressing climate change challenges, including water scarcity. This section aims to present, firstly, an overview of the value added of the agriculture sector in Morocco; secondly, Moroccan environmental and water challenges; and thirdly, the main national environmental strategies and laws adopted related to water.

3.1. Agriculture Added Value in Morocco

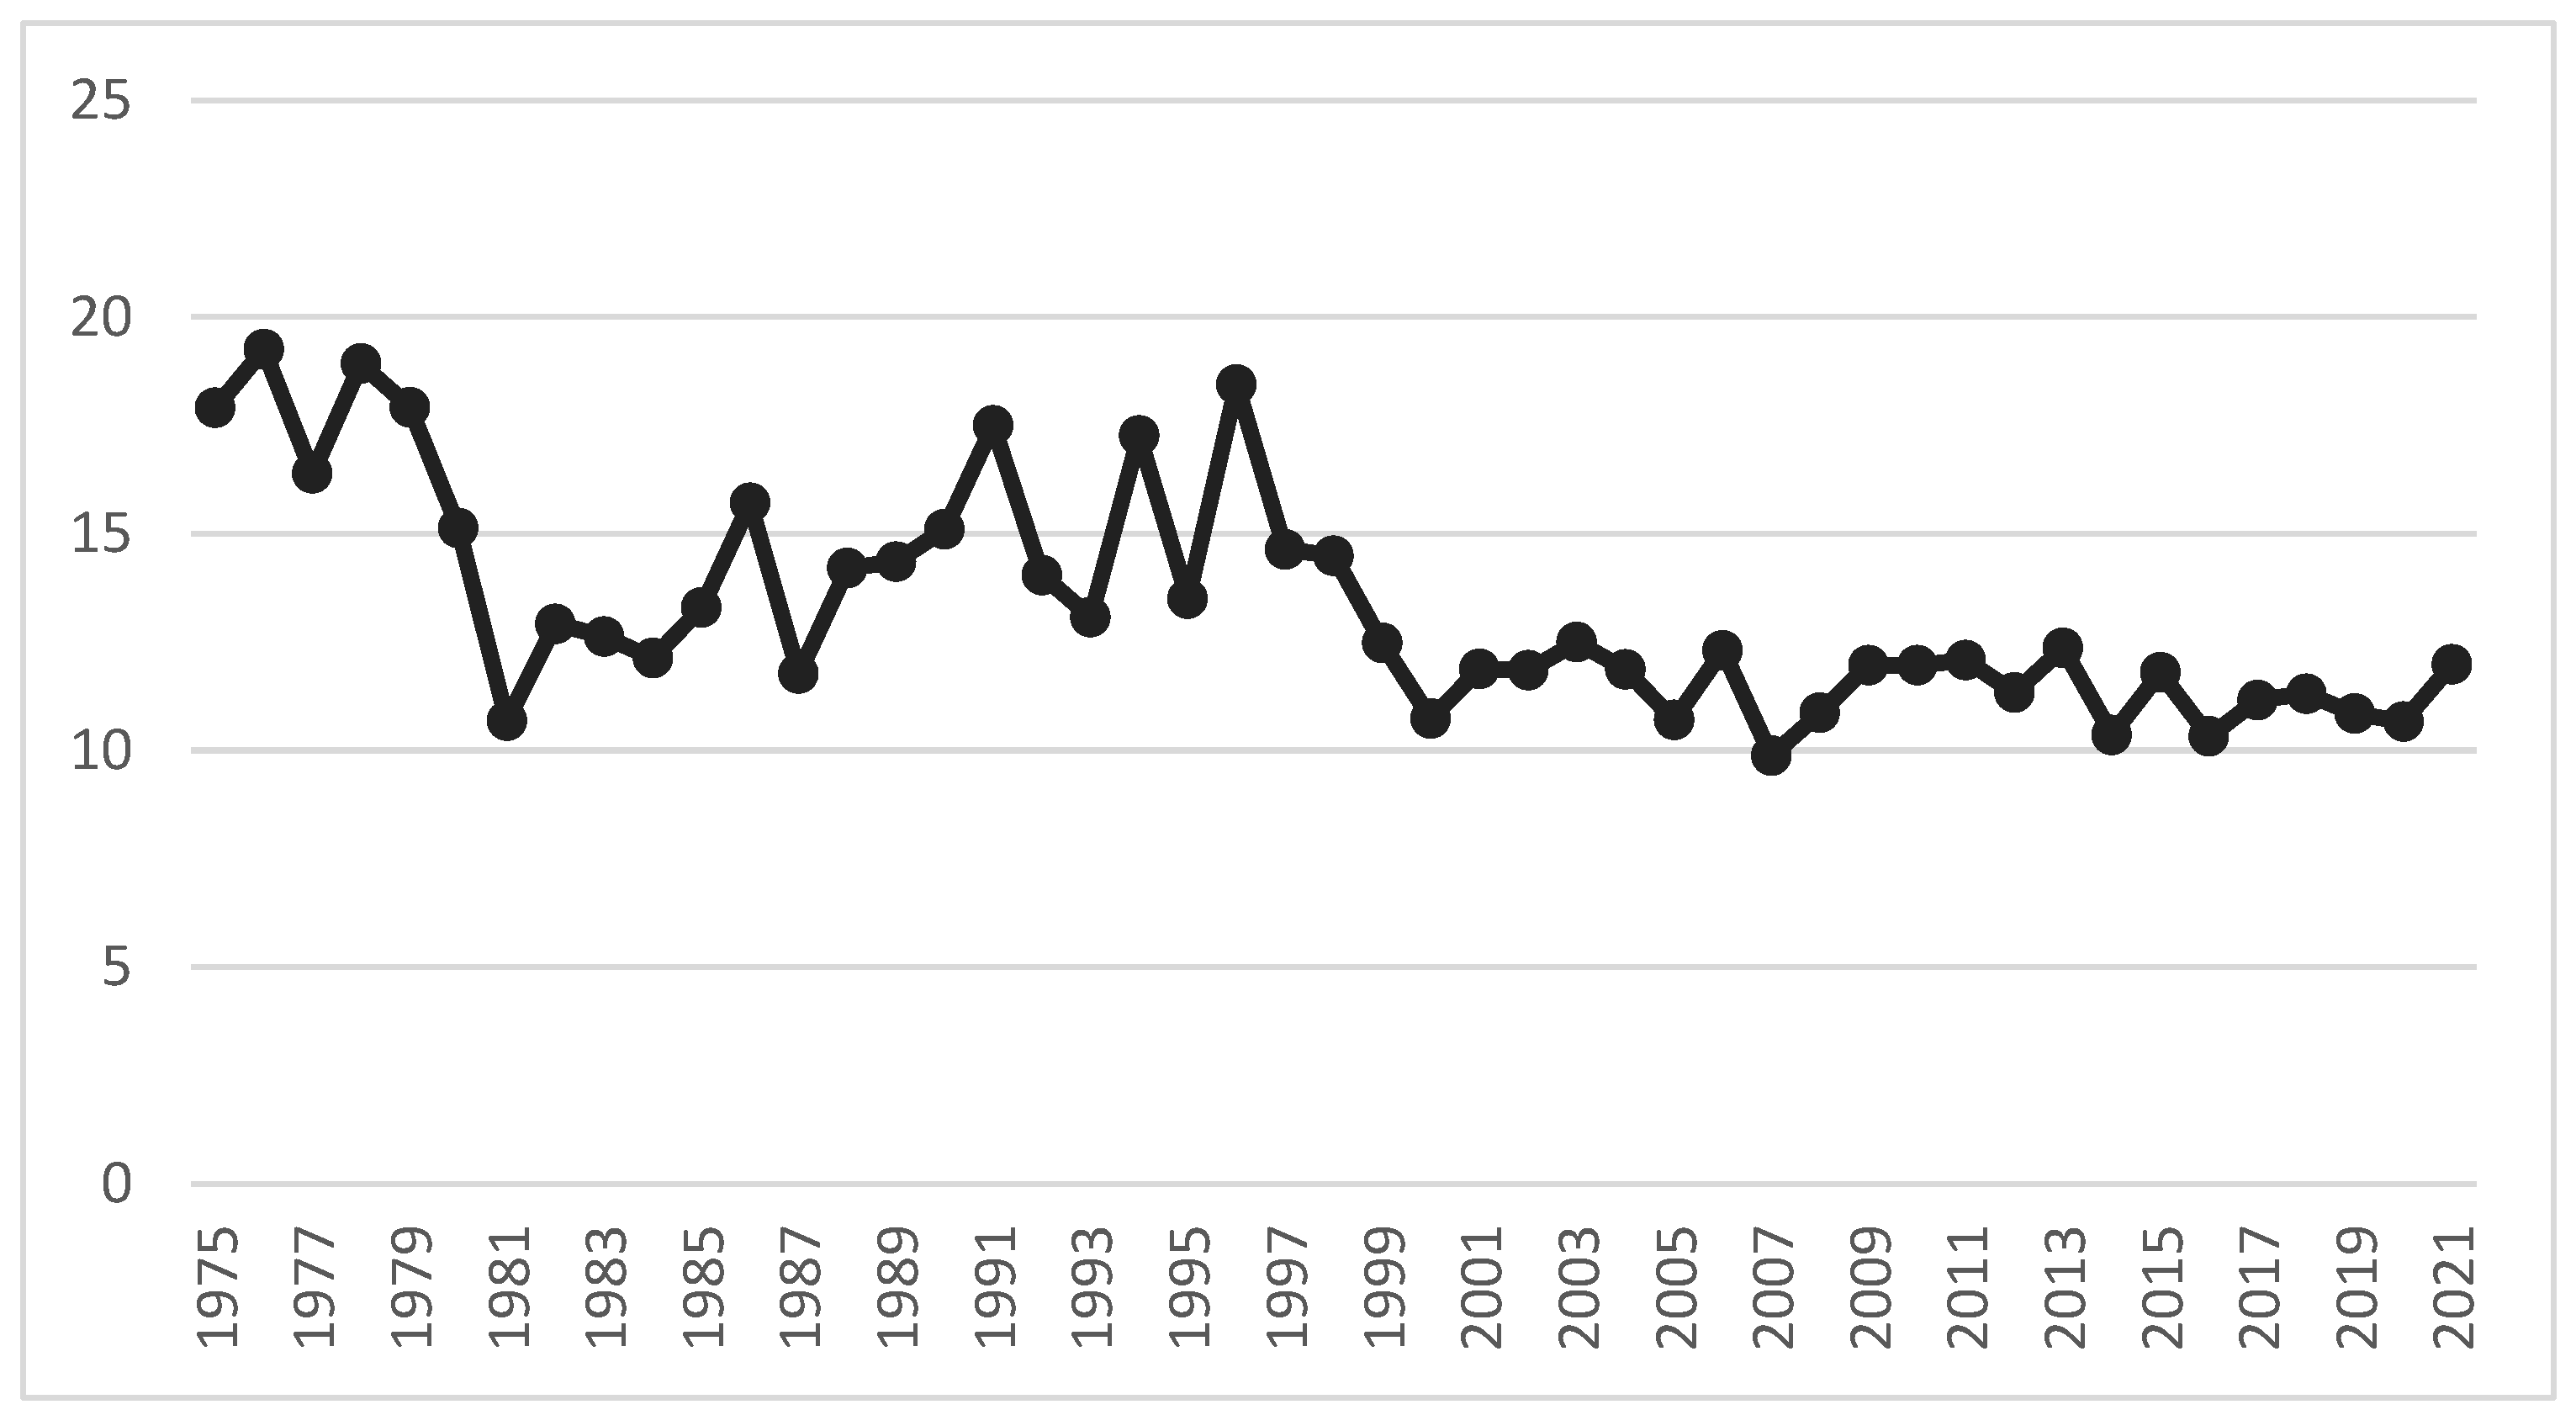
Agriculture remains a fundamental pillar of Moroccan economic growth, making a significant contribution to wealth creation and socio-economic stability in the Kingdom. The role of this sector is strategic. It has a direct impact on food security, rural employment, and trade, and the country’s macroeconomic trajectory [3].
Figure 1 highlights the declining role of agriculture in Morocco’s national wealth since the mid-1970s. After an initial sharp fall, the share of agricultural value added appears to have stabilized at around 12% of GDP over the last twenty years. This change reflects the transformation of the Moroccan economy, which has gradually diversified towards industry and services. Despite this development, agriculture remains an important pillar, both for employment and food security. However, the sector’s heavy dependence on water resources makes the Moroccan economy particularly sensitive to water stress and climatic shocks [27].

3.2. Water in Morocco: Environmental Challenges

In this alarming global context, Morocco is a particularly iconic case study regarding a country with a semi-arid to arid climate. It is experiencing structural stress in water resources, aggravated by recurrent droughts and rapid growth in demand [26]. Morocco ranks as the 27th country in the world most exposed to the risk of water scarcity according to the last ranking of World Resources Institute (2023) [1]. Annual per capita freshwater availability has fallen drastically in recent decades, from over 2000 cubic meters per person in the 1960s to less than 600 cubic meters today, well below the water stress threshold set by the World Bank [2,29].
This deterioration can be explained by several concurrent factors. On one side, population growth, rapid urbanization, and rising living standards have led to a significant increase in water requirements, notably for food, hygiene, industry, and, above all, agriculture [22].
On the other side, Morocco remains very dependent on irrigated agriculture, which mobilizes 87% of national freshwater withdrawals [23].
Intensive irrigation, overexploitation of groundwater, and the low efficiency of irrigation systems all contribute to increasing pressure on water resources and accelerating the degradation of aquatic ecosystems [12].
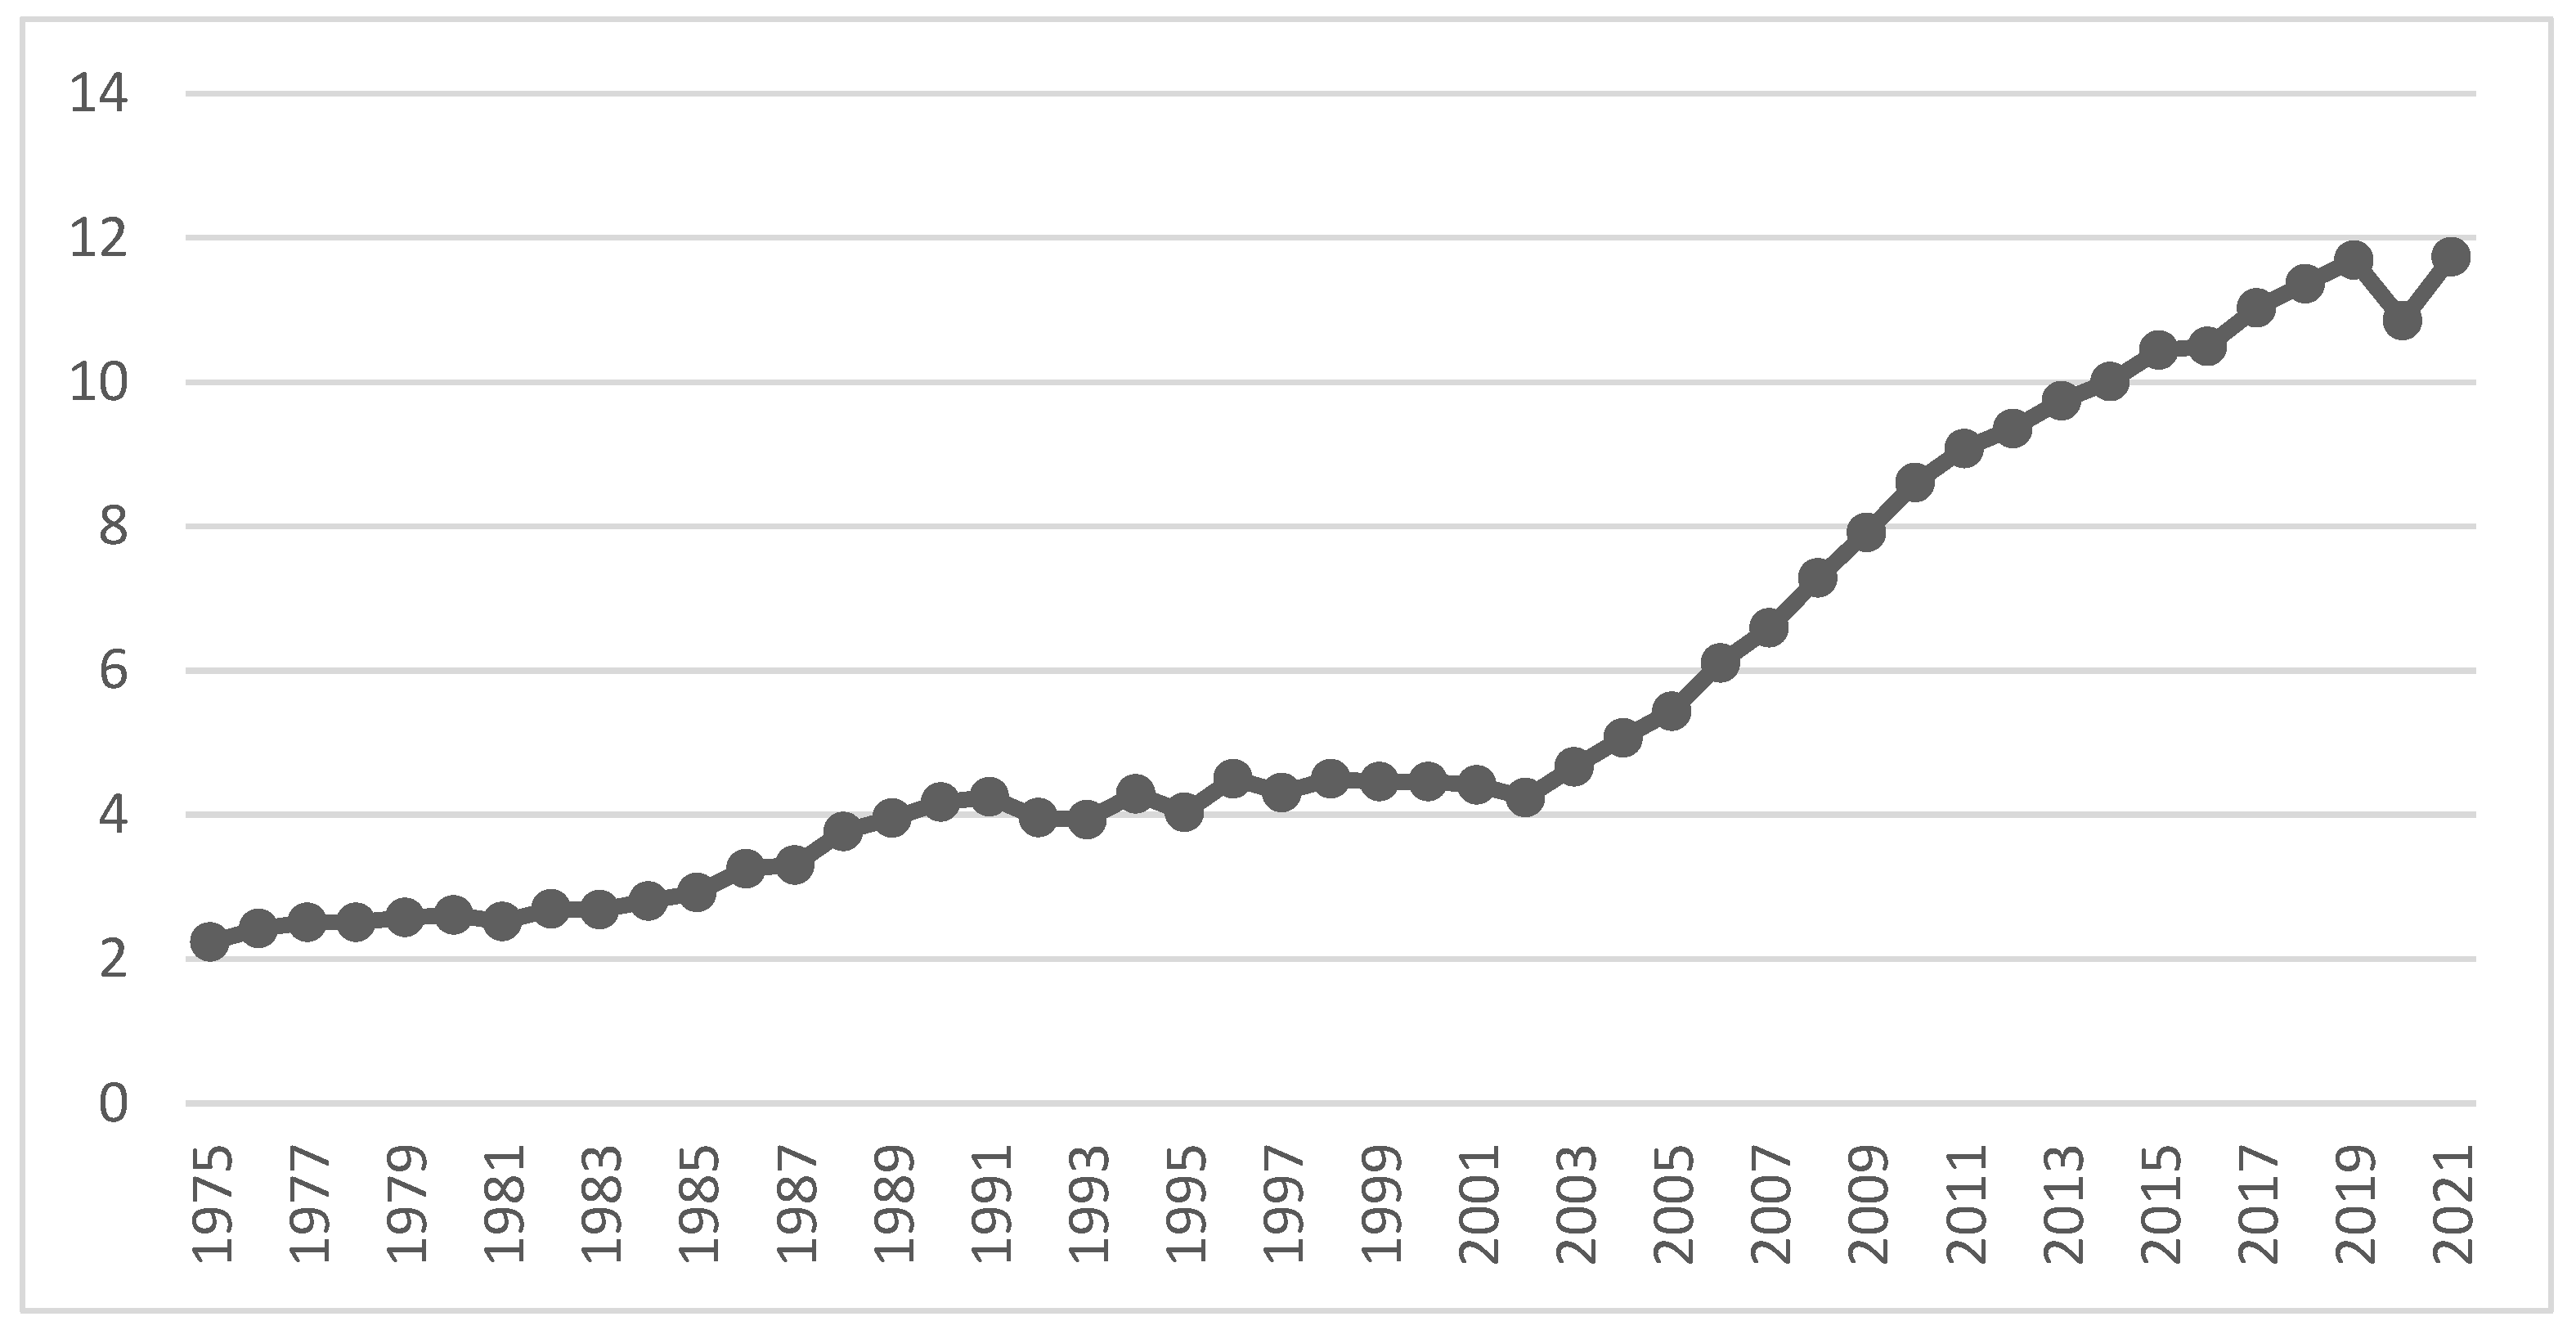
Figure 2 highlights the steady decline in renewable freshwater resources available per capita in Morocco since 1975. We can clearly see that the country has gone from a comfortable situation to a level that is now considered critical, below the threshold of 1000 m3 per capita per year. This trend is the combined reflection of a growing population and increasingly scarce water resources, under the combined effect of climate change and overexploitation [16]. This trend explains why Morocco is now one of the most vulnerable countries to water stress in the MENA region and highlights the need to adopt water management that is both integrated and sustainable [26].
Finally, Figure 3 clearly shows that water productivity in Morocco, expressed in constant 2015 dollars per cubic meter, has risen sharply, especially since the 2000s. In other words, each cubic meter of water used now contributes more to wealth creation. This encouraging trend is undoubtedly the result of efforts to make water use more efficient, through the modernization of agriculture and the adoption of new irrigation technologies [2]. However, it is important to bear in mind that this rapid progress may also signal growing pressure on water resources, raising the question of the balance between economic development and sustainable water management [30].
To face these challenges, several reports stress the need for integrated sustainable management of water resources, combined with innovative policies and enhanced international cooperation [23,31]. The United Nations’ Sustainable Development Goal No. 6 (SDG 6) specifically aims to guarantee universal access to water and sanitation by 2030, but many countries are still a long way from achieving this target [28]. Morocco has made notable progress in achieving Sustainable Development Goal 6, with an achievement of 75% for safely managed drinking water services (SDG indicator 6.1.1, 2022) and 70% as a degree of implementation of integrated water resources management (SDG indicator 6.5.1, 2023). However, there are still gaps and challenges to overcome, especially in water stress with an achievement of only 51% in 2021 (SDG indicator 6.4.2, 2021).

3.3. National Environmental Strategies

Water management thus represents a strategic challenge for Moroccan economic growth. Resource scarcity is likely to hamper the development of key sectors, including agriculture, tourism, and the agri-food industry, while exacerbating regional inequalities and the vulnerability of rural populations [22]. In addition, climate projections for the country predict a worsening water deficit, reduced rainfall, and rising temperatures, which will make water management even more complex [23].
Faced with this situation, the Moroccan authorities have engaged in several reforms and strategies, such as the implementation of the National Drinking Water Supply and Irrigation Program (PNAEPI) and the promotion of water-saving technologies (desalination, drip irrigation, etc.), but the results are still not adequate to growing needs [30]. The issue of the water-economic growth nexus is therefore central to guaranteeing the resilience and sustainability of the Moroccan development model in the decades to come [27].
To rebuild and restore water availability nationwide, Morocco launched its National Water Plan (PNE) in 2020, committing nearly $40 billion to the sector [3]. This initiative was further bolstered in 2022 with an additional budget allocation for the National Program for Drinking Water Supply and Irrigation 2020–2027, which operates as a component of the broader PNE [29]. These efforts build upon the foundational strategies initiated by the earlier Plan Maroc Vert (PMV), launched in 2008, which significantly emphasized the modernization of irrigation techniques, such as widespread adoption of drip irrigation, to enhance water use efficiency within the agricultural sector and reduce water losses.

4. Methodology

The present section aims to assess empirically the relationship between economic growth and water resource constraints in Morocco, using the estimation of an ARDL (Autoregressive Distributed Lag) model. First, we present the data and the stationarity tests and detail the procedure for selecting the optimal lags, before presenting and discussing the econometric results obtained. The aim is to highlight the mechanisms by which variations in water resources and their productivity influence growth dynamics in Morocco, considering short- and long-term adjustments [16].

4.1. Data Type and Source

The empirical analysis is based on annual data covering the period from 1975 to 2021 for Morocco. The data is sourced from the World Bank database [32]. We choose annual frequency, because it corresponds to the maximum availability of data series over the period studied for Morocco. The selection of the data is consistent with the literature on growth and water management [19,27]. The variables are selected based on the research objectives and on the recommendations of recent empirical work studying the link between growth, agriculture, and water stress in developing countries [32].

4.2. Variable Description and Justification

Table 1 shows the variables used in the model. Gross Domestic Product (GDP), measured in constant 2015 US dollars, sourced from the World Bank’s World Development Indicators (WDI), is used as an indicator of economic growth [26] and Agricultural value added (AG), expressed as a percentage of GDP, obtained from the World Bank (WDI), is used for measuring the importance of the agricultural sector, which is highly dependent on water availability in Morocco [22]. The indicator of the degree of water stress, which is a structural challenge for the country [16], is renewable freshwater resources (RW), defined as the annual total volume of internal renewable water resources (in cubic meters per capita per year), sourced from the World Bank (WDI). Finally, water productivity (WP), measured as GDP generated per cubic meter of total water withdrawal (US dollars per m3), sourced from the World Bank (WDI), is an indicator of the efficiency of agricultural uses of the resource, recommended by the FAO and validated in several recent studies of North Africa and the Middle East [30,33].

4.3. Descriptive Statistics

Table 2 presents the descriptive statistics for the variables used in the ARDL model over the period 1975–2021. The average real GDP is 62.7 billion constant dollars, while the average agricultural value added is 13.28 billion. Renewable water resources per capita show a marked dispersion, with a minimum of 784.75 m3 and a maximum of 1673.85 m3. Water productivity, measured in constant dollars per cubic meter, also varies significantly. The results of the normality tests (Jarque–Bera) [34] indicate a slightly non-normal distribution for agricultural value added and water productivity, which will be considered when interpreting the econometric results.
OpenAI’s ChatGPT (GPT-4, 2025) was used solely for improving language clarity during manuscript preparation. The authors reviewed and validated all AI-assisted content to ensure scientific rigor.

5. Results and Discussion

5.1. Preliminary Data Analysis

Before performing the ARDL estimation, it is important to explore some basic properties of the data. The first step involves testing the stationarity of the series, which is essential for ensuring the statistical validity of the model and its subsequent results. Once the stationarity and integration order of all variables have been determined, the next step is to select the optimal lag length for each series.

5.1.1. Stationarity

To determine the order of integration of the time series, the Augmented Dickey–Fuller (ADF) [35] unit root test was applied to each variable, first in level and then in first difference. The results are summarized in Table 3. It appears that GDP and agricultural value added (AG) are not stationary in level, but become so after differentiation, which classifies them as integrated variables of order one (I(1)). The variable representing internal renewable freshwater resources (RW) is stationary in level (I(0)). For water productivity (WP), the p-value of the ADF test applied to the first difference is 0.07, slightly above the usual 5% threshold. This situation can be interpreted, according to several authors [36,37], as a ‘weak’ integration of order one (weakly I(1)), which is generally accepted for the estimation of ARDL models when most variables are I(0) or I(1). Indeed, literature considers that results close to the threshold can be interpreted flexibly, particularly in empirical studies of macroeconomic series from emerging countries. Consequently, all the variables in the model meet the necessary condition for the application of the ARDL method, namely the absence of second-order integrated variables (I(2)). These results confirm the relevance of using the ARDL approach, which requires that the variables be either I(0) or I(1), and not I(2) [38].

5.1.2. Optimum Number of Lags

Choosing the optimal number of lags to include in the ARDL model is an essential methodological step to correctly capture the adjustment dynamics between variables without introducing unnecessary over-parametrization. In line with the recommendations of Pesaran, Shin, and Smith [38] and Lütkepohl [39], several informational criteria were used: the Akaike information criterion (AIC), the Bayesian Schwarz criterion (BIC), and the Hannan–Quinn criterion (HQC).
Table 4 presents the specifications tested for selecting the number of lags.
The optimal lag structure for the ARDL model was selected based on the lowest value of the Akaike Information Criterion (AIC = 44.60) [38,40], which is widely recognized for balancing model fit and parsimony, especially with small to moderate sample sizes [37]. To ensure robustness, we considered a maximum lag length of three for each variable, which is appropriate for annual data and prevents overfitting [36]. The selected ARDL (3, 0, 1, 2) specification yielded the lowest AIC among all tested combinations. Furthermore, the suitability of this lag structure was further confirmed through post-estimation diagnostic tests, as discussed in the next section.

5.2. Model Selection

The ARDL (AutoRegressive Distributed Lag) has several methodological advantages. The fact that the ARDL framework does not require all series to be integrated at the same order reduces the risk of specification errors due to the stationarity properties of the variables [36].
Therefore, the ARDL approach resolves the constraint of studying short samples [40]. Several empirical studies confirm the robustness of the ARDL co-integration tests and the reliability of the estimation of short- and long-term coefficients, even with less than 50 observations [41].
Also, considering the lags specific to each variable, the ARDL approach allows flexible modeling of adjustment dynamics. This advantage is relevant for studying the delayed impact of water shocks on growth or agricultural value added (AG) [42].
The ARDL (AutoRegressive Distributed Lag) model is then used in this study to analyze the dynamics between economic growth (GDP), water availability (RW), and water productivity (WP) in Morocco.
The ARDL model used in this study takes the following form in Equation (1):
Δ G D P t = α 0 + i = 1 p α i Δ G D P t i + j = 0 q 1 β j Δ A G t j + k = 0 q 2 γ k Δ R W t k + l = 0 q 3 δ l Δ W P t l + λ 1 G D P t 1 + λ 2 A G t 1 + λ 3 R W t 1 + λ 4 P W P t 1 + ε t
With
Δ : first-difference operator,
p ,   q 1 ,   q 2 ,   q 3 : optimal lag orders for each variable, determined empirically based on information criteria.
α 0 : constant term,
ε t : error term.
The ARDL model (Equation (2)) can be reformulated as an error correction model (ECM), highlighting the speed of adjustment towards equilibrium after a shock:
Δ G D P t = α 0 + i = 1 p α i G D P t i + j = 0 q 1 β j Δ A G t j + k = 0 q 2 γ k Δ R W t k + l = 0 q 3 δ l Δ W P t l + E C M t 1 + ε t
E C M t 1 is the error term in the long-term relationship estimated from the levels of the variables in Equation (3):
E C M t 1 = G D P t i + β 1 A G t 1 + β 2 R W t 1 + β 3 W P t 1
ϕ is the coefficient of adjustment towards equilibrium. To validate convergence, ϕ must be negative and significant according to Pesaran et al. [38].

5.3. ARDL Estimation Output

Table 5 presents the results of estimating the ARDL (3, 0, 1, 2) model with GDP as the dependent variable. Water productivity (WP) and its lags are significant coefficients at the 1% level, showing a significant influence of this variable on economic growth. The agricultural value added (AG) and water resources (RW) variables show non-significant coefficients at the usual threshold, although their sign is consistent with theoretical expectations. The model shows a very good overall fit, with an adjusted R2 greater than 0.99, and no autocorrelation problems (Durbin–Watson ≈ 1.77).

5.3.1. ECM Form (Short Run) Estimation

Table 6 presents the results of the ARDL model in the form of error correction regression (ECM). We observe that the error correction term [CointEq(-1)] is negative and highly significant (−0.0806; p < 0.01), indicating a rapid adjustment mechanism towards the long-run equilibrium after an exogenous shock. This result confirms the presence of a process of return to equilibrium, in line with the literature that considers the significance of this term as an essential condition for the validity of ARDL [36,38]. Furthermore, the differing variables, in particular water productivity (WP) and its lags, have a significant impact on short-term economic growth, in line with studies highlighting the importance of water dynamics for GDP trajectories in emerging countries [42].

5.3.2. Long Run Form

Table 7 summarizes the long-term coefficients derived from the ARDL model levels equation. Although none of the coefficients are significant at the 5% level, water productivity (WP) is marginally significant at the 10% level (p = 0.089), suggesting a potential positive effect of water efficiency on Moroccan economic growth in the long term. This result is coherent with the work of the FAO [16] and Wada et al. [33]. Their studies highlight the importance of sustainable water management in agricultural development strategies. On the other side, the coefficients associated with agricultural value added (AG) and renewable water resources (RW) remain statistically insignificant, which is in line with some empirical analyses on the difficulty of translating structural water improvements into sustainable economic gains in the North African context [22].

5.3.3. F-Bounds Test

We use the F-Bounds test (Table 8) to validate the presence of a cointegration relationship (long-term relationship) which provides an F statistic (2.69) below the critical threshold of 5% recommended by Pesaran et al. [38]. It is not possible to conclude that there is a robust long-term relationship between real GDP, agricultural value added (AG), water resources (RW), and water productivity (WP) according to this result. It confirms the results of the literature on growth under water stress and suits studies that highlight the pre-eminence of short-term adjustments in developing economies faced with water stress [42].

5.4. Specification Tests

Specification testing helps verify that the ARDL model is not under-specified as missing relevant variables or lags or over-specified as including unnecessary terms, thus enhancing the credibility of the econometric results [36]. In the following section. Several specification tests are performed to assess the robustness of the model structure and to identify any potential structural issues. such as omitted variables, multicollinearity, or inappropriate lag selection.

5.5. Breusch-Godfrey Serial Correlation

Although the Durbin-Watson statistic (1.77) is reported, it is important to note that this test is not fully reliable for models that include lagged dependent variables, such as ARDL specifications [37]. To ensure robust assessment of serial correlation, we therefore applied the Breusch-Godfrey LM test. The Breusch–Godfrey test (LM Test) applied to the ARDL model results in Table 9 does not reject the null hypothesis of no autocorrelation in the residuals (p-value = 0.322). The result confirms that the model’s errors are not serially correlated up to second order, adequate for the prerequisites of time series models and the robustness of the test as recommended in the literature [37].

5.5.1. Breusch-Pagan-Godfrey Heteroskedasticity Test

The heteroskedasticity test (Breusch-Pagan-Godfrey) applied to the model’s residuals in Table 10 shows a p-value = 0.584, above the usual 5% threshold. The null hypothesis of homoskedasticity cannot be rejected, which confirms that the variances of the errors are constant over the entire period studied. According to the recommendations of Breusch and Pagan [38] and Agung [39], this result guarantees the validity of the confidence intervals of the estimators. in accordance with.

5.5.2. Normality Test

The Jarque–Bera normality test applied to the residuals (Table 11) provides a statistic of 4.27 for a p-value of 0.118. The null hypothesis of error normality is therefore not rejected, which satisfies an essential condition for the validity of coefficient significance tests in ARDL models [28,29].

5.5.3. Multicollinearity Diagnosis

A check on multicollinearity using the Variance Inflation Factor (VIF) (Table 12) shows that most of the lagged variables have exceptionally high values, particularly GDP (−1 to −3) and RW(-1), well above the generally accepted threshold of 10 [37]. High VIF values are commonly observed in ARDL models because the inclusion of multiple lags creates strong correlations among variables—a structural characteristic well documented in the econometric literature [36,43,44]. This structural multicollinearity differs fundamentally from the problematic multicollinearity encountered in static models.
As emphasized by Nkoro and Uko [36], this type of multicollinearity does not bias the estimated long-run relationships or undermine the overall validity of the model. Its principal effect is to inflate standard errors, which may reduce the statistical significance of certain coefficients. but does not compromise the reliability of the main results [43].
For full transparency, all VIF values are reported. Nevertheless, we do not consider elevated VIFs among lagged terms to represent a critical threat to our findings. To reinforce the robustness of our results, we have conducted additional stability tests, such as CUSUM and CUSUMSQ, as recommended in the literature [36,44] in the following section.
Table 12 below shows the Variance Inflation Factors (VIF) for the explanatory variables in the estimated model.

5.5.4. Outliers Test

Analysis of the residuals has enabled us to identify two isolated episodes of outliers, located around the years 2000–2002 and 2010–2012, as shown in the Figure 4. These atypical values, although one-off, may reflect the impact of major exogenous shocks (such as droughts, changes in water policy, or economic crises) on the model’s dynamics. However. outside these specific periods. No significant outliers were detected, with almost all observations remaining at zero. This situation is consistent with what is reported in the literature, namely that economic models applied to long time series are likely to present a few extreme residuals linked to historical events [37,43].

5.5.5. CUSUM Stability Test

The graphical CUSUM test (Figure 5) shows that the stability curve remains within the confidence bands for the entire period. According to Pesaran and Pesaran, this indicates that the model’s coefficients are structurally stable and that the model does not suffer any major regime change over the study period.

5.5.6. CUSUM of Squares Stability Test

The Visual analysis of the CUSUM of Squares test in Figure 6 reveals that the curve crosses the confidence bounds twice, which may indicate episodes of structural instability of the parameters. This result should be considered when interpreting long-term effects, particularly in the presence of exogenous shocks or policy changes [36,45].
If we cross-analyze, we notice that the periods with outliers in the residual series correspond precisely to the peaks observed on the CUSUM of Squares graph. This agreement suggests that the structural instabilities detected by the CUSUM of Squares test are due to these atypical values. This phenomenon is generally the sign of major external shocks such as extreme droughts. economic crises or institutional changes, which affect both the dynamics of the residuals and the stability of the model parameters [37].

5.6. ARDL Model Estimation Excluding Outlier Years (2000 and 2011)

To validate that the results of the ARDL model were not influenced by the presence of outliers identified in the years 2000 and 2011, the model was re-estimated by excluding these two years from the sample. The results (Table 13) show that the main coefficients, particularly those related to water productivity (WP and its lags), maintain the same direction and remain significant at the 1% level, as in the initial estimate. The model’s overall statistics, such as the adjusted R2 and the Akaike Information Criterion (AIC), remain very close to the reference estimate.
This robustness test thus confirms that the dynamics identified between real GDP and the water variables are not the result of an artifact linked to extreme events but rather reflect a stable structural relationship [37]. This type of verification is recommended in the literature to guarantee the reliability of estimated models in the presence of point breaks or exogenous shocks [42].

6. Discussion

6.1. Interpretation of Results

The empirical results reveal that water productivity (WP) and its lagged values are highly significant predictors of economic growth in Morocco, both in the short and long run, which confirms the hypothesis H1 of the present study. The positive coefficient for current WP (8.60 × 10⁹. p < 0.01) suggests that even small improvements in the efficiency with which water is used, for example, through the adoption of advanced irrigation technologies or better water management practices, can have an immediate and substantial impact on GDP. This result is especially relevant for Morocco, where water scarcity has become a structural challenge [26]. The negative and significant coefficient for lagged WP (–1.33 × 10¹⁰. p < 0.01) may reflect adjustment effects or diminishing returns, indicating that while gains in water productivity provide an initial boost to economic activity, their impact may be partially offset in subsequent periods as the system adapts [46].
Conversely, agricultural value added (AG) and renewable water resources (RW) do not show statistically significant effects on economic growth, despite Morocco’s high dependence on agriculture and chronic water stress. The lack of significance for AG can be attributed to the sector’s vulnerability to rainfall variability and market shocks, which often translate into erratic annual outputs and weaken the stable link between agriculture and GDP [9]. Regarding RW, its non-significance is likely explained by the low variability observed since 2010, as Morocco’s renewable water resources have remained at critically low and relatively stable levels, leaving little room for detectable impact on economic performance [16]. This chronic scarcity, compounded by the country’s adaptation strategies—such as investments in water-saving technologies and demand management—has reduced the sensitivity of GDP to year-to-year fluctuations in water supply.
Overall, these findings emphasize that. under Morocco’s current water constraints. improvements in water productivity are a more meaningful lever for economic growth than simply increasing agricultural output or water supply. Future policy should thus prioritize technological innovation. efficient water use and resilience in agricultural and water management systems [31].
While the ARDL model allows for the estimation of long-run dynamics, the results indicate a weak and statistically insignificant long-term relationship between GDP and renewable water resources (RW) in Morocco. This finding appears counterintuitive, considering that approximately 40% of the country’s water use is dedicated to agriculture [29], a sector that remains central to the Moroccan economy. However, several factors can help explain this result.
First, Morocco’s agricultural sector is highly dependent on annual rainfall and is subject to frequent droughts. leading to significant year-to-year variability in production [27]. This structural volatility can weaken the statistical association between long-term trends in RW and aggregate GDP, as economic output in non-agricultural sectors may offset agricultural fluctuations.
Second, major policy initiatives such as the Green Morocco Plan (Plan Maroc Vert)—launched in 2008—have promoted investment in irrigation efficiency, water-saving technologies, and the diversification of agricultural production [18]. This weak long-term relationship between GDP and renewable water resources (RW) may also be explained by Morocco’s proactive adaptation strategies, notably large-scale investments in seawater desalination (e.g., the Chtouka Aït Baha plant) and the implementation of the National Water Plan [29]. Such initiatives have enabled the economy to buffer the effects of annual water scarcity, making growth less sensitive to fluctuations in RW and highlighting the rising importance of water productivity as a growth driver. These measures have partially decoupled the agricultural sector’s performance from fluctuations in absolute water availability, making GDP less sensitive to changes in RW at the macroeconomic level.
Third, the persistent water scarcity observed since 2010 has led to a plateau in renewable water resources. with little annual variation [21]. This low variability further limits the capacity of RW to emerge as a significant driver of long-term economic growth in the model’s estimates. Instead, the findings suggest that Morocco’s growth prospects rely more on improving water productivity and the efficiency of water use. rather than on absolute increases in water availability.
Beyond the case of renewable water resources, it is important to note that other long-run coefficients, such as those related to agricultural value added, also appear non-significant in the present analysis. This lack of significance may arise from several factors [47]. First, potential data limitations—such as measurement errors, the aggregation of economic and sectoral data, or gaps in historical records [27]—could weaken the statistical power of the estimations. Second, certain structural features of the Moroccan economy, including the size of the informal sector, limited economic diversification, and pronounced regional disparities [20], may dilute the impact of sector-specific variables on overall economic growth. Moreover, unobserved variables, such as governance quality, institutional factors, and exposure to external shocks [48] (e.g., droughts, global market fluctuations), might also play a role in shaping long-term relationships. These considerations highlight the need for further research, potentially using more disaggregated data or alternative econometric approaches, to better understand the drivers of long-run growth in the Moroccan context.
In summary, the weak long-run impact of RW on GDP reflects both the success of adaptation policies—such as those under the Green Morocco Plan—and the structural evolution of the Moroccan economy, which is gradually becoming less dependent on variable water inputs.
Analysis of the econometric diagnostics reveals the presence of a few isolated outliers in the residual series, particularly around the years 2000 and 2011. These anomalies coincide with peaks observed on the CUSUM of Squares graph, indicating episodes of disruption or exogenous shocks that have potentially affected the structural stability of the model [37]. These shocks, coupled with the volatility of agricultural markets and the introduction of major policies such as the Green Morocco Plan, were able to generate temporary breaks in the dynamics of the variables, thus justifying the detection of outliers during structural stability tests [42]. Taking these episodes into account makes it possible to refine the analysis of the results and to call for proactive management of water risk in public policies. However, the robustness tests carried out—including the re-estimation of the model after excluding these years—show that the main relationships retain their significance and consistency, in line with the methodological recommendations of Narayan [40] and Banerjee, Dolado, and Mestre [49]. The classic CUSUM test also confirms the general stability of the coefficients, while the CUSUM of Squares suggests a cautious interpretation of the long-term relationships, particularly in the presence of exogenous shocks or changes in water policy [45].

6.2. Theoretical Implications and Links to Literature

This study contributes to the literature on the water–economic growth nexus in several important ways. First, by applying the ARDL modeling approach. The analysis captures both short- and long-run dynamics between economic growth, water productivity, and renewable water resources—an approach still underutilized in studies focused on Morocco and the wider MENA region [6,26]. Second, the empirical results highlight the critical role of water productivity (WP) in driving short-term economic growth. a finding that aligns with and expands recent global research emphasizing efficiency and innovation in water use as levers for sustainable development [31]. Third, the lack of significant long-term effects for renewable water resources (RW) provides new evidence that, under conditions of chronic scarcity and adaptation, Economic growth may become less dependent on absolute water availability and more reliant on productivity gains. These insights not only advance understanding of Morocco’s unique experience but also offer broader lessons for arid and semi-arid regions worldwide confronting similar sustainability challenges.
The results are in line with several studies conducted in similar contexts. For example, in the MENA region, ref. [22] point out that optimizing water productivity has become an unavoidable priority for public policies to support water-constrained economic development. Damania et al. [42] point out that water variability and water resource management are major determinants of growth in countries with low water availability. In the Moroccan context, ref. [50] highlight the importance of water efficiency policies in strengthening the resilience of the agricultural sector to drought.
On an international scale. research such as that by Gleick [51] and Hoekstra and Mekonnen [52] stresses the need to adopt “soft-path” approaches based on integrated management and the reduction in the “water footprint” to ensure the sustainability of growth in a context of water scarcity. Wada and al. [33] use global modeling to highlight the fact that optimizing water abstraction and use is a prerequisite for sustainable growth.

6.3. Policy Implications and Recommendations

Building on the finding that water productivity (WP) exerts a strong and significant effect on economic growth in Morocco. policy recommendations should move beyond generic calls for “integrated resource management” and focus on actionable measures tailored to the national context. First, accelerating the modernization and expansion of efficient irrigation systems—particularly drip and sprinkler technologies—can significantly enhance water use efficiency in agriculture. which consumes over 85% of Morocco’s total water withdrawals [31]. Targeted public investment. combined with incentives for farmers to adopt water-saving practices, has been shown to yield substantial gains in both productivity and resilience [50].
Second, it is essential to invest in the maintenance and rehabilitation of existing water infrastructure. including irrigation networks. reservoirs. and urban supply systems, to minimize water losses and improve service reliability [31]. Urban water management should also be prioritized: promoting water reuse, upgrading distribution systems, and incentivizing efficient water use in cities and industries can amplify the macroeconomic benefits of improved WP, as demonstrated in this study.
Finally, given the chronic water scarcity facing Morocco, expanding non-conventional water sources, such as seawater desalination, particularly in coastal regions, should complement efficiency strategies. This approach aligns with the objectives of Morocco’s National Water Plan and is supported by recent investments in large-scale desalination projects [29]. These targeted approaches are explicitly promoted in Morocco’s National Water Plan and align with the objectives of SDG 6 (Clean Water and Sanitation), strengthening their relevance in both national and global contexts [2].

6.4. Limits

However, this study has several methodological and empirical limitations. The quality of the data on water in Morocco can still be improved: several indicators, such as the level of water stress, show low variability or gaps after 2010, limiting the power and accuracy of the econometric estimates [50]. In addition, the relatively small size of the sample and the annual periodicity constraint reduce the ability to identify specific dynamics or short-term effects. Some potentially decisive variables (investment in water infrastructure, changes in agricultural prices, effects of climate change) could not be included due to the lack of homogeneous and continuous series over the period.
However, it is important to note methodological limitations of the analysis, linked to the presence of multicollinearity between certain lagged variables in the ARDL model. As highlighted by the results of the VIF test, this relatively strong collinearity is mainly explained by the dynamic structure of the model, which integrates several past values of each variable. This phenomenon is common in time series analyses and does not necessarily affect the overall validity of the estimates [43]. However, it does call for caution when interpreting the individual effects of each lag. These may be amplified or attenuated by existing correlations between variables [39].
Another limitation of this study is that it does not explicitly test the Environmental Kuznets Curve (EKC) hypothesis by including a quadratic GDP term (GDP2) in the ARDL model. The EKC framework is widely used to capture potential non-linear relationships between economic growth and environmental stress, such as water scarcity [9,12]. Our analysis focused primarily on the dynamic effects of water productivity and renewable water resources, but future research could incorporate GDP2 to examine whether an inverted U-shaped (EKC-type) relationship exists in Morocco [50]. Such an approach would provide additional theoretical depth and align the study more closely with global debates on the growth–environment nexus. It is also important to note that in arid countries like Morocco. persistent water scarcity and adaptive policy responses may limit the emergence of classic EKC patterns, as highlighted by the World Bank [26].
Also, to explore the impact of investment policies and integrate indicators linked to water governance or climate change, future works should extend the analysis to a panel-country perspective [24] as recommended in the recent literature.

7. Conclusions

This study highlights the important role of water productivity in Morocco’s resilience to the increasing scarcity of water resources and economic growth. The results confirm that, while the short-term links between water productivity and GDP are robust, the long-term relationship between growth and water resources remains more nuanced, notably because of water variability and exogenous shocks. This Moroccan specificity can be explained by the structural importance of the agricultural sector and the country’s high exposure to climatic conditions.
In this context, Morocco has promoted ambitious policies, such as the National Water Strategy 2009–2030 and the Green Morocco Plan (Plan Maroc Vert), aimed at encouraging integrated resource management. precision irrigation and modernization of the agricultural sector [16,26]. The importance given to saving water, diversifying supply sources, and encouraging research and development into water technologies reflects the national will to adapt the development model to environmental constraints.
However, to build resilience and ensure inclusive growth, it is crucial to continue efforts in water governance. investment in infrastructure, and integration of water planning with economic and social policies. Establishing better monitoring indicators and systematically integrating climate change risks into decision-making remain major challenges for Morocco [28].
In sum, the Moroccan experience offers valuable lessons for countries facing similar challenges in the MENA region and beyond. Continuously improving water productivity and promoting adaptive management, based on science and innovation, are the major levers for ensuring water security and supporting sustainable economic development in the Kingdom.

Author Contributions

Conceptualization, M.E.H. and H.L.; Methodology, M.E.H. and H.L.; Data curation, M.E.H.; Writing—original draft, M.E.H. and H.L.; Writing—review & editing, M.T.; Supervision, M.T. All authors have read and agreed to the published version of the manuscript.

Funding

This research received no external funding.

Institutional Review Board Statement

Not applicable.

Informed Consent Statement

Not applicable.

Data Availability Statement

The data used in this study are publicly available from the World Bank Open Data platform: https://data.worldbank.org.

Acknowledgments

The authors used OpenAI’s ChatGPT (version GPT-4, 2025) as a writing assistant to improve the language clarity and coherence of the manuscript. All content was critically reviewed and validated by the authors to ensure accuracy and integrity.

Conflicts of Interest

The authors declare no conflicts of interest.

References

  1. World Resources Institute (WRI). Aqueduct Water Risk Atlas. 2024. Available online: https://climate-adapt.eea.europa.eu/en/mission/solutions/tools/005_aqueduct-global-water-risk-atlas-wri (accessed on 30 June 2025).
  2. World Bank. Migrants, Refugees, and Societies; World Development Report; World Bank: Washington, DC, USA, 2023; ISBN 978-1-4648-1941-4. [Google Scholar]
  3. Haut-Commissariat au Plan (HCP). Modélisation de la Consommation en Eau Intersectorielle Dans L’économie Marocaine; Les Brefs du Plan; Haut-Commissariat au Plan (HCP): Rabat, Morocco, 2020. [Google Scholar]
  4. Hamed, L.M.M.; Dhaouadi, L.; Zehri, F.; Tiba, S.; Besser, H.; Karbout, N.; Emara, E.I.R. Examining the Relationship between the Economic Growth, Energy Use, CO2 Emissions, and Water Resources: Evidence from Selected MENA Countries. J. Saudi Soc. Agric. Sci. 2024, 23, 415–423. [Google Scholar] [CrossRef]
  5. Hernández, J.; Roberts-Baca, S.J.; Gurulé, G.G. Maximizing the Water Economy in MENA Through Energy Policies and Governance. In Proceedings of the 2023 IEEE PES/IAS PowerAfrica, Marrakech, Morocco, 6–10 November 2023; pp. 1–3. [Google Scholar]
  6. El Hirtsi Hamid, A.; Chabane, F. Water Scarcity Effect on Economic Growth in MENA Region during 1975–2017. Dirassat J. Econ. Issue 2019, 10, 331–348. [Google Scholar] [CrossRef]
  7. Grossman, G.M.; Krueger, A.B. Economic Growth and the Environment. Q. J. Econ. 1995, 110, 353–377. [Google Scholar] [CrossRef]
  8. Kuznets, S. Economic Growth and Income Inequality. Am. Econ. Rev. 1955, 45, 1–28. [Google Scholar]
  9. Stern, D.I. The Rise and Fall of the Environmental Kuznets Curve. World Dev. 2004, 32, 1419–1439. [Google Scholar] [CrossRef]
  10. Katz, D. Water Use and Economic Growth: Reconsidering the Environmental Kuznets Curve Relationship. J. Clean. Prod. 2015, 88, 205–213. [Google Scholar] [CrossRef]
  11. Esen, Ö.; Yıldırım, D.Ç.; Yıldırım, S. Threshold Effects of Economic Growth on Water Stress in the Eurozone. Environ. Sci. Pollut. Res. 2020, 27, 31427–31438. [Google Scholar] [CrossRef]
  12. Gu, A.; Zhang, Y.; Pan, B. Relationship between Industrial Water Use and Economic Growth in China: Insights from an Environmental Kuznets Curve. Water 2017, 9, 556. [Google Scholar] [CrossRef]
  13. Saidmamatov, O.; Tetreault, N.; Bekjanov, D.; Khodjaniyazov, E.; Ibadullaev, E.; Sobirov, Y.; Adrianto, L.R. The Nexus between Agriculture, Water, Energy and Environmental Degradation in Central Asia—Empirical Evidence Using Panel Data Models. Energies 2023, 16, 3206. [Google Scholar] [CrossRef]
  14. Dai, D.; Alamanos, A.; Cai, W.; Sun, Q.; Ren, L. Assessing Water Sustainability in Northwest China: Analysis of Water Quantity, Water Quality, Socio-Economic Development and Policy Impacts. Sustainability 2023, 15, 11017. [Google Scholar] [CrossRef]
  15. Arbulú, I.; Deyà-Tortella, B.; Rey-Maquieira, J.; Tirado, D. The Environmental Kuznets Curve, Water Stress, and Tourism: A European Analysis. Water 2025, 17, 1031. [Google Scholar] [CrossRef]
  16. AQUASTAT—FAO’s Global Information System on Water and Agriculture. Available online: https://www.fao.org/aquastat/en/ (accessed on 29 June 2025).
  17. Moussaid, F.Z.; Jerry, M.; Qafas, A. Examining the Nexus Water Demand-Economic Growth in Morocco: A Tapio Decoupling Index Analysis. Int. J. Account. Financ. Audit. Manag. Econ. 2023, 4, 85–100. [Google Scholar] [CrossRef]
  18. Taheripour, F.; Wallace, E.T.; Haqiqi, I.; Sajedinia, E. Water Scarcity in Morocco: Analysis of Key Water Challenges; World Bank Group: Washington, DC, USA, 2020. [Google Scholar]
  19. Elame, F.; Doukkali, M.R.; Fadlaoui, A. Modélisation Économique de l’impact Des Changements Climatiques Sur Les Ressources En Eau: Cas Du Bassin de Souss-Massa (Maroc). New Medit Mediterr. J. Econ. Agric. Environ. 2016, 15, 10–18. [Google Scholar]
  20. Boudhar, A.; Boudhar, S.; Ibourk, A. An Input–Output Framework for Analysing Relationships between Economic Sectors and Water Use and Intersectoral Water Relationships in Morocco. J. Econ. Struct. 2017, 6, 9. [Google Scholar] [CrossRef]
  21. Houria, E.-T. WATER SCARCITY IMPACTS ON FOOD PRODUCTION IN MOROCCO. Int. J. Strateg. Manag. Econ. Stud. (IJSMES) 2023, 2, 1640–1653. [Google Scholar] [CrossRef]
  22. Othman, M.; Ayoub, S.; Mohamed, S.; Qarro, M.; Mustapha, N.; Mohamed, C.; Ayoub, A. Water in Morocco, Retrospective at the Political, Regulatory and Institutional Levels. Open J. Mod. Hydrol. 2022, 12, 11–31. [Google Scholar] [CrossRef]
  23. Programme mondial de l’UNESCO pour l’évaluation des ressources en eau. In The United Nations World Water Development Report 2020: Water and Climate Change; UNESCO: Paris, France, 2020; ISBN 978-92-3-100371-4.
  24. WWAP (United Nations World Water Assessment Programme). The United Nations World Water Development Report 2019: Leaving No One Behind; UNESCO: Paris, France, 2019. [Google Scholar]
  25. World Economic Forum. The Global Risks Report 2020, 15th ed.; World Economic Forum: Geneva, Switzerland, 2020. [Google Scholar]
  26. World Bank. Water in the Balance: The Economic Impacts of Climate Change and Water Scarcity in the Middle East and North Africa; World Bank: Washington, DC, USA, 2020. [Google Scholar]
  27. Verner, D.; Wilby, R.L.; Breisinger, C.; Al-Riffai, P. Climate Variability, Drought, and Drought Management in Morocco’s Agricultural Sector; World Bank: Washington, DC, USA; Center for Mediterranean Integration: Marseille, France, 2018; p. 164. [Google Scholar]
  28. World Bank. World Development Indicators. 2020. Available online: https://www.worldbank.org/en/publication/wdr2020/brief/world-development-report-2020-data (accessed on 30 June 2025).
  29. Yin, W.; Yang, X.; Liu, W. Sustainable Management and Regulation of Agricultural Water Resources in the Context of Global Climate Change. Sustainability 2025, 17, 2760. [Google Scholar] [CrossRef]
  30. The State of the World’s Land and Water Resources for Food and Agriculture—Systems at Breaking Point (SOLAW 2021); FAO: Rome, Italy, 2021; ISBN 978-92-5-135327-1.
  31. World Health Organization; United Nations Children’s Fund. Progress on Household Drinking Water, Sanitation and Hygiene 2000–2020: Five Years into the SDGs; WHO: Geneva, Switzerland; UNICEF: New York, NY, USA, 2021; p. 164. [Google Scholar]
  32. Ministry of Equipment and Water (Morocco). National Water Plan Draft 2020–2050; Ministère de l’Équipement, du Transport, de la Logistique et de l’Eau: Rabat, Morocco, 2023. [Google Scholar]
  33. Wada, Y.; Wisser, D.; Bierkens, M.F.P. Global Modeling of Withdrawal, Allocation and Consumptive Use of Surface Water and Groundwater Resources. Earth Syst. Dyn. 2014, 5, 15–40. [Google Scholar] [CrossRef]
  34. Jarque, C.M.; Bera, A.K. A Test for Normality of Observations and Regression Residuals. Int. Stat. Rev. Rev. Int. Stat. 1987, 55, 163. [Google Scholar] [CrossRef]
  35. Dickey, D.A.; Fuller, W.A. Distribution of the Estimators for Autoregressive Time Series With a Unit Root. J. Am. Stat. Assoc. 1979, 74, 427. [Google Scholar] [CrossRef]
  36. Nkoro, E.; Uko, A.K. Autoregressive Distributed Lag (ARDL) Cointegration Technique: Application and Interpretation. J. Stat. Econom. Methods 2016, 5, 63–91. [Google Scholar]
  37. Harris, R.; Sollis, R. Applied Time Series Modelling and Forecasting; Wiley: Chichester, UK, 2003; ISBN 978-0470848853. [Google Scholar]
  38. Pesaran, M.H.; Shin, Y.; Smith, R.J. Bounds Testing Approaches to the Analysis of Level Relationships. J. Appl. Econom. 2001, 16, 289–326. [Google Scholar] [CrossRef]
  39. Lütkepohl, H. New Introduction to Multiple Time Series Analysis; Springer: Berlin/Heidelberg, Germany, 2005; ISBN 978-3-540-40172-8. [Google Scholar]
  40. Narayan, P.K. The Saving and Investment Nexus for China: Evidence from Cointegration Tests. Appl. Econ. 2005, 37, 1979–1990. [Google Scholar] [CrossRef]
  41. Menyah, K.; Wolde-Rufael, Y. CO2 Emissions, Nuclear Energy, Renewable Energy and Economic Growth in the US. Energy Policy 2010, 38, 2911–2915. [Google Scholar] [CrossRef]
  42. Damania, R.; Desbureaux, S.; Hyland, M.; Islam, A.; Moore, S.; Rodella, A.-S.; Russ, J.; Zaveri, E. Uncharted Waters: The New Economics of Water Scarcity and Variability; World Bank: Washington, DC, USA, 2017; ISBN 978-1-4648-1179-1. [Google Scholar]
  43. Gujarati, D.N.; Porter, D.C. Basic Econometrics, 5th ed.; The McGraw-Hill Series Economics; McGraw-Hill Irwin: Boston, MA, USA, 2009; ISBN 978-0-07-337577-9. [Google Scholar]
  44. Wooldridge, J.M. Introductory Econometrics: A Modern Approach, 5th ed.; South-Western Cengage Learning: Mason, OH, USA, 2013; ISBN 978-1-111-53439-4. [Google Scholar]
  45. Pesaran, H.; Pesaran, B. Microfit 4.0: Interactive Econometric Analysis; Oxford University Press: Oxford, UK, 1997; ISBN 978-0192685301. [Google Scholar]
  46. Allan, J.A. The Middle East Water Question: Hydropolitics and the Global Economy; I.B. Tauris: London, UK, 2001; ISBN 978-1850439306. [Google Scholar]
  47. Pritchett, L. Understanding Patterns of Economic Growth: Searching for Hills among Plateaus, Mountains, and Plains. World Bank Econ. Rev. 2000, 14, 221–250. [Google Scholar] [CrossRef]
  48. Acemoglu, D.; Johnson, S.; Robinson, J.A. Chapter 6 Institutions as a Fundamental Cause of Long-Run Growth. In Handbook of Economic Growth; Elsevier: Amsterdam, The Netherlands, 2005; pp. 385–472. ISBN 978-0-444-52041-8. [Google Scholar]
  49. Banerjee, A.; Dolado, J.; Mestre, R. Error-correction Mechanism Tests for Cointegration in a Single-equation Framework. J. Time Ser. Anal. 1998, 19, 267–283. [Google Scholar] [CrossRef]
  50. Ayt Ougougdal, H.; Yacoubi Khebiza, M.; Messouli, M.; Lachir, A. Assessment of Future Water Demand and Supply under IPCC Climate Change and Socio-Economic Scenarios, Using a Combination of Models in Ourika Watershed, High Atlas, Morocco. Water 2020, 12, 1751. [Google Scholar] [CrossRef]
  51. Gleick, P.H. Global Freshwater Resources: Soft-Path Solutions for the 21st Century. Science 2003, 302, 1524–1528. [Google Scholar] [CrossRef] [PubMed]
  52. Hoekstra, A.Y.; Mekonnen, M.M. The Water Footprint of Humanity. Proc. Natl. Acad. Sci. USA 2012, 109, 3232–3237. [Google Scholar] [CrossRef] [PubMed]
Figure 1. Evolution of agriculture added value (% of GDP) period 1975–2021. Source: World Bank, World Development Indicators [28].
Sustainability 17 06990 g001
Figure 2. Renewable internal freshwater resources per capita (cubic meters). Source: World Bank, World Development Indicators [28].
Sustainability 17 06990 g002
Figure 3. Water productivity (constant 2015 US dollars per m3). Source: World Bank, World Development Indicators [28].
Sustainability 17 06990 g003
Figure 4. Outlier test. Source: author’s calculations.
Sustainability 17 06990 g004
Figure 5. Cusum Test. Source: author’s calculations.
Sustainability 17 06990 g005
Figure 6. Cusum of squares test. Source: author’s calculations.
Sustainability 17 06990 g006
Table 1. Data source and description.
VariableAbbreviationDefinitionNature/UnitSource [28]
Real Gross Domestic ProductGDPTotal value of goods and services produced, adjusted for inflationBillions of constant 2015 US dollarsWorld Bank (WDI)
Agricultural Added ValueAGValue added by the agricultural sector, adjusted for inflation% of GDPWorld Bank (WDI)
Renewable Internal Freshwater Resources per capitaRWAnnual volume of renewable freshwater available per capitaCubic meters per capitaWorld Bank (WDI)
Water ProductivityWPGDP generated per unit of water used in agricultureConstant 2015 US dollars per m3World Bank (WDI)
Source: author’s compilation.
Table 2. Descriptive statistics.
AGGDPRWWP
Mean13.2835162.7 billion1102.4145.653867
Median12.3583753.8 billion1043.4724.413786
Maximum19.25347124 billion1673.85011.74081
Minimum9.87524720.1 billion784.75002.234064
Std. Dev.2.55577932.8 billion251.28523.076727
Skewness0.9016370.4947110.6888500.784692
Kurtosis2.7314161.9035392.4320592.136175
Jarque–Bera6.5093734.2714884.3487056.284604
Probability0.0385930.1181570.1136820.043183
Sum624.32492.95 × 101251,813.45265.7317
Sum Sq. Dev.300.47234.95 × 10222,904,636435.4474
Source: author’s calculations.
Table 3. Augmented Dickey–Fuller test.
VariableADF (Level)5% Critical ValueStationary at LevelADF (1st Difference)5% Critical ValueStationary at 1st Diff.Order of Integration
GDP−1.65−3.51No−10.60−3.51YesI(1)
AG−3.08−3.51No−11.40−3.51YesI(1)
RW−4.39−3.51YesI(0)
WP−1.92−3.52/−1.95 *No−1.77 (or slightly higher)−1.95No (even at 1st diff.)Weakly I(1) **
* Critical value depends on the model specification (with or without trend). ** Weak evidence of stationarity at first difference. Source: author’s calculations.
Table 4. Lag length criteria.
ModelLogLAICBICHQCAdjusted R2ARDL Specification
243−948.9944.6045.0144.760.9989ARDL(3, 0, 1, 2) *
238−948.2544.6245.0744.780.9989ARDL(3, 0, 2, 2)
242−948.6144.6345.0844.800.9989ARDL(3, 0, 1, 3)
248−950.6644.6445.0044.770.9988ARDL(3, 0, 0, 2)
368−950.6944.6445.0144.770.9988ARDL(2, 0, 1, 2)
Source: author’s calculations. LR: sequential modified LR test statistics (each test at 5% level). FPE: Final prediction error. AIC: Akaike information criterion. SC: Schwarz information criterion. HQ: Hannan-Quinn information criterion. * Indicates lag order selected by the criterion.
Table 5. ARDL (3, 0, 1, 2) ARDL estimation output.
VariableCoefficientStd Errort-StatisticProbability
GDP(-1)1.25160.17177.290.0000
GDP(-2)−0.49740.1931−2.580.0145
GDP(-3)0.16520.10971.510.1414
AG1.78 × 1081.22 × 1081.450.1564
RW−2.19 × 1081.54 × 108−1.420.1653
RW(-1)2.01 × 1081.45 × 1081.390.1735
WP8.60 × 1098.05 × 10810.670.0000
WP(-1)−1.33 × 10101.84 × 109−7.260.0000
WP(-2)5.15 × 1091.40 × 1093.680.0008
(C)1.63 × 10108.59 × 1091.900.0657
Diagnostic stat.Value
R20.9991
R2 SQ0.9989
S.E. of regression1.06 × 109
Akaike info criterion (AIC)44.60
Schwarz criterion45.01
Hannan-Quinn criter.44.75
Log likelihood−971.26
F-statistic4345.71
Prob(F-statistic)0.0000
Durbin-Watson1.77
Source: author’s calculations.
Table 6. ECM form estimation.
VariableCoefficientStd Errort-StatisticProbability
D(GDP(-1))0.33230.13562.450.0195
D(GDP(-2))−0.16520.0862−1.920.0638
D(RW)−2.19 × 1085.27 × 1070.0000
D(WP)8.60 × 1096.47 × 1080.0000
D(WP(-1))−5.15 × 1091.17 × 1090.0000
Constante
CointEq(-1)−0.08060.0208−3.880.0005
Diagnostic stat.Value
R20.885
R2 adj0.870
S.E. of regression1.01 × 109
Akaike info criterion44.42
F-statistic
Durbin-Watson1.77
Source: author’s calculations.
Table 7. Long run form.
VariableCoefficientStd Errort-StatisticProbability
AG2.20 × 1092.38 × 1090.930.3610
RW−2.15 × 1081.59 × 108−1.350.1874
WP5.18 × 1092.96 × 1091.750.0894
Constante2.03 × 10111.29 × 10111.580.1244
Source: author’s calculations.
Table 8. F-Bounds test.
StatisticValueCritical Value (n = 40. k = 3)
F-statistic2.6910%: 2.592–3.454 5%: 3.100–4.088
Source: author’s calculations.
Table 9. Lagrange multiplier test.
TestStatisticp-ValueNull HypothesisConclusion
Breusch–Godfrey Serial CorrelationF = 1.170.322No serial correlation at up to 2 lagsNot rejected (no autocorrelation)
χ2 = 3.010.223
Source: author’s calculations.
Table 10. Heteroskedasticity Test.
TestStatisticp-ValueNull HypothesisConclusion
Breusch–Pagan–Godfrey HeteroskedasticityF = 0.840.584Homoskedasticity of residualsNot rejected (no heteroskedasticity)
χ2 = 8.010.533
Source: author’s calculations.
Table 11. Jarque–Bera normality test.
TestStatisticp-ValueNull HypothesisConclusion
Jarque–Bera NormalityJB = 4.270.118Residuals are normally distributedNot rejected (normality)
Source: author’s calculations.
Table 12. Variance inflation factor (VIF) results.
VariableCentered VIF
GDP(-1)1103.311
GDP(-2)1356.946
GDP(-3)411.6253
AG3.050848
RW42,075.29
RW(-1)40,515.20
WP230.5117
WP(-1)1121.941
WP(-2)621.8940
C (Constante)NA
Source: author’s calculations.
Table 13. ARDL model estimation excluding outlier years (2000 and 2011).
VariableCoefficientStd. Errort-Statisticp-Value
GDP(-1)1.39660.17288.080.0000
GDP(-2)−0.63450.1912−3.320.0023
GDP(-3)0.17310.10501.650.1091
AG1.78 × 1081.20 × 1081.490.1470
RW−1.82 × 1081.48 × 108−1.220.2299
RW(-1)1.68 × 1081.39 × 1081.200.2384
WP8.89 × 1097.72 × 10811.500.0000
WP(-1)−1.49 × 10101.85 × 109−8.050.0000
WP(-2)6.35 × 1091.42 × 1094.480.0001
C1.28 × 10108.25 × 1091.550.1312
TestNull hypothesisStatisticp−valueDecision
Breusch-Godfrey (autocorrelation)No serial correlationProb. Chi2(2) = 3.010.2225Not rejected: No autocorrelation
Jarque–Bera (residual normality)Residuals are normally distributedJB = 17.380.00017Rejected: Non-normal residuals
Breusch-Pagan-Godfrey (heteroskedasticity)Homoskedasticity (constant variance)Prob. Chi2(9) = 8.010.5327Not rejected: No heteroskedasticity
Outlier detection (2 SD rule)No extreme outliers--No outliers detected
StatisticValue
R20.9993
Adjusted R20.9990
S.E. of regression1.00 × 109
Akaike info criterion44.50
F-statistic4748.05
Prob(F-statistic)0.0000
Durbin-Watson stat1.55
Source: author’s calculations.
Disclaimer/Publisher’s Note: The statements, opinions and data contained in all publications are solely those of the individual author(s) and contributor(s) and not of MDPI and/or the editor(s). MDPI and/or the editor(s) disclaim responsibility for any injury to people or property resulting from any ideas, methods, instructions or products referred to in the content.

