Abstract
Achieving synergies between government-led and market-based policy instruments is critical to advancing Energy–Environmental Productivity and Sustainable Urban Development. This study investigates the effects of China’s dual-pilot energy policies (New Energy Demonstration Cities (NEDCs) and Energy Consumption Permit Trading (ECPT)) on urban environmental productivity (UEP) across 279 prefecture-level cities from 2006 to 2023. Utilizing a Non-Radial Directional Distance Function (NDDF) approach, combined with Difference-in-Differences (DID) estimation and spatial econometric models, the analysis reveals that these synergistic policies significantly enhance both comprehensive and net measures of UEP. Mechanism analysis highlights the roles of industrial restructuring, technological innovation, and energy transition in driving these improvements, while heterogeneity analysis indicates varying effects across different city types. Spatial spillover analysis further demonstrates that policy impacts extend beyond targeted cities, contributing to broader regional gains in UEP. These findings offer important insights for the design of integrated energy and environmental policies and support progress toward key Sustainable Development Goals (SDG 7, SDG 11, and SDG 12).
1. Introduction
The inequality and unsustainability of energy consumption have intensified global extreme climate change, making it one of the most pressing challenges facing the world today [1]. Recent Intergovernmental Panel on Climate Change (IPCC) reports also emphasize the need for integrated policy solutions to address climate mitigation while sustaining economic productivity [2]. The global transition toward sustainable urban development requires innovative approaches to simultaneously advance urban environmental productivity (UEP) and economic performance. Achieving synergies between state-led and market-based mechanisms and technological innovation is critical to meeting the targets set by the United Nations Sustainable Development Goals (SDGs), particularly SDG 7 (Affordable and Clean Energy), SDG 11 (Sustainable Cities and Communities), and SDG 12 (Responsible Consumption and Production) [2,3,4]. A growing body of research in environmental economics and productivity analysis emphasizes the importance of integrated policy approaches that align energy efficiency, environmental performance, and urban sustainability [5,6,7]. Besides this, recent UNEP assessments highlight the need to strengthen measurement frameworks for environmental efficiency and policy synergy in the pursuit of sustainable urban development [8]. However, evidence on how state-led and market-based mechanisms interact to shape sustainable productivity outcomes remains limited, especially in urban contexts.
As the world’s largest energy producer and consumer, China is at the forefront of this issue. According to the Statistical Bulletin of the People’s Republic of China on National Economic and Social Development (2024), China’s total energy consumption in 2024 reached 5.96 billion tons of standard coal, a 4.3% year-on-year increase, with coal consumption remaining dominant in the energy structure at 53.2% [9,10]. Furthermore, carbon emissions from the energy system account for approximately 88% of the country’s total carbon emissions. This trend of high energy consumption and extensive development underscores the systemic challenges in China’s energy transformation. On the supply side, the energy structure remains heavily reliant on coal, with limited contributions from oil and natural gas. On the demand side, the industrial restructuring is skewed toward energy-intensive industries [11,12,13,14]. Faced with the imbalance between energy supply and demand, rising energy consumption, and mounting pressures from carbon emissions, China urgently needs to establish an energy transition pathway that integrates policy guidance with market mechanisms. Globally, aligning productivity gains with environmental sustainability is a key priority. Thus, achieving climate and sustainability targets requires integrated public policies that align UEP with economic and well-being goals [15]. Accelerating the production of clean energy and promoting green energy consumption are critical to achieving—SDG 7 (Affordable and Clean Energy) and SDG 11 (Sustainable Cities and Communities)—that require integrating energy policies with environmental productivity goals [3].
To enhance the state’s strategic role in guiding energy transformation, the National Energy Administration of China released a list of new energy demonstration cities (NEDCs) in 2014, designating 81 cities to spearhead environmental governance and drive energy system reform through innovation in clean energy applications. Building on this initiative, China further advanced the market-oriented reform of its energy system. In 2016, the National Development and Reform Commission introduced the Pilot Plan for Paid Use and Trading System of Energy-Consuming Rights, selecting Zhejiang, Fujian, Henan, and Sichuan provinces for pilot programs on Energy Consumption Permit Trading (ECPT), which were officially implemented in 2017. The coordinated implementation of NEDC and ECPT policies has established an energy transformation policy framework that integrates state-led and market-based mechanisms. This approach reflects institutional collaborative innovation through the synergy of an effective state and an effective market [16,17].
As dual instruments of energy and environmental regulation, the NEDC and the ECPT policies simultaneously target the energy supply and demand sides, reshaping the energy production and consumption structure as well as the carbon emission trajectory of Chinese cities. These efforts have enabled China to achieve notable progress in sustainable energy development. According to the 2024 Annual Report on China’s Policies and Actions to Address Climate Change, China’s installed capacity of new energy in 2023 reached 1.516 billion kilowatts, maintaining its position as the global leader. Renewable energy accounted for 51.9% of the country’s total installed power generation capacity, while the share of coal-fired power generation fell below 40%. Additionally, coal consumption decreased to 55.3% in 2023, down from 67.4% in 2013. At the same time, the energy trading market has been steadily improving, expanding, and developing. By the end of 2023, Zhejiang Province had conducted 49 energy use rights transactions during the year. Fujian Province recorded a cumulative transaction volume of 2.2091 million tons of standard coal, amounting to CNY 34.45 million. During the 13th Five-Year Plan period, Hubei Province carried out energy use rights transactions, with a total transaction volume exceeding 1.9 million tons of standard coal and a transaction value of over CNY 100 million. Policy documents such as the Action Plan for Carbon Peak by 2030 and the Notice issued by the National Energy Administration on Organizing and Carrying out Pilot and Demonstration of Renewable Energy Development further emphasize the need to enhance the energy-consuming rights trading system, accelerate the establishment of a national energy-consuming rights trading market, and build a new energy system led by new energy demonstration projects. These initiatives aim to shift the focus from dual control of energy consumption to dual control of carbon emissions. This development underscores the dual energy pilot policy as a critical tool for China to achieve its carbon peak and carbon neutrality goals, as well as to advance its sustainable economic and social transition.
China, as the world’s largest developing country, prioritizes economic development as a primary state objective. Beyond promoting the green transformation of the energy system to achieve energy conservation and emissions reduction, balancing the relationship between energy consumption, carbon emissions, and economic growth while improving energy and UEP remains a critical challenge for achieving sustainable urban development. Cities serve not only as core hubs of economic activity and sustainable urban development but also as demonstration sites for new energy initiatives and key participants in the energy-consuming rights trading system. Consequently, transforming the energy structure and enhancing UEP have become strategic focal points for transitioning China’s economic growth model and fostering sustainable productivity growth. However, under the dual roles of an effective state and an effective market, can the combination of state-led and market-based mechanisms effectively improve UEP while promoting the transformation of urban energy structures? Or might the overlap of policy instruments lead to efficiency losses [18,19]? These critical questions require further in-depth exploration. As the world’s largest energy consumer and a developing country, China’s approach to promoting energy structure transformation and achieving energy conservation and emission reduction through policy guidance and market mechanisms represents an important example of energy policy innovation. Studying the impact of China’s dual-pilot energy policies (DPEPs) on UEP provides valuable insights and evidence for global energy system reform and sustainable urban development. Hence, it is essential to create synergies between government-led and market-based policy instruments to advance Energy–Environmental Productivity and Sustainable Urban Development, which is an important research gap and the primary motivation of this study. Thus, this study assesses the impacts of synergistic energy policies on UEP and their contribution to sustainable urban development.
UEP, as conceptualized in this study, refers to a city’s ability to simultaneously maximize desirable economic output and minimize undesirable environmental inputs, particularly energy use and emissions. UEP builds on frontier-based efficiency concepts and is operationalized using a Non-Radial Directional Distance Function (NDDF). It differs from traditional measures such as eco-efficiency, which typically uses simple ratios of output to environmental input, and from green total factor productivity (green TFP), which focuses on long-term productivity growth under environmental constraints. Unlike these, UEP provides a unified measure of static performance across multiple inputs and outputs, enabling more granular policy evaluation in a multi-dimensional urban setting [20,21,22]. This concept is closely linked to eco-efficiency and sustainable productivity, widely studied in the international literature [6]. This theoretical framework integrates input factors, desired outputs, and undesirable outputs into a unified production frontier evaluation system. It constructs a comprehensive measurement model for economy–energy–environment co-optimization and describes the dynamic balance among resource utilization efficiency, environmental carrying capacity, and economic benefits within the context of regional development [23]. The materials balance condition is also fundamental in UEP analysis [24,25,26]. Chung et al. first introduced the Directional Distance Function (DDF) to measure UEP, accounting for undesirable outputs [27]. Numerous studies have since applied these methods to evaluate energy and UEP [5,28]. However, the traditional DDF relies on radial measures, which proportionally reduce undesirable outputs or increase desirable outputs without distinguishing efficiency losses between input and output factors.
To address this limitation, Zhou et al. and Zhang et al. proposed the NDDF, which considers undesirable outputs and enhances the measurement of UEP [5,29]. This approach also allows for estimation of shadow prices of undesirable outputs, as shown by Färe et al. [30]. The NDDF has been widely adopted in international research to measure eco-efficiency, UEP, and sustainable performance [5,6,31,32]. It enables the simultaneous modeling of desirable and undesirable outputs, making it particularly well-suited for evaluating sustainability-oriented policy impacts. By modeling both energy consumption and pollutant emissions, the NDDF provides an integrated measure of UEP that aligns with sustainable urban development goals and productivity-enhancing policy analysis. This study builds on this well-established methodological foundation to analyze UEP in the context of China’s dual-pilot policies, contributing to global debates on UEP and sustainable urban development. This advancement expanded the application of the NDDF method in UEP assessments. The application of the NDDF allows for international comparability of efficiency outcomes, making the results of this study relevant not only for China but also for broader discussions on global energy and UEP, and policy synergy. In the measurement of UEP, input factors typically include capital (K), labor (L), and energy (E). The desired output is economic income (Y), while the undesirable output is carbon emissions (C). Since capital and labor inputs do not directly generate carbon emissions, Zhang and Choi further divided UEP into Comprehensive Urban Environmental Productivity (CUEP) and Net Urban Environmental Productivity (NUEP) [33]. CUEP considers the allocative efficiency of maximizing desired outputs and minimizing undesirable outputs across all input factors, including capital, labor, and energy. NUEP, on the other hand, focuses exclusively on the allocative efficiency of maximizing desired outputs and minimizing undesirable outputs associated with energy inputs.
This study aims to evaluate the synergistic impact of China’s DPEPs—namely, the NEDC and ECPT policies—on UEP. By applying a combination of NDDF efficiency modeling, Difference-in-Differences (DID) estimations, and spatial econometric analysis across 279 Chinese cities from 2006 to 2023, this study seeks to assess whether the simultaneous implementation of supply- and demand-side energy reforms can improve both economic and environmental performance in urban areas. The goal is not only to provide robust empirical insights into the effectiveness of policy synergies in China but also to offer practical implications for integrated energy–environment policymaking in other emerging economies.
The remainder of this paper is structured as follows: Section 2 reviews the current literature related to the latest advancements in this research area. Section 2 presents the conceptual framework of policy synergies and formulates the research hypotheses regarding their effects on UEP. Section 4 describes the empirical strategy, including the measurement of energy and UEP using the NDDF approach, key variable construction, and data sources. Section 5 provides empirical results on the impacts of the dual-pilot energy policies on UEP and sustainability outcomes. Section 6 offers further analyses, including comparative assessments of policy synergy effects and evaluations of spatial spillover dynamics. Finally, Section 7 concludes with a summary of key findings, policy implications for sustainable urban development, study limitations, and directions for future research.
2. Literature Review
Building on the accurate measurement of UEP, academia has increasingly explored the key factors driving improvements in UEP. Relevant research primarily focuses on three dimensions: technological innovation, financial development, and environmental regulation. In terms of technological innovation, Wang et al. found that green innovation sustainably augments regional energy efficiency by industrial restructuring [34]. From the perspective of digital technology innovation, Xiao et al. demonstrated that digital technology innovation substantially improves urban total factor energy efficiency, with a 1% increase in digital technology innovation resulting in an approximately 0.035% increase in energy efficiency. Lu et al. further showed that industrial transition to higher productivity sectors generates scale and synergy effects, providing new momentum for improving carbon emission efficiency [35]. Research on financial development has focused on digital finance and green finance. Liao et al. found that digital HP finance effectively reduces urban environmental pollution while improving energy efficiency [28]. Using a quasi-natural experiment, Zhao et al. revealed that the green finance reform and innovation pilot zone policy markedly boost urban energy efficiency [36]. Furthermore, Shi and Ya examined the policy synergy between digital finance and green finance, finding that these mechanisms optimize urban energy efficiency through dual pathways of green technology innovation and digital technology innovation [37]. Regarding the impact of environmental regulation on energy efficiency, studies have approached the topic from two perspectives: environmental concern and policy instruments. Wang et al. and Guo and Lu employed quantitative text analysis, finding that public–market policy synergies and state environmental attention positively correlate with urban energy efficiency [38,39]. From the perspective of market-oriented environmental regulation, Cui and Cao, and Lu et al. analyzed the impacts of China’s sulfur dioxide emission trading policy and carbon emission trading policy on urban energy efficiency [11,40]. Li et al. investigated the effects of sustainable city construction on China’s energy transition, concluding that the sustainable city pilot policy increased UEP by an average of 3.8% [41].
With the acceleration of energy transition, existing research on the effects of energy policy has established a dual-track framework encompassing state guidance and market regulation. State-led and market-based mechanisms are exemplified by the new energy demonstration cities. Zhou et al. used the SE-EBM model to measure urban energy efficiency and found that new energy demonstration cities considerably strengthen urban energy efficiency and carbon emission efficiency [42]. Hou et al. reported that these cities promote regional energy transformation [43]. Using data from China’s A-share listed enterprises with high energy consumption from 2007 to 2022, Chen et al. further explored the micro-level impacts of the NEDC policy and found that their construction effectively improved the green total factor productivity (TFP) of enterprises [44]. Market regulation policies primarily include tradable green certificates, white certificates, and energy trading systems. Previous studies have shown that tradable green and white certificates enhance system efficiency by optimizing the energy supply chain, aiding states in achieving sustainable development goals [11,45,46]. Cui and Cao found that energy trading systems improve green TFP in pilot areas through green technology innovation and industrial restructuring [47]. Peng and Gao further examined the policy synergy between dual-track energy policy, combining state-led and market-based mechanisms, and urban carbon emission efficiency [16]. They found that the DPEPs enhance urban carbon emission efficiency through industrial restructuring, energy efficiency improvements, and technological progress.
In summary, the existing literature has provided valuable insights into the concept, measurement methods, improvement pathways, and impacts of UEP. It has also affirmed the positive significance of energy and environmental policies in promoting energy conservation, emission reduction, and efficiency enhancement. However, most studies focus on the individual policy effects of either new energy demonstration cities or energy use rights trading, with limited attention to the combined effects of DPEPs. Additionally, the interaction effects between different energy policies remain insufficiently explored. Furthermore, existing research often isolates the policy objectives of energy conservation, emissions reduction, pollution control, and economic efficiency improvement for analysis. Many studies rely on single indicators, such as pollution emissions, energy consumption, economic growth, energy efficiency, or carbon emission efficiency, to evaluate policy effects. This segmented approach makes it difficult to comprehensively assess the overall impact of policy implementation. As a result, examining the synergies among energy conservation, consumption reduction, emissions reduction, and efficiency improvement is frequently overlooked.
In this context, this study defines the coordinated implementation of NEDC and ECPT as the DPEPs. It constructs a comprehensive analytical framework for UEP, integrating energy consumption, carbon emissions, and economic benefits. This paper aims to systematically examine the impacts and mechanisms of the DPEPs on UEP. Using panel data from 279 Chinese cities from 2006 to 2023, this study employs the Difference-in-Differences (DID) method to systematically investigate four key issues: (1) the overall impact of the DPEPs on UEP; (2) the transmission mechanisms through which these policies influence UEP; (3) the heterogeneity of policy effects across cities with varying levels of industrial restructuring, resource dependency, and environmental attention; (4) the comparative effectiveness and spatial spillover effects of the DPEPs.
Thus, the main contributions of this study are as follows: First, unlike previous studies that evaluate the effects of individual energy and environmental policies, this paper systematically examines the linkage effects of the NEDC and the ECPT policies from the perspective of collaborative governance between an effective state and an effective market. This provides a new theoretical perspective for improving the policy framework of energy and environmental governance. Second, the paper uses the UEP index to evaluate the effects of the DPEPs, covering two dimensions: CUEP and NUEP. UEP is a composite index encompassing energy consumption, carbon emissions, and economic output that effectively overcomes the limitations of single-indicator evaluations. This approach more comprehensively reflects the overall impact of the DPEPs on sustainable urban development [39]. Third, this research focuses on the city level, deeply examining the heterogeneity of policy effects across regions and their spatial spillover effects. It reveals the varying performances of policy synergies under different regional characteristics to meet the IEA’s net-zero roadmap, which highlights the need for cross-sectoral policy synergies to drive sustainable energy productivity [48]. The insights gained from this study contribute to the global knowledge base on designing effective policy synergies that advance sustainable energy transitions and UEP, supporting progress toward the SDGs. These findings also offer insights for other emerging economies and urban regions pursuing energy productivity and sustainability transitions, including through market-based mechanisms such as the EU ETS and OECD environmental policy frameworks.
3. Conceptual Framework and Research Hypotheses
In this study, we define UEP as the static operational efficiency of a city in transforming energy and capital inputs into economic output while minimizing environmentally harmful outputs. The concept is measured using a DDF, which allows for simultaneous expansion of desirable output (e.g., GDP) and contraction of undesirable outputs (e.g., CO2 emissions, energy use). Unlike eco-efficiency, which often relies on simple ratios and is sensitive to scale, or green TFP, which emphasizes long-term productivity growth dynamics, UEP provides a more flexible, static benchmark for evaluating multi-input, multi-output urban performance at a given point in time. This distinction is critical for assessing the impact of spatially heterogeneous policy interventions such as China’s DPEPs. We follow Coelli et al. in applying environmental efficiency measurement under the materials balance condition [24]. UEP thus serves as a core indicator of sustainable urban performance and is directly aligned with the goals of advancing environmental efficiency, economic productivity, and sustainable development.
3.1. DPEPs and Urban Environmental Productivity (UEP)
As the dual drivers of China’s energy system reform, the NEDC and ECPT policies differ in their instrumental attributes and implementation mechanisms. However, their core purpose is to promote the transformation of energy production and consumption toward cleaner and more efficient practices, thereby promoting sustainable economic growth of energy in the new era. The implementation of a mix of energy policies is likely to advance policy synergy and UEP [49].
The policy of new energy demonstration cities promotes the development and application of new energy through administrative guidance, gradually reducing dependence on traditional energy, and establishes clear requirements for pollution emission assessments. Meanwhile, the energy-consuming rights trading system, through the construction of a market-oriented energy quota allocation and trading mechanism, forms an incentive-compatible environmental regulation framework. It achieves dual regulation of regional energy consumption volume and intensity [34]. Through the dual state-led and market-based mechanisms, the NEDC and ECPT policies guide energy consumers to use energy more rationally, reduce reliance on traditional energy consumption, facilitate the broader adoption of clean energy, and jointly promote the transformation of urban energy structures toward greener and low-carbon directions. Additionally, the implementation of the ECPT policy compels enterprises in pilot areas to choose between “energy use” and “energy conservation.” Simultaneously, the NEDC policy provides a feasible pathway for enterprises constrained by the energy use quota system to overcome these limitations. Enterprises can opt to adopt clean energy and clean energy technologies to achieve energy conservation and emission reduction targets. This not only alleviates the constraints of the ECPT policy on enterprises’ energy quotas but also actively supports the new energy demonstration city’s goals for the application and promotion of clean energy. Compared with single-pilot cities, the DPEPs complement each other in advancing energy system reform. This synergy creates a more robust energy reform framework, resulting in a “policy superposition effect” that better drives the improvement of UEP. Finally, dual-pilot energy cities face dual requirements: transforming toward green energy consumption and meeting energy dual control targets. The combined pressures of consumption reduction and emission reduction encourage local states and enterprises to collaborate on industrial restructuring and technological innovation [50]. By urban industrial restructuring, promoting research, sustainable urban development, and application of new technologies, and reallocating resources to cleaner and more efficient sectors, the state fosters positive spillover effects for the environment and the economy. This synergy promotes the virtuous interaction between energy efficiency improvements, environmental performance enhancements, and economic growth, maximizing the multiplier effect of energy policies. Ultimately, it achieves the dual goals of energy dual control and carbon emission dual control, improving UEP. Based on this, the following hypothesis is proposed:
Hypothesis 1.
The DPEPs synergistically drive the improvement of UEP.
3.2. Linking DPEPs to Structural, Innovation, and Scale Efficiency Mechanisms
This study theorizes that the DPEPs—comprising the NEDC and ECPT programs—affect UEP through three primary mechanisms: structural adjustment, innovation stimulation, and scale efficiency improvement.
First, the structural adjustment operates through industrial restructuring and urban energy mix transformation. Under the NEDC policy, cities receive central support for renewable energy infrastructure deployment, pilot technologies, and administrative mandates for clean energy targets. These facilitate a shift from high-emission industries toward cleaner sectors and service-oriented economies. By contrast, ECPT incentivizes structural adjustment indirectly by imposing tradable energy consumption limits, which penalize inefficient industries and reward lower energy intensity sectors, thereby rebalancing the urban industrial structure.
Second, the innovation stimulation is primarily driven by ECPT, which creates a market-based signal for firms and local governments to invest in energy-saving and pollution-reducing technologies. The cap-and-trade design provides dynamic incentives for continuous process improvement. The NEDC policy, while not directly pricing energy, contributes to innovation by funding demonstration projects, enabling learning by doing, and promoting knowledge spillovers through government-led pilots. Thus, ECPT fosters bottom-up innovation, while NEDCs promote top-down experimentation and replication.
Third, the scale efficiency improvement emerges as cities adopt greener technologies at broader scales and leverage policy support to increase efficiency returns. In NEDCs, centralized infrastructure investments (e.g., in smart grids or renewable energy plants) create scale advantages. In ECPT, firms that scale up cleaner production benefit from lower marginal energy costs under the trading mechanism.
Together, these mechanisms form complementary channels through which the DPEPs improve UEP. The synergistic impact of implementing both policies lies in aligning administrative planning (NEDCs) with market responsiveness (ECPT), which creates both immediate behavioral adjustments and longer-term capability building. The mapping between these policy instruments and their mechanism-specific influence on UEP is summarized in Table 1.

Table 1.
Mapping of policy instruments to mechanisms enhancing UEP.
3.2.1. Structural Adjustment
Urban industrial restructuring and layout reflect the sustainable urban development of urban production activities, which are directly linked to urban energy consumption and environmental quality. From the perspective of new energy demonstration cities, the construction of these cities provides green and clean energy industries, along with related supporting industries, with policy support and market opportunities. It guides capital, technology, and other production factors to concentrate in sustainable industries, gradually reducing the proportion of high energy consumption and high pollution industries in cities [51,52] and promoting the advancement and rationalization of industrial transition to higher productivity sectors. The implementation of ECPT relies on market-driven resource allocation mechanisms to compel high energy consumption enterprises to reform their energy use structures, adopt energy-efficient technologies, or exit the market. This system promotes industrial restructuring toward cleaner and more efficient practices. The combination of DPEPs aims to reconstruct the industrial system on the supply side, optimize energy allocation on the demand side, and drive the transformation of industrial restructuring toward low-energy consumption and sustainable urban development. This transformation reduces the intensity of traditional energy use and carbon emissions in cities, increases the proportion of clean energy use, and ultimately improves UEP. Accordingly, this paper proposes the following research hypothesis:
Hypothesis 2.
The DPEPs promote the optimization and upgrading of industrial restructuring and effectively improve UEP through structural adjustment.
3.2.2. Innovation Stimulation
The DPEPs improve UEP, with technological innovation serving as the key driving force. By advancing innovation in energy mining, management, consumption, governance, and clean energy applications, cities can create new economic growth drivers through energy technology innovation, reduce traditional energy consumption and pollution emissions, achieve efficient energy use and management, and transition to a resource-saving and environmentally sustainable growth model, thereby improving UEP. On the one hand, to meet political performance goals, states implement policy tools such as fiscal and tax incentives and special funding support to accelerate the agglomeration of innovation resources, including talent, capital, and technology, in new energy demonstration cities. This fosters the formation of knowledge-intensive innovation networks and creates a favorable innovation ecosystem for research, sustainable urban development, and industrial transition to higher-productivity sectors [53,54]. On the other hand, the energy trading system drives enterprise innovation through market mechanisms. ECPT internalizes negative externalities, such as environmental deterioration caused by unrestrained energy resource use. It enables energy-efficient enterprises to sell energy-saving quotas for economic gains, thereby forming innovation incentives. Simultaneously, it exerts environmental rationality pressure on low-energy-efficiency enterprises, compelling them to invest in advanced technologies and cleaner production processes to enhance UEP [55]. Additionally, from the perspective of the new energy market’s prospects and the long-term dynamic development of enterprises, companies must continuously innovate to maintain competitive advantages and capture market share in the new energy sector. This includes promoting product quality improvements and technological advancements to optimize the structure of energy production and consumption and improve UEP at its source. Such innovation facilitates the coordinated improvement of economic and environmental performance [56,57,58]. In summary, the synergistic effect of the DPEPs creates a virtuous cycle of resource agglomeration, innovation incentives, and market competition. This cycle effectively drives technological innovation across the entire energy chain, including energy mining, management, consumption, and supervision. It promotes the adoption and application of new energy technologies in various industries, achieves energy conservation and carbon reduction throughout the energy supply and consumption chain, and generates new economic growth drivers through energy technology innovation, ultimately improving UEP. Accordingly, this paper proposes the following research hypothesis:
Hypothesis 3.
The DPEPs promote technological innovation and drive improvements in UEP through innovation stimulation.
3.2.3. Scale Efficiency Improvement
As the world’s largest energy consumer, China faces significant challenges in transforming its energy structure, which is heavily reliant on coal, and achieving dual control of energy and carbon emissions. Based on the construction goals of new energy demonstration cities, the state sets binding targets for the total amount and intensity of energy consumption, internalizes the externalities of environmental pollution, implements incentive policies for regional production capacity and energy-using enterprises, encourages the transformation of production capacity enterprises toward the clean energy industry, and guides energy-using enterprises to transition from traditional fossil energy consumption to new energy consumption. This process gradually reduces dependence on traditional energy resources, aiming to control energy consumption, pollution emissions, and carbon emissions at their source [43]. ECPT further facilitates the effective reallocation of factor resources from high-consumption, inefficient production sectors to clean and efficient production sectors through rigid energy use quota constraints and a market trading mechanism [59]. Under the constraints of energy consumption quotas, enterprises are incentivized to adjust the allocation of production factors, optimize their energy consumption structures, and adopt cleaner and more efficient production models. When enterprises achieve energy-saving transformations, they can generate economic benefits through additional quota trading, improving their overall production efficiency. This leads to the dual enhancement of energy efficiency and business performance, forming a virtuous cycle of energy conservation and efficiency gains [20]. In summary, through the combination of administrative control and market regulation, the DPEPs jointly drive reforms in energy production and consumption, guide the transformation of urban energy structures toward clean energy, and reduce dependence on traditional energy and resources. This approach achieves a dual dividend of energy conservation and emission reduction alongside economic benefits, ultimately improving UEP. Accordingly, this paper proposes the following research hypothesis:
Hypothesis 4.
The DPEPs reduce traditional energy dependence and total energy consumption, effectively improving UEP through scale efficiency improvement.
To better illustrate the analytical structure of this study, Figure 1 presents a conceptual framework outlining how China’s DPEPs are hypothesized to impact UEP. The model operates through three main mechanisms: structural transformation, innovation stimulation, and scale efficiency improvement. NEDCs support these via policy-driven infrastructure and planning, while ECPT incentivizes behavioral change through market pricing and quota allocation. The dual implementation is expected to produce synergistic effects.
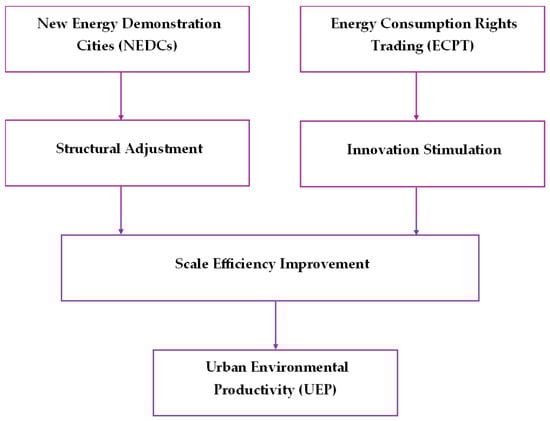
Figure 1.
Conceptual framework showing how DPEPs affect UEP through structural, innovation, and scale efficiency mechanisms.
4. Methodology
This section presents the methodological foundation of this study. The section begins with data source descriptions and city-level characteristics. We then introduce the theoretical metric of UEP and the rationale for using the NDDF. Afterwards, the identification strategy is explained, including the Propensity Score Matching Difference-in-Differences (PSM-DID) approach. Finally, we describe the construction of treatment variables, key inputs/outputs, and control variables. The section concludes with data source descriptions and city-level characteristics.
4.1. Data Sources and Description
This paper selects 279 prefecture-level cities in China from 2006 to 2023 as research samples. The list of NEDCs was obtained from the National Energy Administration website [60], and the information on ECPT was obtained from the official website of The State Council of the People’s Republic of China—English [61]. The carbon dioxide emission data of prefecture-level cities were sourced from the European Commission, Joint Research Center’s Emissions Database for Global Atmospheric Research (EDGAR) [62]. The city-level data used to compute the CUEP and NUEP indicators were compiled from several authoritative sources: (a) China Energy Statistical Yearbook 2024 (CESY), National Bureau of Statistics of China [63]; (b) China City Statistical Yearbook (CCSY) [64]; (c) China Stock Market & Accounting Research Database (CSMAR Data) [65] across multiple years; and (d) Report on the State of the Ecology and Environment in China (Ministry of Ecology and Environment, multiple years [66]). These sources provide city-level values for energy consumption, GDP, emissions, population, and industrial structure—used to derive inputs and outputs for the NDDF model. The integration of these datasets ensures consistency, comparability, and national coverage across the 279 cities included in the analysis. In data processing, this paper uses the linear interpolation method to interpolate a few missing data points and Winsorizes the continuous data by 1% and 99% to eliminate the interference of outliers. The descriptive statistics of the main variables are shown in Table 2.
Table 2.
Descriptive statistics of main variables.
4.2. Model
To effectively evaluate the impact of the NEDC and ECPT policies—collectively referred to as the DPEPs—on UEP, this study employs a DID model, following Peng and Gao [16]. The model is specified as follows:
where subscripts and denote city and year, respectively. The dependent variable, UEP, includes two measures: CUEP and NUEP. The key explanatory variable, , indicates whether a city implements the DPEPs. Additionally, represents a set of control variables that may influence UEP. is the intercept, while and denote the coefficients of the explanatory variables. µ represents region-fixed effects, λ represents time-fixed effects, and ε is the random error term. This study primarily focuses on the coefficient of , which estimates the causal effect of the DPEPs on UEP.
In our baseline specification, we assign equal weights to all inputs and outputs in the NDDF estimation. This decision follows standard practice in the UEP literature (e.g., Färe et al. [30] and Chung et al. [27]), where equal weighting is used to provide a neutral and unbiased benchmark for comparing performance across heterogeneous units such as cities. Equal weights avoid the imposition of normative judgments regarding the relative importance of, for instance, energy consumption vs. pollutant emissions. Moreover, this approach ensures comparability and transparency when evaluating the average treatment effects of policies across the national sample. Nonetheless, to address potential concerns about this assumption, we also conduct a sensitivity analysis using alternative weightings (see robustness discussion in Section 5.3.4), which confirms the robustness of our main findings.
4.3. Variables
4.3.1. Dependent Variable
The explained variable in this paper is UEP. Following Li et al. [41], this study employs the NDDF model with undesirable outputs to measure UEP, distinguishing between CUEP and NUEP.
- Production function specification
Drawing on existing studies [67], this study assumes an economy with N cities, where each city utilizes three input factors: capital (K), labor (L), and energy (E). The desirable output (Y) is the gross regional product, while the undesirable output (C) is carbon dioxide (CO2) emissions. The production possibility set (T) under the assumption of constant returns to scale for N cities is defined as follows:
Following the definition proposed by Zhang and Choi [33], the NDDF model incorporating undesirable outputs is given by
where represents the weight vector associated with inputs and outputs, denotes the directional vector, and captures the set of factors influencing inefficiencies in each input or output. represents a diagonal matrix, and denotes the environmental production technology.
- Model Solution
The solution process for the NDDF model consists of two steps: first, define the weight vector for input and output factors and specify the directional vector . Second, incorporate all input factors and outputs into the objective function and constraint conditions to solve for the optimal value of β for each factor, thereby constructing an energy and environmental productivity index to measure UEP. The efficiency scores for UEP range from 0 to 1, where a higher value indicates greater efficiency. If a city’s UEP equals 1, it implies that the city operates on the production frontier, achieving optimal efficiency.
- Solution for CUEP: Following the approaches of Chung et al. [27], Zhang et al. [29], and Färe et al. [30], this study first assigns equal weights to input factors, desirable outputs, and undesirable outputs. The input factors include capital (K), labor (L), and energy (E), which are further evenly distributed. Based on this, the weight vector for input and output factors and the directional vector are specified. These values are then incorporated into the objective function and constraint conditions to solve for the optimal β values for each factor. The NDDF value for CUEP and the corresponding energy and environmental productivity index are thus obtained as follows:
- Solution for NUEP: Since capital and labor inputs do not directly generate carbon emissions, this study follows the approach of Zhang and Choi [33] by setting the weight vector for input and output factors and specifying the directional vector . Capital and labor are then excluded from the objective function and constraint conditions. The NDDF value for NUEP and the corresponding energy and environmental productivity index are thus obtained as follows:
The input factors, desirable output variables, and undesirable output variables used to calculate UEP are defined and measured as follows: (1) Capital input : Measured by the urban fixed capital stock. Following Zhang [68], the perpetual inventory method is applied with 2006 as the base year, and the annual capital depreciation rate is set at 9.6%. (2) Labor input : Measured by the total number of employed persons in the city. (3) Energy consumption input : Represented by total primary energy consumption, which includes total electricity usage across society, total artificial coal, gas, and natural gas supply in urban districts, and total liquefied petroleum gas supply in urban districts. The total energy consumption in tons of standard coal for each city is calculated using the following conversion factors: 1.229 tons of standard coal per 10,000 kWh for electricity, 13.3 tons of standard coal per 10,000 cubic meters for natural gas, and 1.7143 tons of standard coal per ton for liquefied petroleum gas. (4) Desirable output : Measured by annual gross regional product, adjusted to 2006 constant prices in 2006 using the Gross Domestic Product (GDP) deflator. (5) Undesirable output (C): Measured by the city’s carbon dioxide (CO2) emissions.
Figure 2 illustrates the spatial distribution of CUEP and NUEP in 2006 and 2023. Overall, both CUEP and NUEP exhibit an upward trend from 2006 to 2023, though with significant spatiotemporal heterogeneity. From a spatial perspective, the southeastern coastal regions have consistently maintained efficiency frontiers for both CUEP and NUEP, benefiting from first-mover advantages and strong policy support. The central regions have achieved rapid development through factor accumulation and technological diffusion, while the western regions have seen improvements but still exhibit relatively low UEP. From a temporal perspective, the spatial pattern of CUEP and NUEP has evolved from a “point-like distribution” in 2006 to a “belt-shaped expansion” in 2023. In 2006, high-efficiency areas were concentrated in a few economically developed cities, displaying significant polarization. By 2023, with technology diffusion and policy spillover effects becoming more pronounced, regional efficiency disparities have gradually narrowed. Notably, continuous high-efficiency belts have emerged around urban agglomerations such as the Yangtze River Delta and the Pearl River Delta.
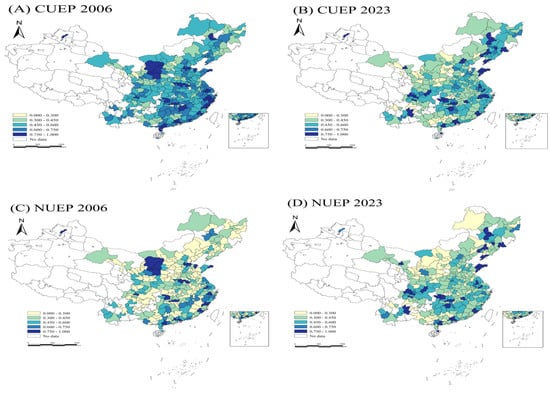
Figure 2.
Spatial distribution of CUEP and NUEP for 279 Chinese cities (baseline year: 2012). Data Sources: (A) Energy Statistical Yearbook 2024 (CESY)—National Bureau of Statistics of China [63]; (B) China City Statistical Yearbook (CCSY) [64]; (C) China Stock Market & Accounting Research Database (CSMAR Data) [65] across multiple years; and (D) Report on the State of the Ecology and Environment in China (Ministry of Ecology and Environment, multiple years [66]).
4.3.2. Core Explanatory Variable
The DPEPs, comprising the NEDC and ECPT policies, serve as the core explanatory variable in this study. A city is assigned a value of 1 in the year it becomes a dual-pilot city and for all subsequent years, while non-pilot cities are assigned a value of 0. This study covers 51 new energy demonstration cities and 41 pilot cities implementing the ECPT. The interaction of these two policies at the city level defines the DPEPs.
4.3.3. Core Variables
To accurately identify the causal relationship between the DPEPs and UEP and to minimize the bias in regression results caused by omitted variables and other influencing factors, this paper refers to the research of Zhang and Zheng [69] and Chai et al. [21]. The following control variables are introduced into the model:
- 3.
- Economic development level : Measured by the natural logarithm of a city’s per capita GDP. Regions with higher economic development levels typically benefit from higher-quality factor inputs and greater energy utilization efficiency. As economic levels improve, regions tend to prioritize environmental governance, thereby enhancing UEP. However, economic growth may also lead to increased energy consumption, which could reduce the resilience of UEP.
- 4.
- Population density : Measured by the natural logarithm of the population per unit of administrative area in a city. Higher population density facilitates the intensive use of energy, thereby improving energy efficiency. However, it may also cause a significant rise in energy demand, leading to higher energy consumption and environmental pollution, which can negatively affect UEP.
- 5.
- Openness to Foreign Investment : Measured by the natural logarithm of the actual utilized foreign direct investment in a city. A higher degree of openness can attract foreign investment, introduce advanced energy technologies, and promote the upgrading and innovation of energy utilization technologies, thus improving energy efficiency. Additionally, foreign firms often adhere to stricter environmental standards, which can encourage local firms to improve UEP. Conversely, foreign firms may transfer highly polluting and energy-intensive production processes to the local area, negatively impacting UEP.
- 6.
- Financial development level : Measured by the ratio of the sum of year-end deposits and loans of financial institutions to GDP. A high level of financial development provides sufficient financial support for energy efficiency improvements and environmental protection projects, facilitates the research and application of new energy technologies, and encourages the optimization of the energy structure.
- 7.
- State intervention level : Measured by the ratio of state public fiscal expenditure to GDP. Appropriate state intervention can help formulate and implement policies that support clean energy industries, guide production factors toward energy-efficient and environmentally friendly improve UEP. However, excessive state intervention may distort market mechanisms, hinder enterprise innovation, and reduce the vitality of the energy market, negatively affecting UEP.
- 8.
- Infrastructure level : Measured by the natural logarithm of per capita road area in a city. Sustainable productivity growth in infrastructure, particularly in transportation and energy sectors, can enhance the efficiency of energy transmission and usage, reducing energy loss. However, infrastructure construction itself consumes significant resources and energy, and poorly planned infrastructure projects may lead to energy waste, environmental damage, and reduced UEP.
5. Empirical Analysis: Impacts of Dual-Pilot Energy Policies on Urban Environmental Productivity (UEP) and Sustainability Outcomes
This section reports and interprets the empirical results. We first present the baseline estimates of DPEPs’ effects on UEP. Next, we conduct mechanism analyses to unpack the underlying pathways. Additional robustness checks—including sensitivity analyses, heterogeneity evaluations, and spatial spillover assessments—are then introduced. Together, these results provide strong evidence for the presence of policy complementarities and meaningful cross-city learning effects.
5.1. Baseline Estimation Results
Table 3 shows the benchmark regression results of the impact of the DPEPs on UEP. The regression specifications are as follows: columns (1) and (2) exclude control variables, and columns (3) and (4) include a set of control variables on the basis of columns (1) and (2), respectively. It can be seen that the estimated coefficients of are significantly positive at the level of 1%, indicating that the DPEPs can effectively improve the UEP, thereby validating Hypothesis 1. In terms of economic significance, the coefficient of in column (3) is 0.041, while in column (4) it is 0.045. This suggests that, compared to non-dual-pilot cities, the CUEP and NUEP of dual-pilot cities increased by an average of 4.10% and 4.50%, respectively. These findings highlight the substantial economic impact of the DPEPs on UEP.
Table 3.
Baseline regression results.
5.2. Parallel Trend Test
The validity of the DID model relies on the parallel trend assumption, which requires that the pre-policy trends in UEP for both the treatment group (dual-pilot areas) and the control group (non-dual-pilot areas) be consistent before the policy implementation. Following Beck et al. [70], this study employs the event study method to test the parallel trend hypothesis. The specific test model is formulated as follows:
where represents a set of dummy variables for the DPEPs. Specifically, if city adopts the DPEPs in year , then takes a value of ; otherwise, it is . The variable denotes the year relative to the implementation of the DPEPs; D_5 to D_1 represent the years from 5 years to 1 year before the policy implementation, represents the year of policy implementation, and to represent the years from 1 year to 5 years after policy implementation. The base period is set as the first year before policy implementation (D_1), so D_1 is excluded from the model. The coefficient measures the impact of the DPEPs on UEP at time . If for is statistically insignificant and not different from zero, this indicates that the parallel trends assumption is satisfied.
The parallel trend test results are presented in Figure 3. Before the implementation of the DPEPs, there is no significant difference in the change trend of CUEP and NUEP between the pilot and non-pilot areas. The estimated coefficients fluctuate around 0, confirming that the parallel trend assumption holds. After the implementation of the DPEPs, the CUEP and NUEP both increased significantly. CUEP increases significantly immediately after the policy is enacted. NUEP shows a significant increase from the second year onward, following a pattern of initial growth followed by a decline. These results indicate that the DPEPs have a time-lagged effect and exhibit long-term dynamic impacts on UEP.
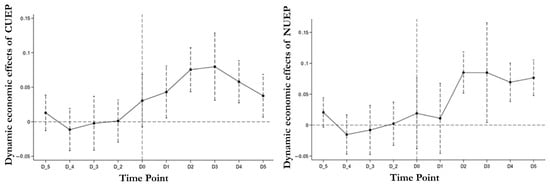
Figure 3.
Parallel trend test (source: authors’ calculation).
In addition to interaction terms, we further explored the independent and combined impacts of the two policies through categorical treatment variables. We created a three-category policy variable: (i) NEDC-only cities, (ii) ECPT-only cities, and (iii) dual-pilot cities that implemented both policies. We estimated a modified DID model where each group is compared against the control group (non-pilot cities). The results (presented in Table 4) show that while both NEDC-only and ECPT-only cities exhibit modest improvements in UEP, dual-pilot cities demonstrate significantly larger gains. This provides empirical support for policy synergy: the coexistence of administrative planning (NEDC) and market-based incentives (ECPT) leads to deeper and more sustained improvements in urban environmental productivity. These findings are robust across alternative specifications and underscore the added value of coordinated policy interventions in complex systems like urban sustainability.
Table 4.
Comparative UEP effects by policy type: NEDC-only, ECPT-only, and dual-pilot cities.
5.3. Robustness Tests
5.3.1. Placebo Tests
To ensure that the observed improvement in UEP in dual-pilot cities is primarily driven by the DPEPs—rather than other unobserved factors—a placebo test is conducted. The specific steps are as follows: Randomly select a subset of cities from the 279 sample cities as the pseudo-dual-pilot cities (the placebo treatment group) and randomly assign each pseudo-dual-pilot city a pseudo policy implementation year. Based on the pseudo treatment group and pseudo policy implementation year, construct a pseudo-DPEP dummy variable. The regression analysis is re-estimated using Equation (1) to obtain the estimated coefficient and p-value of the virtual treatment effect. To enhance the robustness of the placebo test, repeat the above steps 500 times to generate 500 sets of placebo estimation results.
Figure 4 shows the kernel density distribution and p-value distribution of the dummy estimated coefficients for CUEP and NUEP. The results reveal the following: The distribution of the virtual estimated coefficients approximates a normal distribution, with its center close to 0 (vertical line at ). The actual estimated coefficient of the model is located in the right tail of the distribution, far from the center, indicating a significant deviation from the placebo estimates. Additionally, the majority of p-values from the placebo estimates are greater than 0.1, whereas the p-values for the actual estimated coefficients are well below 0.1, confirming that the dummy variable for the pseudo-dual-pilot energy policy is not significant. These results indicate that the observed positive impact on UEP is driven by the implementation of the DPEPs rather than other unobserved factors. Thus, the placebo test confirms the robustness of the core conclusions.
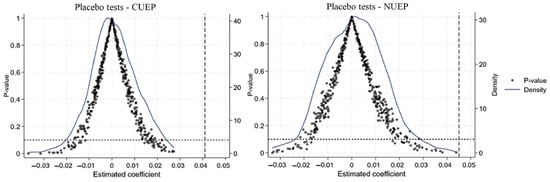
Figure 4.
Placebo test (source: authors’ calculation).
5.3.2. PSM-DID Identification Strategy
When selecting new energy demonstration cities and energy-consuming rights trading pilot cities, the state may consider factors such as regional resource endowment, economic development level, degree of marketization, and regional radiation capacity. This selection process means that the DPEPs are not a natural experiment in the strict sense, leading to the problem of sample selection bias. Referring to established methodologies, this paper adopts the PSM-DID method to evaluate the impact of the DPEPs on UEP. The specific implementation is as follows: UEP is used as the outcome variable, while urban economic development level, population density, level of openness, financial development level, state intervention level, and infrastructure level are used as matching variables. A logit model is employed to estimate the propensity scores of the treatment group, and the one-to-one nearest neighbor matching method is applied to identify the matching group. In this study, panel data is treated as cross-sectional data for mixed matching. The regression results are presented in columns (1) and (2) of Table 5.
Table 5.
Regression results.
Our empirical strategy relies on the Conditional Independence Assumption (CIA), which states that—conditional on observed pre-treatment covariates—treatment assignment (i.e., selection into DPEPs) is independent of potential outcomes. While this assumption cannot be directly tested, it is made plausible through the inclusion of rich matching covariates that proxy for cities’ baseline development conditions, including industrial structure, GDP per capita, population, foreign direct investment, energy intensity, and urbanization level. These covariates are chosen based on theoretical relevance and the prior literature on energy and environmental policy diffusion in China.
In addition, to ensure common support and mitigate bias due to dissimilar pre-treatment characteristics, we perform nearest-neighbor matching with caliper and replacement, followed by DID estimation on the matched sample. Balance diagnostics indicate that the matching substantially reduces standardized bias across covariates. We acknowledge that unobserved confounding cannot be entirely ruled out but believe our rich set of covariates and robustness tests (including placebo and trend tests) help ensure credible identification.
5.3.3. Control of Concurrent Policy Influences
During the sample period, other environmental regulation policies may have also influenced UEP, potentially biasing the baseline estimation results. By reviewing existing relevant policy documents, we identify that carbon emission trading policies and low-carbon city pilot policies may have impacted the urban energy environment during this period. To more accurately isolate the net effect of the DPEPs, this paper successively incorporates dummy variables for the carbon emission trading policy and the low-carbon city pilot policy into the baseline model for regression analysis, thereby excluding the effects of contemporaneous policy shocks. The regression results indicate that, after accounting for the impact of contemporaneous policies, the estimated coefficient of the core explanatory variable, , remains significantly positive. This finding demonstrates that the DPEPs have a significantly positive effect on UEP, thereby confirming the robustness of the research conclusions.
5.3.4. Additional Robustness Tests
To further verify the robustness of the findings, three additional tests are conducted: First, lagged explanatory variables: To address potential reverse causality between UEP and the selection of dual-pilot cities, as well as the time-lagged policy effect, all explanatory variables are lagged by one period before conducting regression analysis. Second, adjustment of the observation time interval: The earliest single-pilot policy—the NEDC—was implemented in 2014, while the earliest DPEP was introduced in 2017. Additionally, after the implementation of the ECPT, regions such as Hefei, Jinan, and Qingdao began exploring the energy rights trading system in 2020 and beyond. To ensure data consistency and minimize the influence of earlier unobserved values and later policy changes, samples from before 2010 and after 2019 are excluded. Third, controlling for province-year interaction effects: To eliminate potential bias caused by unobserved regional time-varying factors, the province-year interaction effect is controlled in addition to the benchmark regression model. The results of the robustness tests are presented in Table 6, and the coefficients of the core explanatory variables across all models remain consistent with the benchmark regression results.
Table 6.
Robustness test results.
5.4. Mechanism Analysis
The above empirical analysis confirms that DPEPs can effectively improve UEP, with results demonstrating robustness. The theoretical analysis suggests that the DPEPs influence UEP through three key channels: structural adjustment, innovation stimulation, and scale efficiency improvement. This section further explores the mechanisms. Following Li and Yue [71], the following model is employed to empirically verify the impact pathways of the DPEPs:
where is the mechanism variable, which includes the following: (1) Structural adjustment, represented by the proportion of the added value of the secondary and tertiary industries to a city’s GDP, as well as the proportion of employees in the secondary and tertiary industries to total city employment [72]. (2) Innovation stimulation: Evaluated through innovation inputs, measured by the natural logarithm of the number of R&D personnel and the internal R&D expenditures in each city [73]. (3) Scale efficiency improvement: Measured by the proportion of the number of mining employees in the urban secondary industry and the natural logarithm of per capita total energy consumption [74,75].
Structural adjustment. The regression results in columns (1) to (4) of Table 7 indicate that the DPEPs reduce the proportion of the urban secondary industry’s output value and employment while significantly increasing the proportion of the urban tertiary industry’s output value and employment. This finding suggests that the DPEPs facilitate the upgrading of the urban industrial restructuring, promoting a shift toward a tertiary industry dominated by low-carbon service industries. This effect may be attributed to the DPEPs’ dual regulation mechanism of “policy guidance + market constraint.” As discussed in the theoretical framework, the upgrading of industrial restructuring reflects a transformation of the urban economic development model toward resource-saving and environmentally sustainable practices. This transformation achieves energy conservation and emission reduction at the source, thereby improving UEP. Hypothesis 2 is thus verified.
Table 7.
Mechanism analysis results.
Innovation stimulation. The regression results in columns (5) and (6) of Table 7 show that the estimated coefficient of the DPEPs is significantly positive at the 1% level, indicating that the DPEPs promote urban R&D investment in both personnel and funding, thereby enhancing the level of urban innovation. The implementation of the DPEPs fosters the innovation and application of urban energy technologies through the agglomeration effect, incentive effect, and competition effect. This process achieves energy savings and carbon reductions across the entire energy supply and consumption chain, generates new economic growth drivers through energy technology innovation, and ultimately improves UEP.
Scale efficiency improvement. The regression results for the scale efficiency improvement are presented in columns (7) and (8) of Table 7. The coefficients of the DPEPs on traditional energy dependence and per capita total energy consumption are significantly negative, indicating that the DPEPs have effectively improved the structure and scale of energy consumption. It has also promoted the transformation and upgrading of energy consumption toward cleaner and greener energy types. The reduction in the use of traditional energy resources generates significant energy savings, further enhancing UEP. These findings confirm Hypothesis 4.
5.5. Heterogeneity Analysis
5.5.1. Industrialization Level Heterogeneity
Cities at different stages of industrialization exhibit significant variations in industrial restructuring paths. Based on the National Plan for Adjusting and Transforming Old Industrial Bases (2013–2022), the sample cities are categorized as old industrial base cities (assigned a value of 1) and non-old industrial base cities (assigned a value of 0) for comparative analysis. Regression results in columns (1) to (4) of Table 8 indicate that the DPEPs have an insignificant impact on old industrial base cities. In contrast, these policies notably amplify both comprehensive CUEP and NUEP in non-old industrial base cities. Old industrial base cities exhibit strong path dependence due to their entrenched heavy industry infrastructure and traditional industrial support systems. Additionally, constraints such as mismatched human capital, insufficient innovation resources, institutional resistance, and fiscal and employment pressures further hinder efficiency improvements. Conversely, non-old industrial base cities benefit from more flexible industrial restructures and lower transformation costs, allowing for DPEPs to exert a more substantial impact on UEP.
Table 8.
Industrial level heterogeneity analysis results.
5.5.2. Resource Dependent Heterogeneity
Industrial structure and energy intensity differences have been key determinants of UEP globally [76]. Therefore, resource endowment plays a crucial role in shaping a city’s responsiveness and capacity for transformation under energy policies, potentially influencing the effectiveness of the DPEPs. Following Wu et al. [77], this paper measures urban resource dependence using the proportion of urban mining industry employees in total employment. Regression results in columns (5) to (8) of Table 8 indicate that in cities with high resource dependence, the DPEPs significantly enhance both CUEP and NUEP. In contrast, in cities with low resource dependence, the policy effects are not statistically significant. This difference can be attributed to the following reasons: High resource-dependent cities have large-scale energy consumption and face greater pressure for energy transition. The DPEPs provide these cities with transformation opportunities and policy guidance. Additionally, their strong industrial foundation and accumulated technological expertise enable them to better leverage policy incentives, fostering innovation and industrial restructuring to achieve simultaneous improvements in CUEP and NUEP. Conversely, low resource-dependent cities have a smaller energy consumption base, limiting their potential for substantial energy conservation and emissions reduction. As a result, the policy’s impact in these cities remains relatively insignificant.
These findings suggest that resource-dependent cities—often characterized by higher baseline energy intensity and historically inefficient industrial structures—demonstrate greater potential for rapid transformation when faced with both regulatory constraints (ECPT) and infrastructural support (NEDC). This is consistent with path-dependency theory, which posits that institutions and policy legacies shape response trajectories: cities that were previously locked into fossil-fuel-based growth pathways are more likely to realize substantial improvements when external pressure (e.g., tradable quotas) is combined with enabling investments (e.g., renewable energy pilots). In effect, the policy synergy creates both a “push” (cost of non-compliance) and “pull” (incentive to modernize), particularly in areas previously left behind in China’s green transition. This interpretation aligns with recent findings on targeted transitions in structurally disadvantaged regions (e.g., Tan et al. [72]; Du et al. [50]). These empirical patterns invite further reflection through the lens of environmental transition theory.
5.5.3. State Environment Attention Heterogeneity
The commitment of local states to environmental governance can significantly influence both the intensity and effectiveness of policy implementation. Following Zhang and Zhang [78], this study applies textual analysis to the Report on the Work of the Government, measuring governmental environmental attention by calculating the ratio of environmental keywords to the total word count. Cities were then grouped based on the median value of this measure, followed by grouped regression analysis. As shown in Table 9, the DPEPs have a stronger impact on improving CUEP and NUEP in cities with higher governmental environmental attention. This can be attributed to several factors. Cities with strong environmental commitment tend to demonstrate greater governance intent and stronger policy implementation motivation. These local states recognize the role of environmental governance in sustainable urban development and are more inclined to allocate financial, material, and human resources to policy execution. Additionally, they are more likely to establish comprehensive support mechanisms to ensure effective enforcement, thereby fostering sustainable urban development. In contrast, cities with lower environmental attention often prioritize economic growth over environmental protection, leading to weak policy enforcement and insufficient regulatory oversight. These constraints limit the effectiveness of DPEPs in enhancing UEP in such cities.
Table 9.
State environment attention heterogeneity analysis results.
6. Further Analysis: Comparative Assessment of Policy Synergies and Spatial Spillover Effects
6.1. Comparative Analysis of the Synergistic Effect of DPEPs
This section further examines the policy synergy between DPEPs, specifically whether they have a greater impact on improving UEP and single-pilot policy.
Examination of the Net Policy Effects of NEDC and ECPT
Firstly, the impact of the single-pilot policy on UEP is analyzed separately. Specifically, to isolate the effect of the NEDC policy, the analysis excludes cities participating in the energy-consuming rights trading pilot, retaining only new energy demonstration cities and non-pilot cities. Conversely, to isolate the effect of the ECPT, the analysis excludes new energy demonstration cities, retaining only cities participating in the energy-consuming rights trading pilot and non-pilot cities. In this context, the coefficients DID_ne and DID_et capture the net effects of the NEDC and the ECPT, respectively, on UEP. As shown in the regression results from columns (1) to (4) of Table 10, the coefficients of DID_ne and DID_et are both significantly positive. This indicates that implementing either NEDCs or ECPT as a single-pilot policy markedly boosts both CUEP and NUEP in cities.
Table 10.
Results of comparative analysis of the synergistic effect of DUEPs.
Secondly, this paper examines whether the DPEPs have a stronger positive effect on UEP compared to the single-pilot policy. The methodology involves excluding cities that are neither new energy demonstration cities nor pilot cities for the energy-consuming rights trading system, retaining only cities that participate in either of these pilot programs. In this case, the estimated coefficient of captures the net effect of transitioning from a single-pilot city to a dual-pilot city on UEP. As shown in columns (5) to (10) of Table 10, the regression results indicate the following: The transition from a single-pilot city to a dual-pilot city does not have a significant effect on UEP in the current period, aligning with the findings of [16]. However, after a one-period lag, comprehensive CUEP becomes significant at the 10% confidence level. After a two-period lag, both CUEP and NUEP become significant at the 10% confidence level. These findings suggest that transitioning from a single-pilot city to a dual-pilot city promotes improvements in UEP. This suggests that the implementation of DPEPs is more effective in enhancing UEP compared to single pilot policies; however, the effect exhibits a certain degree of lag. The underlying reason may stem from the differences in mechanisms and implementation pathways between the NEDC and ECPT policies, despite both being energy policies. When a single-pilot city transitions to a dual-pilot city, relevant departments must systematically plan and effectively integrate the additional policy, cultivating new market mechanisms to foster synergy. Simultaneously, micro-level entities (such as enterprises) need time to adjust their production and operational strategies to align with the new policy framework. As a result, the transition from a single-pilot city to a dual-pilot city may exhibit a lagged effect in enhancing UEP.
6.2. Spatial Spillover Effects of the DPEPs
The establishment of new energy demonstration cities and energy-consuming rights trading pilot cities may generate regional spillover effects, particularly given the spatial diffusion characteristics of carbon dioxide [79]. Therefore, this paper incorporates spatial factors by employing a spatial econometric model to assess whether these DPEPs exhibit spatial spillover effects. Specifically, it examines whether a city’s designation as a dual-pilot city influences the UEP of surrounding cities.
6.2.1. Global Spatial Automation Test
Following Chai et al. [21], this paper utilizes an inverse geographic distance matrix, constructed using the longitude and latitude of cities, to investigate spatial correlations further. Specifically, the global Moran’s I index is used to determine whether UEP in China exhibits spatial dependence. Table 11 presents the results of the global Moran’s I test for UEP. The Moran’s I values for both CUEP and NUEP range between 0.015 and 0.084, and all are statistically significant at the 1% confidence level. This indicates that UEP in China exhibits significant spatial correlation. In other words, the DPEPs not only affect the UEP of the local region but also influence the UEP of neighboring cities.
Table 11.
Global Moran’s I index.
6.2.2. Spatial Econometric Model Testing and Results Analysis
This paper further tests the model selection. The results of the LM, LR, and Wald tests are presented in Table 12. The Lagrange Multiplier (LM) test results reject the null hypothesis of no spatial lag terms and no spatial error terms at the 1% significance level. Therefore, the Spatial Durbin Model (SDM) is deemed more appropriate than the Spatial Lag Model (SLM) or the Spatial Error Model (SEM). Furthermore, the robustness of the SDM is confirmed through the LR (Likelihood Ratio) and Wald tests, both of which are significant at the 1% level. These results suggest that the SDM cannot be reduced to the SLM or SEM. Consequently, this study adopts the two-way fixed effects Spatial Durbin Model (SDM), with the specific model specification shown below:
where represents a 279 × 279 inverse geographic distance spatial weight matrix, while β, φ, and θ denote the spatial autoregressive coefficients. , , and , represent the spatial lag terms. The meanings of the remaining variables are consistent with those in Equation (1).
Table 12.
Spatial spillover effects analysis results.
Table 12 also presents the spatial econometric regression results for SDM, SLM, and SEM. Under the inverse spatial distance matrix, the DPEPs have a significantly positive impact on UEP, which is consistent with the regression results discussed earlier. Furthermore, the spatial autoregressive coefficient ρ is significantly positive at the 1% level, indicating that improvements in the UEP of a given region can enhance the UEP of neighboring regions. However, the estimated coefficient for is not statistically significant, suggesting that the policy implementation itself does not directly produce spillover effects. A possible explanation for this is that the design and implementation of NEDCs and ECPT are based on the specific resource endowments and practical conditions of individual regions. As a result, there may be a lack of institutional measures for coordinated policy implementation across regions, causing energy policies to remain relatively independent. Nevertheless, the improvement in the UEP of regions implementing DPEPs can drive the UEP improvement of neighboring regions. This suggests that local states may focus more on the ultimate performance of UEP rather than the policy measures themselves. The regional improvement in UEP is primarily driven by an effect diffusion mechanism rather than policy diffusion.
6.2.3. Robustness Check Using Economic Distance Spatial Matrix
To further evaluate the robustness of spatial spillover effects, we replace the default inverse distance matrix with an economic distance matrix, constructed using dissimilarity in GDP per capita and energy intensity. This approach accounts for latent economic and energy linkages across cities, capturing a more functional dimension of urban connectivity than geographic distance alone. The results, presented in Table 13, remain consistent with our baseline findings. The coefficient on the spatial lag of UEP (W_UEP) remains positive and significant (0.227, p < 0.01), indicating that cities economically similar to high-UEP peers tend to exhibit improved productivity outcomes. Moreover, the estimated treatment effect of the dual policy intervention remains statistically robust. These findings affirm that our conclusions are not sensitive to spatial matrix construction and strengthen the external validity of the policy synergy impact.
Table 13.
Robustness check using economic distance spatial matrix.
6.3. Cross-National Policy Comparison
While the DPEPs are designed within China’s unique institutional context, many of their underlying principles echo developments in other regions. For instance, the EU Emissions Trading System (EU ETS) similarly uses market-based mechanisms to incentivize emission reductions, albeit with a multilateral governance structure and sector-specific allocations. Like China’s ECPT, the EU ETS has evolved to address over-allocation and carbon leakage, offering lessons for adaptive design and enforcement.
Likewise, the OECD’s “Cities for Climate” and “Green Growth in Cities” initiatives emphasize integrated urban approaches combining regulatory, fiscal, and technological tools—analogous to the NEDC’s city-level demonstration projects. However, OECD policies often prioritize decentralization and voluntary targets, in contrast to China’s top-down pilot structure.
Germany’s Energiewende, known for its long-term vision and public acceptance mechanisms, provides an example of how infrastructure investments and social contracts play a role in sustainable energy transitions—elements that are emerging in China’s NEDC framework but may require further development in participatory planning.
These comparisons suggest that while institutional details differ, the underlying logic of combining planning-based and market-based tools is gaining global traction. Our findings contribute to this discourse by offering empirical evidence on how coordinated dual-pilot mechanisms can generate synergistic improvements in energy–environmental outcomes.
The findings of this study also offer valuable insights for international policy frameworks seeking to enhance UEP through integrated governance approaches. For example, the European Union’s Emissions Trading System (EU ETS) demonstrates how market-based mechanisms, when complemented by national and local policies, can drive improvements in industrial transition to higher productivity sectors [80,81,82]. Similarly, OECD’s “Cities for Climate” initiative highlights the importance of synergistic policy designs that combine state-led interventions with market-driven incentives to promote UEP [15]. Lessons from China’s dual-pilot energy policies may therefore inform other countries and cities seeking to implement comparable models to advance their sustainable urban development and climate goals.
7. Conclusions
This study provides robust empirical evidence that synergistic energy policies—combining government-led initiatives with market-based mechanisms—significantly enhance UEP across Chinese cities. The findings show that dual-pilot policies drive improvements in UEP through industrial restructuring, technological innovation, and cleaner energy transitions, with positive spillover effects across neighboring regions.
These results contribute to the international literature on policy synergies, environmental economics, and sustainable development, offering valuable insights for both scholars and policymakers. The demonstrated success of China’s DPEPs aligns with international frameworks such as the EU Emissions Trading System (EU ETS) and OECD Cities for Climate initiatives and supports global efforts toward achieving SDG 7 (Affordable and Clean Energy), SDG 11 (Sustainable Cities and Communities), and SDG 12 (Responsible Consumption and Production).
More broadly, this study contributes to global policy learning on sustainable urban transitions. Although China’s DPEPs operate within a centralized governance model, the policy mix of administrative planning (NEDC) and market-based incentives (ECPT) mirrors international best practices, including the EU ETS and Germany’s Energiewende. By drawing parallels and highlighting differences, this study supports knowledge transfer across contexts while acknowledging the importance of local institutional tailoring. Such insights can inform emerging economies and regions seeking to build integrated energy and environmental governance systems.
7.1. Key Findings and Recommendations
Based on the implementation of DPEPs—namely, NEDCs and ECPT—this study employs a DID model to empirically analyze the impact and mechanisms of these policies on UEP in China. The key findings are as follows: (1) The DPEPs greatly improve UEP, reflected in improvements in both CUEP and NUEP. This conclusion remains robust after a series of robustness checks. (2) The DPEPs primarily improve UEP through three mechanisms: structural adjustment, innovation stimulation, and scale efficiency improvement. These mechanisms promote a more rationalized industrial restructuring, enhance technological innovation, and drive energy consumption toward cleaner and more efficient alternatives, thereby effectively improving UEP. (3) The policy effects of the DPEPs vary depending on differences in urban industrial restructuring, resource dependency, and the degree of environmental attention by local states. The effects are more pronounced in cities that are not old industrial bases, have a higher degree of resource dependency, or exhibit greater environmental concern. (4) Further analysis reveals that, compared to single-pilot policies, the DPEPs have a stronger positive impact on UEP, though with a certain degree of lag. Additionally, there are positive spillover effects of UEP across regions: improvements in local environmental productivity can trigger learning and imitation in adjacent regions, driving improvements in neighboring areas. However, these spillover effects are not directly caused by the policy implementation itself but are instead driven by performance spillovers, which contribute to the overall regional improvement in UEP.
Based on these empirical findings, we offer the following practical recommendations: First, policymakers should consider the coordinated design of supply-side and demand-side energy policies, as their combination (e.g., NEDCs and ECPT) yields significantly higher gains in environmental productivity than either policy alone. Second, tailoring policy interventions to city-specific characteristics—particularly targeting support to resource-dependent or industrially lagging cities—can unlock substantial latent efficiency improvements. Third, the expansion of energy trading markets should be accompanied by regulatory capacity-building at the municipal level to ensure equitable implementation. Lastly, international stakeholders can draw lessons from China’s DPEP framework to explore context-sensitive policy mixes that align clean energy innovation with market-based compliance mechanisms.
7.2. Policy Implications
The above findings and recommendations offer important policy implications for further progressing and improving the construction of NEDCs and ECPT, advancing UEP in the transition from energy dual control to carbon emissions dual control.
First, strengthen the synergy and coordination of the DPEPs to better leverage the complementary roles of an active state and an effective market. A mutually reinforcing and complementary policy framework should be established to integrate the construction of new energy demonstration cities with the energy-consuming rights trading system. Supporting measures should be improved to create a unified and cohesive policy force. The state should play a leading role in top-level design, regulatory oversight, and policy coordination. On this foundation, the decisive role of the market in resource allocation should be utilized to mobilize the active participation of enterprises and other micro-level entities in policy implementation. This approach would facilitate the efficient allocation of NEDCs and ECPT. By reinforcing the mutual benefits of demonstration city construction and ECPT, this coordination can jointly enhance UEP and achieve the goals of energy transition.
Second, optimize the diverse pathways of the DPEPs to systematically improve UEP. An integrated “Energy–Industry–Efficiency” evaluation system should be established to promote the transition of industries toward sustainable urban development. Special support plans for industrial restructuring should be designed based on regional characteristics to gradually guide the urban industrial transition to higher productivity sectors. A comprehensive support system for energy innovation across the entire value chain should be developed and improved. This includes increasing investments in research and development, as well as talent cultivation, to incentivize innovation in energy-saving technologies, energy management, and commercial transactions. Such efforts would accelerate the large-scale application of various innovations within urban energy systems. Simultaneously, differentiated dual-control targets for energy consumption should be implemented to optimize the energy consumption structure. Efforts should be directed toward establishing an integrated urban energy optimization mechanism, ensuring a virtuous cycle of scale efficiency improvements.
Third, energy policy implementation techniques should be maximized by striking a balance between localized measures and regional coordination, as Sachs et al. [83] argue that enhancing policy synergies is also vital to speed global progress toward several SDGs.
Policies should be tailored to the specific characteristics of cities, such as their industrial base, resource endowments, and environmental governance needs, to ensure targeted and effective implementation. For cities with heavy industrial structures, efforts should focus on supporting the transformation and upgrading of traditional industries. For cities with high resource dependency, policy combinations should prioritize diversifying the energy structure and promoting the substitution of clean energy. Additionally, a regional coordination mechanism based on “policy demonstration–learning–promotion” should be established to facilitate collaborative development. Efforts should be made to explore cross-regional energy resource sharing and coordinated governance mechanisms, such as regional clean energy networks and inter-regional energy rights trading markets. These strategies would enable a transition from isolated breakthroughs to holistic regional improvements, ultimately driving continuous enhancements in UEP. This, in turn, would provide strong support for optimizing the national energy structure and advancing sustainable urban development. These findings also contribute to the ongoing international efforts to measure and benchmark progress toward UEP and sustainable development goals, as emphasized by the OECD [15].
7.3. Research Limitations
Despite offering robust evidence on the impact of China’s DPEPs—namely, NEDCs and ECPT—on UEP, several limitations warrant acknowledgment. First, the analysis is conducted at the city level and does not account for micro-level dynamics, such as firm-specific behavioral responses or industrial reallocation patterns. Future research could investigate the effects of DPEPs at the enterprise or sectoral level to inform precision policy design better. Second, this study focuses on energy-specific interventions and does not fully explore potential synergies or trade-offs with other regulatory instruments, such as carbon trading schemes or environmental taxation. Exploring the interactions among various market-based mechanisms would enhance understanding of composite policy architectures.
Third, although the empirical strategy incorporates matching techniques and robustness checks, unobserved heterogeneity—such as differences in informal enforcement practices, political incentives, or administrative will—may still bias estimates. Fourth, the institutional specificity of China’s governance model, characterized by hierarchical coordination and target-based accountability, may limit the generalizability of our results to decentralized or democratic systems. Finally, regional disparities in industrial structure, fiscal capacity, and policy implementation across Chinese cities imply that the benefits of DPEPs are not evenly distributed. These contextual dependencies should be carefully considered when interpreting findings or applying them to other jurisdictions.
7.4. Future Research Directions
Future research could further explore cross-country comparisons, long-term dynamic impacts, sector-specific impacts, micro-level studies for deeper insights, and the role of digital technologies in advancing UEP and sustainable urban development.
First, future studies could conduct cross-country comparative analyses to examine how similar policy synergies between state-led and market-based instruments affect UEP in other institutional contexts, such as OECD or ASEAN countries. Second, further research could explore the long-term dynamic impacts of such dual-pilot policies using panel data that capture changes in UEP over extended periods. Third, it would be valuable to apply the proposed methodological framework to sector-specific analyses—such as the manufacturing, transport, or construction sectors—to assess sectoral heterogeneity in policy impacts. Fourth, micro-level studies incorporating firm-level or household-level behavioral data could offer deeper insights into how various stakeholders respond to synergistic energy policies and contribute to sustainable outcomes. Finally, additional research could investigate the potential for digital technologies and data-driven governance tools (e.g., AI-based energy management, blockchain for emissions tracking) to further enhance the effectiveness of integrated policy models for sustainable urban development.
Author Contributions
Conceptualization, S.Z. and X.Z.; methodology, S.Z.; software, S.Z.; validation, S.Z. and X.Z.; formal analysis, S.Z.; investigation, S.Z.; resources, S.Z.; data curation, S.Z.; writing—original draft preparation, S.Z.; writing—review and editing, S.Z. and X.Z.; visualization, S.Z.; supervision, X.Z.; project administration, X.Z.; funding acquisition, X.Z. All authors have read and agreed to the published version of the manuscript.
Funding
This research received no specific grant from any funding agency in the public, commercial, or not-for-profit sectors.
Institutional Review Board Statement
Not applicable.
Informed Consent Statement
Not applicable.
Data Availability Statement
The data used to support this study’s findings were collected from the following sources: 1. The list of NEDCs was obtained from the National Energy Administration official website of the Government of China [60]. Available online: https://www.nea.gov.cn/ (accessed on 15 October 2024). 2. The information on ECPT was obtained from the official website of the State Council of the People’s Republic of China—English [61]. Available online: https://english.www.gov.cn/ (accessed on 5 January 2025). 3. The carbon dioxide emission data of prefecture-level cities were sourced from the European Commission, Joint Research Center’s Emissions Database for Global Atmospheric Research (EDGAR) [62]. Available online: https://edgar.jrc.ec.europa.eu/ (accessed on 5 January 2025). 4. National Bureau of Statistics of China [China Statistical Yearbook 2024—English Edition] China Energy Statistical Yearbook 2024 (CESY) [63]. Available online: https://www.stats.gov.cn/sj/ndsj/2024/indexeh.htm (accessed on 5 January 2025). 5. China City Statistical Yearbook (CCSY) [64] China Overseas Yearbook: China City Statistical Yearbook 2024. Available online: https://data.oversea.cnki.net/en/trade/yearBook/single?zcode=Z009&id=N2025020156&pinyinCode=YZGCA (accessed on 5 January 2025). 6. China Stock Market & Accounting Research Database (CSMAR Data) [65]. Available online: https://data.csmar.com/ (accessed on 5 January 2025). 7. Ministry of Ecology and Environment of the People’s Republic of China (MEE). Report on the State of the Ecology and Environment in China [66]. Available online: https://english.mee.gov.cn/Resources/Reports/ (accessed on 5 January 2025).
Acknowledgments
We sincerely thank the anonymous reviewers for their constructive critiques and thoughtful suggestions, which significantly improved the quality of this manuscript. We are especially grateful for their encouraging feedback on this study’s methodological contributions and policy relevance. Their recognition of the research’s empirical breadth and analytical rigor as a meaningful addition to the discourse on climate governance and sustainable urban transformation is deeply appreciated. We hope this work stimulates further inquiry into synergistic policy frameworks in other national and regional contexts.
Conflicts of Interest
The authors declare that they have no conflicts of interest.
Abbreviations
The following abbreviations are used in this manuscript:
| * | significance at the level of 10% |
| ** | significance at the level of 5% |
| *** | significance at the level of 1% |
| C | carbon emissions/undesirable output |
| CCSY | China City Statistical Yearbook |
| CESY | China Energy Statistical Yearbook |
| CO2 | carbon dioxide emissions |
| control group | non-dual-pilot areas |
| CSMAR | China Stock Market & Accounting Research |
| CUEP | Comprehensive Urban Environmental Productivity |
| DDF | Directional Distance Function |
| DID | Difference-in-Differences |
| DPEP(s) | Dual-Pilot Energy Policy/Policies |
| E | energy/energy input/energy consumption input |
| ECPT | Energy Consumption Permit Trading policy |
| EDGAR | Emissions Database for Global Atmospheric Research |
| EU ETS | European Union’s Emissions Trading System |
| fin | ratio of the sum of year-end deposits and loans of financial institutions to GDP/financial development level |
| GDP | Gross Domestic Product |
| govern | ratio of state public fiscal expenditure to GDP/state intervention level |
| K | capital/capital input |
| L | labor/labor input |
| LM | Lagrange Multiplier |
| lnfdi | natural logarithm of actual utilized foreign direct investment in a city/openness to foreign investment |
| lnpgdp | natural logarithm of a city’s per capita GDP/economic development level |
| lnpop | natural logarithm of population per unit of administrative area in a city/population density |
| lntrans | natural logarithm of per capita road area in a city/infrastructure level |
| LR | Likelihood Ratio |
| NDDF | Non-radial Directional Distance Function |
| NEDC | New Energy Demonstration City policy |
| NUEP | Net Urban Environmental Productivity |
| OECD | Organization for Economic Co-operation and Development |
| PSM-DID | Propensity Score Matching Difference-in-Differences |
| SAR | Specific Absorption Rate |
| SDGs | Sustainable Development Goals |
| SDM | Spatial Durbin Model |
| SEM | Spatial Error Model |
| SLM | Spatial Lag Model |
| T | production possibility set |
| TFP | Total Factor Productivity |
| treatment group | dual-pilot areas |
| UEP | Urban Environmental Productivity |
| UNEP | United Nations Environment Programme |
| Y | economic income/desirable output/Gross Regional Product |
References
- Hong, C.; Burney, J.A.; Pongratz, J.; Nabel, J.E.; Mueller, N.D.; Jackson, R.B.; Davis, S.J. Global and regional drivers of land-use emissions in 1961–2017. Nature 2021, 589, 554–561. [Google Scholar] [CrossRef]
- IPCC. Climate Change 2022: Mitigation of Climate Change. Contribution of Working Group III to the Sixth Assessment Report of the Intergovernmental Panel on Climate Change; Cambridge University Press: Cambridge, UK; New York, NY, USA, 2022. [Google Scholar] [CrossRef]
- United Nations. The Sustainable Development Goals Report 2023. Special Edition: Towards a Rescue Plan for People and Planet; United Nations: New York, NY, USA, 2023; Available online: https://unstats.un.org/sdgs/report/2023/The-Sustainable-Development-Goals-Report-2023.pdf (accessed on 5 January 2025).
- OECD. Measuring Distance to the SDG Targets 2019: An Assessment of Where OECD Countries Stand; OECD Publishing: Paris, France, 2019. [Google Scholar] [CrossRef]
- Zhou, P.; Ang, B.W.; Poh, K.L. A survey of data envelopment analysis in energy and environmental studies. Eur. J. Oper. Res. 2008, 189, 1–22. [Google Scholar] [CrossRef]
- Kuosmanen, T.; Kortelainen, M. Measuring eco-efficiency of production with data envelopment analysis. J. Ind. Ecol. 2005, 9, 59–72. [Google Scholar] [CrossRef]
- Shaikh, Z.A.; Hajjej, F.; Uslu, Y.D.; Yüksel, S.; Dınçer, H.; Alroobaea, R.; Chinta, U. A new trend in cryptographic information security for Industry 5.0: A systematic review. IEEE Access 2024, 12, 7156–7169. [Google Scholar] [CrossRef]
- UNEP. Measuring Progress: Towards Achieving the Environmental Dimension of the SDGs; United Nations Environment Programme: Nairobi, Kenya, 2019; Available online: https://www.unep.org/resources/report/measuring-progress-towards-achieving-environmental-dimension-sdgs (accessed on 5 January 2025).
- Wang, W.; Wang, J.; Wu, H. The impact of energy-consuming rights trading on green total factor productivity in the context of digital economy: Evidence from listed firms in China. Energy Econ. 2024, 131, 107342. [Google Scholar] [CrossRef]
- Liu, Z.; Jian, X.; Sadiq, T.; Shaikh, Z.A.; Alfarraj, O.; Alblehai, F.; Tolba, A. Efficient control of spider-like medical robots with capsule neural networks and modified spring search algorithm. Sci. Rep. 2025, 15, 13828. [Google Scholar] [CrossRef] [PubMed]
- Lu, Q.; Fang, H.; Hou, J. The impact of energy supply side on the diffusion of low-carbon transformation on the energy demand side under low-carbon policies in China. Energy 2024, 307, 132817. [Google Scholar] [CrossRef]
- Dang, N.; Wang, Q.; Zhou, K.; Zhou, T. Coordinated transition of the supply and demand sides of China’s energy system. Renew. Sustain. Energy Rev. 2024, 203, 114744. [Google Scholar] [CrossRef]
- Moe, E. Energy, industry and politics: Energy, vested interests, and long-term economic growth and development. Energy 2010, 35, 1730–1740. [Google Scholar] [CrossRef]
- Lin, B.; Xu, C. Enhancing energy-environmental performance through industrial intelligence: Insights from Chinese prefectural-level cities. Appl. Energy 2024, 365, 123245. [Google Scholar] [CrossRef]
- OECD. Accelerating Climate Action: Refocusing Policies Through a Well-Being Lens; OECD Publishing: Paris, France, 2019; Available online: https://www.oecd.org/en/publications/2019/09/accelerating-climate-action_3c08b33f.html (accessed on 5 January 2025).
- Peng, B.; Gao, F. Crafting the perfect policy combination: Exploring the synergistic effects of dual-pilot energy policies on urban carbon emission efficiency. Urban Clim. 2025, 59, 102260. [Google Scholar] [CrossRef]
- Shaikh, Z.A.; Kraikin, A.; Mikhaylov, A.; Pinter, G. Forecasting stock prices of companies producing solar panels using machine learning methods. Complexity 2022, 2022, 9186265. [Google Scholar] [CrossRef]
- Rosenow, J.; Kern, F.; Rogge, K. The need for comprehensive and well-targeted instrument mixes to stimulate energy transitions: The case of energy efficiency policy. Energy Res. Soc. Sci. 2017, 33, 95–104. [Google Scholar] [CrossRef]
- Ahmad, H.; Shahab, S.; Mobarak, W.F.; Dutta, A.K.; Abolelmagd, Y.M.; Shaikh, Z.A.; Anjum, M. Convergence results for cyclic-orbital contraction in a more generalized setting with application. AIMS Math. 2024, 9, 15543–15558. [Google Scholar] [CrossRef]
- Yu, Y.; Su, Y.; Qi, C. Comparing potential cost savings of energy quota trading and carbon emissions trading for China’s industrial sectors. Resour. Conserv. Recycl. 2022, 186, 106544. [Google Scholar] [CrossRef]
- Chai, J.; Tian, L.; Jia, R. New energy demonstration city, spatial spillover and carbon emission efficiency: Evidence from China’s quasi-natural experiment. Energy Policy 2023, 173, 113389. [Google Scholar] [CrossRef]
- Akhund, T.M.N.U.; Shaikh, Z.A.; De La Torre Díez, I.; Gafar, M.; Ajabani, D.H.; Alfarraj, O.; López, L.A.D. IoST-enabled robotic arm control and abnormality prediction using minimal flex sensors and Gaussian mixture models. IEEE Access 2024, 12, 45265–45278. [Google Scholar] [CrossRef]
- Jafar, M.N.; Ullah, F.; Idris, S.A.; Mobarak, W.F.M.; Shaikh, Z.A.; Chavali, D.; Muniba, K. Evaluation of Tourist Destinations Carrying Capacity in a Decision-Making Context with Muirhead Means Aggregation Operator in q-Rung Orthopair Fuzzy Hypersoft Environment. IEEE Access 2024, 12, 162476–162498. [Google Scholar] [CrossRef]
- Coelli, T.J.; Lauwers, L.; Van Huylenbroeck, G. Environmental efficiency measurement and the materials balance condition. J. Prod. Anal. 2007, 28, 3–12. [Google Scholar] [CrossRef]
- Shaikh, Z.A.; Datsyuk, P.; Baitenova, L.M.; Belinskaja, L.; Ivolgina, N.; Rysmakhanova, G.; Senjyu, T. Effect of the COVID-19 pandemic on renewable energy firm’s profitability and capitalization. Sustainability 2022, 14, 6870. [Google Scholar] [CrossRef]
- Bohang, L.; Li, N.; Yang, J.; Alfarraj, O.; Albelhai, F.; Tolba, A.; Yee, P.L. Image steganalysis using active learning and hyperparameter optimization. Sci. Rep. 2025, 15, 7340. [Google Scholar] [CrossRef]
- Chung, Y.H.; Färe, R.; Grosskopf, S. Productivity and undesirable outputs: A directional distance function approach. J. Environ. Manag. 1997, 51, 229–240. [Google Scholar] [CrossRef]
- Liao, H.; Zhang, J.; Gong, R.; Zhang, W. The mitigating effect of digital inclusive finance development on urban environmental pollution: Insights from innovation capacity and financing constraints. Int. Rev. Financ. Anal. 2025, 97, 103815. [Google Scholar] [CrossRef]
- Zhang, N.; Kong, F.; Choi, Y.; Zhou, P. The effect of size-control policy on unified energy and carbon efficiency for Chinese fossil fuel power plants. Energy Policy 2014, 70, 193–200. [Google Scholar] [CrossRef]
- Färe, R.; Grosskopf, S.; Lovell, C.A.K.; Yaisawarng, S. Derivation of shadow prices for undesirable outputs: A distance function approach. Rev. Econ. Stat. 1993, 75, 374–380. [Google Scholar] [CrossRef]
- Sueyoshi, T.; Goto, M. DEA approach for unified efficiency measurement: Assessment of performance of Japanese fossil fuel power generation. Energy Econ. 2011, 33, 292–303. [Google Scholar] [CrossRef]
- Hong, Q.; Cui, L.; Hong, P. The impact of carbon emissions trading on energy efficiency: Evidence from quasi-experiment in China’s carbon emissions trading pilot. Energy Econ. 2022, 110, 106025. [Google Scholar] [CrossRef]
- Zhang, N.; Choi, Y. A comparative study of dynamic changes in CO2 emission performance of fossil fuel power plants in China and Korea. Energy Policy 2013, 62, 324–332. [Google Scholar] [CrossRef]
- Wang, K.; Su, X.; Wang, S. How does the energy-consuming rights trading policy affect China’s carbon emission intensity? Energy 2023, 276, 127579. [Google Scholar] [CrossRef]
- Xiao, Y.; Duan, Y.; Zhou, H.; Han, X. Has digital technology innovation improved urban total factor energy efficiency?—Evidence from 282 prefecture-level cities in China. J. Environ. Manag. 2025, 378, 124784. [Google Scholar] [CrossRef] [PubMed]
- Zhao, X.; Zeng, B.; Zhao, X.; Zeng, S.; Jiang, S. Impact of green finance on green energy efficiency: A pathway to sustainable development in China. J. Clean. Prod. 2024, 450, 141943. [Google Scholar] [CrossRef]
- Shi, Y.; Yang, B. How digital finance and green finance can synergize to improve urban energy use efficiency? New evidence from China. Energy Strategy Rev. 2024, 55, 101553. [Google Scholar] [CrossRef]
- Wang, H.; Deng, W.; Zhang, Z.; Li, M. Does government’s environmental attention improve urban energy efficiency? Int. Rev. Financ. Anal. 2024, 91, 103046. [Google Scholar] [CrossRef]
- Guo, Q.; Zeng, D.; Lee, C.C. Impact of smart city pilot on energy and environmental performance: China-based empirical evidence. Sustain. Cities Soc. 2023, 97, 104731. [Google Scholar] [CrossRef]
- Cui, H.; Cao, Y. How can market-oriented environmental regulation improve urban energy efficiency? Evidence from quasi-experiment in China’s SO2 trading emissions system. Energy 2023, 278, 127660. [Google Scholar] [CrossRef]
- Li, S.; Wang, Y.; Xu, X. Can low-carbon city pilot policy improve urban energy-environmental efficiency? Evidence from China. Energy Rep. 2025, 13, 2933–2945. [Google Scholar] [CrossRef]
- Zhou, A.; Wang, S.; Chen, B. Impact of new energy demonstration city policy on energy efficiency: Evidence from China. J. Clean. Prod. 2023, 422, 138560. [Google Scholar] [CrossRef]
- Hou, Y.; Yang, M.; Ma, Y.; Zhang, H. Study on city’s energy transition: Evidence from the establishment of the new energy demonstration cities in China. Energy 2024, 292, 130549. [Google Scholar] [CrossRef]
- Chen, H.; Niu, D.; Gao, Y. Research on the Impact of Energy Transition Policies on Green Total Factor Productivity of Chinese High-Energy-Consuming Enterprises. Energy 2025, 319, 135066. [Google Scholar] [CrossRef]
- Safarzadeh, S.; Hafezalkotob, A.; Jafari, H. Energy supply chain empowerment through tradable green and white certificates: A pathway to sustainable energy generation. Appl. Energy 2022, 323, 119601. [Google Scholar] [CrossRef]
- Khan, R.H.; Salamat, N.; Baig, A.Q.; Shaikh, Z.A.; Yousef, A. Graph-based analysis of DNA sequence comparison in closed cotton species: A generalized method to unveil genetic connections. PLoS ONE 2024, 19, e0306608. [Google Scholar] [CrossRef] [PubMed]
- Cui, H.; Cao, Y. Energy rights trading policy, spatial spillovers, and energy utilization performance: Evidence from Chinese cities. Energy Policy 2024, 192, 114234. [Google Scholar] [CrossRef]
- Bouckaert, S.; Pales, A.F.; McGlade, C.; Remme, U.; Wanner, B.; Varro, L.; D’Ambrosio, D.; Spencer, T. Net Zero by 2050: A Roadmap for the Global Energy Sector; International Energy Agency: Paris, France, 2021; Available online: https://iea.blob.core.windows.net/assets/063ae08a-7114-4b58-a34e-39db2112d0a2/NetZeroby2050-ARoadmapfortheGlobalEnergySector.pdf (accessed on 15 October 2024).
- Zhang, M.; Tang, Y.; Liu, L.; Zhou, D. Optimal investment portfolio strategies for power enterprises under multi-policy scenarios of renewable energy. Renew. Sustain. Energy Rev. 2022, 154, 111879. [Google Scholar] [CrossRef]
- Du, K.; Cheng, Y.; Yao, X. Environmental regulation, green technology innovation, and industrial structure upgrading: The road to the green transformation of Chinese cities. Energy Econ. 2021, 98, 105247. [Google Scholar] [CrossRef]
- Jiang, W.; Du, L.; Wei, H.; Sun, H. The influence of urban new energy development orientation on new energy technology innovation in firms. Renew. Energy 2024, 237, 121873. [Google Scholar] [CrossRef]
- Akhund, T.M.N.U.; Ajabani, D.; Shaikh, Z.A.; Elrashidi, A.; Nureldeen, W.A.; Bhatti, M.I.; Sarker, M.M. A comprehensive exploration of human communal media interaction and its evolving impact on psychological health across demographics and time. PeerJ Comput. Sci. 2024, 10, e2398. [Google Scholar] [CrossRef] [PubMed]
- Zhang, Z.; Luo, C.; Zhang, G.; Shu, Y.; Shao, S. New energy policy and green technology innovation of new energy enterprises: Evidence from China. Energy Econ. 2024, 136, 107743. [Google Scholar] [CrossRef]
- Mikhaylov, A.; Dinçer, H.; Yüksel, S.; Pinter, G.; Shaikh, Z.A. Bitcoin mempool growth and trading volumes: Integrated approach based on QROF multi-SWARA and aggregation operators. J. Innov. Knowl. 2023, 8, 100378. [Google Scholar] [CrossRef]
- Wang, H.J.; Zheng, M.Q.; Yin, H.T.; Chang, C.P. Green innovation, industrial structure and urban eco-efficiency in Chinese cities. Econ. Anal. Policy 2024, 82, 1011–1024. [Google Scholar] [CrossRef]
- Song, Y.; Pang, X.; Zhang, Z.; Sahut, J.M. Can the new energy demonstration city policy promote corporate green innovation capability? Energy Econ. 2024, 136, 107714. [Google Scholar] [CrossRef]
- Tu, Y.; Wu, W. How does green innovation improve enterprises’ competitive advantage? The role of organizational learning. Sustain. Prod. Consum. 2021, 26, 504–516. [Google Scholar] [CrossRef]
- Yang, J.; Qin, H.; Por, L.Y.; Shaikh, Z.A.; Alfarraj, O.; Tolba, A.; Thwin, M. Optimizing diabetic retinopathy detection with Inception-V4 and dynamic version of Snow Leopard Optimization Algorithm. Biomed. Signal Process. Control 2024, 96, 106501. [Google Scholar] [CrossRef]
- Zhang, S.; Andrews-Speed, P.; Li, S. To what extent will China’s ongoing electricity market reforms assist the integration of renewable energy? Energy Policy 2018, 114, 165–172. [Google Scholar] [CrossRef]
- National Energy Administration. National Energy Administration Official Website; National Energy Administration: Beijing, China, 2025. Available online: https://www.nea.gov.cn/ (accessed on 5 January 2025).
- The State Council of the People’s Republic of China. The State Council of the People’s Republic of China—English; The State Council: Beijing, China, 2025. Available online: https://english.www.gov.cn/ (accessed on 5 January 2025).
- European Commission, Joint Research Center. Emissions Database for Global Atmospheric Research (EDGAR); European Commission, JRC: Brussels, Belgium, 2025; Available online: https://edgar.jrc.ec.europa.eu/ (accessed on 5 January 2025).
- National Bureau of Statistics of China. China Statistical Yearbook 2024—English Edition; National Bureau of Statistics: Beijing, China, 2024. Available online: https://www.stats.gov.cn/sj/ndsj/2024/indexeh.htm (accessed on 5 January 2025).
- CNKI. China Overseas Yearbook: China City Statistical Yearbook 2024. CNKI Overseas Data: 2025. Available online: https://data.oversea.cnki.net/en/trade/yearBook/single?zcode=Z009&id=N2025020156&pinyinCode=YZGCA (accessed on 5 January 2025).
- CSMAR. China Stock Market & Accounting Research (CSMAR) Database; CSMAR Data Co., Ltd.: Shenzhen, China, 2025; Available online: https://data.csmar.com/ (accessed on 5 January 2025).
- Ministry of Ecology and Environment of the People’s Republic of China (MEE). Report on the State of the Ecology and Environment in China. Available online: https://english.mee.gov.cn/Resources/Reports/ (accessed on 5 January 2025).
- Zhang, J.; Sun, Z. Energy-environmental efficiency enhancement using green finance through spatio-temporal heterogeneity and dynamic regulatory mechanisms: Multiple perspectives study. Renew. Energy 2025, 240, 122212. [Google Scholar] [CrossRef]
- Zhang, J. Estimation of China’s provincial capital stock (1952–2004) with applications. J. Chin. Econ. Bus. Stud. 2008, 6, 177–196. [Google Scholar] [CrossRef]
- Zhang, J.; Zheng, T. Can dual pilot policy of innovative city and low carbon city promote green lifestyle transformation of residents? J. Clean. Prod. 2023, 405, 136711. [Google Scholar] [CrossRef]
- Beck, T.; Levine, R.; Levkov, A. Big bad banks? The winners and losers from bank deregulation in the United States. J. Financ. 2010, 65, 1637–1667. [Google Scholar] [CrossRef]
- Li, X.; Yue, S. Blessing or curse? The role of digital technology innovation in carbon emission efficiency. J. Environ. Manag. 2024, 365, 121579. [Google Scholar] [CrossRef]
- Tan, J.; Hu, X.; Hassink, R.; Ni, J. Industrial structure or agency: What affects regional economic resilience? Evidence from resource-based cities in China. Cities 2020, 106, 102906. [Google Scholar] [CrossRef]
- Gao, K.; Yuan, Y. Government intervention, spillover effect and urban innovation performance: Empirical evidence from national innovative city pilot policy in China. Technol. Soc. 2022, 70, 102035. [Google Scholar] [CrossRef]
- Namahoro, J.P.; Wu, Q.; Zhou, N.; Xue, S. Impact of energy intensity, renewable energy, and economic growth on CO2 emissions: Evidence from Africa across regions and income levels. Renew. Sustain. Energy Rev. 2021, 147, 111233. [Google Scholar] [CrossRef]
- Shaikh, Z.A.; Laghari, A.A.; Litvishko, O.; Litvishko, V.; Kalmykova, T.; Meynkhard, A. Liquid-phase deposition synthesis of ZIF-67-derived synthesis of Co3O4@TiO2 composite for efficient electrochemical water splitting. Metals 2021, 11, 420. [Google Scholar] [CrossRef]
- Worrell, E.; Price, L.; Martin, N.; Farla, J.; Schaeffer, R. Energy intensity in the iron and steel industry: A comparison of physical and economic indicators. Energy Policy 1997, 25, 727–744. [Google Scholar] [CrossRef]
- Wu, S.; Li, L.; Li, S. Natural resource abundance, natural resource-oriented industry dependence, and economic growth: Evidence from the provincial level in China. Resour. Conserv. Recycl. 2018, 139, 163–171. [Google Scholar] [CrossRef]
- Zhang, Y.; Zhang, J. Environmental governance and regional green development: Evidence from China. J. Clean. Prod. 2024, 447, 141643. [Google Scholar] [CrossRef]
- Li, L.; Zheng, Y.; Zheng, S.; Ke, H. The new smart city programme: Evaluating the effect of the internet of energy on air quality in China. Sci. Total Environ. 2020, 714, 136380. [Google Scholar] [CrossRef] [PubMed]
- Ellerman, A.D.; Buchner, B.K. Over-allocation or abatement? A preliminary analysis of the EU ETS based on the 2005–06 emissions data. Environ. Resour. Econ. 2008, 41, 267–287. [Google Scholar] [CrossRef]
- Chen, H.; Wei, N.; Wang, L.; Mubarak, W.; Albahar, M.A.; Shaikh, Z.A. The Role of Blockchain in Finance Beyond Cryptocurrency: Trust, Data Management, and Automation. IEEE Access 2024, 12, 64861–64885. [Google Scholar] [CrossRef]
- Calel, R.; Dechezleprêtre, A. Environmental policy and directed technological change: Evidence from the European carbon market. Rev. Econ. Stat. 2016, 98, 173–191. [Google Scholar] [CrossRef]
- Sachs, J.; Lafortune, G.; Kroll, C.; Fuller, G.; Woelm, F. Sustainable Development Report 2022. From Crisis to Sustainable Developments: The SDGs as Roadmap to 2030 and Beyond; Sustainable Development Solutions Network: Paris, France, 2022; Available online: https://s3.amazonaws.com/sustainabledevelopment.report/2022/2022-sustainable-development-report.pdf (accessed on 5 January 2025).
Disclaimer/Publisher’s Note: The statements, opinions and data contained in all publications are solely those of the individual author(s) and contributor(s) and not of MDPI and/or the editor(s). MDPI and/or the editor(s) disclaim responsibility for any injury to people or property resulting from any ideas, methods, instructions or products referred to in the content. |
© 2025 by the authors. Licensee MDPI, Basel, Switzerland. This article is an open access article distributed under the terms and conditions of the Creative Commons Attribution (CC BY) license (https://creativecommons.org/licenses/by/4.0/).