Abstract
This paper presents the Green Watershed Index (GWI) methodology, focusing on the 17 sustainability indicators selected in the Razey watershed, NW Iran. Field surveys and data collection have provided the possibility of field inspection and measurement of the present condition of the watershed and the indicators taken. Based on the degree of compliance with the required process, each indicator was scored from 0 to 10 and classified into three categories: unsustainable, semi-sustainable, and sustainable. Using the Entropy method to assign weight to each indicator and formulating a proportional mathematical relationship, the GWI score for each sub-watershed was derived. Spatial changes regarding the selected indicators and, consequently, the GWI were detected in the study area. Development of water infrastructure, particularly in the upstream sub-watersheds, plays a great role in increasing the GWI score. The highest weight is related to environmental productivity (0.26), and the five indicators of water footprint, knowledge management and information quality system, landscape attractiveness, waste recycling, and corruption control have approximately zero weight due to their monotonous spatial distribution throughout sub-watersheds. Only sub-watershed R1 has the highest score (5.13), indicating a semi-sustainable condition. The rest of the sub-watersheds have unsustainable conditions (score below 5). Concerning the GWI, the watershed is facing a critical situation, necessitating the implementation of management and conservation strategies that align with the sustainability level of each sub-watershed.
1. Introduction
Environmental degradation in Iran’s watersheds has escalated to a critical point, endangering public health and ecological stability [1,2,3]. Iran, located in the Middle East, with an approximate population of 92 million, is a fast-growing developing country https://www.worldometers.info/world-population/iran-population/ (accessed on 20 May 2024). Iran’s pressing environmental issues, including diminishing water resources, severe air pollution, and the overuse of natural resources, emphasize adapting short-term and long-term green strategies [4,5,6]. This article outlines critical factors for adopting green leadership in Iran, including engaging stakeholders, developing training initiatives, and aligning environmental policies. Additionally, Iran encounters significant challenges like financial limitations and an underdeveloped regulatory system. To overcome these hurdles, applying practical solutions aimed at promoting sustainable development and calling for more in-depth research to address Iran’s distinct environmental sustainability and green development conditions is essential [2,7,8].
Sustainable and healthy watersheds offer numerous ecosystem services that provide for both humans and the environment [9,10,11]. To achieve watershed sustainability, it should be ensured that a watershed can withstand natural disturbances, is self-sustainable, has no effects on the surrounding environment, and is useful for communities with ecological value. Advancing watershed management in the 1990s presented a holistic view in which the community and watershed sustainability are interdependent, and they are mutually beneficial [12,13,14]. The achievement of watershed sustainability necessitates the development of multidimensional indices to monitor and evaluate resource management [15,16]. In the previous studies on watershed sustainability measurements, numerous watershed sustainability indices (e.g., the Water Exploitation Index [17], European Green City Index [18], West Java Water Sustainability Index (WJWS) [19], Watershed Sustainability Index (WSI) [20], and Environmental Performance Index (EPI) [21]) were developed to estimate the watershed sustainability in terms of a specific aspect [10,22,23]. However, there is now a need to develop tools that enable the monitoring of watershed sustainability through different aspects of water, soil, and environmental resource management, emphasizing the green watershed development.
Green development and management in different ecosystems are closely linked to sustainable development [18,24,25,26]. Since the introduction of the green development concept, researchers have engaged in extensive discussions regarding its implications in diverse fields and have made noteworthy advancements in defining and applying related green initiatives [27,28]. Nonetheless, current researchers have focused less on developing a temporally and spatially dynamic and multidimensional index at the watershed scale. For instance, Hall and Kerr [29] introduced the idea of a “green index,” organizing it into three levels, with the first level containing two key categories—the green state and green policy, which together include 256 specific indicators. Cobb et al. [30] also developed the Genuine Progress Indicator (GPI), a sustainability-oriented measure that encompasses social, economic, and environmental components. Later, Lawn [31,32] argued that, in addition to the GPI and the Index of Sustainable Economic Welfare (ISEW), alternative indicators should be developed to encourage broader acceptance and application. Furthermore, Wang et al. [33] evaluated the green development levels of nine cities in China using a multi-level index system covering living environment, ecological efficiency, economic growth, pollutant treatment, and innovation potential. Results reveal significant differences among cities: Shenzhen, Zhuhai, and Guangzhou lead in green development, particularly in ecological efficiency and economic optimization. Their study recommends targeted policies to improve energy and industrial structures, public transport, and forestry carbon sinks to promote a low-carbon, circular development model in the PRD. Recently, the Green Watershed Index (GWI) was developed by Caro and Bladé [26] to analyze natural resource management in rural areas. Applied in various rural regions of Colombia, the method revealed both challenges in implementation and opportunities to enhance water resource management at the watershed level. Their findings revealed that the GWI can act as a crucial foundation for future in-depth studies, offering a new perspective on green watershed assessment. Their methodology is adaptable to other key ecological areas. Therefore, it is inferred from the literature that research aimed at green assessment is essential, and whether a watershed is green, which indicators ought to be utilized, and how to define the level of greenness in a watershed are intricate topics that merit further investigation. There is room for improvement.
Quantitative assessment of watershed status in terms of green representative indicators provides valuable knowledge for conserving and enhancing ecosystem services, especially for Iranian watersheds where immediate managerial solutions are needed. As mentioned earlier, today, climate change, pollution control, overexploitation of natural resources, loss of biodiversity, and water resources scarcity are important public concerns worldwide. In addition, various related crises, destructions, and hazards that affect human health or the environment, along with the persistence of poverty, have reinforced concerns about technological evolution and economic development, while concurrently questioning the ability of public policies to address such problems in a timely manner, especially in developing countries [34]. Therefore, determining indicators for exploring the impact of environmental, economic, and social factors on the green watershed status is essential in management frameworks. Various standards have been proposed for choosing suitable indicators to assess watershed sustainability and associated issues, such as sensitivity to environmental changes, being accessible and cost-effective in nature, and having the capacity to offer predictive insights into watershed functioning [22,23,35,36]. Specifically, in line with literature reviews [27,28,31,32], a selection of diagnostic indicators on the substantive and formal criteria should be completed. The substantive criterion means prioritizing indicators that accurately represent and explain the green status of the study regional condition. Furthermore, in terms of the formal criterion, it is important to ensure that the indicators are quantitative, complete, and continuous, while eliminating variables that could compromise the comparability of the analyzed objects.
Razey watershed, located in Ardabil Province (northwest Iran), is among the few watersheds in the region where measures for soil and water conservation, both structural and biological, have been implemented [37]. Previous studies have primarily examined the impacts of land use changes—such as deforestation and expansion of residential areas—on soil erosion and flood hazards within the watershed [3,37]. However, there is a significant lack of studies focused on the conceptualization and assessment of the green status of the watershed aimed at evaluating the sustainability of various ecosystems in Ardabil Province. This study was, therefore, designed to (1) apply the GWI to offer actionable insights for policymakers in developing a balanced and comprehensive green development roadmap in the Razey watershed, especially in light of significant land use change, soil degradation, and sedimentation; (2) determine the relative weight of key indicators influencing the watershed’s green status; and (3) conduct spatial zoning of both individual indicators and the overall GWI at the sub-watershed level. The present research supports the broader goals of previous watershed management efforts in the Razey watershed, while introducing an advanced framework to assist decision-makers in optimizing the management of the province’s natural and anthropogenic resources.
This research serves as an initial step toward more comprehensive investigations, providing a new lens for policymaking in watershed management and introducing an innovative approach to sustainability assessment. Notably, evaluating sustainability at the watershed scale—especially through green development indicators—has become an increasingly important global concern. Therefore, it is essential for watershed managers to implement a context-specific, structured framework that effectively captures the dynamic relationship between anthropogenic pressures and ecological integrity. Accordingly, this study can be viewed as a complementary advancement of Caro and Bladé’s work [26], offering new insights derived from a case with distinct climatic, ecological, economic, social, and policy-related features. Based on an extensive review of the existing literature, this study is among the first to tailor and apply the GWI framework to such conditions. The results enhance our understanding of watershed sustainability and establish a foundation for future initiatives aimed at reducing watershed degradation and encouraging equitable development. Although the GWI framework developed by Caro and Bladé [26] presents a valuable tool for sustainability assessment, several challenges remain in terms of its customization, modeling, and quantification. In particular, the selection of appropriate evaluation indicators that account for varying local and regional climatic and ecological conditions requires further exploration and discussion. In this context, the current research marks the first attempt to adapt the GWI framework to a case study in Iran, thereby extending its applicability and relevance.
2. Materials and Methods
2.1. Description of the Study Area
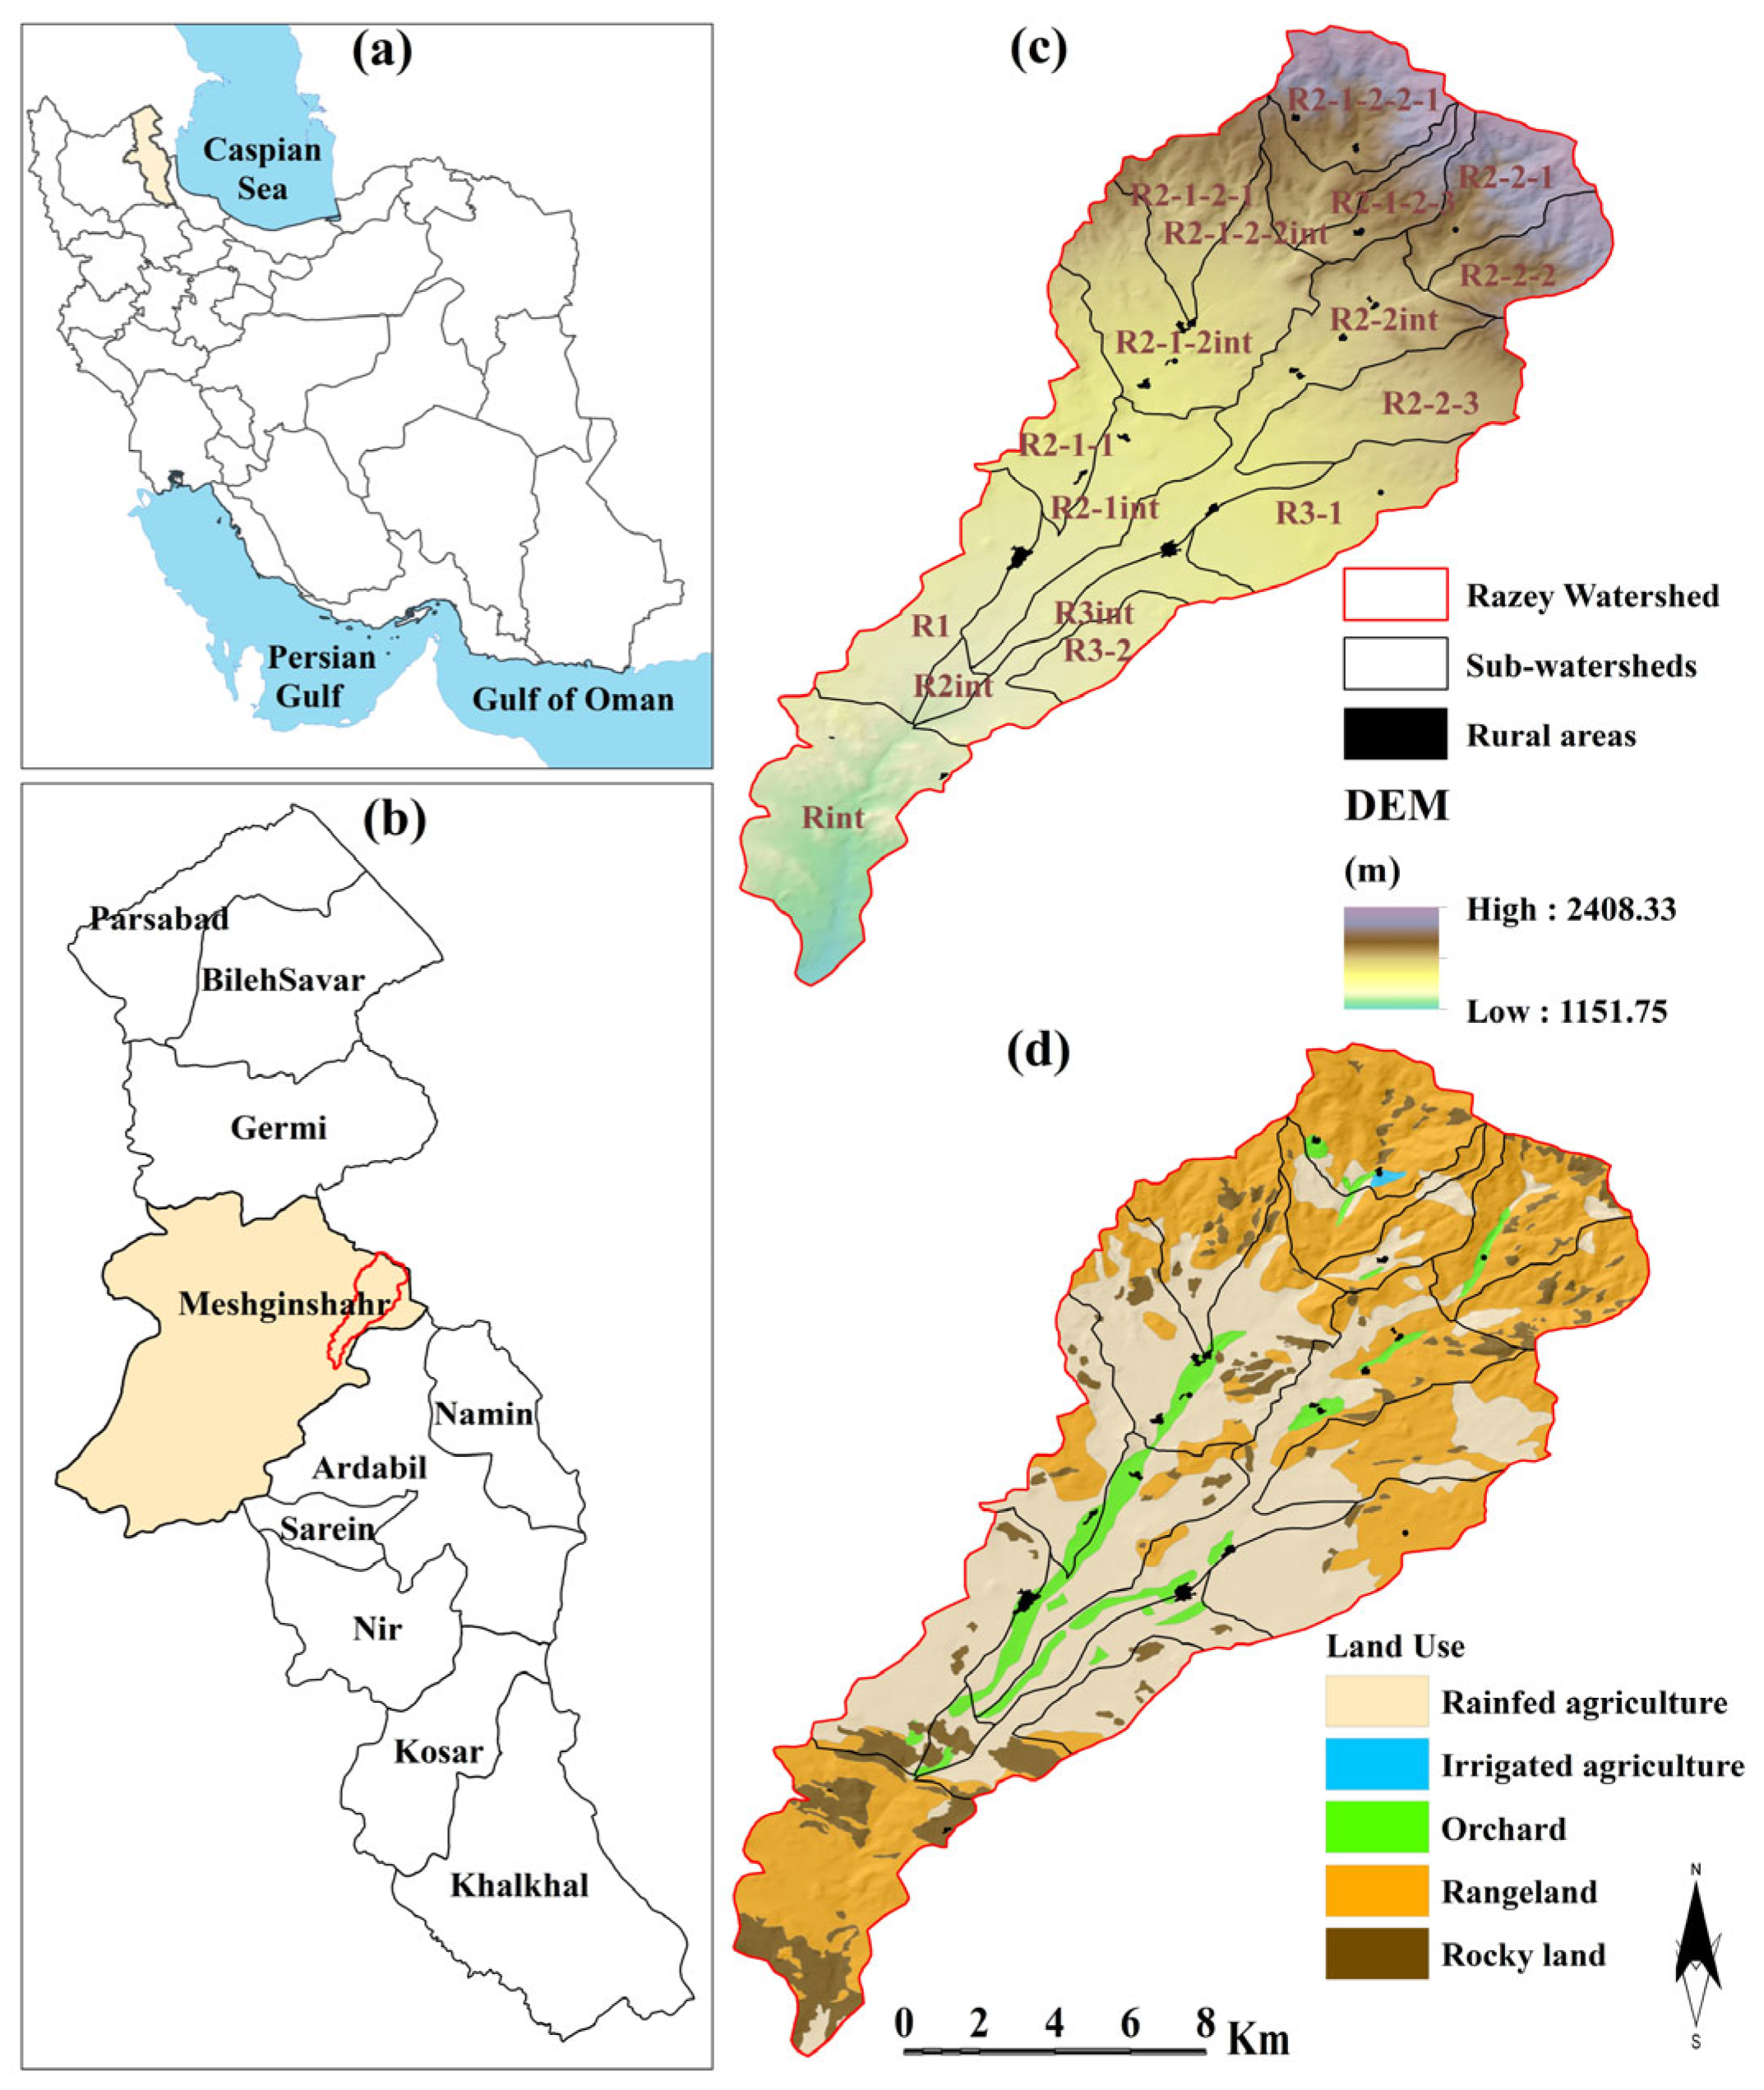
The Razey watershed (18,194 ha) is located in Meshginshahr, Ardabil (NW Iran; Figure 1a,b). In terms of topography, the minimum and maximum elevations are 1151.75 and 2408.33 m amsl, respectively, and its average slope is 13.3%. The mean annual rainfall is 315.6 mm. In terms of the mean temperature, there is a minimum of 3.3 °C and a maximum of 13.9 °C. According to the Emberger climatic classification, the region is placed in the highlands, and based on the Ambrothermic curve method, a wide area is classified as a semi-arid ultra-cold region. This watershed is divided into 17 sub-watersheds (Figure 1c; Table 1).

Figure 1.
Location of Razey watershed in Ardabil Province (a), Meshginshahr county (b), digital elevation model map with sub-watersheds boundary (c), and land use map (d).

Table 1.
Sub-watershed characteristics in the study area.
This watershed has relatively diverse land uses such as rangeland, rainfed agriculture, rocky land, orchard, residential areas, and irrigated agriculture (Figure 1d). The main activity of the local residents is agriculture and animal husbandry. Agricultural lands of the domain include rainfed, irrigated, and orchard lands. In agriculture, wheat cultivation, and orchards, walnuts have the highest net income in the area.
2.2. Setting the Sustainability Indicators
To monitor ecosystem sustainability, there are many indicators within the Sustainable Development Goals (SDGs) in urban and rural areas. These indicators are designed to monitor the natural resources supplied by land, air, water, and biodiversity [38]. To select the most suitable indicators for monitoring and evaluation of natural resources, their inputs, processes, outputs, outcomes, impacts, and exogenous factors should have been identified [39]. Here, the research design was grounded in the methodology originally developed by Caro and Bladé [26]. Following this approach, the Green Watershed Index (GWI) framework was implemented to evaluate the environmental conditions of the Razey watershed. While most input indicators were chosen in alignment with this framework, certain ones—such as the water retention index (WRI), Simpson’s biodiversity index (BD), environmental productivity (EP), and recycling (R) indicators—were selected differently due to data limitations and specific regional constraints. This study made use of the most comprehensive and accessible datasets and maps available. Notably, the selected indicators are widely recognized and valued by experts in hydrology, geomorphology, sociology, and economics for their capacity to analyze diverse and complex watershed dynamics, ranging from physical and hydrological to social, economic, and ecological aspects and supporting informed improvements. To support this analysis, a GIS database was developed, incorporating the necessary data layers for each sub-watershed, as defined by the General Office of Natural Resources and Watershed Management in Ardabil Province.
Accordingly, in this research, we selected 17 sustainability indicators to generate the GWI in the study area. The first eight indicators were widely used in assessing different aspects of hydrologic sustainability [14,37,40,41,42,43]. These indicators highlighted the specific importance and role of hydrology dynamics on the different aspects of watershed sustainability.
For infrastructure maintenance (IM) calculation, the gray and blue infrastructure play an influential role in the development of the Razey watershed. Rivers, water wells, and springs were examined as blue infrastructures, and fuel supply (gasoline, kerosene, and gas), access to drinking water, health, schools, and public transportation roads were examined as grey infrastructure.
Three influential sub-indicators, including water production, water quality, and sewage system coverage, were considered in calculating effectiveness in public water management (EPWM). According to Dalavi et al. [44], the Coutagine model [45] demonstrated the highest accuracy among the four empirical models examined for runoff estimation. This model was applied to estimate water production volume, which is a basic input for the calculation of the EPWM, water vulnerability (WV), water stress (WS), and water self-sufficiency (WSS) indicators. Coutagine [45] analyzed multiple catchments across various countries and developed a formula that links temperature, precipitation, and runoff.
Using the results obtained from the chemical analysis of four wells drilled in the groundwater aquifer and four wells drilled in rock units, the water quality of the Razey watershed was evaluated. The four variables used in this regard included pH, electrical conductivity (EC), total dissolved solids (TDS), and the sodium absorption ratio (SAR). TDS is very effective in creating the taste of drinking water. So, in the range of less than 500 mg/L, it is very good, between 500 and 1000 is desirable, between 1000 and 1500 is permissible for drinking, and above 1500 is not permissible. EC is the ability to pass electric current in water, and a TDS value less than 1000 mg/L is suitable for drinking. According to WHO standards, the standard pH value for groundwater varies between 6.5 and 8.5. An SAR value up to 6 is very good, from 6 to 10 is acceptable, and more than 10 is suitable for agriculture.
Water vulnerability (WV) for each sub-watershed was evaluated based on the ratio of water production volume to its population. The water retention index (WRI), which is also considered one of the ecosystem services, was calculated using InVEST 3.16.1 software and land use data [46].
Water stress (WS) and water self-sufficiency (WSS) indicators were also calculated based on the water production volume of each sub-watershed and population and by considering an annual per capita consumption of 1500 m3. In addition, the water footprint (WF) is a multidimensional indicator that expresses the direct and indirect consumption and production of water and the induced pollution [42].
To calculate the water saving and efficient use programs (WSE), the implemented cultural promotion activities were taken into account. For example, in Razey City—located within the sub-watersheds R1 and R2-1—these efforts involve not only advertising but also educational messages displayed on city walls and the organization of workshops by the Meshginshahr County water departments. Additionally, incentive and enforcement strategies are applied, such as modifying water consumption and controlling water pressure using specialized equipment. In comparison, surrounding villages mainly utilize wall writings to foster a culture of water conservation and encourage responsible water use.
Malvandi et al. [47] and Alaei et al. [36] used Simpson’s biodiversity index (BD) to study the habitat fragmentation and quality, which are a prerequisite to assessing the environmental sustainability. Indeed, this index quantifies the landscape composition. The plant vegetation and green spaces are a critical component that sustains the watershed performance in the long term [28,33]. Three activities of afforestation, pit seeding, and seeding, which were conducted sparsely in the Razey watershed, were investigated with the environmental productivity (EP) indicator. In addition, waste recycling (R) is one of the important green indicators considering sustainability, especially in urban ecosystems [48], which was also investigated in our study.
Three indicators, landscape attractiveness (LA), human capital (HC), and population participation (PP), were calculated based on the demographic information in terms of social sustainability. To examine the desire and sense of belonging of people to their place of residence (i.e., LA), population changes were compared over 10 years based on the available data (2006 to 2016). Then, the HC was evaluated by considering the formal and informal staff in the related organizations to sustainability issues in the Razey watershed. Finally, the PP was assessed based on the participation level of the local communities in gatherings and educational workshops, which are mostly held in local mosques. In terms of the adaptation to climate change (ACC) indicator, the design and implementation of stone-mortar and gabion (stone nets) structures and canalization in residential areas, as well as the improvement of old wells and aquifers, were examined as factors affecting the water supply and consumption system, as well as protection against floods [16,49,50].
The last two indicators of the knowledge management and information quality system (KM) and corruption control (CC) are among the significant indicators for assessing the green sustainability of organizations. Based on field visits to various departments in the Razey watershed, it can be stated that there is a spatial difference in the application of the integrated virtual system in the departments of natural resources and the environment for responding to letters and inquiries from departments, the public, and reviewing natural resources and watershed management plans for transfer to the private sector online (which has reduced the need for in-person visits and administrative bureaucracy). Finally, to improve environmental sustainability performance, it is crucial to engage citizens effectively and create transparent governments that help combat corruption in environmental and natural resource issues [51]. In this regard, the online finding of the Transparency International organization (https://www.transparency.org.uk/) was considered. It is a global organization that works in more than 100 countries to end the injustice of corruption. The association was founded in 1993 by former World Bank employees. According to the statistics provided, the global score of the Corruption Perceptions Index has remained stable over the past decade (statistics up to 2022) and is equal to 43. Over two-thirds of the world’s countries have a rank below 50, and 26 countries have been assigned the minimum score.
The above-mentioned indicators, along with their abbreviations, is presented in Table 2. Each indicator receives a score ranging from 0 (worst) to 10 (best), based on the degree of conformity of the required process. Then, by weighting each of the indicators and formulating a proportional mathematical relationship, the score of the GWI of each sub-watershed was obtained. A sub-watershed that belongs to a developed region is expected to maintain its management indicators within a very sustainable framework, and a sub-watershed that belongs to a developing region is expected to have lower levels of sustainability. Therefore, following a thorough assessment of each indicator and the sub-indicators involved in their evaluation and implementation, 17 indicators were selected that are suitable for describing a watershed [26].
Table 2.
Monitoring indicators for Green Watershed Index (GWI) (adapted from [26] with some modifications).
All indicators were calculated based on defined methods and existing standards. Some of the information needed to calculate the indicators was obtained from government organizations and institutions. For example, information related to population statistics was collected through the statistics provided by the Statistical Center of Iran. Furthermore, field visits and data collection have provided the possibility of field surveys and measurements of the current state of the study area and the set of measures taken, including biological and hydraulic activities. The justification of the eligibility of each indicator was completed according to the extent of its compliance with the purpose of the GWI.
2.3. Scoring of the Sustainability Indicators
Considering the scores presented in Table 3, the indicators are classified into three categories: unsustainable, semi-sustainable, and sustainable (Table 3).
Table 3.
The general evaluation criteria of the selected indicators (adapted from [26]).
To describe the performance of the indicators, six levels of conformity were established for each indicator (Table 4). In this context, a score in the range of 0 to 10 was assigned, based on the effectiveness and utilization of resources for delivering the service. Furthermore, this scale from 0 to 10 was preferred as a basis for ranking, where a green representative criterion of 0 specifies the worst possible green state and 10 represents the best possible green state. Each score highlights the importance of strategic planning and implementing processes to fulfill the fundamental requirements of the watershed in optimal conditions.
Table 4.
Specific evaluation of green management criteria (adapted from [26] with some modifications).
2.4. Weighting the Sustainability Indicators
The indicators that are the most important in natural ecosystems and for ensuring sustainability have the most impact on green watershed management. The Entropy method was applied to define this importance and evaluate the weight of each indicator. The Entropy is expressed by the specific probability distribution of Pi with Equation (1):
To calculate the importance coefficient, the following four steps were taken:
(a) The available information was normalized. In this way, the values of each indicator were divided by the sum of the values of that indicator throughout all sub-watersheds.
(b) Equation (1) was used to calculate Ei.
(c) The degree of dispersion was obtained from Equation (2):
Dj = 1 − Ej
(d) By dividing the values of Dj by their sum, the weight of the indicators was obtained.
2.5. Calculation of Green Watershed Index (GWI)
The GWI was calculated from the weighted combination of 17 indicators as explained in Equation (3) [26].
Here, each indicator was scored with a value between 0 and 10, and a distinct weight coefficient P was placed for each of the indicators based on the study area. The abbreviated form of the previous relation for better explanation and understanding is presented in Equation (4):
In this equation, the GWI represents the Green Watershed Index, n denotes the total count of management indicators, Fi indicates the numerical outcome of management indicator i, and P signifies the weighting coefficient assigned to each indicator based on the study area. It should be noted that the full title of each of the indicators, along with their abbreviations, is presented in Table 2.
3. Results
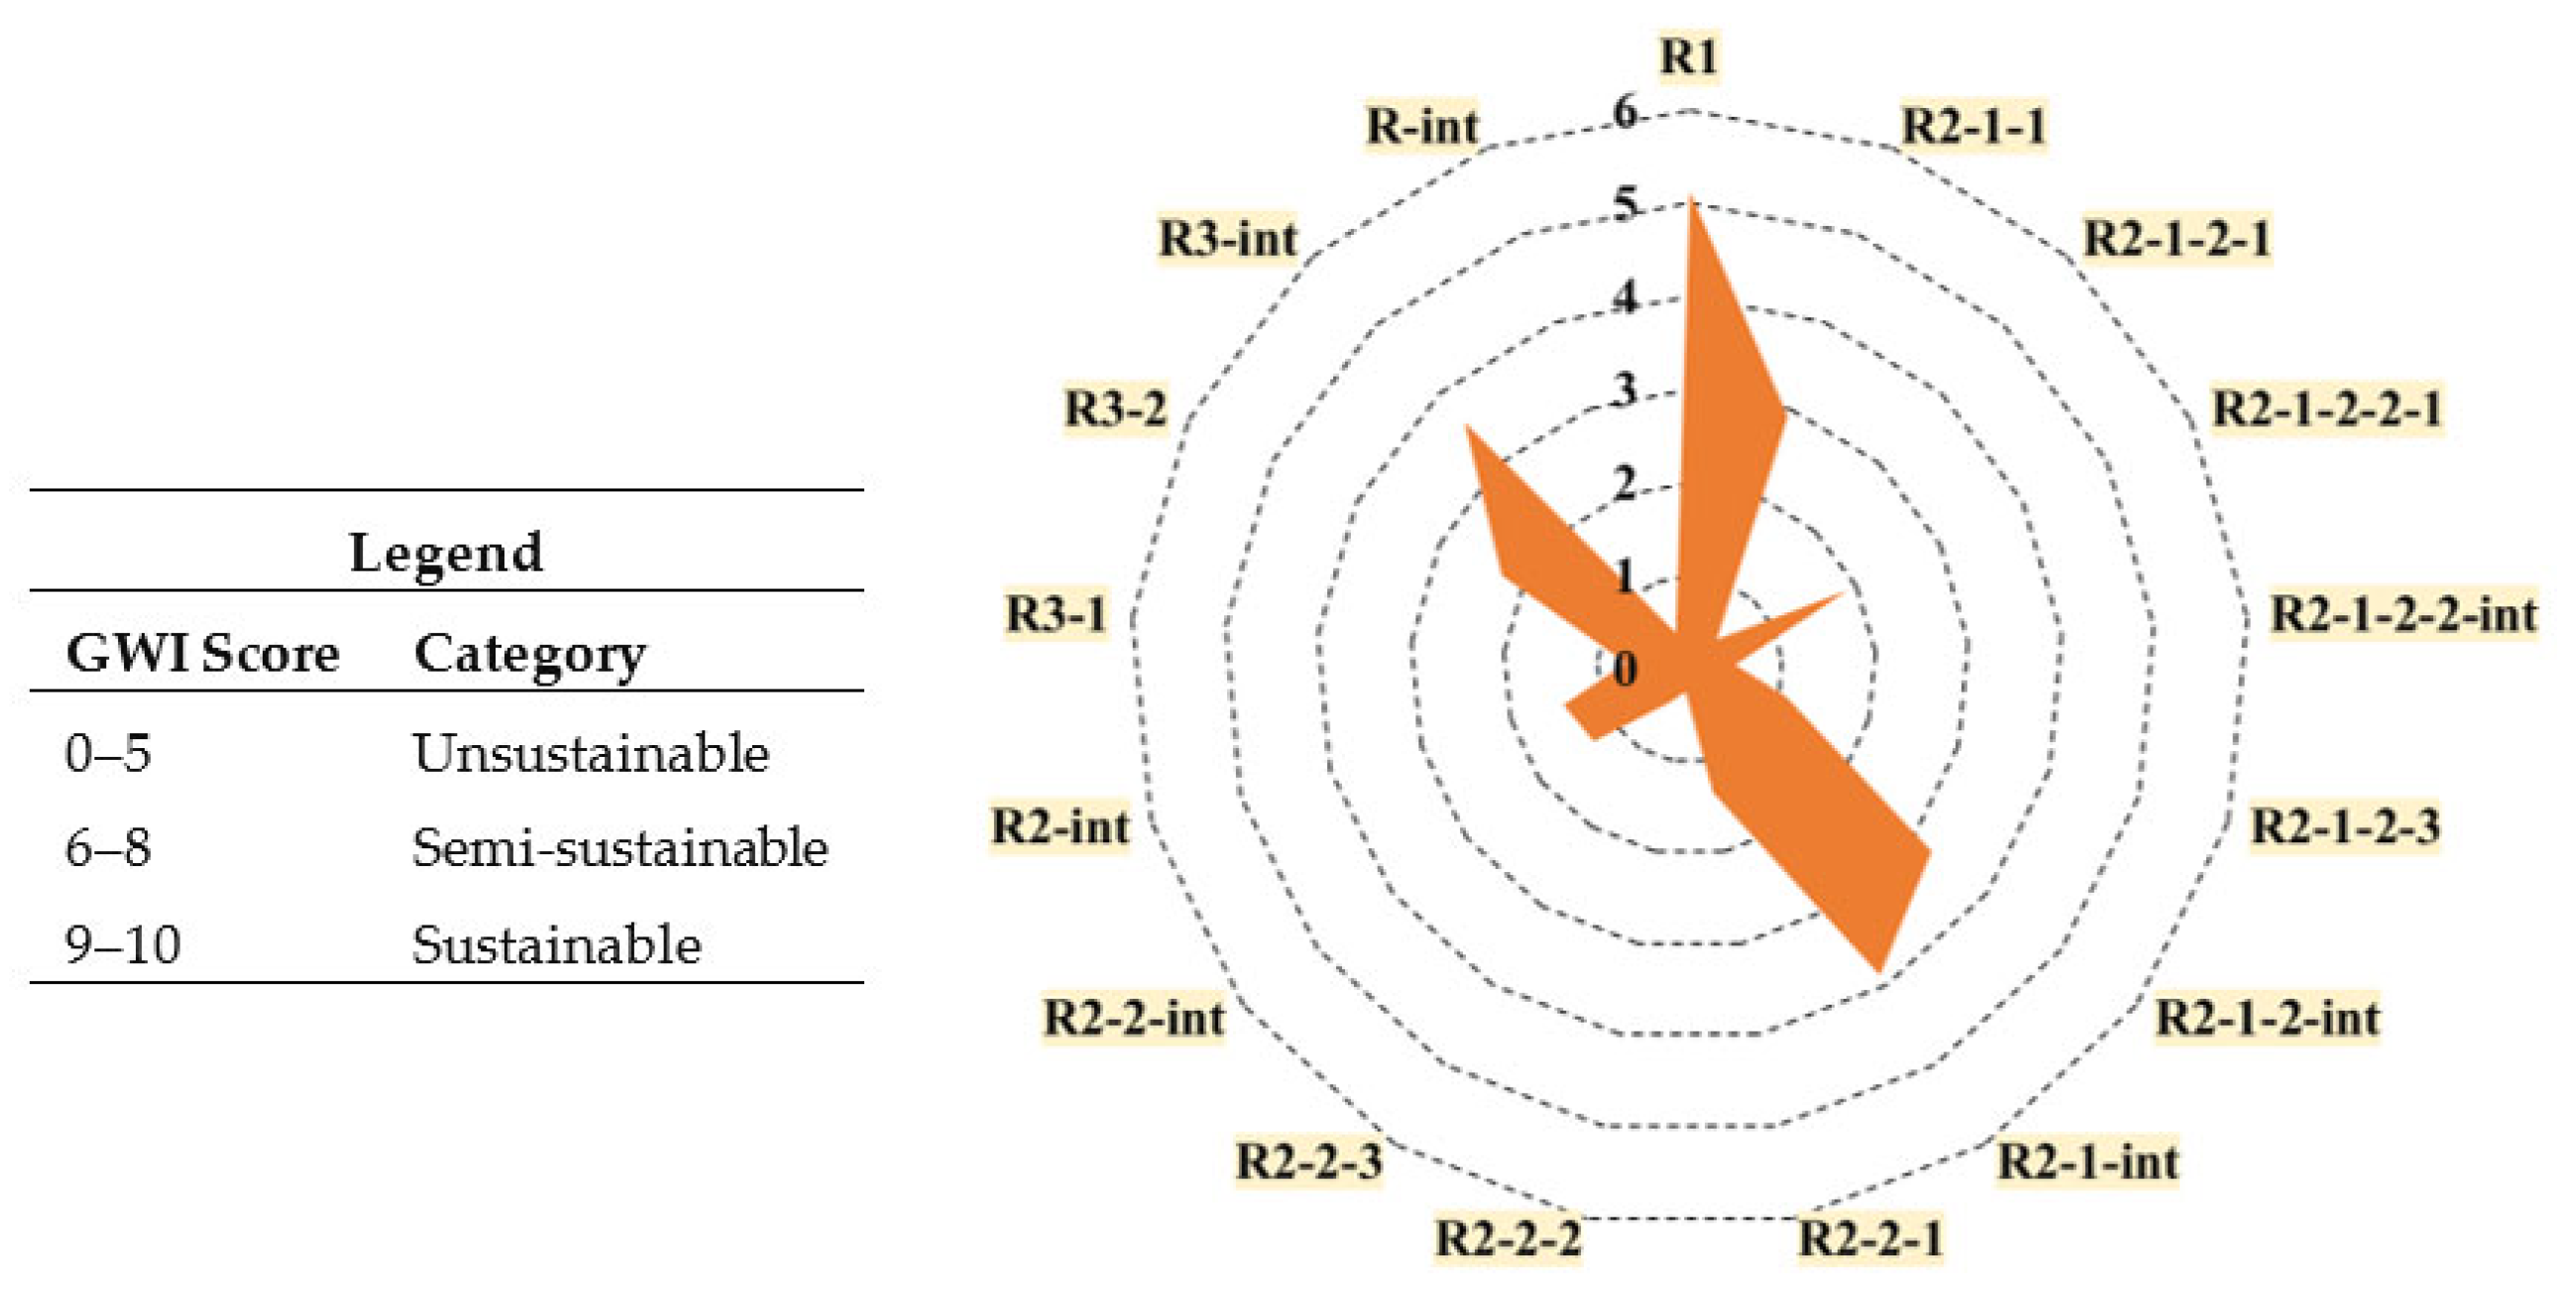
The findings of the water-related indicators chosen for the Green Watershed Index (GWI) in the study area are shown in Table 5. Each sub-watershed has its indicator scores that are used to evaluate its sustainability category. Based on the zoning of the unsustainable, semi-sustainable, and sustainable categories in the study area, the spatial changes in the GWI are confirmed (Figure 2). Based on Table 5, the minimum (0.25) and maximum (5.13) values of the GWI with the standard deviation of 1.42 were obtained, which indicates relatively moderate spatial variability. Furthermore, in Figure 3, a sub-watershed weight radar chart is used to display the results of the GWI with a range of 0 to 6, where 6 is the most important in sustainability development (Figure 3).
Table 5.
The results of calculating the Green Watershed Index (GWI) and the related indicators (Weighted values).

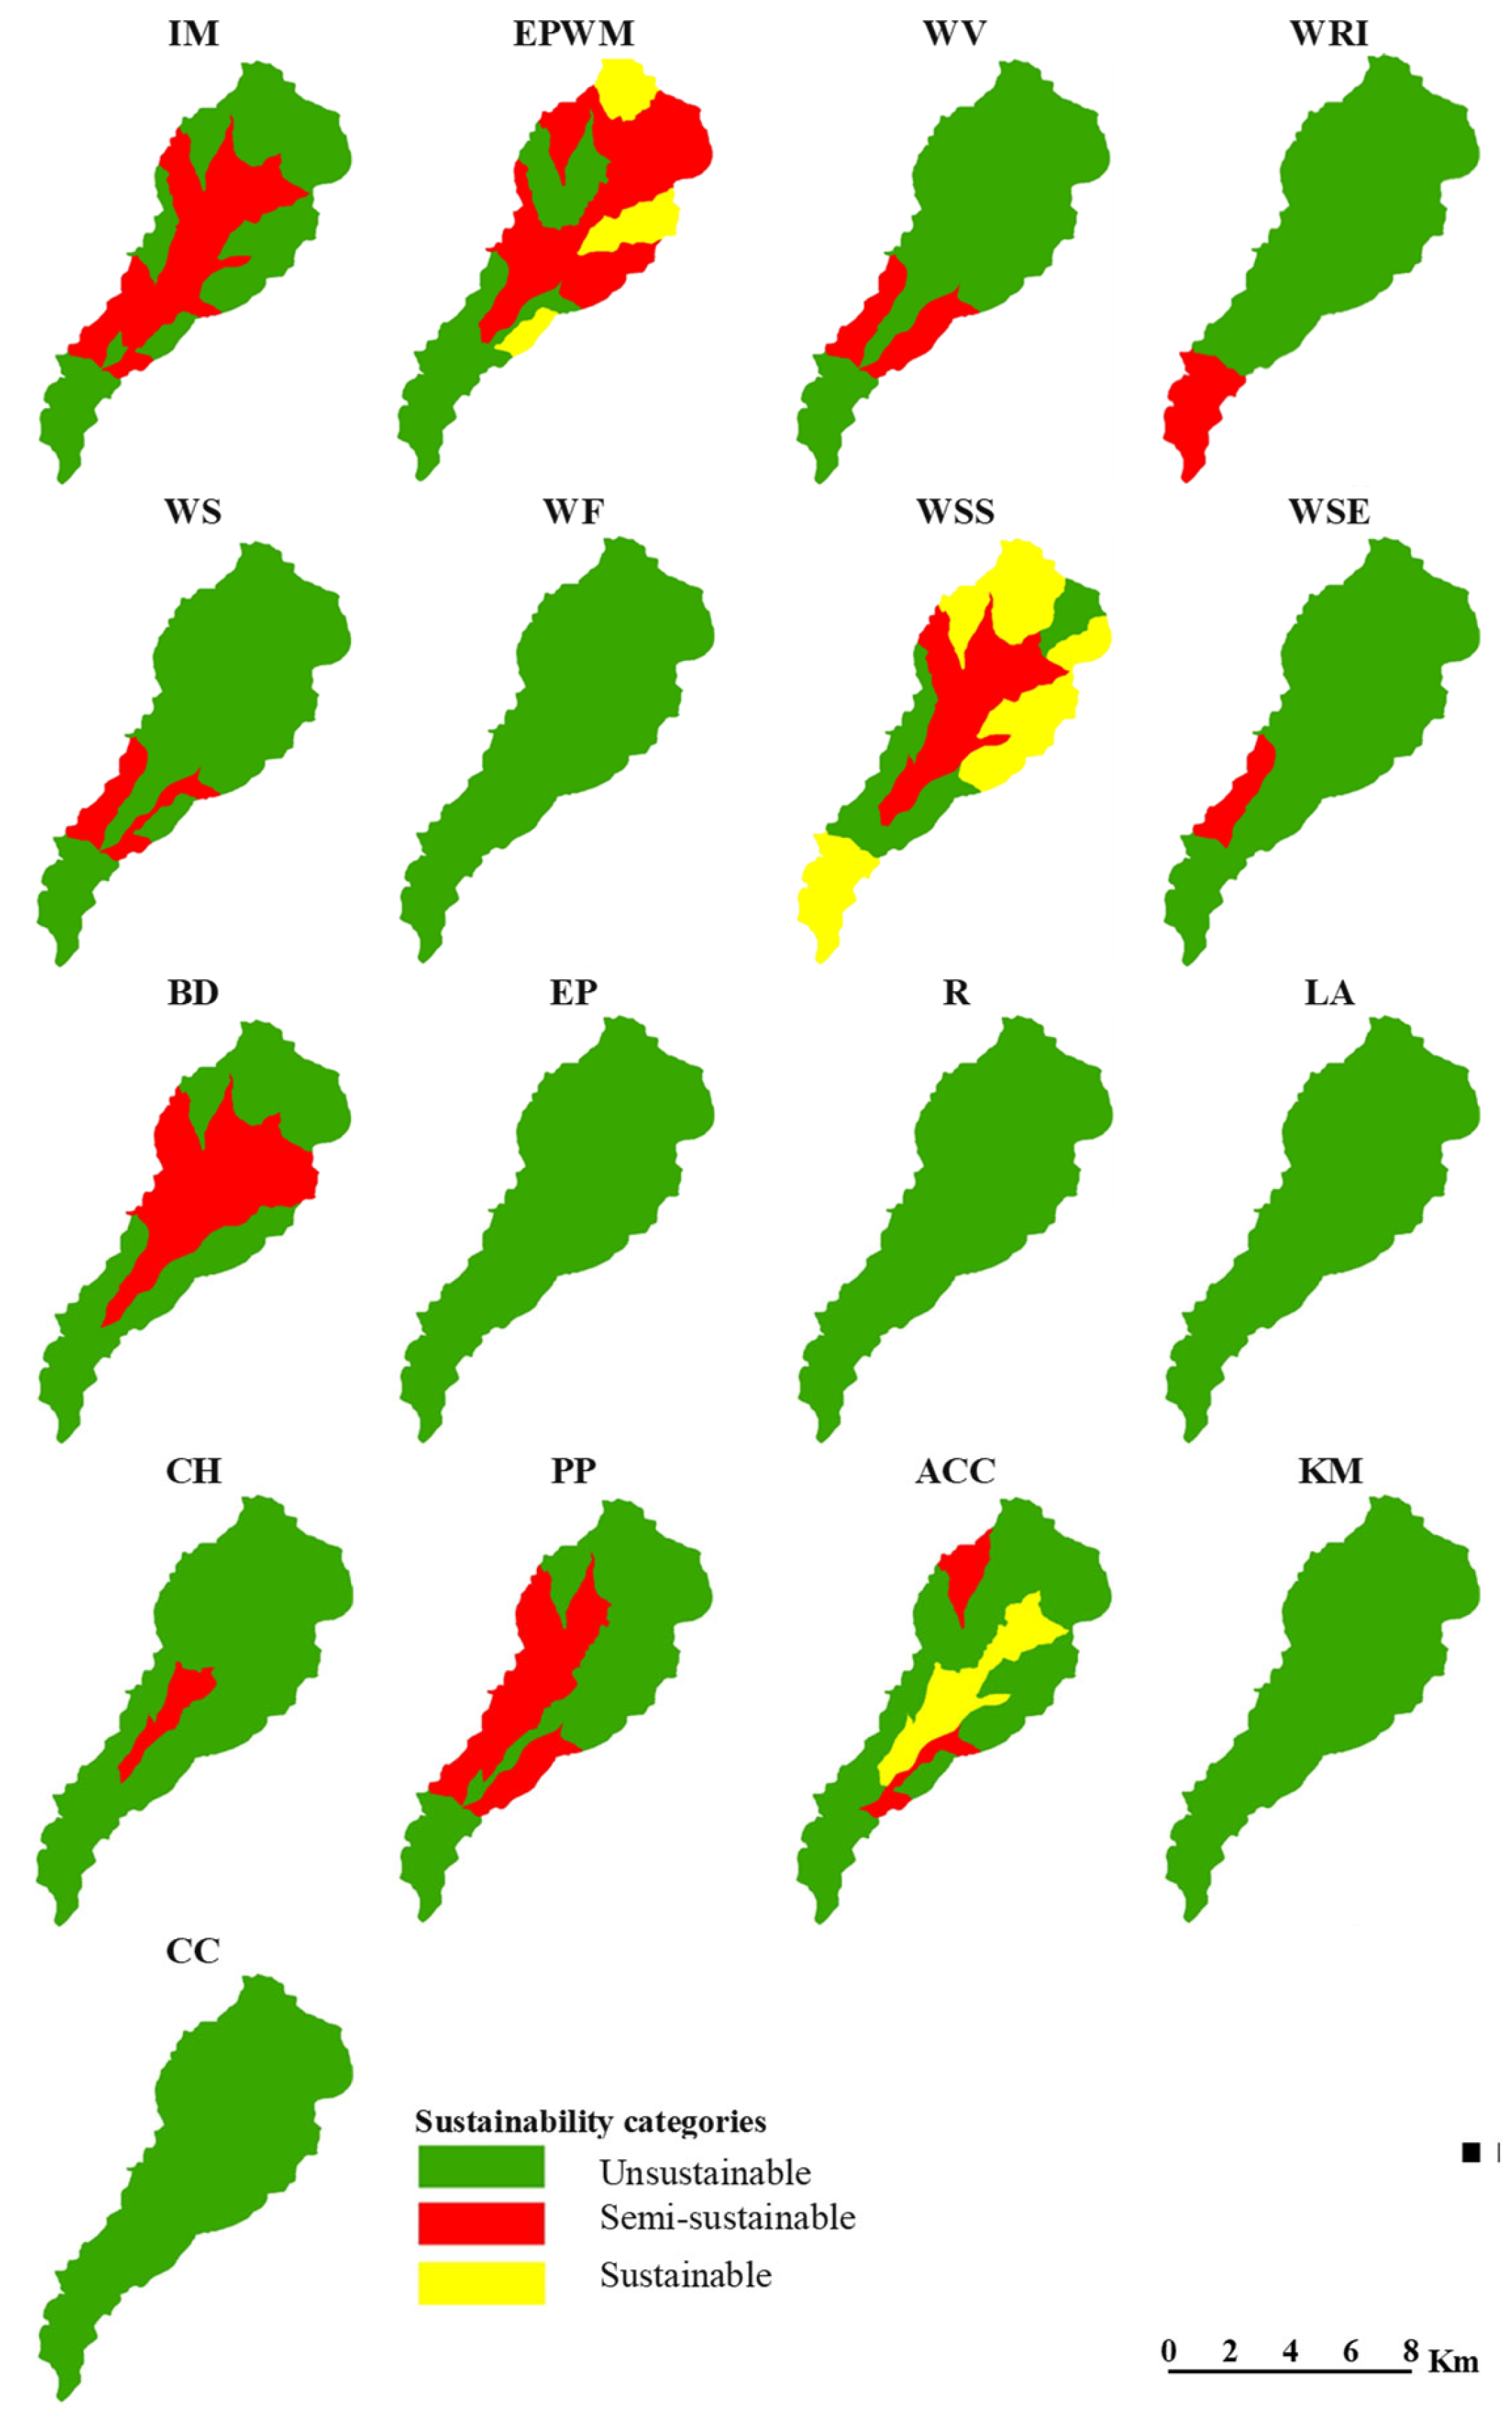
Figure 2.
Zoning of sustainability categories of the 17 indicators selected for the Green Watershed Index (GWI) in the Razey Watershed. The full title of each indicator, along with its abbreviations, is presented in Table 2.

Figure 3.
Green Watershed Index (GWI) results with a radar for different sub-watersheds.
According to the results of Entropy weighting (Table 5), the variability in indicator weights within the GWI assessment was validated, offering valuable guidance for policymakers in formulating effective management strategies. Among the indicators, environmental productivity (EP), human capital (HC), and water-saving and efficient use programs (WSE) were the most influential, with respective weights of 0.26, 0.19, and 0.15. In contrast, the monotonous spatial pattern of recycling (R), landscape attractiveness (LA), knowledge management and information quality system (KM), and corruption control (CC) throughout sub-watersheds leads to their least contribution to the GWI calculation.
In the study area, at first, the infrastructure maintenance (IM) indicator was calculated from the total scores of the two blue-green and gray infrastructure types. According to the regional condition, the blue-green infrastructure was related to the number of groundwater wells, rivers, and drinking fountains, while the gray infrastructure was related to the total number of gas stations, kerosene, gas, water piping, health, schools, and public transportation. The mean scores for blue-green and gray infrastructures were obtained as 0.64 and 0.24, respectively. The results showed that the mean and standard deviations of the IM score were 3.58 and 2.22, respectively. Furthermore, the highest score of IM was obtained in the sub-watershed R2-1-int located in Rahim Bigloi and Razey. In return, sub-watersheds R2-1-2-2-1, R2-2-1, and R2-2-2 had the lowest score. The mean values obtained from the three sub-indicators of water production, water quality, and sewage system coverage were 4.29, 2.18, and 0.26, respectively. The lowest score is related to sewage coverage and then the water quality. The total score of these three sub-indicators that led to the production of the effectiveness in public water management (EPWM) indicator varies between 2 and 8.5. The lowest score is related to the sub-watershed R3-int (located in Karamshahlo village). The three sub-watersheds R2-1-2-2-1, R2-2-3, and R3-2 have the best situation in terms of this indicator.
The indicators of water vulnerability (WV), water stress (WS), and water self-sufficiency (WSS) were calculated based on the amount of irrigation and the amount of water consumption in the sub-watersheds, using the Coutagine formula [45]. Therefore, these indicators have a direct relationship with the population. Regarding all three indicators, the sub-watershed R1 obtains lower values than the other sub-watersheds due to the larger population and excessive consumption. In addition, the mean water retention index (WRI) was equal to 3.8 and varied between 2 and 6.7 across the study area. The index shows particularly low values in almost all sub-watersheds (<4.6), resulting from a combination of typically sparse vegetation, low permeability, and limited, shallow presence of soil. The sub-watershed R-int recorded the highest WRI value at 6.7.
Regarding the water footprint (WF) indicator, given that the volume of water utilized for production is insignificant in comparison to the water used for drinking, all sub-watersheds were given a score of 8. Furthermore, in terms of the water-saving and efficient use programs (WSE) indicator, factors such as advertising, holding training workshops, incentive and punishment measures, actualization of bills, and use of equipment were investigated. High levels of WSE are associated with the central areas of the watershed, especially in Razey City and its nearby villages (i.e., sub-watershed R1 with a score of 6). In sub-watersheds located on the border of Iran and Azerbaijan (i.e., sub-watershed R2-1-2-2-1 with score 1), levels were low (<4). The mean WSE was equal to 1 in the study area.
In terms of Simpson’s biodiversity (BD) indicator, the results obtained from the Fragstat software show that the mean value is 4.58 (varies between 2.8 to 6.4), which indicates a semi-sustainable condition in most of the sub-watersheds. The highest values of the Simpson index (>6) were observed in sub-watersheds R2-int and R2-2-int, and the lowest value (<3) was in the sub-watershed R2-1-2-2-1. In terms of the environmental productivity (EP) indicator, the mean score is 1.67, and most of the sub-watersheds have zero values, which shows the unsustainable conditions. The upstream sub-watersheds are in a better condition than other sub-watersheds, although the measures taken are insufficient and have little impact. Furthermore, in terms of the waste recycling (R) indicator, during the research carried out by the Razey Municipality and the Islamic Council of Villages, no practical action has been taken in the field of waste recycling, and the Razey watershed has an unsustainable condition in this regard.
In terms of the landscape attractiveness (LA) indicator, the score was measured based on the rate of population increase or decrease in the past decade in the study area. A slight increase in population was observed only in the sub-watershed R2-1-1 (1.79%), and the LA score was considered 1 for this sub-watershed. For other sub-watersheds, due to population decrease, a score of zero was considered for LA. Therefore, the average LA score for the entire study area was very low (<0.1).
Regarding the human capital (HC) indicator, the maximum score is related to the sub-watershed R2-1-int, which is higher than the mean of 4.4 for the entire watershed due to the participation of both the contracting and administrative parts in this sub-watershed. Findings of this study also indicated that the extent of the population participation (PP) indicator in watershed program planning and implementation phases, as well as participatory watershed management training (i.e., attending events and workshops), was higher in large, densely populated villages than in small villages. However, the average PP was relatively low (=3), with a range of variation between 0 and 7. Specifically, six sub-watersheds have the maximum PP, including R1, R2-1-1, R2-1-2-int, R2-1-int, R3-2, and R3-int. This shows that the extent of the adaptation to climate change (ACC) indicator was moderate in the study area. This indicator assesses the level of sub-watersheds’ access to measures for reducing the effects of drought and floods. In the study area, the average value of ACC was about 4.7, and this indicator ranges between 0 and 10. The highest ACC score (10) was observed in the sub-watershed R2-1-int, followed by the sub-watershed R2-2-int (9).
Regarding the knowledge management and information quality system (KM) indicator, the existence of an integrated virtual system in the Natural Resources and Environment Departments to respond to requests without the need for in-person visits, and the lack of public access to maps, location of plans, and other important data and information by the public and experts in the study area, led to a score of 5 out of 10. To improve environmental performance, people’s participation and transparent governance that help control corruption in the environment and natural resources issues are crucial [51]. Accordingly, corruption control (CC) and its ranking were obtained using information provided by Transparency International (https://www.transparency.org/), which ranked Iran at 25 out of 100, ranking 147 out of 180 countries. In other words, the CC value for Iran and, as a result, in the Razey watershed, is 2.5.
4. Discussion
Comparative analysis of land use type and elevation (Table 1), with GWI results, also showed that the sub-watershed R1, which is allocated the highest value of the GWI (5.13), had covered 37.4, 944.8, 136.8, 17, and 10.3 ha of rangeland, rainfed agriculture, rocky land, orchard, and residential areas, respectively. In addition, its mean elevation is about 2129.4 m, which is the maximum value among all sub-watersheds. Indeed, this watershed ranked third in terms of residential areas, rainfed agriculture, and rocky land. The sub-watershed R2-2-2 has the lowest value of the GWI (0.25), situated among other sub-watersheds with the lowest residential areas, rainfed agriculture, and orchard areas. The mean elevation of this sub-watershed is also obtained as 1714.98 m.
Different gray and blue infrastructures were adapted for assessing the sustainability and performance of various ecosystems [26,27,52]. The gray infrastructure refers to traditional, engineered structures like piped water systems, public transportation, and buildings. Furthermore, blue infrastructure focuses on water features, both natural (rivers, lakes, and wetlands) and engineered (drainage systems and canals). Finally, the green infrastructure encompasses natural land or plant-based features like trees, parks, and green roofs. In essence, blue-green infrastructure leverages natural and engineered systems to manage water and other environmental aspects, while gray infrastructure represents the traditional built environment [24,25,41,53].
In this study area, the mean and standard deviation of the infrastructure maintenance (IM) score were 3.58 and 2.22, respectively. The highest score was obtained in the sub-watershed R2-1-int located in Rahim Bigloi and Razey villages. This sub-watershed has more groundwater wells and rivers. It is also in very good condition in terms of gray infrastructure, so that in terms of gas station, kerosene, gas, water piping, health, and school conditions, it received the maximum score, and in terms of public transportation and asphalt road, it scored one out of two. In return, sub-watersheds R2-1-2-2-1, R2-2-1, and R2-2-2 had the lowest score. These results indicate the prioritization of sub-watersheds for planning and adopting suitable management and protection strategies for resiliency from environmental stresses. It can be concluded that the sub-watersheds with the highest IM scores are more resilient to various environmental stresses. In this regard, Rezaei Ghaleh et al. [54] reported the importance of green-blue infrastructure management in improving the people’s health of Qazvin city (Iran) in dealing with climate change. There was an inverse relationship between the per capita green-blue infrastructure and the number of emergency calls regarding respiratory, cardiac, and stroke patients. Therefore, the watershed had more green-blue infrastructure and healthier people. Benedict and McMahon [24] also proposed that green infrastructures are linked to gray infrastructures, which consider a watershed as a unit at a specific time and scale. It is widely accepted that green infrastructure can effectively reduce combined sewer overflow incidents by increasing infiltration [25]. Water resulting from diminished runoff can be captured in the infrastructure and reintroduced into the watershed during dry periods, thereby supporting an ecological base flow to maintain ecosystem services [55].
Specifically, the human capital (HC) indicator with a score of 0.84 and environmental productivity (EP) with a score of 0.44 have the highest impact on the GWI. Among the 17 indicators studied, six indicators, including infrastructure maintenance (IM), effectiveness in public water management (EPWM), water conservation (WC), Simpson’s biodiversity index (BD), environmental productivity (EP), and adaptation to climate change (ACC), are significantly affected by green infrastructure. Furthermore, five indicators, including waste recycling (R), human capital (HC), population participation (PP), knowledge management system (KM), and corruption control (CC), are affected by gray infrastructure, and the rest are affected by both green and gray infrastructure.
The total score of the three sub-indicators (water production, water quality, and sewage system coverage) that led to the production of the effectiveness in public water management (EPWM) indicator varies between 2 and 8.5. The sub-watershed R3-int showed the lowest score, while sub-watersheds R2-1-2-2-1, R2-2-3, and R3-2 presented the highest scores. Maleki et al. [56] showed that, among the 31 investigated provinces, the water security index of Ardabil Province ranked 12th with a value of 0.101 in 2011 and 7th with a value of 0.119 in 2016. Despite the fact that a very slight improvement has been achieved during the period, the obtained average indicates the poor state of water resource management in the province and even in the whole country.
In terms of the water vulnerability (WV), water stress (WS), and water self-sufficiency (WSS) indicators, the least populated sub-watersheds and, as a result, the controlled water consumption or native “virgin” rangelands obtain higher values in the study area. Meanwhile, the sub-watershed R1 gains lower values than other sub-watersheds, due to the larger population and excessive water consumption. As a result, water planning, development, and management are needed to ensure sustainable supplies and meet growing demands for both humans and natural ecosystems [43] in the study area, especially in the sub-watershed R1 (located in Razey City).
The mean water retention index (WRI) in the study area reflects its unfavorable capacity in terms of water regulation and water quantity management in the soil. Vandecasteele et al. [40] indicated that the WRI is a composite measure that considers factors related to the potential for water retention in soil, plants, water bodies, and underlying aquifers, along with the effects of slope and artificially sealed surfaces. In the same context, Crossman et al. [57] stated that water regulation refers to how land cover influences the runoff and discharge of rivers. In Ardabil Province, Ghabelnezam et al. [46] prepared a water retention map for all watersheds of the province and reported the minimum and maximum water retention in residential and forest land uses, respectively. This study provides a dynamic assessment and warning of the risk of future degradation of water retention, which can be valuable and applicable to other regions.
The average daily consumption of fresh water in Razey City, with a population of 1581, is 602 m3. On the other hand, the only industrial town in the watershed has an average consumption of 2004 m3 over two months, resulting in a daily consumption of 33.4 m3. According to a survey conducted throughout the watershed, it was found that the piped water is mainly used for domestic consumption and is not used for industrial production, agriculture, or animal husbandry except in exceptional and rare cases. Therefore, the only water-bearing industrial and production unit is Razey Industrial Town, which is small in comparison to the production of water in the watershed, so the ratio of water consumption in production is low for all watersheds, and the score of the water footprint (WF) for all sub-watersheds is 8.
The results of the water-saving and efficient use programs (WSE) index show that the study area is characterized by a very low mean value (WSE = 1). In Razey City and its nearby villages, the indices are better than in other sub-watersheds, and sub-watershed R1 has the maximum score. In remote areas and sub-watersheds located on the border of Iran and Azerbaijan (i.e., R2-1-2-2-1), due to the lack of necessary equipment and facilities, the score is naturally low, and paying attention to culture and low-cost advertising can help improve the situation.
Based on the results, Simpson’s biodiversity index (BD) was significantly higher in upstream areas (i.e., sub-watersheds R2-int and R2-2-int) than downstream areas (i.e., sub-watersheds R2-1-2-2-1, R1, and R3-2). These spatial variations are related to the distribution of patches of land use. The Simpson’s biodiversity index (BD) is particularly sensitive to the most dominant patches in a landscape. A homogeneity value of one indicates a highly diverse landscape, whereas values approaching zero reflect a decline in landscape diversity [58]. Malvandi et al. [47] also used diversity indices to assess water quality in eastern Iran. They found that diversity indices such as Simpson’s diminished from upstream to downstream, which corresponded with a decline in water quality.
Results of environmental productivity (EP) show very low mean values, and most sub-watersheds have zero values, which shows the unstable situation. The lack of implementation of plant mulching and seeding in sub-watersheds R2-2-1, R2-2-2, and R2-1-2-1, which are located upstream, is quite evident in the instability of this watershed. In this regard, Wang et al. [33] and Cegielska et al. [28] stated that vegetation and green spaces provide economic and health advantages, support mitigating and adapting to climate change, help counteract the negative environmental and social impacts of development, and enhance both living standards and environmental quality.
Regarding waste recycling (R), there are no records of practical actions in the study area, leading to a highly unstable condition in this aspect. However, efficient approaches for sustainably reducing waste facilitate sustainable resource management by enhancing the availability of clean water, decreasing the pressure on natural resources, recovering energy, and supporting agriculture [48].
For landscape attractiveness (LA), the population growth rate in the sub-watersheds was compared. In the sub-watershed R2-1-1 only, there was a very slight increase in population, and in other sub-watersheds, a population decrease was observed. This watershed is unstable in this regard and needs basic and comprehensive management decisions.
Human capital (HC), or the quality and knowledge of the workforce, is the main driver of innovation and economic growth [59]. So, if capital, raw materials, and other physical factors are available, it is the HC that shapes them. Regarding the repair and maintenance of water supply equipment, HC is the main factor in the Razey sub-watershed, which is managed by contracting and is only addressed and reviewed by administrative staff in the city of Razey itself. The maximum score is related to the sub-watershed R2-1-int, which is higher than the average of 4.4 of the entire watershed, due to the participation of the contracting and administrative parts in the area. Based on the field survey, it was found that several upstream villages are not covered by services at all. For this reason, sending specialized personnel to these areas, shaping a basis for the integrated development of all areas, can be provided.
Population participation (PP) in watershed management programs is an important strategy for making watershed programs successful and is considered a key element for effective long-term monitoring efforts [60]. The data in Table 5 show that the overall extent of PP in watershed development programs in the study area exhibited a low level, with a calculated mean PP equal to 3. This shows that the population contributed less to interventions implemented during watershed development programs. Surveys show that planning in sparsely populated areas such as Qasim-Kandi and Post-Kandi villages and proper cultural development increase the rate of participation.
In assessing the adaptation to climate change (ACC) indicator, the level of measures to reduce the effects of drought and flood carried out in the sub-watershed was investigated. Despite this, several previous studies, especially in arid and semi-arid regions [50,61], have shown that ACC has a direct relationship with rural livelihoods. Furthermore, creating new businesses that are less dependent on nature has been proposed as a new approach to ACC, reducing vulnerability and improving livelihoods in the region [49]. In the study area, measures to improve people’s livelihood are not satisfactory. A series of flood protection measures have been carried out. Specifically, the construction of mortared stones and cobblestone structures, as well as the construction and modification of canals, water supply, production systems, and flood protection systems, were investigated. The maximum score of 10 compared to the mean score of 4.65 indicates a large difference in investment and management outlook between sub-watersheds. Based on the research conducted, political tastes play an important role in the promotion or decline of this index.
Finally, the values of knowledge management and information quality system (KM) and corruption control (CC) indicators were, respectively, 5 and 2.5 for all sub-watersheds. Both indicators are in completely unstable conditions. However, taking a knowledge-based view of the watershed management programs can provide more successful management practices. Furthermore, low corruption control, with the value of 2.5, is a driver of inefficient water governance [62] and can be a barrier to sustainable watershed management strategies. Widespread corruption in governance not only leads to inefficiency and reduced quality of public services but also negatively impacts social capital, erodes public trust, and ultimately weakens citizen participation by diminishing confidence in governing institutions. Moeinifar et al. [63] created a model for anti-corruption policy in Iran and discovered that administrative corruption, lack of transparency, and exclusion of public participation had fostered an unstable and inefficient management system in terms of a causal perspective. Corruption both drives and stems from the weaknesses of formal institutions. The findings of Taghva et al. [64] revealed that widespread legal violations are often facilitated by the corrupt actions of current and former officials. In response, many farmers have internalized these corrupt practices as a means to gain access to water, exacerbating social conflict and obstructing effective planning and water governance. This persistent dysfunction continues to degrade the watershed’s ecological integrity [62].
The Razey watershed in Ardabil Province is a vital area for soil and water conservation initiatives, particularly due to its limited size and increasing pressures from land use changes. Our focus on utilizing the Green Watershed Index (GWI) framework to evaluate ecosystem sustainability, especially at the sub-watershed level, addresses a significant gap in current research. While previous studies [3,37] have mainly explored how land use changes—including deforestation and urban growth—affect soil erosion and flood risks, this approach to employing a sustainability assessment like the GWI offers a more holistic view of the watershed’s ecological condition and its capacity to maintain resilience.
To improve the effectiveness of green management strategies, establishing regional priorities is crucial for making informed decisions regarding resource allocation. By ranking different sub-watersheds based on the severity of environmental issues, managers gain valuable insights that help streamline interventions. This approach not only benefits watershed managers by enabling more efficient and cost-effective solutions but also aids government agencies in developing targeted regional development plans. Prioritization results can guide budgetary agencies in distributing funds among departments involved in watershed management and environmental protection. Similarly, research funding organizations can use these rankings to identify sub-watersheds that require more or less research attention. Prioritizing sub-watersheds from various environmental perspectives supports smarter, more strategic green management and is a widely recognized practice in related studies.
5. Conclusions
This study established an integrated Green Watershed Index (GWI) using 17 indicators, which were calculated based on water resources, biodiversity, environmental sustainability, and social well-being data that were collected from field survey, remote sensing (RS), and a geographical information system (GIS) in the Razey watershed in a cold semi-arid region of Iran. The spatial dynamics of the calculated indicators were also well analyzed. It was found that the minimum and maximum values of the GWIs were equal to 0.25 and 5.13. Furthermore, the standard deviation is equal to 1.42, which indicates relatively moderate spatial variability. In conclusion, GWI values, along with its assessment indicators and criteria, vary significantly across different locations and over time. As such, continuous and systematic monitoring of the watershed’s green status is essential to ensure accurate evaluation and informed decision-making. Given the innovative nature of this research and the practical relevance of the selected indicators, further studies are recommended to calculate the GWI for additional watersheds across Iran and other countries. Such investigations could contribute to the creation of a comprehensive GWI atlas, allow for testing various methods of indicator integration and weighting for sensitivity analysis, assess the uncertainty associated with GWI results, and support the development of detailed management guidelines. Finally, using remotely sensed data and products of Google Earth Engine could be very helpful and widely applicable to define more applicable indicators, especially for large regions, for monitoring spatio-temporal changes. In addition, it is highly encouraged to facilitate equipping the watershed for collecting high-resolution data associated with green representative indicators regarding the accuracy assessment of GWI results.
Author Contributions
Conceptualization, Z.H. and R.M.; methodology, Z.H.; software, A.I.; validation, R.J. and Z.H.; formal analysis, A.I.; investigation, R.J. and Z.H.; resources, R.J.; data curation, Z.H.; writing—original draft preparation, R.J.; writing—review and editing, Z.H., R.M. and A.E.O.; visualization, R.J.; supervision, R.J.; project administration, R.J. All authors have read and agreed to the published version of the manuscript.
Funding
This research received no external funding.
Institutional Review Board Statement
Not applicable.
Informed Consent Statement
Not applicable.
Data Availability Statement
The data are available on request.
Acknowledgments
This research was supported by the University of Mohaghegh Ardabili, Ardabil, Iran.
Conflicts of Interest
The authors declare no conflicts of interest.
References
- Zakeri, M.A.; Mirnia, S.K.; Moradi, H.R. Assessment of water security in the large watersheds of Iran. Environ. Sci. Policy. 2022, 127, 31–37. [Google Scholar] [CrossRef]
- Afshar Bakeshlo, Z.; Omidvar, M.; Gigauri, I. Sustainable Path and Green Leadership: Navigating the Challenges of Environmental Sustainability in Iran. In Navigating Corporate Social Responsibility Through Leadership and Sustainable Entrepreneurship; Gigauri, I., A. Khan, A., Eds.; IGI Global Scientific Publishing: Hershey, PA, USA, 2025; pp. 257–278. [Google Scholar] [CrossRef]
- Abedini, M.; Sabouri, H.; Pasban, A. Flood Hazard Zoning and Its Relationship with Land Use Using the Analytic Network Process Model (Case Study: Razi Chay Watershed, Ardabil Province). J. Sustain. Urban Reg. Dev. Stud. 2025, 6, 68–84. Available online: https://www.srds.ir/article_214387_en.html (accessed on 26 May 2025). (In Persian).
- Shamaee, S.H.; Yousefi, H.; Zahedi, R. Assessing urban development indicators for environmental sustainability. Discov. Sustain. 2024, 5, 341. [Google Scholar] [CrossRef]
- Amghani, M.S.; Sabouri, M.S.; Baghernejad, J.; Norozi, A. Factors affecting the livelihood sustainability of smallholder farmers in Iran. Environ. Sustain. Indic. 2025, 26, 100601. [Google Scholar] [CrossRef]
- Tajbakhshian, M. Groundwater quality and hydrogeochemical challenges in the Sarakhs Plain, NE Iran: A call for sustainable management. Environ. Geochem. Health. 2025, 47, 75. [Google Scholar] [CrossRef] [PubMed]
- Heshmati, S.; Hafezparast, M.; Mastali, F. Productivity and sustainability index evaluation for Harsin dam. J. Rainwater Catchment Syst. 2019, 7, 53–63. (In Persian) [Google Scholar]
- Saeedi, I.; Mikaeili Tabrizi, A.R.; Bahremand, A.; Salmanmahiny, A. A soft systems methodology and interpretive structural modeling framework for green infrastructure development to control runoff in Tehran metropolis. Nat. Resour. Model. 2022, 35, e12339. [Google Scholar] [CrossRef]
- He, D.; Hu, J.; Zhang, J. Assessment of sustainable development suitability in linear cultural heritage—A case of Beijing Great Wall Cultural Belt. Land 2023, 12, 1761. [Google Scholar] [CrossRef]
- Núñez-Razo, I.; de Anda, J.; Barrios-Piña, H.; Olvera-Vargas, L.A.; García-Ruíz-García, M.; Hernández-Morales, S. Development of a watershed sustainability index for the Santiago River Basin, Mexico. Sustainability 2023, 15, 8428. [Google Scholar] [CrossRef]
- Mocuta, D.; Stoian, E. Interdependence between sustainable development and human health. In Scientific Papers. Series “Management, Economic Engineering in Agriculture and Rural Development”; U.S.A.M.V.: Bucharest, Romania, 2013; Volume 13, pp. 241–246. ISSN 2284-7995. [Google Scholar]
- Flotemersch, J.; Leibowitz, S.; Hill, R.; Stoddard, J.; Thoms, M.; Tharme, R. A watershed integrity definition and assessment approach to support strategic management of watersheds. River Res. Appl. 2016, 32, 1654–1671. [Google Scholar] [CrossRef]
- Naiman, R.J. New Perspectives for Watershed Management: Balancing Long-Term Sustainability with Cumulative Environmental Change. In Watershed Management; Naiman, R.J., Ed.; Springer: New York, NY, USA, 1992. [Google Scholar] [CrossRef]
- Kateb, F.; Ouri, A.E.; Mostafazadeh, R.; Sharari, M.; Hazbavi, Z. Index-based assessment of stakeholder perception for participatory sustainable soil and water resources in a mountainous landscape. Eval. Program Plan. 2025, 112, 102643. [Google Scholar] [CrossRef]
- Jarzebski, M.P.; Karthe, D.; Chapagain, S.K.; Setiawati, M.D.; Wadumestrige Dona, C.G.; Pu, J.; Fukushi, K. Comparative Analysis of Water Sustainability Indices: A Systematic Review. Water 2024, 16, 961. [Google Scholar] [CrossRef]
- Nugroho, H.Y.S.H.; Purwanto, P.; Nandini, R.; Adi, R.N.; Savitri, E.; Putra, P.B.; Indrawati, D.R.; Nada, F.M.H.; Nugroho, A.W. Building Adaptive and Resilient Community to Climate Change Through Micro Watershed Management Strategies to Support the Achievement of Village SDGs. In Climate Change: Conflict and Resilience in the Age of Anthropocene; Pal, S.C., Chatterjee, U., Saha, A., Ruidas, D., Eds.; Advances in Global Change Research; Springer: Cham, Switzerland, 2025; Volume 80. [Google Scholar] [CrossRef]
- Eurostat. Water Exploitation Index in Europe, 2016, 310. Available online: http://maps.eea.europa.eu/EEAViewer/?appid=eaf7bb088ba-548368c6e102c4a876c13 (accessed on 1 June 2023).
- Dening, S. European Green City Index; Siemens AG: Munich, Germany, 2009. [Google Scholar]
- Juwana, I.; Perera, B.J.; Muttil, N. A water sustainability index for West Java. Part 1: Developing the conceptual framework. Water Sci. Technol. 2010, 62, 1629–1640. [Google Scholar] [CrossRef]
- Chaves, H.M.L.; Alipaz, S. An Integrated Indicator Based on Basin Hydrology, Environment, Life, and Policy: The Watershed Sustainability Index. Water Resour. Manage 2007, 21, 883–895. [Google Scholar] [CrossRef]
- Emerson, J.; Esty, D.C.; Levy, M.A.; Kim, C.H.; Mara, V.; de Sherbinin, A.; Srebotnjak, T. 2010 Environmental Performance Index; Yale Center for Environmental Law and Policy: New Haven, CT, USA, 2010; Available online: http://epi.yale.edu/ (accessed on 26 May 2025).
- Mititelu-Ionuş, O. Watershed Sustainability Index Development and Application: Case Study of the Motru River in Romania. Pol. J. Environ. Stud. 2017, 26, 2095–2105. [Google Scholar] [CrossRef]
- Rendrarpoetri, B.L.; Rustiadi, E.; Fauzi, A.; Pravitasari, A.E. Sustainability Assessment of the Upstream Bengawan Solo Watershed in Wonogiri Regency, Central Java Province, Indonesia. Sustainability 2024, 16, 1982. [Google Scholar] [CrossRef]
- Benedict, M.A.; McMahon, E.T. Green infrastructure: Smart Conservation for the 21st Century. Renew. Resour. J. 2002, 20, 12–17. Available online: http://www.sprawlwatch.org/greeninfrastructure.pdf (accessed on 2 June 2023).
- Buckley, M. Economic Benefits of Green Infrastructure: Chesapeake Bay Region; ECONorthwest: Portland, OR, USA, 2011. [Google Scholar]
- Caro, C.A.; Bladé, E. Water Resources Management: Green Watershed Index (GWI). In Proceedings of the IOP Conference Series: Earth and Environmental Science, Volume 690, 2020 International Symposium on Water, Ecology and Environment, Beijing, China, 6–8 December 2020. [Google Scholar]
- Abdel-Basset, M.; Gamal, A.; Chakrabortty, R.K.; Ryan, M.; El-Saber, N. A Comprehensive Framework for Evaluating Sustainable Green Building Indicators under an Uncertain Environment. Sustainability 2021, 13, 6243. [Google Scholar] [CrossRef]
- Cegielska, K.; Kukulska-Kozieł, A.; Hernik, J. Green Neighbourhood Sustainability Index–A measure of the balance between anthropogenic pressure and ecological relevance. Ecol. Indic. 2024, 160, 111815. [Google Scholar] [CrossRef]
- Hall, B.; Kerr, M.L. 1991–1992 Green Index: A State-by-State Guide to the Nation’s Environmental Health, 1st ed.; Island Press: Washington, DC, USA, 1991; 170p. [Google Scholar]
- Covv, C.; Halstead, T.; Rowe, J. If the GDP is Up, why is America Down? Atl. Mon. 1995, 276, 5978. [Google Scholar]
- Lawn, P.A. A theoretical foundation to support the Index of Sustainable Economic Welfare (ISEW), Genuine Progress Indicator (GPI), and other related indexes. Ecol. Econ. 2003, 44, 105–118. [Google Scholar] [CrossRef]
- Lawn, P.A. An assessment of the valuation methods used to calculate the index of sustainable economic welfare (ISEW), genuine progress indicator (GPI), and sustainable net benefit index (SNBI). Environ. Dev. Sustain. 2005, 7, 185–208. [Google Scholar] [CrossRef]
- Wang, M.X.; Zhao, H.H.; Cui, J.X.; Fan, D.; Lv, B.; Wang, G.; Li, Z.H.; Zhou, G.J. Evaluating green development level of nine cities within the Pearl River Delta, China. J. Clean. Prod. 2018, 174, 315–323. [Google Scholar] [CrossRef]
- Ahmadov, E. Water resources management to achieve sustainable development in Azerbaijan. Sustain. Futures 2020, 2, 100030. [Google Scholar] [CrossRef]
- Hazbavi, Z.; Sadeghi, S.H.; Gholamalifard, M.; Davudirad, A.A. Watershed health assessment using the pressure–state–response (PSR) framework. Land Degrad. Dev. 2020, 31, 3–19. [Google Scholar] [CrossRef]
- Alaei, N.; Mostafazadeh, R.; Esmali Ouri, A.; Hazbavi, Z.; Sharari, M.; Huang, G. Spatial comparative analysis of landscape fragmentation metrics in a watershed with diverse land uses in Iran. Sustainability 2022, 14, 14876. [Google Scholar] [CrossRef]
- Azizi, E.; Nikoo, M.R.; Mostafazadeh, R.; Hazbavi, Z. Flood vulnerability analysis using different aggregation frameworks across watersheds of Ardabil province, northwestern Iran. Int. J. Disaster Risk Reduct. 2023, 91, 103680. [Google Scholar] [CrossRef]
- Dickens, C.; McCartney, M.; Tickner, D.; Harrison, I.J.; Pacheco, P.; Ndhlovu, B. Evaluating the global state of ecosystems and natural resources: Within and beyond the SDGs. Sustainability 2020, 12, 7381. [Google Scholar] [CrossRef]
- Ali, A. Monitoring, Evaluation and Learning of Natural Resources Management Projects, Part II. Project “Strengthening Natural Resources Management Capacities to Revitalize Agriculture in Fragile Contexts”. E-nugget. 2020. Available online: https://www.fao.org/3/cb2139en/cb2139en.pdf (accessed on 12 May 2023).
- Vandecasteele, I.; Mari Rivero, I.; Baranzelli, C.; Becker, W.; Dreoni, I.; Lavalle, C.; Batelaan, O. The Water Retention Index: Using land use planning to manage water resources in Europe. Sustain. Dev. 2018, 26, 122–131. [Google Scholar] [CrossRef]
- Alves, A.; Gersonius, B.; Kapelan, Z.; Vojinovic, Z.; Sanchez, A. Assessing the Co-Benefits of green-blue-grey infrastructure for sustainable urban flood risk management. J. Environ. Manag. 2019, 239, 244–254. [Google Scholar] [CrossRef]
- Hogeboom, R.J. The water footprint concept and water’s grand environmental challenges. One Earth 2020, 2, 218–222. [Google Scholar] [CrossRef]
- Loucks, D.P.; van Beek, E. Water Resources Planning and Management: An Overview. In Water Resource Systems Planning and Management; Springer: Cham, Switzerland, 2017. [Google Scholar] [CrossRef]
- Dalavi, P.; Bhakar, S.R.; Rajput, J.; Gaddikeri, V.; Tiwari, R.K.; Shukla, A.; Vishwakarma, D.K. Modeling runoff in Bhima River catchment, India: A comparison of artificial neural networks and empirical models. Water Pract. Technol. 2024, 19, 2595–2612. [Google Scholar] [CrossRef]
- Coutagine, J. A new method of determining the runoff coefficient of small catchments. J. Hydrol. Hydromech. 1967, 5, 94–108. [Google Scholar]
- Ghabelnezam, E.; Mostafazadeh, R.; Esmali Ouri, A.; Hazbavi, Z. The Importance of Watershed Ecosystem Services with Emphasis on Runoff yield and Erosion Control. Hum. Environ. 2022, 62, 137–155. Available online: https://sanad.iau.ir/en/Article/847705 (accessed on 20 May 2023). (In Persian).
- Malvandi, H.; Moghanizade, R.; Abdoli, A. The use of biological indices and diversity indices to evaluate water quality of rivers in Mashhad, Iran. Biologia 2021, 76, 959–971. [Google Scholar] [CrossRef]
- Silva, J.A. Wastewater Treatment and Reuse for Sustainable Water Resources Management: A Systematic Literature Review. Sustainability 2023, 15, 10940. [Google Scholar] [CrossRef]
- Tohidimoghadam, A.; PourSaeed, A.; Bijani, M.; Eshraghi Samani, R. Rural sustainable livelihood resilience to climate change: A strategic analysis. Environ. Sustain. Indic. 2023, 20, 100292. [Google Scholar] [CrossRef]
- Ullah, A.; Bavorova, M.; Ahmad Shah, A.; Kandel, G.P. Climate change and rural livelihoods: The potential of extension programs for sustainable development. Sustain. Dev. 2024, 32, 4992–5004. [Google Scholar] [CrossRef]
- Rodríguez-Martínez, C.C.; García-Sánchez, I.M.; Vicente-Galindo, P.; Galindo-Villardón, P. Exploring relationships between environmental performance, e-government and corruption: A multivariate perspective. Sustainability 2019, 11, 6497. [Google Scholar] [CrossRef]
- Lu, P.; Sun, Y.; Steffen, N. Scenario-based performance assessment of green-grey-blue infrastructure for flood-resilient spatial solution: A case study of Pazhou, Guangzhou, greater Bay area. Landsc. Urban Plan. 2023, 238, 104804. [Google Scholar] [CrossRef]
- Ncube, S.; Arthur, S. Influence of Blue-Green and Grey Infrastructure Combinations on Natural and Human-Derived Capital in Urban Drainage Planning. Sustainability 2021, 13, 2571. [Google Scholar] [CrossRef]
- Rezaei Ghaleh, M.; Hagh Parast, F.; Maleki, A. Investigating the correlation between blue-green infrastructure and reduction of heat-related health effect under climate change (Case study: Qazvin City). Bagh-e Nazar. 2022, 19, 69–84. (In Persian) [Google Scholar] [CrossRef]
- Risch, E.; Gasperi, J.; Gromaire, M.C.; Chebbo, G.; Azimi, S.; Rocher, V.; Roux, P.; Rosenbaum, R.K.; Sinfort, C. Impacts from urban water systems on receiving waters–how to account for severe wet-weather events in LCA? Water Res. 2018, 128, 412–423. [Google Scholar] [CrossRef] [PubMed]
- Maleki, N.; Shakeri Bostanabad, R.; Salehi komroudi, M.; Seiedabadi, S. Investigating the status of the combined water security index of Iranian Provinces in the Period of 2012-2017: Application of Multi-Criteria Analysis Methods. J. Water Sustain. Dev. 2021, 8, 21–32. (In Persian) [Google Scholar] [CrossRef]
- Crossman, N.D.; Nedkov, S.; Brander, L. Discussion Paper 7: Water Flow Regulation for Mitigating River and Coastal Flooding. Paper Submitted to the Expert Meeting on Advancing the Measurement of Ecosystem Services for Ecosystem Accounting, New York, 2019 and Subsequently Revised. Version of 1 April 2019. Available online: https://seea.un.org/events/expert-meeting-advancing-measurement-ecosystem-services-ecosystem-accounting (accessed on 14 April 2023).
- McGarigal, K.; Cushman, S.A.; Ene, E. Spatial Pattern Analysis Program for Categorical and Continuous Maps, FRAGSTATS v4; University of Massachusetts: Amherst, MA, USA, 2012. [Google Scholar]
- Brodny, J.; Tutak, M. A multi-criteria measurement and assessment of human capital development in EU-27 countries: A 10-year perspective. J. Open Innov. Technol. Mark. Complex. 2024, 10, 100394. [Google Scholar] [CrossRef]
- Zuniga-Teran, A.A.; Fisher, L.A.; Meixner, T.; Le Tourneau, F.-M.; Postillion, F. Stakeholder participation, indicators, assessment, and decision-making: Applying adaptive management at the watershed scale. Environ. Monit. Assess. 2022, 194, 156. [Google Scholar] [CrossRef]
- Piya, L.; Maharjan, K.L.; Joshi, N.P. Climate Change and Rural Livelihoods in Developing Countries. In Socio-Economic Issues of Climate Change; Springer: Singapore, 2019. [Google Scholar] [CrossRef]
- Lopez Porras, G.; Stringer, L.C.; Quinn, C.H. Corruption and conflicts as barriers to adaptive governance: Water governance in dryland systems in the Rio del Carmen watershed. Sci. Total Environ. 2019, 10, 519–530. [Google Scholar] [CrossRef]
- Moeinifar, M.; Givarian, H.; Rabiei Mondajin, M.R.; Momeni, M. Indicators and Components for Developing a Model of Anti-Corruption Policy in Iran (With an Electronic Government Approach). Int. J. Innov. Manag. Organ. Behav. 2023, 3, 77–83. [Google Scholar] [CrossRef]
- Taghva, M.R.; Masnavi, H.; Taghavifard, M.T.; Zarandi, S. E-Governance Development Model Towards Anti-Corruption in Iran. Public Manag. Res. 2023, 16, 163–190. (In Persian) [Google Scholar] [CrossRef]
Disclaimer/Publisher’s Note: The statements, opinions and data contained in all publications are solely those of the individual author(s) and contributor(s) and not of MDPI and/or the editor(s). MDPI and/or the editor(s) disclaim responsibility for any injury to people or property resulting from any ideas, methods, instructions or products referred to in the content. |
© 2025 by the authors. Licensee MDPI, Basel, Switzerland. This article is an open access article distributed under the terms and conditions of the Creative Commons Attribution (CC BY) license (https://creativecommons.org/licenses/by/4.0/).