Article

Emissions of Conventional and Electric Vehicles: A Comparative Sustainability Assessment

by
Esra’a Alrashydah
1,
Thaar Alqahtani
2,* and
Abdulnaser Al-Sabaeei
3
1
Independent Researcher, Austin, TX 78729, USA
2
Department of Civil Engineering, College of Engineering, Prince Sattam Bin Abdulaziz University, Alkharj 11942, Saudi Arabia
3
Department of Civil Engineering, Thamar University, Thamar 87246, Yemen
*
Author to whom correspondence should be addressed.
Sustainability 2025, 17(15), 6839; https://doi.org/10.3390/su17156839
Submission received: 2 June 2025 / Revised: 3 July 2025 / Accepted: 18 July 2025 / Published: 28 July 2025

Abstract

Vehicle emissions, as a source of air pollution and greenhouse gases, have a significant impact on the environment and climate change. Battery electric vehicles (BEVs) have the potential to reduce air pollution and GHGs. However, BEVs often attract the criticism that their benefits are minimal as the power plant emissions compensate for emissions from the tailpipes of vehicles. This study compared two scenarios: scenario A considers all vehicles as internal combustion engine vehicles (ICEVs), and scenario B considers all vehicles as BEVs. The study used the City of San Antonio, Texas, as the study area. The study also focused on the seasonal and spatial variation in ICEV emissions. The results indicate that scenario A has a considerably higher volume of emissions than scenario B. For ICEVs, PM2.5 emissions were up to 50% higher in rural areas than urban areas, but 45% lower for unrestricted versus restricted conditions. CO2 emissions were highly affected by seasonal variations, with a 51% decrease from winter to summer. The full adoption of BEVs could reduce CO2 and N2O emissions by 99% and 58% per km, especially for natural gas power resources. Therefore, BEVs play a significant role in reducing emissions from the transportation sector.

1. Introduction

Environmental sustainability and climate change represent two of the most significant concerns faced by humanity at the present time. According to estimates, the Earth at present is going through one of the most significant phases of biodiversity loss, the effect of which is unforeseen and unpredictable [1]. The increase in population, along with a massive escalation in human activities, has raised several questions regarding sustainability. In particular, urbanization, industrialization, and modern agricultural practices are globally recognized for their pollution of natural resources such as water, air, and soil. Most importantly, increasing emissions of greenhouse gases (GHGs) are having a far-reaching impact. Based on the estimates of different agencies, such as the United States Development Authority (USDA) and the Organization for Economic Cooperation and Development (OECD), increasing greenhouse emissions will lead to a rise in temperatures by 02 °C by 2050. Accordingly, glaciers and polar ice are melting at rates 2–3 times higher than the melting rates in the last century [2].
The remarkable evolution of the transportation sector and the increase in the number of vehicles are of significant concern for sustainability. The transportation sector is one of the most critical sectors in terms of energy consumption and GHG emissions. Vehicle emissions are a vital source of GHGs and contribute significantly to global climate change [3,4,5,6,7,8]. Meanwhile, in the light of increasing global transportation demand due to economic and population growth, vehicle emissions alerts associated with the increasing number of vehicles are a major focus for transportation and environmental and public health agencies [9,10]. The World Health Organization (WHO) predicted that worldwide ambient air pollution would lead to 4.2 million premature deaths per year [11]. Although there are many sources for this issue, road vehicles are the primary source of air pollution in urban areas [12,13].
Vehicular emissions are a severe problem, especially with increasing road network congestion leading to stop-and-go traffic [14,15]. This has a harmful impact on both the temporal and spatial patterns of GHGs, particulate matter (PM), and toxic air pollutant concentrations within urban areas [16,17]. In the literature, a broad range of measures are suggested to reduce vehicle emissions [18,19,20]. These efforts include improving internal combustion engines to increase engine efficiency [21,22,23,24], the adaption of green vehicles with hybrid technology, the inclusion of autonomous vehicles or AVs [25], implementing traffic network management strategies with a primary focus on the traffic control system and efficient vehicle routing [26,27], and modeling the prospects of plug-in hybrid electric vehicles (HEVs) to reduce CO2 emissions [28].
The Clean Air Act requires the Environmental Protection Agency (EPA) to set National Ambient Air Quality Standards (NAAQSs) for six common air pollutants. These pollutants are monitored all over the United States (US) as they may have harmful impacts on health and the environment. These pollutants are ozone (O3), PM (i.e., fine PM2.5 and PM10), carbon monoxide (CO), sulfur dioxide (SO2), nitrogen oxides (NOx), and lead (Pb). Research studies on air quality near major roadways have identified higher concentrations of motor vehicle-emitted pollutants and other pollutants such as black carbon (BC), polycyclic aromatic hydrocarbons (PAHs), and benzene, in comparison to general urban background levels [29,30,31,32,33].
BEVs are considered to be a more energy-efficient and less polluting solution. However, if they are not charged with cleaner sources of power, then they may also lead to GHG emissions and air pollution. Power-generating plants, such as coal and natural gas power plants, are the primary cause of GHGs and toxic airborne emissions. Concerns over global climate change and fuel security have driven both international and local efforts to implement pollution and carbon taxes. Many of these policies specifically target the electric power sector, where taxes are imposed based on the types of fuel used for power generation. A significant portion of such policy interventions are directed at the electric power industry with taxes applied according to the type of fuel used by the power generators in their power plants. Considering more energy-efficient solutions producing fewer pollutant emissions, different researchers have focused on electric mobility (e-mobility) and its life cycle assessment [34]. The focus has been on BEVs emissions, especially at charging stations, considering the associated vehicle control system [35,36,37]. Considering the cutting edge of technology, considerable attention has been paid to AVs as a type of vehicle that will penetrate the transportation system in the near future.
A recent study by Zhong et al. [38] reviewed different efforts to establish emission prediction models. The review includes emission data-driven models and traditional emission models. Another study by Jiang et al., 2024, focused on establishing a cold-start emission model by integrating travel time at the link level, dynamic cold-start emission rates, and varying cold-start durations between HEVs and gasoline-powered vehicles (GVs) [39]. The most popular emissions and air dispersion prediction models, such as the Environmental Protection Agency’s (EPA’s) Motor Vehicle Emission Simulator (MOVES), MOBILE 6, COPERT, EMFAC, GREET, and TREM, have previously been used to predict emissions [40,41]. However, each model needs specific input requirements and compatibility constraints. The selection of the emission model in this study is based on the model’s ability to perform two essential tasks: the development of emissions rates using average annual daily traffic (AADT) and average travel speed, and the determination of pollutant concentrations using a dispersion model.
Several studies have been conducted to compare these models in terms of flexibility and efficiency [42,43]. Among the different emission simulators, MOVES is the most widely used in air quality analysis, as evidenced by the model’s efficiency in terms of simulating/estimating emissions for mobile sources at the national, county, and project level for air pollutants, GHGs, and air toxics. In addition, the data inventory in MOVES is specific to a US context and is used by many state agencies and regional commissions. It is also known for its ability to generate multiple types of output.
Even though vehicle emissions have widely been studied in the literature [6,14,17], there is not much emphasis on a comprehensive sustainability assessment of the two different vehicle operation systems, ICEVs and BEVs. This study endeavors to bridge these gaps in the literature and compares two scenarios: one with ICEVs and the other with BEVs. In addition, previous studies on vehicle emissions reduction have only focused on conventional vehicle or electric vehicle manufacture and combining green technology to reduce emissions. However, there is a need to focus on modeling the emissions from sources of power generation (power plants) to meet the charging demand of BEVs while accounting for transmission and distribution losses. The power-generating plant emission model is intended to be used by local and regional planners and policymakers at agencies. This will assist planners to accurately estimate the volume of power needed to charge BEVs, as well as to understand precisely the impact of emissions such as nitrogen oxides (NOx) and carbon monoxide (CO) by providing visualizations of existing baselines and future predictions associated with increased traffic volumes and the speed and number of vehicles. The development of such a model in any region can be achieved by analyzing vehicle emission rates for that region.
This study provides real-world evidence on the environmental impacts of two vehicle types, directly advancing environmental science, public health, policymaking, and economics. The study mainly focused on comparing emissions from vehicle operation systems, offering key insights for transportation policymakers, environmental specialists, and urban planners. By highlighting the potential of sustainable vehicle operation systems to reduce emissions and improve public health, this research supports the transition to clean mobility, promoting investments in sustainable transportation and aligning with global efforts to mitigate air pollution and enhance quality of life. The main objectives of this study were as follows:
  • To evaluate and compare the emissions associated with internal combustion engine vehicles (ICEVs) and battery electric vehicles (BEVs), including emissions from power plants used for BEV charging, by modeling power generation and distribution processes.
  • To investigate the seasonal and spatial variation in ICEV emissions.
  • To identify emissions from both vehicle types and analyze various scenarios to assess their environmental impact.

2. Research Approach

This section briefly explains the detailed methodology used to assess the two different vehicle scenarios. To keep any region’s air quality within the thresholds established by NAAQSs, it is required to carry out both planning and voluntary control implementations onsite. This study is mainly focused on the San Antonio region as a region that started ringing with such alerts as early as 1994, when the Alamo Area Council of Governments (AACG) arranged for the air committee meeting that requested the first emissions inventory for the region to address air quality issues. In addition, this study motivates planners and decision-makers to measure the effects of various traffic management strategies on the volume of pollutants and, thereby, makes it possible to assess the impact of vehicle movement on communities located along corridors. To calculate the dispersion of pollutants in the atmosphere, the model first requires emissions rates corresponding to the average speed and AADT for a particular corridor. The emissions rate models from the literature review, such as MOVES, MOBILE 6, COPERT, EMFAC, GREET, and TREM, have been taken into consideration. The Motor Vehicle Emissions Simulator (MOVES) was recommended by the EPA. MOVES is the most effective tool for developing emissions rates, offering an advanced emissions calculator with extensive databases of default temperature and climate values, along with the annual Vehicle Mile Traveled (VMT) data from across the United States. It also enabled the calculations of emissions rates per mile of travel and organized them into specific speed categories. Therefore, in this study MOVES has been selected to be the emission rate estimation tool. The specifications of various parameters used in the development of emissions rates using MOVES are shown in Table 1.
The initial step involved identifying the total emissions for the different routes identified in Table 2. The hourly vehicle flow through each link was calculated and the AADT for each route was divided by 24 to estimate hourly traffic. The average vehicle density (vehicles per kilometer) on each route was determined; the hourly traffic was divided by the link speed. The emissions rate for a link in grams per kilometer was estimated; the average vehicle density was multiplied by emissions rates from MOVES. Four highways in San Antonio with several road segments were selected for analysis and the emissions rates were estimated by considering them to be restricted rural highways, as summarized in Table 2. Following the previous steps, emissions rates were computed for several highways.
Scenario B focuses on evaluating power plant emissions by considering electricity power generation for EVs at charging stations. To calculate emissions rates for this scenario, it was assumed that the entire charging demand is located at the centroid of the study area for simplicity. The subsequent step involved calculating the power demand while accounting for transmission and distribution losses. For this purpose, the distance from each power plant to the centroid of the study area was computed. The volume of power lost in transmission (T) and distribution (D) was also assumed. The volume of emissions was calculated by multiplying the distance from the center of the study area to the power plant and by multiplying by the emission type percentage obtained from the portfolio of the study area. The resultant value is further multiplied by the emission type’s emissivity.
The analysis was performed assuming 100% BEV penetration, which may not reflect the near- to mid-term BEV inclusion scenario. However, this percentage was selected to evaluate the full potential impact of BEV integration into the transportation system. This approach will provide a clear understanding of the full impact of BEV penetration at different levels. This percentage was selected based on several reasons, including: (1) Identification of the maximum system impacts, because a 100% BEV scenario will help to identify the most extreme implications on different parameters such as transportation infrastructure, energy demand, and traffic emissions. These insights are valuable for long-term planning and understanding system resilience. (2) Establishing a reference point or benchmark for future comparisons. By doing this, other penetration levels such as those of 30–50% can be compared in future work. (3) Helping policymakers, engineers, and planners with their decision-making as they often need to prepare for eventualities rather than probabilities. A full-penetration scenario illustrates what infrastructure, regulatory, or technological developments might be required if adoption accelerates more rapidly than expected.

3. Data Collection

3.1. Study Area

This study focused on the City of San Antonio, Texas, USA. Therefore, this section provides general background on the San Antonio region. Several sectors can influence air quality, such as real estate, transportation, energy, solid waste treatment, power generation, and wastewater treatment. The transportation sector is the second most contributing sector to GHG emissions, with 28 percent of the total GHG emissions in the USA [44]. In the US, there are three main electric power grid networks, namely, the East Coast, West Coast, and Southwest. Texas has its own grid network. Briefly, if there are disruptions in the East or West Coast grids, Texas will not be significantly impacted. The San Antonio region is a south-central part of the state of Texas. It is considered the fastest growing city with a booming economy and a growing population. It is the second-largest city in Texas and the seventh-largest city in the nation. With its growth, new challenges for transportation will emerge; therefore, meeting the travel demand and maintaining good air quality are among the major concerns for transportation planning agencies. San Antonio is in Bexar County, which is centrally located in the 13-county AACOG region. The metropolitan statistical area includes Bexar and seven surrounding counties. Figure 1 shows the city of San Antonio and its road network.

3.2. Vehicles’ Emissions Scenarios

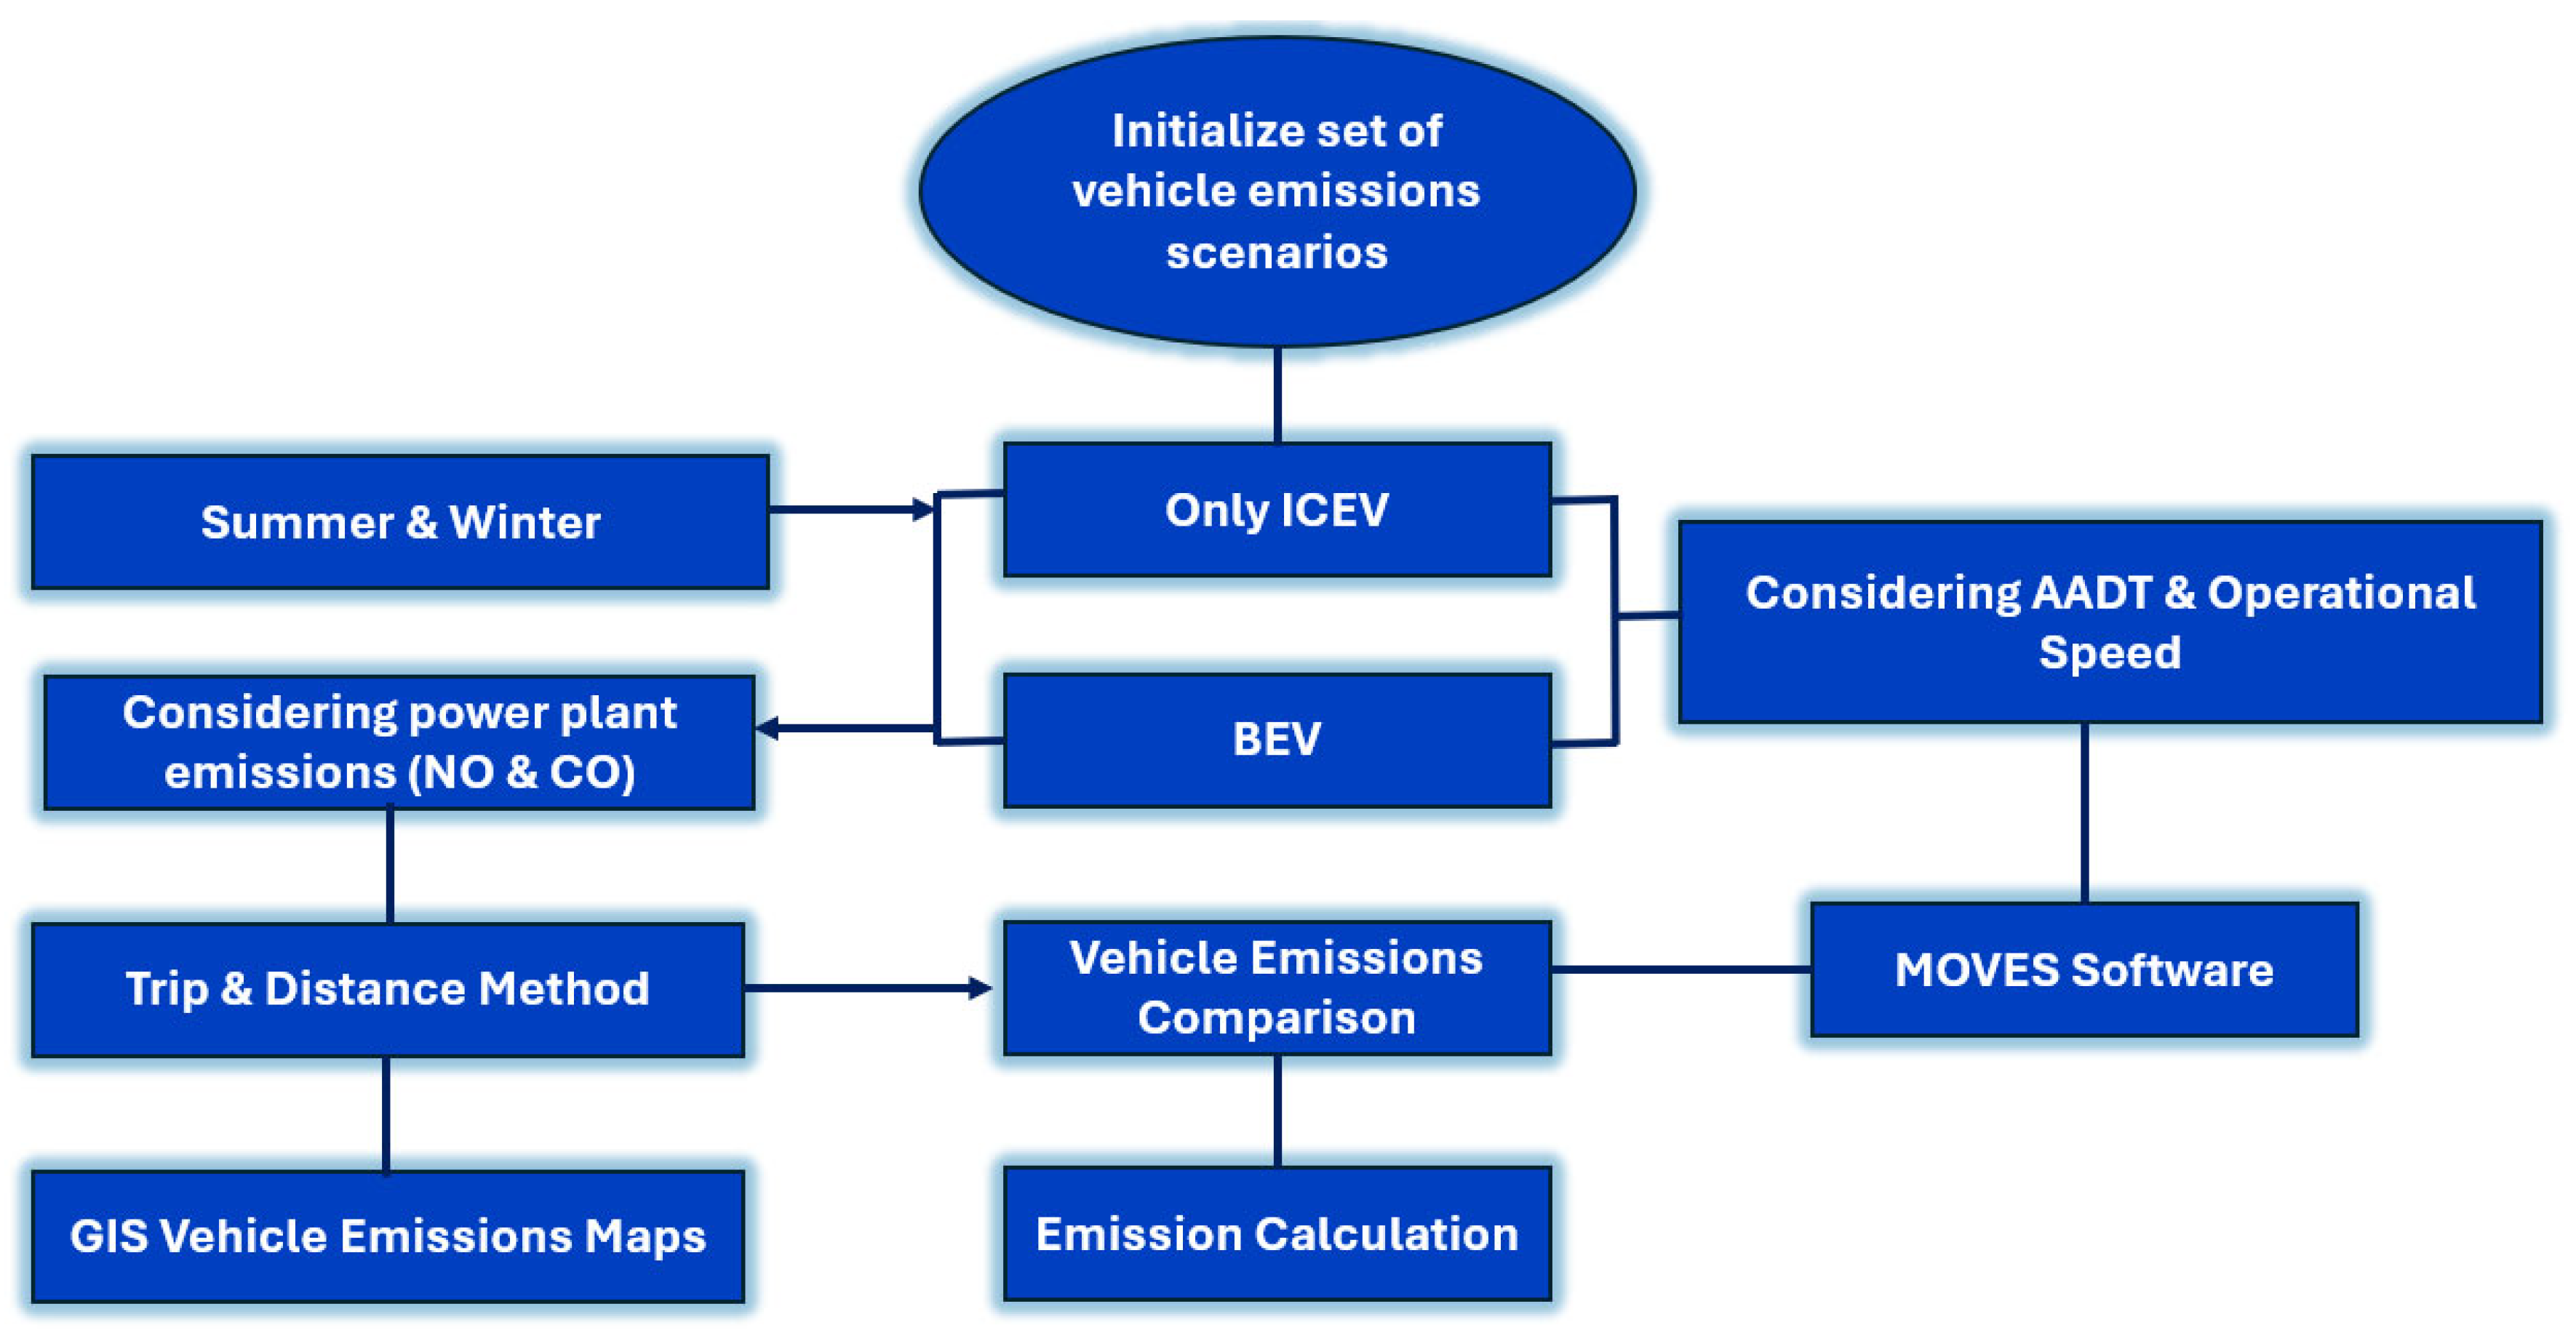
Two scenarios were considered for computing and comparing vehicle emissions, these being Scenario A, which considers only ICEVs, and Scenario B, which assumes all vehicles are BEVs (100% market penetration by BEVs). Scenario A was split into two groups (AW and AS), accommodating the seasonal traffic conditions from winter to summer. Computational experiments were carried out and assumed that January and July are the representative months of winter and summer, respectively. For the sub-scenarios of A (i.e., AW and AS), the US-EPA simulator MOVES was used to compute vehicle emissions. For Scenario B, emissions from the power generation plants were calculated by using the trip and distance relationship. Figure 2 depicts the research roadmap.

3.3. Data Sources and Analysis

3.3.1. General Portfolio for Power Generation

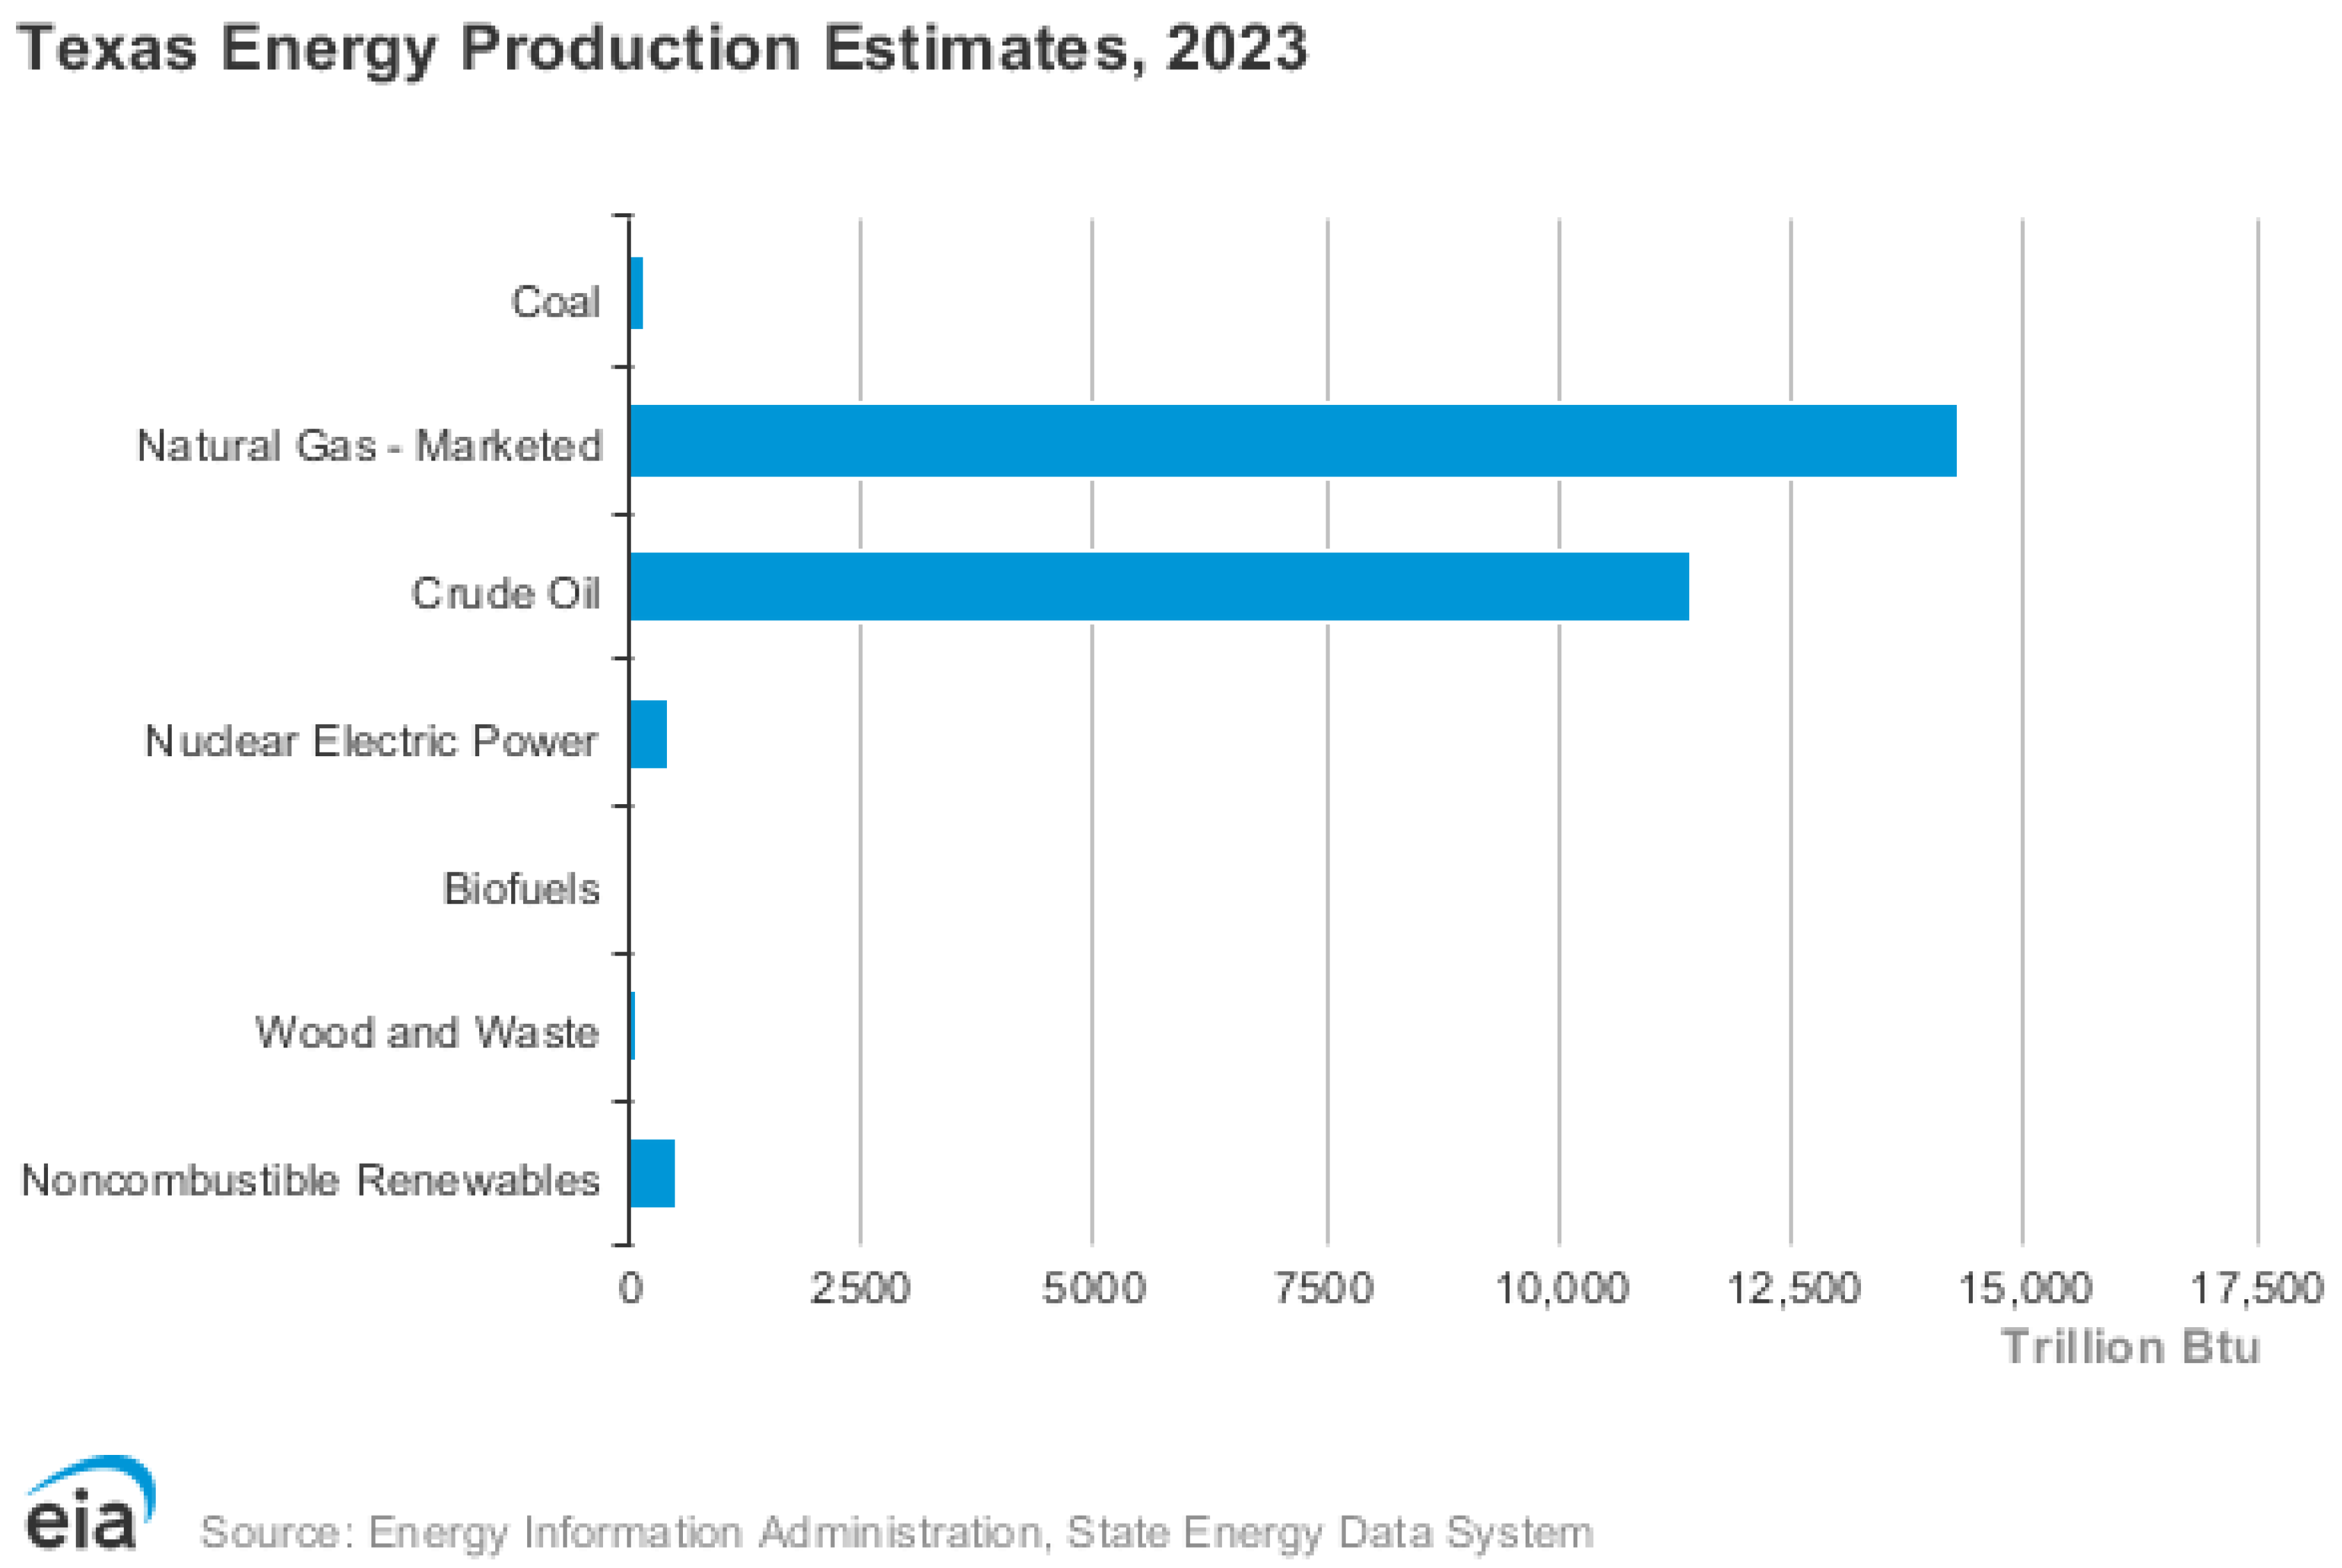
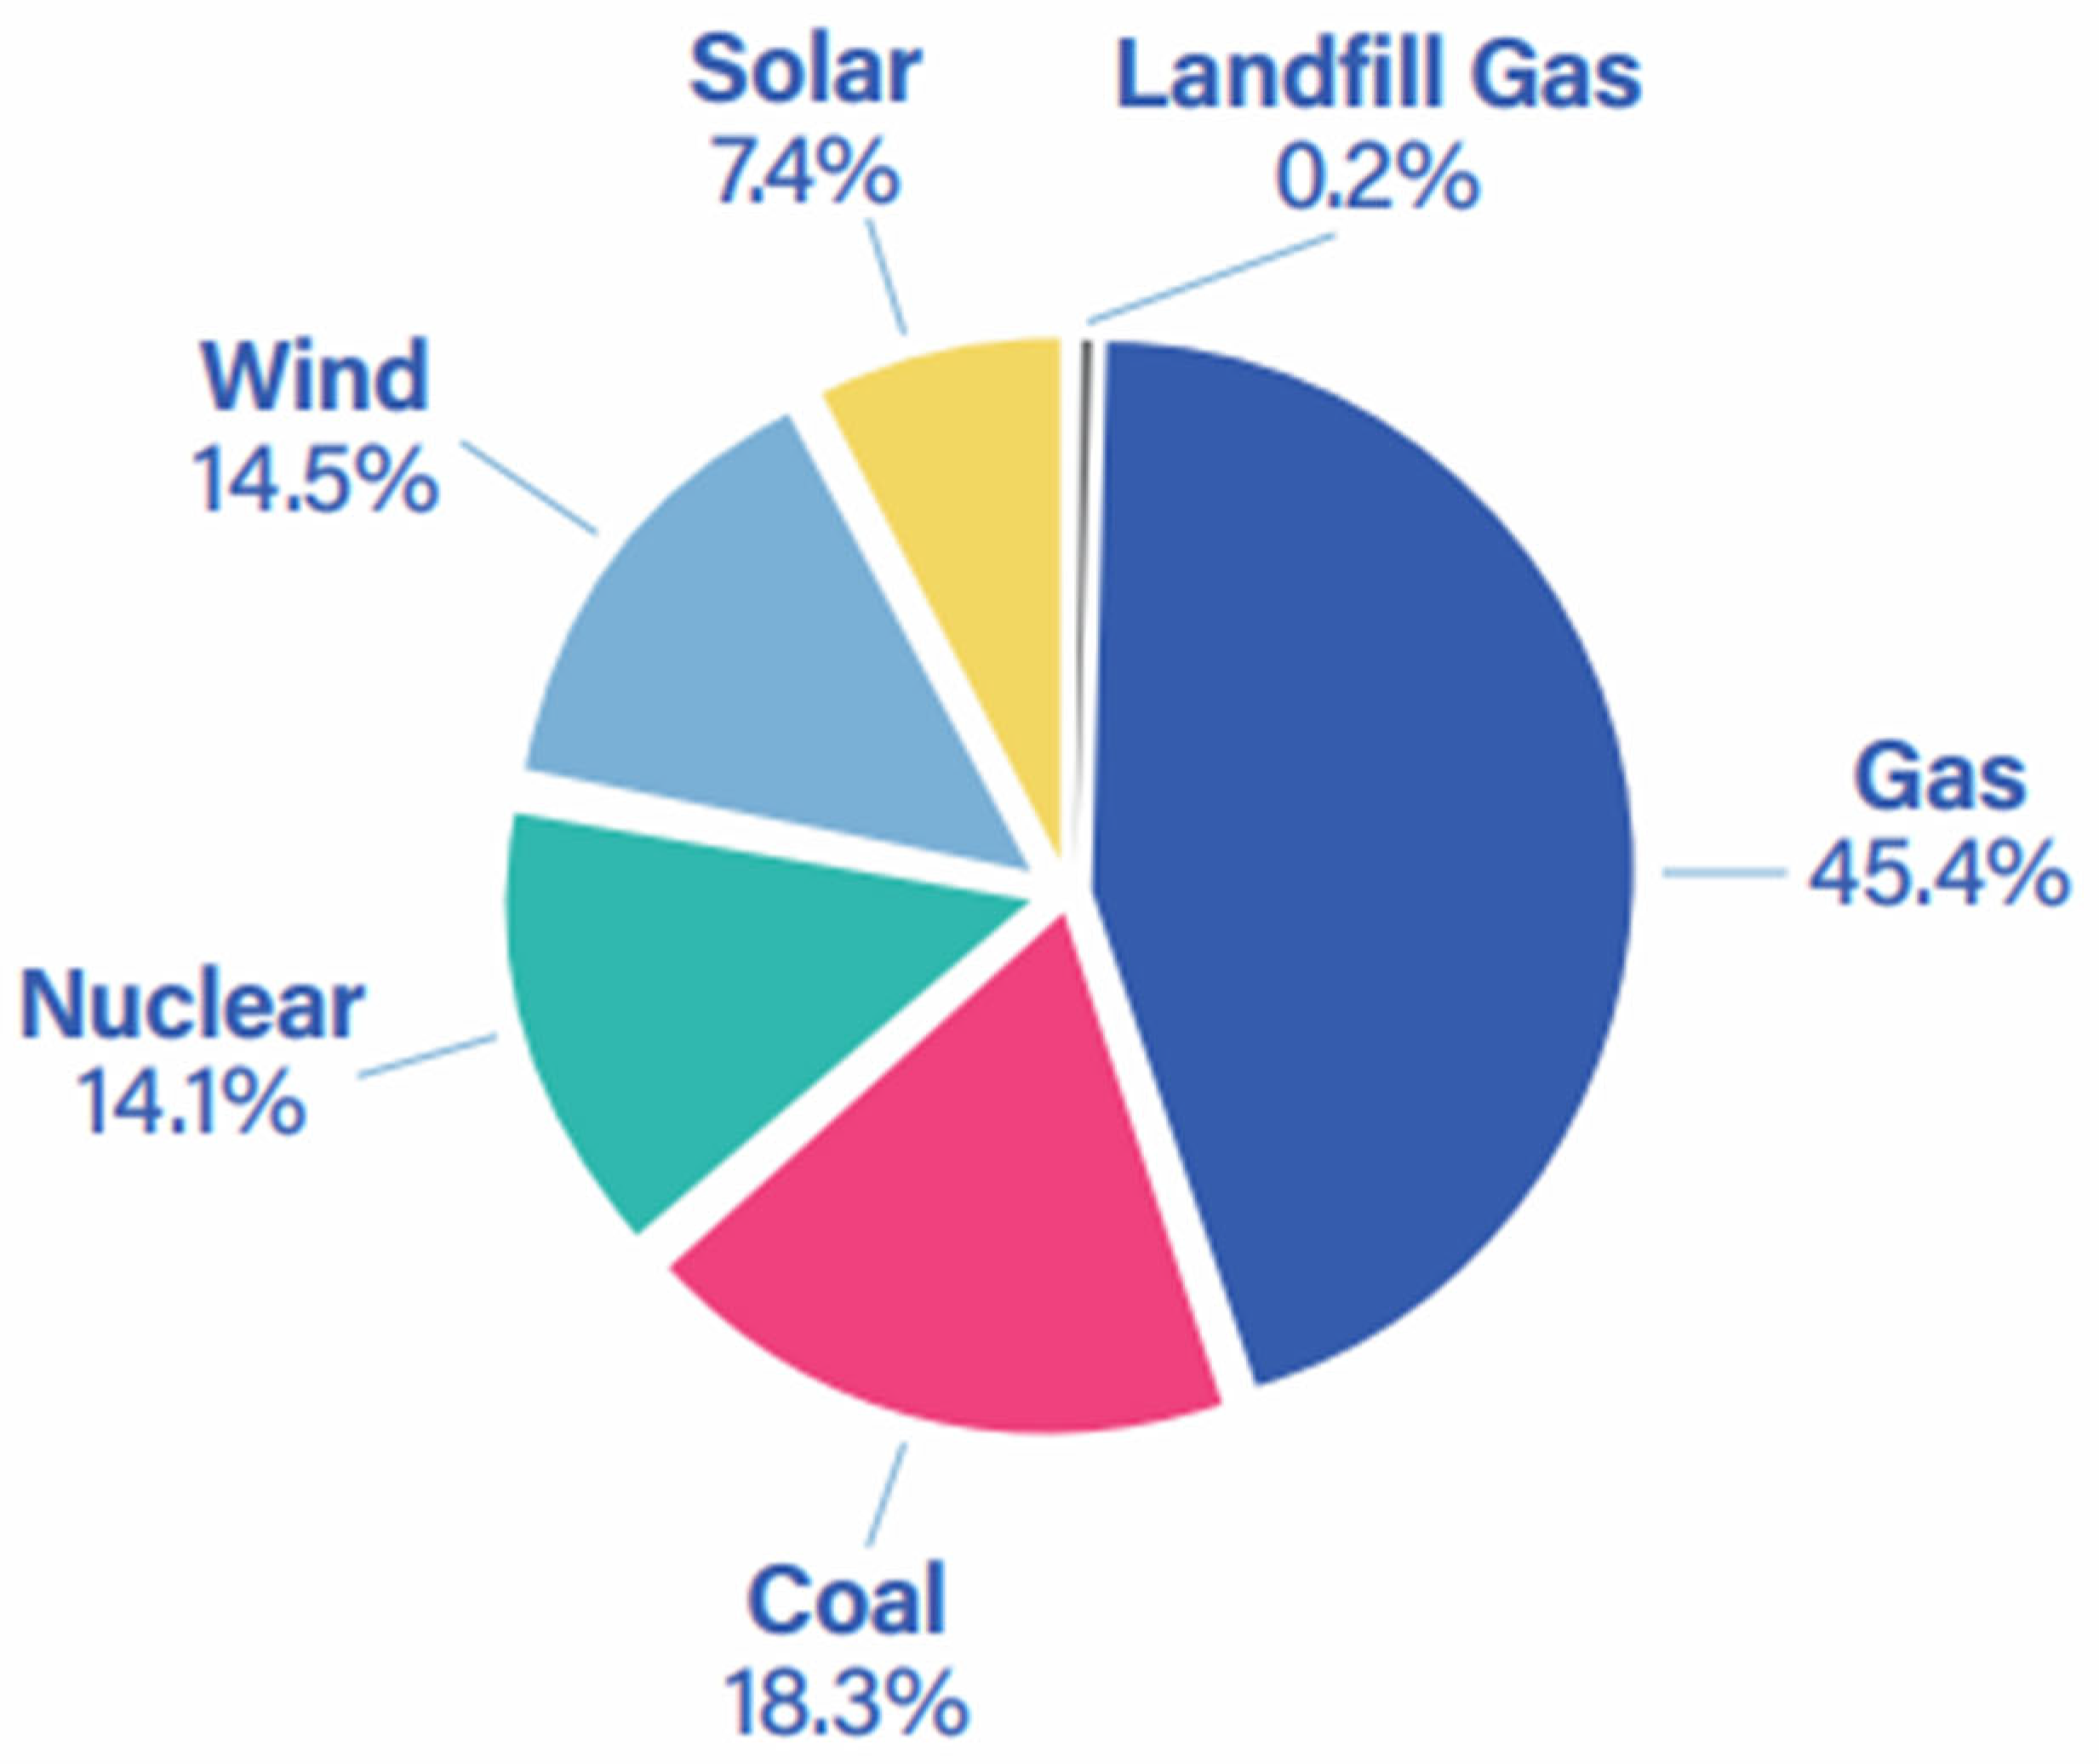
In terms of power plant generation, natural gas and coal are the two most critical contributors to power plant emissions. However, renewable energy sources (i.e., solar and wind) have negligible emissions or no emissions. Unlike fossil fuels, renewable energy is considered a clean energy source and does not directly produce carbon dioxide (CO2) when generating electricity, resulting in very low emissions at the point of generation. It is imperative to review the sources of power generation in Texas as well as San Antonio as the main study area. Texas power production estimates are shown in Figure 3. It is exhibited that natural gas is the most contributing source for power generation, followed by crude oil, renewable energy, coal, nuclear, and biofuels. In the city of San Antonio, the natural gas contribution was approximately 45.4%, followed by coal (18.3%), nuclear (14.1%), renewable sources (wind, 14.5% and solar, 7.4%), and landfill gases (0.2%) (Figure 4).

3.3.2. San Antonio Power Plants

San Antonio has 12 power generation plants; five were considered as San Antonio’s top climate polluters (see Table 3 and Table 4). The other five are mainly renewable resources (solar power generation plants with no emissions) (Table 5). Also, the remaining two (J K Spruce, and Covel Gardens Gas Recovery) were not classified as top polluters. This data was collected for the year 2018 [45].

3.3.3. Emissions Calculation

The MOVES model integrates vehicle population information to classify the vehicle population into source bins. These bins are defined by vehicle source type, fuel type, regulatory class, model year, and age.
  • The model uses vehicle characteristics and activity data such as VMT, speed, idle fractions, and driving cycles for each bin to estimate the source hours in each running operating mode.
  • Each source bin and operating mode is linked to an emissions rate, and these are multiplied by source hours, adjusted as needed, and summed to estimate the total running emissions. Based on the pollutant and vehicle characteristics, MOVES could adjust the running emissions to take into consideration the local fuel parameters including heating and air conditioning effects, ambient temperature, humidity, and electrical charging losses [46].
The traffic data was obtained from the Texas department of transportation (TxDOT) website, includes operational speed for weekdays for different roads in San Antonio, and provides the real-time traffic speed on some main highways in San Antonio. In addition, the AADT was used to determine the volume of emissions while TxDOT stored the traffic data in GIS layers for the city of San Antonio. The AADT data were sourced for various highways in San Antonio from the Texas Highwayman website.

4. Results

4.1. Development of Emissions Rates

4.1.1. Scenario A—ICEV-Only Base Case

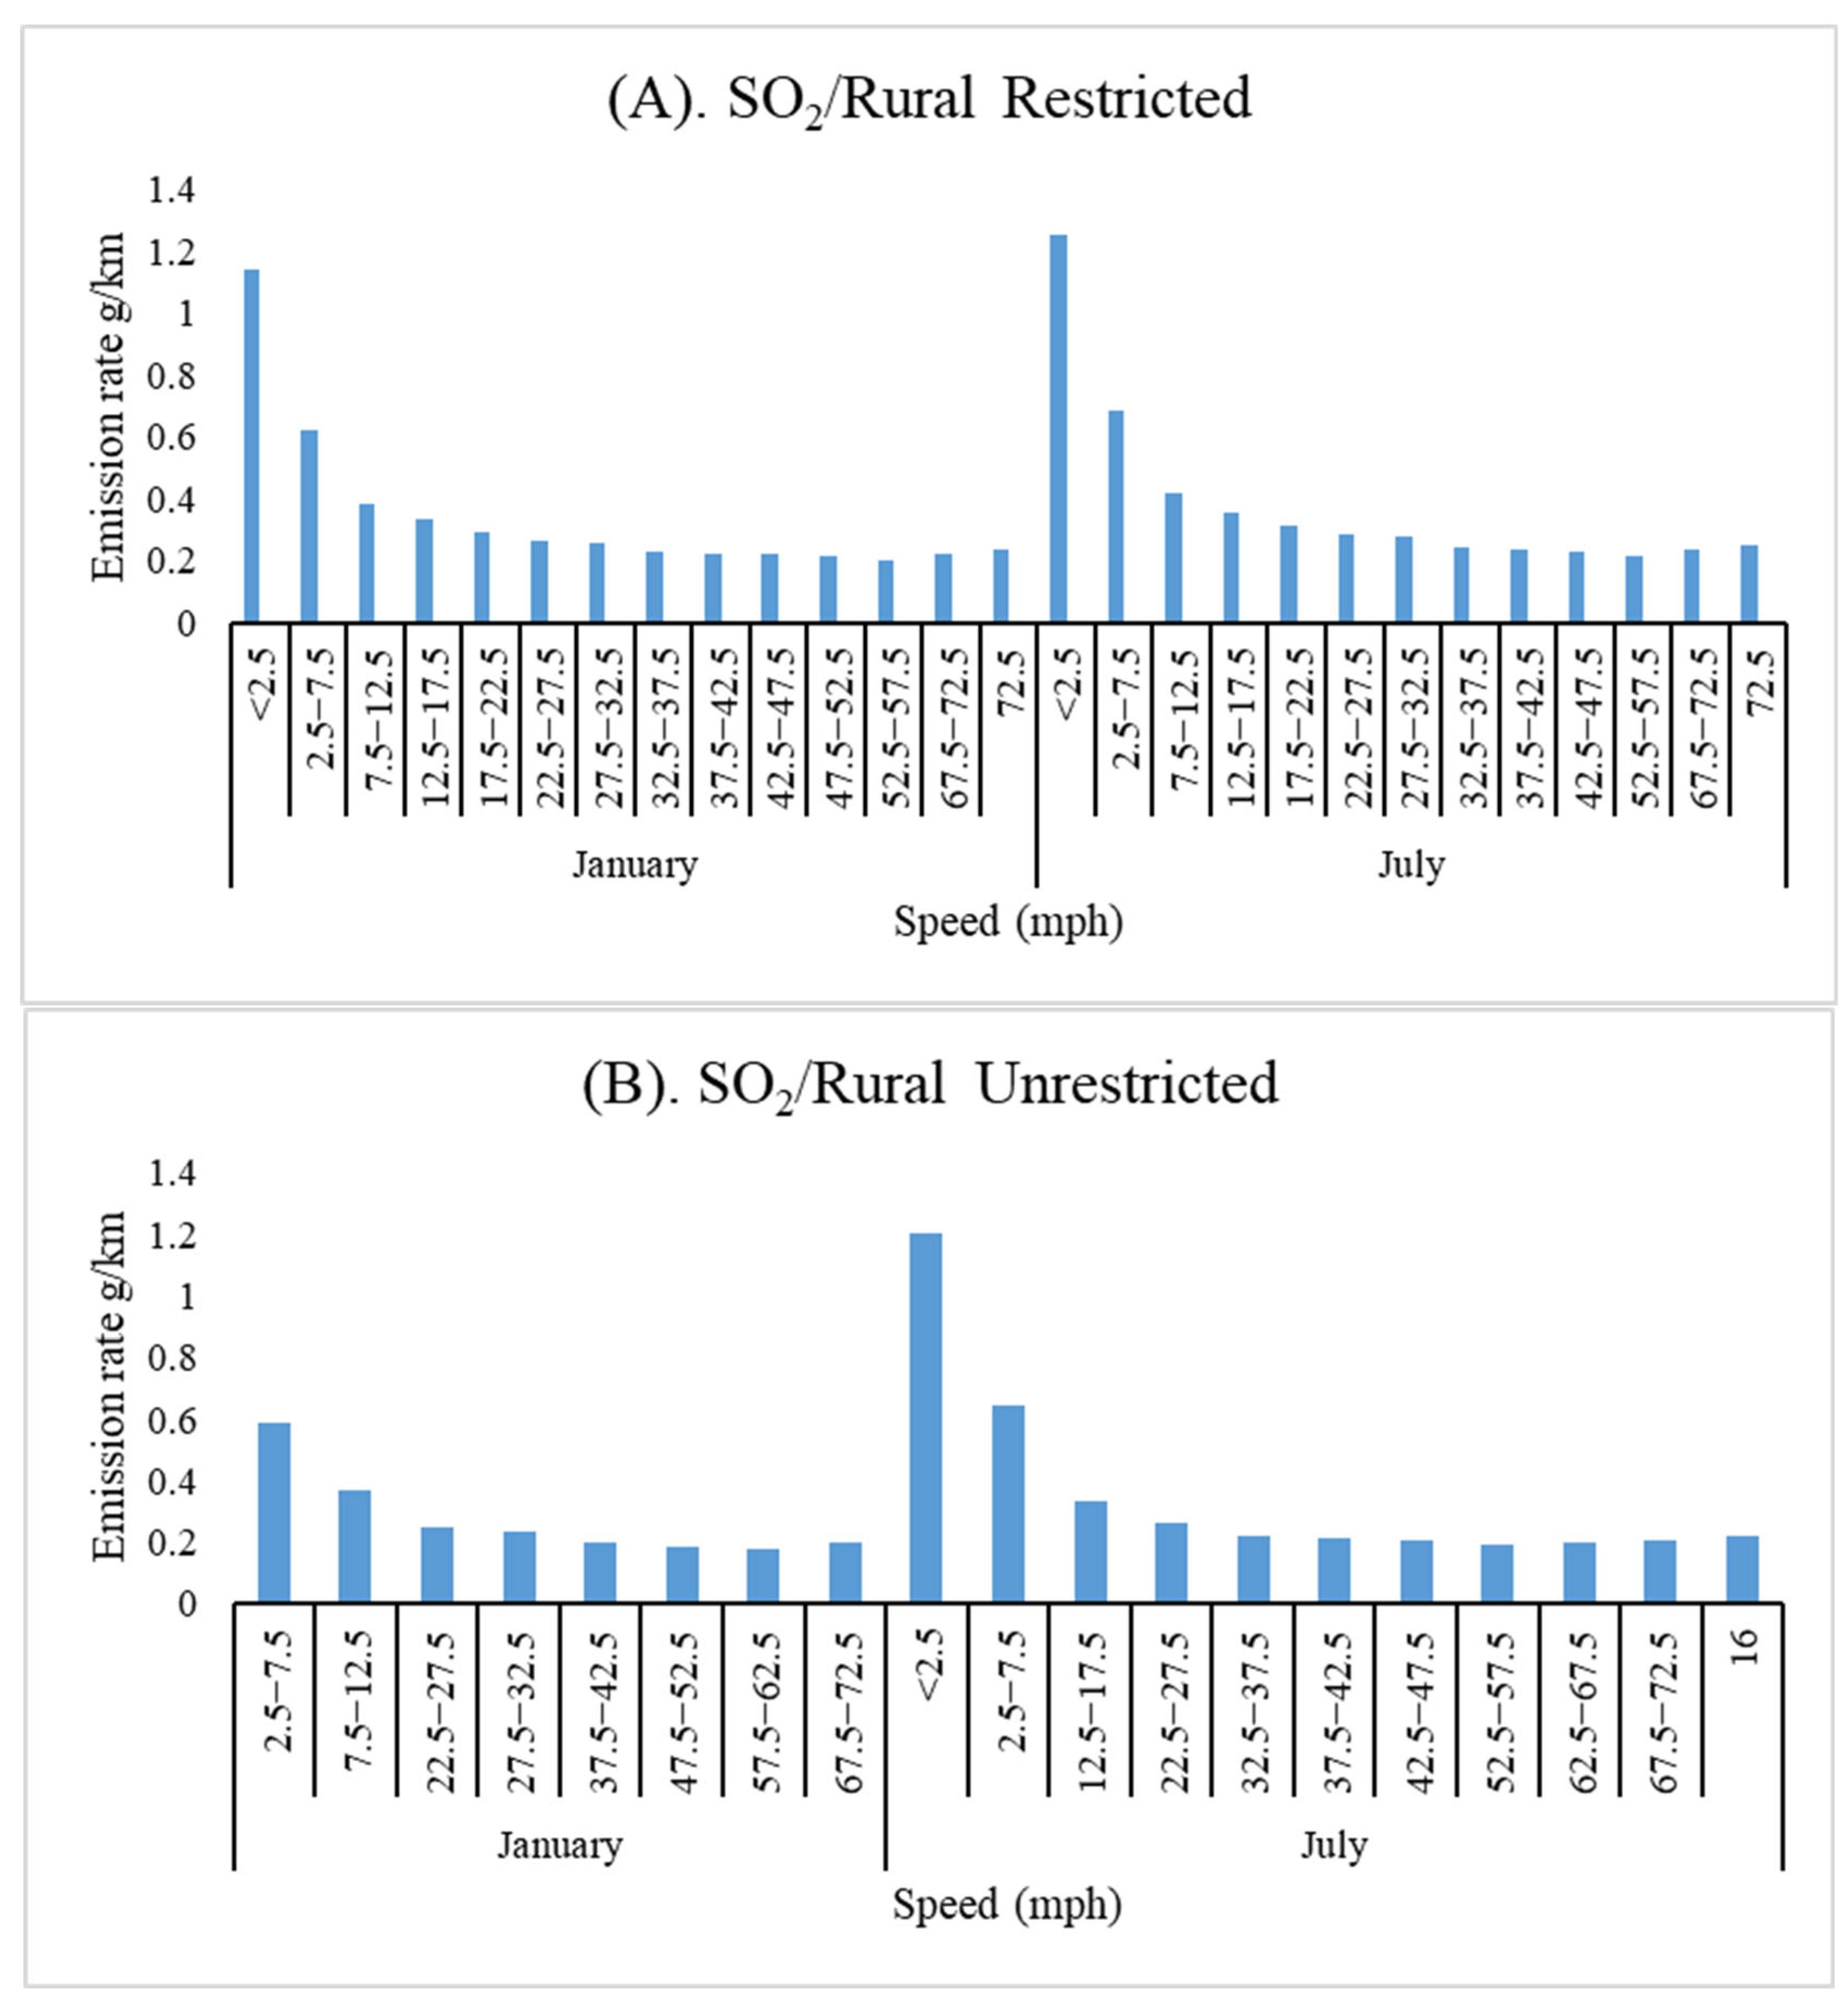
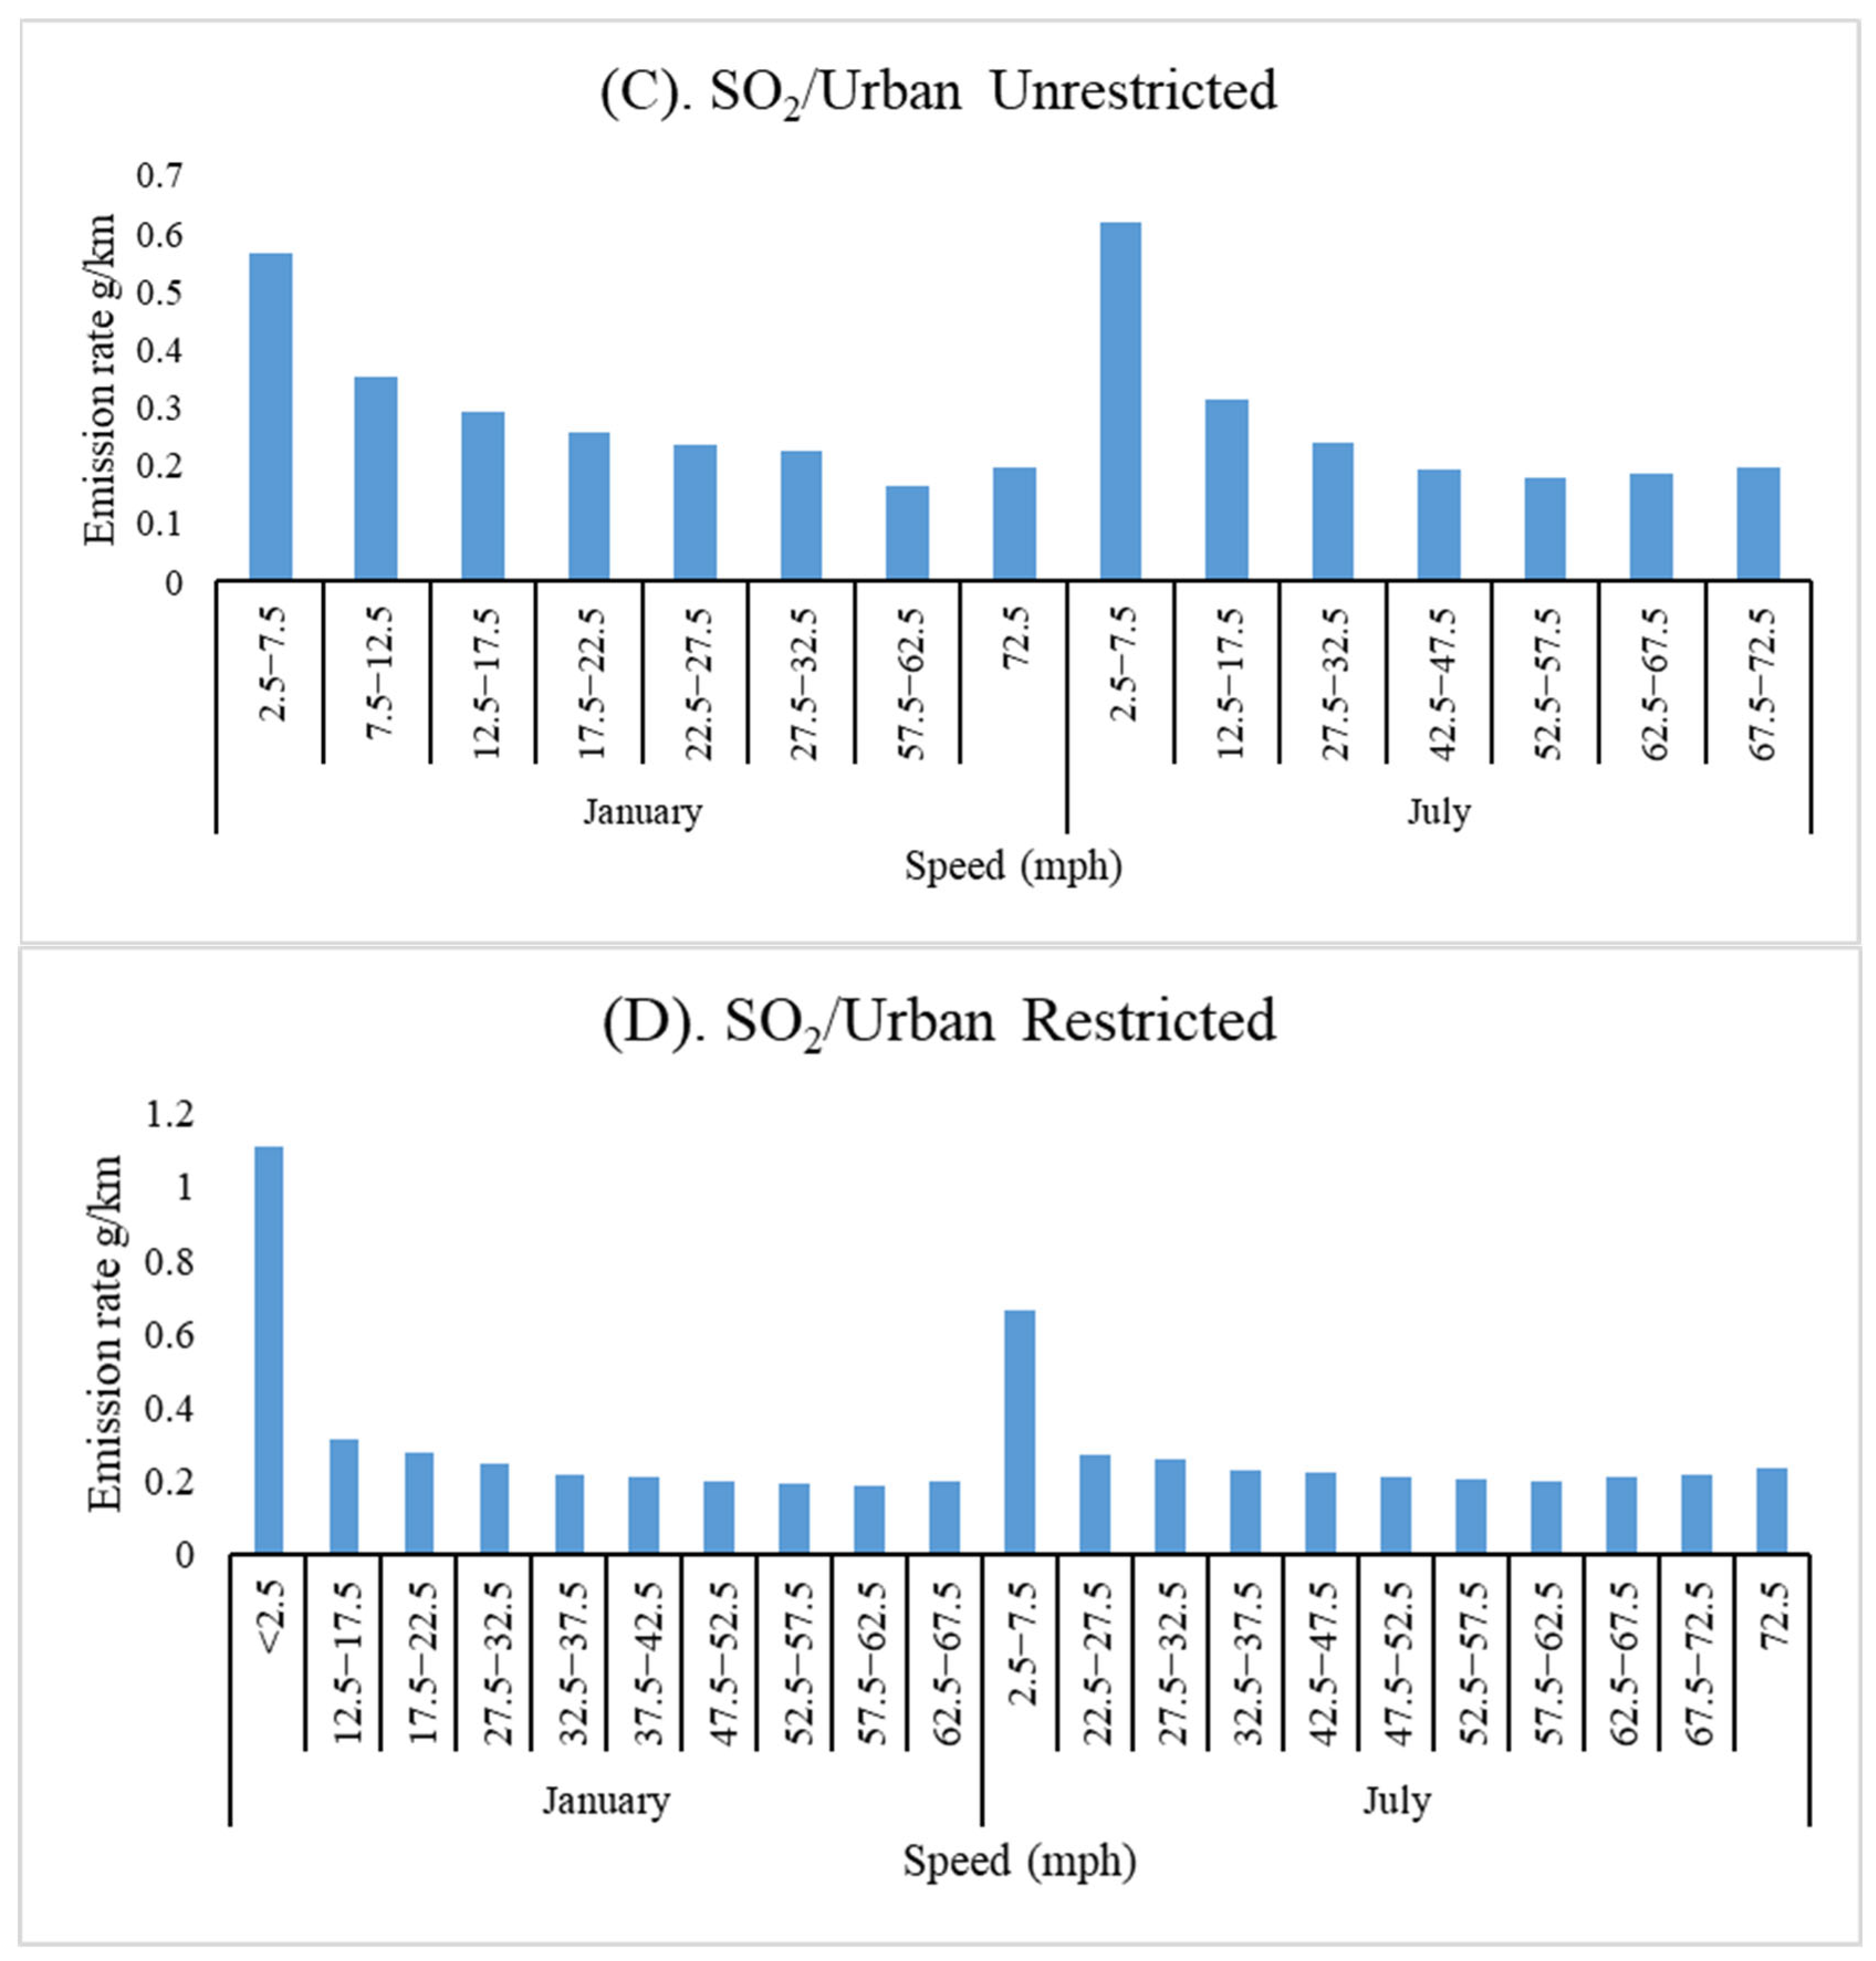
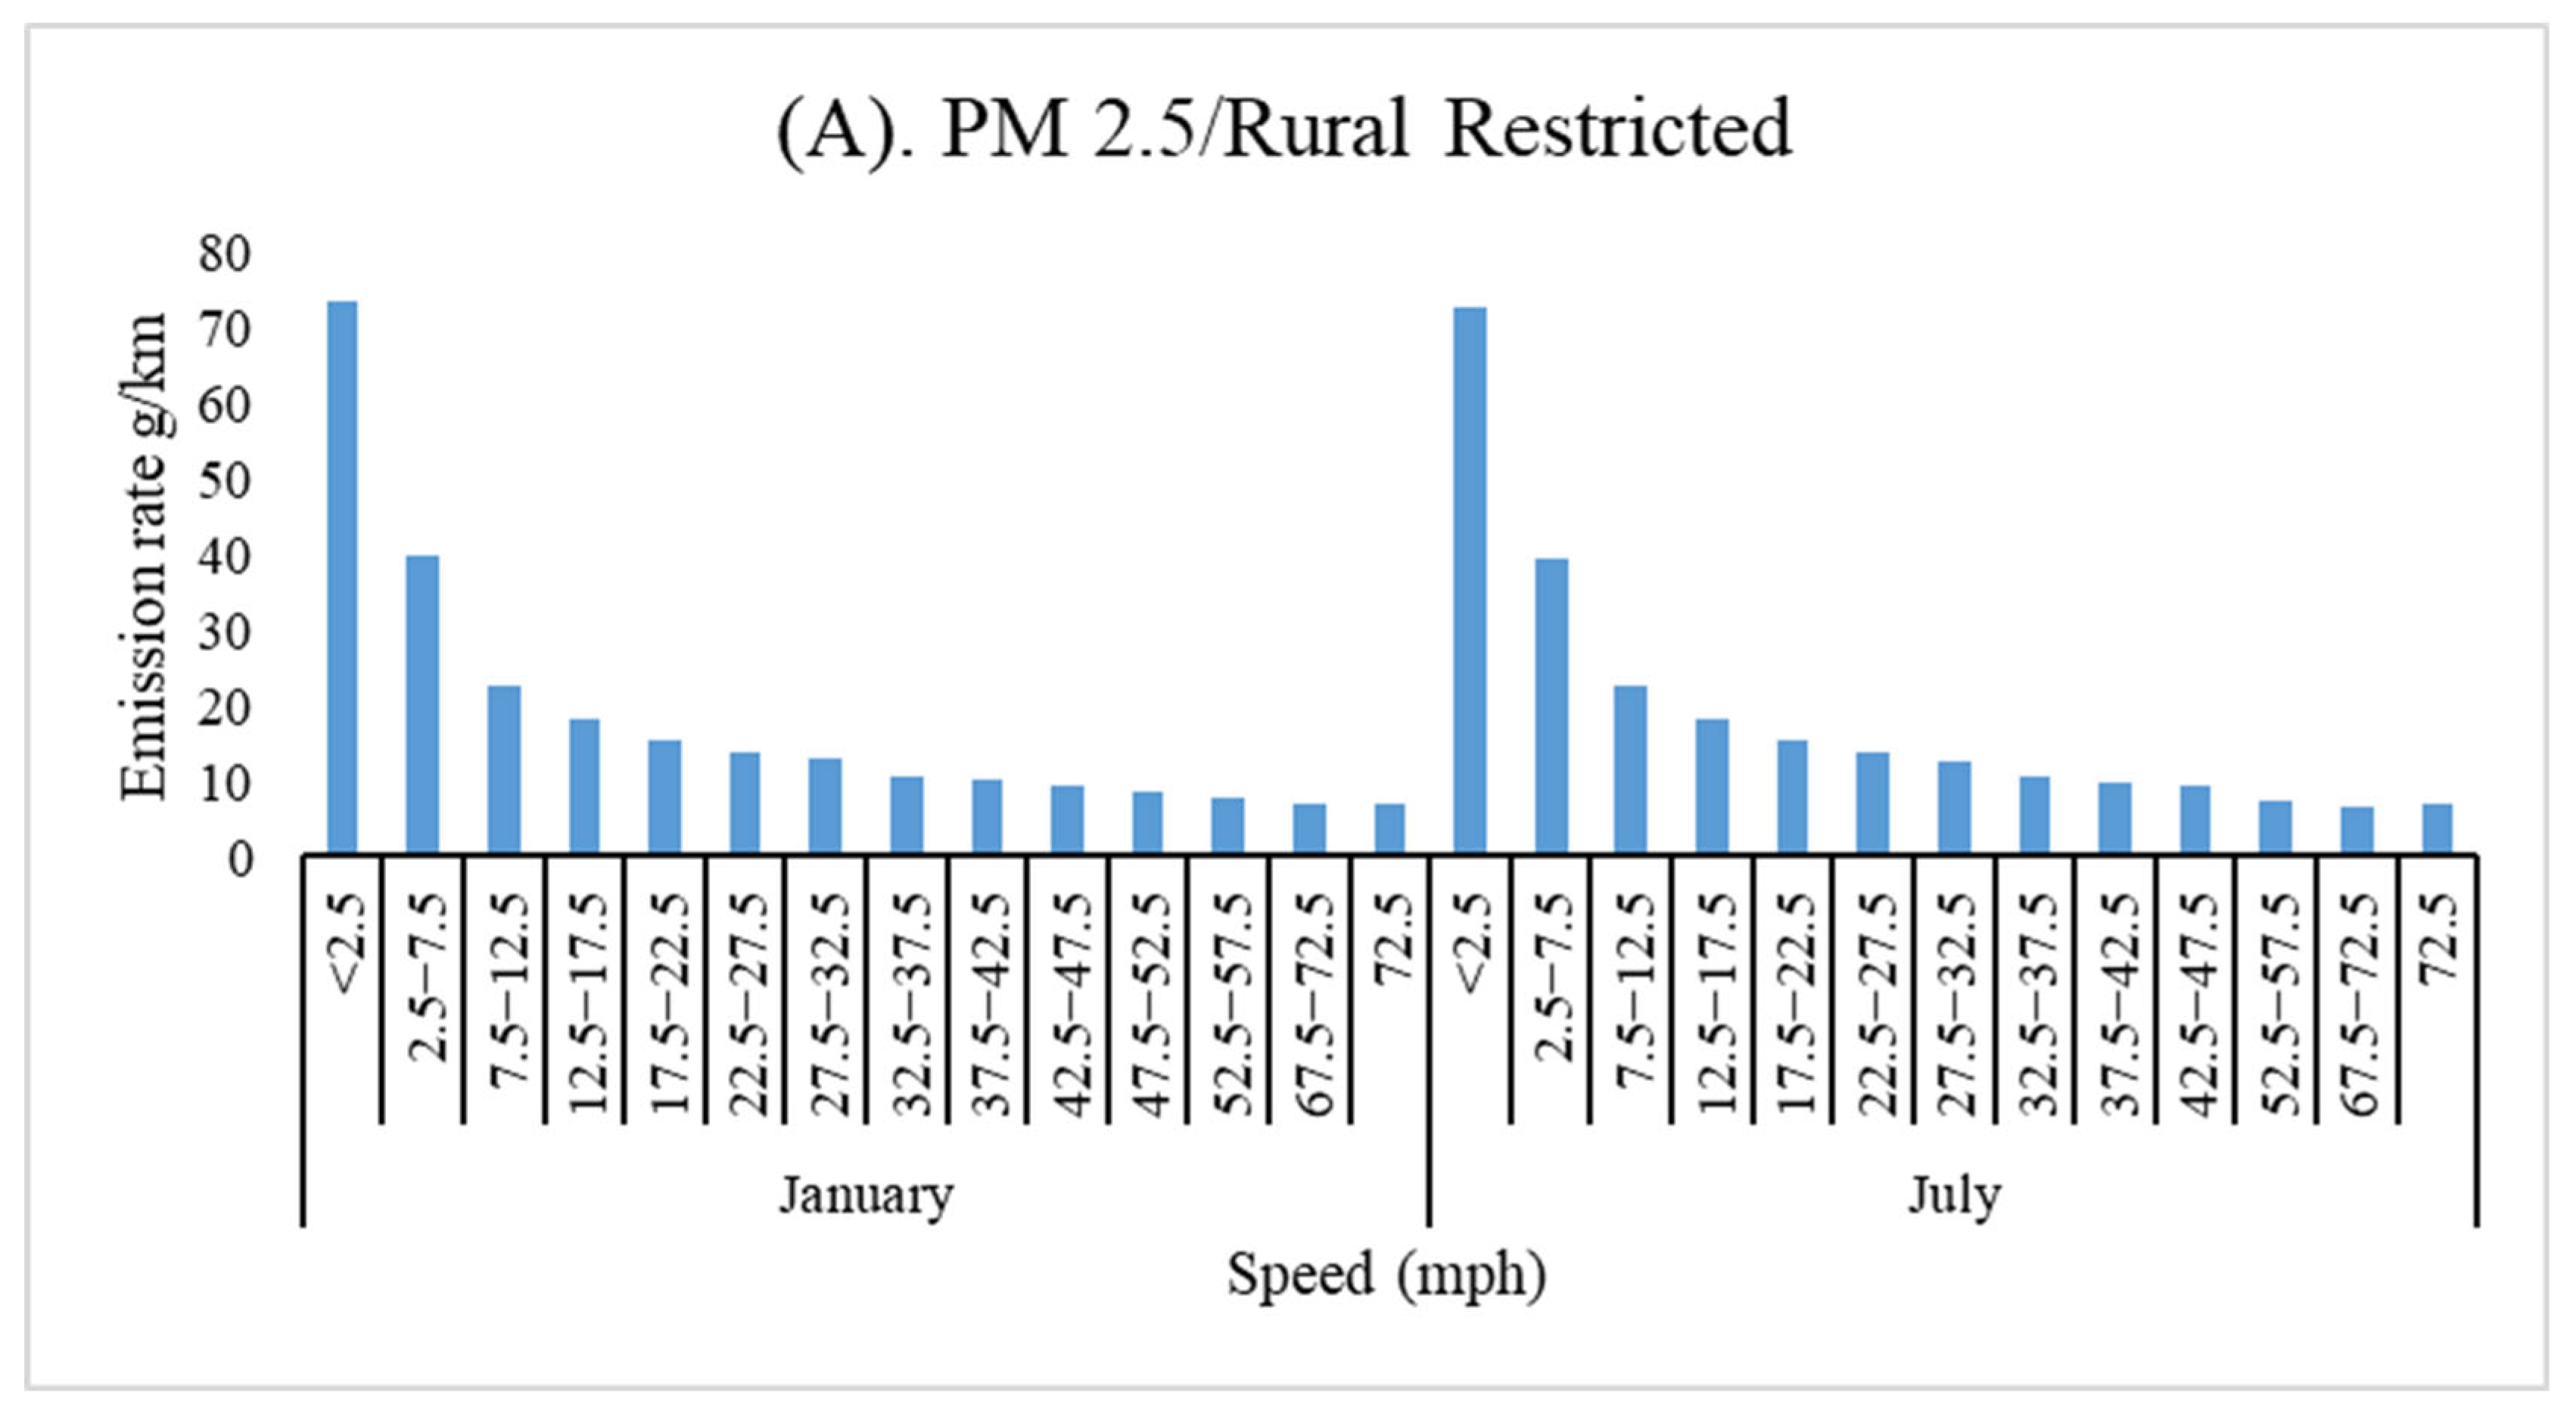
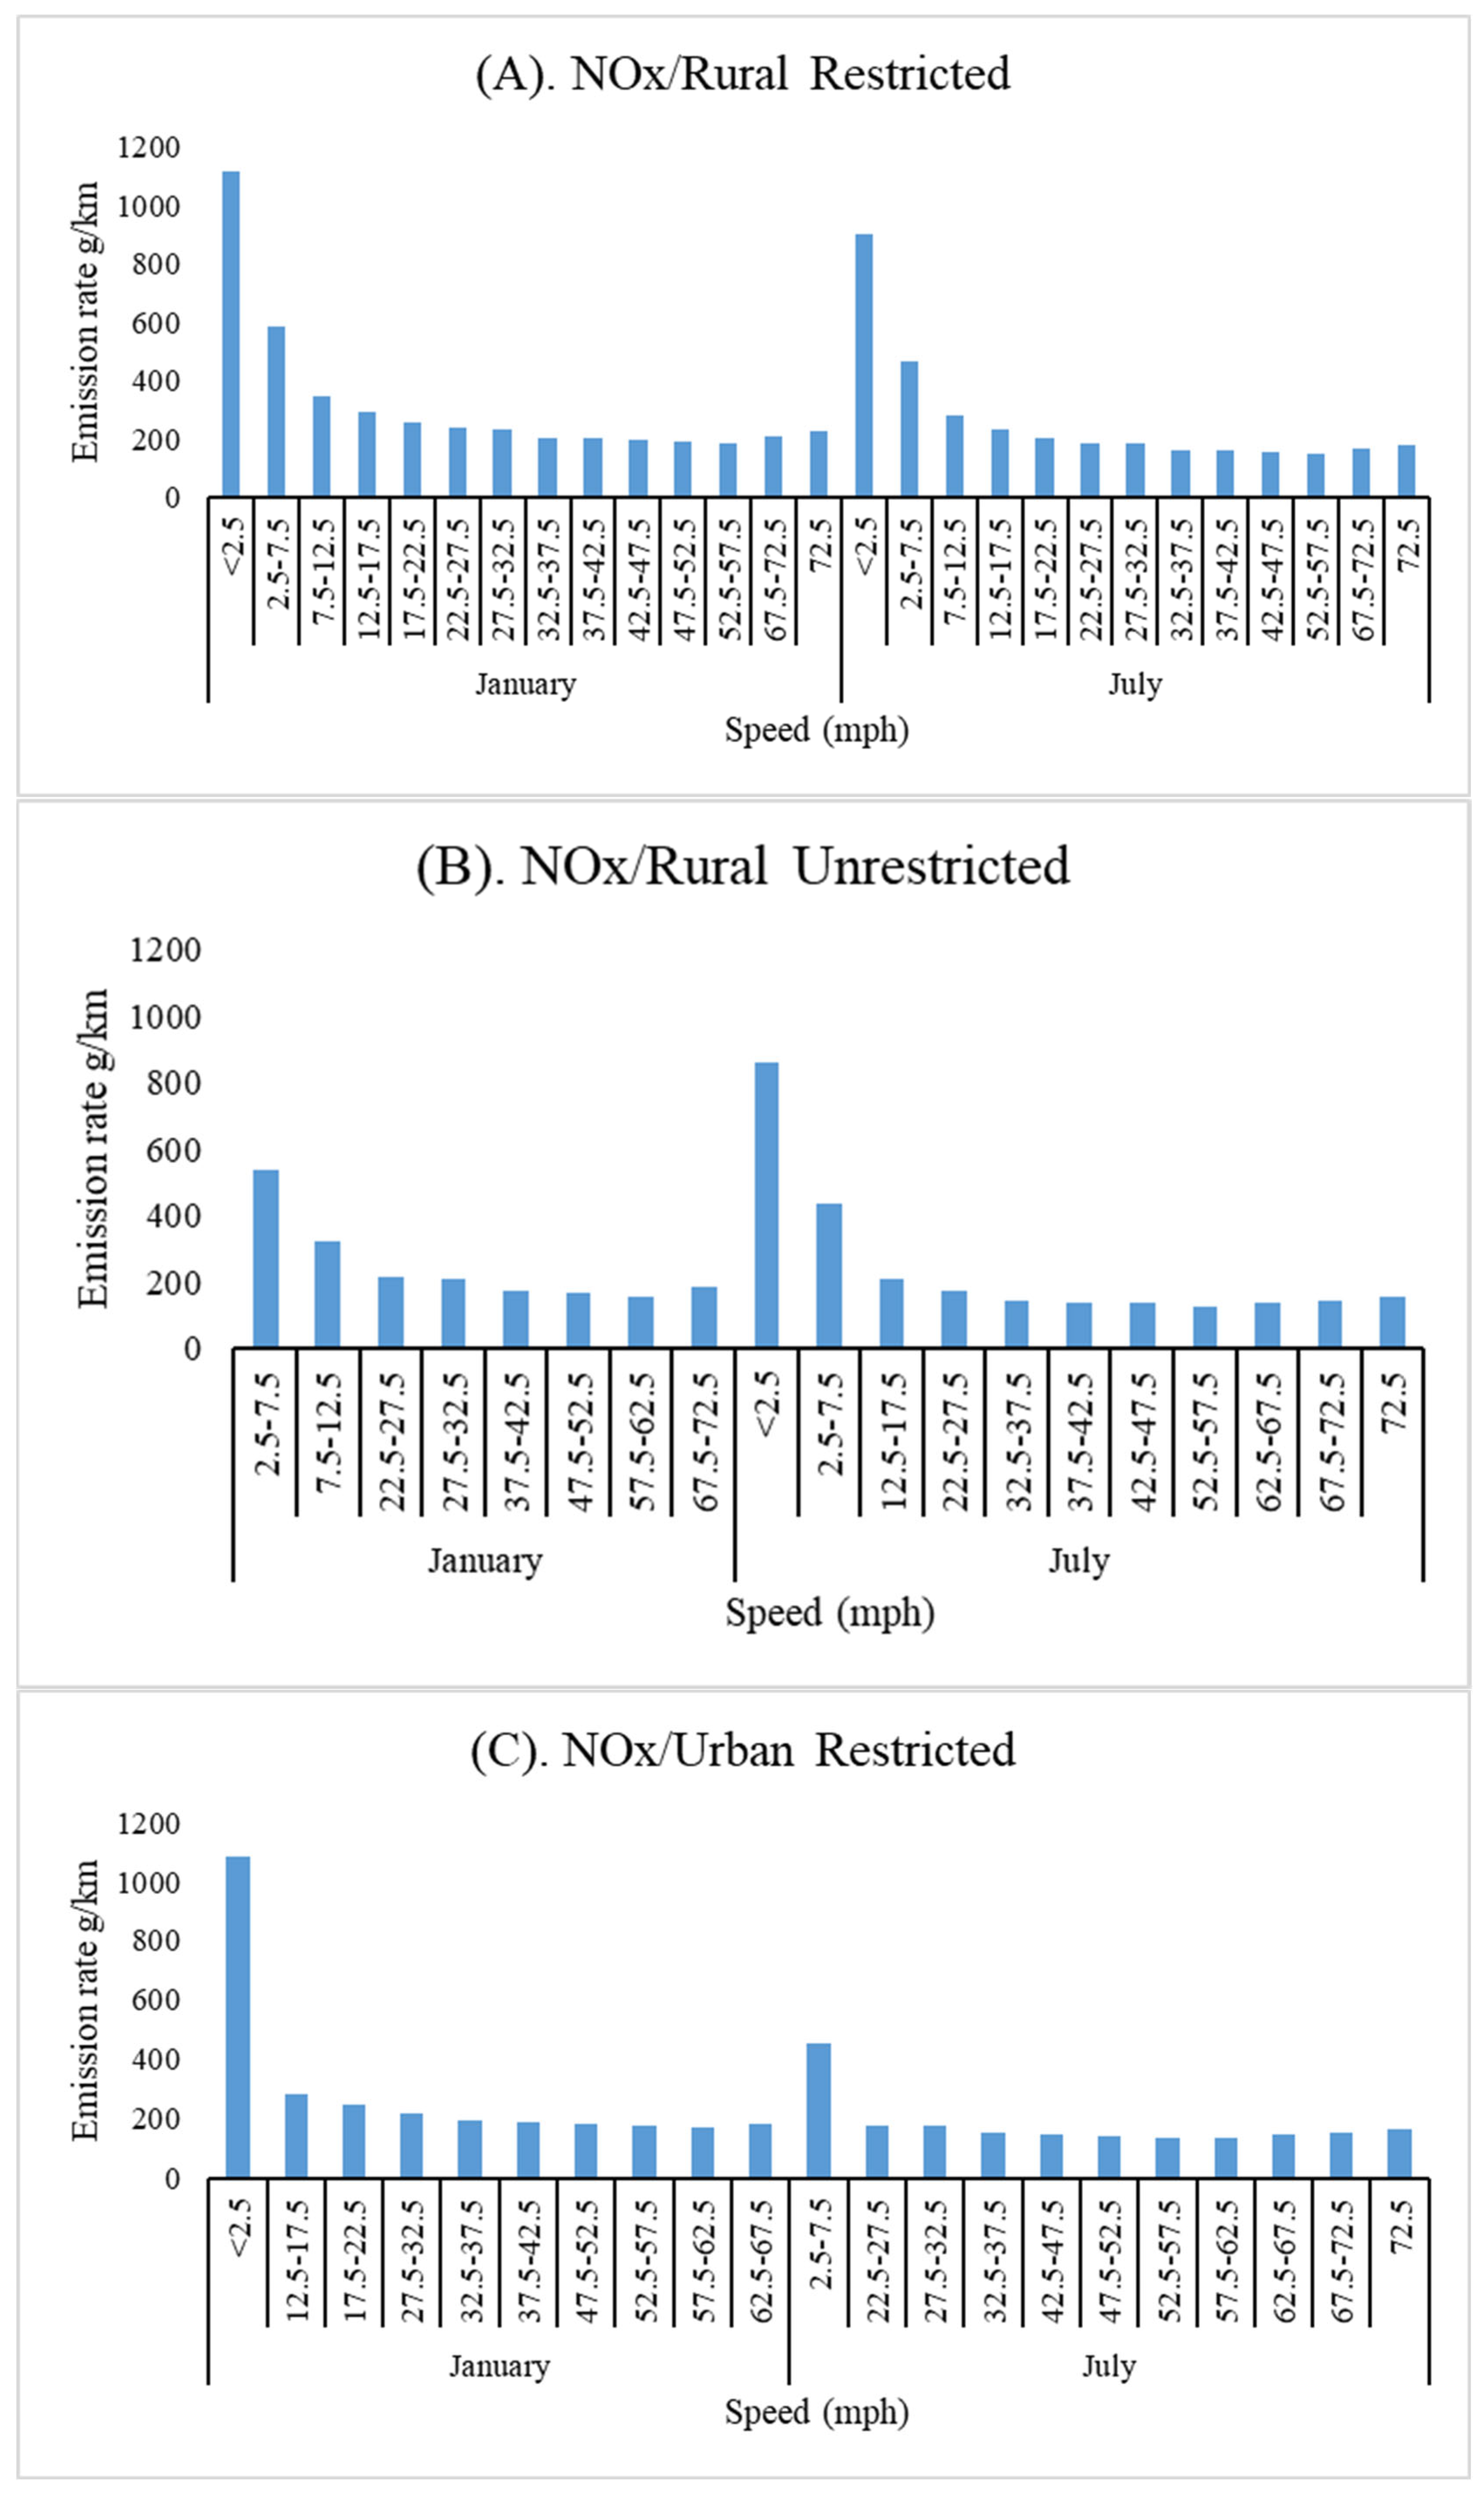
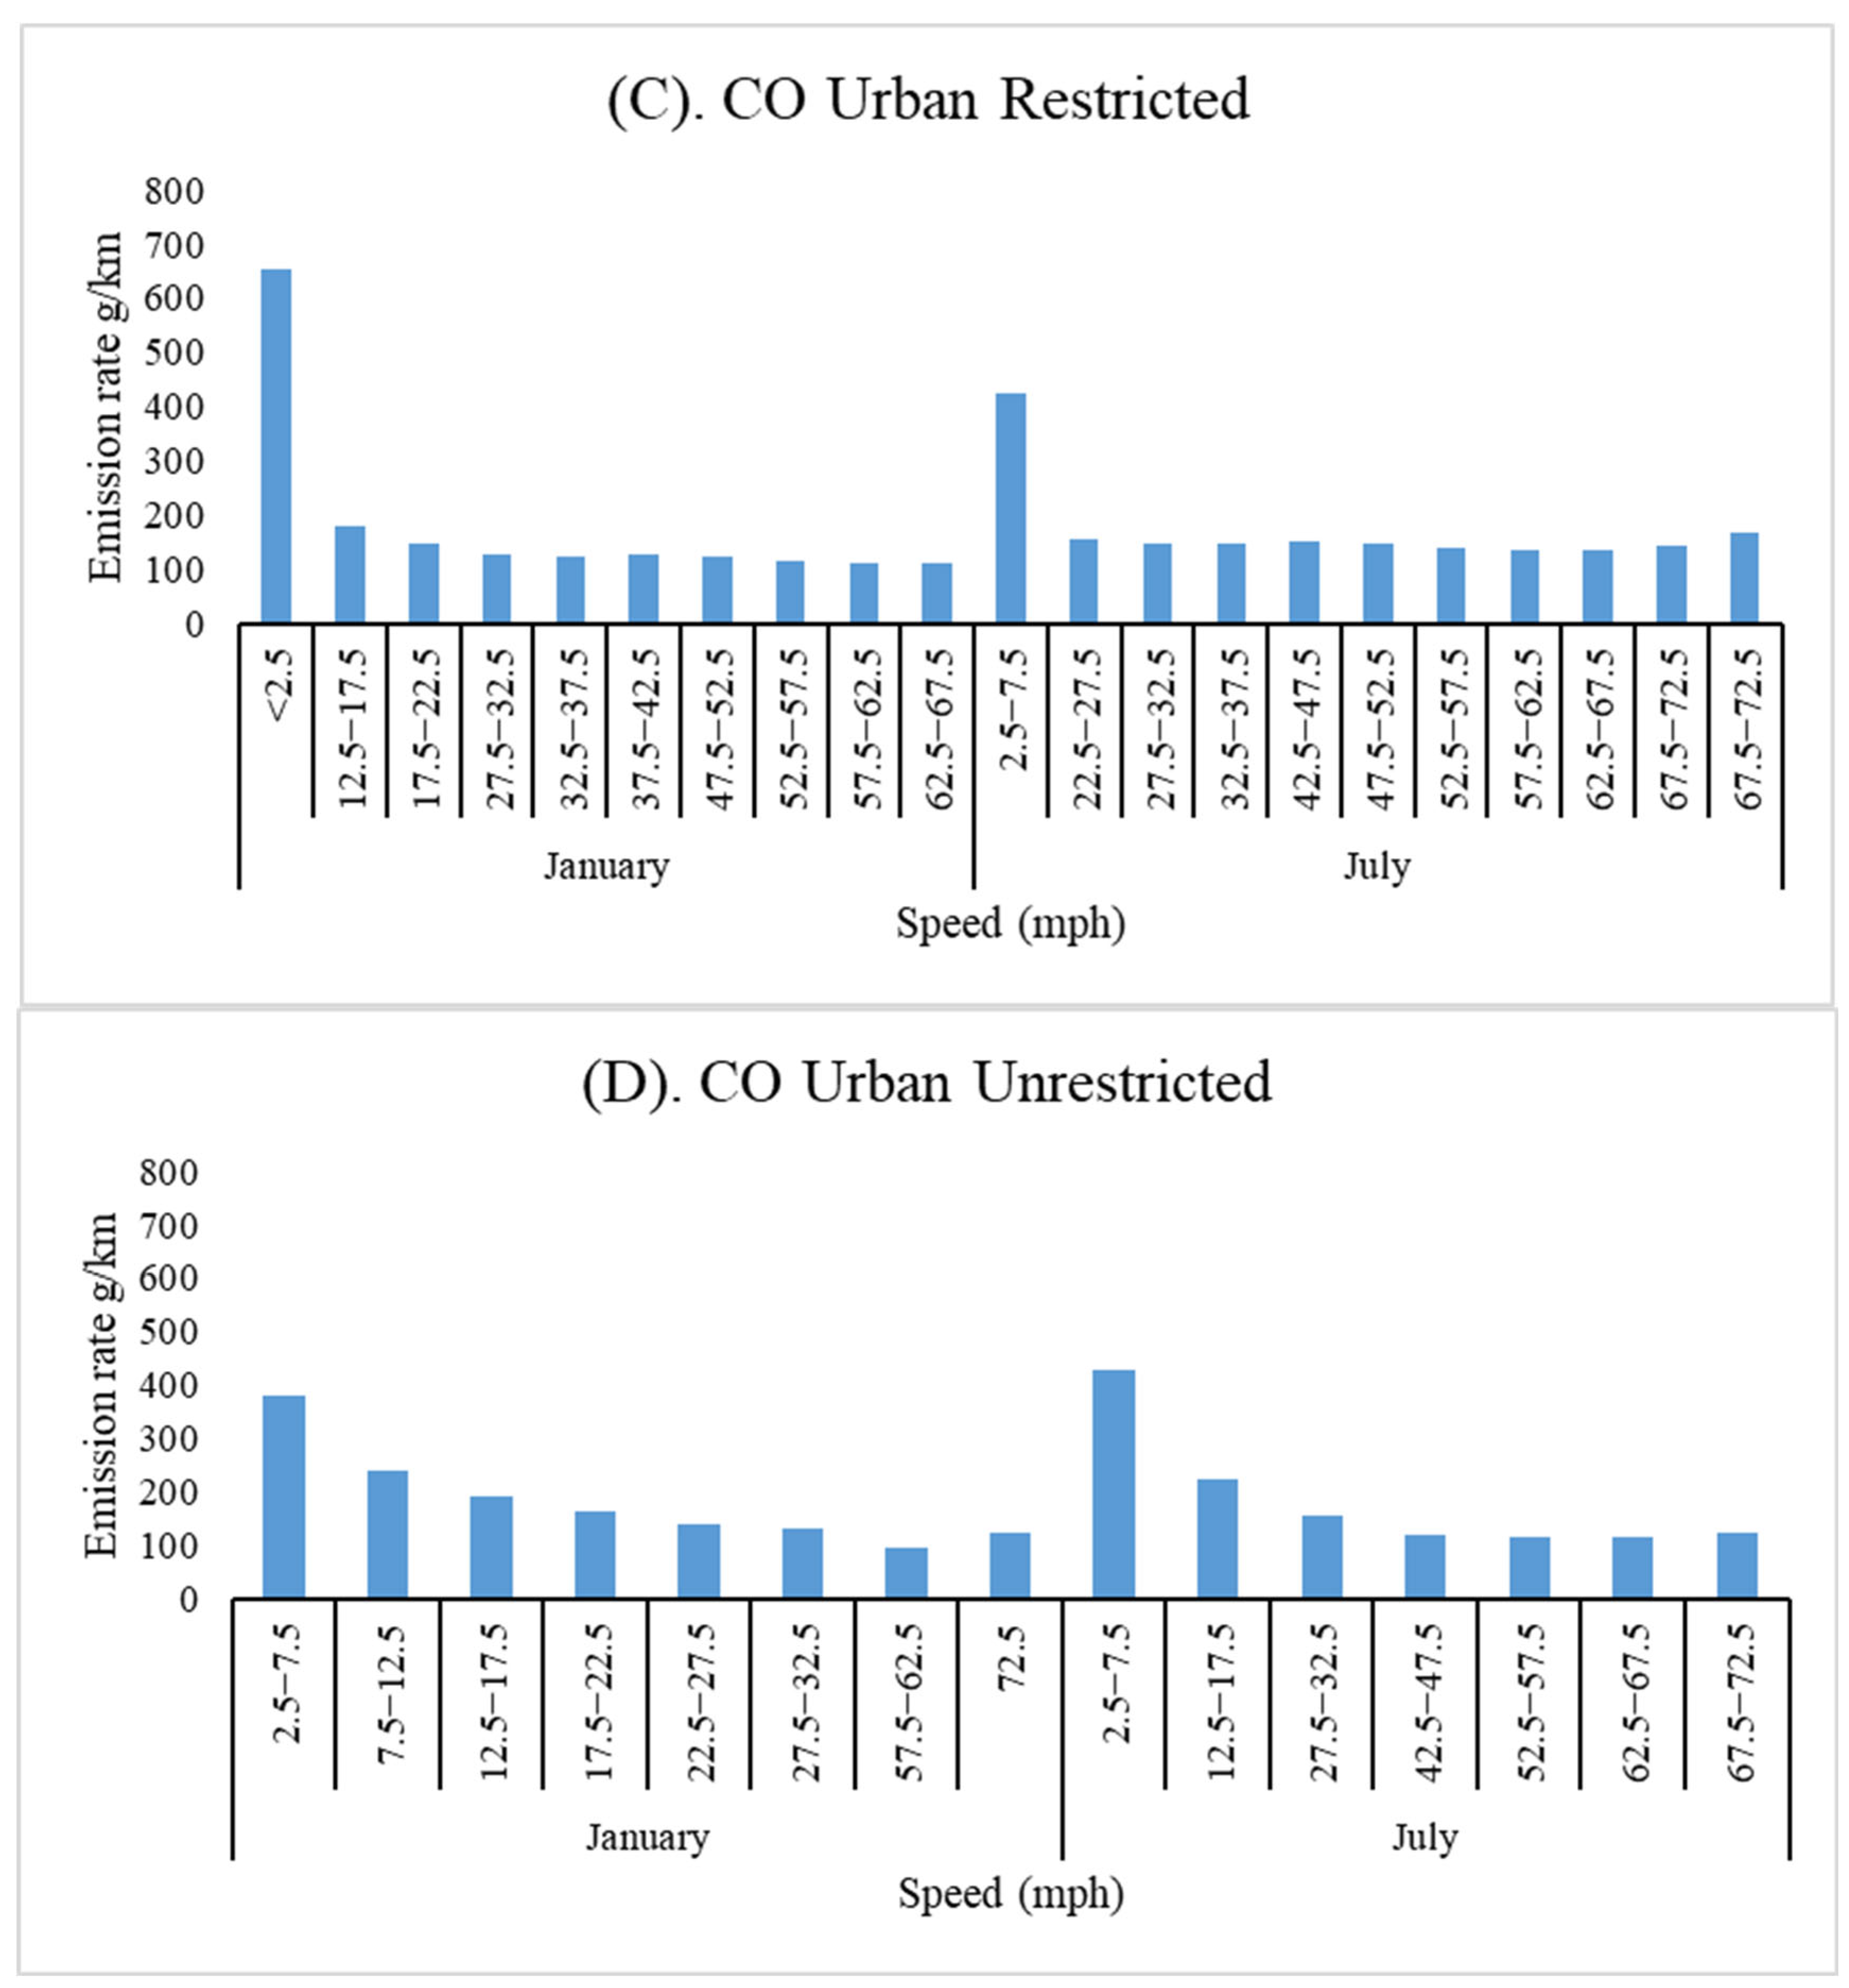
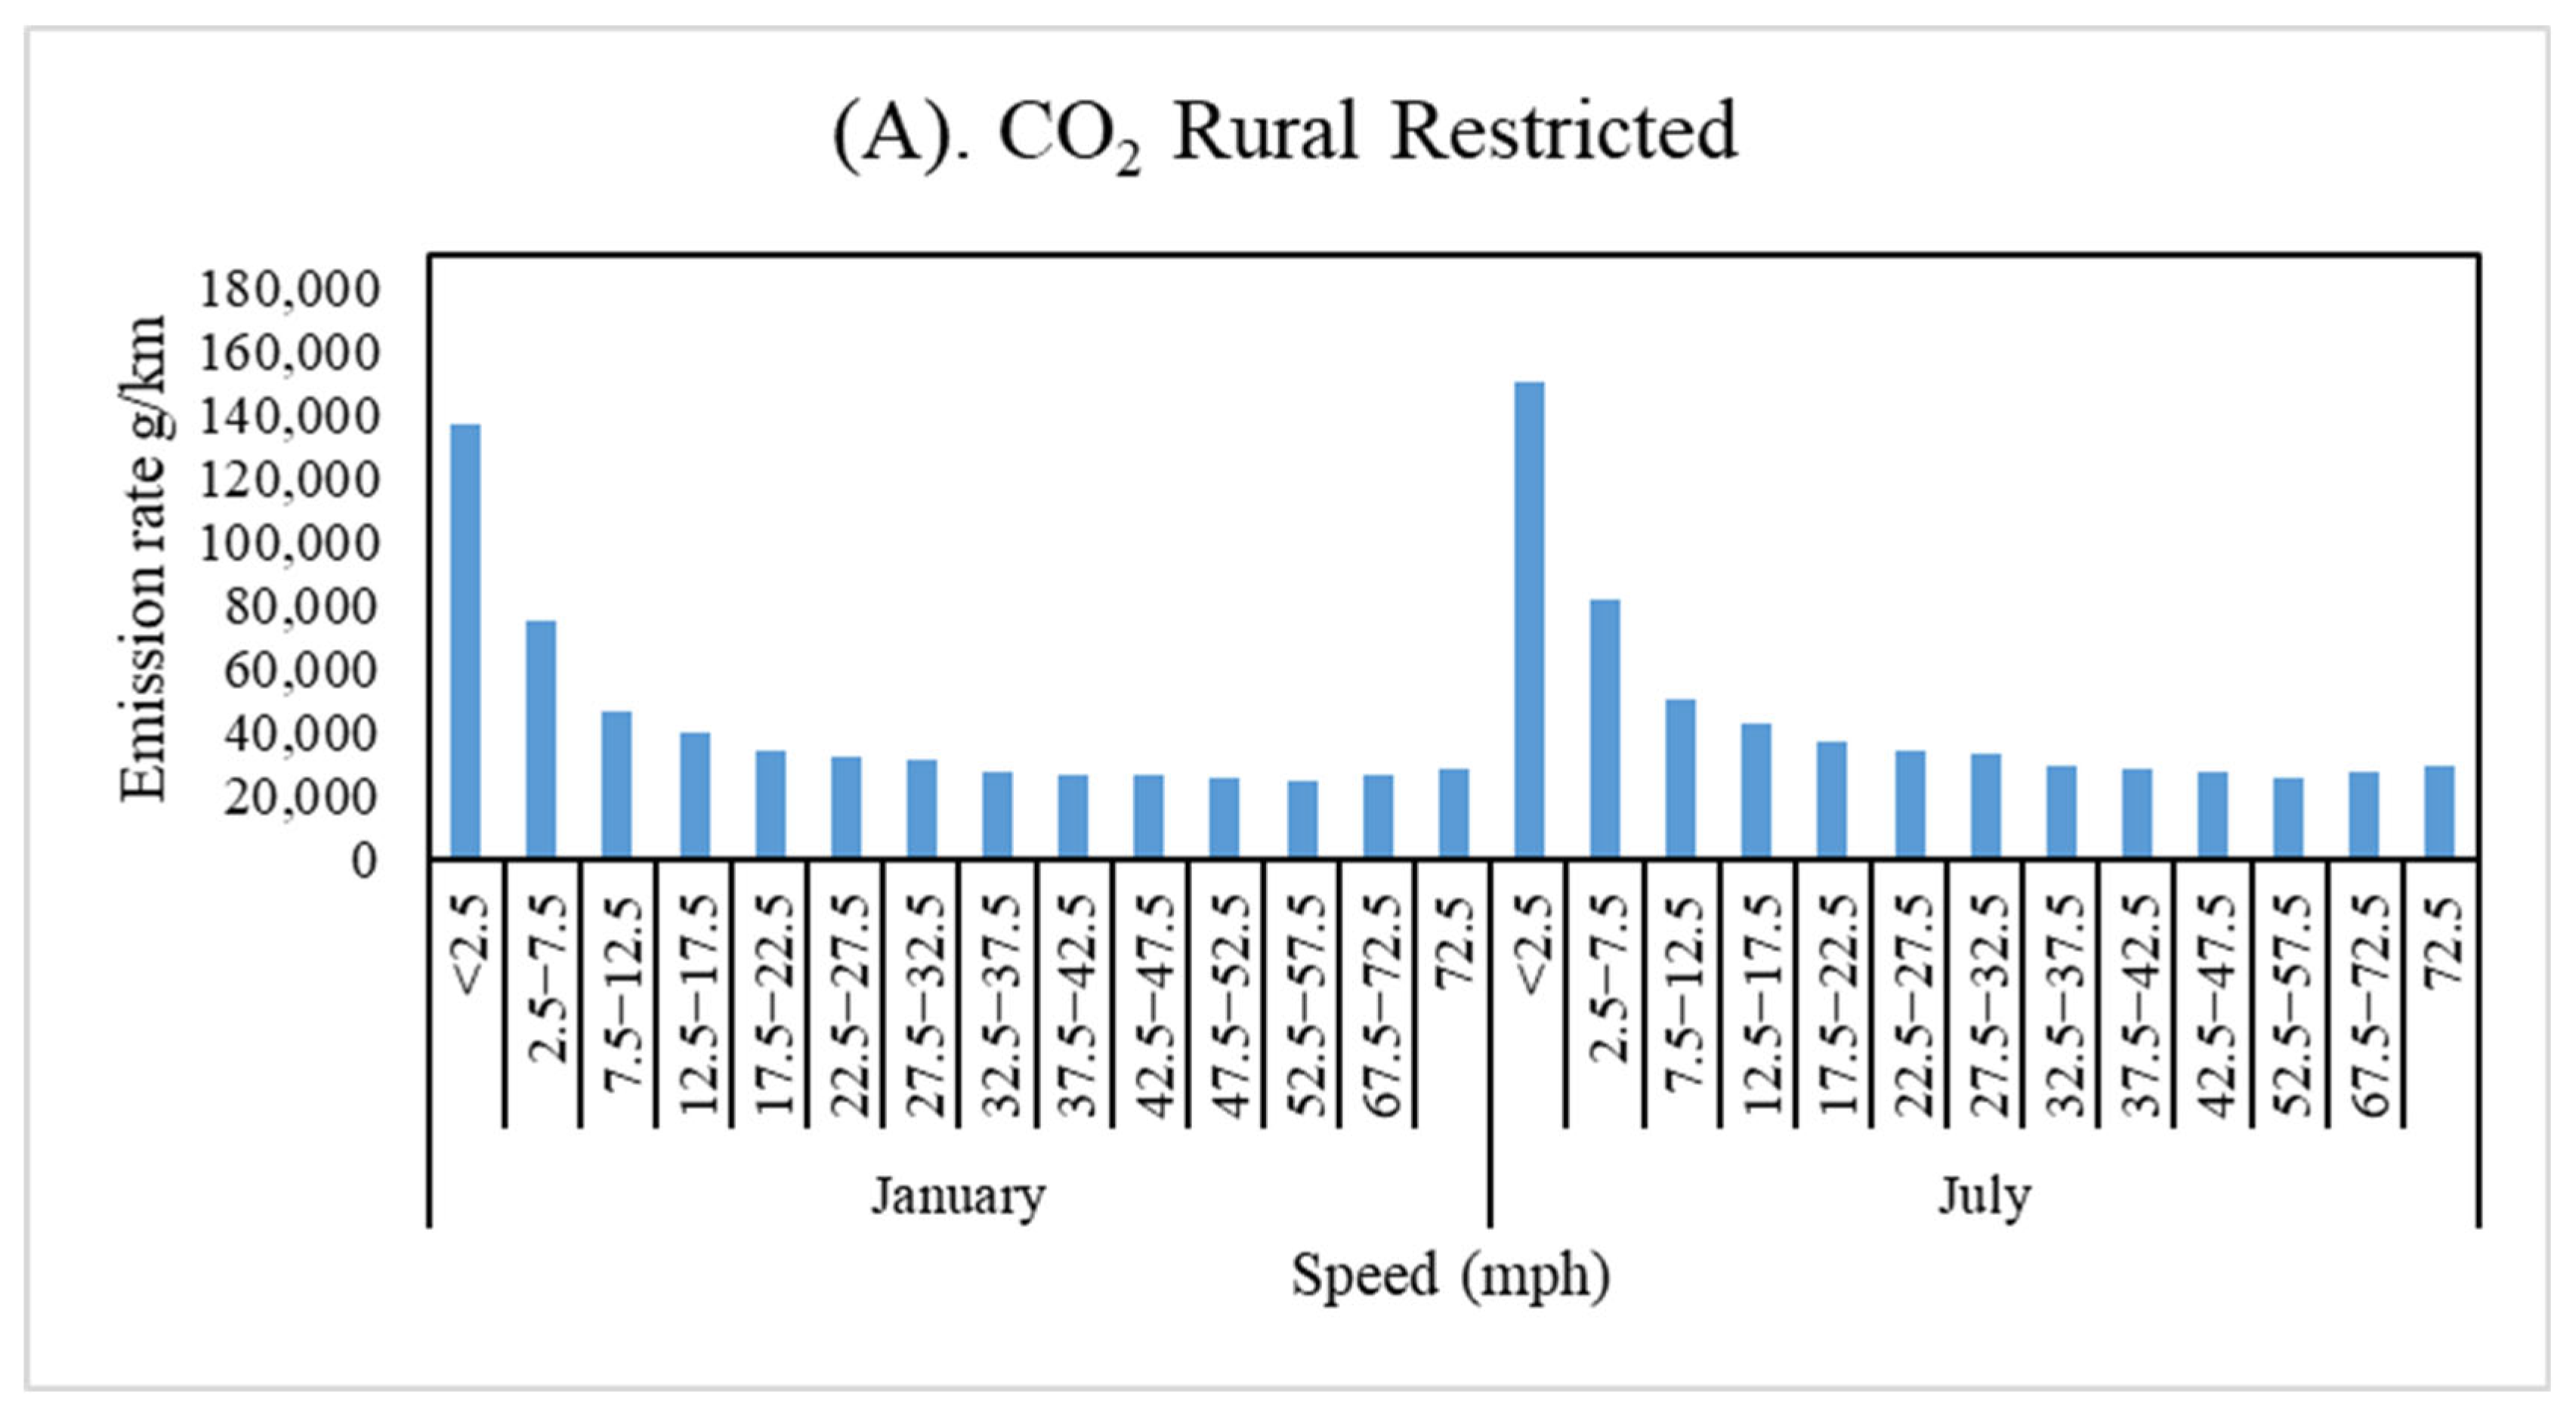
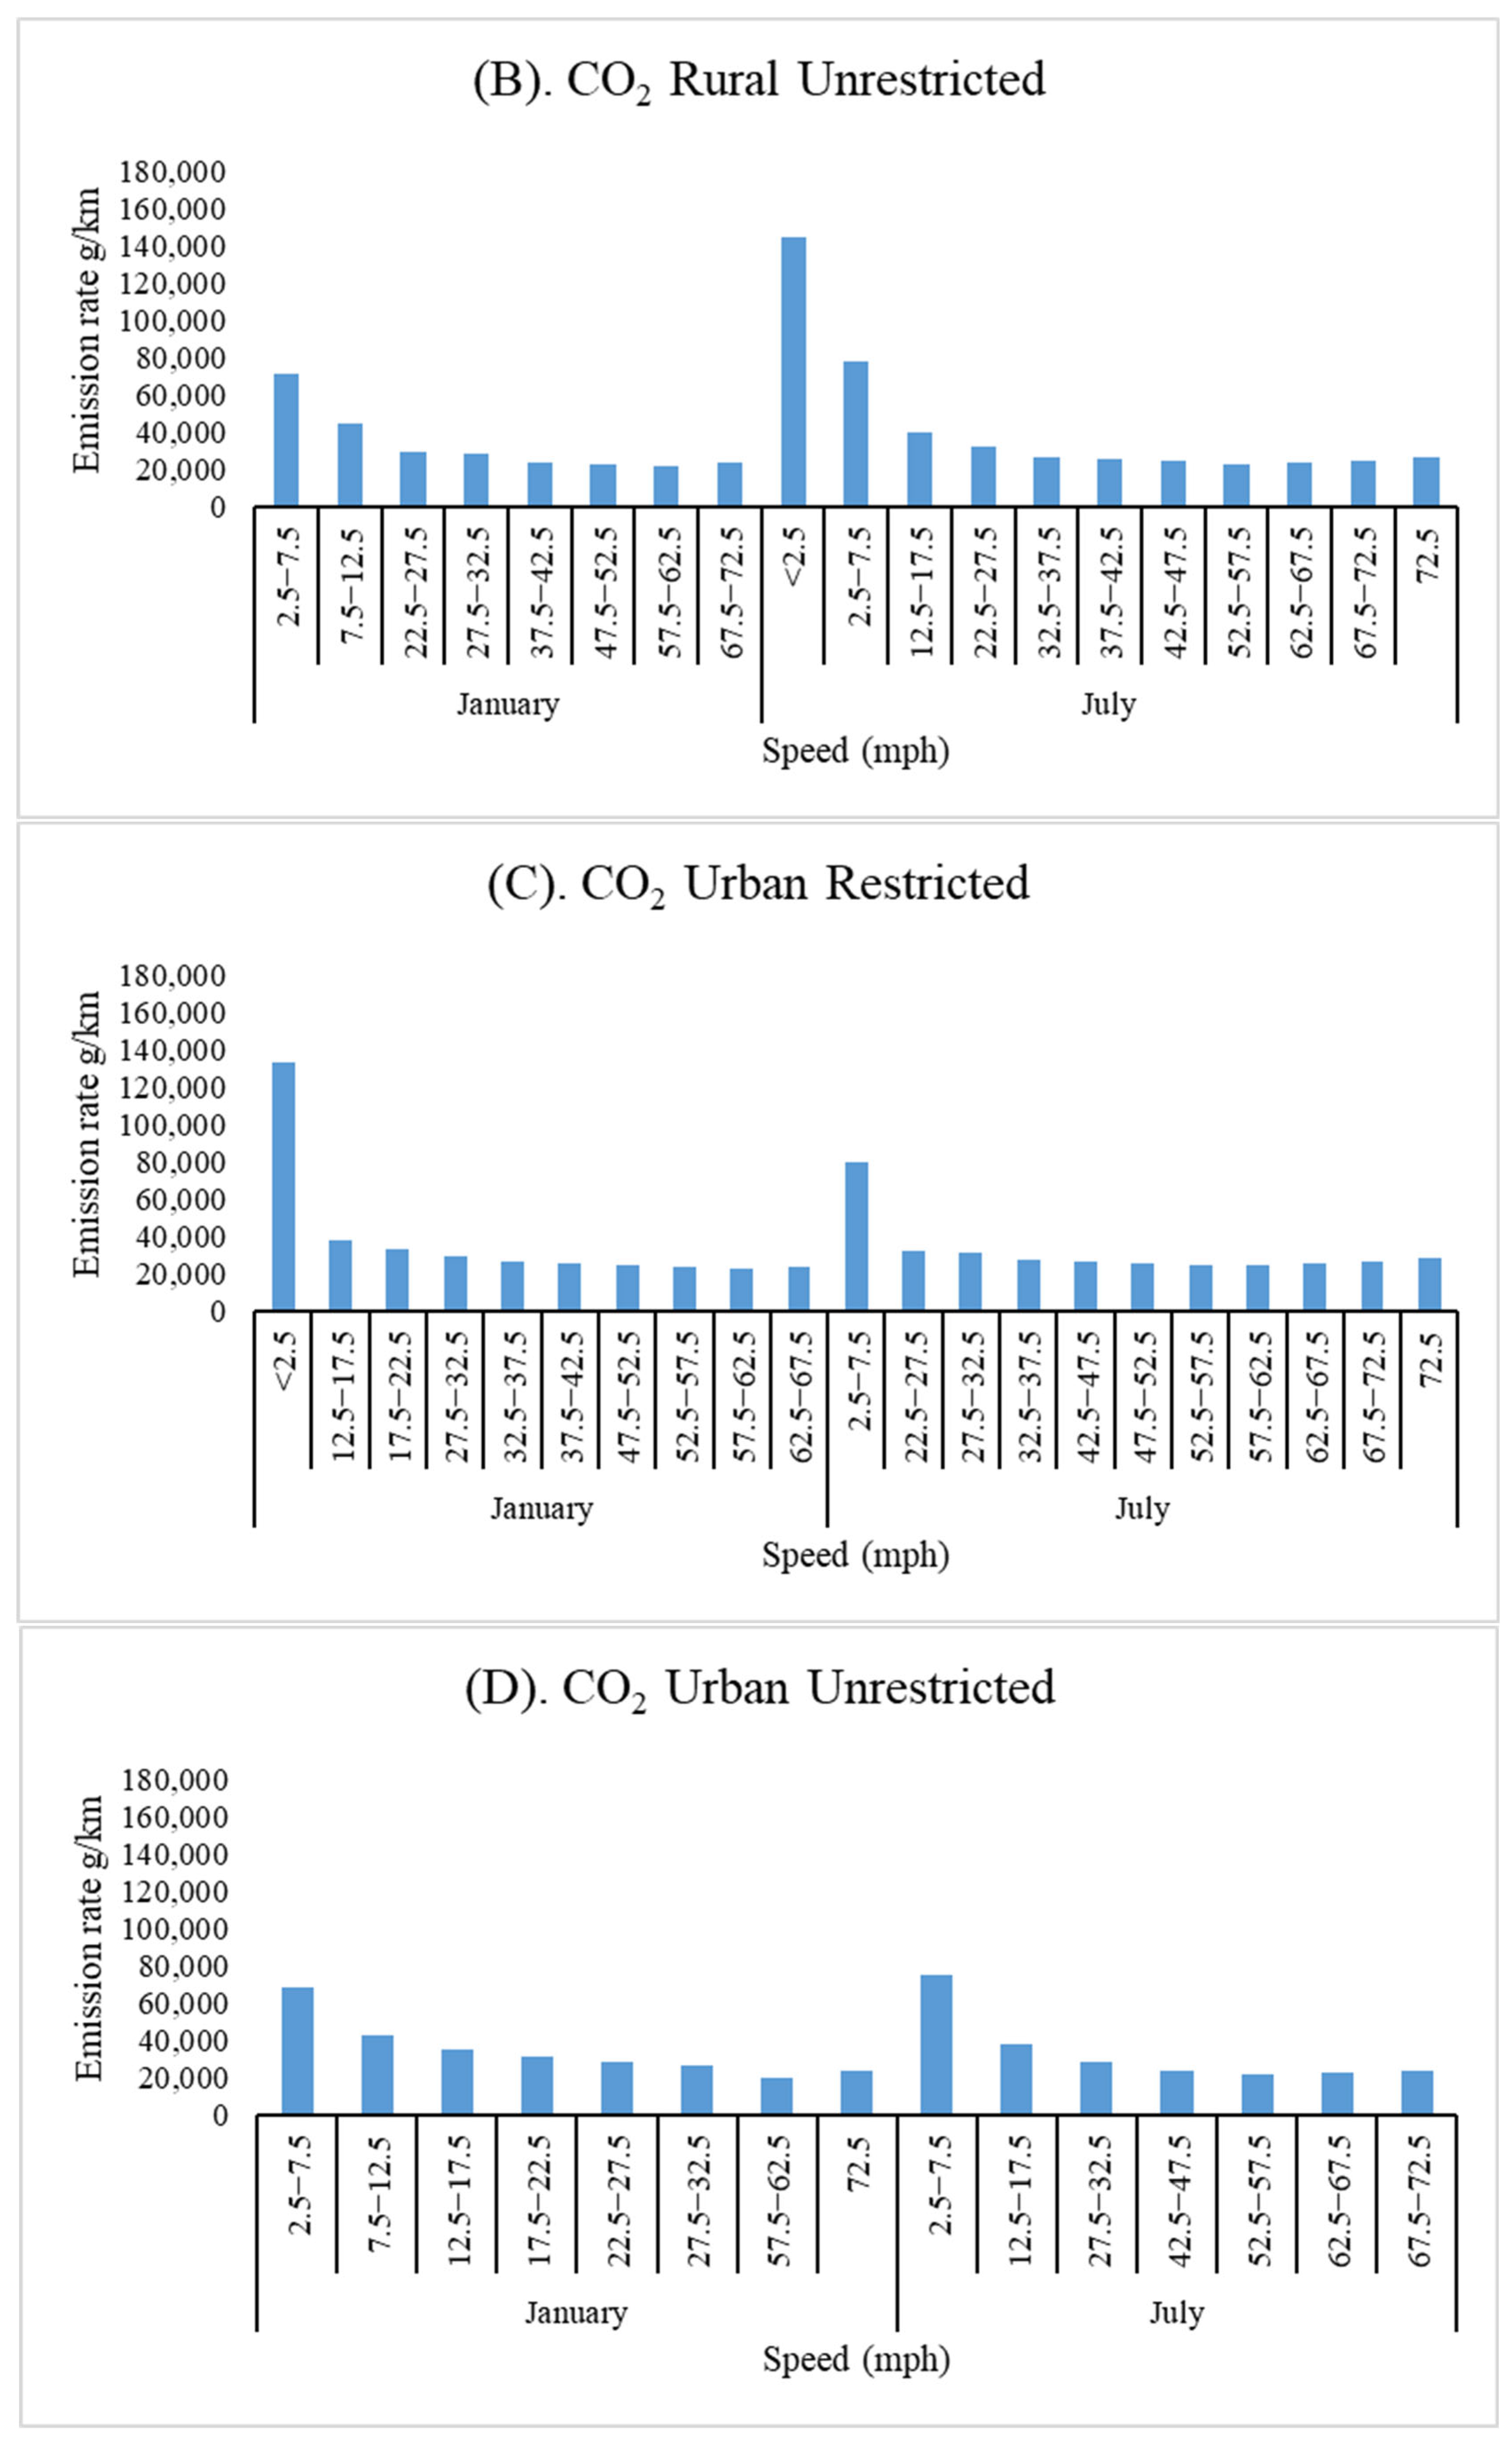
MOVES has user-friendly interface software that allows the user to insert different specifications and calculate emissions. MOVES enables the user to define the geographic bounds by state and county; therefore, Bexar County was selected. The MOVES results were tabulated in the form of numerical codes for categorical values. The MOVES manual has a list of descriptions for these codes. By referring to the MOVES manual, the results of the speed bins with various parameters (see Table 1 for the parameter values used) were obtained. The MOVES outputs were extracted and processed for five different emissions for two different months and four different types of roads. The results from the MOVES analysis are presented in Figure 5, Figure 6, Figure 7, Figure 8 and Figure 9.
After the post-processing of the MOVES emission data, the rate-per-distance table (which is a measure of the quantity of pollutants per vehicle mile) was used to relate the emissions for different road types and speed bins. This emissions rate obtained from MOVES was then used to calculate (gm/vehicle-km). The emissions rates obtained have been summarized in Table 6.
Based on the above table, the volume of emissions from ICEVs for a few segments in Bexar County, only for two selected months, is enormous. The study area is the San Antonio area. However, MOVES allows the user to select state and county over a year; assuming the single year has on average the same emissions for 6 months (winter) as for January and that the remaining 6 months (summer) are equal to July, the total emissions for the whole year are computed for various pollutants and are as shown in Table 7. It also compares the winter and summer emissions, and the higher value is boldfaced.

4.1.2. Scenario B: All Vehicles Are BEVs

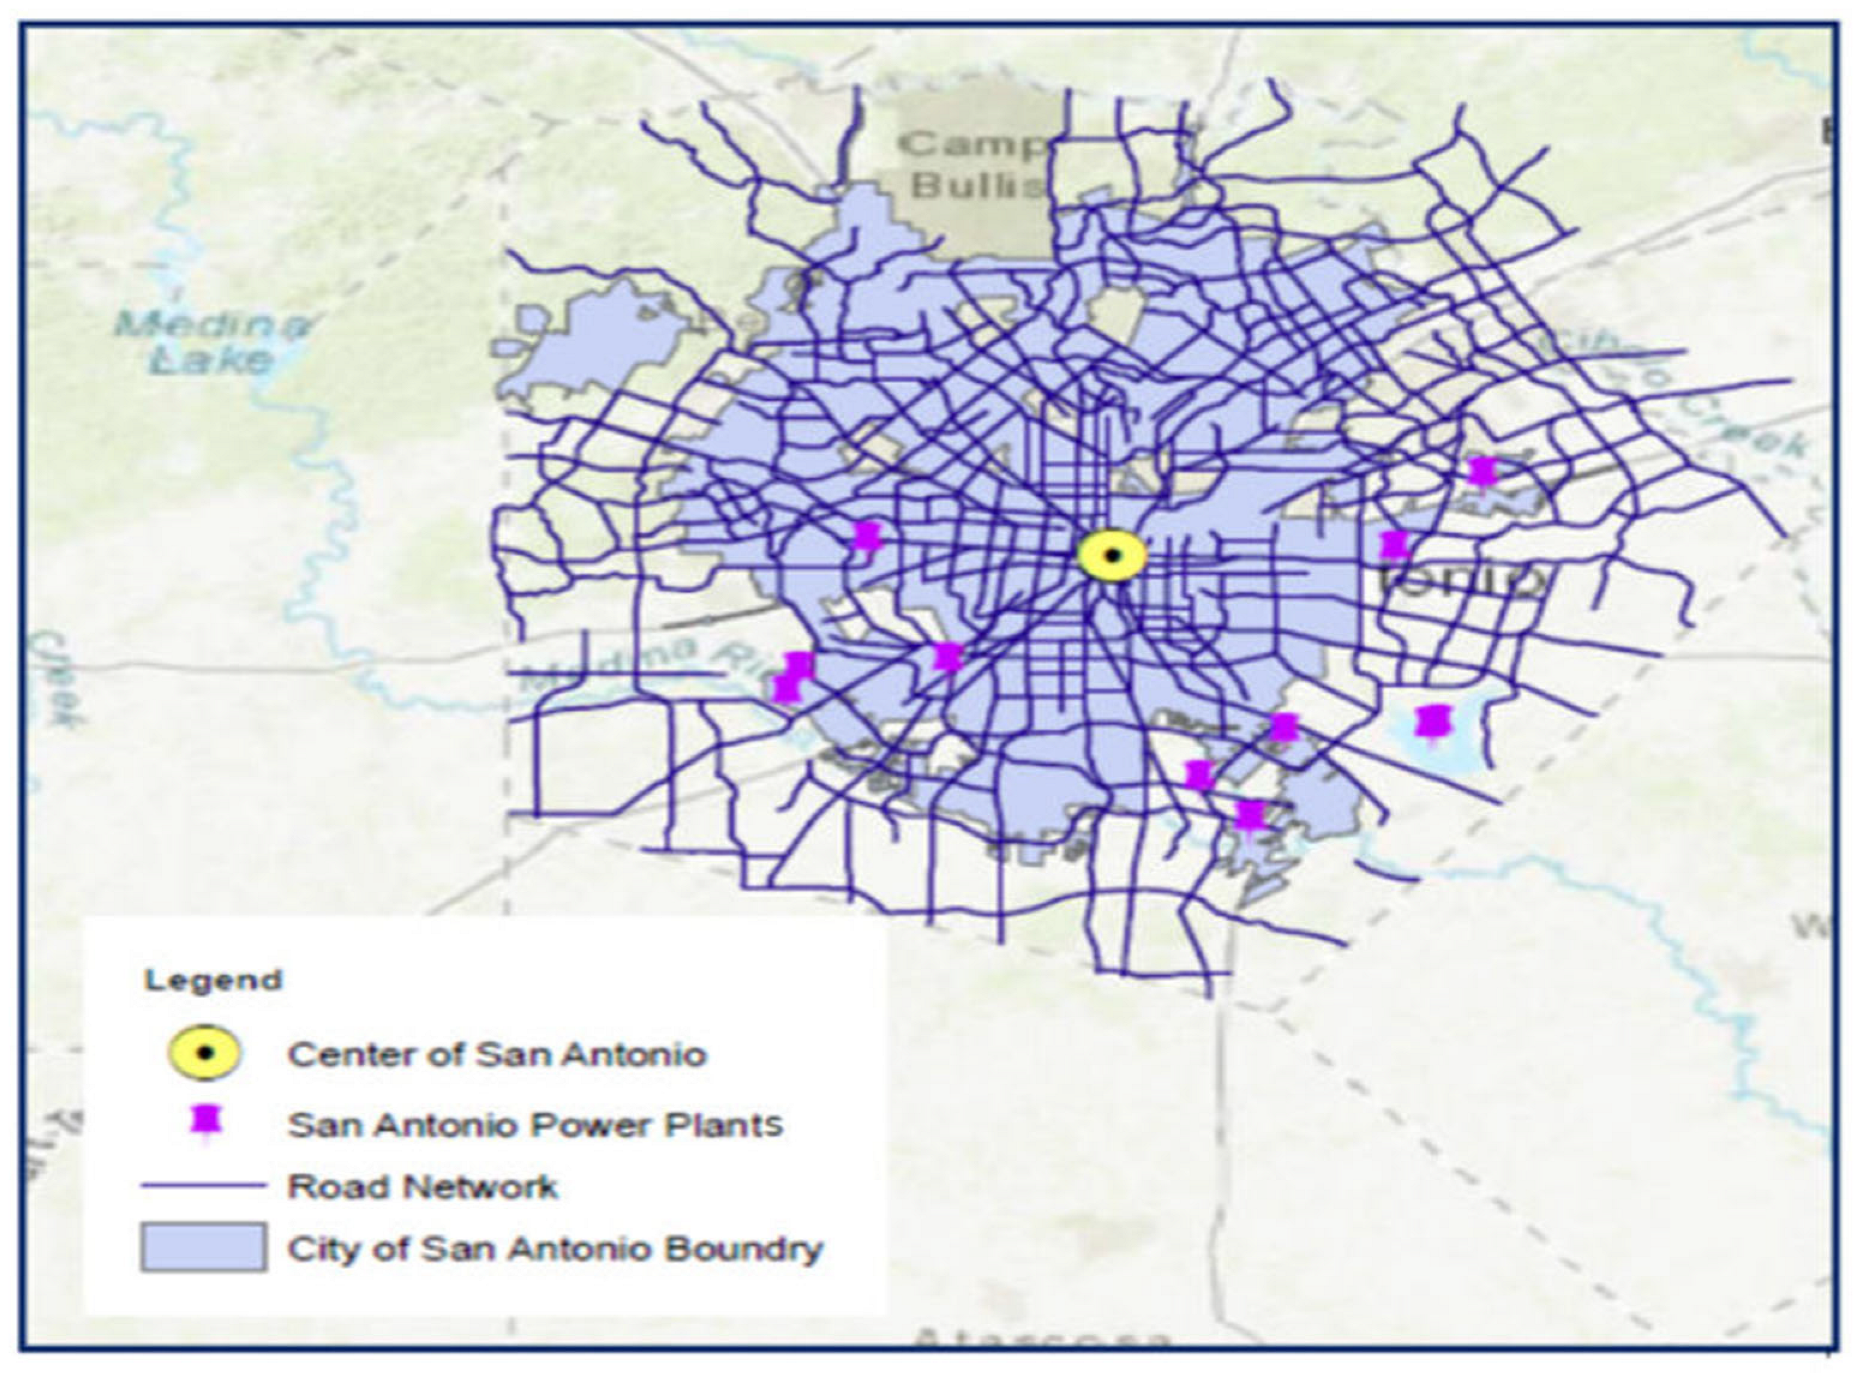
GIS software version 2022 was used to calculate the distance from each power plant to the center of San Antonio. Three GIS maps were created for different types of power plants. One is for the United States (US). The other two were created for the state of Texas and the city of San Antonio. The state of Texas has a total of 473 power generation plants. Among the 473, 13 power plants are located in the city of San Antonio. Figure 10 and Figure 11 illustrate the power plant distribution in Texas and in San Antonio, respectively. Figure 12 presents the power plant distribution with the main roadway network.
The distance from each power plant to the center of San Antonio was calculated using GIS software version 2022, and the results are shown in Table 8 as follows:
In this study, the focus is mainly on power plants that have NO2 and CO2 emissions, so only four power plants were included in the computation process of the power needed for charging, as shown in Table 9.

4.1.3. The Power Needed for Charging

Table 9 shows the primary electricity sources and associated emissions of CO2 and N2O (in grams per meter per kilowatt-hour) for four power plants, highlighting the differences in environmental impact between natural gas- and coal-powered facilities.
The calculation of power plant emissions was based on the following simplifying assumptions: The study assumes that transmission and distribution losses on average equal 15% [47]. This implies that if there is one unit of power consumed at the charging point, then there should be 1.15 units of power produced at the power plant. Hence, if there are X units consumed at the charging point, then (X ×1.15) units should be produced at the power plant. The portfolio for San Antonio is as follows: 18.3% coal, 45.4% gas, 0.2% landfill, 7.4% solar, 14.5% wind, and 14.1% nuclear. Table 9 presents the emissions calculation. Below is an example of how the N2O emissions from the Leon Creek power plant were calculated by multiplying the distance from the city center to the power plant, then multiplying this value by the gas percentage and the N2O emissions as follows: (38,597.815 × (45.4/100) × 1.15 × 5122.65372).
To estimate the indirect emissions from electricity used to power the BEVs, an assumption was made for BEV consumption based on typical EV efficiency, which is 0.2 KWh/km [48]. Emissions in gram/km (Table 10) were computed by multiplying the emissions in Table 9 by the average EV consumption. Emissions percentages were calculated with reference to ICE vehicles as the baseline of comparison. N2O is a type of NOx; therefore, Nox emissions were used to estimate the NO2 emissions.

5. Discussion

This section provides an illustration of the results presented in the previous section. Figure 5 shows that SO2 emissions significantly decrease from the lowest to the highest speeds in both rural and urban areas, with notable seasonal variations. In rural restricted areas, emissions decrease by 80–81%, and in rural unrestricted areas, the reduction ranges from 66 to 83%. Urban restricted areas see a 65–80% decrease, while urban unrestricted areas experience a 66–69% reduction. These patterns suggest that emissions are generally higher at low speeds due to factors like stationary periods and congestion, especially in urban areas where lower speed limits might lead to more frequent deceleration and acceleration. The larger reductions in rural roadways could be due to more consistent driving at higher speeds compared to urban areas, where stop-and-go traffic is more common. Seasonal differences, with generally higher reductions in January, may be attributed to variations in temperature and vehicle operation efficiency.
Based on the figures, it can be concluded that the emissions rates in summer (i.e., July) were higher than those emissions rates in winter (i.e., January). Rural areas experienced higher emissions rates as compared with urban areas, and the restricted areas experienced higher emissions rates than unrestricted areas for different ranges of speed. This can be attributed to the higher density of traffic and increased stationary periods on restricted roadways, which typically involve more congestion and stop-and-go conditions. The results show that increasing speed resulted in lower emissions. This supported the fact that emissions increase with congestion (stop-and-go and slow-movement traffic). It can also be because engines are less efficient at lower speeds, leading to incomplete combustion and higher pollutant emissions.
Figure 6 indicates that PM2.5 emissions are generally higher in restricted conditions, with rural areas experiencing up to 50% more emissions than urban areas. Seasonally, emissions in July are generally the same or lower than in January, except for rural unrestricted conditions where emissions can be up to 40% higher than in January. Comparing unrestricted conditions, urban areas show a 45% reduction in emissions compared to restricted conditions, whereas rural areas exhibit a smaller reduction, around 30%. This suggests that urban areas benefit more from unrestricted conditions, likely due to better regulation and infrastructure.
Figure 7 shows that NOx emissions are highest under restricted conditions, with rural areas experiencing peak rates of 1116.47 g/km in January and slightly lower, at 898.53 g/km, in July. In unrestricted conditions, rural emissions drop significantly, to 535.63 g/km in January. Urban areas under restricted conditions have lower emissions than rural areas, with January rates at 1082.35 g/km and July rates at 453.79 g/km. Urban unrestricted conditions show the lowest emissions, with January rates at 511.85 g/km and a further reduction to 417.69 g/km in July. It can be seen that urban areas show greater emission reductions under unrestricted conditions, likely to be due to better regulation and infrastructure, with seasonal changes further lowering emissions.
Figure 8 illustrates CO emissions trends in rural and urban areas under different conditions (restricted and unrestricted) in January and July. Rural restricted emissions peak at 649.34 g/km in January, increasing to 716.73 g/km in July. Similarly, rural unrestricted emissions rise from 379.53 g/km in January to 712.11 g/km in July, a significant disparity compared to restricted conditions. Urban restricted emissions remain consistently lower than rural levels, notably in July (654.08 g/km in January, decreasing slightly to 422.67 g/km in July). In addition, urban unrestricted emissions are the lowest, with January rates at 380.03 g/km and 428.95 g/km in July. July consistently witnesses emissions reductions, emphasizing seasonal impacts. The rural–urban emissions gap underscores the influence of infrastructure and regulatory measures.
The analysis of CO2 emissions rates, as shown in Figure 9, demonstrates notable differences across various categories and months. In restricted rural areas, emissions in January are approximately 10% lower compared to July. Conversely, unrestricted rural areas show a 51% decrease in emissions from January to July. Urban restricted areas experience a 40% decrease in emissions from January to July, whereas urban unrestricted areas see a slight increase of about 9% in emissions from January to July. These findings indicate that, whether an area is restricted or not, as well as whether it is an urban or rural area, greatly affects CO2 emissions. Generally, emissions are higher in July than in January across most categories, which indicates that seasonal emissions could be influenced by several other factors including traffic patterns, vehicle types, and emissions characteristics.
It can be seen from Table 6 and Table 7 that scenario A, with a 100 percent market share of conventional ICEVs, contributes large volumes of emissions. The section below focuses on the estimation of emissions arising due to BEV charging. By comparing the emissions from both scenarios, the following points were made:
In terms of the types of emissions, scenario B considers only two types of emissions (CO2 and N2O). However, in scenario A, five types of emissions need to be considered (CO2, NOx, SO2, PM2.5, and CO). When all vehicles are BEVs, the volume of emissions for the two types (CO2 and N2O) is much lower than when all vehicles are ICEVs.
The results of the computational experiment indicate that BEVs may play a significant role in reducing emissions from the transportation sector.
Based on the comparison of the results of the two scenarios, the 100% adoption of BEVs could reduce CO2 emissions by 99% per km, regardless of the power source.

6. Conclusions

This study focuses on a comparative analysis of two critical scenarios within the transportation sector to address pressing environmental sustainability challenges: one envisioning a fleet composed entirely of internal combustion engine vehicles (ICEVs) and the other comprising exclusively battery electric vehicles (BEVs). The paper also focuses on modeling the emissions from the source of power generation (power plants) to meet the charging demand of BEVs while accounting for transmission and distribution losses. The study uses the City of San Antonio, Texas, USA, as the study area. These scenarios are doubled into four to accommodate the seasonal change in traffic conditions from winter to summer. Computational experiments are carried out assuming January and July are the representative months of winter and summer, respectively. The method for estimating vehicular emissions and power plant emissions is outlined. The results of the computational experiment indicate that BEVs may play a significant role in reducing emissions from the transportation sector. The main conclusions were drawn as follows:
For Scenario A:
It is found that when all vehicles are ICEVs, five types of emissions will be produced, namely, CO2 and NOx, SO2, PM2.5, and CO.
CO2 has the highest emissions rates, while SO2 has the lowest emissions rates. The emissions rates in summer (i.e., July) are higher than the emissions rates in winter (i.e., January).
  • SO2 emissions decreased significantly with higher speeds due to the fewer stop-and-go events. PM2.5 emissions were up to 50% higher in rural areas as compared with urban areas. While they were about 45% lower for unrestricted conditions as compared with restricted conditions. CO2 emissions are highly affected by seasonal variations. For instance, rural unrestricted areas showed a 51% decrease from winter to summer. This is due to the high usage of vehicles and air conditioners in summer.
Rural areas experienced higher emissions rates as compared with urban areas. Also, restricted areas experienced higher emissions rates than unrestricted areas for different speed ranges.
It is reported that, at higher speeds, the rates of emissions would be lower. This supported the fact that emissions increase with congestion, where the traffic is considered to be slower.
For Scenario B:
BEVs have lower lifecycle emissions, especially in areas with cleaner energy grids. The emissions associated with BEVs can vary significantly depending on the source of electricity used to charge them. If electricity is generated from renewable power plants (i.e., wind or solar), BEVs produce very low emissions. However, if electricity comes from fossil fuel power plants (i.e., coal or natural gas), the emissions related to the charging of BEVs can be higher.
The overall environmental impact of BEVs depends on the energy source. BEVs themselves do not directly produce emissions such as CO2 or NO2 while driving, as they are powered by electricity. However, BEV emissions essentially come from the electricity generator used to charge them, which will mainly take place at charging stations, and from their manufacturing processes, particularly battery production.
  • The results and analysis in this study were developed based on the grid mix used for the selected region in the analysis. It should be noted that this does not necessarily apply to other regions. And this conclusion varies with different grid compositions.
When all vehicles are BEVs, two types of emissions will be produced, namely, CO2 and N2O. A minimal volume of these emissions will be lost in transit from the power plants to the charging stations.
Comparing the two scenarios, it is evident that scenario A has the highest vehicle emissions rates with a considerable volume of emissions for only a few highway sections. Projecting these emissions values for only one year results in a massive volume of emissions. Based on the comparison results between the two scenarios, the 100% adoption of BEVs could reduce CO2 emissions by 99% per km, regardless of the power source. While N2O emissions could be reduced by 58%, especially for those with natural gas power resources. This means that the study area has an unseen severe environmental problem. When all vehicles are BEVs, the volume of emissions is much lower, providing a promising solution that may play a significant role in reducing emissions from the transportation sector.
The computational experiment may assist planners to accurately estimate the volume of power needed to charge BEVs, as well as to understand precisely the impact of emissions such as NOx and CO by providing visualizations of existing baseline and future predictions associated with increased traffic volumes and the speed and number of vehicles.

7. Recommendations and Future Research Works

Based on the results and the analysis of this study, it is recommended that future work address the limitations of this research work. For instance, analyzing the BEV penetration at lower-to-moderate percentages, other than the 100% full BEV integration, is recommended. It is also suggested to investigate the long-term impact of future power grid decarbonization, considering the projected increased use of more renewable energy sources in the long term. Another area that needs to be addressed in future work is incorporating regional diversity and spatial analysis to consider charging behavior variability, grid emissions intensity, charging demand, and infrastructure availability. Given that this study focused on power plant emissions, emissions from oil extraction, refining, and gasoline distribution need to be considered in future work. Another aspect to be addressed in future work is the seasonal variation (i.e., summer versus winter) of BEV traffic emissions. Considering that the focus of this study is only on parameters defined by MOVES, it is recommended to expand the analysis to include a full life cycle assessment (LCA), including well-to-wheel emissions such as those from battery manufacturing for BEVs and fuel extraction and refinement for ICEVs. Another key limitation of this study is the absence of a sensitivity analysis to assess the robustness of the final rankings produced by the multicriteria model. While this study aimed to establish a baseline evaluation under fixed assumptions, future research should incorporate a sensitivity analysis to enhance the reliability of the results. Given the harmful impact of traffic emissions on public health, it is also recommended to develop a diffusion model to understand the impact of vehicle emissions on people.

Author Contributions

Conceptualization, E.A.; methodology, E.A. and T.A.; validation, E.A., T.A. and A.A.-S.; investigation, E.A.; resources, T.A.; data curation, E.A.; writing—original draft preparation, E.A.; writing—review and editing, E.A., T.A. and A.A.-S.; visualization, E.A.; supervision, T.A.; funding acquisition, T.A. and E.A. All authors have read and agreed to the published version of the manuscript.

Funding

This research received no external funding.

Institutional Review Board Statement

Not applicable.

Informed Consent Statement

Not applicable.

Data Availability Statement

The data presented in this study are available on request from the corresponding author.

Acknowledgments

This research did not receive any specific grant from funding agencies in the public, commercial, or not-for-profit sectors.

Conflicts of Interest

The authors declare no conflict of interest. All authors declare that the research was conducted in the absence of any commercial or financial relationships that could be construed as a potential conflict of interest.

References

  1. Arora, N.K. Biodiversity conservation for sustainable future. Environ. Sustain. 2018, 1, 109–111. [Google Scholar] [CrossRef]
  2. Arora, N.K. Environmental Sustainability—Necessary for survival. Environ. Sustain. 2018, 1, 1–2. [Google Scholar] [CrossRef]
  3. Chapman, L. Transport and climate change: A review. J. Transp. Geogr. 2007, 15, 354–367. [Google Scholar] [CrossRef]
  4. Li, S. Reduction emissions from transport sector-EU action against climate change. Mordern Appl. Sci. 2009, 3, 56–62. [Google Scholar] [CrossRef]
  5. Chen, G.; Wan, X.; Yang, G.; Zou, X. Traffic-related air pollution and lung cancer: A meta-analysis. Thorac. Cancer 2015, 6, 307–318. [Google Scholar] [CrossRef]
  6. Sagheb, A.; Alrashydah, E.a.; Vafaeihosseini, E. Valuing traffic emissions’ effect on historic buildings: Environmental assessment to promote historic buildings’ sustainability. J. Cult. Herit. Manag. Sustain. Dev. 2023, 13, 625–641. [Google Scholar] [CrossRef]
  7. Cubells, J.; Miralles-Guasch, C.; Marquet, O. Traffic pollution as a privilege: An intersectional approach to environmental justice and transport emissions. Transp. Res. Part D Transp. Environ. 2024, 126, 104032. [Google Scholar] [CrossRef]
  8. Zhong, Z.; Hu, W.; Zhao, X. Rethinking electric vehicle smart charging and greenhouse gas emissions: Renewable energy growth, fuel switching, and efficiency improvement. Appl. Energy 2024, 361, 122904. [Google Scholar] [CrossRef]
  9. Huang, Y.; Organ, B.; Zhou, J.L.; Surawski, N.C.; Hong, G.; Chan, E.F.; Yam, Y.S. Remote sensing of on-road vehicle emissions: Mechanism, applications and a case study from Hong Kong. Atmos. Environ. 2018, 182, 58–74. [Google Scholar] [CrossRef]
  10. Zahedi, S.; Batista-Foguet, J.M.; van Wunnik, L. Exploring the public’s willingness to reduce air pollution and greenhouse gas emissions from private road transport in Catalonia. Sci. Total Environ. 2019, 646, 850–861. [Google Scholar] [CrossRef] [PubMed]
  11. World Health Organization. Ambient (Outdoor) Air Pollution. 2024. Available online: https://www.who.int/news-room/fact-sheets/detail/ambient-(outdoor)-air-quality-and-health (accessed on 13 May 2024).
  12. Huang, Y.; Surawski, N.C.; Organ, B.; Zhou, J.L.; Tang, O.H.; Chan, E.F. Fuel consumption and emissions performance under real driving: Comparison between hybrid and conventional vehicles. Sci. Total Environ. 2019, 659, 275–282. [Google Scholar] [CrossRef]
  13. Sun, K.; Tao, L.; Miller, D.J.; Pan, D.; Golston, L.M.; Zondlo, M.A.; Griffin, R.J.; Wallace, H.W.; Leong, Y.J.; Yang, M.M. Vehicle emissions as an important urban ammonia source in the United States and China. Environ. Sci. Technol. 2017, 51, 2472–2481. [Google Scholar] [CrossRef]
  14. Debbarma, S.; Raparthi, N.; Venkataraman, C.; Phuleria, H.C. Impact of real-world traffic and super-emitters on vehicular emissions under inter-city driving conditions in Maharashtra, India. Atmos. Pollut. Res. 2024, 15, 102058. [Google Scholar] [CrossRef]
  15. Barth, M.; Boriboonsomsin, K. Energy and emissions impacts of a freeway-based dynamic eco-driving system. Transp. Res. Part D Transp. Environ. 2009, 14, 400–410. [Google Scholar] [CrossRef]
  16. Singh, V.; Agarwal, A. Variation of PM2. 5 and inhalation dose across transport microenvironments in Delhi. Transp. Res. Part D Transp. Environ. 2024, 127, 104061. [Google Scholar] [CrossRef]
  17. He, H.-d.; Lu, D.-n.; Zhao, H.-m.; Peng, Z.-r. Characterizing CO2 and NOx emission of vehicles crossing toll stations in highway. Transp. Res. Part D Transp. Environ. 2024, 126, 104024. [Google Scholar] [CrossRef]
  18. Shancita, I.; Masjuki, H.; Kalam, M.; Fattah, I.R.; Rashed, M.; Rashedul, H. A review on idling reduction strategies to improve fuel economy and reduce exhaust emissions of transport vehicles. Energy Convers. Manag. 2014, 88, 794–807. [Google Scholar] [CrossRef]
  19. Gan, H.; Sun, L.; Lu, H. Empirical Study of Emission Reduction: Benefits of Park and Ride Strategy. Syst. Eng. 2010, 28, 101–105. [Google Scholar]
  20. Silva, C.; Ross, M.; Farias, T. Evaluation of energy consumption, emissions and cost of plug-in hybrid vehicles. Energy Convers. Manag. 2009, 50, 1635–1643. [Google Scholar] [CrossRef]
  21. Reitz, R.D.; Duraisamy, G. Review of high efficiency and clean reactivity controlled compression ignition (RCCI) combustion in internal combustion engines. Prog. Energy Combust. Sci. 2015, 46, 12–71. [Google Scholar] [CrossRef]
  22. Hao, H.; Liu, Z.; Zhao, F.; Li, W.; Hang, W. Scenario analysis of energy consumption and greenhouse gas emissions from China’s passenger vehicles. Energy 2015, 91, 151–159. [Google Scholar] [CrossRef]
  23. Hao, H.; Cheng, X.; Liu, Z.; Zhao, F. Electric vehicles for greenhouse gas reduction in China: A cost-effectiveness analysis. Transp. Res. Part D Transp. Environ. 2017, 56, 68–84. [Google Scholar] [CrossRef]
  24. Dennehy, E.R.; Gallachóir, B.P.Ó. Ex-post decomposition analysis of passenger car energy demand and associated CO2 emissions. Transp. Res. Part D Transp. Environ. 2018, 59, 400–416. [Google Scholar] [CrossRef]
  25. Greenblatt, J.B.; Saxena, S. Autonomous taxis could greatly reduce greenhouse-gas emissions of US light-duty vehicles. Nat. Clim. Change 2015, 5, 860–863. [Google Scholar] [CrossRef]
  26. Zhou, X.; Tanvir, S.; Lei, H.; Taylor, J.; Liu, B.; Rouphail, N.M.; Frey, H.C. Integrating a simplified emission estimation model and mesoscopic dynamic traffic simulator to efficiently evaluate emission impacts of traffic management strategies. Transp. Res. Part D Transp. Environ. 2015, 37, 123–136. [Google Scholar] [CrossRef]
  27. Yang, Y.; Yang, X. Study on travel restriction of urban freight vehicles based on system dynamics. J. Highw. Transp. Res. Dev. 2017, 34, 150–158. [Google Scholar]
  28. Doucette, R.T.; McCulloch, M.D. Modeling the prospects of plug-in hybrid electric vehicles to reduce CO2 emissions. Appl. Energy 2011, 88, 2315–2323. [Google Scholar] [CrossRef]
  29. Kim, S.; Shen, S.; Sioutas, C.; Zhu, Y.; Hinds, W.C. Size distribution and diurnal and seasonal trends of ultrafine particles in source and receptor sites of the Los Angeles basin. J. Air Waste Manag. Assoc. 2002, 52, 297–307. [Google Scholar] [CrossRef]
  30. Hitchins, J.; Morawska, L.; Wolff, R.; Gilbert, D. Concentrations of submicrometre particles from vehicle emissions near a major road. Atmos. Environ. 2000, 34, 51–59. [Google Scholar] [CrossRef]
  31. Zhu, Y.; Hinds, W.C.; Kim, S.; Sioutas, C. Concentration and size distribution of ultrafine particles near a major highway. J. Air Waste Manag. Assoc. 2002, 52, 1032–1042. [Google Scholar] [CrossRef]
  32. Zhu, Y.; Hinds, W.C.; Kim, S.; Shen, S.; Sioutas, C. Study of ultrafine particles near a major highway with heavy-duty diesel traffic. Atmos. Environ. 2002, 36, 4323–4335. [Google Scholar] [CrossRef]
  33. Kittelson, D.B.; Watts, W.F.; Johnson, J.P. Diesel aerosol sampling methodology: State of the art. J. Aerosol Sci. 2004, 35, 1–21. [Google Scholar]
  34. Onat, N.C.; Kucukvar, M.; Aboushaqrah, N.N.; Jabbar, R. How sustainable is electric mobility? A comprehensive sustainability assessment approach for the case of Qatar. Appl. Energy 2019, 250, 461–477. [Google Scholar] [CrossRef]
  35. Sullivan, J.; Baker, R.; Boyer, B.; Hammerle, R.; Kenney, T.; Muniz, L.; Wallington, T. CO2 emission benefit of diesel (versus gasoline) powered vehicles. Environ. Sci. Technol. 2004, 38, 3217–3223. [Google Scholar] [CrossRef]
  36. Saber, A.Y.; Venayagamoorthy, G.K. Plug-in vehicles and renewable energy sources for cost and emission reductions. IEEE Trans. Ind. Electron. 2010, 58, 1229–1238. [Google Scholar] [CrossRef]
  37. Ji, S.; Cherry, C.R.; Bechle, M.J.; Wu, Y.; Marshall, J.D. Electric vehicles in China: Emissions and health impacts. Environ. Sci. Technol. 2012, 46, 2018–2024. [Google Scholar] [CrossRef] [PubMed]
  38. Zhong, H.; Chen, K.; Liu, C.; Zhu, M.; Ke, R. Models for predicting vehicle emissions: A comprehensive review. Sci. Total Environ. 2024, 923, 171324. [Google Scholar] [CrossRef] [PubMed]
  39. Jiang, Y.; Song, G.; Wu, Y.; Lu, H.; Zhai, Z.; Yu, L. Impacts of cold starts and hybrid electric vehicles on on-road vehicle emissions. Transp. Res. Part D Transp. Environ. 2024, 126, 104011. [Google Scholar] [CrossRef]
  40. Fujita, E.M.; Campbell, D.E.; Zielinska, B.; Chow, J.C.; Lindhjem, C.E.; DenBleyker, A.; Bishop, G.A.; Schuchmann, B.G.; Stedman, D.H.; Lawson, D.R. Comparison of the MOVES2010a, MOBILE6. 2, and EMFAC2007 mobile source emission models with on-road traffic tunnel and remote sensing measurements. J. Air Waste Manag. Assoc. 2012, 62, 1134–1149. [Google Scholar] [CrossRef]
  41. Tchepel, O.; Costa, A.; Amorim, J.; Miranda, A.; Borrego, C. Transport emission model and dispersion study for Lisbon air quality at local scale. In Proceedings of the 11th International Symposium, Transport and Air Pollution, Graz, Austria, 19–21 July 2002. [Google Scholar]
  42. Vallamsundar, S.; Lin, J. MOVES versus MOBILE: Comparison of greenhouse gas and criterion pollutant emissions. Transp. Res. Rec. 2011, 2233, 27–35. [Google Scholar] [CrossRef]
  43. Elkafoury, A.; Negm, A.M.; Bady, M.; Aly, M.H.F. Review of transport emission modeling and monitoring in urban areas—Challenge for developing countries. In Proceedings of the 2014 International Conference on Advanced Logistics and Transport (ICALT), Hammamet, Tunisia, 1–3 May 2014; pp. 23–28. [Google Scholar]
  44. US Energy Information Administration. State Energy Production Estimates 1960 Through 2023. 2025. Available online: https://www.eia.gov/state/seds/sep_prod/SEDS_Production_Report.pdf (accessed on 1 May 2022).
  45. EPA. Inventory of U.S. Greenhouse Gas Emissions and Sinks: 1990–2016 (EPA 430-R-18-003); US Environmental Protection Agency: Washington, DC, USA, 2018.
  46. EPA. Overview of EPA’s Motor Vehicle Emission Simulator (MOVES5) (EPA-420-R-25-005); US Environmental Protection Agency: Washington, DC, USA, 2025.
  47. The World Bank. Electric Power Transmission and Distribution Losses. 2021. Available online: https://data.worldbank.org/indicator/EG.ELC.LOSS.ZS (accessed on 12 July 2022).
  48. Weiss, M.; Winbush, T.; Newman, A.; Helmers, E. Energy Consumption of Electric Vehicles in Europe. Sustainability 2024, 16, 7529. [Google Scholar] [CrossRef]
Figure 1. Study Area (City of San Antonio).
Sustainability 17 06839 g001
Figure 2. Research roadmap.
Sustainability 17 06839 g002
Figure 3. Texas energy production estimates [44].
Sustainability 17 06839 g003
Figure 4. San Antonio electricity generation (CPS Energy, 2019).
Sustainability 17 06839 g004
Figure 5. Sulfur dioxide (SO2) emissions rates.
Sustainability 17 06839 g005aSustainability 17 06839 g005b
Figure 6. PM2.5 emissions rates.
Sustainability 17 06839 g006aSustainability 17 06839 g006b
Figure 7. Nitrogen oxides (NOx) emissions rates.
Sustainability 17 06839 g007aSustainability 17 06839 g007b
Figure 8. Carbon monoxide (CO) emissions rates.
Sustainability 17 06839 g008aSustainability 17 06839 g008b
Figure 9. Carbon dioxide (CO2) emissions rates.
Sustainability 17 06839 g009aSustainability 17 06839 g009b
Figure 10. Spatial location of power plants in Texas.
Sustainability 17 06839 g010
Figure 11. Location of power plants in San Antonio.
Sustainability 17 06839 g011
Figure 12. Power plants in San Antonio with the road network.
Sustainability 17 06839 g012
Table 1. MOVES parameter specifications.
ScaleNational
ModelOn Road
Type of CalculationEmission Rate
Time SpanTime aggregate levelHour
Years2018
MonthsJanuary and July
DaysWeekdays
Hours7:00–8:00
9:00–10:00
Geographic BoundsCounty Bexar
Vehicle/EquipmentDieselPassenger trucks; school buses
GasolinePassenger cars
Roadway TypesUrbanRestricted
UrbanUnrestricted
RuralRestricted
RuralUnrestricted
Pollutants and ProcessesCriteria of Pollutants by EPANOx, CO, PM2.5, SO2
Greenhouse GasAtmospheric CO2
Table 2. Selected Interstate Highways (IHs) for emission rate calculations.
IH-10 EastIH-10 WestIH-35 NorthIH-37 North
E of Loop 1604N of Frio St.N of FM 2252S of I-35
W of Loop 1604N of Crossroads Blvd.N of Wiederstein Rd.N of Cesar Chavez Blvd.
E of Foster Rd.S of Callaghan Rd.S of FM 3009N of Fair Ave.
W of Ackerman Rd.N of Huebner Rd.Bexar/Guadalupe lineN of Hot Wells Blvd.
E of WW White Rd.S of DeZavala Rd.S of Loop 1604N of SW Military Dr.
W of WW White Rd.N of UTSA Blvd.N of O’Connor Rd.N of Loop 410
E of Martin Luther King Jr. Dr.N of Loop 1604S of Thousand OaksN of US 181
W of Gevers St.N of Dominion Dr.N of Walzem Rd.-
E of Probandt St.N of FM 3351S of Walzem Rd.-
W of Probandt St.-S of Rittiman Rd.-
--N of Binz-Engleman Rd.-
--N of Salado Creek-
--W of New Braunfels Ave.-
--N of McCullough Ave.-
Table 3. Natural gas and coal power plants in San Antonio.
Plant NamePrimary SourceElectricity Generation (KWh)CO2 Emission
(Metric Ton)
CO2 Emissivity
(g/KWh)
N2O Emissions
(Metric Ton)
N2O Emissivity
(g/KWh)
Leon Creek *Natural gas121,970121,846998,98367549
O W Sommers *Natural gas580,538580,8831,000,594321552
J T Deely (closed, 2018) *Coal5,433,1695,404,035994,63727,6835122
J K SpruceCoal7,180,5007,142,167994,66136,5865122
* San Antonio’s top climate polluters.
Table 4. Biomass power plants in San Antonio.
Plant NamePrimary SourceElectricity Generation (KWh)Methane Emissions
(Metric Ton)
Methane
Emissivity
(g/KWh)
Tessman Road *Biomass166,633304,1731,825,406
Covel Gardens Gas RecoveryBiomass195,944125,380639,876
Nelson Gardens Landfill Gas to Energy *Biomass100,61132,324321,276
* San Antonio’s top climate polluters.
Table 5. Solar power plants in San Antonio.
Plant NamePrimary Source
Blue Wing Solar Energy GenerationSolar
SunE CPS2 LLCSolar
SunE CPS1 LLCSolar
OCI Alamo Solar ISolar
OCI Alamo 3 LLCSolar
Table 6. Total emissions for the selected highways.
Type of EmissionMonthEmission Rates for Various Highways (g/km)Total Emission (g/km)
IH-10 EastIH-10 WestIH-35 NorthIH-37 North
CO2January10,083,381.6916,891,00927,419,982.28,852,275.2563,246,648.37
July10,661,798.8217,859,93528,992,885.89,360,071.9166,874,691.59
COJanuary47,672.7850879,858.274129,637.7541,852.29299,021.0989
July57,510.7210396,338.128156,390.28650,489.0866360,728.222
NOxJanuary77,324.90193129,529.52210,271.46467,884.1024485,009.9927
July61,271.66411102,638.21166,617.50953,790.8464384,318.229
PM 2.5January3198.1716725357.36418696.865092807.6985320,060.09941
July3070.2941685143.15228349.124722695.4339219,258.00505
SO2January84.29901271141.21209229.23633174.0067257528.7541597
July89.12825247149.30171242.36859978.246351559.0449132
Table 7. Total emissions for the selected roadways for one year.
PollutantSeasonTotal Emissions for Six Months (g/km)Total Emissions Estimation for One Year (g/km)
CO2Winter379,479,890780,728,039
Summer401,248,149
COWinter1,794,1263,958,495
Summer2,164,369
NOxWinter2,910,0595,215,969
Summer2,305,909
PM 2.5Winter120,360235,908
Summer115,548
SO2Winter31726526
Summer3354
Table 8. Distance from the center of the city of San Antonio to each power plant.
Power Plant NameDistance (Meters)
Leon Creek 38,597.815
O W Sommers68,140.484
JT Deely68,140.484
J K Spruce68,727.988
Tessman road46,584.177
Covel garden gas recovery59,804.145
Blue wing solar energy generation52,911.679
SunE CPS2 LLC69,927.624
SunE CPS1 LLC69,927.624
OCI Alamo Solar 158,224.213
OCI Alamo 3 LLC64,113.254
Nelson garden Landfill gas to energy 64,691.310
Table 9. Emissions calculation from each power plant.
Plant NamePrimary Electricity SourceEmissions Calculation
CO2
(g. m/KWh)
N2O
(g. m/KWh)
Leon CreekNatural gas20,131,431,89611,081,025.1
O W SommersNatural gas35,597,288,74711,136,091.2
J T Deely (closed, 2018)Coal14,263,269,336103,231,304
J K SpruceCoal14,386,590,251103,228,910
Table 10. BEV and ICEV emissions comparison.
Source CO2 (g/km)N2O (g/km)CO2 Relative to ICEVN2O Relative to ICEV
ICE Vehicles780,728,0395,215,969100% 100%
EV (Leon Creek)4,026,286.382,216,205.020.52%42%
EV (Sommers)7,119,457.752,227,218.240.91%43%
EV (J T Deely)2,852,653.8720,646,260.80.37%396%
EV (J K Spruce)2,877,318.0520,645,7820.37%396%
Disclaimer/Publisher’s Note: The statements, opinions and data contained in all publications are solely those of the individual author(s) and contributor(s) and not of MDPI and/or the editor(s). MDPI and/or the editor(s) disclaim responsibility for any injury to people or property resulting from any ideas, methods, instructions or products referred to in the content.