Article

The Effects of Natural and Social Factors on Surface Temperature in a Typical Cold-Region City of the Northern Temperate Zone: A Case Study of Changchun, China

1
College of Water Conservancy, Shenyang Agricultural University, Shenyang 110161, China
2
Xinjiang Institute of Ecology and Geography, Chinese Academy of Sciences, Urumqi 830011, China
*
Author to whom correspondence should be addressed.
Sustainability 2025, 17(15), 6840; https://doi.org/10.3390/su17156840
Submission received: 21 January 2025 / Revised: 10 July 2025 / Accepted: 24 July 2025 / Published: 28 July 2025

Abstract

Land cover, topography, precipitation, and socio-economic factors exert both direct and indirect influences on urban land surface temperatures. Within the broader context of global climate change, these influences are magnified by the escalating intensity of the urban heat island effect. However, the interplay and underlying mechanisms of natural and socio-economic determinants of land surface temperatures remain inadequately explored, particularly in the context of cold-region cities located in the northern temperate zone of China. This study focuses on Changchun City, employing multispectral remote sensing imagery to derive and spatially map the distribution of land surface temperatures and topographic attributes. Through comprehensive analysis, the research identifies the principal drivers of temperature variations and delineates their seasonal dynamics. The findings indicate that population density, night-time light intensity, land use, GDP (Gross Domestic Product), relief, and elevation exhibit positive correlations with land surface temperature, whereas slope demonstrates a negative correlation. Among natural factors, the correlations of slope, relief, and elevation with land surface temperature are comparatively weak, with determination coefficients (R2) consistently below 0.15. In contrast, socio-economic factors exert a more pronounced influence, ranked as follows: population density (R2 = 0.4316) > GDP (R2 = 0.2493) > night-time light intensity (R2 = 0.1626). The overall hierarchy of the impact of individual factors on the temperature model, from strongest to weakest, is as follows: population, night-time light intensity, land use, GDP, slope, relief, and elevation. In examining Changchun and analogous cold-region cities within the northern temperate zone, the research underscores that socio-economic factors substantially outweigh natural determinants in shaping urban land surface temperatures. Notably, human activities catalyzed by population growth emerge as the most influential factor, profoundly reshaping the urban thermal landscape. These activities not only directly escalate anthropogenic heat emissions, but also alter land cover compositions, thereby undermining natural cooling mechanisms and exacerbating the urban heat island phenomenon.

1. Introduction

Global climate change and rapid urbanization have precipitated profound transformations in urban climates and environments, with the resultant shifts in the spatial configuration of urban landscapes amplifying the magnitude and intricacy of urban thermal dynamics [1]. As the urban heat island (UHI) effect intensifies, rising urban surface temperatures are posing significant threats to public health and the ecological integrity of cities [2]. Hence, a nuanced analysis of the multifaceted factors influencing surface thermal environments, coupled with an exploration of the driving forces behind temperature changes and the processes governing spatial patterns of thermal variation, is imperative for the sustainable development of urban areas.
The urban thermal environment is shaped by a multitude of factors, each exerting varying degrees and mechanisms of influence on surface temperatures [2,3]. Rapid urbanization has accelerated land conversion, triggering substantial increases in surface temperatures over short timeframes [4,5]. The proliferation of impervious surfaces significantly elevates average urban surface temperatures, while the decline of natural cover—such as forests and croplands—diminishes their climate-moderating functions. Topographical features also play a critical role in regulating surface temperatures [6,7]. Studies have demonstrated that surface temperature exhibits an inverse relationship with elevation and solar radiation angles, while varying with slope and slope orientation. Air temperature, as a direct determinant, strongly influences surface temperatures. Urban environments, characterized by extensive impervious surfaces and dense building structures, exacerbate surface temperature increases in response to rising air temperatures [8]. Precipitation exerts a more intricate impact, as it modifies urban microclimates by increasing humidity, subsequently affecting surface thermal conditions [9]. Socio-economic factors, meanwhile, indirectly drive the formation and intensification of the UHI effect during periods of rapid urbanization [10]. Anthropogenic changes to natural landscapes, primarily driven by population growth and urban expansion, have been identified as significant contributors to UHI formation [11]. Although existing studies elucidate the individual effects of specific factors on surface temperatures, they also reveal the multifactorial nature of the UHI effect, underscoring the importance of examining the interactions and combined influences of diverse determinants [12]. Current research, however, provides an insufficient understanding of these complex interrelations. Therefore, a holistic and integrative research approach is essential to uncover the mechanisms through which urbanization processes influence urban surface temperatures and to account for the synergies among multiple factors.
The rapid urbanization process has engendered dramatic changes in urban population dynamics, land use and cover patterns, urban landscape configurations, and socio-economic structures [13]. While these developments have yielded remarkable socio-economic advancements, they have also precipitated significant challenges, including land use changes due to urban expansion, intensifying urban heat island effects, and an array of environmental issues [14]. In this context, analyzing the urban surface thermal environment and its driving factors is pivotal for understanding and addressing the environmental challenges posed by urbanization and for devising appropriate urban development strategies. This study focuses on Changchun City, a prototypical cold-region city in the northern temperate zone. Utilizing Landsat remote sensing imagery and employing surface temperature retrieval on the ENVI platform, it investigates the dominant factors influencing surface temperature variations in Changchun and their seasonal disparities. The findings aim to provide valuable insights for understanding the urban heat island effect and surface temperature dynamics, offering a reference framework for future research and urban planning strategies.

2. Materials and Methods

2.1. Study Area

Changchun, the capital of Jilin Province, is situated in Northeast China at a latitude of 43°05′−45°15′ N and a longitude of 124°18′−127°05′ E. Encompassing a total area of 24,592 km2, the city experiences a north-temperate continental monsoon climate, characterized by an average annual temperature of 5.5 °C. Positioned within a transitional zone between semi-arid and semi-humid regions, Changchun receives an annual precipitation level of 600–700 mm, with over 60% occurring during the summer months [15] (Figure 1).
Changchun lies at the heart of the Great Plain of Northeast China, with an elevation ranging from 250 to 350 m above sea level. It is situated on the Yitong River Tableland, forming a transitional zone between the mountainous regions to the east and the plains to the west within the Songliao Plain [16]. The region’s topography slopes gently from east to west, predominantly comprising terraces and plains, with terraces covering approximately 70% of the city’s area. As a central city and a key industrial hub in Northeast China, Changchun hosts a diverse array of industries, including petroleum, chemicals, light manufacturing, and textiles [17]. With the advancement of the national strategy for revitalizing Northeast China, Changchun’s strategic geographic location has gained prominence, solidifying its role as the core city within the Northeast Asian Economic Circle. Additionally, Changchun serves as the political, cultural, and educational nucleus of Jilin Province.

2.2. Data Sources

Landsat 8 remote sensing imagery of Changchun City from 2021 served as the foundational dataset for surface temperature calculations. Data preprocessing and surface temperature retrieval were conducted using the Environment for Visualizing Images (ENVI) platform. Digital elevation model (DEM) data were sourced from the Geospatial Data Cloud (https://www.gscloud.cn), employing the 90 m resolution SRTM MASPECT elevation data for Changchun City in 2021. The night-time light intensity dataset was derived from the 2021 night-time lighting data of Changchun City, made available by the Resource and Environmental Science Data Center of the Chinese Academy of Sciences (http://www.resdc.cn). Land use classification data were obtained from the 2021 land use dataset, featuring a spatial resolution of 30 m, provided by the same data center (https://www.resdc.cn/). These data encompassed multiple land use categories, including urban construction land, agricultural land, forested areas, grasslands, water bodies, and unused land.

2.3. Methods

This study employed the atmospheric correction method for surface temperature inversion. Landsat 8 image data were imported into the ENVI platform, where they were filtered based on predefined temporal and geographic criteria. Subsequently, cloud-removal processing was conducted to ensure the integrity and reliability of the dataset.
The radiative transfer equation, which represents the brightness value of thermal infrared radiation captured by the satellite sensor, is expressed as follows:
L λ   =   [ ε B ( T S ) + ( 1 + ε ) L ] τ + L
In this equation, ε is the surface specific emissivity, T s is the real temperature of the surface, B ( T s ) is the brightness of the blackbody thermal radiation, L represents the upward atmospheric radiance, L represents the downward atmospheric radiance, L λ denotes the radiance value at a specific wavelength, and τ is the transmittance of the atmosphere in the thermal infrared band. The brightness of the blackbody radiation in the thermal infrared band at a temperature of T is calculated as follows:
B ( T s ) = [ L λ L τ ( 1 ε ) L ] τ ε
T s can be obtained using Planck’s formula, and the calculation yields a result that needs to be converted from Kelvin to Celsius (so subtract 273.15).
T s = K 2 ln ( K 1 B ( T s ) + 1 ) 273.15
In this equation, K1 and K2 are constants, which are available in the image header file: K1 = 774.89 W·m−2 µm−1 sr−1, K2 = 1321.08 K.

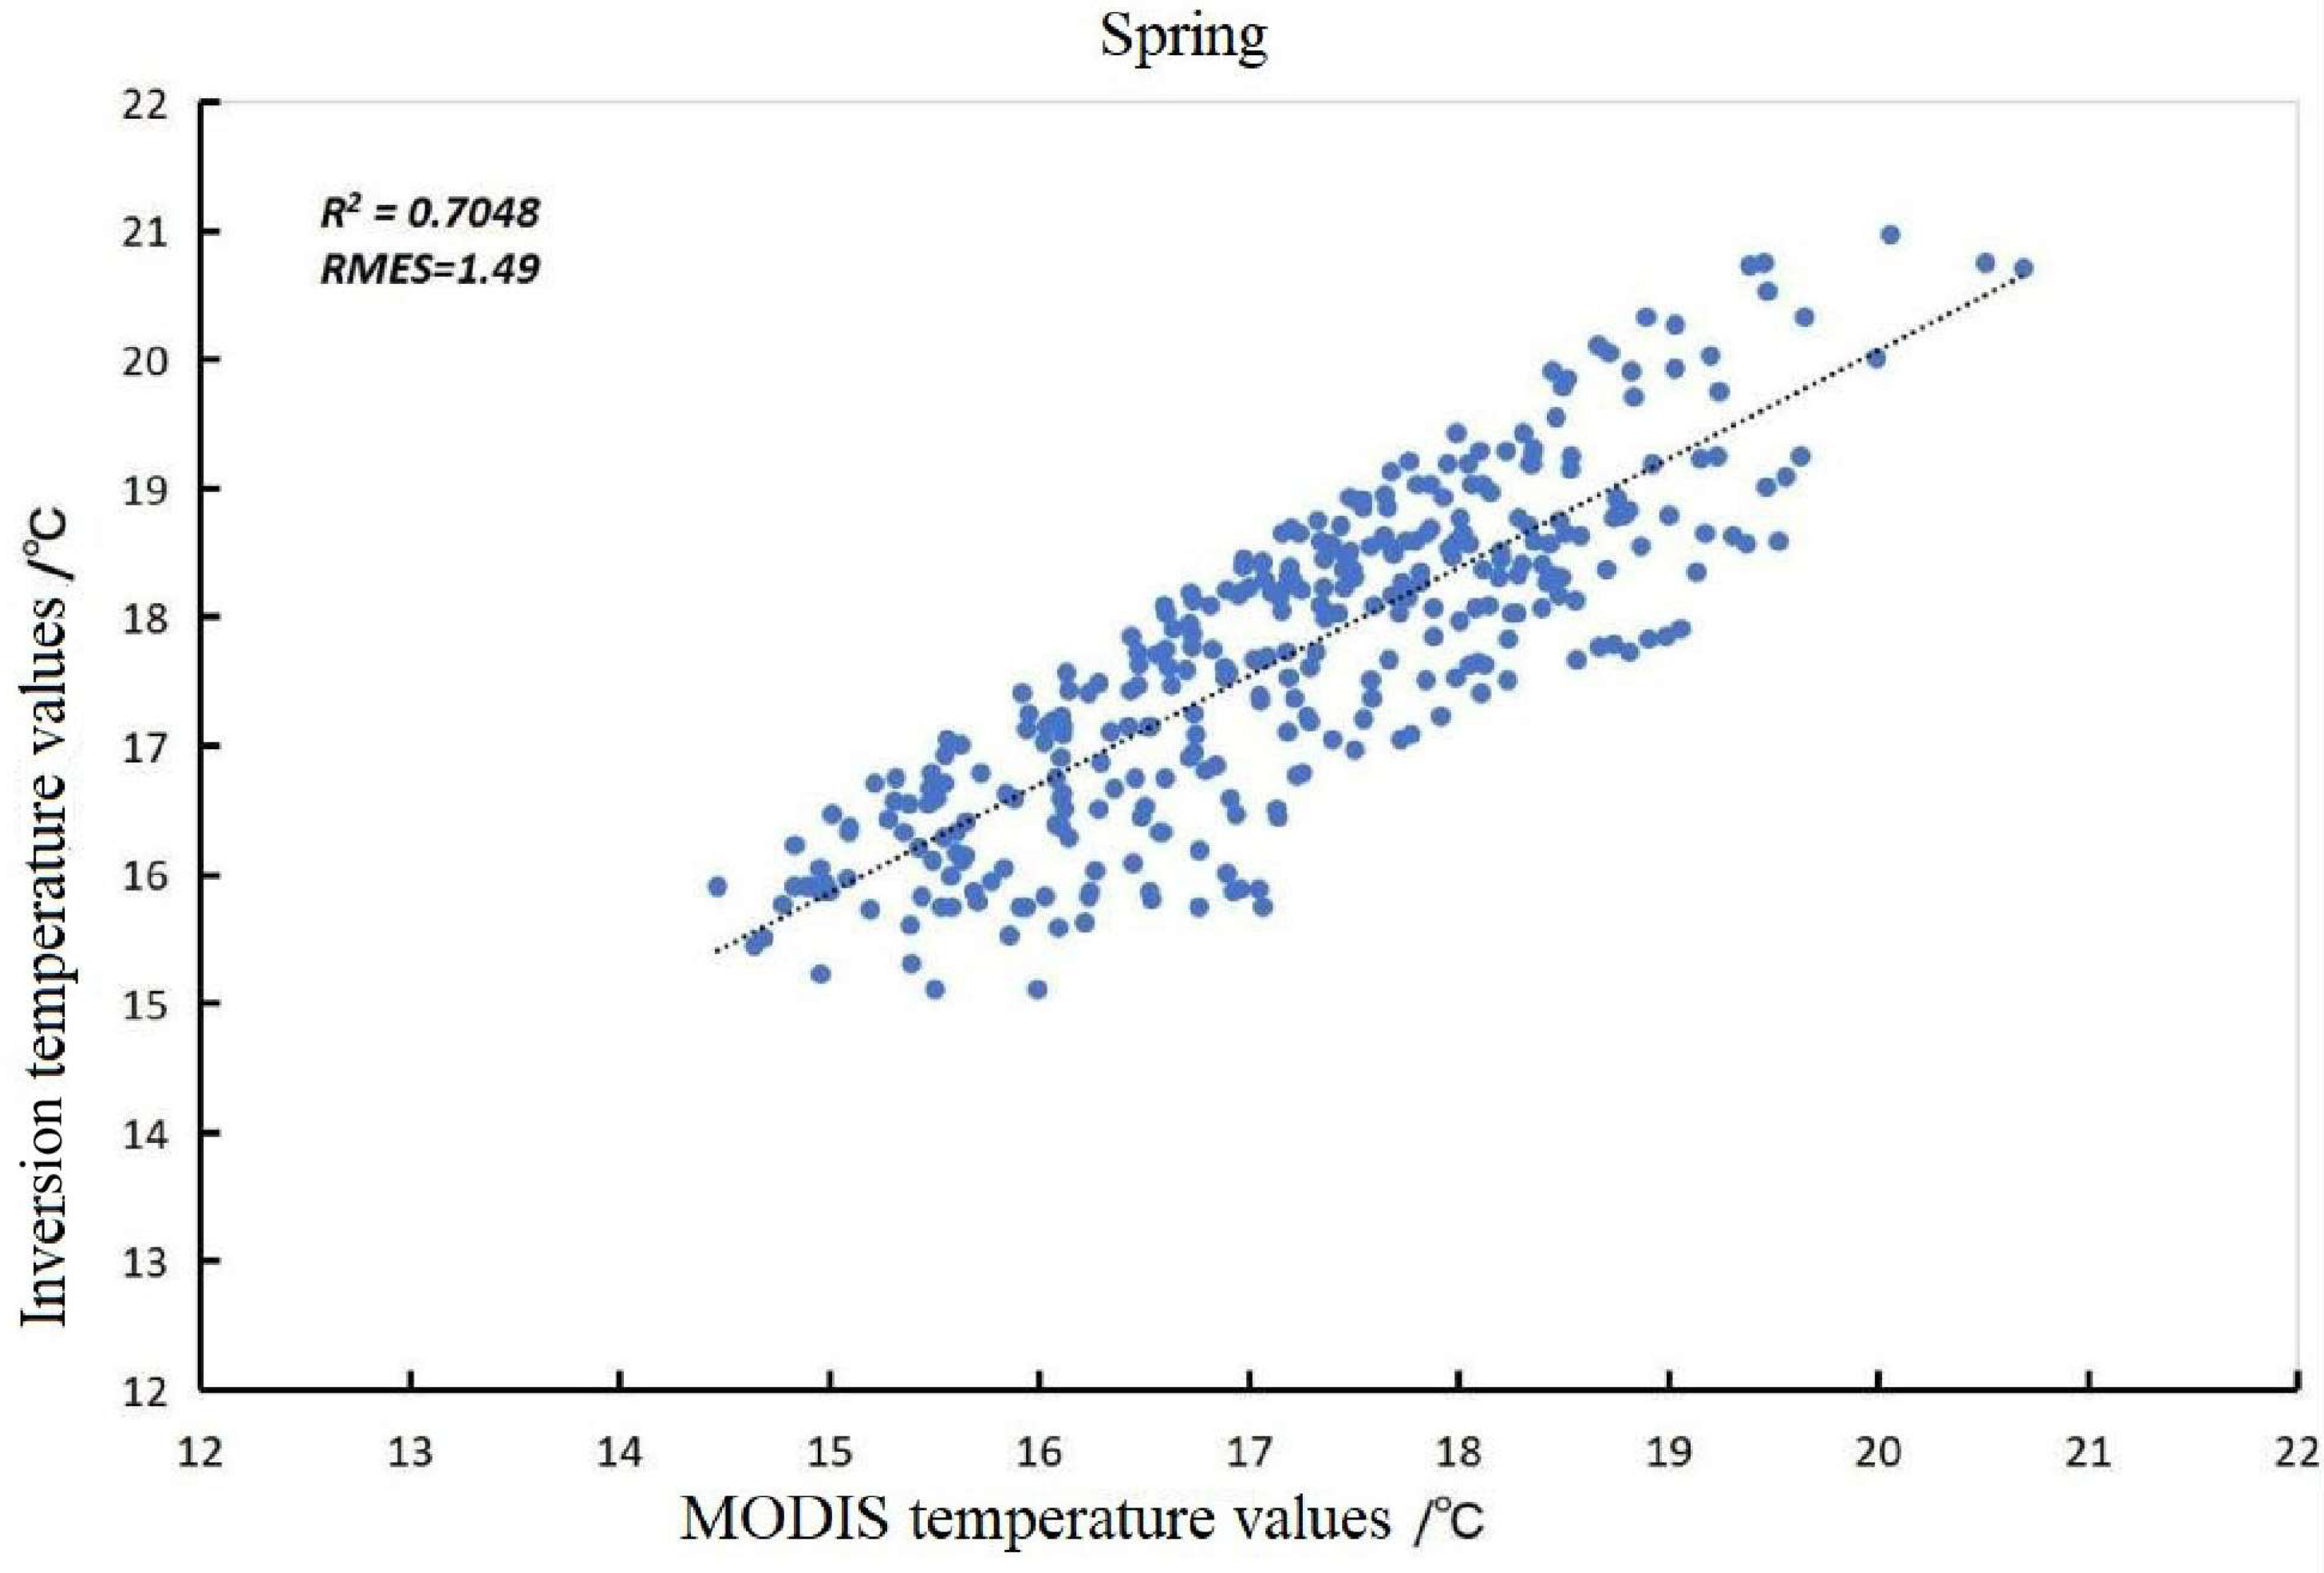
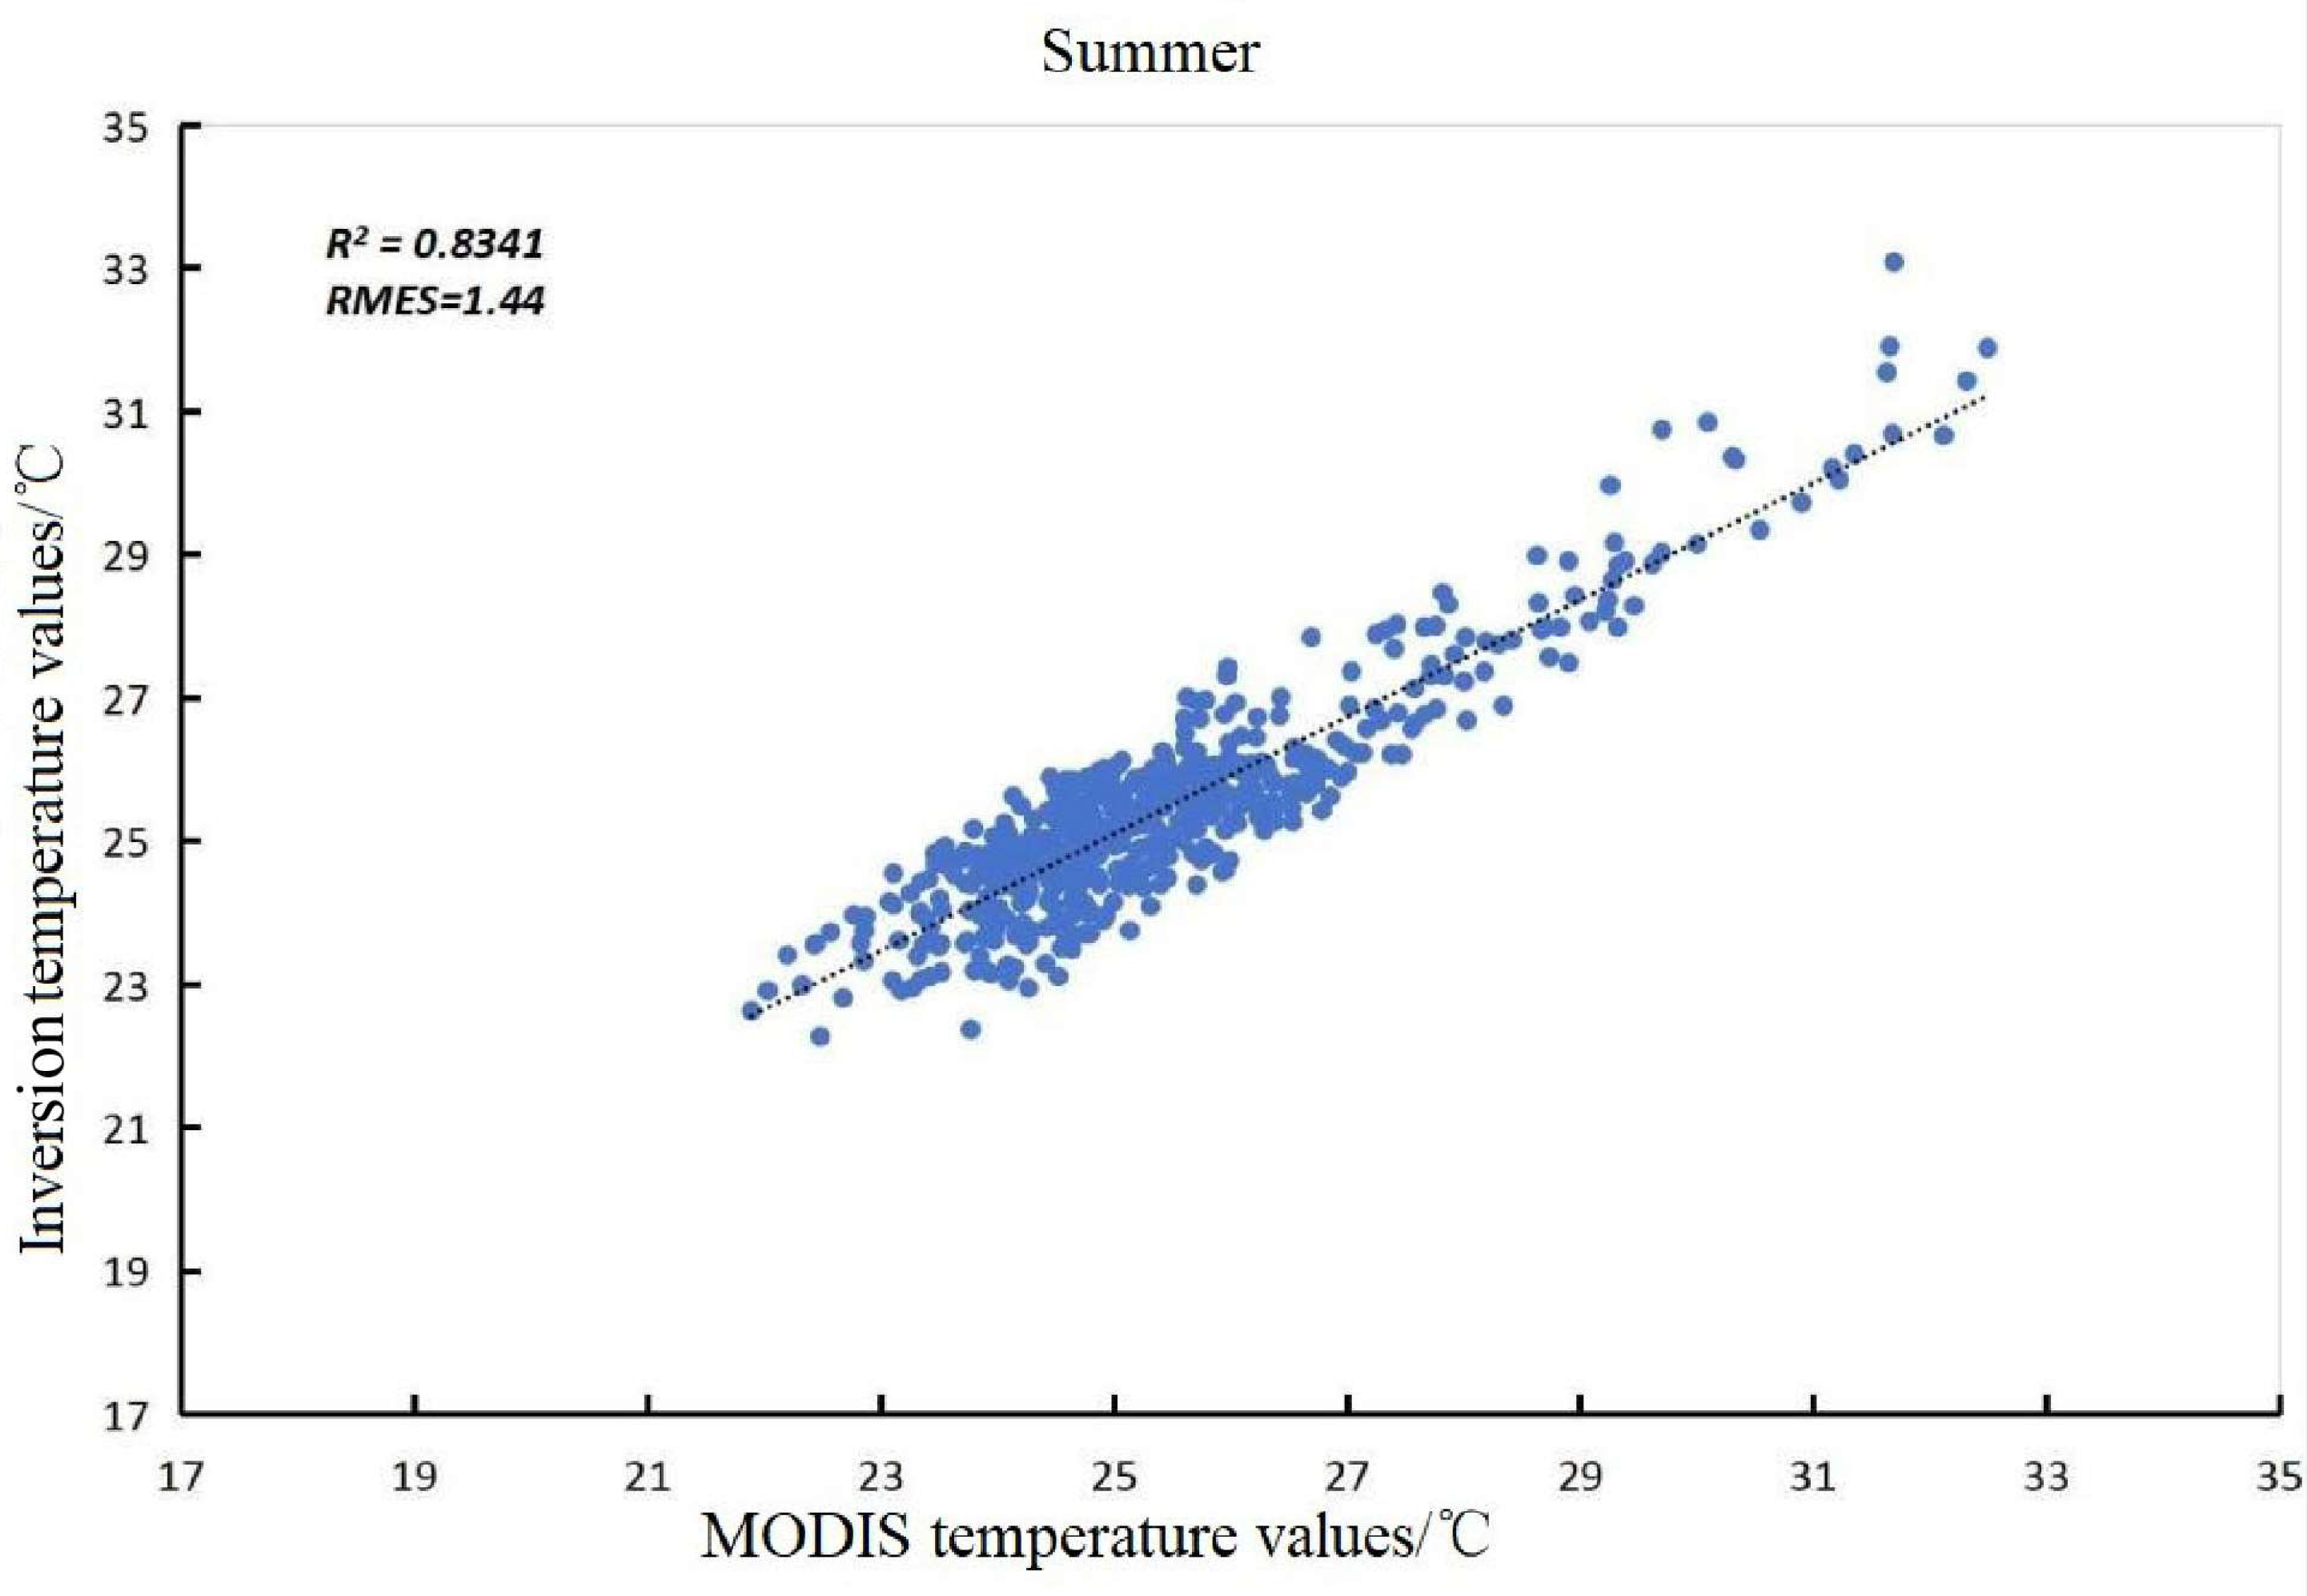
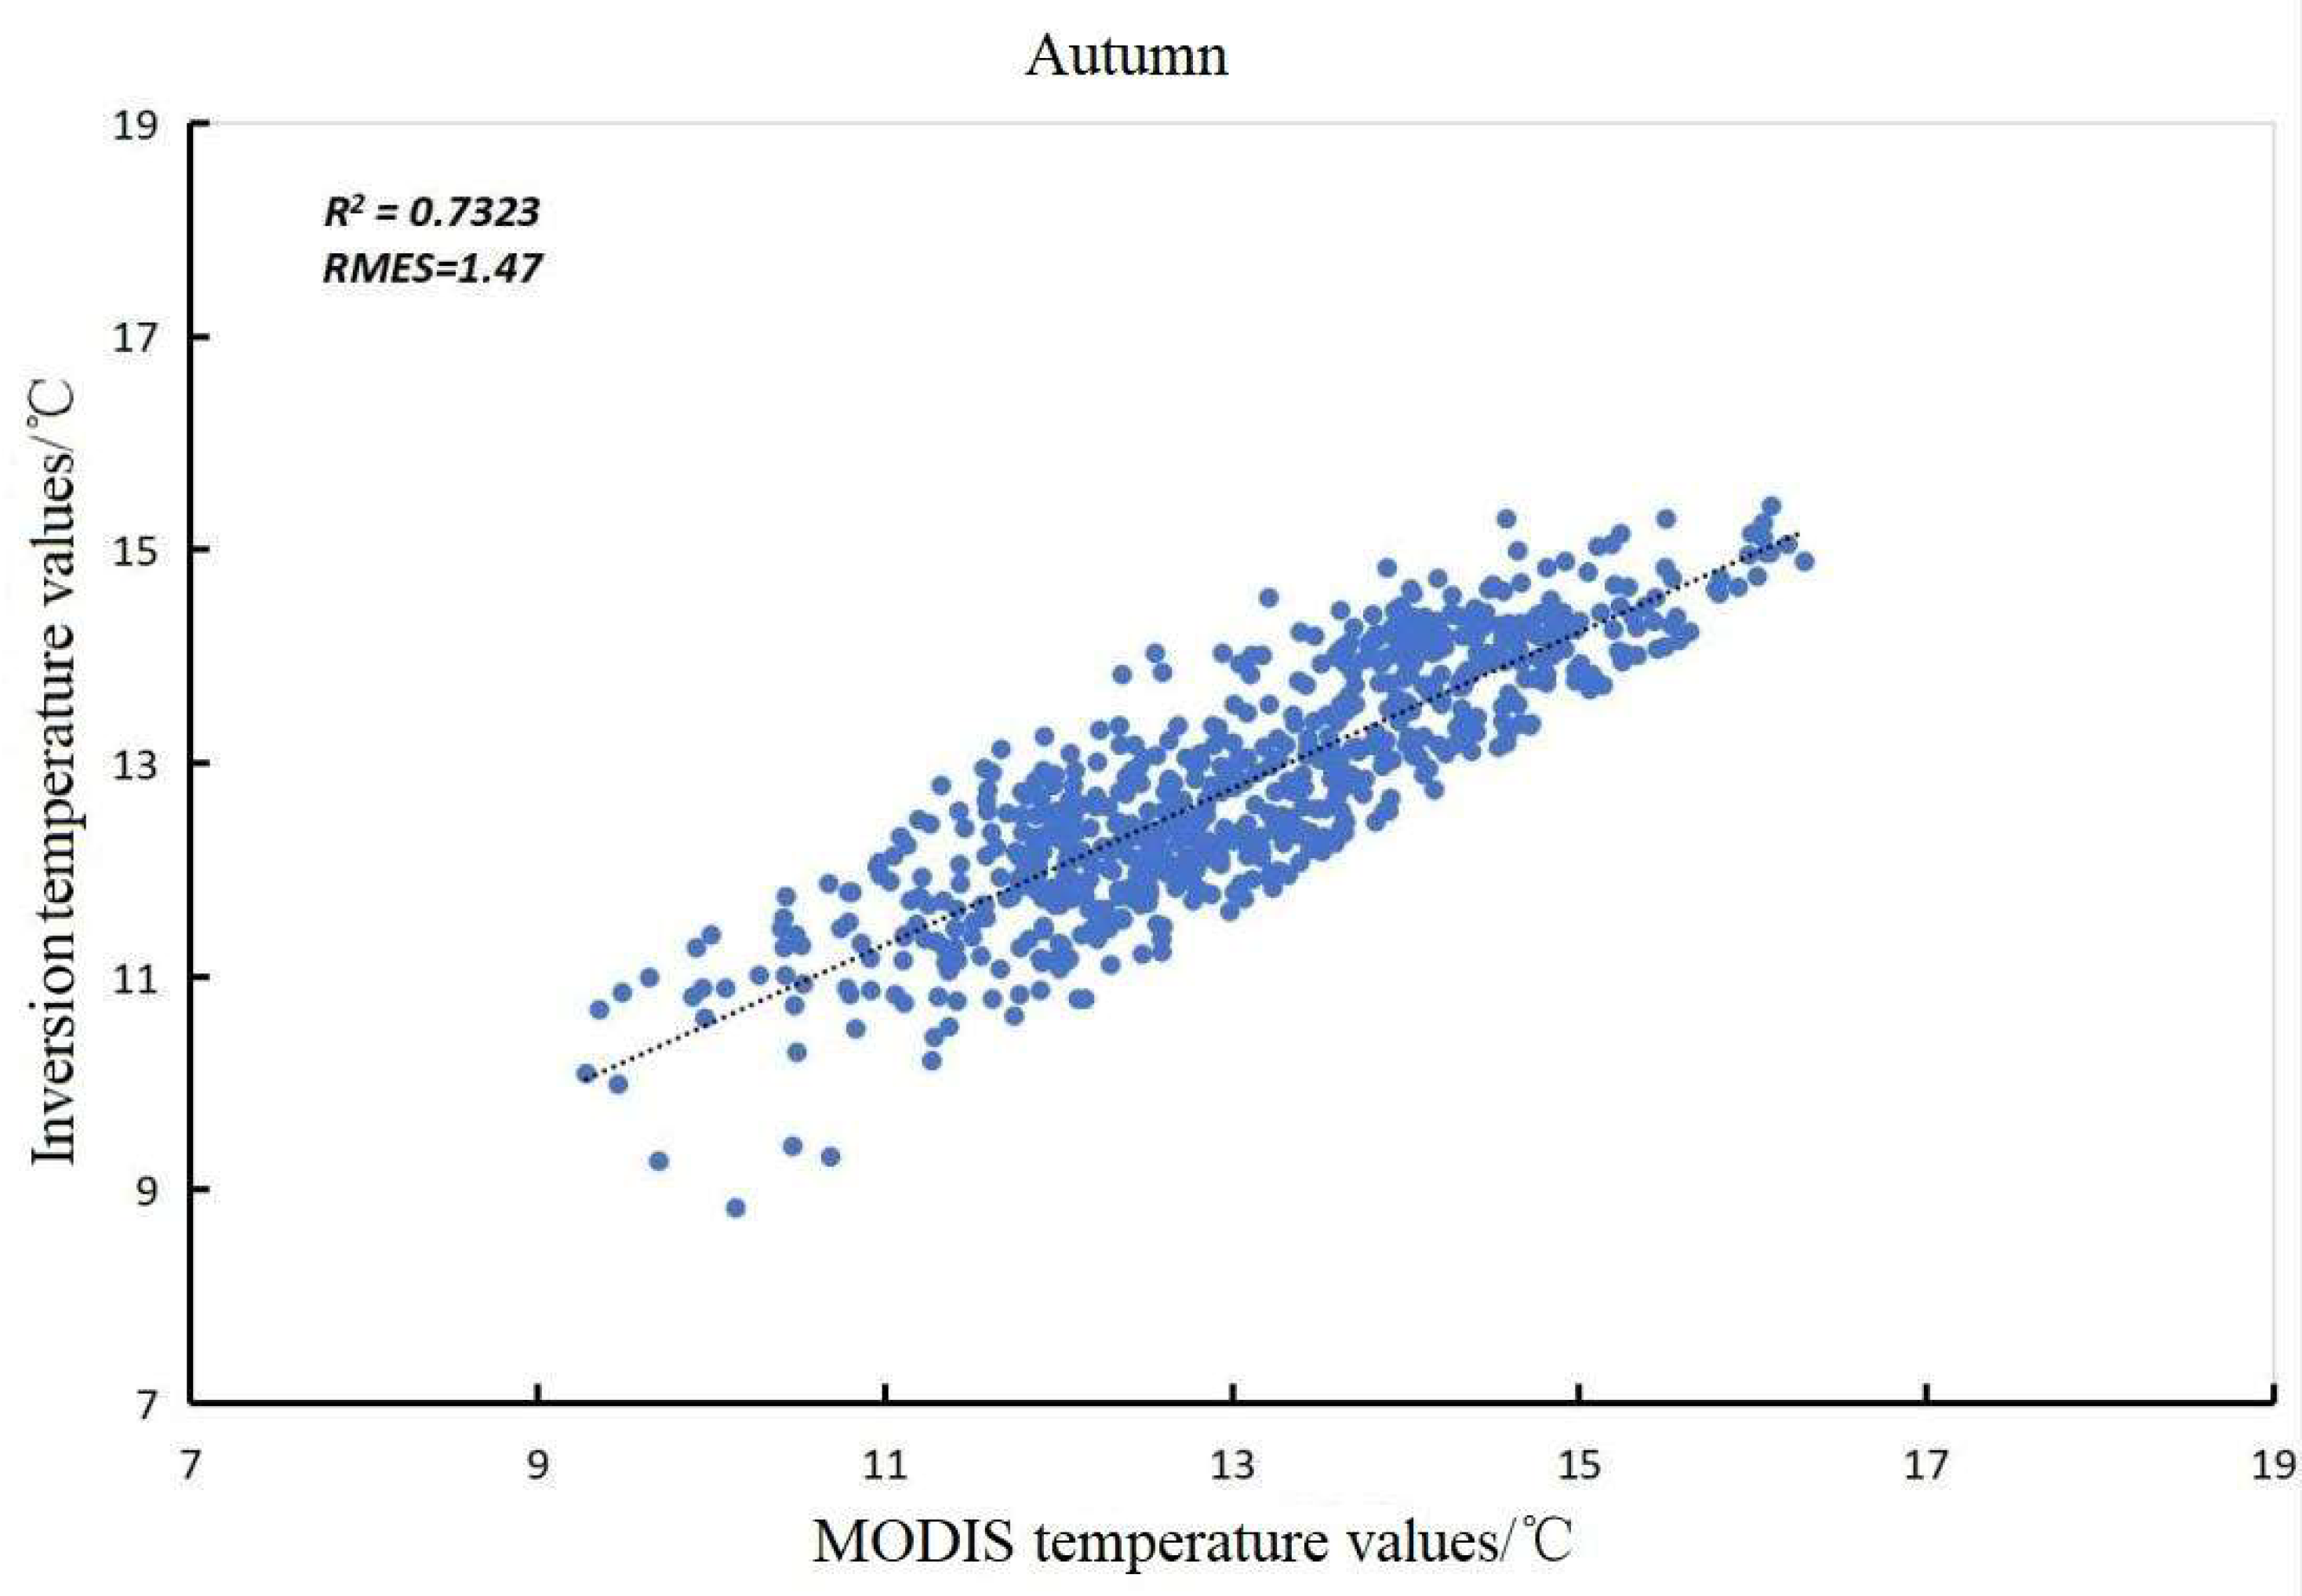
2.4. Verification of Accuracy

To ensure the accuracy and reliability of surface temperature data, this study employed a comparative validation method using MODIS surface temperature products. Leveraging the built-in modis_conversion_toolkit in the ENVI 5.3 software, data preprocessing was conducted efficiently. Subsequently, a subset of temperature data was randomly selected for regression analysis to evaluate the precision and consistency of the surface temperature estimates. The detailed results and comparative analyses are presented in Table 1 and Figure 2, Figure 3, Figure 4 and Figure 5, which illustrate the performance of the surface temperature data across various locations in relation to the MODIS product.
The analysis results significantly reveal the high correlation between the MODIS and inversion values, with the values of the coefficient of determination R2 reaching 0.7048 and 0.8341, showing an almost consistent trend between the two groups of data; the maximum error did not exceed 10%, and the average error was only 2.2%, which meets the requirements of the study on the accuracy of the data, and jointly verifies the accuracy and reliability of the inversion method for surface temperature adopted in this paper. Together, these results verify the accuracy and reliability of the surface temperature inversion method adopted in this paper, and provide a solid data foundation for subsequent analysis of and research on urban surface temperature.

3. Results

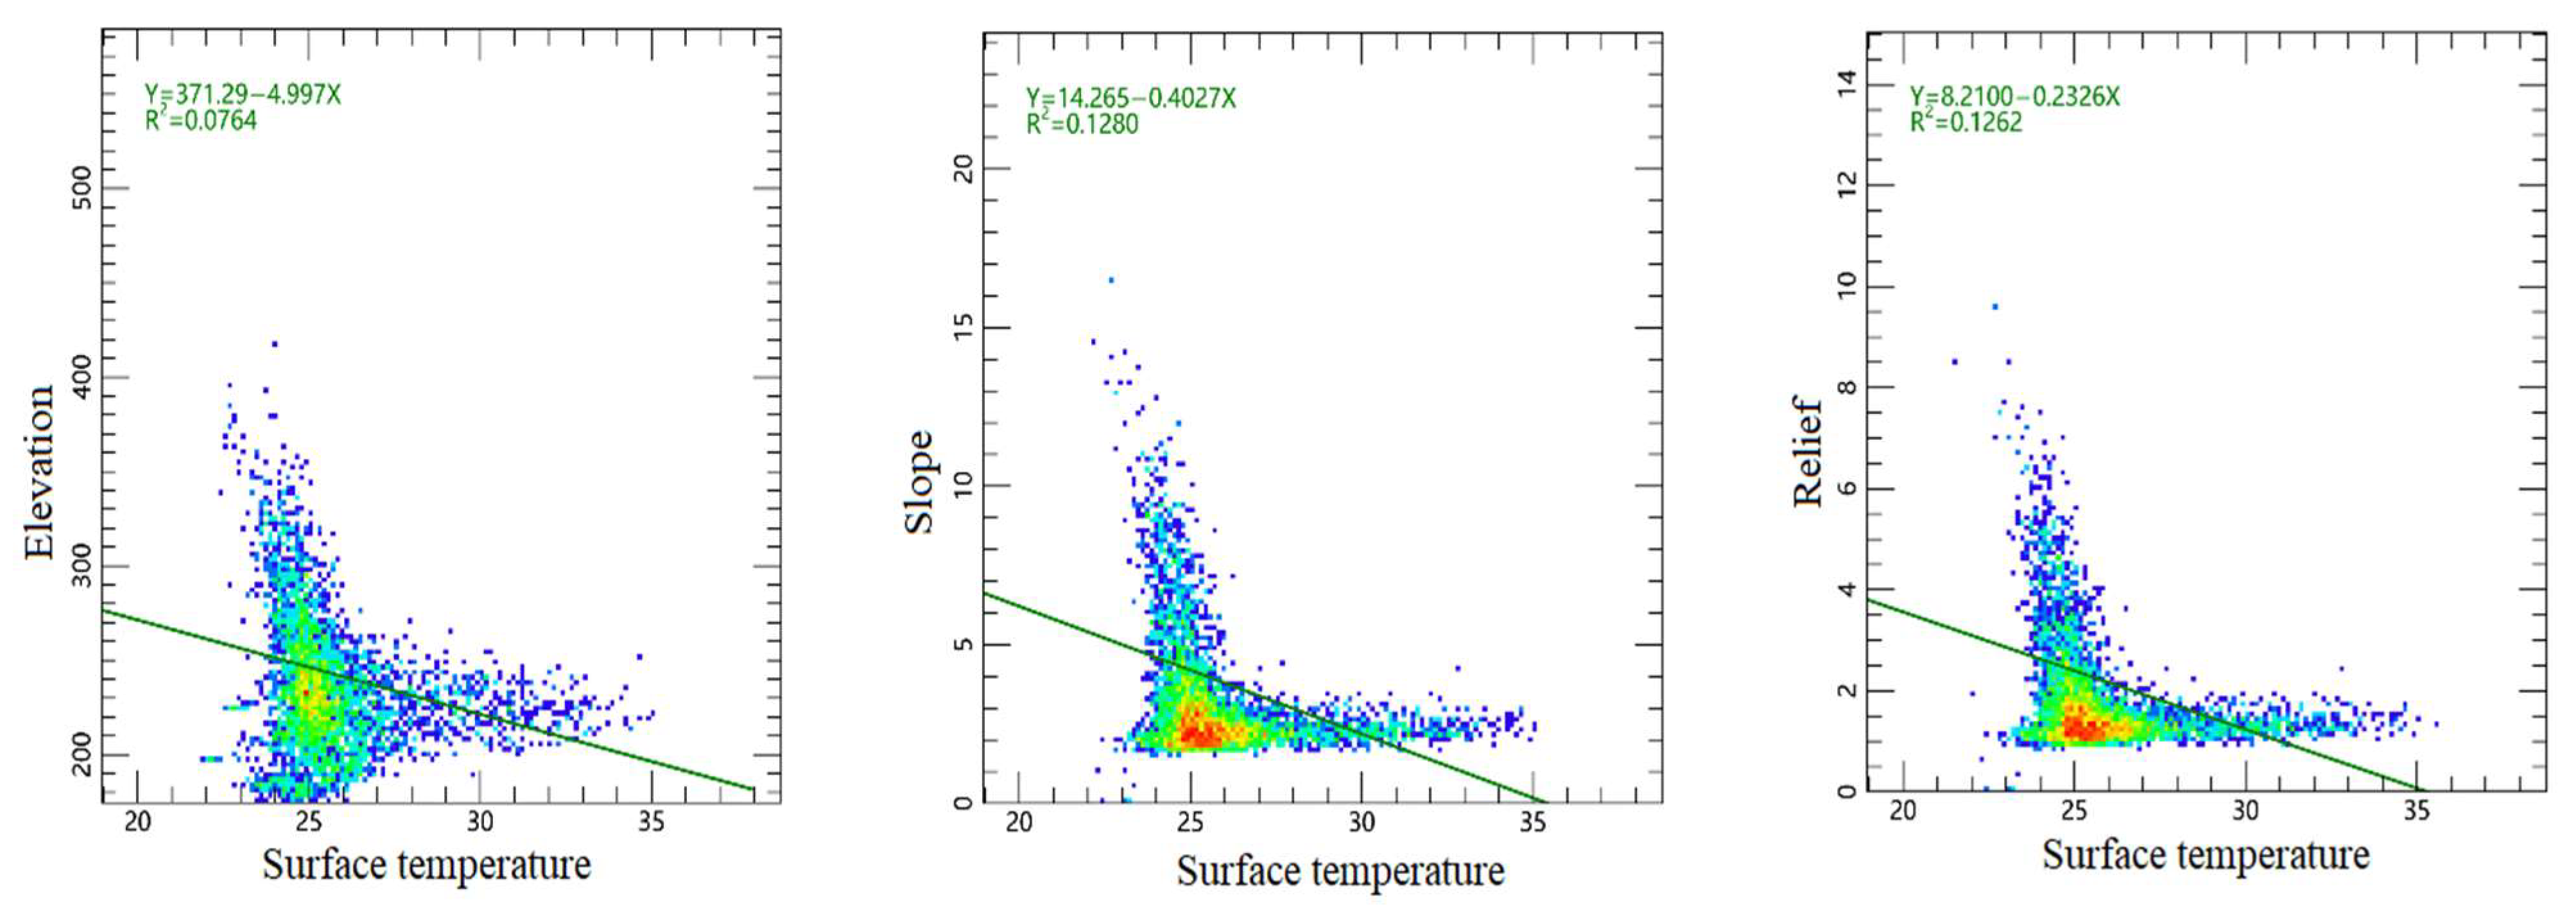
3.1. The Influence of Topographic Factors on Surface Temperature in Changchun City

The outcomes of the correlation analysis for the three topographic factors—elevation, slope, and relief—are illustrated in Figure 6.
The correlations between each of the three topographic factors and surface temperature were found to be relatively weak. Notably, elevation exhibited the weakest correlation with surface temperature, while slope demonstrated a slightly stronger association. The coefficients of determination (R2) for all three factors were found to be below 0.15.

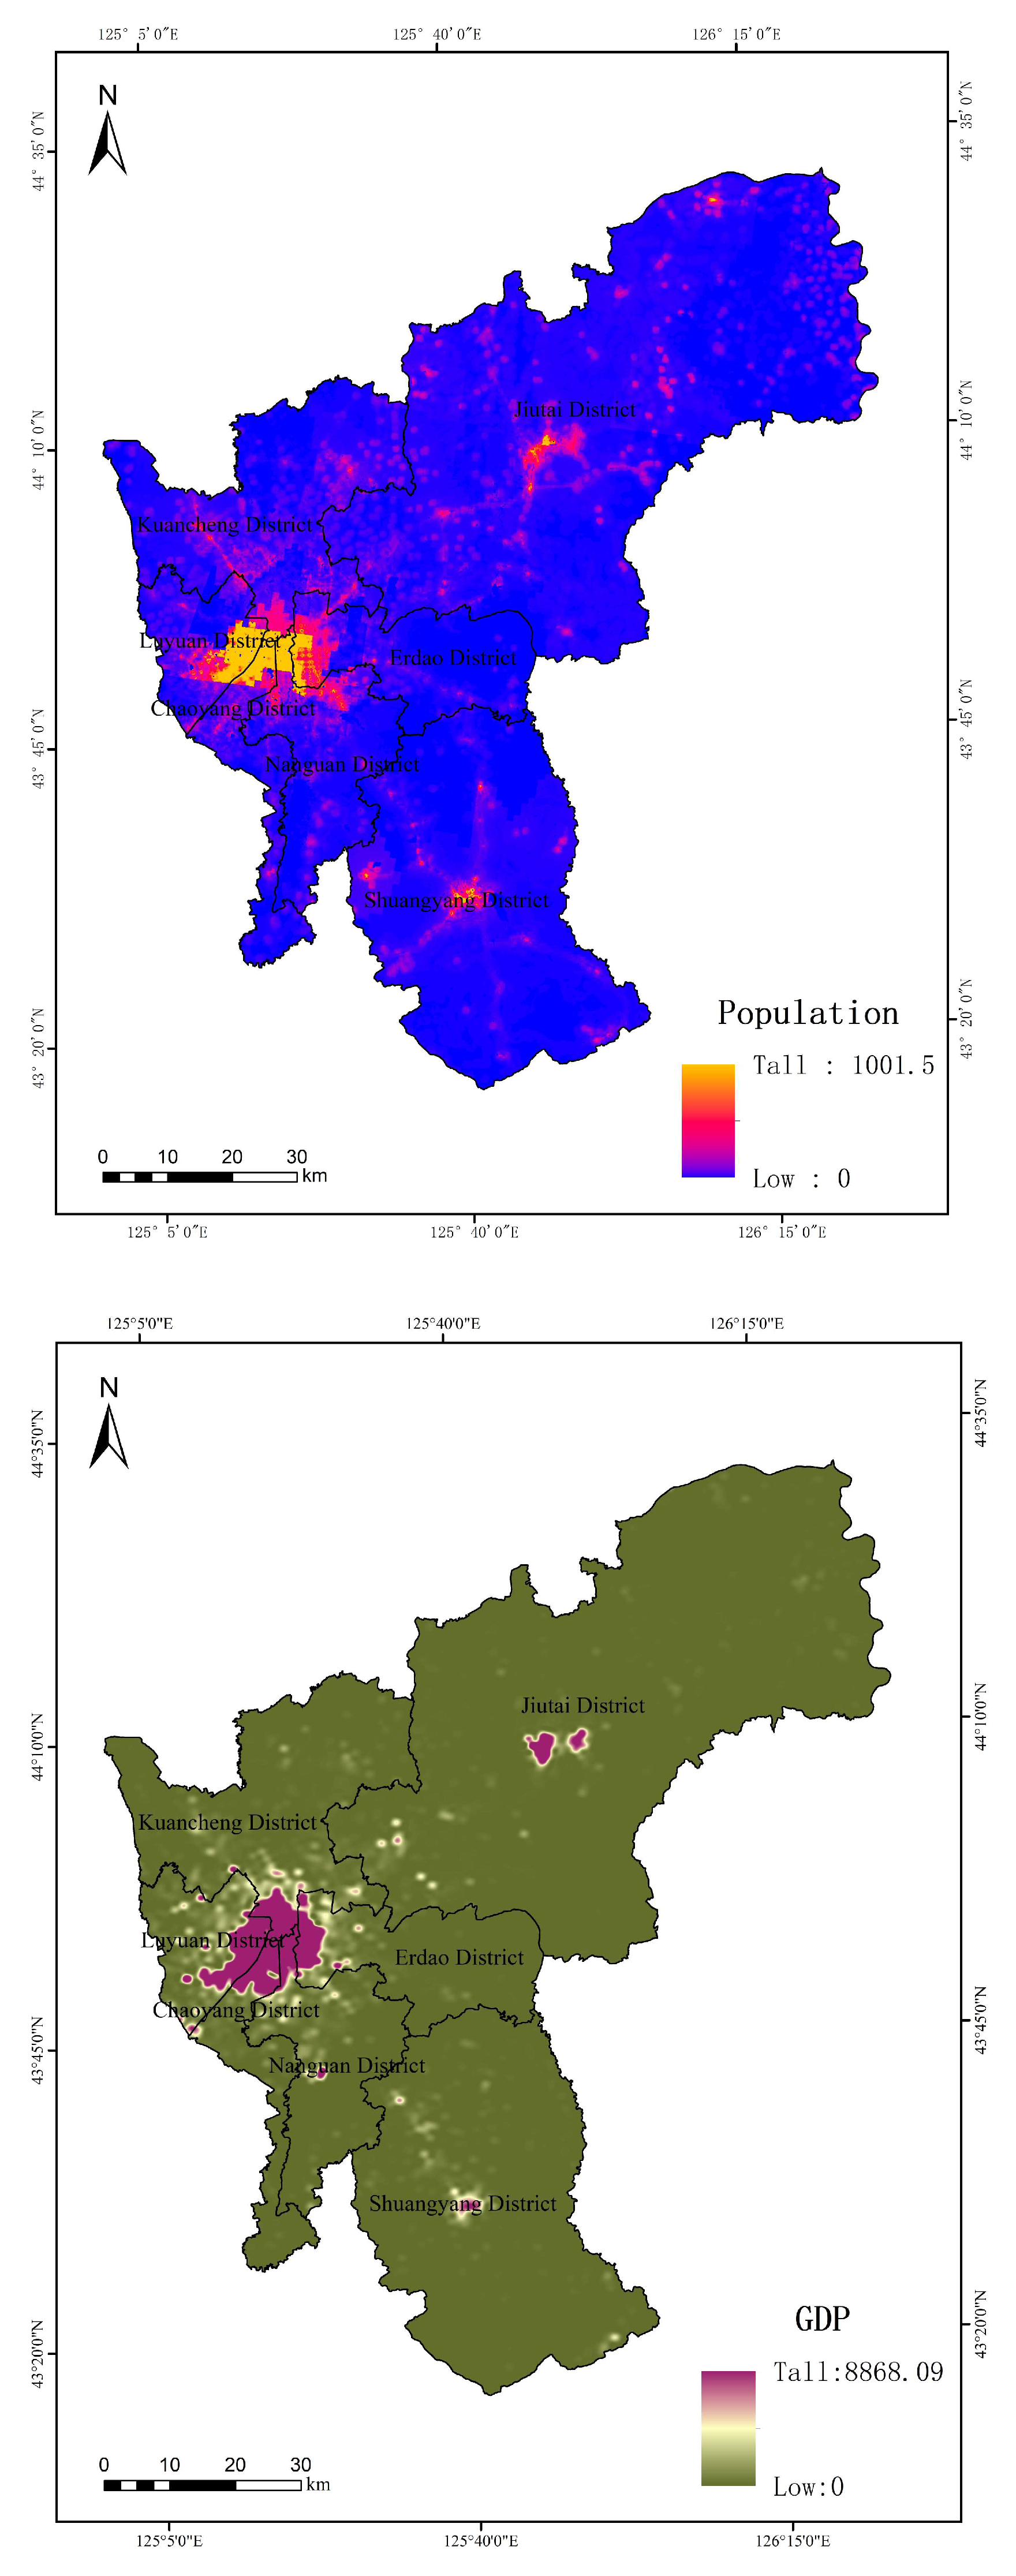
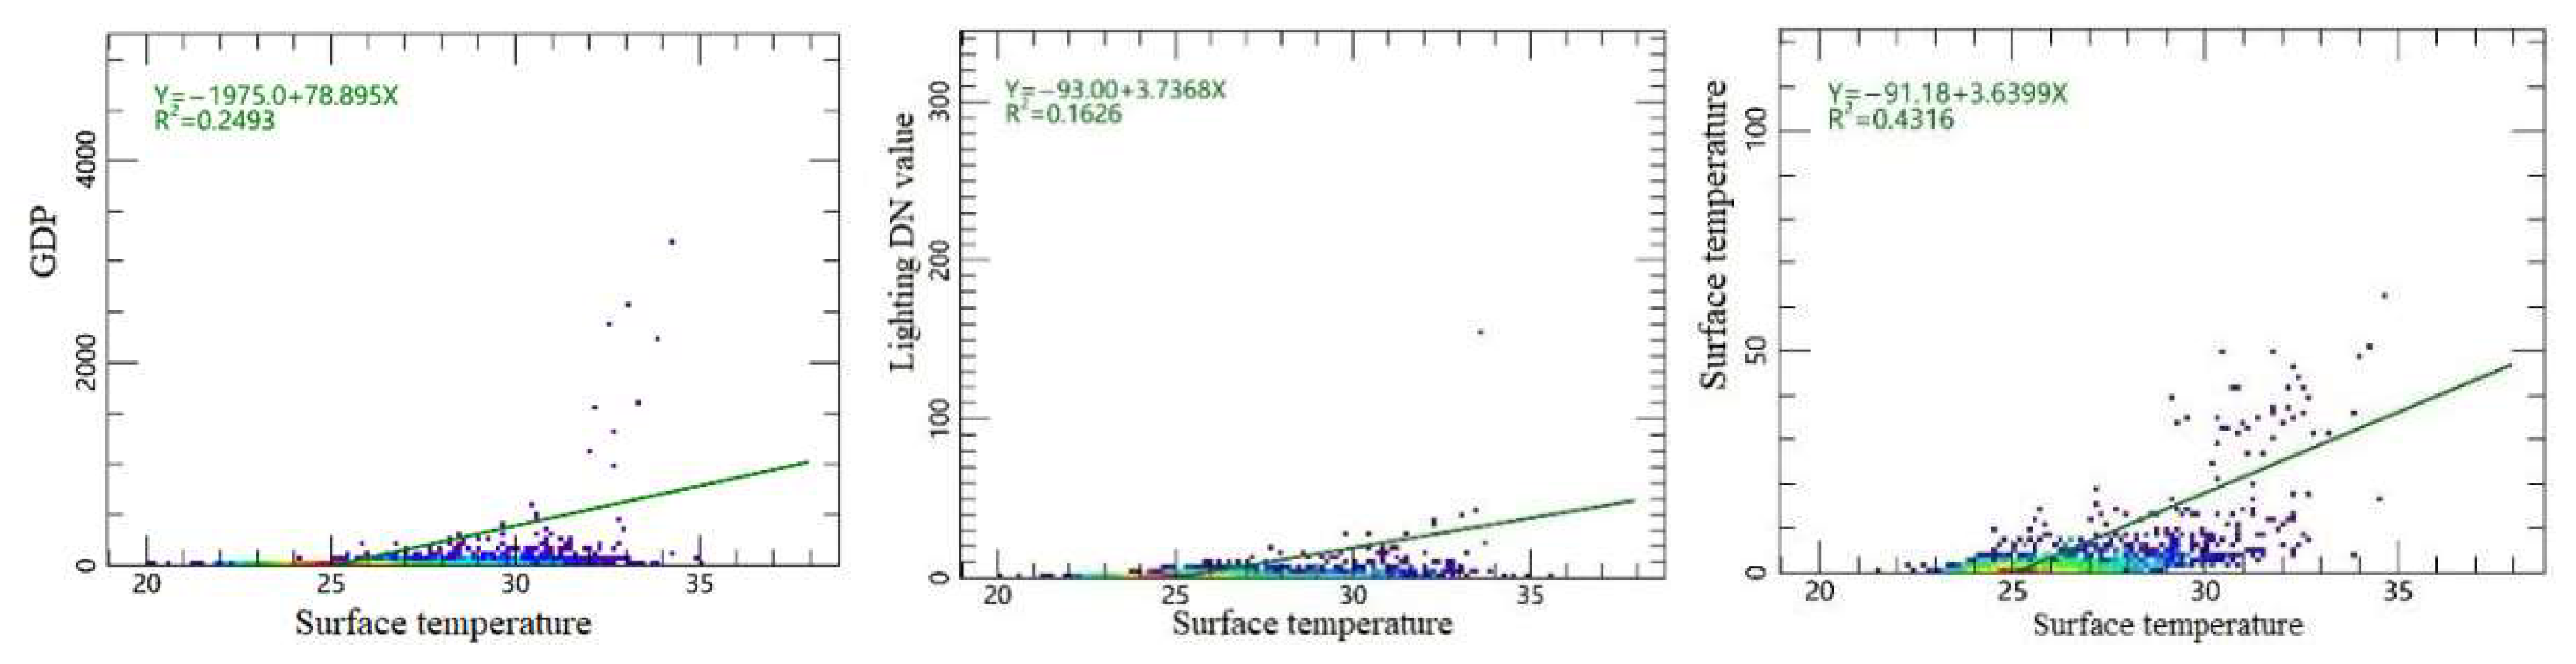
3.2. The Influence of Socio-Economic Factors on Surface Temperature in Changchun City

The population density distribution map reveals a marked concentration of population in the central urban areas, particularly within the Greentown, Kancheng, Chaoyang, Nanguan, and Erdao districts. Conversely, the Jutai and Shuangyang districts exhibit lower population densities. Overall, population density predominantly clusters in the eastern part of Changchun, radiating outward in a point-like pattern, with smaller population agglomerations also observable in the Jutai and Shuangyang districts. Similarly, the map of GDP per unit area demonstrates a consistent distribution pattern with population density. Specifically, GDP levels are higher in the central city, radiating outward in a similar point-like manner, while both the Jiutai and Shuangyang districts contain localized GDP peaks, also following a point-like outward distribution. The night-time lighting map corroborates the distribution trends of the previous two datasets, with the central city exhibiting brighter night-time illumination and the surrounding urban areas being dimmer. Additionally, two small areas in the Jiutai and Shuangyang districts show elevated night-time lighting intensity, further reflecting their local economic and demographic characteristics (Figure 7).
Figure 8 illustrates the correlations between three socio-economic factors—population density, GDP, and night-time lighting—and surface temperature. Given the high mobility of the population, night-time lighting was utilized as a supplementary indicator to assess population density. The analysis reveals that night-time lighting exhibits the weakest correlation with surface temperature, with a coefficient of determination (R2) of 0.1626. In contrast, GDP shows a moderately stronger correlation with surface temperature, with an R2 of 0.2493, while population density demonstrates the highest correlation, with an R2 of 0.4316. These results indicate that, among the three socio-economic factors, population density exerts the most significant influence on surface temperature.

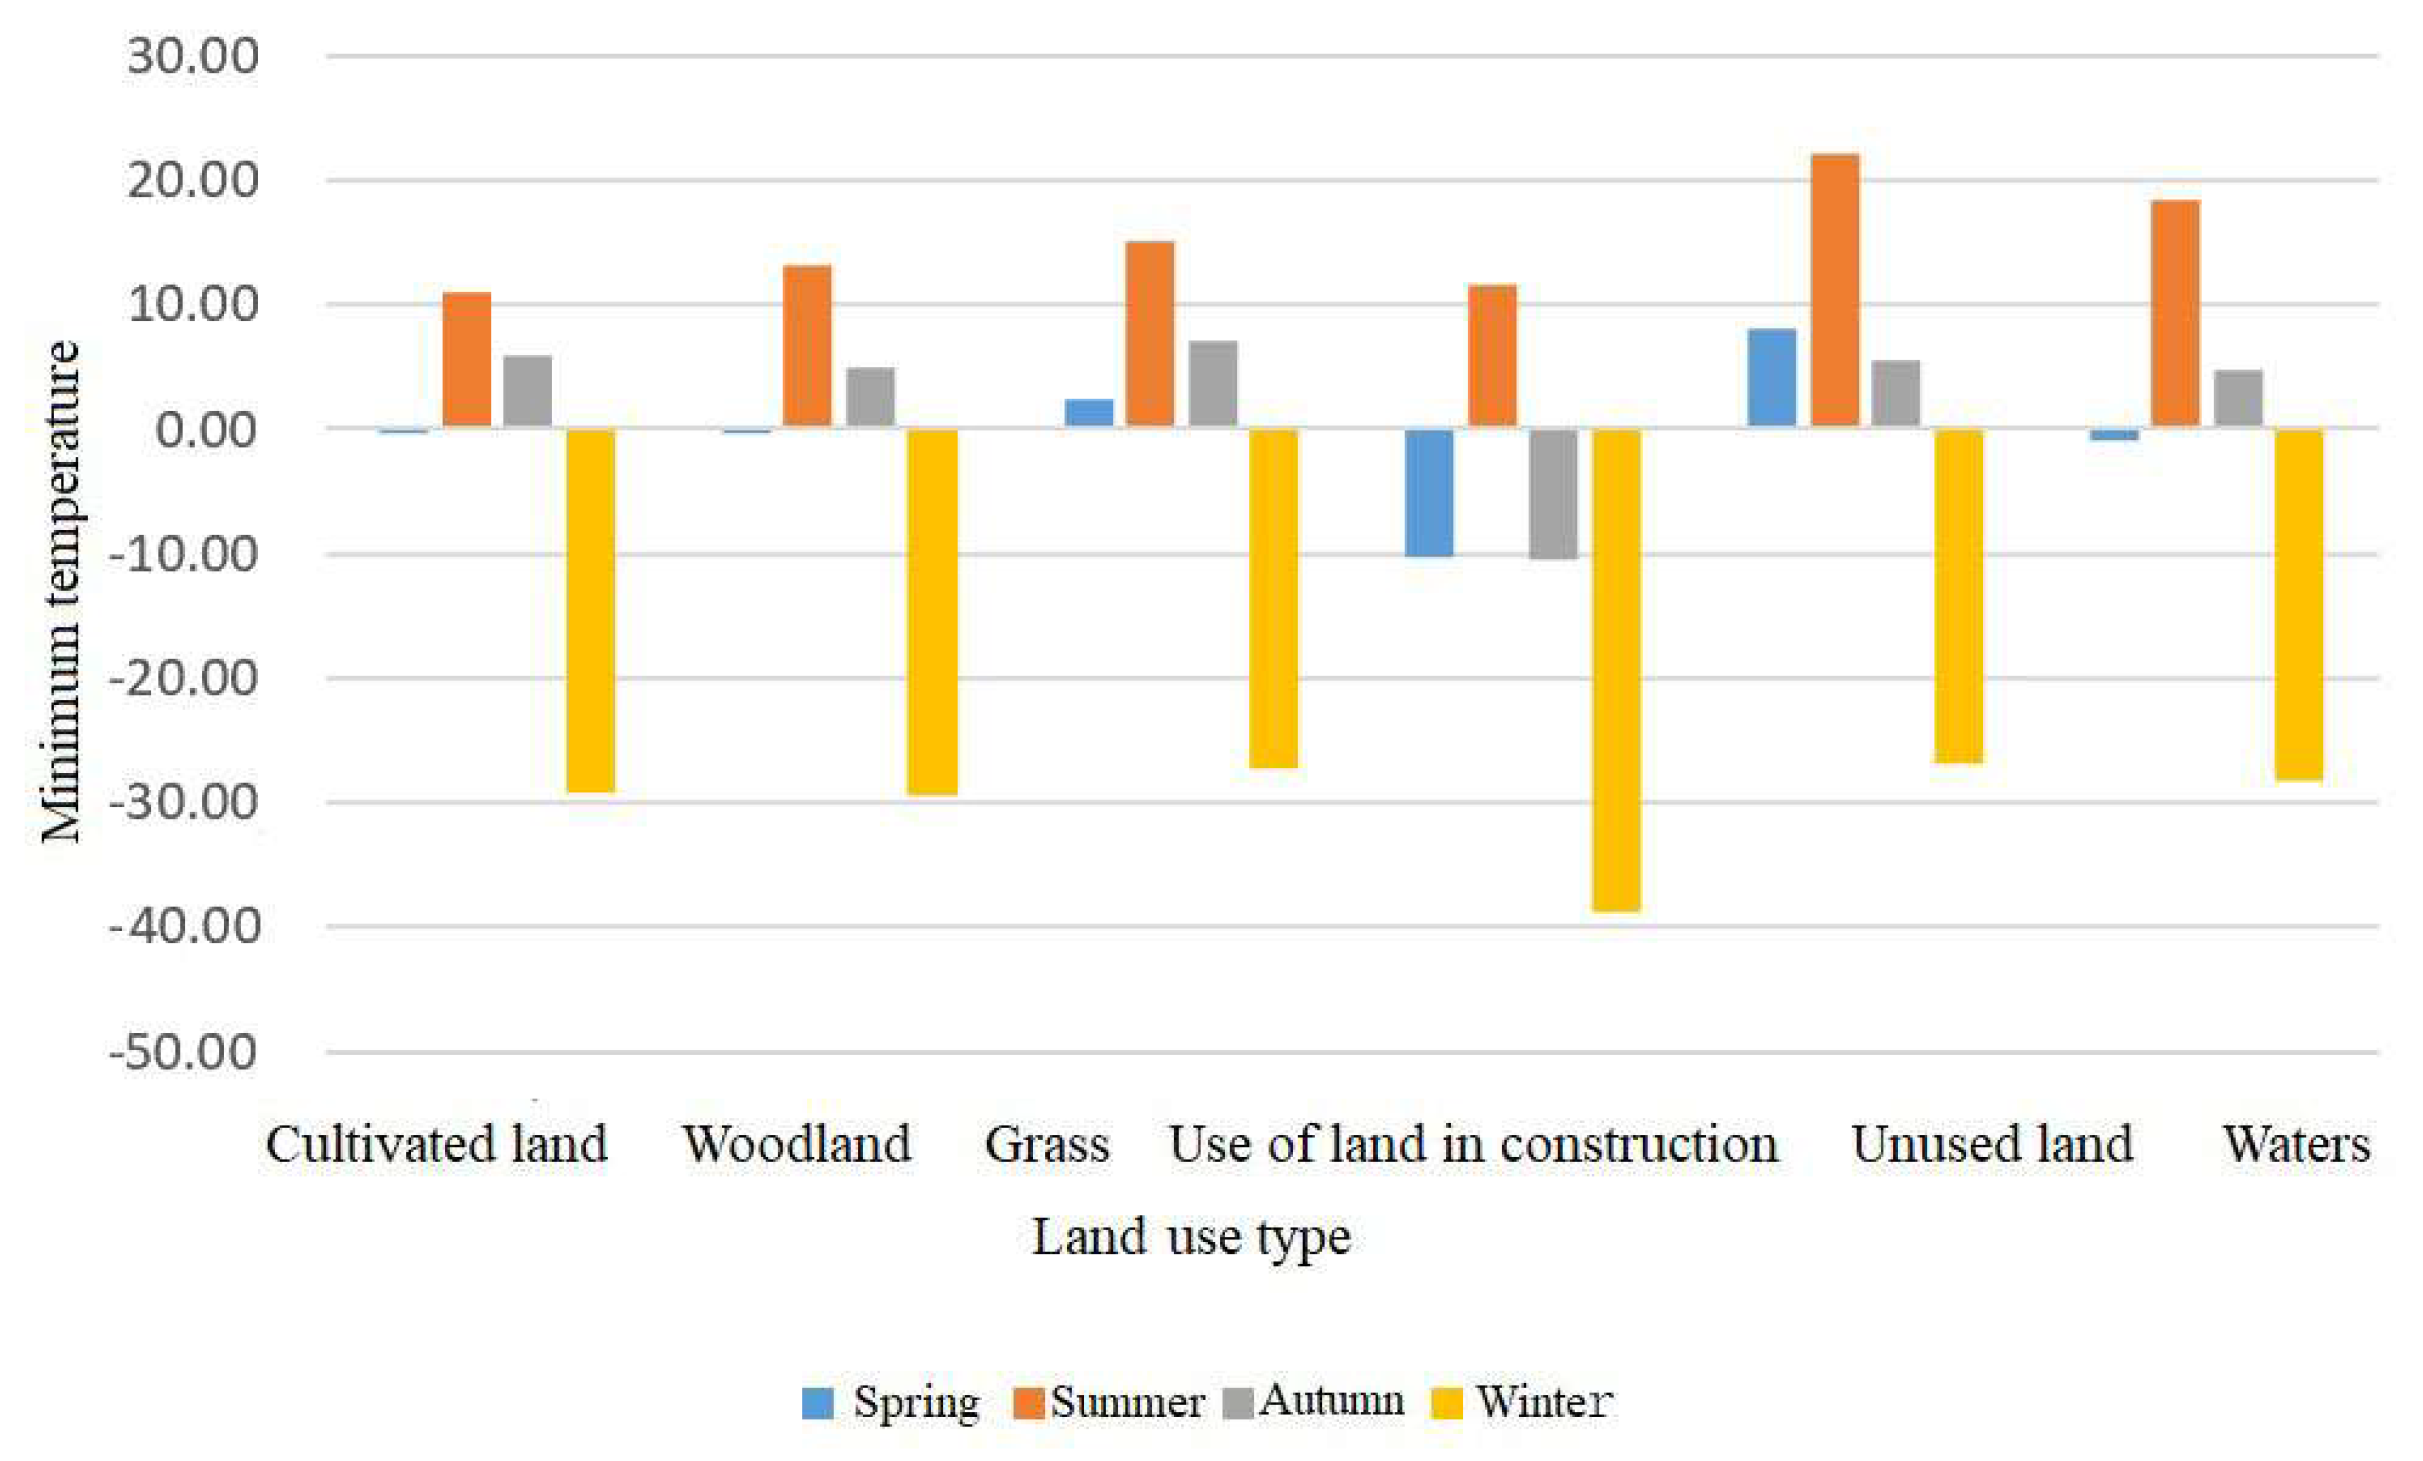
3.3. The Impact of Land Use on Seasonal Surface Temperature in Changchun City

The land use types were categorized into six distinct variables: watershed, cropland, forest land, grassland, construction land, and unutilized land. The accuracy of the land use classification was verified, with an explanation accuracy of 89% achieved. For subsequent analysis, surface temperatures corresponding to different land use types across various seasons were extracted, including the average, minimum, and maximum temperatures. Statistical graphs, as shown in Figure 9, were generated to depict the distribution of average temperatures. The analysis reveals that, in both spring and summer, unutilized land exhibited the highest surface temperatures, while water bodies recorded the lowest temperatures. In autumn, unutilized land again showed the highest temperatures, with water bodies maintaining the lowest. During winter, surface temperatures were highest on unutilized land and lowest on forested land. In terms of maximum temperatures, cropland recorded the highest temperatures in spring, while grassland had the lowest. In summer, built-up land experienced the highest temperatures, whereas woodland had the lowest. In autumn, the highest temperatures were observed on built-up land, and the lowest were observed on cropland. In winter, the maximum surface temperatures were highest on water bodies and lowest on woodland. For minimum temperatures, in spring, unutilized land exhibited the highest temperatures, while water bodies recorded the lowest. In summer, water bodies had the highest minimum temperatures, while cropland had the lowest. In autumn, grassland displayed the highest minimum temperatures, with built-up land showing the lowest. In winter, built-up land had the highest minimum temperatures, and unutilized land had the lowest. In summary, surface temperatures were consistently higher on unutilized land and lower on water bodies and forested land across all seasons.

3.4. Analysis of the Impact of Multiple Factors on Surface Temperature

A comprehensive examination of the influence of the seven factors on surface temperature reveals their respective contributions to the model in the following order: population, night-time lighting, slope, land use, GDP, relief, and elevation. Further details are presented in Figure 10.
The influence of each factor on the surface temperature model, ranked in descending order, is as follows: population, light, land use, GDP, relief, and elevation. Among these factors, population, light, land use, GDP, relief, and elevation exhibit a positive correlation with surface temperature, whereas slope shows a negative correlation. Detailed information is provided in Figure 11.

4. Discussion

4.1. The Influence of Topography on Surface Temperature

The elevation and slope of the terrain significantly influence the distribution and intensity of solar radiation [7]. In higher-altitude regions, where atmospheric pressure is lower and air contains less moisture and dust, solar radiation is more direct and intense, leading to higher surface temperatures in mountainous areas. Conversely, in lower-lying areas, the higher atmospheric pressure, coupled with greater moisture and dust in the air, results in solar radiation being partially shaded and scattered, thereby lowering the surface temperature. Additionally, the degree of undulation affects the surface temperature, as valleys, constrained by the topography, hinder airflow, facilitating the formation of inversion layers that result in higher surface temperatures. In regions with pronounced undulations, surface temperatures are consequently higher. In contrast, plains experience smoother airflow, and surface temperatures are more uniformly distributed due to the combined effects of solar radiation and airflow, resulting in relatively lower surface temperatures in areas with minimal undulation.

4.2. The Influence of Population Density on Surface Temperature

The influence of population density on surface temperature primarily stems from the environmental changes induced by human activities. Areas with higher population densities are typically characterized by an increased presence of buildings, roads, and other anthropogenic structures that absorb and retain solar radiation, resulting in elevated surface temperatures [18]. Moreover, human activities, such as vehicle exhaust and industrial emissions, generate substantial amounts of heat, further exacerbating the rise in surface temperatures [19]. Consequently, regions with denser populations tend to experience higher surface temperatures. The relationship between GDP and surface temperature is primarily driven by the environmental impacts of economic development [20]. As GDP increases, it is often accompanied by industrialization, urbanization, and higher energy consumption, all of which contribute to rising surface temperatures. For instance, industrial production and transportation release significant amounts of waste heat, and the proliferation of man-made structures during urbanization alters the heat balance of the surface. Therefore, areas with higher GDP levels tend to exhibit elevated surface temperatures. The effect of night-time lighting on surface temperature is mainly manifested through light pollution and thermal pollution. Artificial lighting interferes with the heat exchange process between the surface and the atmosphere, hindering the surface’s ability to effectively dissipate heat, which leads to an increase in surface temperature [21]. Additionally, urban areas illuminated at night are brighter than their surrounding regions, further raising the surface temperatures in urban settings relative to adjacent areas [22]. Warmer seasons, marked by heightened production, construction, and commercial activities, are particularly conducive to increased economic activity, which releases substantial heat. Heightened demand for transportation, vehicle exhaust, and roadway heat further influences surface temperatures, amplifying the urban heat island effect. Additionally, the increased use of air conditioning and refrigeration equipment during hot seasons leads to greater energy consumption, which, in turn, drives up surface temperatures.
Building upon a comprehensive understanding of the factors influencing surface temperature, future research could offer a more holistic assessment of the urban thermal environment’s impacts, including the consequences of the heat island effect on human health, urban ecosystems, and energy consumption. This would also pave the way for exploring effective urban planning and management strategies aimed at mitigating the heat island effect, enhancing urban climate resilience, improving urban living comfort, and providing robust support for the development of strategies for urban climate change adaptation and mitigation [23].

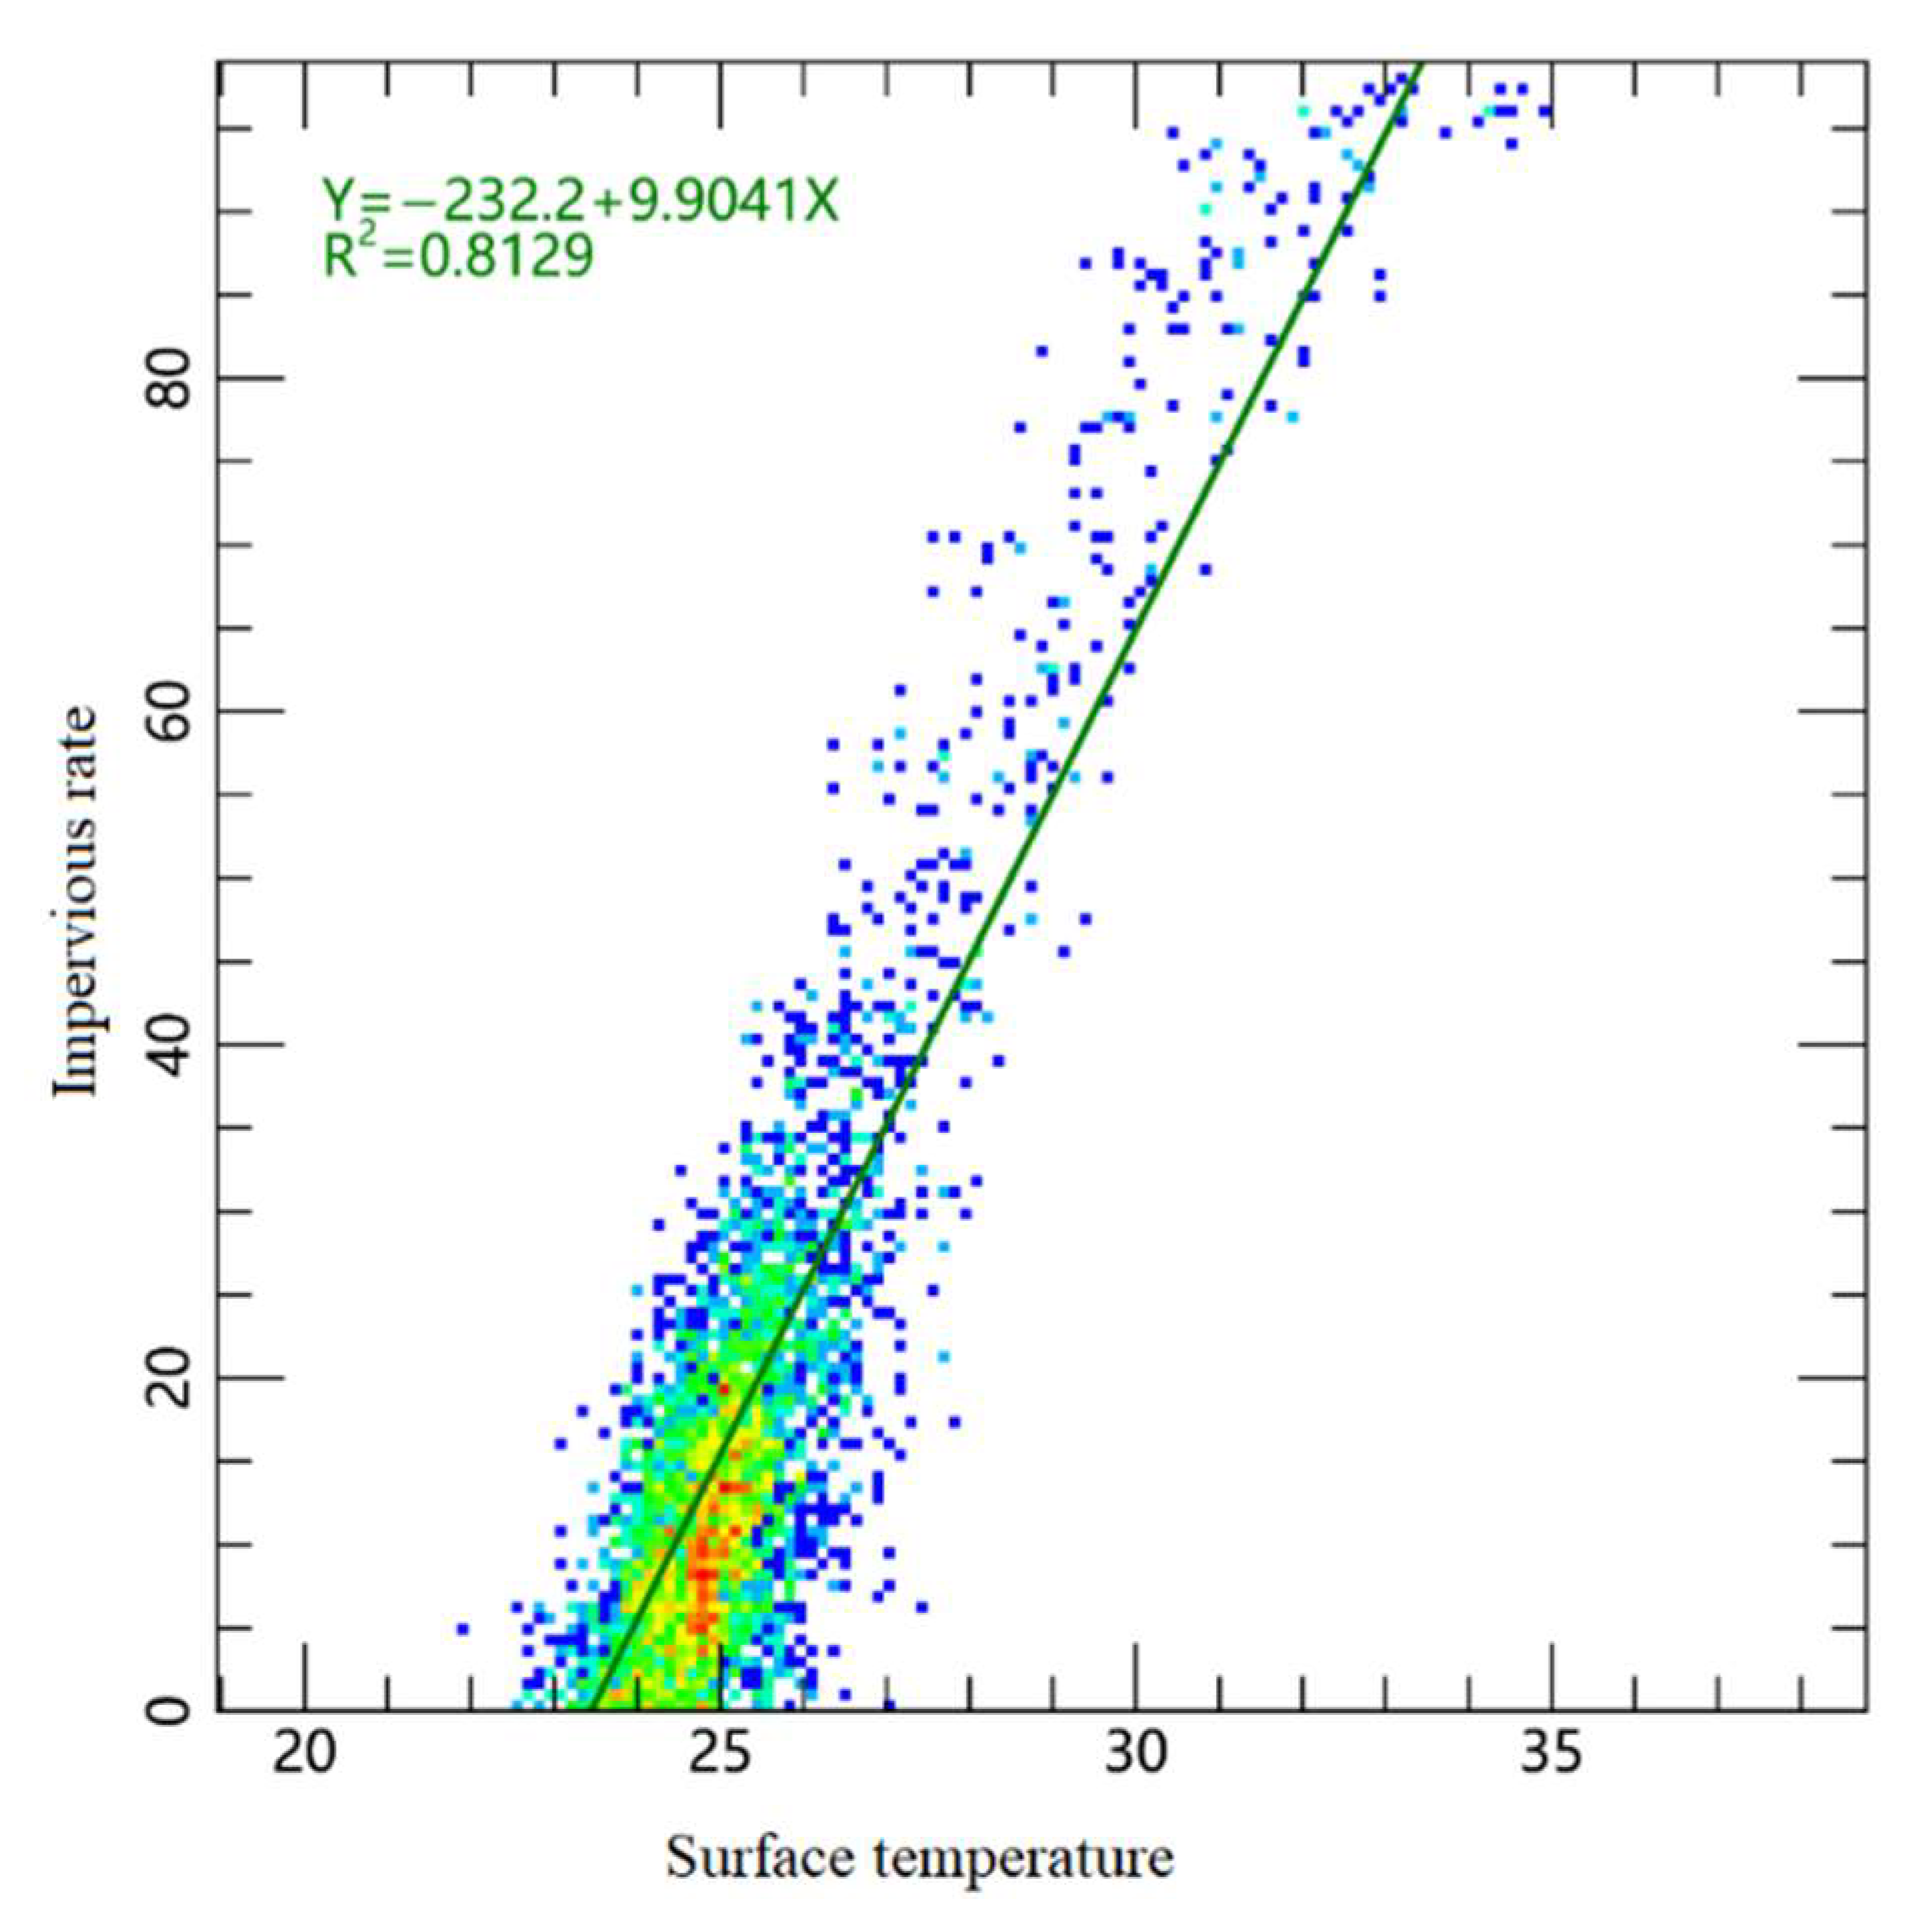
4.3. The Impact of Impervious Surfaces on Surface Temperature

Impervious surfaces are typically defined as those urban or other types of ground cover that do not permit water infiltration. These surfaces are generally composed of human-made structures, such as buildings, roads, and parking lots. In remote sensing imagery, impervious surfaces are typically identified by their higher brightness and reflectivity. In this study, imperviousness data were derived using land use type data, where built-up land was classified as impervious surfaces, while cropland, forested land, grassland, unutilized land, and water bodies were treated as permeable surfaces. The percentage of impervious surfaces within a unit area was then calculated.
Using SPSS 29.0 software, the correlation between imperviousness data and surface temperature was analyzed, with the resulting scatter plot presented in Figure 12. The analysis reveals a strong correlation, with the coefficient of determination (R2) being 0.8129. Several factors contribute to this high correlation:
(1) Low Heat Storage Capacity: Impervious surfaces are predominantly composed of materials such as concrete and asphalt, which possess high thermal conductivity, allowing them to quickly absorb and conduct heat. As a result, when sunlight strikes these surfaces, they rapidly absorb solar radiation, leading to an increase in surface temperature. (2) The Heat Island Effect: Impervious surfaces are a primary contributor to the urban heat island effect. Urban areas tend to have higher temperatures than surrounding agricultural or suburban regions, and the expansion of impervious surfaces exacerbates this effect. By reducing evaporation and hindering heat dissipation, impervious surfaces cause the surface temperature to rise in urban environments. (3) Disruption of the Water Cycle: Impervious surfaces obstruct the natural water cycle between the surface and groundwater. This disruption leads to a decrease in the relative humidity of the surface, resulting in a gradual drying effect on the land. These factors collectively contribute to the significant correlation observed between the impervious surface rate and surface temperature.

5. Conclusions

Amid the rapid pace of urbanization, various factors exert differing levels of influence on surface temperature. The results of this study highlight that land use factors exhibit the strongest correlation with surface temperature, with impervious areas playing a particularly significant role in exacerbating the heat island effect. Increases in population density and GDP are also associated with rising surface temperatures, underscoring the profound impact of economic activities on the urban thermal environment. Furthermore, the analysis of topographic factors reveals the influence of elevation and topographic relief on the distribution of surface temperatures. In regions characterized by variable topography, the spatial heterogeneity of surface temperatures is more pronounced.
In conclusion, this study offers an in-depth analysis of the seasonal variations in surface temperature in Changchun City, elucidating the mechanisms through which multiple factors drive changes in surface temperature. This research provides a scientific foundation and valuable reference for urban planning and environmental management in cold regions. The comprehensive examination of various factors—including land use, topography, and socio-economic conditions—not only enhances our understanding of the dynamics of the urban thermal environment, but also offers crucial guidance for urban planning and sustainable development. It is essential, however, that efforts to address surface temperature changes also incorporate integrated strategies for improving the urban climate. This necessitates that urban planners and managers adopt a holistic approach, employing targeted measures to mitigate the urban heat island effect, particularly through managing dominant factors such as land use types and topography.

Author Contributions

Methodology, X.W.; Software, D.G.; Formal analysis, Y.L.; Writing—original draft, M.L. and W.X.; Writing—review & editing, C.W.; Funding acquisition, B.G. All authors have read and agreed to the published version of the manuscript.

Funding

This research was funded by National Natural Science Foundation of China: 41807172; Liaoning Provincial Natural Science Foundation of China: 2024-MS-094.

Institutional Review Board Statement

Not applicable.

Informed Consent Statement

Not applicable.

Data Availability Statement

The data presented in this study are available on request from the corresponding author. The data are not publicly available due to the restriction policy of the co-authors’ affiliations.

Conflicts of Interest

The authors declare no conflict of interest.

References

  1. Yang, J.; Wang, Y.; Xiu, C.; Xiao, X.; Xia, J.; Jin, C. Optimizing local climate zones to mitigate urban heat island effect in human settlements. J. Clean. Prod. 2020, 275, 123767. [Google Scholar] [CrossRef]
  2. Meehl, G.A.; Tebaldi, C. More intense, more frequent, and longer lasting heat waves in the 21st century. Science 2004, 305, 994–997. [Google Scholar] [CrossRef]
  3. Hirano, Y.; Ichinose, T.; Ohashi, Y.; Shiraki, Y.; Onishi, A.; Yoshida, Y. Simulation of urban surface temperature and surface heat balance in the Tokyo metropolitan area. Sustain. Cities Soc. 2024, 112, 105596. [Google Scholar] [CrossRef]
  4. Guha, S.; Govil, H.; Dey, A.; Gill, N. Analysing the capability of NCI technique in change detection using high-and medium-resolution multispectral data. In Geoecology of Landscape Dynamics; Springer: Singapore, 2020; pp. 133–147. [Google Scholar]
  5. Liu, H.; Zhan, Q.; Yang, C.; Wang, J. Characterizing the spatio-temporal pattern of land surface temperature through time series clustering: Based on the latent pattern and morphology. Remote Sens. 2018, 10, 654. [Google Scholar] [CrossRef]
  6. Smith, G.S.; Mirsky, D.S.; Florinsky, M. The Correspondence of DS Mirsky and Michael Florinsky, 1925–1932. Slavon. East Eur. Rev. 1994, 72, 115–139. [Google Scholar]
  7. Geiger, R.; Aron, R.H.; Todhunter, P. The Climate Near the Ground; Rowman & Littlefield: Lanham, MD, USA, 2009. [Google Scholar]
  8. Oke, T.R. The energetic basis of the urban heat island. Q. J. R. Meteorol. Soc. 1982, 108, 1–24. [Google Scholar] [CrossRef]
  9. Skelhorn, C.; Lindley, S.; Levermore, G. The impact of vegetation types on air and surface temperatures in a temperate city: A fine scale assessment in Manchester, UK. Landsc. Urban Plan. 2014, 121, 129–140. [Google Scholar] [CrossRef]
  10. Neog, R. Monitoring land use dynamics, urban sprawl, and land surface temperature in Dimapur urban area, Nagaland, India. Int. J. Environ. Sci. Technol. 2023, 20, 7519–7532. [Google Scholar] [CrossRef]
  11. Kotharkar, R.; Surawar, M. Land use, land cover, and population density impact on the formation of canopy urban heat islands through traverse survey in the Nagpur urban area, India. J. Urban Plan. Dev. 2016, 142, 04015003. [Google Scholar] [CrossRef]
  12. Li, K.; Yang, H.; Chen, Q.; Chen, T.; Shen, R. Analysis of Urban Thermal Environment Evolution and Mechanisms Based on Multisource Data: A Case Study of Hangzhou, China. J. Urban Plan. Dev. 2024, 150, 05024026. [Google Scholar] [CrossRef]
  13. Zenouzi, A.S.; Yenneti, K.; Teimouri, R.; Abbasiyan, F.; Palme, M. Analysis of Changes in Vegetation Index during the Rapid Urban Spatial Development Period (1990–2020) in Tehran Metropolis, Iran. Atmosphere 2022, 13, 2010. [Google Scholar] [CrossRef]
  14. Lei, K.; Li, M.; Yi, L. Comparing the driving mechanisms of different types of urban construction land expansion: A case study of the Beijing-Tianjin-Hebei region. J. Geogr. Sci. 2024, 34, 722–744. [Google Scholar]
  15. Zhao, W.; Lu, J.L.; Wei, Q.Q.; Cao, J.X.; Cui, J.X.; Hou, Y.; Zhang, K.; Chen, H.; Zhao, W. Spatial distribution, source apportionment, and risk assessment of perfluoroalkyl substances in urban soils of a typical densely urbanized and industrialized city, Northeast China. Sci. Total Environ. 2024, 953, 176166. [Google Scholar] [CrossRef] [PubMed]
  16. Li, Y.X.; Liu, Z.S.; Li, S.J.; Li, X.; Wang, W.Y. Spatiotemporal Patterning and Matching of Ecosystem Services’ Supply and Demand in Changchun, China. Land 2023, 12, 2101. [Google Scholar] [CrossRef]
  17. Sun, H.L.; Wu, S.K.; Dong, Q.Y.; Zhou, X.; Yang, J.X.; Li, G. Research on Runoff Management of Sponge Cities under Urban Expansion. Water 2024, 16, 2103. [Google Scholar] [CrossRef]
  18. Li, L.; Tan, Y.B.; Ying, S.; Yu, Z.H.; Li, Z.; Lan, H.H. Impact of land cover and population density on land surface temperature: Case study in Wuhan, China. J. Appl. Remote Sens. 2014, 8, 084993. [Google Scholar] [CrossRef]
  19. Mallick, J.; Rahman, A. Impact of population density on the surface temperature and micro-climate of Delhi. Curr. Sci. 2012, 102, 1708–1713. [Google Scholar]
  20. Han, G.F.; Zhao, K.; Yan, W.T.; Ye, L. Multi-gradients of land surface temperature in mountainous cities with rapid urbanization: A case study in central area of Chongqing City. J. Appl. Ecol. 2012, 23, 1655–1662. [Google Scholar]
  21. Li, Z.; Wu, F.; Ma, H.Q.; Xu, Z.J.; Wang, S.H. Spatiotemporal Evolution and Relationship between Night Time Light and Land Surface Temperature: A Case Study of Beijing, China. Land 2022, 11, 548. [Google Scholar] [CrossRef]
  22. Li, L.L.; Yu, T.; Zhao, L.M.; Zhan, Y.L.; Zheng, F.J.; Zhang, Y.Z.; Wang, C.M. Characteristics and trend analysis of the relationship between land surface temperature and nighttime light intensity levels over China. Infrared Phys. Technol. 2019, 97, 381–390. [Google Scholar] [CrossRef]
  23. Mathew, A.; Khandelwal, S.; Kaul, N.; Chauhan, S. Analyzing the diurnal variations of land surface temperatures for surface urban heat island studies: Is time of observation of remote sensing data important. Sustain. Cities Soc. 2018, 40, 194–213. [Google Scholar] [CrossRef]
Figure 1. Location map of Changchun.
Sustainability 17 06840 g001
Figure 2. Spring inversion temperature regression analysis.
Sustainability 17 06840 g002
Figure 3. Summer inversion temperature regression analysis.
Sustainability 17 06840 g003
Figure 4. Autumn inversion temperature regression analysis.
Sustainability 17 06840 g004
Figure 5. Winter inversion temperature regression analysis.
Sustainability 17 06840 g005
Figure 6. Elevation, slope, undulation, and surface temperature scatter plot.
Sustainability 17 06840 g006
Figure 7. Spatial distribution of population density, GDP, and night-time lighting.
Sustainability 17 06840 g007aSustainability 17 06840 g007b
Figure 8. Correlation of socio-economic factors (population density, GDP, night lighting) with surface temperature.
Sustainability 17 06840 g008
Figure 9. Mean, maximum, and minimum temperatures in areas with different land use types in different seasons.
Sustainability 17 06840 g009aSustainability 17 06840 g009b
Figure 10. Order of roles of different factors in constructing surface temperature models.
Sustainability 17 06840 g010
Figure 11. The role of different factors in modeling surface temperature.
Sustainability 17 06840 g011
Figure 12. Scatter plot of impervious surface coverage vs. surface temperature.
Sustainability 17 06840 g012
Table 1. Temperature comparison results.
TimeMonthly Average
Ground Temperature (°C)
Inversion Mean
Ground Temperature (°C)
Relative Error (%)
Spring23.122.920.78
Summer35.236.960.05
Autumn20.519.620.04
Winter−18.5−20.650.12
Disclaimer/Publisher’s Note: The statements, opinions and data contained in all publications are solely those of the individual author(s) and contributor(s) and not of MDPI and/or the editor(s). MDPI and/or the editor(s) disclaim responsibility for any injury to people or property resulting from any ideas, methods, instructions or products referred to in the content.

