Article

The Effect of Generator-Side Charges on Investment in Power Generation and Transmission Under Demand Uncertainty

Department of Industrial and Systems Engineering, Tokyo University of Science, 2641 Yamazaki, Noda, Chiba 278-8510, Japan
*
Author to whom correspondence should be addressed.
Sustainability 2025, 17(15), 6824; https://doi.org/10.3390/su17156824
Submission received: 24 May 2025 / Revised: 16 July 2025 / Accepted: 25 July 2025 / Published: 27 July 2025
(This article belongs to the Special Issue Sustainable Energy System: Efficiency and Cost of Renewable Energy)

Abstract

Given the increases in renewable energy penetration, appropriately allocating transmission costs is important in generation and transmission investment decisions. This study examines how a generator-side transmission charge affects investment decisions by power generation companies (PC) and the transmission system operator (TSO) under two frameworks differing in who decides investment timing. We compare two frameworks: (1) TSO determines investment timing and the PC determines capacity (TL framework); (2) PC determines investment timing and capacity (GL framework). We examine how variations in generator-side charges and demand uncertainty affect the optimal investment timing, capacity, and social surplus. Regarding investment timing, increases in the generator-side charge led to earlier investment in the TL framework but delayed investment in the GL framework. Concerning investment capacity, the TL framework yielded greater capacity with low uncertainty, while the GL framework supported greater capacity with high uncertainty. The magnitude of the relative social surplus of the two frameworks was reversed according to the generator-side charge and uncertainty. Specifically, the GL framework became increasingly superior to the TL framework as uncertainty increased, and this advantage was amplified by a higher generator-side charge. Policymakers should consider uncertainty and calibrate the level of generator-side charge and the allocation of decision-making authority.

1. Introduction

1.1. Background

Climate change is an urgent challenge faced by the international community. The Intergovernmental Panel on Climate Change (IPCC) stated that, to limit post-industrial revolution warming to below 1.5 °C, global CO 2 emissions must reach net-zero levels by approximately 2050 [1]. Achieving this target hinges on the rapid decarbonization of the energy sector, most critically the power sector, as electricity generation accounts for approximately 40% of global CO 2 emissions and serves as a foundation for decarbonizing other end-use sectors through electrification [2]. Accordingly, the acceleration of investment in renewable energy has become a cornerstone of policies for realizing low-carbon societies. Specifically, wind and solar power not only emit zero CO 2 during their operation but have also seen reductions in capital costs in recent years, enhancing their economic competitiveness [3]. Indeed, in 2022, approximately 80% of the newly installed generation capacity worldwide was renewable, underscoring a clear global trend toward clean-power expansion [4]. However, renewable technologies depend heavily on natural conditions, which gives rise to pronounced output variability and forecasting challenges [5]. Moreover, sites with high wind or solar potential are geographically concentrated and often located far from urban demand centers. Resolving this spatial mismatch and ensuring a reliable electricity supply, therefore, require the development of extensive, high-capacity transmission networks that integrate renewable resources into the grid [6].
With the recent expansion of renewable energy, the fixed costs associated with operating, maintaining, and expanding transmission networks have increased. According to the International Energy Agency, building a power system dominated by renewables requires not generation-side investment but sustained, large-scale capital deployment in transmission infrastructure, which would amount to tens of trillions of dollars by 2050 [7]. To underwrite such investments, establishing an institutional framework that enables transmission operators to reliably recover costs is essential. The question of who should bear transmission costs, as well as how this should be done, is a critical design issue because cost-allocation rules directly influence site selection, investment scales, and transmission-line utilization for renewable projects. Under the beneficiary-pays principle, transmission costs are generally allocated to both generators and entities who benefit from network use, that is, electricity consumers [8]. However, an incorrect choice of cost allocation methodology can affect developers’ locational preferences, investment incentives, and patterns of grid usage, potentially deterring socially optimal investments. Therefore, it is imperative to adopt cost allocation mechanisms that enhance economic efficiency while ensuring fairness and public acceptance [9]. Against this backdrop of economic and institutional demands, growing attention has recently been directed toward the generator-side transmission charge scheme. This scheme requires power generators who are beneficiaries of the transmission network to bear a portion of the costs associated with the maintenance and expansion of transmission infrastructure. Traditionally, these costs were fully borne by consumers; the generator-side transmission charge aims to rectify this imbalance based on the beneficiary pays principle, thereby enhancing fairness in cost allocation. Furthermore, by introducing locational differentiation in the tariff structure, the scheme is expected to function as a locational signal, guiding power plant siting decisions toward areas with lower transmission constraints. In this regard, the generator-side transmission charge serves as a mechanism that internalizes the impact of generators on the transmission network through pricing, thereby incentivizing long term investment decisions that favor locations with sufficient transmission capacity [10]. Several countries have already implemented generator-side transmission charge systems, including the United Kingdom, Norway, Sweden, Germany, and France. For example, in the United Kingdom, National Grid applies zonal charges based on Locational Marginal Pricing (LMP) that reflect regional differences in transmission costs. This system has been shown to encourage generators to locate closer to demand centers, thereby reducing the need for excessive transmission investment in remote areas [11]. In Norway and Sweden, a more granular tariff design is adopted, with differentiation by time of day and voltage level. These systems have reportedly contributed to alleviating transmission congestion caused by the large scale integration of renewable energy, while also promoting demand side load leveling [12]. In light of these developments, the present study constructs a theoretical framework to analyze how the cost-sharing ratio between generators and consumers influences investment decisions made by power generators and transmission operators. In particular, the objective is to clarify how variations in the generator’s share of transmission costs affect the timing and scale of investment, as well as the resulting changes in social welfare. Through this analysis, the study aims to derive policy implications that support institutional transitions toward a renewable energy driven power system. In this context, we developed a theoretical framework to analyze how different levels of transmission cost allocation affect generation and transmission investment decisions under uncertainty, and determined the policy implications to support the institutional transition to a renewables-led power system.

1.2. Literature Review

Various methods have been proposed for transmission cost allocation. Traditionally, pro-rata approaches, such as the postage-stamp method and contract-path method, have been widely used to allocate transmission costs uniformly across users, regardless of their usage or distance. These approaches offer simplicity and transparency but have been criticized for failing to reflect actual network usage [13]. To address this shortcoming, the MW-Mile method was introduced; it multiplies the power flow (megawatts) by the distance (miles) to assess asset utilization and was later extended into the MVA-Mile method by incorporating reactive power [14]. Both methods enable cost allocation that mirrors the physical use of transmission equipment. More recently, the principle of equivalent bilateral exchange has been combined with power tracing in the PTEBX method to visualize the interactions between suppliers and consumers, attracting attention as a more equitable allocation technique [15]. Physical model approaches, such as the Z-bus method and its refinements, are used to calculate the contribution of each line to power flows. Advances include the modified Z-bus techniques and min-max fairness algorithms [16]. In parallel, cooperative game theory based approaches allocate costs according to economic benefits, using solution concepts such as the Shapley value and the nucleolus, to achieve a fair economic distribution. Although these methods perform well in terms of fairness, efficiency, and stability, their computational demands pose challenges for large systems [17]. As guiding principles for transmission tariff design, economic efficiency and the provision of investment signals are paramount. Economic efficiency is achieved by maximizing social surplus through network operation, selecting generation and transmission locations, and investment. Accordingly, tariffs must send the appropriate signals to market participants [18]. However, most studies on cost allocation have focused on physical usage or economic benefits and have not fully considered how allocation rules affect investment decisions by generation and transmission operators.
In the context of investment decisions under uncertainty in the energy sector, analyses employing the real options approach have been widely adopted. Grimm et al. (2016) compared flat-rate, capacity-based, and energy-based tariffs in a liberalized electricity market to quantify how transmission tariff design influences the location and capacity of generation and transmission investments as well as social surplus [19]. Agaton et al. (2018) applied the real options approach to examine the impact of oil price and electricity price uncertainty on investment behavior and quantitatively showed that substituting renewable energy for oil-fired generation is preferable in the Philippines, with lower electricity prices and internalized oil externalities promoting renewable investment [20]. Bahrami et al. (2018) addressed the enhanced complexity in market operation caused by renewable generation variability and responsive consumer behavior by proposing a distributed energy trading algorithm in which the transmission operator sends appropriate control signals to decentralized agents, consumers, and generators, such that the system converges on a centrally optimal solution [21]. Yang et al. (2023) conducted a portfolio simulation to assess how policy uncertainty and generator risk aversion each affect investment timing, and they found that both factors tend to delay the transition to a low-carbon energy system and that higher levels of either factor further extend the delay [22]. Focusing explicitly on the interaction between multiple agents, Lavrutich et al. (2023) integrated the real options approach with game theory to analyze how generators and transmission system operator, each with distinct objectives, affect social surplus, demonstrating that, when a transmission operator anticipates generator investment decisions, the loss of social surplus due to differing objectives can be reduced [23]. Ito et al. (2024) similarly modeled the strategic interplay between generators and a transmission operator within a combined game theory and real options framework, performing an equilibrium analysis of simultaneous investment timing and capacity decisions, and quantifying the effects of policy options such as feed-in premium scheme and declining renewable investment costs on both agents’ behavior and social surplus [24]. However, to the best of our knowledge, few studies have explicitly determined how institutional arrangements for transmitting cost allocation, particularly generator-side charge, affect investment decision-making and the related social surplus.

1.3. Research Objectives and Contributions

In this study, we develop a theoretical framework to analyze how the transmission cost allocation under a generator-side charge scheme influences investment decisions by power generation companies (PCs) and a transmission system operator (TSO), as well as the resulting social surplus. Specifically, we employed a real options approach to quantify how both the level of the generator-side charge and the identity of the decision maker for investment timing (the PC or the TSO) affect each player’s investment timing, capacity, and overall social surplus, considering market uncertainty. Furthermore, we defined two frameworks according to which the player determines the investment timing, and conducted numerical analyses for each. In the framework in which the TSO decides on the investment timing, increasing the generator-side charge accelerates the investment. However, greater uncertainty delays it. In the framework in which the PC decides on the investment timing, both a higher generator-side charge and increased uncertainty delay the investment timing. In both frameworks, rising uncertainty leads to larger capacity investments. A comparison across frameworks showed that the magnitude of the social surplus depended on the degree of uncertainty and the generator-side charge. These results suggest that policymakers can enhance the social surplus by adjusting the generator-side charge in line with market uncertainty.
The structure of this paper is as follows. Section 2 describes the key assumptions and formulates the theoretical model. Section 3 conducts numerical analyses based on the developed model to examine how institutional design and uncertainty affect investment behavior and social surplus. Finally, Section 4 discusses the policy implications derived from the results and addresses the limitations of the study as well as directions for future research.

2. Model

In this study, we modeled investment decisions in a power market consisting of a PC and TSO, each pursuing a different objective. The PC invests in generation capacity to maximize its revenue from electricity sales, whereas the TSO, as a regulated public institution, invests in transmission capacity to maximize social surplus. Both agents make investment decisions under electricity demand uncertainties. In our model, we assume an electricity system in which generation and transmission are fully unbundled. Unbundling separates the generation sector from the transmission sector with the aim of creating an efficient market structure through competition. Consequently, generation companies and the transmission system operator act as independent decision-making entities with no capital ties [25]. To capture this situation, we build the model without any hierarchical relationship or information asymmetry between the two agents. In other words, they make decisions independently. Nonetheless, by sharing investment timing and the generation and transmission capacities, their decisions become mutually interdependent.
This relationship reflects the fact that transmission infrastructure is a prerequisite for power companies to earn revenue, while generation represents the source of social surplus for the TSO. To recover the transmission cost, the TSO levies a volumetric tariff τ (JPY/kWh), of which the PC pays α τ and end-users pay the remaining ( 1 α ) τ . We treated the cost-share parameter α as an institutional, that is, generation-side charge, variable and analyzed how changes in α affect both the decisions in investment timing and the capacity under uncertainty. Under these assumptions, this study clarified how variations in cost allocation and the roles of decision-making agents influence investment timing, capacity expansion, and social surplus.

2.1. Settings

In this study, we focused on who decides on the investment timing, together with the generator-side charge. Specifically, we assessed how different investment decision makers affect the timing of investment, capacity expansion, and social surplus. In the conventional sequence of investment in generation and transmission infrastructure, the PC determines its capacity and makes the corresponding investment, after which the transmission operator develops its network expansion plan [24]. A more recent approach considers that the TSO decides on an investment schedule to encourage subsequent capacity investments by the PC [26,27]. To explore the implications of these alternatives, we compared two decision-making frameworks.
The first is the generation-led (GL) framework, in which power producers independently determine the timing of generation investment based on their own profit-maximization objectives. TSO then responds passively by reinforcing the transmission network as needed to accommodate these investments. A example of this framework is the “first-come, first-served” approach previously employed in the PJM (Pennsylvania–New Jersey–Maryland Interconnection) system in the United States prior to regulatory reform. Under this regime, generation developers could submit interconnection requests at any time, and the TSO conducted system impact studies in the order in which requests were received [28]. Another example is the “Connect and Manage” policy formerly adopted in the United Kingdom, which also exhibits characteristics of the GL framework. This policy allowed generators to connect to the grid prior to the completion of necessary transmission upgrades, effectively granting them the discretion to choose earlier connection timing [29]. The second framework is the transmission-led (TL) framework, where the TSO determines the timing of transmission investment with the objective of maximizing social surplus. This proactive role enables the TSO to influence and coordinate the timing of subsequent generation investments. A representative example is proactive transmission planning (PTP), a long-term planning strategy in which the TSO anticipates future developments in the power system and prepares corresponding transmission expansions in advance. A concrete implementation of this approach is the Competitive Renewable Energy Zones (CREZ) program in the state of Texas, USA. In this case, the state regulatory authority and the TSO jointly identified regions with high wind energy potential as CREZs and proactively developed large-scale transmission infrastructure connecting these zones to major demand centers. As a result, generation developers formulated their investment plans based on the pre-established transmission buildout, meaning that the TSO’s planning decisions effectively determined the timing and location of generation investments [30]. In both frameworks, the PC bears the costs of the generation capacity investment and receives the associated revenue; therefore, the generation capacity q is determined based on the players’ profit-maximization decisions. Furthermore, to focus our analysis on new investment behavior under the introduced institutional framework, we assumed that no generation or transmission capacity existed before the investments.
The annual electricity demand Q f (kWh) supplied to the market by the generation capacity q f in framework f is expressed using the annual operating hours h (hours) and the capacity factor k, as follows:
Q f = h k q f
where h = 24 × 365 = 8760 (h). We focused on the fluctuations in electricity prices caused by demand shocks as the source of uncertainty faced by the both PC and TSO when making decisions. The electricity price P t (JPY/kWh) at continuous time t is defined by the following inverse demand function using the total market supply Q f (kWh):
P t ( Q f ) = X t ( 1 η Q f )
η > 0 is the slope of the inverse demand function, which represents the market price sensitivity. To ensure that the prices remain positive, we assumed that η < 1 Q f . Although electricity prices exhibit complex short-term dynamics, such as seasonality and spikes, our interest lied in long-term investment decisions; therefore, this streamlined model retained sufficient validity [31]. Moreover, X t denotes the random variable at time t, capturing the magnitude of the demand shocks in the electricity market, and it was assumed to follow geometric Brownian motion (GBM):
d X t = μ X t d t + σ X t d W t , X 0 = x ,
where μ denotes the expected growth rate of demand shocks, σ denotes their volatility, W t is the standard Brownian motion, and X 0 is the initial value. Investment timing was represented by the investment threshold x f for framework f under a real options approach. This threshold was derived from the value function of the decision maker by satisfying the boundary conditions [32]. We assumed that investments were made immediately after the demand shock level in the electricity market reached x f . Hence, x f served as an indicator of investment timing, and larger values of x f corresponded to delayed investments.

2.2. Optimal Investment Timing and Capacity in the TL Framework

First, we modeled the value functions for the PC and TSO in the TL framework. V f , i identifies the value function of the PC in framework f and the investment status before ( i = 0 ) and after ( i = 0 ) the investment. Similarly, S f , i represents the framework and status of the TSO. First, the PC seeks to maximize its net benefit, defined as the expected current value of revenue from electricity sales after investment, minus the initial investment cost. The value function for the PC after investment in the TL framework is given by:
V T L , 1 ( x T L , q T L ) = E 0 e ρ t Q T L P t C Q T L α τ Q T L d t ξ q T L = ( 1 η Q T L ) Q T L x T L ρ μ C Q T L ρ α τ Q T L ρ ξ q T L
where C (JPY/kWh) denotes the generation cost, α τ (JPY/kWh) is the transmission tariff per unit of electricity borne by the power company under the generator-side charge, ξ (JPY/kW) is the installation cost per unit of generation capacity, ρ is the discount rate, and e is the base of the natural logarithm. For simplicity, we assumed that construction and operation begun immediately after investment and that cash flows continued indefinitely. Next, under the given x T L , we derived the generation capacity that maximized the PC’s profit. The PC treats the TSO’s investment timing x T L as a given and determines q T L to maximize its profit. In other words, for value function V P C , 1 ( x T L , q T L ) , we determined q T L ( x T L ) by imposing a first-order condition with respect to q T L . The first-order condition in the PC’s optimization problem is expressed as follows:
V T L , 1 ( x T L , q T L ) q T L = 0
By solving this first-order condition, the optimal capacity q T L ( x T L ) is derived as follows:
q T L ( x T L ) = ρ h k x T L ( ρ μ ) C h k + ρ ξ + α τ h k ( ρ μ ) η h 2 k 2 .
Equation (6) defines the function of the generation capacity q T L , given investment timing x T L . Thus, it can be regarded as the best response function of the PC.
Subsequently, we formulated the TSO’s value function. The TSO seeks to maximize the social surplus, defined as the total consumer benefit minus the generation cost and the installation costs of generation and transmission facilities. In the TL framework, the TSO decides on investment timing x T L by considering the investment generation capacity q T L decided on by the PC. The TSO invests in expanding its transmission capacity based on q T L , thereby ensuring that the capacity installed by the PC can be accommodated. The social surplus after the TSO’s investment, S T L , 1 ( x T L , q T L ) , is given by:
S T L , 1 ( x T L , q T L ) = E 0 e ρ t 0 Q T L P t ( Q T L ) d Q T L C Q T L d t ( ξ + γ ) q T L = ( 2 η Q T L ) Q T L x T L 2 ( ρ μ ) C Q T L ρ ( ξ + γ ) q T L
γ (JPY/kW) denotes the installation cost per unit of transmission capacity. Because the transmission tariff τ functions as a transfer from the PC and consumers to the TSO, it nets out in the calculation of the social surplus and was, therefore, excluded from the objective function. Accordingly, τ was not considered in terms of the social surplus. The TSO’s value function before investment was modeled as the option value of the investment and is given by:
S T L , 0 ( x T L ) = a T L x T L β 1
a T L is an undetermined coefficient in the TL framework, and β 1 > 1 denotes the positive root of the following quadratic characteristic equation:
1 2 σ 2 β ( β 1 ) + μ β ρ = 0 .
This equation follows the standard optimal-stopping problem for a state variable X t that follows GBM [32]. The coefficient of option value and investment timing x T L were derived from the boundary conditions of value-matching and the smooth-pasting conditions, as follows:
S T L , 0 ( x T L ) = S T L , 1 ( x T L , q T L )
We derived the coefficient of option value and optimal investment timing x T L as follows:
a T L = ( 2 η Q T L ) Q T L x T L 1 β 1 2 β 1 ( ρ μ )
x T L ( q T L ) = β 1 β 1 1 2 ( ρ μ ) ( 2 η h k q T L ) h k C h k ρ + ξ + γ
Equation (13) defines investment timing x T L , which maximizes the social surplus for any given generation capacity, q T L . Hence, it can be regarded as the best response function of the TSO.
In the TL framework, the PC and TSO each optimize their objective functions, taking the other’s decisions as a given. In other words, while the PC selects its optimal capacity q T L , given x T L , the TSO determines its optimal investment timing x T L , given q T L . Under this interdependent decision-making structure, the equilibrium ( x T L * , q T L * ) is characterized by the simultaneous solution of the following conditions:
q T L * ( x T L * ) = ρ h k x T L * ( ρ μ ) C h k + ρ ξ + α τ h k ( ρ μ ) η h 2 k 2 x T L *
x T L * ( q T L * ) = β 1 β 1 1 2 ( ρ μ ) ( 2 η h k q T L * ) h k C h k ρ + ξ + γ
Equations (14) and (15) represent the investment timing and the capacity at the Nash equilibrium, respectively. In this study, we numerically computed these equilibrium values to derive a joint optimal decision solution for both entities.

2.3. Optimal Investment Timing and Capacity in the GL Framework

We derived the optimal investment timing and capacity in the GL framework, in which the PC decides on both the investment timing and capacity. In this framework, the PC selects capacity q G L to maximize the expected present value of its revenue from electricity sales after investment. The first-order condition for the PC’s value function is expressed as follows:
V G L , 1 q G L ( x G L , q G L ) = 0
By solving this equation, the optimal capacity q G L ( x G L ) is derived as follows:
q G L ( x G L ) = ρ h k x G L ( ρ μ ) ( C h k + ρ ξ + α τ h k ) 2 η ρ h 2 k 2 x G L
In this framework, the PC also determines the investment timing. Similar to the TL framework, its value function before investment is expressed as the option value of investment, as follows:
V G L , 0 ( x G L ) = a G L x G L β 1
where a G L is the undetermined coefficient in the GL framework, and β 1 > 1 is the positive solution of the characteristic equation Equation (9). We determined the optimal investment threshold x G L * using the following boundary conditions:
V G L , 0 ( x G L * ) = V G L , 1 ( x G L * , q G L * )
d V G L , 0 d x G L ( x G L * ) = V G L , 1 x G L ( x G L * , q G L * )
From these conditions, the optimal investment threshold x G L * can be expressed as a function of the optimal capacity q G L * , as follows:
x G L * ( q G L * ) = ( ρ μ ) ( C h k + α τ h k + ρ ξ ) ( β 1 1 ) ( 1 η h k q G L * ) h k ρ
By solving Equations (17) and (21) simultaneously, the analytical expressions for the optimal capacity q G L * and the optimal investment threshold x G L * can be obtained as follows:
q G L * = 2 β 1 3 β 1 · 1 η h k
x G L * = 3 β 1 β 1 1 · ( ρ μ ) ( C h k + α τ h k + ρ ξ ) ρ h k
Based on Equations (22) and (23), the PC makes its optimal investment decision to maximize revenues, accounting for the cost structure and market uncertainty. In contrast, under this framework, the TSO cannot independently select the investment timing or capacity. It adjusts its actions in response to the PC’s investment decisions. Finally, the coefficient of option value a G L is expressed using the optimal investment threshold x G L * , as follows:
a G L = ( 1 η Q G L ) Q G L x G L * 1 β 1 β 1 ( ρ μ )
In Section 3, we conduct numerical analyses based on the theoretical model developed in this study to examine how institutional design and uncertainty affect the investment behavior of power generators and the resulting social surplus. Specifically, Section 3.1 describes the key parameter settings used in the numerical experiments. Section 3.2 quantitatively analyzes how the generator’s share of transmission costs and demand uncertainty influence the optimal investment timing, investment capacity, and social surplus under the TL framework. Section 3.3 conducts a similar analysis for the GL framework and highlights how structural differences between the two institutional settings affect investment behavior. Finally, Section 3.4 compares the results across the two frameworks and derives policy relevant criteria for institutional design and selection.

3. Numerical Analysis

In this section, we describe the parameters used in our analysis. Subsequently, for each framework, we determined how the generator-side charge and the uncertainty of demand shocks affect investment timing and capacity, and social surplus. Finally, by comparing the outcomes of the two frameworks, we evaluated how a difference in the decision maker influences investment timing, capacity, and social surplus, and obtained policy implications. The social surplus is the sum of consumer and producer (generator) surpluses.

3.1. Parameters

We present the parameters used in this study in Table 1. We assume that power generation is fueled by liquefied natural gas (LNG), which offers relatively low environmental impact and high generation efficiency. The generation and installation cost, and capacity factor are set based on reports from the Agency for Natural Resources and Energy [33,34]. The annual operating hours are fixed 8760 h, and the transmission distance is set to 300 km. The installation cost of transmission infrastructure is set at 54,600 JPY/kW, following data from the Organization for Cross regional Coordination of Transmission Operators (OCCTO) [35]. The slope of the inverse demand function η , which governs price elasticity and has a significant impact on the equilibrium price and investment decisions, is calibrated based on the study by Ito et al. [24] Similarly, the expected growth rate and volatility of demand shocks, as well as the discount rate, are also adopted from the parameter settings in Ito et al. [24]. The transmission tariff level is set in accordance with the institutional guidelines provided by the Electricity and Gas Market Surveillance Commission [36], to ensure consistency with actual regulatory design. All model analysis and simulations are implemented in a Python 3.9.6 environment using numerical computation and visualization libraries such as NumPy 2.0.2 and Matplotlib 3.9.4.

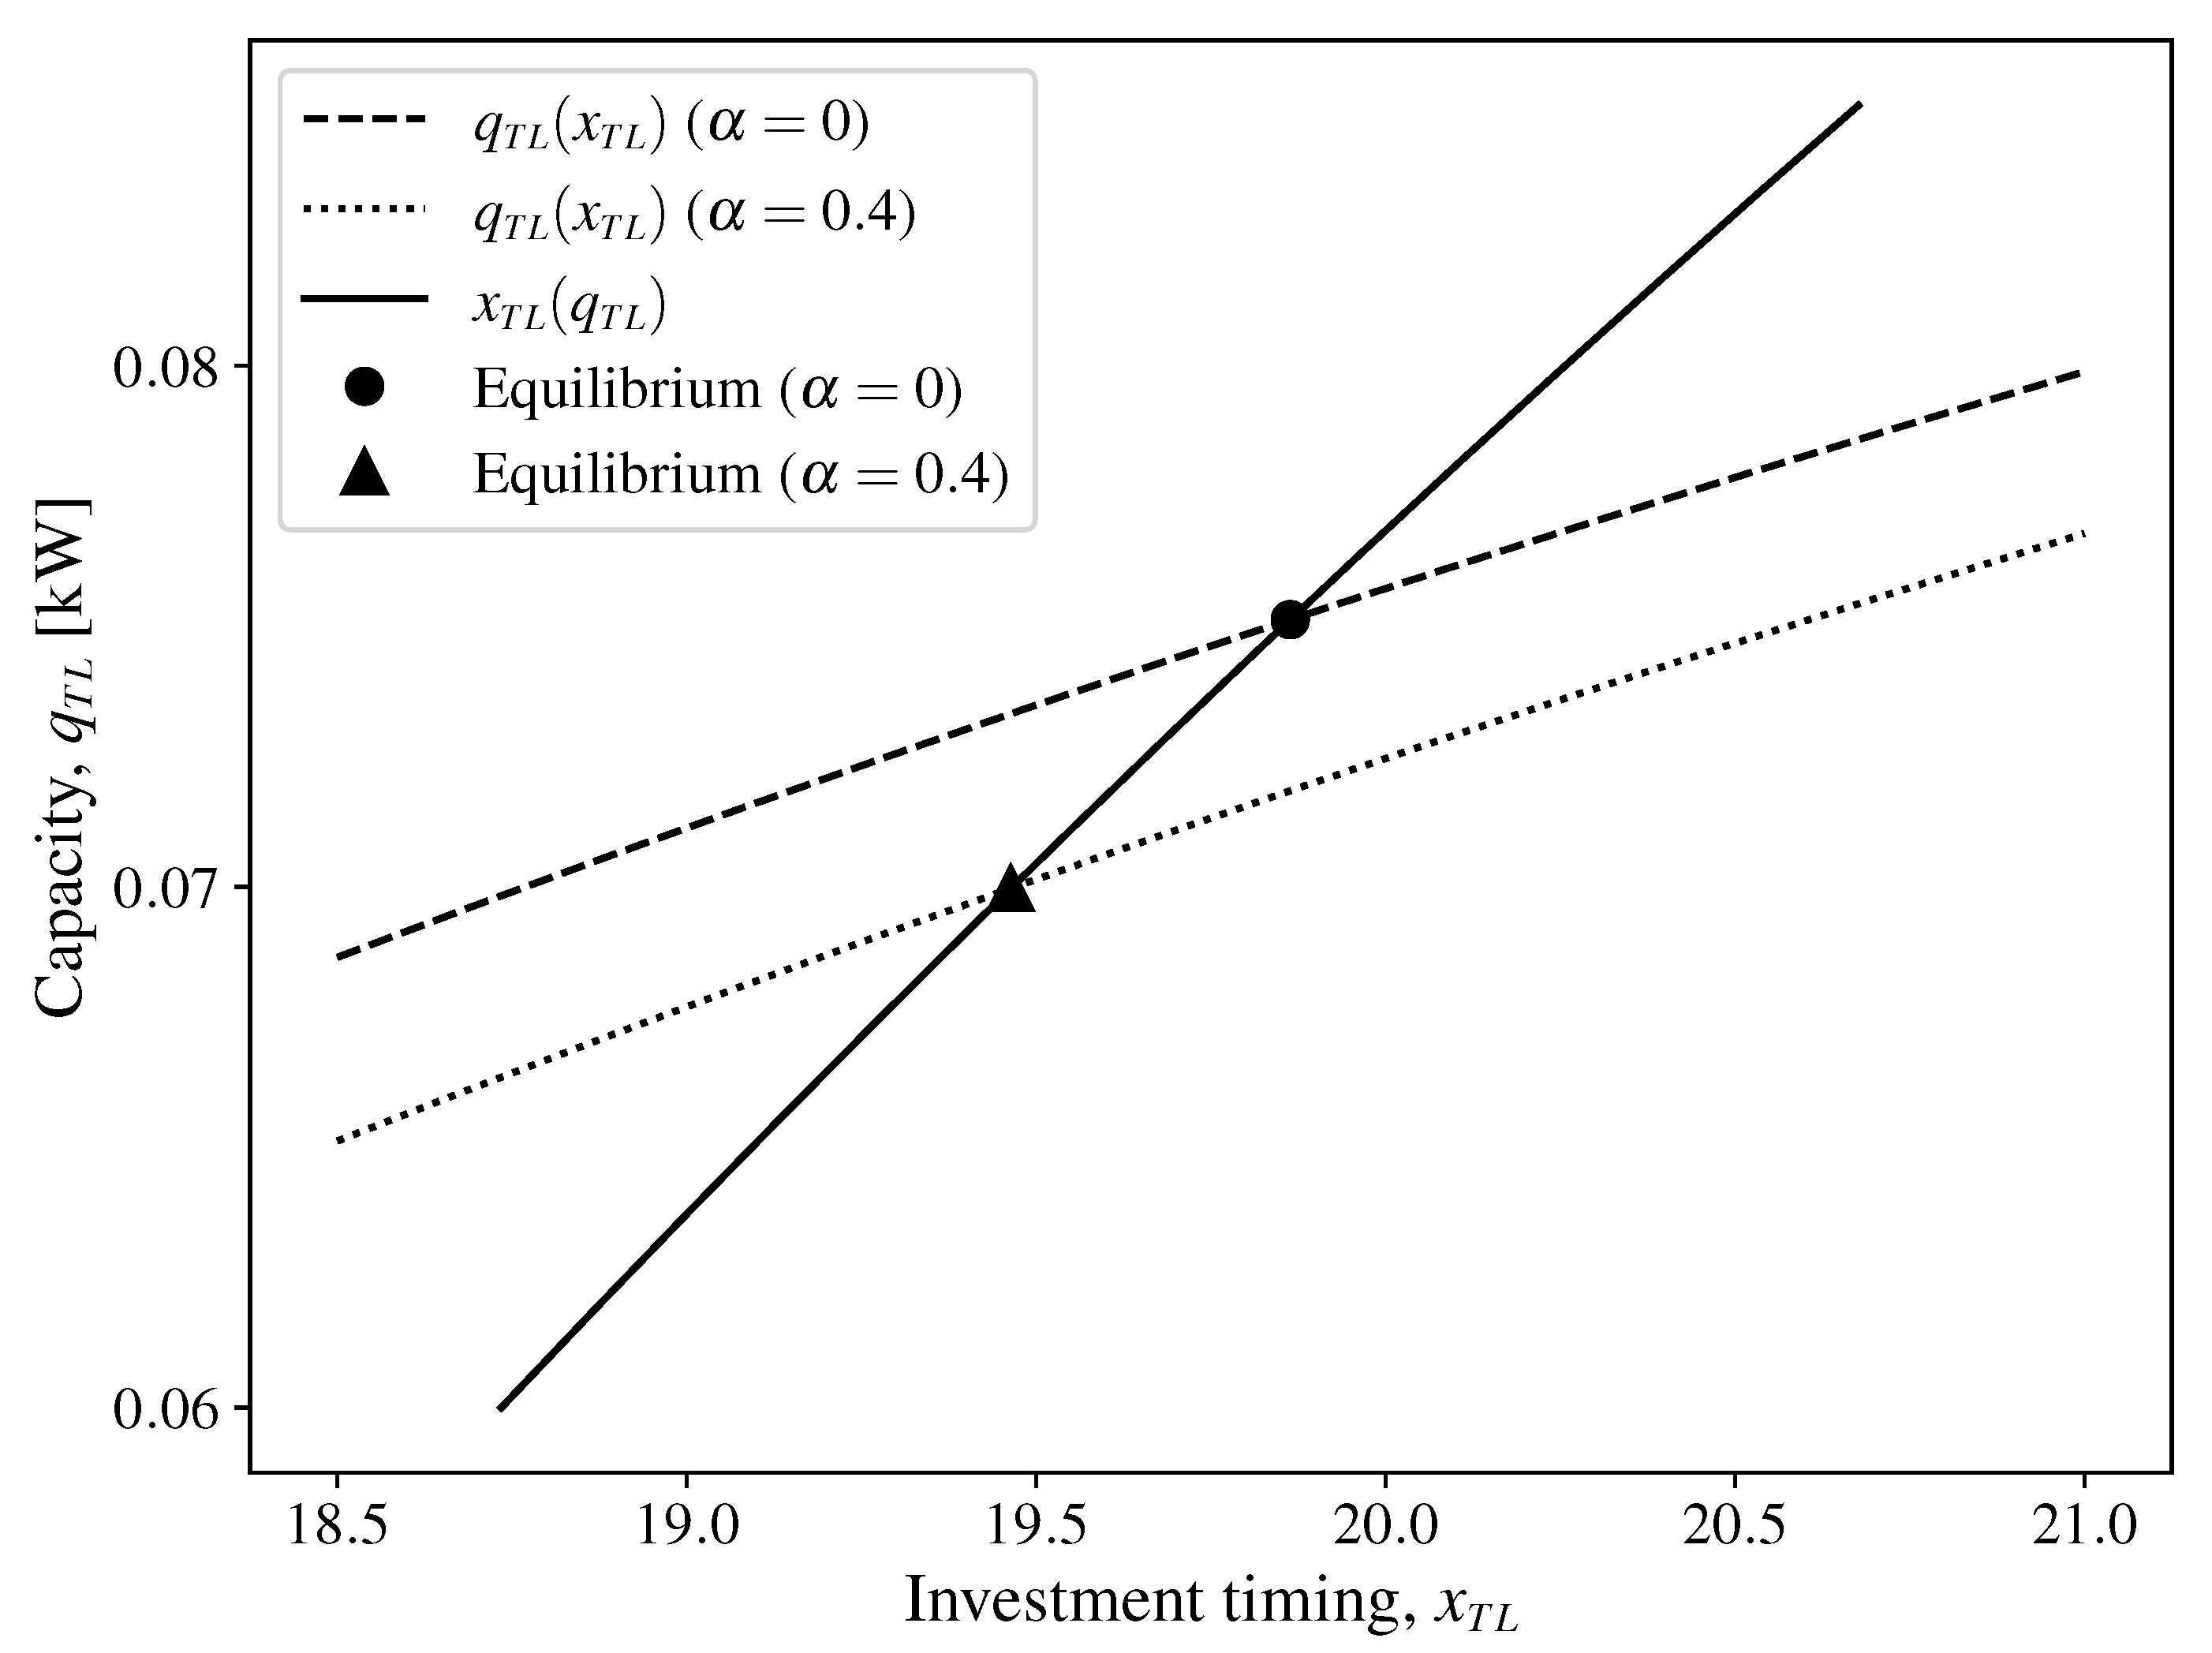
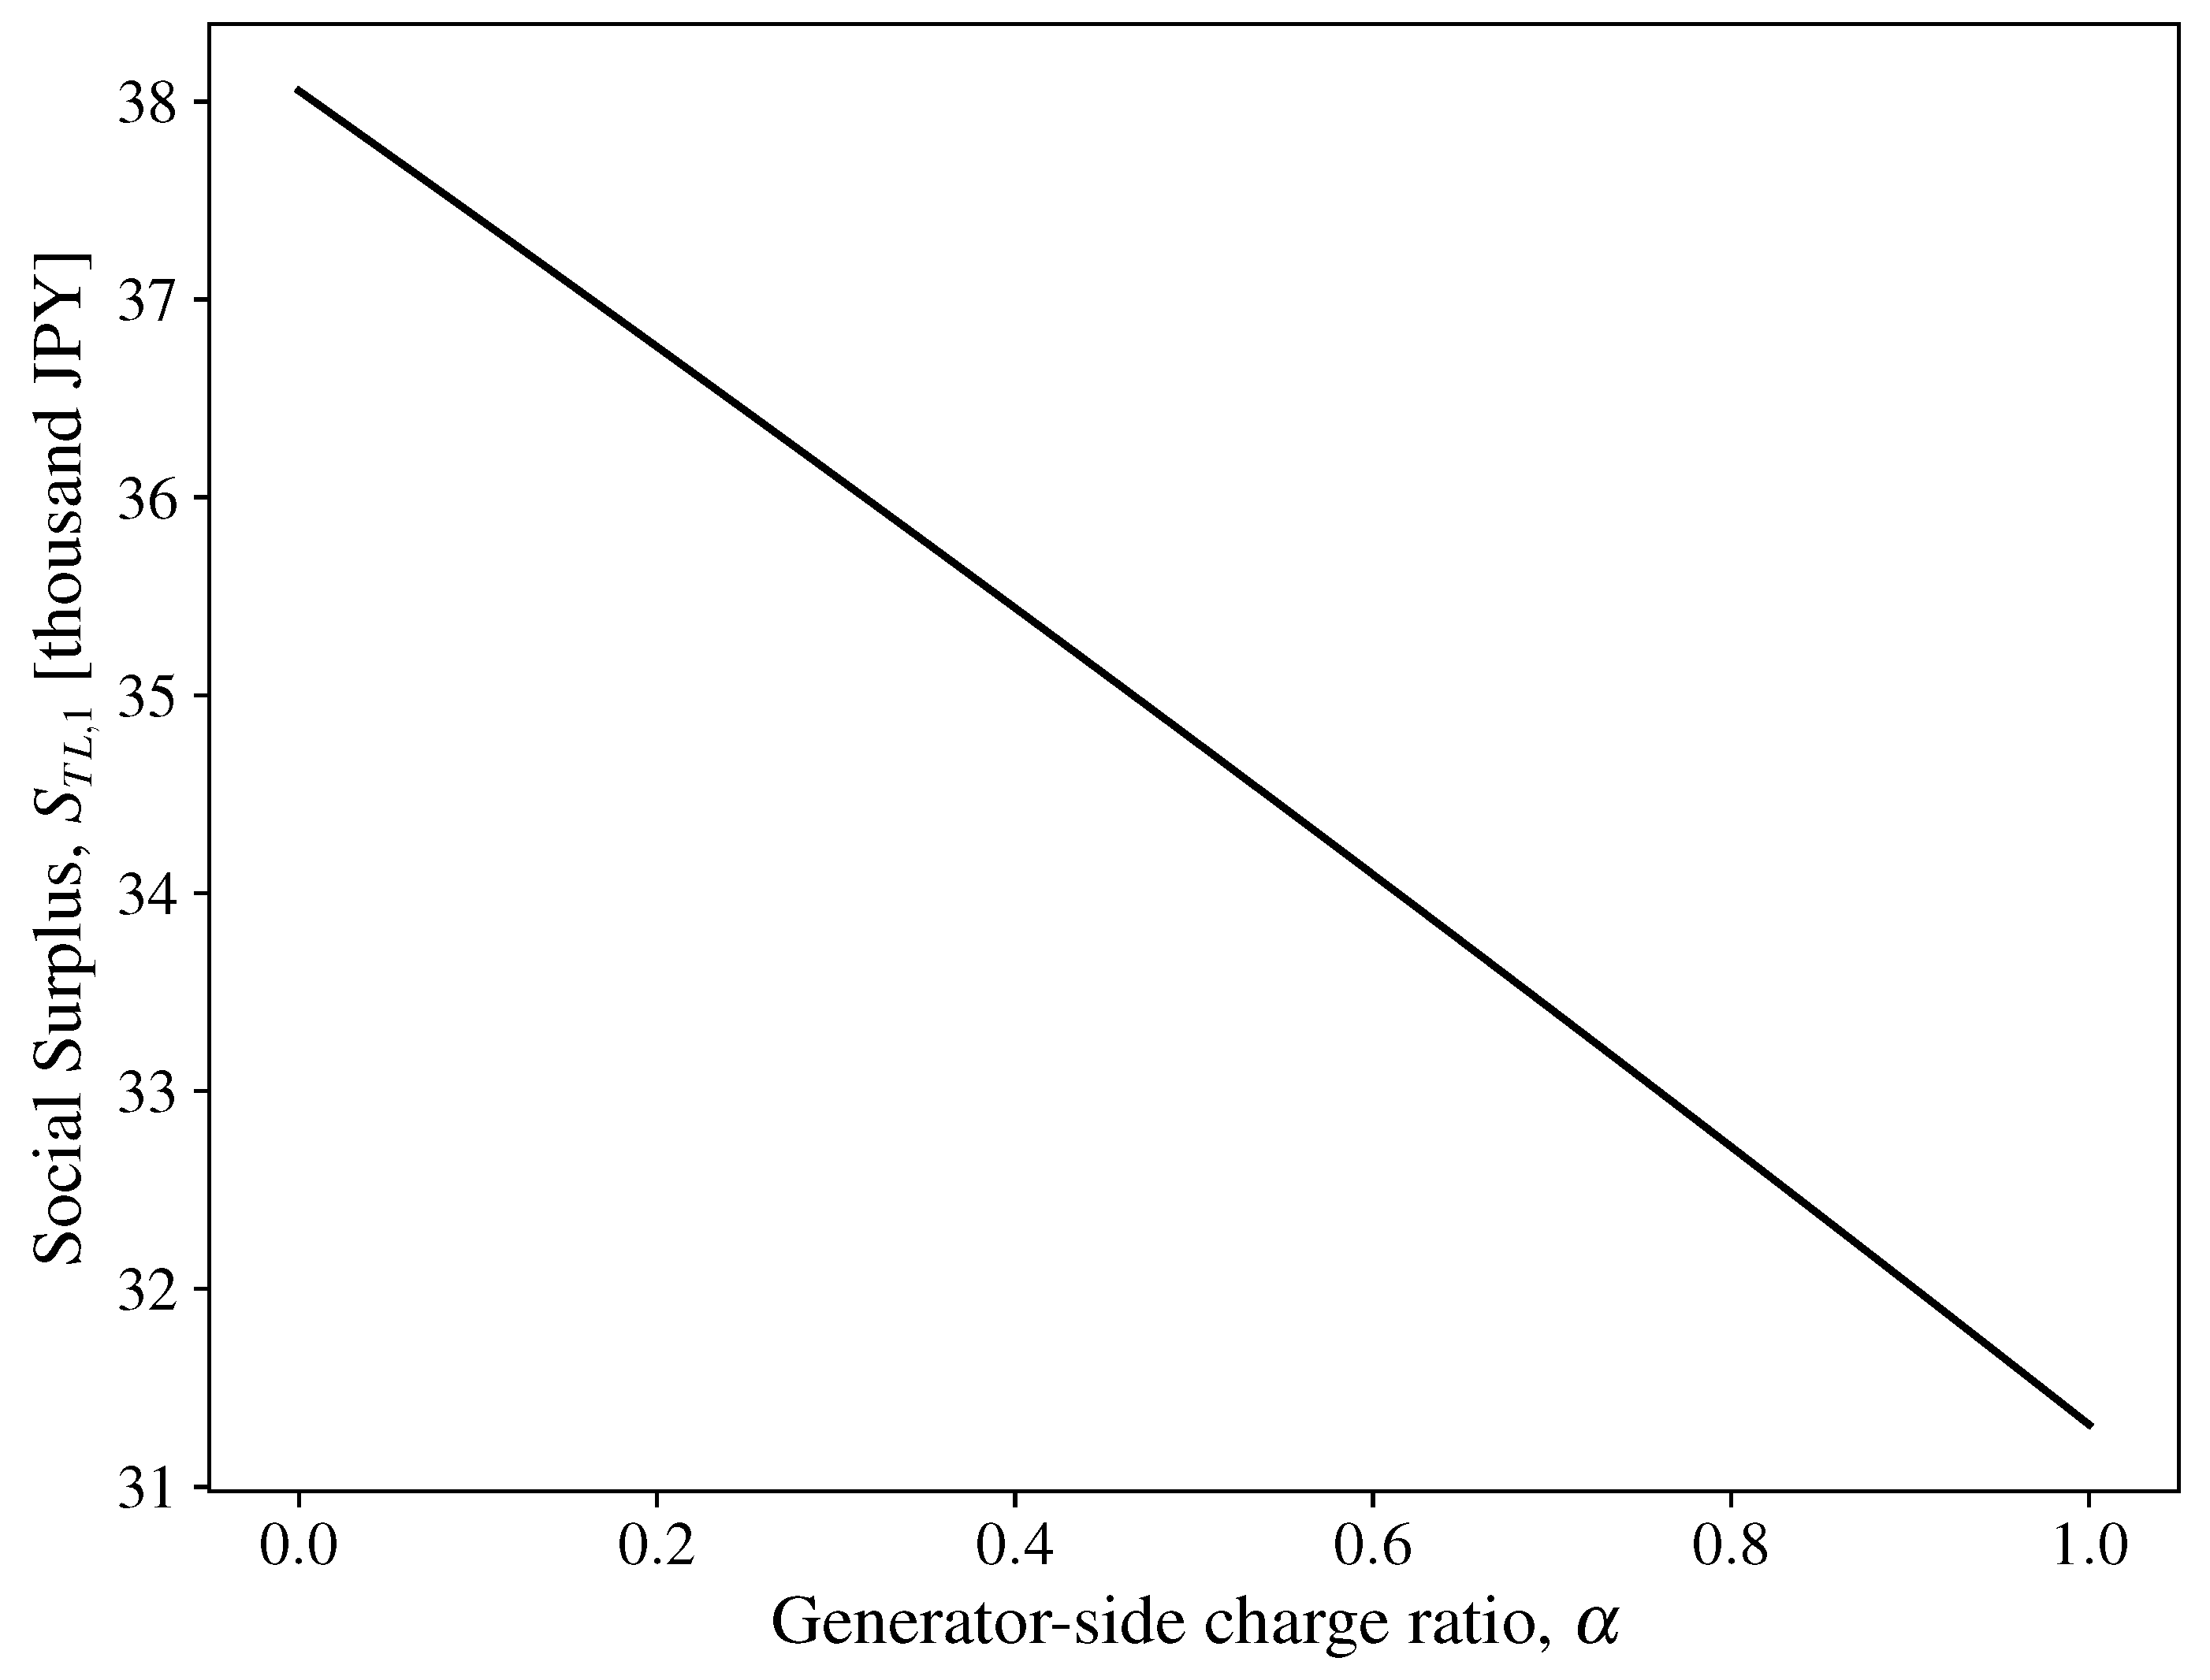
3.2. Analysis of Investment Timing, Capacity, and Social Surplus in the TL Framework

Figure 1 shows the equilibrium between the optimal capacity of the PC and the TSO’s optimal investment timing. As noted above, each entity selects its optimal decision by considering the decisions of the other entities. Accordingly, x T L ( q T L ) and q T L ( x T L ) can be interpreted as best-response functions to one another. In the figure, the vertical and horizontal axes denote investment capacity and investment timing, respectively, and the point at which these two functions intersect represents the equilibrium x T L * , q T L * . Moreover, both x T L ( q T L ) and q T L ( x T L ) are increasing functions of the other variables, reflecting strategic complementarity. Therefore, a unique equilibrium point existed within the realistic parameter ranges considered in this study.
Figure 2 and Figure 3 illustrate how each generator-side charge and uncertainty affect the equilibrium investment timing and capacity, respectively. Figure 2 shows that increasing the generator-side charge ratio α from 0.0 to 0.4 shifts the PC’s best response function q T L ( x T L ) decreases from 0.0751 kW to 0.0700 kW, representing a reduction of approximately 6.79%. Consequently, the equilibrium shifts downward and, compared with the case of α = 0 , the PC’s capacity at equilibrium is reduced. Meanwhile, a higher generator-side charge does not directly alter the TSO’s best response function x T L ( q T L ) . However, the downward shift in q T L ( x T L ) moves the intersection down and to the left, thereby accelerating the equilibrium investment timing. Thus, a higher generator-side charge reduces the equilibrium capacity and promotes earlier investment. Figure 3 shows that increasing the uncertainty of the electricity demand shock σ from 0.1 to 0.2 shifts the TSO’s best response function x T L ( q T L ) to the right. This shifts the equilibrium to later investment timing compared with the σ = 0.1 case. Meanwhile, higher demand uncertainty does not directly affect the PC’s best response function q T L ( x T L ) . However, the rightward shift of x T L ( q T L ) causes the intersection to move up and to the right, thereby increasing the equilibrium capacity. Therefore, greater demand shock uncertainty raises equilibrium capacity and delays the investment timing.
Figure 4 shows the social surplus calculated at each equilibrium using the corresponding combinations of investment timing and capacity for different generator-side charge values. This figure implies that social surplus declines monotonically as α increases. This figure suggests that social surplus decreases monotonically as the generator-side charge increases. In our model, a higher α raises the share of transmission costs borne by generators, and this burden increases in proportion to the installed capacity. Under the TL framework, where the generator’s decision variable is limited to investment capacity, the generator responds to rising costs by reducing the scale of investment. This leads to lower electricity output, which in turn reduces social surplus. This causal relationship holds consistently across the entire range of uncertainty levels ( σ = 0.1 to 0.9). Policymakers and regulators considering such a regulatory framework should exercise great care in setting the level of generator-side charges, fully accounting for the combined effects on the generator and consumer surpluses through adjustments in the equilibrium investment capacity and timing.

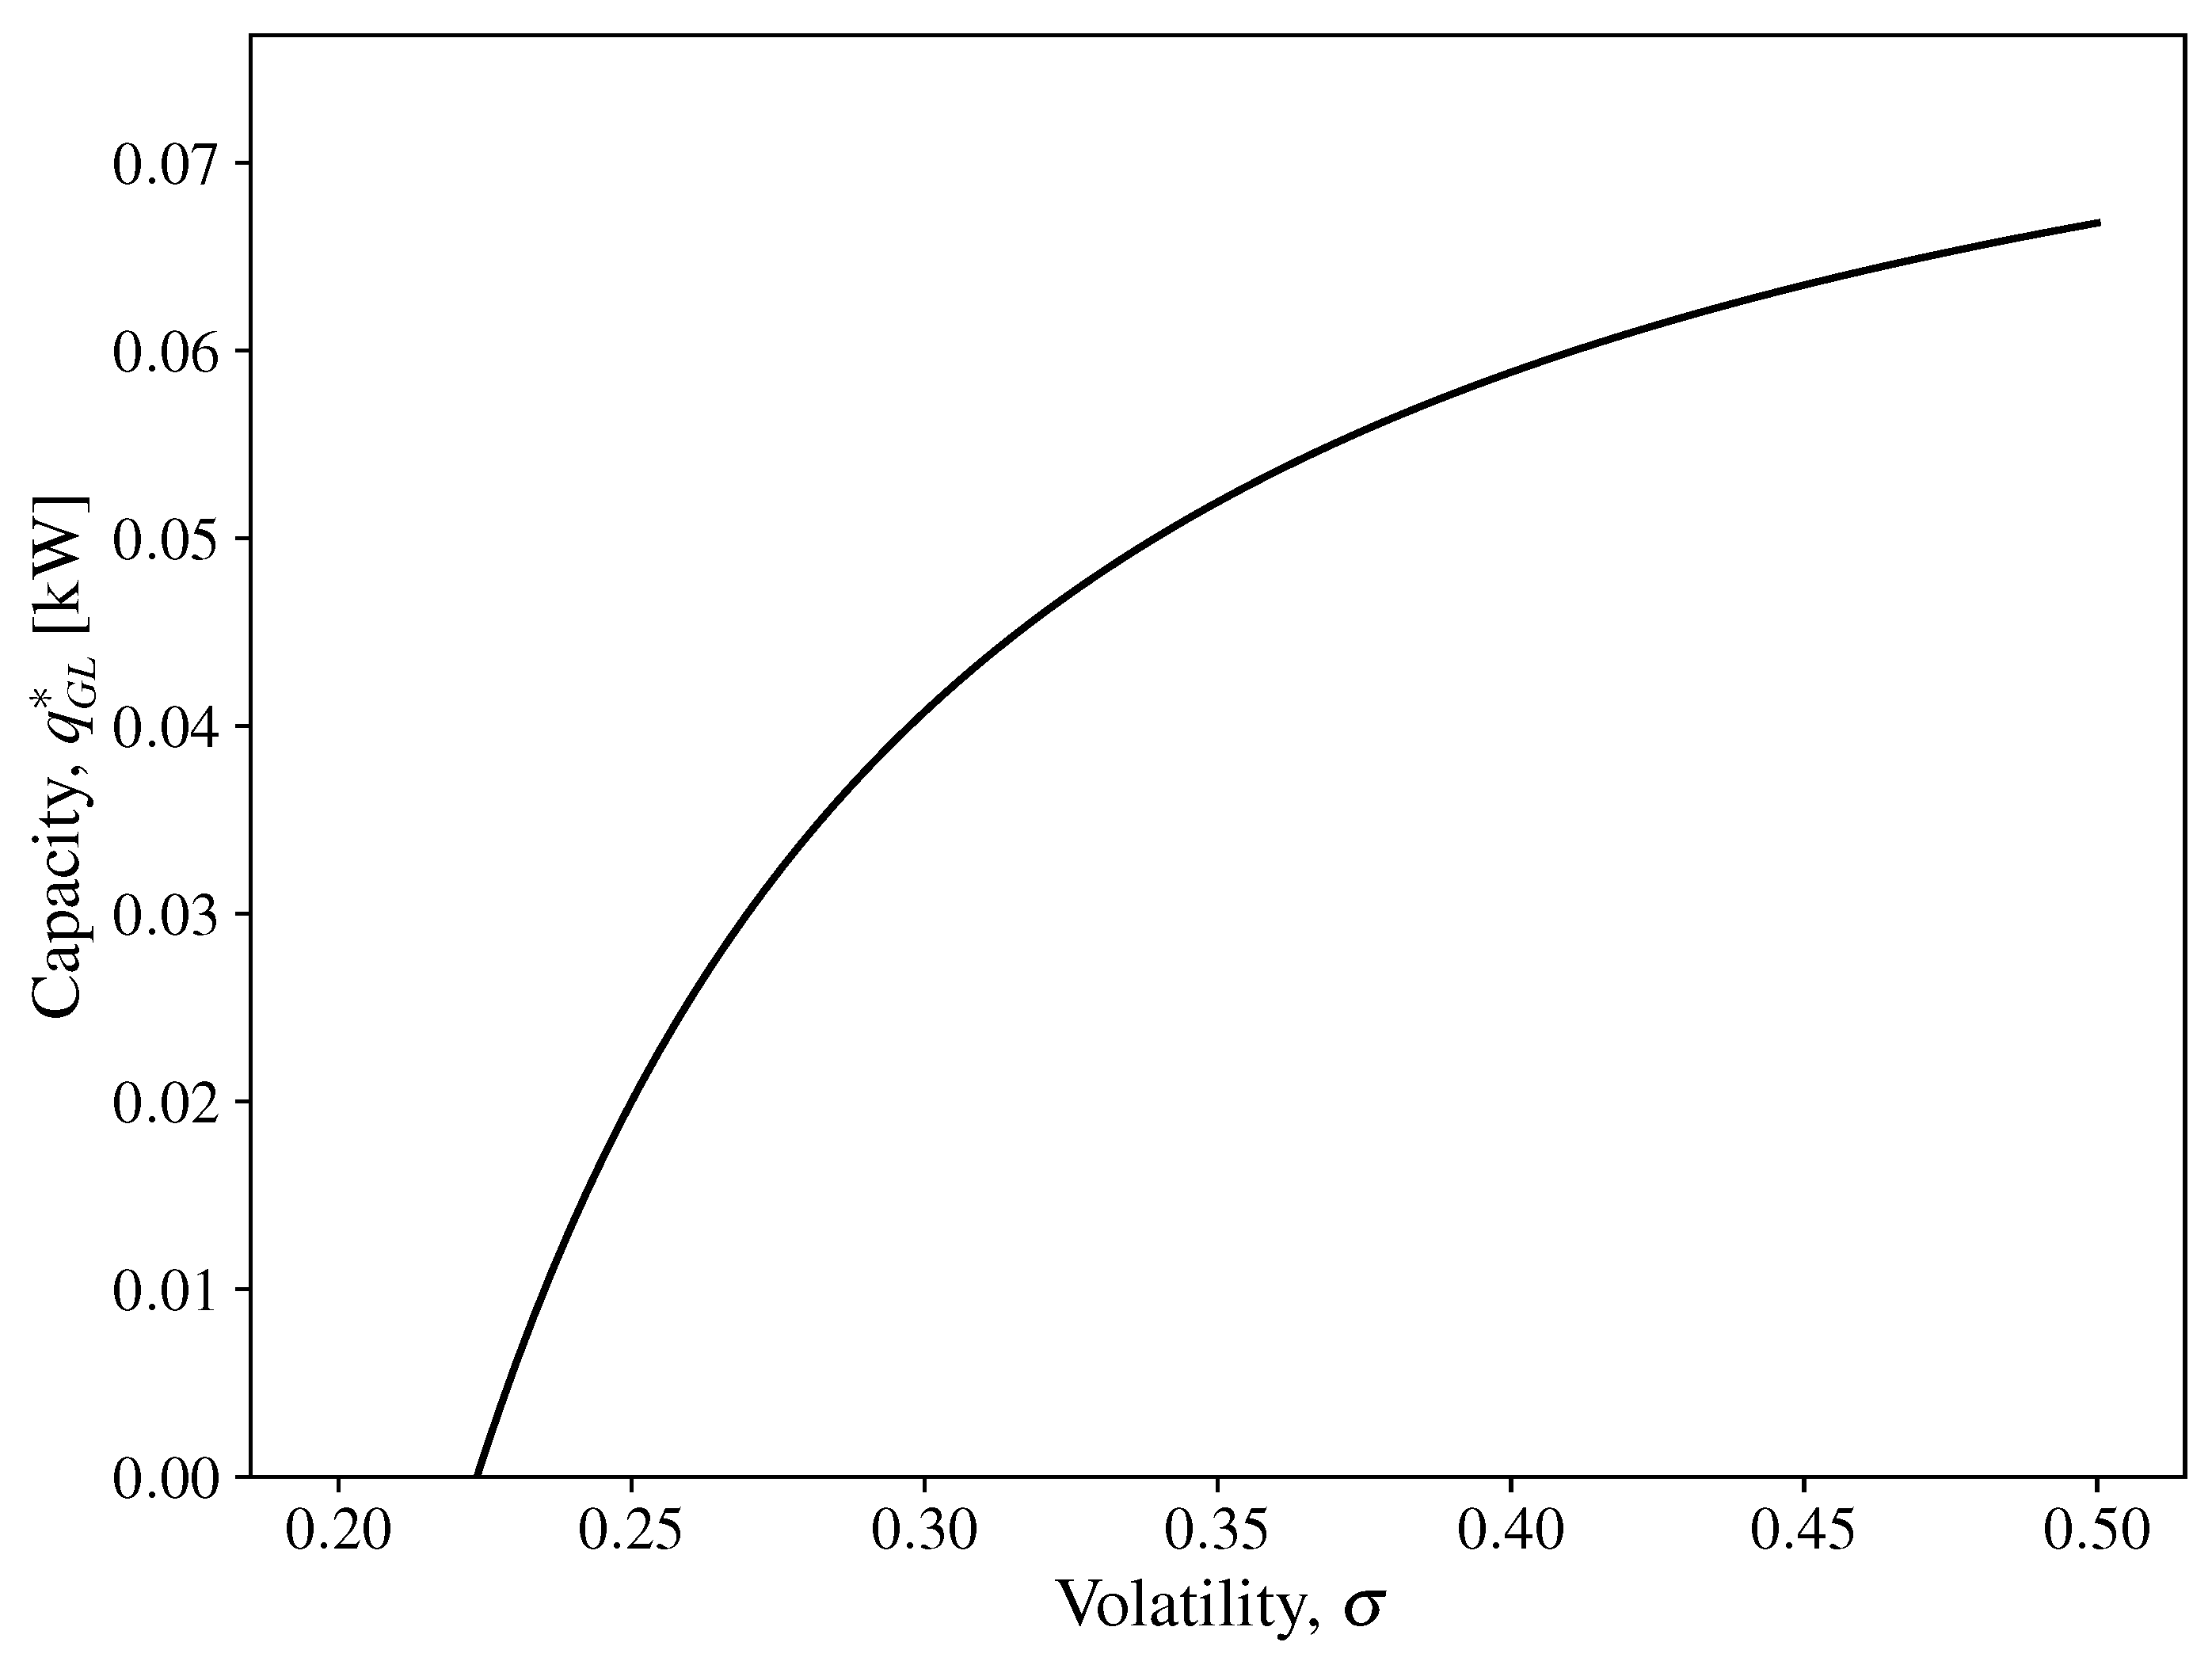
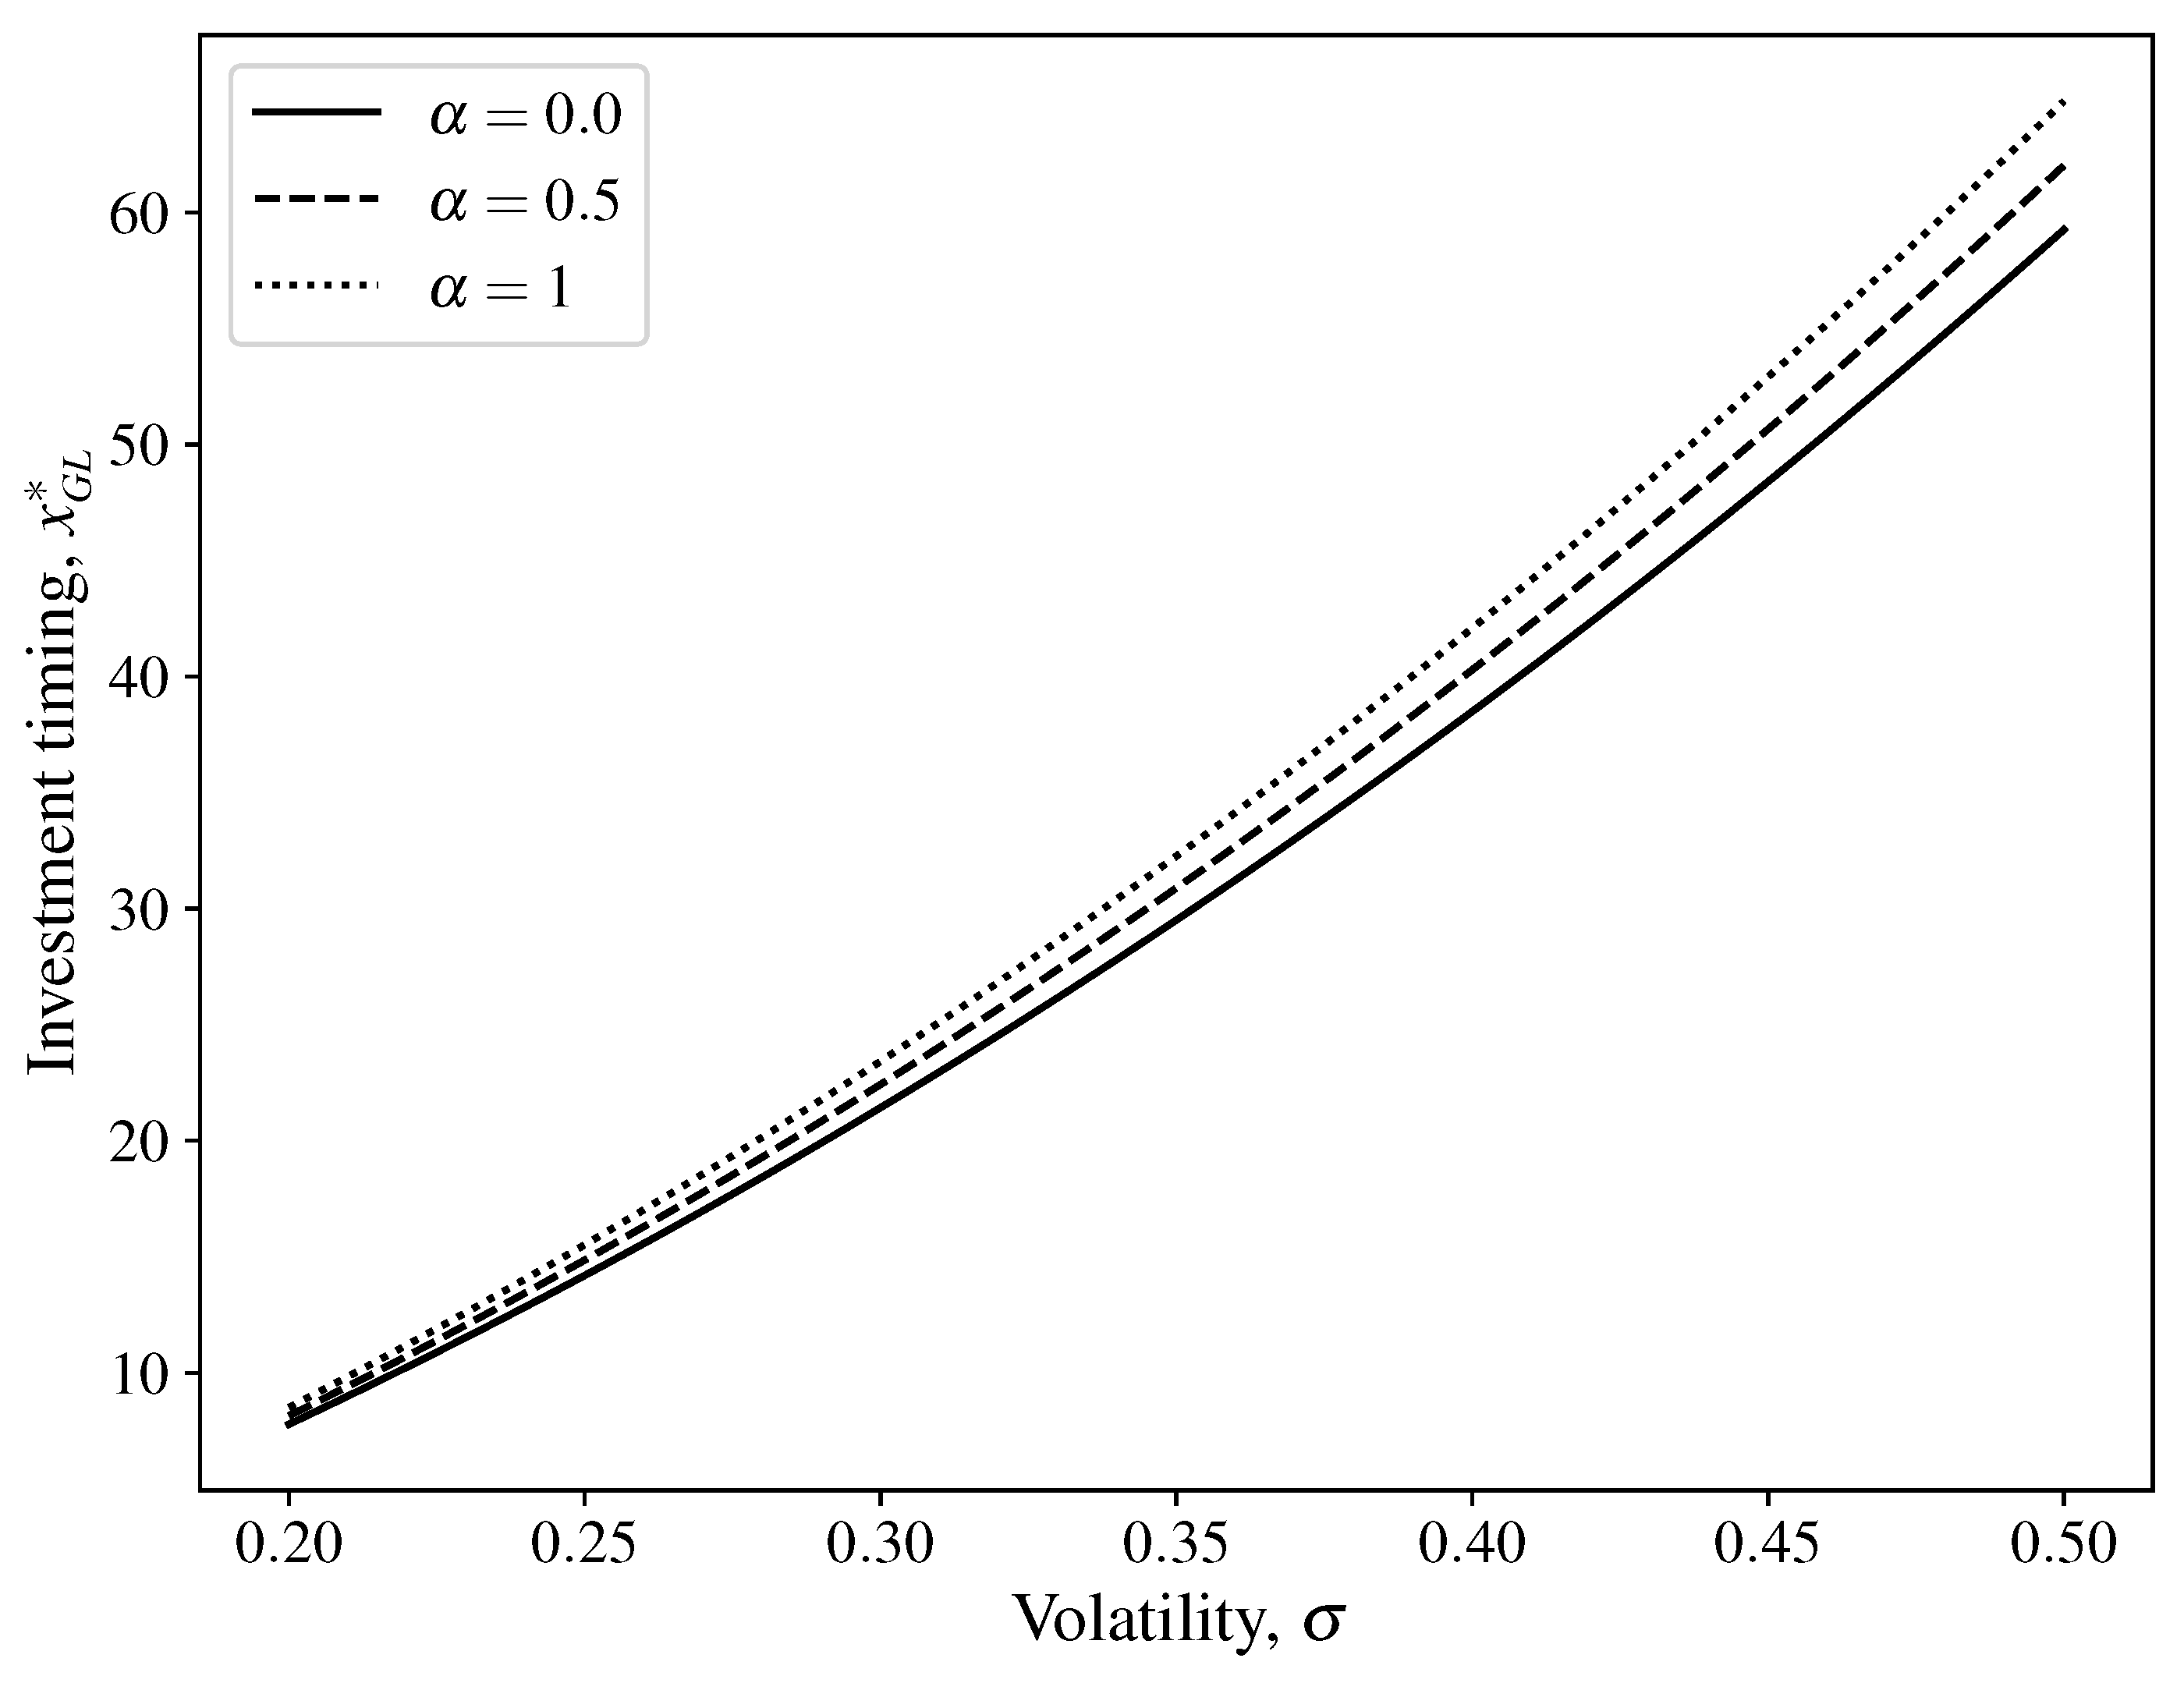
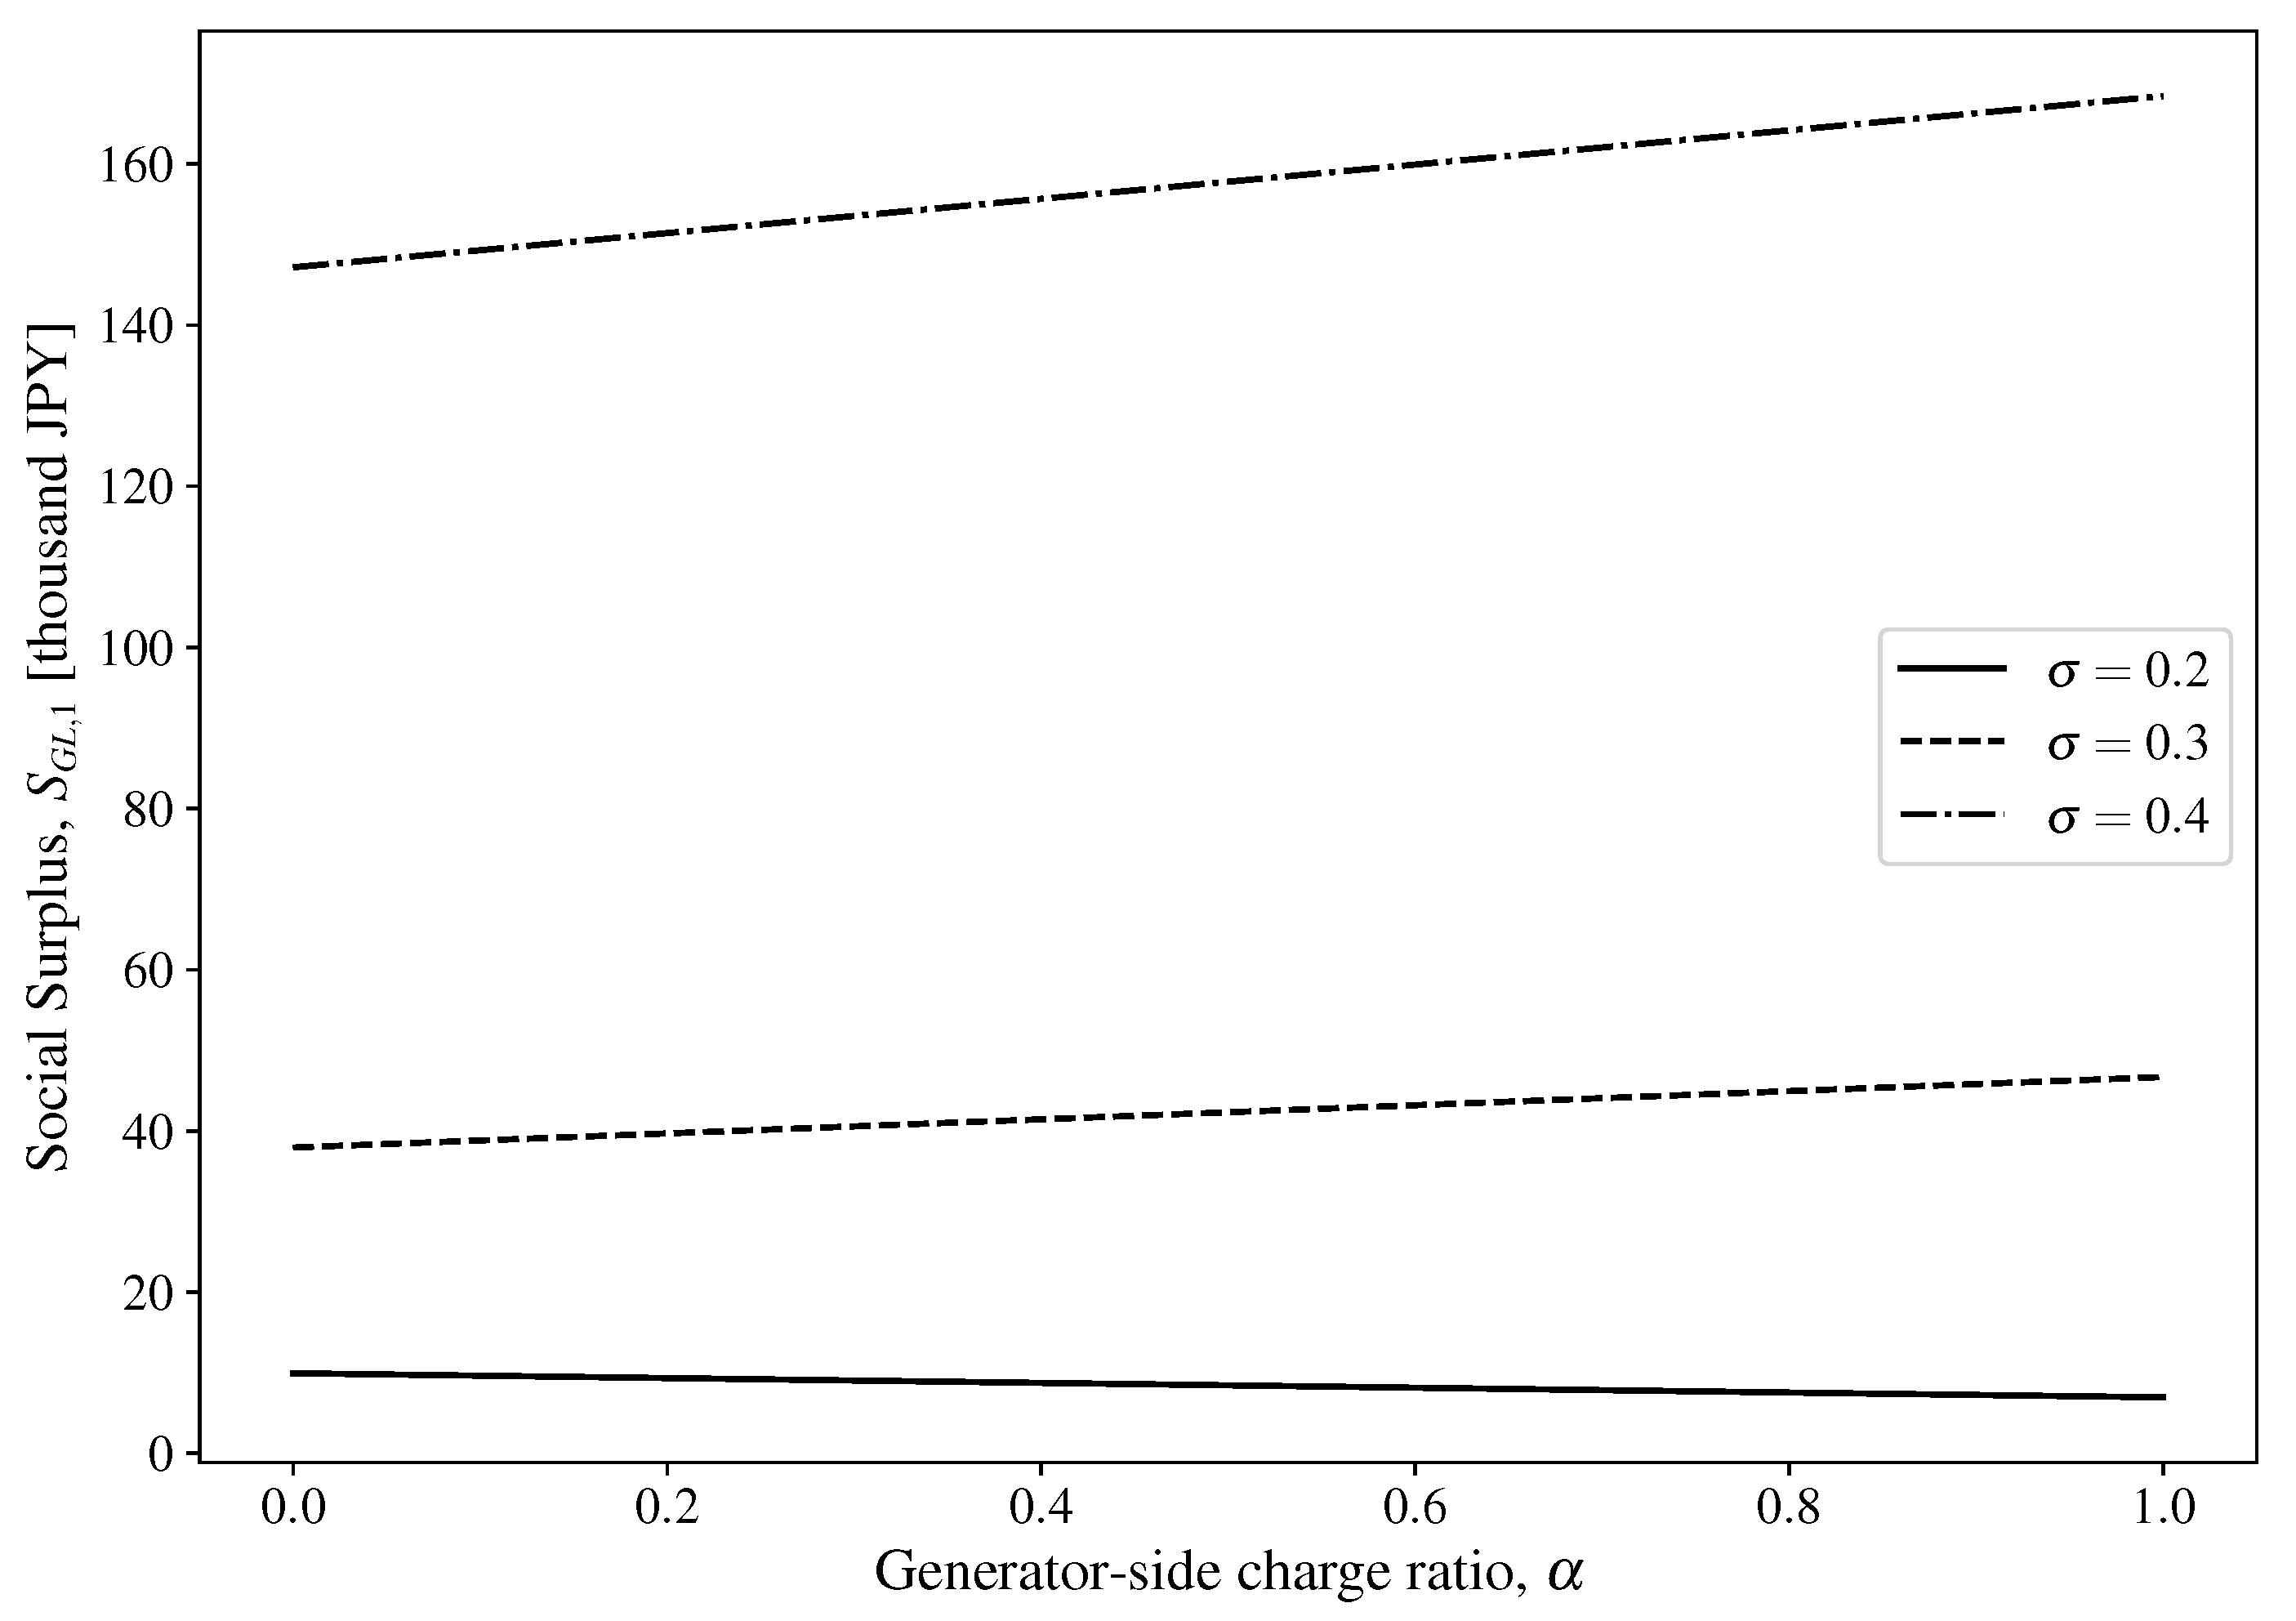
3.3. Analysis of Investment Timing, Capacity, and Social Surplus in the GL Framework

Figure 5 illustrates the effect of demand shock uncertainty on the optimal capacity q G L * . As σ increased, the optimal capacity increased steadily. The rate of increase was steep at low levels of uncertainty and then gradually tapered off. The initial rapid expansion reflects a higher likelihood of a future surge in demand, leading the PC to increase its capacity. The subsequent moderation indicates diminishing expected returns from further capacity addition as uncertainty increases. In other words, if early capacity expansion sufficiently mitigates the risk of undersupply, the additional uncertainty will have a smaller marginal incentive for further expansion. Thus, the response of the optimal capacity to an increasing σ is nonlinear: a sharp increase initially, followed by a decelerating upward trend. This suggests that under the GL framework, PC’s capacity strategy adjusts in stages according to the prevailing level of demand uncertainty.
Figure 6 depicts the effects of demand shock uncertainty and the generator-side charge on the optimal investment timing in the GL framework. In this analysis, α was set to 0, 0.5, and 1.0. As α increases, the optimal investment timing x G L * consistently shifts upward. This shift indicates that a larger generator-side charge increases the PC’s cost burden, reduces the expected return on the new investment, and induces the PC to defer investment. Moreover, an increase in σ increases x G L * . As uncertainty increases, the PC requires additional risk premiums for its investments. Consequently, increasing σ delays the investment decisions. Additionally, the slope of the curve for x G L * increases with α . In other words, as the generator-side charge increases, the delaying effect of uncertainty on the investment timing is amplified. Therefore, at higher values of α , rising uncertainty more strongly triggers risk-averse behavior in the PC, making the delay in optimal timing more pronounced. These findings characterize the interaction between the level of generator-side charge and the demand shock uncertainty in shaping the PC’s investment behavior. Policymakers should design an investment environment that considers the setting of the generator-side charge and uncertainty in demand shocks simultaneously.
Figure 7 presents the effect of the generator-side charge on social surplus for three levels of demand-shock uncertainty, σ = 0.2, 0.3, and 0.4. In the GL framework with high uncertainty, increases in the generator-side charge lead to a higher social surplus. Taken together with Figure 5 and Figure 6, an increase in α delays the PC’s investment timing and induces larger capacity investments, thereby boosting generation output and producer surplus after investment. This gain in the producer surplus drives the observed increase in the total social surplus. Moreover, the amplifying effect of higher generator-side charges on the social surplus becomes more pronounced as uncertainty increases. For σ = 0.3 and 0.4, the social surplus increases consistently with α , indicating that the PC’s expanded expected profits underlie the surplus increase. By contrast, for σ = 0.2, the change in social surplus is stable. These results suggest that the generator-side charge has a different effect on social surplus depending on the uncertainty level. Overall, when a PC decides on both investment timing and capacity, implementing a generator-side charge can have a positive effect on the social surplus. Policymakers considering such charges should, therefore, assess uncertainty levels carefully. In high-demand uncertainty, they establish a regulatory framework that grants the generator these decision rights to realize potential gains in social surplus.

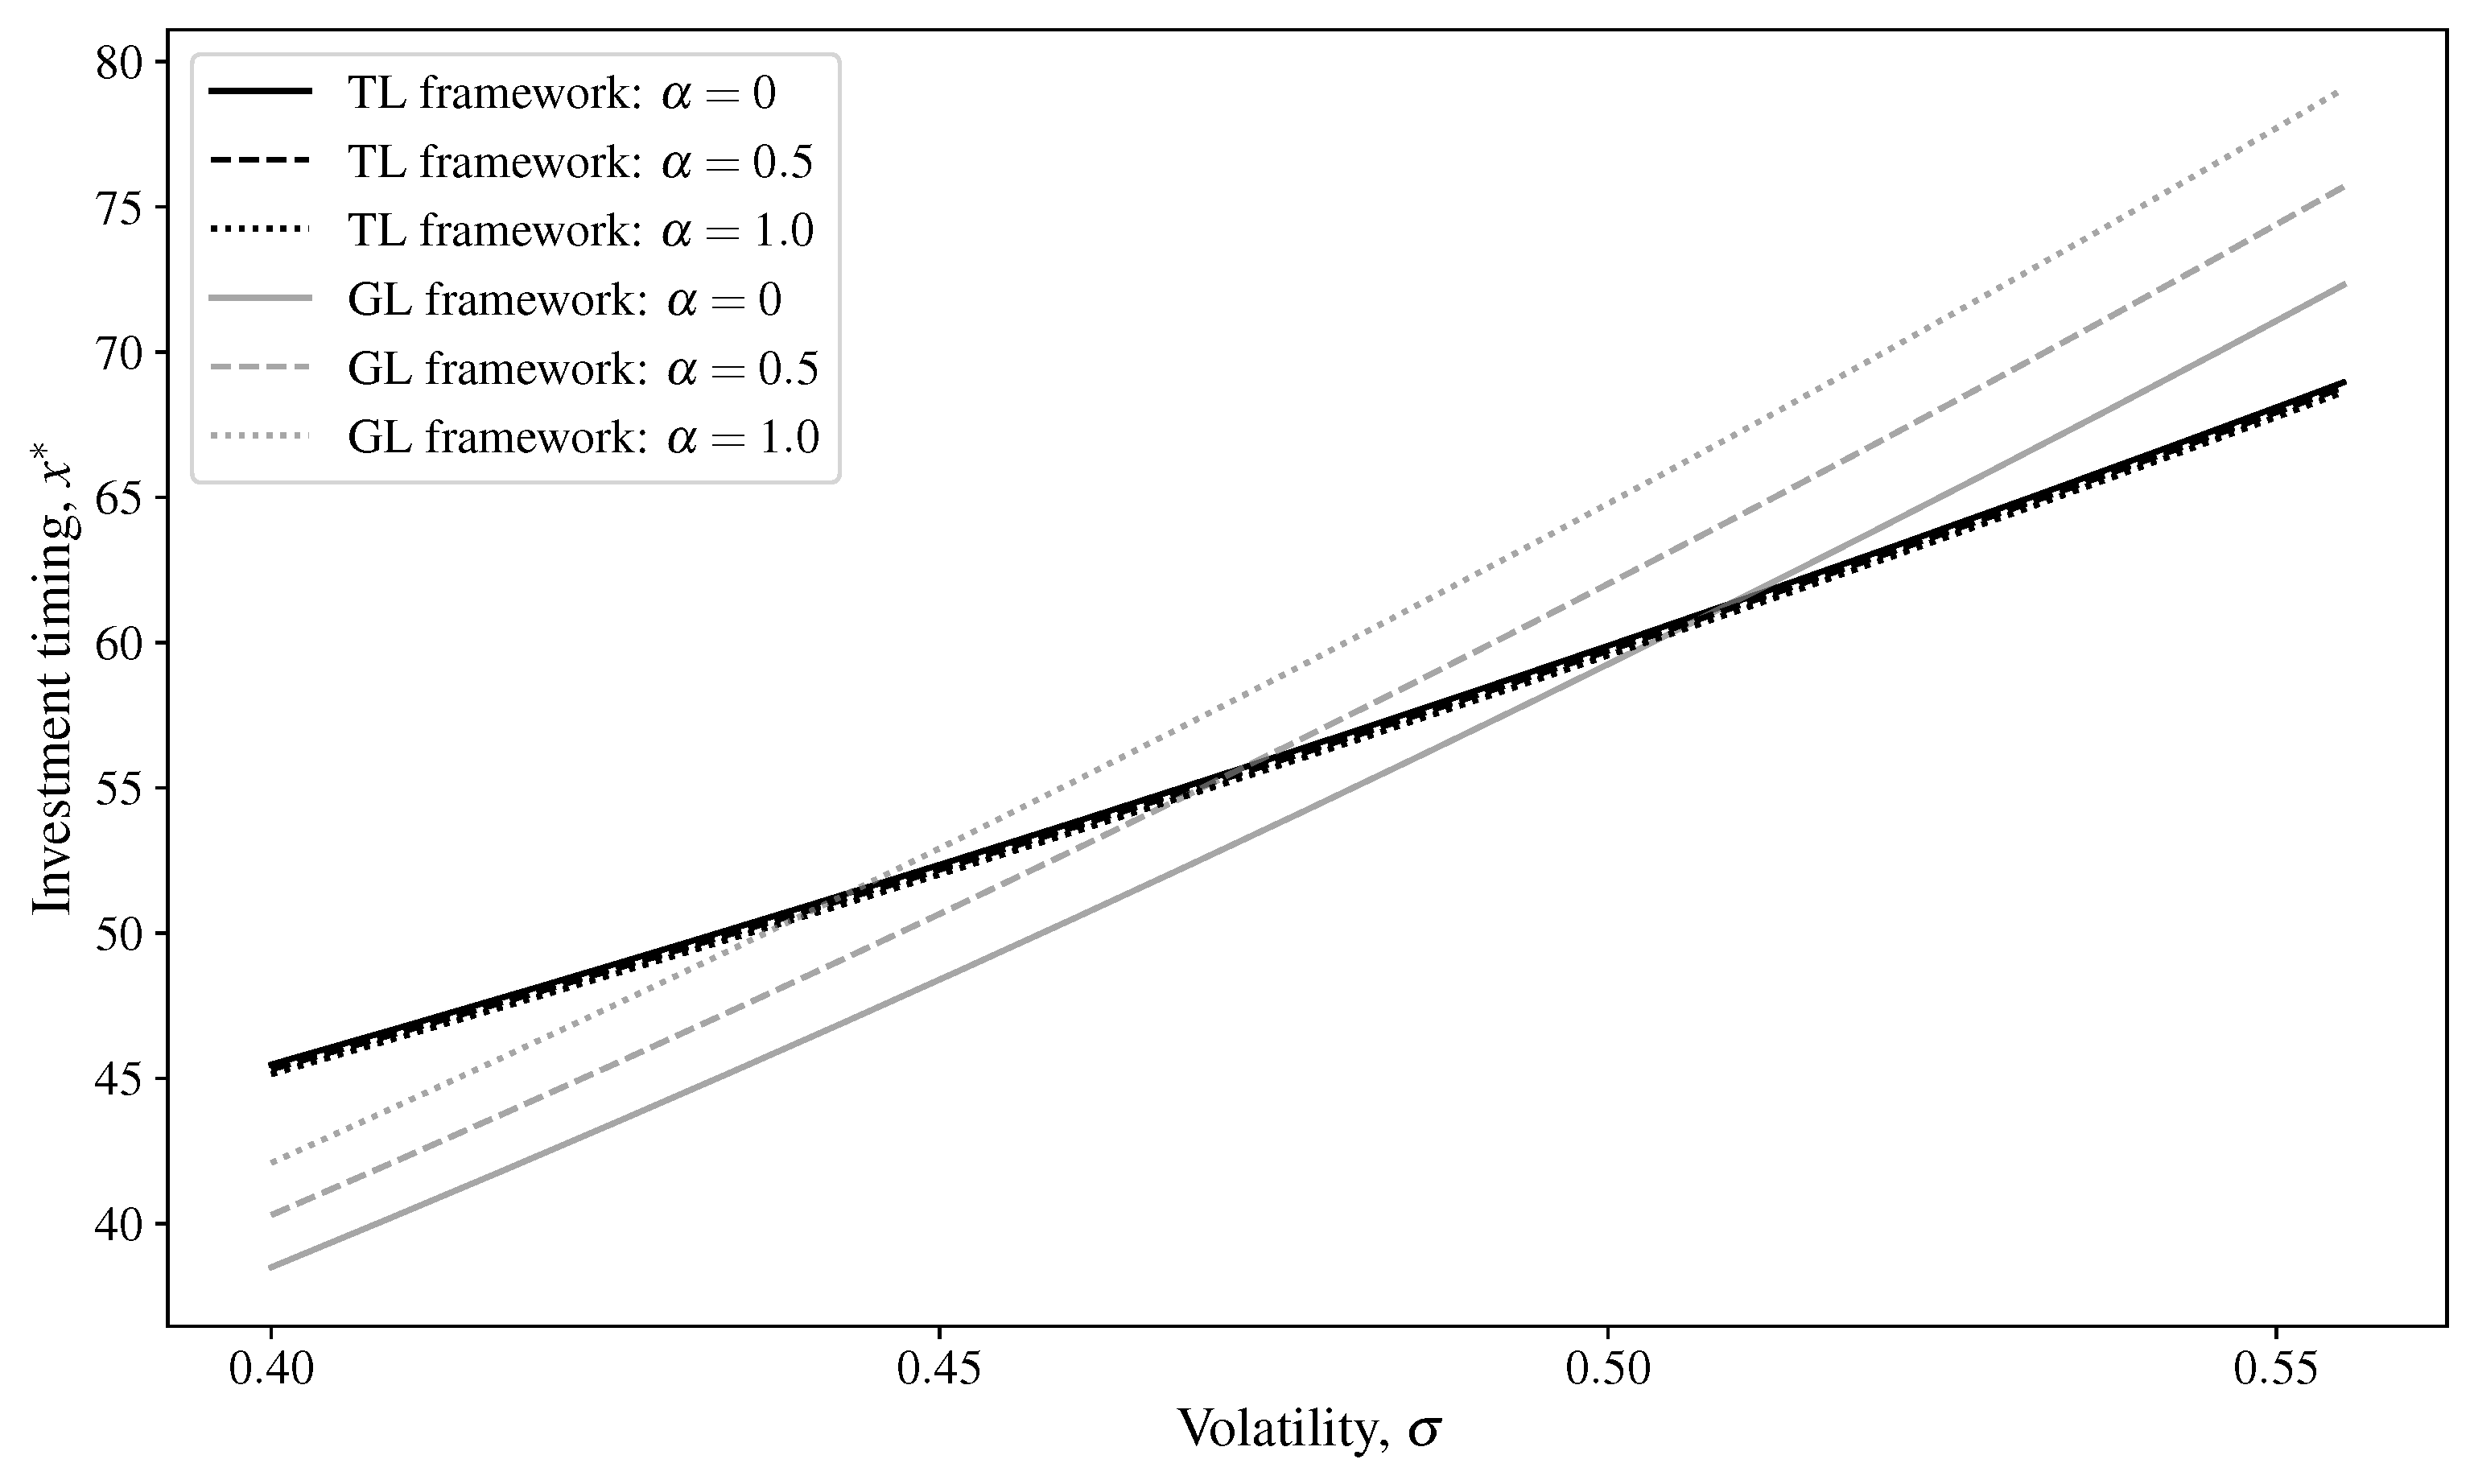
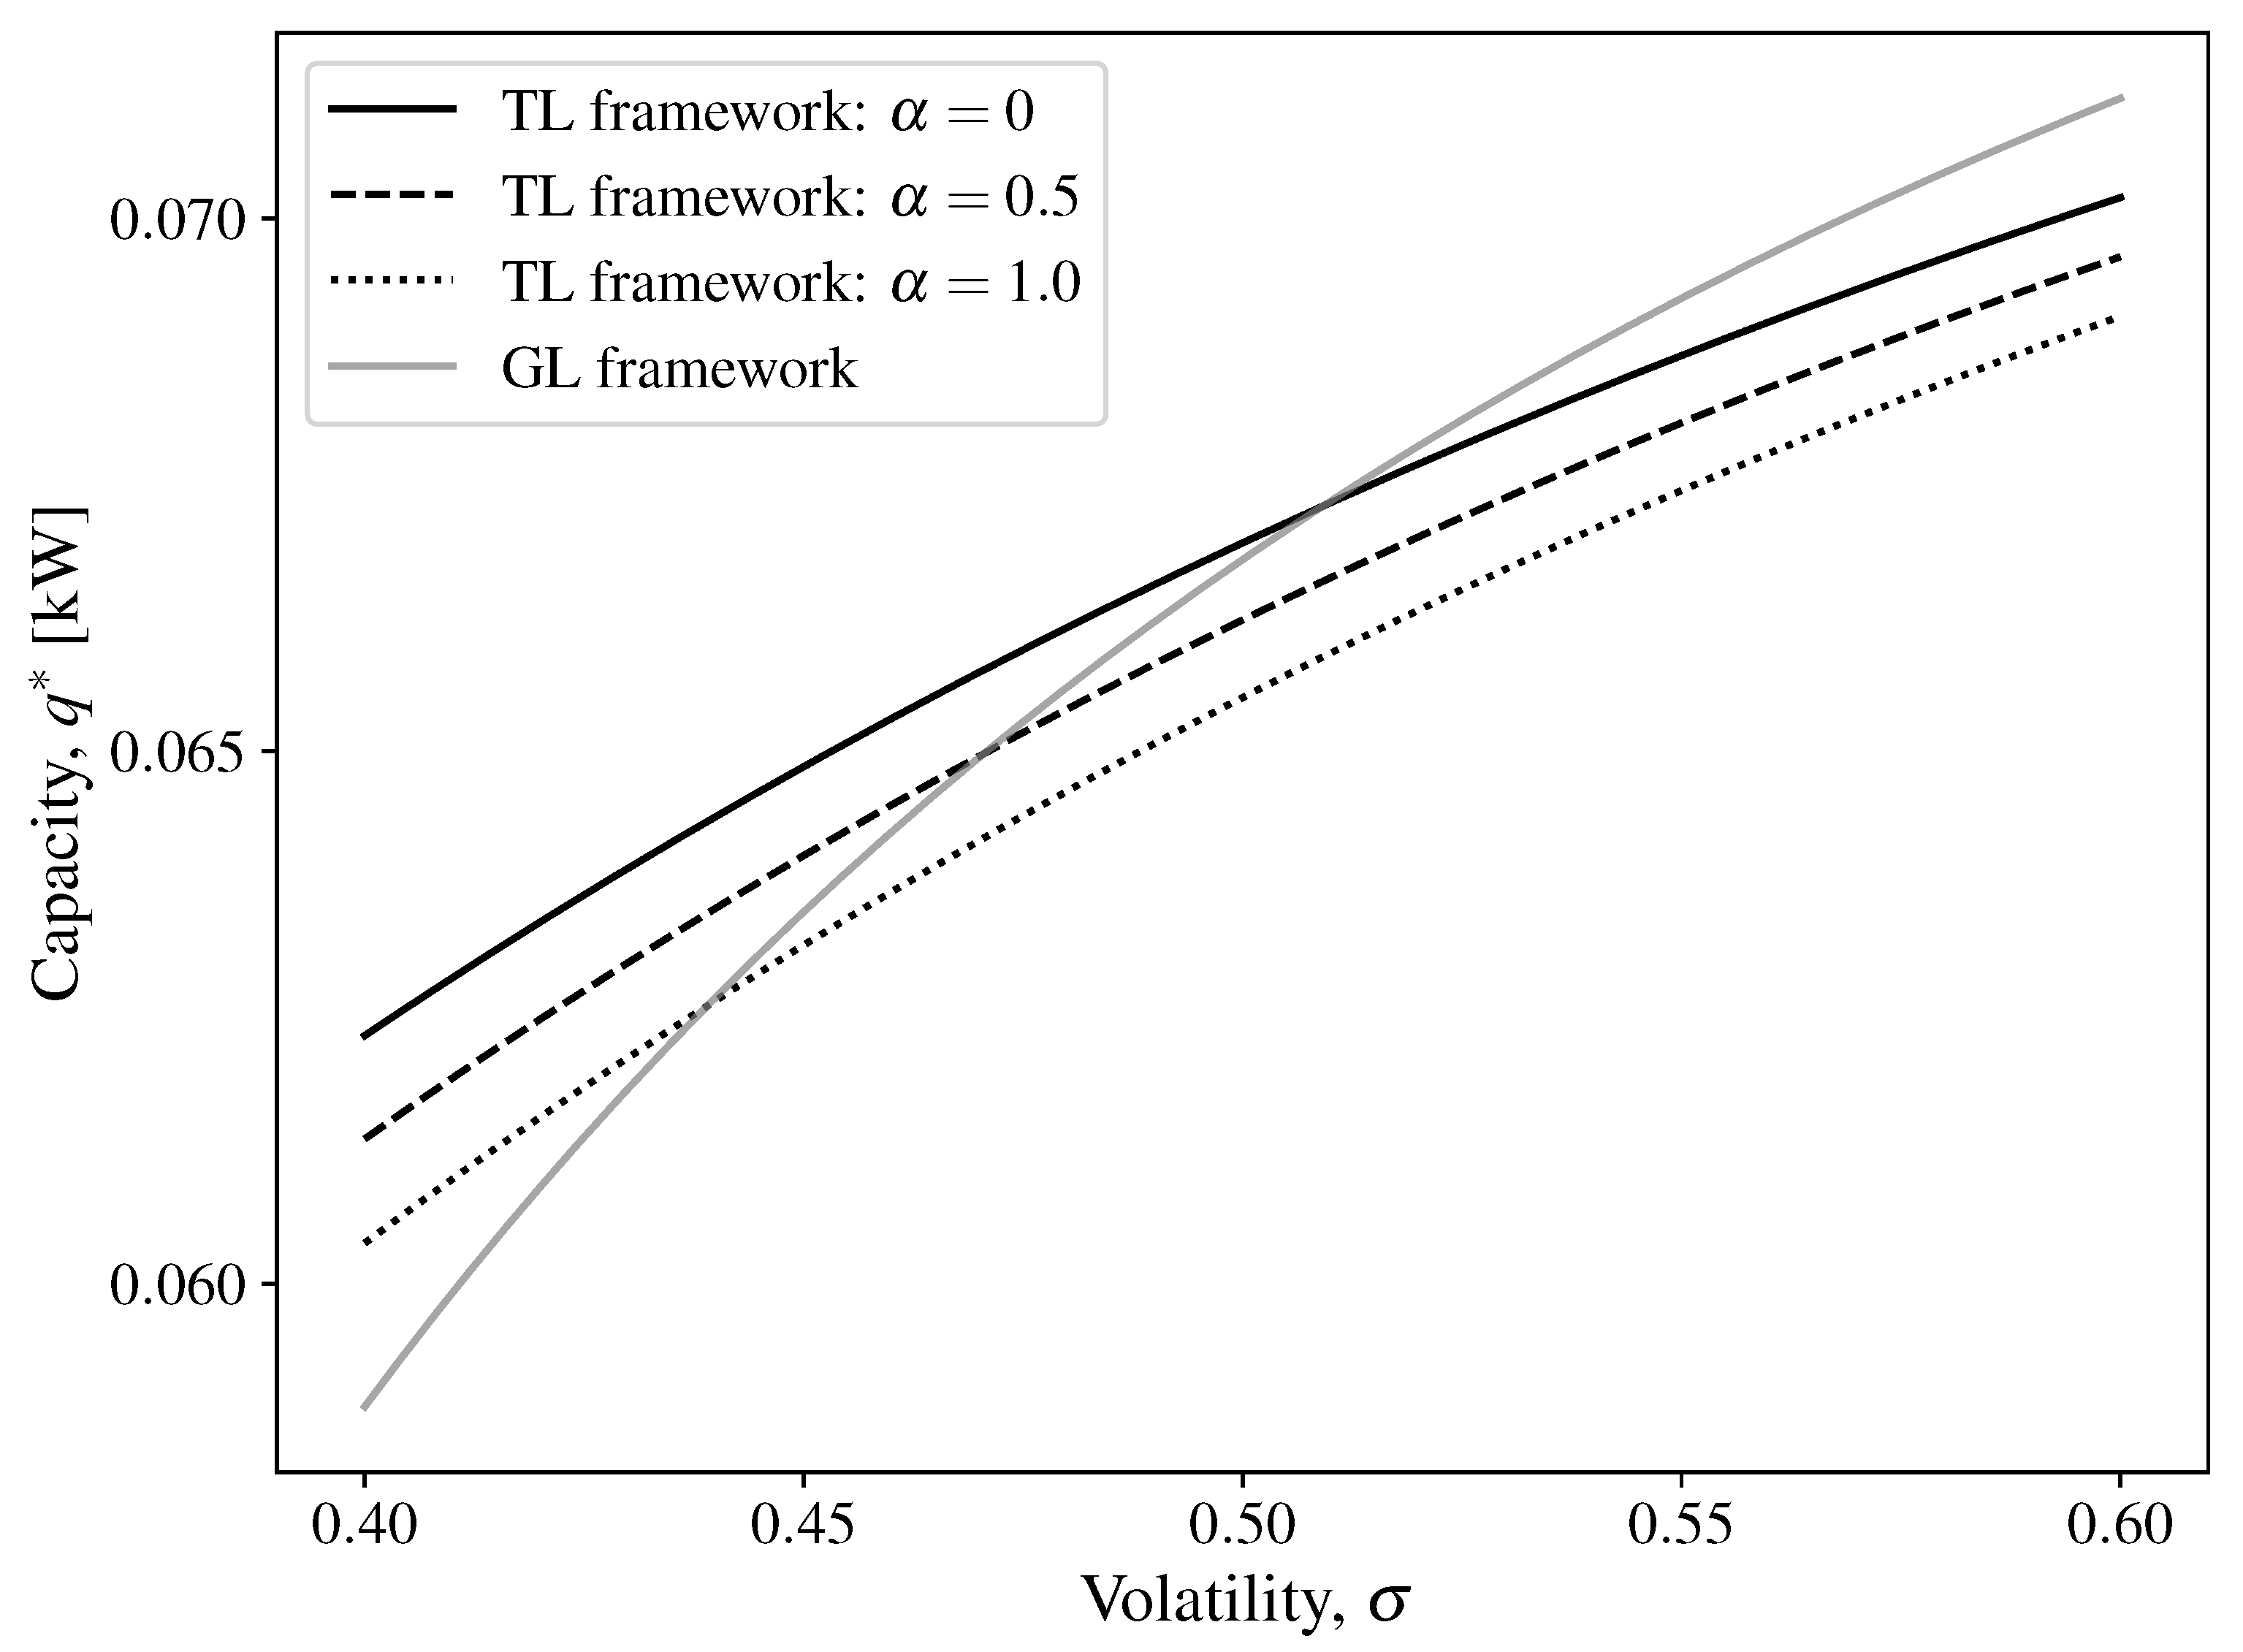
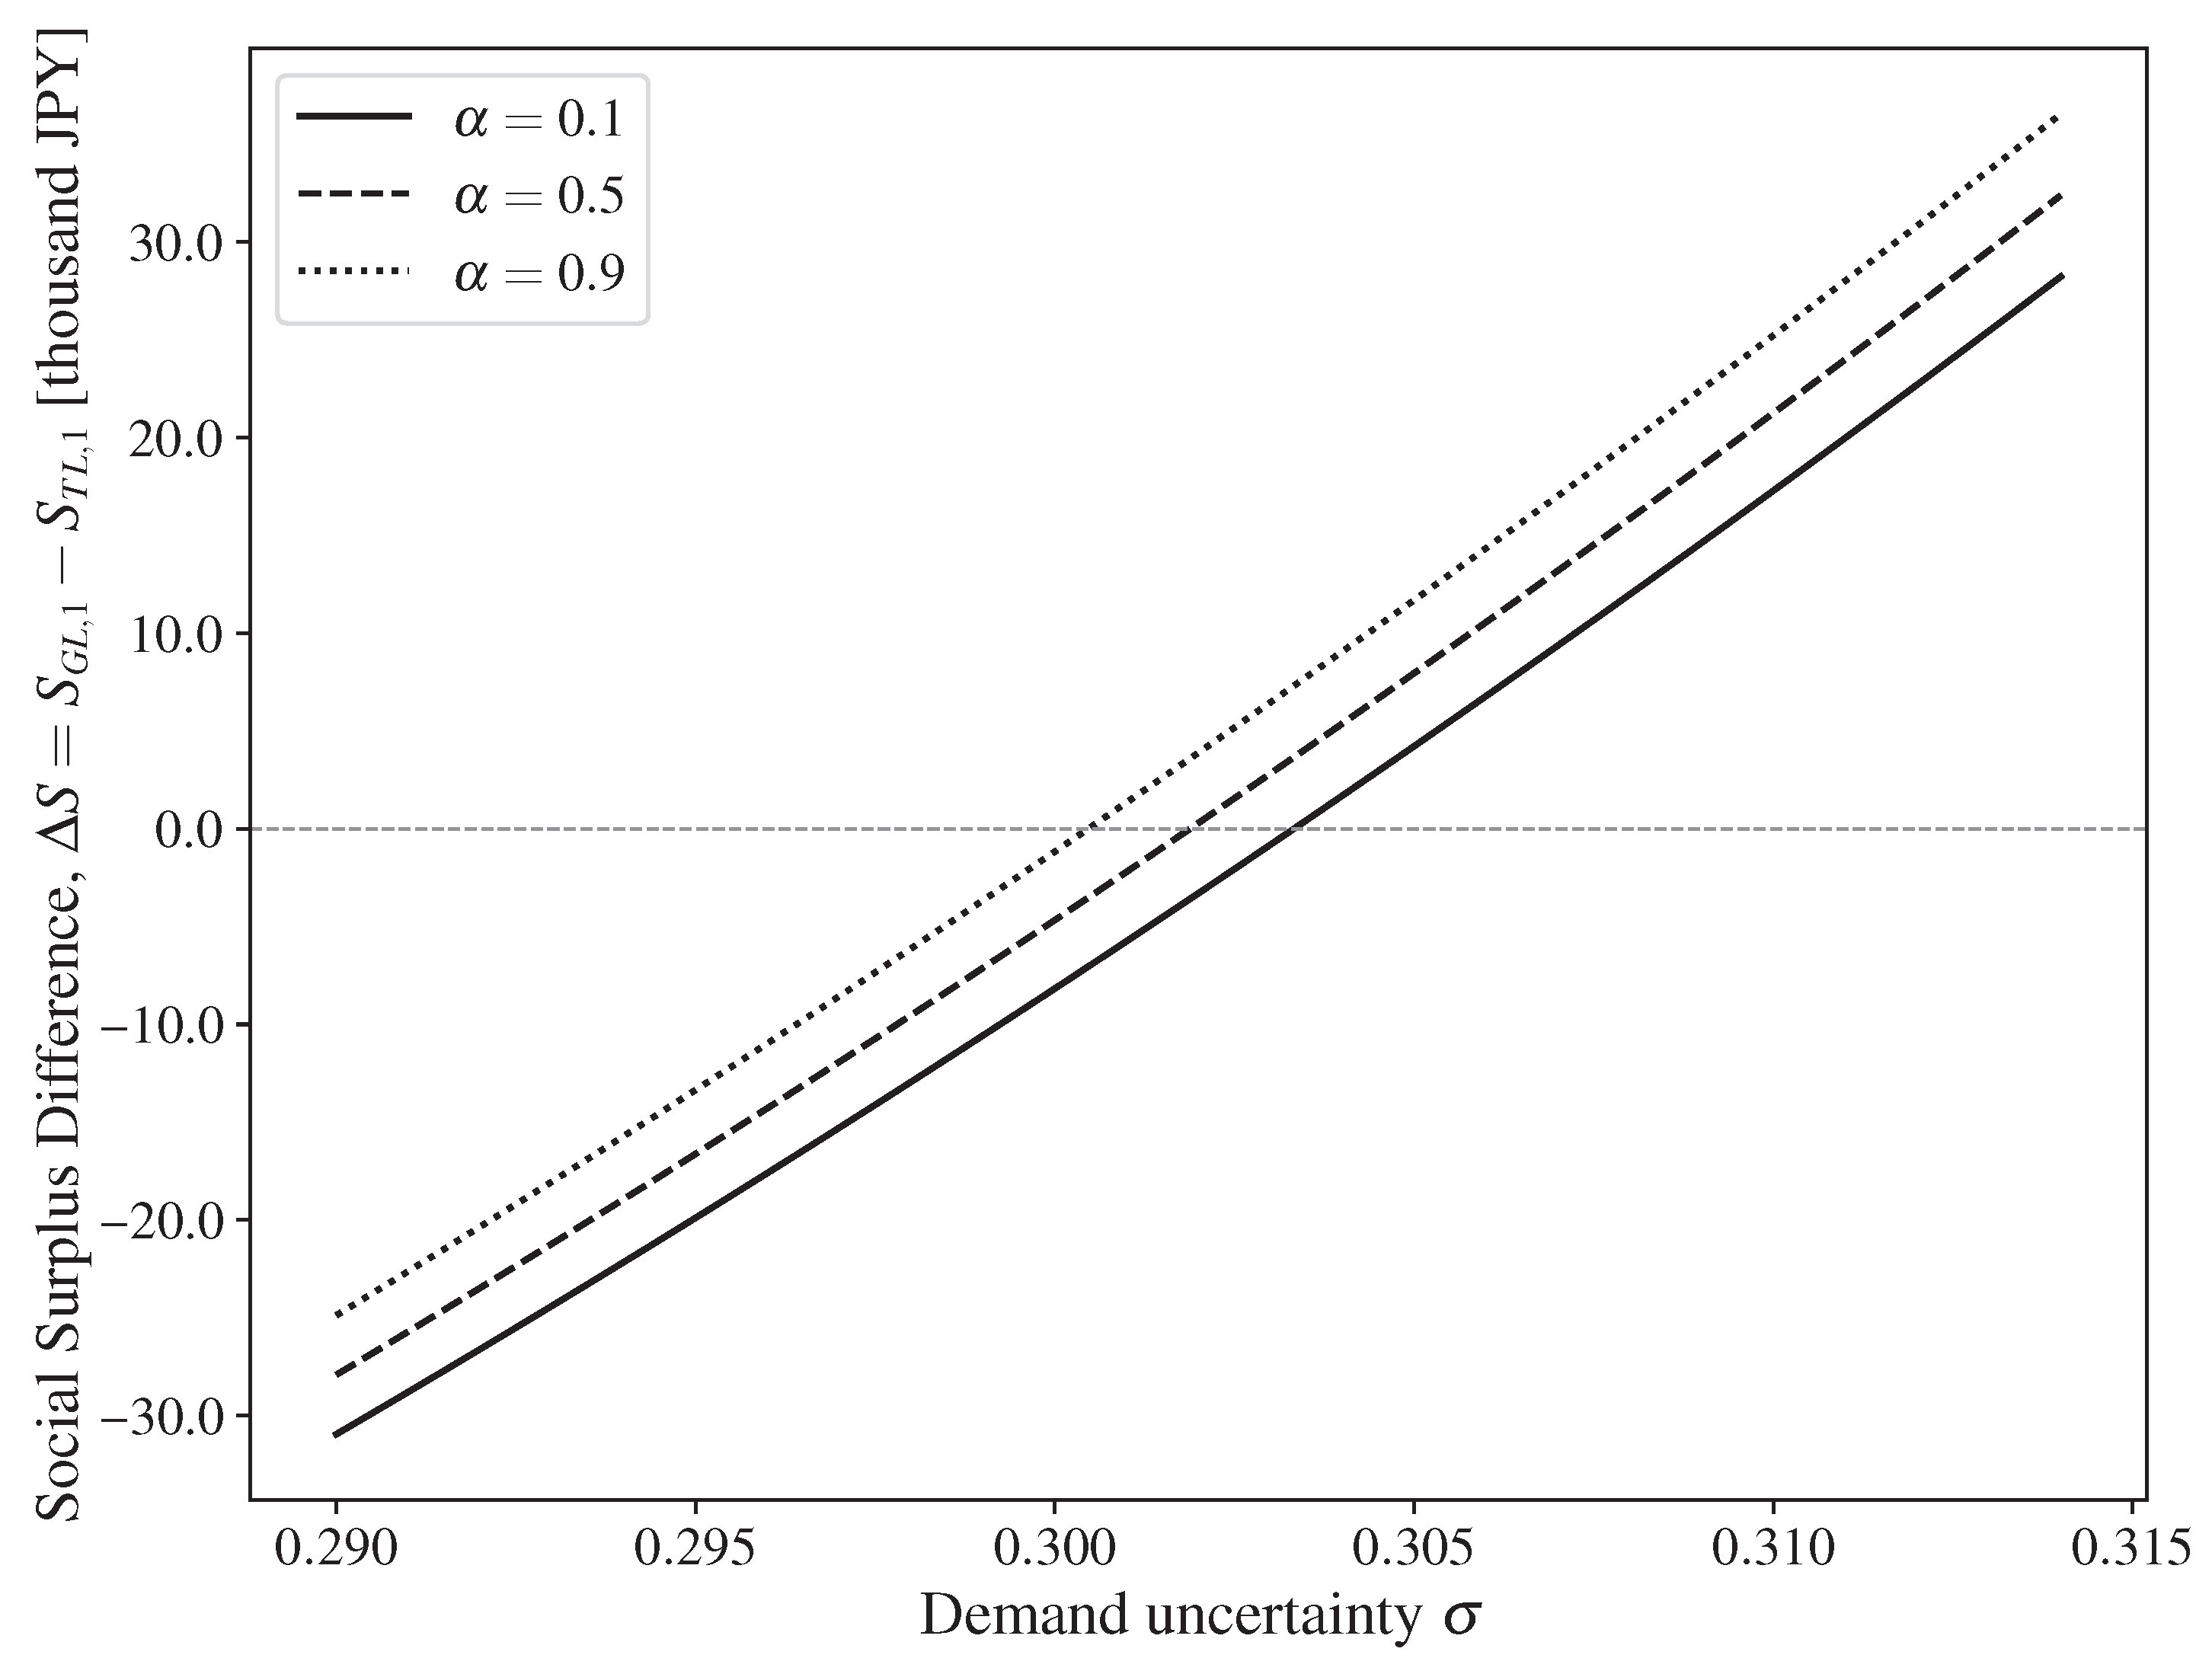
3.4. Comparative Analysis of Investment Timing, Capacity, and Social Surplus

First, Figure 8 illustrates how rising demand-shock uncertainty affects the optimal investment timing under the TL and GL frameworks. We set the α = 0, 0.5, and 1.0. Under the TL framework, an increase in α slightly hastens the investment timing. Under the GL framework, however, higher values of α progressively induce later investment timing. Overall, when uncertainty is high, the TL framework encourages earlier investment. On the one hand, the GL framework better sustains investment incentives under low uncertainty. From a different perspective, the intersection between the two frameworks shifts to the left as α increases, broadening the range in which the TL framework secures investment incentives. From a policy perspective, investment incentives may be maintained by determining which entity should make decisions based on both the levels of uncertainty and the generator-side charge.
Figure 9 illustrates how the optimal capacity changes in response to different levels of uncertainty. In the GL framework, where the generator determines both the investment timing and capacity, the generator can respond to an increase in the generator-side charge by delaying investment rather than reducing capacity. As a result, the optimal capacity remains constant and is independent of α . In contrast, in the TL framework, where the investment timing is exogenously given (i.e., determined by the transmission system operator), the generator must adjust capacity in response to changes in α . Therefore, the optimal capacity varies with α in this case. For these reasons, in Figure 9, the value of α is varied only under the TL framework ( α = 0, 0.5, 1.0), while it is held constant under the GL framework. In both frameworks, a higher σ leads to a larger optimal capacity, but the order reverses at a certain uncertainty level. Specifically, for a low σ , the TL framework yields a greater capacity than the GL framework. This is because a low generator-side charge enhances producer profitability, and thus encourages capacity expansion under the TL framework. As σ increases, the GL framework’s capacity surpasses that of the TL framework, reflecting the GL framework’s ability to preserve profitability under high uncertainty. In summary, capacity expansion patterns differ across frameworks, depending on the uncertainty level. From a policy design perspective, this result implies that under low uncertainty, structuring the market as in the TL framework to encourage early investment can secure sufficient capacity and maintain supply reliability. Conversely, in high-uncertainty environments, adopting a GL framework that ensures strong returns for generators can foster capacity growth. By adjusting these market incentives to match the prevailing uncertainty, policymakers can avoid supply shortfalls while maximizing investment opportunities.
Figure 10 shows the impact of varying the demand-shock uncertainty and generator-side charge on the difference in social surplus between frameworks, defined as Δ S = S G L , 1 S T L , 1 . A positive Δ S indicates that the GL framework delivers a higher social surplus than the TL framework, while a negative Δ S favors the TL framework. Because even slight changes in uncertainty can lead to sharp shifts in the difference in social surplus between the two frameworks, this analysis focuses on the threshold values of σ at which the sign of Δ S changes. Accordingly, Figure 10 plots the results for σ ranging from 0.295 to 0.315. The results show that an increase in either σ or α consistently has a positive effect on Δ S . In other words, Δ S increases monotonically with respect to σ and shifts upward as α increases. This indicates that higher levels of uncertainty and generator-side charges expand the region in which the GL framework outperforms the TL framework. Furthermore, as α increases, the σ value at which Δ S changes sign becomes smaller. That is, the higher the generator-side charge, the more likely it is that the superiority between the TL and GL frameworks will reverse even under lower levels of uncertainty. This pattern reflects the strategic responses under each framework. In the GL framework (see Figure 7), a higher generator-side charge and greater uncertainty induce the PC to delay its investment until the demand is sufficiently high, thereby enhancing the expected revenue and boosting the social surplus. In contrast, under the TL framework (see Figure 4), the TSO controls the investment timing, leaving the PC only able to adjust its capacity. This yields smaller gains in the social surplus when α or σ increases. Consequently, in high-uncertainty environments, the GL framework achieves a higher social surplus than does the TL framework. For large values of α , the social surplus under the GL framework exceeds that under the TL framework. Here, the PC’s ability to decide on its investment in response to anticipated demand maximizes its revenue opportunities. In contrast, under the TL framework, the PC is constrained to modify its capacity in response to higher charges, resulting in relatively smaller surplus gains.
From a policy perspective, under conditions of high uncertainty, granting the PC the authority to decide investment timing, together with an appropriately calibrated generator share of the transmission charge, can expand the social surplus by improving investment timing. By contrast, when uncertainty is low, assigning investment timing decisions to the TSO is more effective in enhancing the social surplus. These findings suggest that policymakers should tailor both the generator-side charge and the choice of decision-making authority to the level of uncertainty to maximize the overall social surplus.

4. Conclusions

As renewable integration progresses, allocating transmission costs appropriately is critical for balancing generation uncertainty and ensuring a reliable supply. In this study, we modeled the investment decisions of PC and TSO in electricity markets using the real options approach under a generator-side charge mechanism for sharing transmission costs. We considered two decision frameworks: one in which the TSO decides on the investment timing and the PC decides on the investment capacity (TL framework), and one in which the PC decides on both investment timing and capacity (GL framework). For each framework, we conducted a numerical analysis of the optimal investment timing, capacity, and resulting social surplus under varying levels of the generator-side charge share and demand-shock uncertainty.
The findings of this study offer several policy implications regarding the design of generator-side transmission charges and the allocation of investment decision-making authority in electricity markets. First, the results suggest that the level of generator-side charge should be set at a moderate level. While a certain degree of cost recovery from generators is desirable from the perspectives of fairness and efficiency, excessively high charges—particularly under institutional settings in which generators cannot control the timing of investment (i.e., the TL framework)—may discourage capacity expansion. Therefore, the charge level should be carefully calibrated to balance cost recovery and investment efficiency. Second, the allocation of decision-making authority should be designed according to the level of market uncertainty. When demand uncertainty is high, institutional designs that allow generators to determine both the timing and scale of investment (as in the GL framework) enhance flexibility and contribute to greater social surplus. Conversely, when uncertainty is low, a TL-type structure in which the TSO determines investment timing may yield more efficient outcomes. Lastly, the results imply that a one size fits all regulatory design is not necessarily optimal across different regions and institutional contexts. Effective policy design requires context sensitive approaches that take into account characteristics such as demand volatility, and tailor institutional frameworks and cost allocation rules accordingly.
This study has several limitations. First, the model assumes an ideal vertically unbundled market where the power generator and transmission operator are institutionally separated and make decisions under full information. However, in practice, information asymmetry and strategic interdependence may exist between them. Future work should address these issues by endogenizing behavioral and institutional constraints, and by developing models that incorporate non-cooperative games and interactions with regulators. Second, while this study focuses on investment timing and capacity, it does not consider how transmission cost allocation affects plant location. Location signals may reduce transmission costs and enhance social surplus. Also, physical constraints, demand distribution, and the geographic availability of renewable resources are important factors. Future research should extend the model to a spatial framework to evaluate locational efficiency and regional fairness. Finally, our model does not include policy instruments such as carbon pricing or renewable subsidies, which can significantly influence investment decisions and social surplus. Future models should integrate multiple policy mechanisms to analyze their complementarities and trade-offs. Addressing these limitations will help improve the realism of our framework and strengthen its implications for designing sustainable electricity market policies.

Author Contributions

Conceptualization, H.H., K.I. and R.T.; methodology, H.H., K.I. and R.T.; validation, H.H., K.I. and R.T.; formal analysis, H.H.; investigation, H.H. and K.I.; resources, H.H.; data curation, H.H. and K.I.; writing—original draft preparation, H.H., K.I. and R.T.; writing—review and editing, K.I. and R.T.; visualization, H.H.; supervision, R.T.; project administration, K.I. and R.T.; funding acquisition, K.I. and R.T. All authors have read and agreed to the published version of the manuscript.

Funding

This study was supported in part by JSPS KAKENHI Grant Numbers JP23K26334 and JP24K17468.

Data Availability Statement

The original contributions presented in this study are included in the article. Further inquiries can be directed to the corresponding author.

Conflicts of Interest

The authors declare no conflicts of interest.

References

  1. Masson-Delmotte, V.; Zhai, P.; Pirani, A.; Connors, S.L.; Péan, C.; Chen, Y.; Goldfarb, L.; Gomis, M.I.; Matthews, J.B.R.; Berger, S.; et al. Contribution of Working Group I to the Sixth Assessment Report of the Intergovernmental Panel on Climate Change. In Climate Change 2021: The Physical Science Basis; Technical report, Intergovernmental Panel on Climate Change (IPCC); IPCC: Paris, France, 2021. [Google Scholar]
  2. IEA. World Energy Outlook 2023; IEA: Paris, France, 2023. [Google Scholar]
  3. IREA. Renewable Power Generation Costs in 2022; IRENA: Bonn, Germany, 2023. [Google Scholar]
  4. IEA. Renewables 2023: Analysis and forecast to 2028; IEA: Paris, France, 2023. [Google Scholar]
  5. Notton, G.; Nivet, M.L.; Voyant, C.; Paoli, C.; Darras, C.; Motte, F.; Fouilloy, A. Intermittent and stochastic character of renewable energy sources: Consequences, cost of intermittence and benefit of forecasting. Renew. Sustain. Energy Rev. 2018, 87, 96–105. [Google Scholar] [CrossRef]
  6. Herding, L.; Cossent, R.; Rivier, M.; Bañales, S. Assessing the impact of renewable energy penetration and geographical allocation on transmission expansion cost: A comparative analysis of two large-scale systems. Sustain. Energy Grids Netw. 2024, 38, 101349. [Google Scholar] [CrossRef]
  7. IEA. Net Zero by 2050: A Roadmap for the Global Energy Sector; IEA: Paris, France, 2021. [Google Scholar]
  8. Newbery, D. Efficient Renewable Electricity Support: Designing an Incentive-compatible Support Scheme. Energy J. 2023, 44, 1–22. [Google Scholar] [CrossRef]
  9. Avar, A.; El-Eslami, M.K.S. A new benefit-based transmission cost allocation scheme based on capacity usage differentiation. Electr. Power Syst. Res. 2022, 208, 107880. [Google Scholar] [CrossRef]
  10. Agency for Natural Resources and Energy. Toward the Implementation of Generator-Side Transmission Charges; Agency for Natural Resources and Energy: Tokyo, Japan, 2023.
  11. Office of Gas and Electricity Markets (Ofgem). Assessment of Locational Pricing in the GB Electricity Market; Technical report; Office of Gas and Electricity Markets (Ofgem): London, UK, 2023.
  12. Ministry of Economy and Industry. Study on Transmission Tariff Systems in Foreign Countries; Ministry of Economy and Industry: New Delhi, India, 2024.
  13. Orfanos, G.A.; Tziasiou, G.T.; Georgilakis, P.S.; Hatziargyriou, N.D. Evaluation of transmission pricing methodologies for pool based electricity markets. In Proceedings of the 2011 IEEE Trondheim PowerTech, Trondheim, Norway, 19–23 June 2011; pp. 1–8. [Google Scholar]
  14. Kumar, N.; Reddy, Y.; Das, D.; Padhy, N. Allocation of transmission charge by using MVA-Mile approaches for restructured Indian power utility. In Proceedings of the 2011 IEEE Power and Energy Society General Meeting, Detroit, MI, USA, 24–29 July 2011; pp. 1–6. [Google Scholar]
  15. Xiao, Y.; Wang, X.; Wang, X.; Du, C. Transmission cost allocation by power tracing based equivalent bilateral exchanges. CSEE J. Power Energy Syst. 2016, 2, 1–10. [Google Scholar] [CrossRef]
  16. Rao, M.S.S.; Soman, S.A.; Chitkara, P.; Gajbhiye, R.K.; Hemachandra, N.; Menezes, B.L. Min-Max Fair Power Flow Tracing for Transmission System Usage Cost Allocation: A Large System Perspective. IEEE Trans. Power Syst. 2010, 25, 1457–1468. [Google Scholar] [CrossRef]
  17. Torres.; Lívi.; Ramos, F.S. Allocating Benefits Due to Shared Resources Using Shapley Value and Nucleolus in Dynamic Network Data Envelopment Analysis. Mathematics 2024, 12, 698. [Google Scholar] [CrossRef]
  18. Mehta, R.P.; Soman, S.A.; Rao, M.S.S. A novel method for transmission system cost allocation with better accuracy and fairness. Sådhanå 2022, 47, 62. [Google Scholar] [CrossRef]
  19. Grimm, V.; Martin, A.; Schmidt, M.; Weibelzahl, M.; Zöttl, G. Transmission and generation investment in electricity markets: The effects of market splitting and network fee regimes. Eur. J. Oper. Res. 2016, 254, 493–509. [Google Scholar] [CrossRef]
  20. Agaton, C.B.; Karl, H. A real options approach to renewable electricity generation in the Philippines. Energy Sustain. Soc. 2018, 8, 1. [Google Scholar] [CrossRef]
  21. Shahab Bahrami, M.H.A. A decentralized trading algorithm for an electricity market with generation uncertainty. Appl. Energy 2018, 218, 520–532. [Google Scholar] [CrossRef]
  22. Yang, J.; Fuss, S.; Johansson, D.J.; Azar, C. Investment dynamics in the energy sector under carbon price uncertainty and risk aversion. Energy Clim. Chang. 2023, 4, 100110. [Google Scholar] [CrossRef]
  23. Lavrutich, M.; Hagspiel, V.; Siddiqui, A.S. Transmission investment under uncertainty: Reconciling private and public incentives. Eur. J. Oper. Res. 2023, 304, 1167–1188. [Google Scholar] [CrossRef]
  24. Ito, K.; Tanaka, M.; Takashima, R. Strategic investment in power generation and transmission under a feed-in premium scheme: A game theoretic real options analysis. Ann. Oper. Res. 2024, 343, 349–372. [Google Scholar] [CrossRef]
  25. Newbery, D.M. European deregulation problems of liberalising the electricity industry. Eur. Econ. Rev. 2002, 46, 919–927. [Google Scholar] [CrossRef]
  26. Tohidi, Y.; Hesamzadeh, M.R.; Regairaz, F. Sequential coordination of transmission expansion planning with strategic generation investments. IEEE Trans. Power Syst. 2016, 32, 2521–2534. [Google Scholar] [CrossRef]
  27. Sauma, E.E.; Oren, S.S. Proactive planning and valuation of transmission investments in restructured electricity markets. J. Regul. Econ. 2006, 30, 358–387. [Google Scholar] [CrossRef]
  28. United States of America Federal Energy Regulatory Commission, U.S. Order Accepting Tariff Revisions Subject to Condition. 2022. Available online: https://www.ferc.gov/media/e-4-er22-2844-000 (accessed on 14 July 2025).
  29. Department of Energy & Climate Change Government Response to the Technical Consultation on the Model for Improving Grid Acces. 2010. Available online: https://www.gov.uk/government/organisations/department-of-energy-climate-change (accessed on 14 July 2025).
  30. NREL. Renewable Energy Zone (REZ) Transmission Planning Process: A Guidebook for Practitioners. 2017. Available online: https://docs.nrel.gov/docs/fy17osti/69043.pdf (accessed on 14 July 2025).
  31. Schwartz, E. Valuing Long-term Commodity Assets. J. Energy Financ. Dev. 1998, 3, 85–99. [Google Scholar] [CrossRef]
  32. Dixit, A.K.; Pindyck, R.S. Investment Under Uncertainty; Princeton University Press: Princeton, NJ, USA, 1994. [Google Scholar]
  33. Agency for Natural Resources and Energy. On the Verification of Power Generation Costs: Document 4 from the 1st Meeting of the Working Group on Power Generation Cost Verification, Advisory Committee for Natural Resources and Energy. 2024. Available online: https://www.enecho.meti.go.jp/committee/council/basic_policy_subcommittee/mitoshi/cost_wg/2024/04.html (accessed on 16 May 2025).
  34. Agency for Natural Resources and Energy. Specifications of Each Power Source: Document 3 from the 8th Meeting of the Working Group on Power Generation Cost Verification, Advisory Committee for Natural Resources and Energy. 2021. Available online: https://www.enecho.meti.go.jp/committee/council/basic_policy_subcommittee/mitoshi/cost_wg/2021/008.html (accessed on 16 May 2025).
  35. Organization for Cross-Regional Coordination of Transmission Operators. On the Publication of Standard Unit Costs for Transmission Facilities. 2016. Available online: https://www.occto.or.jp/access/oshirase/2015/files/20160329_tanka_kouhyou.pdf (accessed on 16 May 2025).
  36. Electricity and Gas Market Surveillance Commission. On the Notification of Changes to the Specified Retail Supply Provisions Following Approval of Amendments to the Transmission Service Agreement: Document 3 from the 54th Meeting of the Tariff System Expert Committee. 2024. Available online: https://www.egc.meti.go.jp/english/committee/pdf/annualreport2024.pdf (accessed on 16 May 2025).
Figure 1. Equilibrium of investment timing and capacity.
Sustainability 17 06824 g001
Figure 2. Impact of α on equilibrium investment timing and capacity.
Sustainability 17 06824 g002
Figure 3. Impact of σ on equilibrium investment timing and capacity.
Sustainability 17 06824 g003
Figure 4. Impact of α on the social surplus with equilibrium investment timing and capacity.
Sustainability 17 06824 g004
Figure 5. Impact of σ on optimal investment capacity.
Sustainability 17 06824 g005
Figure 6. Impact of σ and α on optimal investment timing.
Sustainability 17 06824 g006
Figure 7. Impact of α on the social surplus.
Sustainability 17 06824 g007
Figure 8. Comparison of the impact of σ and α on investment timing in each framework.
Sustainability 17 06824 g008
Figure 9. Comparison of the impact of σ and α on investment capacity in each framework.
Sustainability 17 06824 g009
Figure 10. Comparison of the impact of σ and α on the social surplus difference in each framework.
Sustainability 17 06824 g010
Table 1. List of parameters.
ParameterSymbolValue
Annual operating timeh8760 [h]
Capacity factork0.7
Expected growth rate of demand shock μ 0.0
Volatility of demand shock σ 0.1
Discount rate ρ 0.05
Slope of inverse demand function ( 0 < η < 1 Q ) η 0.001
Transmission tariff τ 1.0 [JPY/kWh]
Generation costC9.4 [JPY/kWh]
Installation cost of power generation ξ 161,000 [JPY/kW]
Installation cost of transmission line γ 54,600 [JPY/kW]
Disclaimer/Publisher’s Note: The statements, opinions and data contained in all publications are solely those of the individual author(s) and contributor(s) and not of MDPI and/or the editor(s). MDPI and/or the editor(s) disclaim responsibility for any injury to people or property resulting from any ideas, methods, instructions or products referred to in the content.

