Article

Sustainability-Oriented Assessment of Passenger Car Emissions in Relation to Euro Standards Using the ECE-15 Driving Cycle

by
Saugirdas Pukalskas
1,*,
Dominik Adamaitis
1,
Dainius Paliulis
2 and
Šarūnas Mikaliūnas
1
1
Department of Automobile Engineering, Faculty of Transport Engineering, Vilnius Gediminas Technical University, Plytinės g. 27A, 10105 Vilnius, Lithuania
2
Department of Environment Protection and Water Engineering, Faculty of Environmental Engineering, Vilnius Gediminas Technical University, Saulėtekio al. 11, 10223 Vilnius, Lithuania
*
Author to whom correspondence should be addressed.
Sustainability 2025, 17(13), 6000; https://doi.org/10.3390/su17136000
Submission received: 31 May 2025 / Revised: 26 June 2025 / Accepted: 27 June 2025 / Published: 30 June 2025
(This article belongs to the Special Issue Sustainable Energy System: Efficiency and Cost of Renewable Energy)

Abstract

This study introduces an original sustainability-oriented methodology for calculating pollutant emissions (g/km) based on the ECE-15 driving cycle, aimed at evaluating passenger car compliance with various Euro emission standards. Four vehicles—two diesel and two gasoline-powered—representing Euro 4 to Euro 6 categories, respectively, were tested under controlled laboratory conditions. CO, HC, NOx, and CO2 emissions were measured and analyzed using the developed method. The Euro 4 Nissan Qashqai+2 exceeded the CO limit by 2.07 times, while NOx and HC emissions were below the threshold by 1.46 and 50%, respectively. CO2 exceeded the limit by only 6.2%. The Euro 5 Nissan Qashqai showed extremely low CO and HC levels—33 and 333 times below the limit—but exceeded NOx by 1.32 times, with CO2 emissions 62.8% above the target. Both Euro 6 vehicles (VW Passat) exhibited undetectable CO emissions, HC levels under 2% of the limit, and NOx reduced by 3.81 to 15 times. However, their CO2 emissions remained elevated, at 2.9% and 51.4% above the standard, respectively. The results confirm the effectiveness of modern emission control technologies, while also highlighting that CO2 remains a major challenge, particularly for powerful gasoline vehicles.

1. Introduction

The transportation sector plays a critical role in the global sustainability agenda, as it remains a major contributor to greenhouse gas emissions, urban air pollution, and fossil fuel consumption [1,2,3]. Achieving climate neutrality and improving air quality require not only the development of alternative powertrains [4] but also the improvement and monitoring of emissions from existing internal combustion engine (ICE) vehicles, which will continue to operate on roads for years to come [5].
New cars with internal combustion engines must meet the latest exhaust emission standards. Older cars must meet the emission standards that were in place when they were manufactured. In many countries, a large proportion of cars are older cars, and their emissions account for the largest share of all car emissions [6]. Therefore, accurate and reproducible emissions assessment methods—especially those applicable to older and retrofitted vehicles—are essential tools in supporting environmental policy, sustainable mobility strategies, and the transition toward cleaner technologies.
Due to the different engine designs, different fuels used, and different combustion conditions, the composition of exhaust gases from petrol and diesel engines is different. This is especially evident in older cars that were built to older standards. The primary harmful compounds found in engine exhaust gases from burning petroleum-based fuels, such as gasoline or diesel, are incomplete combustion oxides of hydrocarbons, which contain CO, NOx, HC, and particulates [7]. The most poisonous component of exhaust gases is carbon monoxide, which has no colour, taste, or odor. Incomplete combustion is the main cause of HC and CO emissions. The emission of these pollutants is not directly related to fuel consumption, in contrast to CO2. Comparing these emissions to the European vehicle emissions standards is crucial. Typically, heavy-duty vehicles are reported in g/kWh, while light-duty and passenger vehicles are reported in g/km.
Passenger cars are operated under very different operating conditions and the pollution of car engines of different designs under certain conditions is different [8]. With increasing emphasis on environmental aspects in various fields and with the aim of reducing the use of fossil fuels, it is very important to understand how car engines of different designs, when operating in different driving cycles, affect car engine emissions and fuel consumption [9]. The properties of harmful chemical components of automobile engine emissions, the conditions of their formation, and their impact on health are systematically discussed in the article by Alkama et al. [10].
Car emissions and fuel consumption are usually assessed according to the WLTP methodology. However, various scientific studies show that when comparing emissions and fuel consumption of different types of cars under certain conditions, this methodology does not always adequately assess emissions and fuel consumption when driving under certain conditions [11]. All engine emission measurement methods have advantages and disadvantages. Therefore, different engine emission measurement methods are appropriate for different situations.
In recent years, research on various aspects of this topic has increased, which shows that this problem is relevant. Some articles emphasize the importance of conducting research not only according to standardized driving cycles, but also emphasize research in real conditions, which are often just called by different names, i.e., research “under real driving scenarios”, “specific driving conditions”, “real driving conditions”, “real-world driving conditions”, “real driving cycles”, and even “real driving emissions”. According to Sofwan and Latif, driving vehicles at low speeds can improve fuel economy by reducing CO and NOx emissions, but this operating condition increases CO2 emissions. The results of this study were obtained from cars driving on city streets [12]. Chong et al. found that higher NOx emissions from diesel vehicles under real driving conditions were associated with higher speeds, stronger acceleration, and reduced exhaust gas recirculation, and excessive HC and CO emissions were often observed during engine acceleration [13].
Unlike other studies that use real-world fuel consumption and emissions data or standardized driving cycles created in America and Europe, Bagheri et al. developed original driving cycles based on real-world conditions that were specifically tailored to unique driving patterns and accurately reflected the driving cycles of particular regions [14].
The increasing number of cars with damaged or manipulated emissions reduction systems limits the utility of laboratory measurements for a number of reasons, making in situ real driving emissions (RDE) measurements crucial [15].
The introduction of stricter environmental requirements does not always achieve the desired goals if their implementation and application are not well thought out. Because VW used software to circumvent emissions testing, causing their diesel vehicles to emit noticeably more NOx and other pollutants, the company was linked to the Dieselgate scandal in 2015 [16]. The Dieselgate scandal led to higher emissions from diesel cars, worsening air quality in cities and contributing to climate change by releasing more greenhouse gases. In response, governments introduced tighter regulations, including real-world emissions testing.
In July 2021, the European Commission learnt that the German automakers Volkswagen, Daimler, and BMW (the “working group”) had colluded to reduce the effectiveness of diesel emissions control software. For the first time, the Commission determined that, even though collusive pricing was not a factor in this case, coordination to limit technical development is unlawful under competition law. The article states that the results of road vehicle emissions tests show that diesel vehicle the NOx standard emissions exceed the requirement by three times on average and that more than 70% of diesel vehicles do not meet the requirements [17]. The authors of the publication conclude that during the period 2014–2018, when NEDC’s approved Euro 6 vehicles were sold, there was clear evidence of non-compliance.
Weak enforcement of standards allows manufacturers to circumvent regulations, and targets for reducing harmful emissions may be missed. The impact of vehicle emissions sub-compliance on the European automotive sector has been studied in publications by Reynaert and Sallee [18] and Reynaert [19]. Based on data from 1998–2011, the author of the latter publication argues that the new standard did not achieve the emission reduction target.
The Dieselgate scandal had a far-reaching impact, not only in Europe but also beyond, affecting various aspects beyond environmental concerns. Alexander and Schwandt analyzed the effect of the scandal on the U.S. market [20]. Bachmann et al. used Volkswagen (VW)’s emissions scandal of 2015 as a natural experiment to demonstrate that external factors of collective reputation are economically significant [21]. The authors of this publication showed the effects of the scandal on other German automobile manufacturers, while Ater and Yoseph studied its consequences for the used car market in Israel [22]. According to the authors’ findings, which were based on administrative and proprietary data and a difference-in-differences research design, the number of transactions involving VW-manipulated cars decreased by 18% and their resale value decreased by 6% after Dieselgate. Additionally, Holland et al. assessed the health-related outcomes of the scandal [23].
Although modern European regulations emphasize real driving emissions (RDE) testing, most certification and laboratory-based research still rely on chassis dynamometer tests using standardized cycles, such as WLTP or the older NEDC [24,25]. While the ECE-15 cycle does not fully replicate real-world driving dynamics or route variability, it offers a highly controlled and repeatable test environment that enables consistent comparison across vehicle types and emission standards. This is particularly relevant in vehicle retrofit scenarios, where real driving data may be unavailable or difficult to compare.
The ECE-15 cycle has a simpler structure and shorter duration than WLTP, which includes a broader range of speeds, accelerations, and load conditions [26]. Although WLTP offers improved representativeness of modern driving, studies highlight that it also introduces increased variability in emission results [27]. Likewise, RDE captures on-road influences, such as traffic, ambient conditions, and route gradients, yet suffers from significant inter-test variability and methodological complexity [28,29]. In contrast, ECE-15 maintains high repeatability and methodological transparency, making it particularly suitable for benchmarking emissions across different vehicle configurations—such as retrofits—and for developing calculation methodologies.
Moreover, most existing studies report pollutant concentrations or trends without converting them into units directly comparable to regulatory thresholds. The methodology developed in this study addresses this gap by converting real-time concentration data into emission rates in g/km, which allows for a direct assessment of compliance with Euro 4–6 standards. This approach not only enhances the reproducibility of laboratory-based emission assessments but also provides a scientifically grounded and practically applicable framework for evaluating the environmental performance of modified or alternative-fuel vehicles, contributing to both certification processes and policy-relevant emissions analysis.
The aim of the study presented in this article was to apply the ECE-15 methodology to compare the emissions of different types of passenger cars meeting different Euro emission standards. Such a methodology could not be found, so it was decided to examine it in more detail. The methodology allows the collected pollution data to be processed and the pollutant values (g/km) for any driving cycle to be presented.

2. Materials and Methods

For the experiments, four passenger cars were selected. The vehicles were chosen to represent different Euro emission standards. The tests were conducted under laboratory conditions using a chassis dynamometer, simulating driving according to the ECE-15 driving cycle (Figure 1). Each vehicle underwent two repeated test runs.

2.1. Research Equipment

For the experiments, four passenger cars were selected—two powered by diesel and two by gasoline (Table 1).
During the laboratory tests, the following conditions were maintained:
  • The engine was warmed up to its normal operating temperature to ensure proper functioning of the exhaust gas after-treatment systems;
  • The vehicle’s technical condition was faultless: no diagnostic trouble codes were present in the control units, the exhaust system was undamaged, and all manufacturer-specified components were intact;
  • The tests were conducted under simulated driving conditions based on the ECE-15 cycle.
To obtain data from the engine control unit, a diagnostic computer equipped with BOSCH ESI[tronic] 2.0 (Online) software (Robert Bosch Ltd., Abstatt, Germany) is connected via the OBDII port. The system records vehicle speed, intake air mass, and the amount of fuel injected (consumed). The dynamometer control computer displays the driving cycle, indicating the target speed that the test vehicle’s driver must maintain.
During experimental measurements, the Maha LPS 3000 (MAHA Maschinenbau Haldenwang GmbH & Co, Haldenwang, Germany) dynamometer test bench was used for vehicle traction testing. This equipment allows for the measurement of vehicle power up to 260 kW, with a maximum speed of 260 km/h. The technical specifications of the test bench are provided in Table 2.
The vehicle traction test bench consists of rollers, a control cabinet computer, a remote-control unit, and a fan (with a motor power of 5 kW) designed to cool the engine of the test vehicle. The bench is used for various automotive studies. The load applied to the vehicle’s wheels is generated by an eddy current electromagnetic brake, simulating road resistance. The test bench is equipped with a pressure and temperature module that measures ambient air conditions. The collected data is normalized according to the DIN 70200 standard [30]. All measured parameters and data can be saved, reviewed, adjusted if needed, or compared with other data sets.
The Maha LPS 3000 chassis dynamometer used in this study is calibrated according to the manufacturer’s specifications, which comply with EU approval standards. The system ensures a power measurement accuracy of ±1% and a torque measurement accuracy of ±1.5% under nominal conditions. All tests were conducted following calibration procedures consistent with EN ISO 9001:2015 [31], ensuring reliable and repeatable results.
The AVL DiCom 4000 (AVL DiTEST GmbH, Graz, Austria) emissions analyzer was used to measure the pollutant emissions of the tested vehicles. The technical specifications and measurement parameters are provided in Table 3. The AVL DiCom 4000 gas analyzer meets the highest metrological standards, as confirmed by its compliance with OIML R99 class I, ISO 3930 [32], and ECR R 24 [33] certifications.
To obtain additional data from the tested vehicles—such as driving speed, injected fuel quantity, and air mass—a computer equipped with BOSCH ESI[tronic] 2.0 (Online) software (Robert Bosch Ltd., Abstatt, Germany) was used. The system was connected to the vehicle via the OBDII port. The results were recorded in real time using the Bandicam (Bandicam Company, Irvine, CA, USA) screen recording software.
Later, the video recordings were trimmed at a frame rate of one frame per second, generating individual images from which the data were extracted. Since the AVL DiCom 4000 emissions analyzer also lacks a built-in recording function, a camera was used to capture its output. The video files were processed using the same method as before, and the extracted frames were manually transcribed into an Excel spreadsheet for further analysis.

2.2. Calculation Methodology

An original exhaust emission calculation methodology for the driving cycle was developed based on established approaches [7,34,35,36].
In order to calculate the exhaust mass flow, all pollutant concentrations must first be expressed in parts per million (ppm). In this case, NOx and HC were measured directly in ppm, whereas CO and CO2 were recorded in volume percent. Therefore, these values must be converted as follows:
Cp_i = Ci × 10,000 (ppm),
where Cp_i is the concentration of the pollutant i in the diluted exhaust gas, ppm; Ci is the concentration of the pollutant i in the diluted exhaust gas, %vol.
Taking into account the molecular weight of pollutant i, the concentration Cp_i is converted into mass concentration Cm_i, as follows:
Cm_i = Cp_i × Mp/Mair × 10−3 (g/kg),
where Mp is the molar mass of CO = 28.01 g/mol, CO2 = 44.01 g/mol, HC = 13.86 g/mol [37], NO = 30.01 g/mol; NO2 = 46.01 g/mol; Mair = 28.97 g/mol.
The mass flow rate of pollutant i is calculated as follows:
Qi = Cm_i × Gexh (g/h),
where Gexh is the mass of the exhaust gas flow, kg/h, which is calculated as follows:
Gexh = Bfuel + Bair (kg/h),
where Bfuel is the fuel consumption, kg/h; Bair is the air consumption, kg/h.
The mass flow rate of CO is calculated as follows:
Cp_CO = CCO × 10,000 (ppm),
Cm_CO = Cp_CO × 28.01/28.97 × 10−3 (g/kg),
QCO = Cm_CO × Gexh (g/h),
by substituting the known values, we obtain the following:
QCO = CCO × 10,000 × 28.01/28.97 × 10−3 × Gexh = CCO × 9.669 × Gexh (g/h),
or QCO = CCO × 9.669 × Gexh/3600 = CCO × 2.686 × 10⁻⁴ × Gexh (g/s).
The mass flow rate of CO2 is calculated as follows:
Cp_CO2 = CCO2 × 10,000 (ppm),
Cm_CO2 = Cp_CO2 × 44.01/28.97 × 10−3 (g/kg),
QCO2 = Cm_CO2 × Gexh (g/h),
by substituting the known values, we obtain the following:
QCO2 = CCO2 × 10 000 × 44.01//28.97 × 10−3 × Gexh = CCO2 × 15.19 × Gexh (g/h),
or QCO2 = CCO2 × 15.19 × Gexh/3600 = CCO2 × 42.2 × 10−4 × Gexh (g/s).
Since the majority of NOx consists of NO [38,39], NO2 is not considered. The mass flow rate of NO is calculated as follows:
Cm_NO = Cp_NO × 30.01/28.97 × 10−3 (g/kg),
QNO = Cm_NO × Gexh (g/h),
by substituting the known values, we obtain:
QNO = Cp_NO × 30.01/28.97 × 10−3 × Gexh = Cp_NO × 1.036 × 10⁻³ × Gexh (g/h),
or QNO = Cp_NO × 1.036 × 10⁻³ × Gexh/3600 = Cp_NO × 0.2877 × 10⁻⁶ × Gexh (g/s).
The mass flow rate of HC is calculated as follows:
Cm_HC = Cp_HC × 13.86/28.97×10−3 (g/kg),
QHC = Cm_HC × Gexh (g/h),
by substituting the known values, we obtain the following:
QHC = Cp_HC × 13.86/28.97 × 10−3 × Gexh = Cp_HC × 13.86/28.97 × 10−3 × Gexh (g/h),
or QHC = Cp_HC × 0.4784 × Gexh/3600 = Cp_HC × 0.1329 × 10⁻⁶ × Gexh (g/s).
In order to correct the influence of humidity on the results of NOx, the following calculations are applied [36]:
M i = ( t t + Δ t Q i × d t ) × k h / d
where Mi is the mass emission of the pollutant i, g/km; kh is the humidity correction factor used for the calculation of the mass emissions of NOx (there is no humidity correction for HC and CO, CO2); d is the actual distance corresponding to the operating cycle, km.
The humidity correction factor is calculated as follows:
kh = 1/(1 − 0.0329 × (h − 10.71)),
in which Equation (11) is as follows:
h = 6.211 × Ra × pd/(pbpd × Ra × 10−2),
where h is the absolute humidity, g (water/kg dry air); Ra is the relative humidity of the ambient air, %; pd is the saturated vapor pressure at ambient temperature, kPa; pb is the atmospheric pressure in the room, kPa.

2.3. Study Limitations

Although the methodology presented in this study provides valuable insights into pollutant emissions under controlled laboratory conditions, several limitations must be acknowledged. First, the vehicle sample size was limited to four passenger cars. While these vehicles were selected to represent different Euro emission standards and fuel types, a broader dataset encompassing a wider range of engine technologies, vehicle classes, and manufacturers would enhance the generalizability of the findings.
Second, the experimental tests were conducted exclusively using the ECE-15 driving cycle. While this cycle was historically used for emission certification, it does not reflect current regulatory procedures for newer vehicle generations, such as Euro 6d, which are tested under the WLTP. Consequently, comparing vehicles across different Euro classes using a single test cycle introduces certain limitations, as each standard was originally assessed using distinct driving conditions. Moreover, the ECE-15 cycle lacks high-speed operation, rapid acceleration, and variable load conditions, thus providing only a partial representation of real-world driving. This may lead to underestimation of emissions that typically arise during dynamic or transient phases, especially in modern vehicles with advanced emission control systems.
Finally, environmental parameters, such as ambient temperature and humidity, were not systematically varied during the tests. Since these factors can significantly influence both engine behavior and after-treatment system efficiency, future studies should incorporate environmental variability to better reflect real-world operating conditions.

3. Results and Discussions

Using the chassis dynamometer and the aforementioned vehicles, driving tests were carried out according to the ECE-15 driving cycle. The measured exhaust gas concentrations were converted into g/s and presented graphically.

3.1. Experimental Research

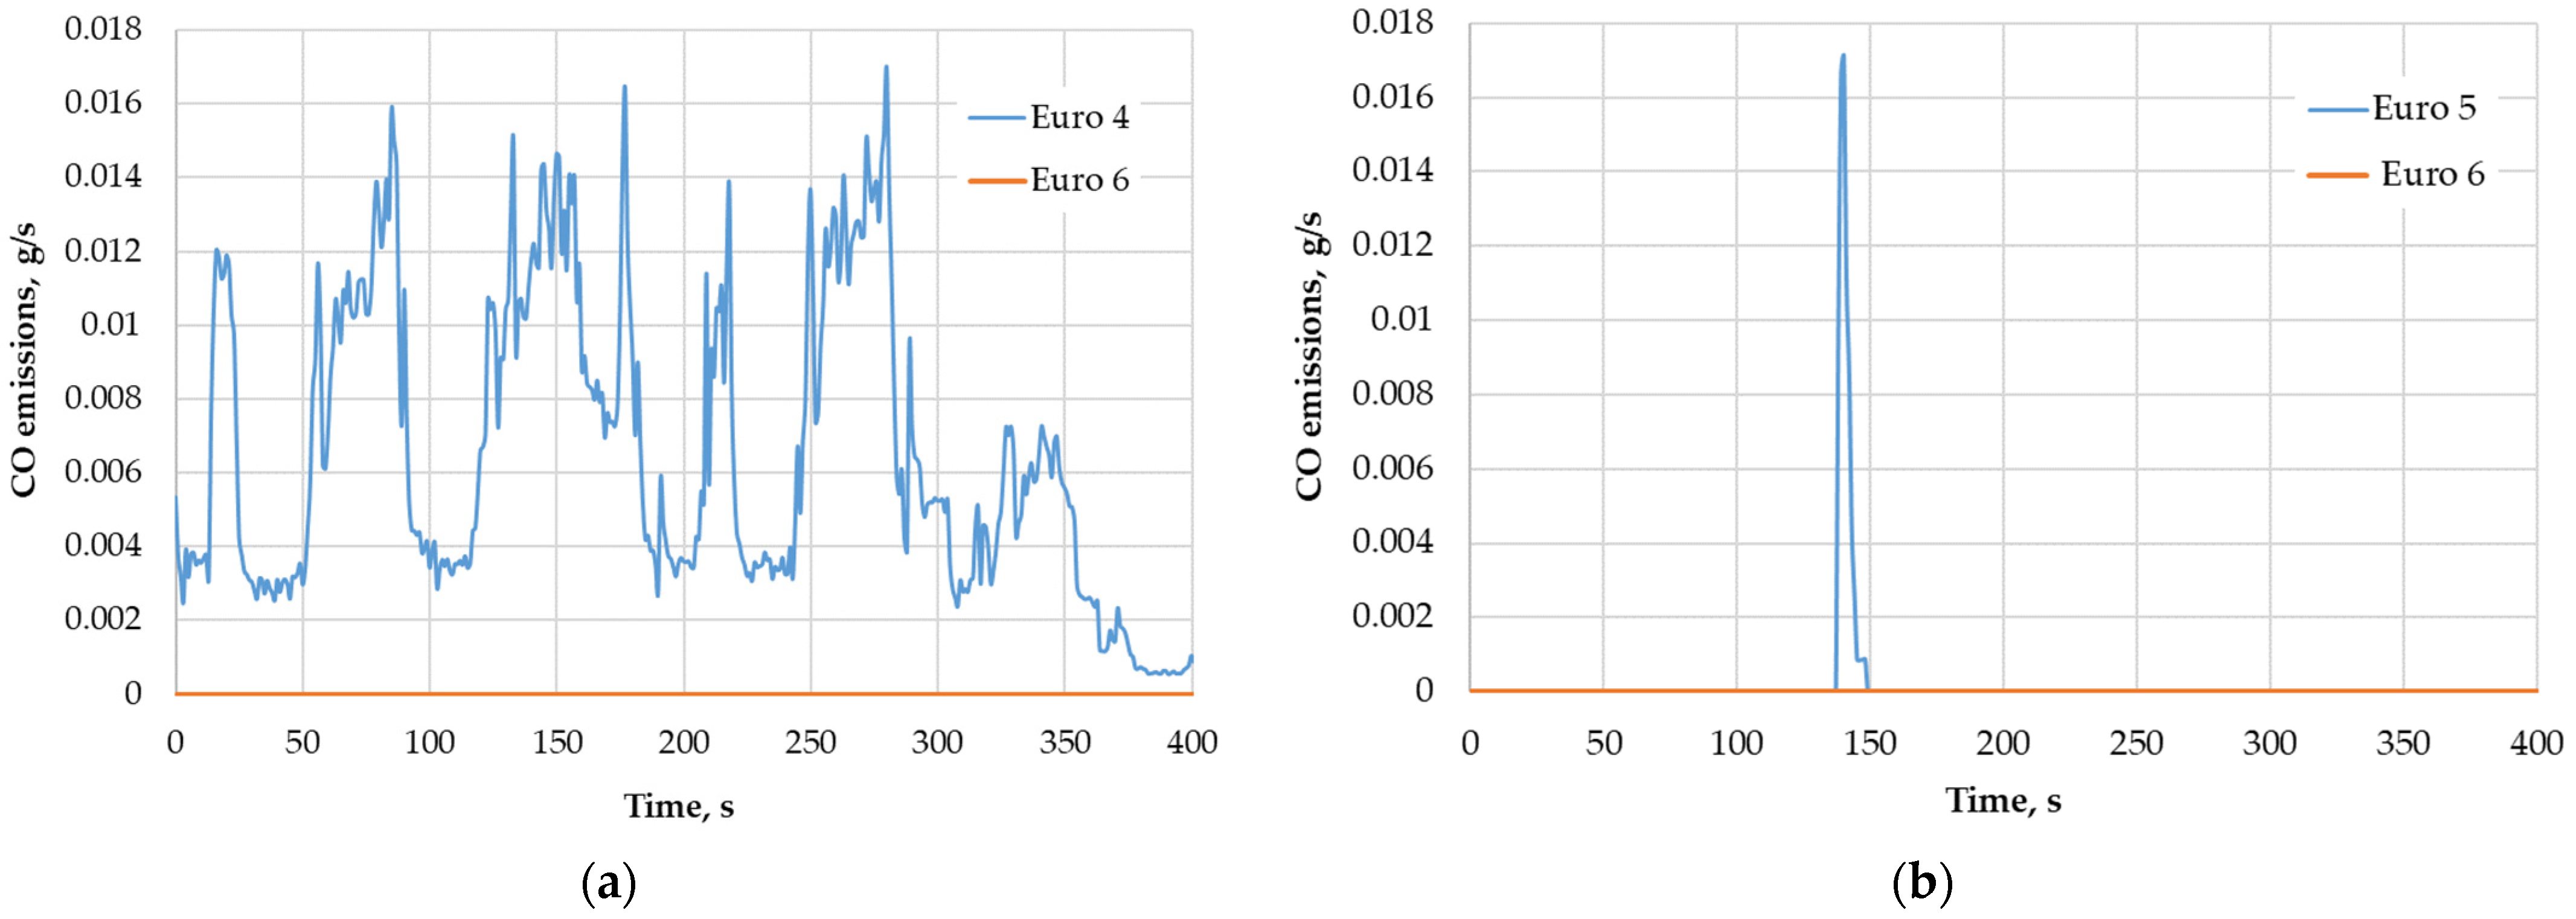
Figure 2 presents CO emission data for two complete repetitions of the ECE-15 driving cycle. Notably, a clear distinction is observed between the exhaust after-treatment systems of diesel vehicles from different generations (Figure 2a). The 2019 VW Passat, compliant with Euro 6 emission standards, shows virtually no detectable CO emissions, whereas the Euro 4-compliant Nissan Qashqai exhibits significantly higher CO output. Notably, peaks in CO emissions—ranging from 0.012 to 0.016 g/s—consistently coincide with vehicle acceleration phases, indicating a direct correlation between transient engine load and incomplete combustion processes. A direct comparison of the time scales of the driving cycle and CO emissions confirms that emission spikes coincide with acceleration events. Once the vehicle reaches steady-state speed, emissions drop to 0.003 … 0.004 g/s. Another important observation is the sharp decline in CO emissions after approximately 310 s, despite a third, intense acceleration phase. While emissions at this point would be expected to match those of the initial acceleration (i.e., ~0.014 … 0.016 g/s), they are notably lower. This can likely be explained by the fact that although the engine had already reached operating temperature, the exhaust system—specifically the diesel oxidation catalyst (DOC)—required additional time to warm up before functioning effectively. As studies show, a temperature of no less than 300–400 °C is required for the DOC to achieve sufficient conversion efficiency [40,41]. Although there are catalytic materials capable of achieving 90% conversion efficiency at temperatures below 200 °C [42], such materials are still in the research stage.
A contrasting situation is observed when analyzing the CO emissions of gasoline vehicles (Figure 2b). In this case, both vehicles exhibit near-zero CO emissions throughout the driving cycle, with the exception of a single peak from the 2014 Nissan Qashqai (Euro 5), which recorded a value of 0.017 g/s during the third, most intense acceleration phase. It is assumed that the engine control unit temporarily enriched the air–fuel mixture during this acceleration to provide additional power [43,44,45] or to initiate the regeneration of a NOx storage catalyst [46,47]. However, this emission peak was observed only during the first cycle repetition; during the second run, CO emissions remained close to zero throughout. This suggests that the initial emission may also be attributed to the insufficient warm-up of the three-way catalytic converter (TWC), which had not yet reached full operating efficiency [48,49].
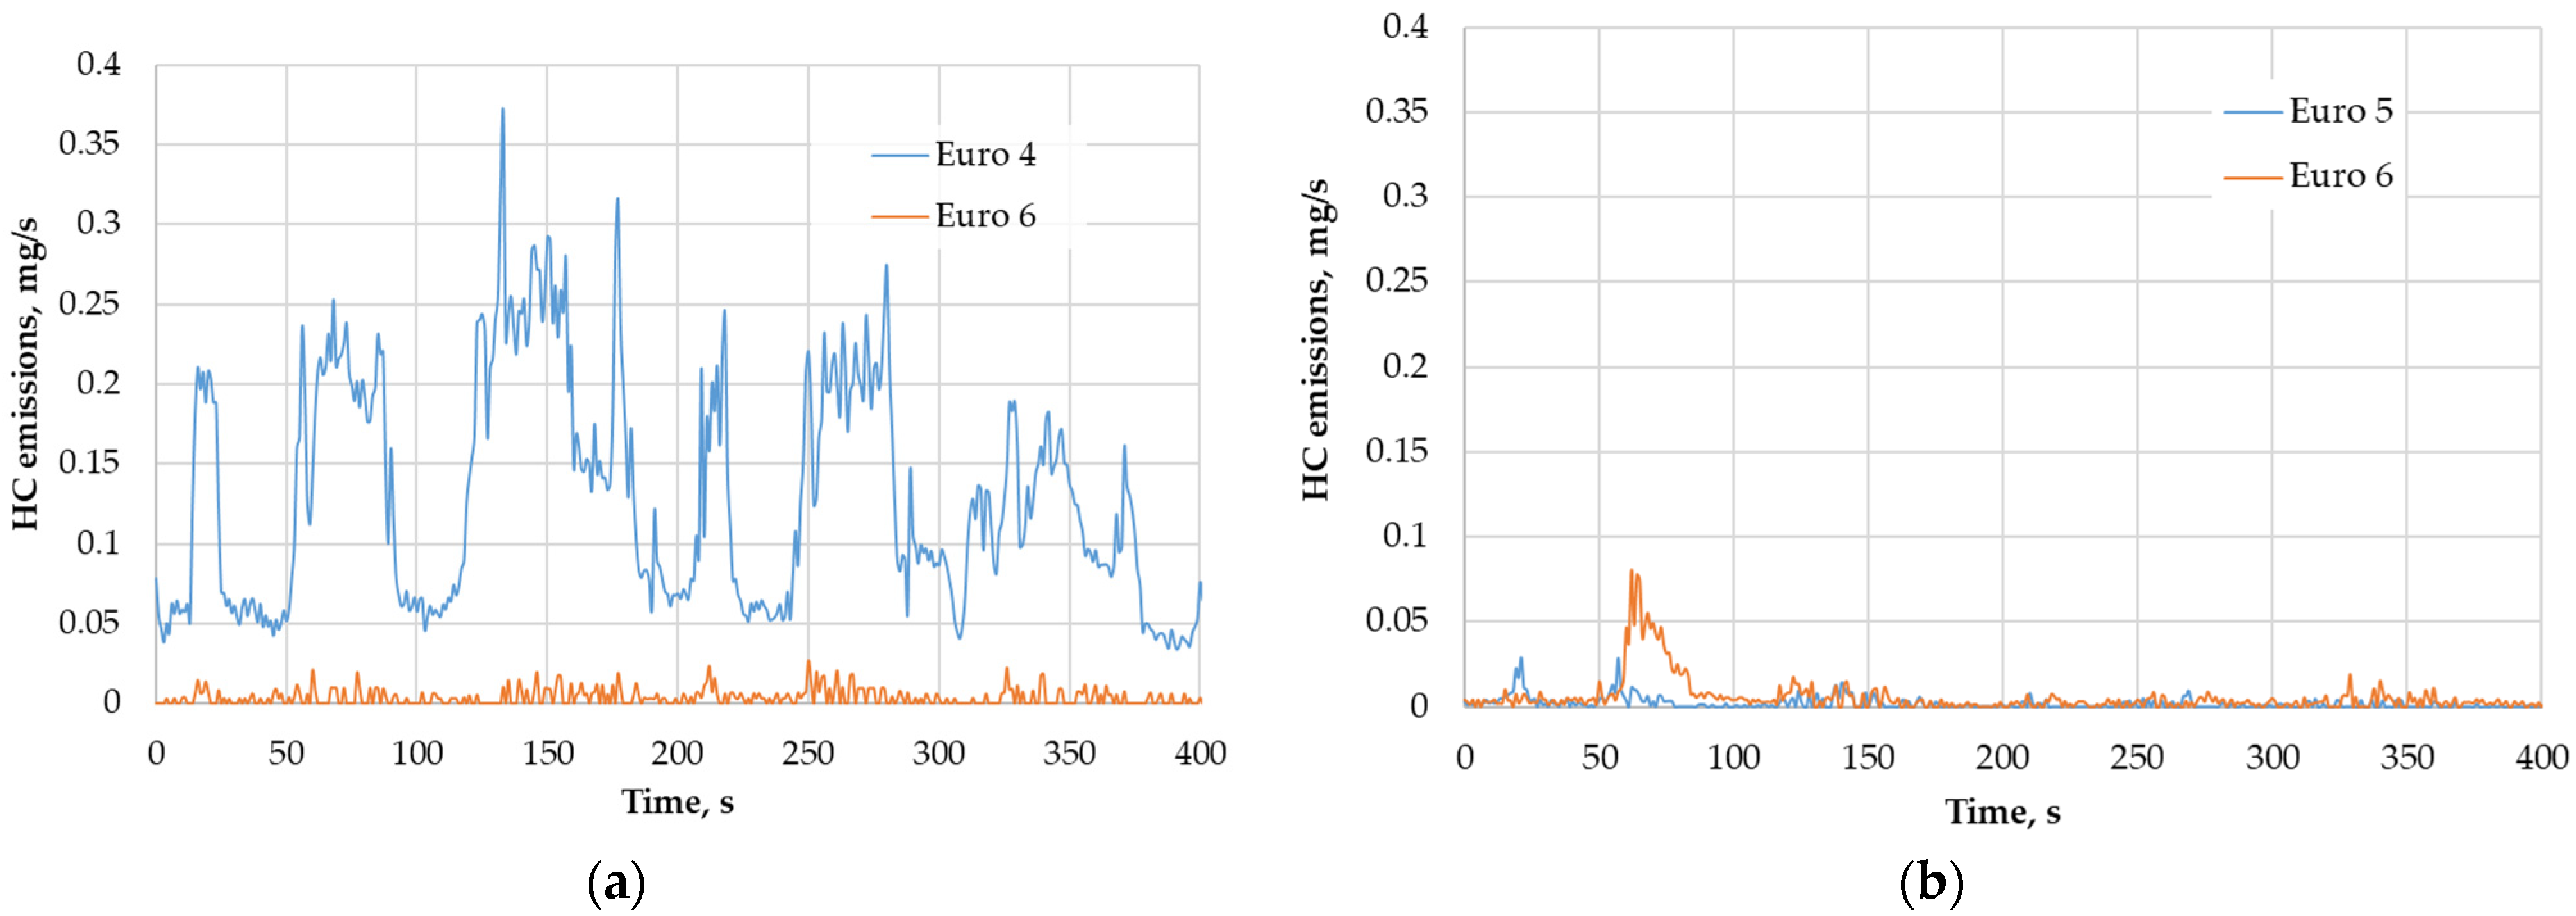
At first glance, gasoline vehicles (Figure 3b) appear to exhibit a clear advantage in terms of HC emissions compared to diesel vehicles (Figure 3a). However, closer inspection reveals that both Euro 6-compliant vehicles demonstrate similarly low HC emissions, typically fluctuating within the 0–0.025 g/s range, with the exception of the gasoline-powered VW Passat, which shows a noticeable increase between 60 and 80 s, peaking at 0.08 g/s. This can be attributed to insufficient warm-up of the three-way catalytic converter and the fact that different pollutants require different converter temperatures for effective treatment. Early-stage DOCs are particularly sensitive to their light-off temperature; if the exhaust gas temperature is too low or too high—or if the catalyst is contaminated—oxidation efficiency drops significantly [50]. The DOC also facilitates the conversion of NO to NO2 in the exhaust, which supports passive DPF regeneration and enhances SCR efficiency [51,52]. Thus, the DOC plays a central role in the performance of the entire after-treatment system and remains critical even in Euro 6-compliant vehicles [53].
The 2010 Nissan Qashqai, which meets Euro 4 emission standards, stands out with significantly higher HC emissions—just as it did in terms of CO output. These elevated emissions are largely attributable to the lower efficiency of DOCs used in Euro 4 vehicles, which typically achieved only about 70–80% conversion efficiency [54,55]. Additionally, earlier DOCs were more susceptible to sulfur content in diesel fuel. During combustion, sulfur is oxidized to sulfur dioxide (SO2) [56], which accumulates in the catalyst and degrades its performance [57]. Notably, even when using ultra-low sulfur diesel (ULSD), sulfate accumulation remains one of the primary causes of DOC deactivation [58].
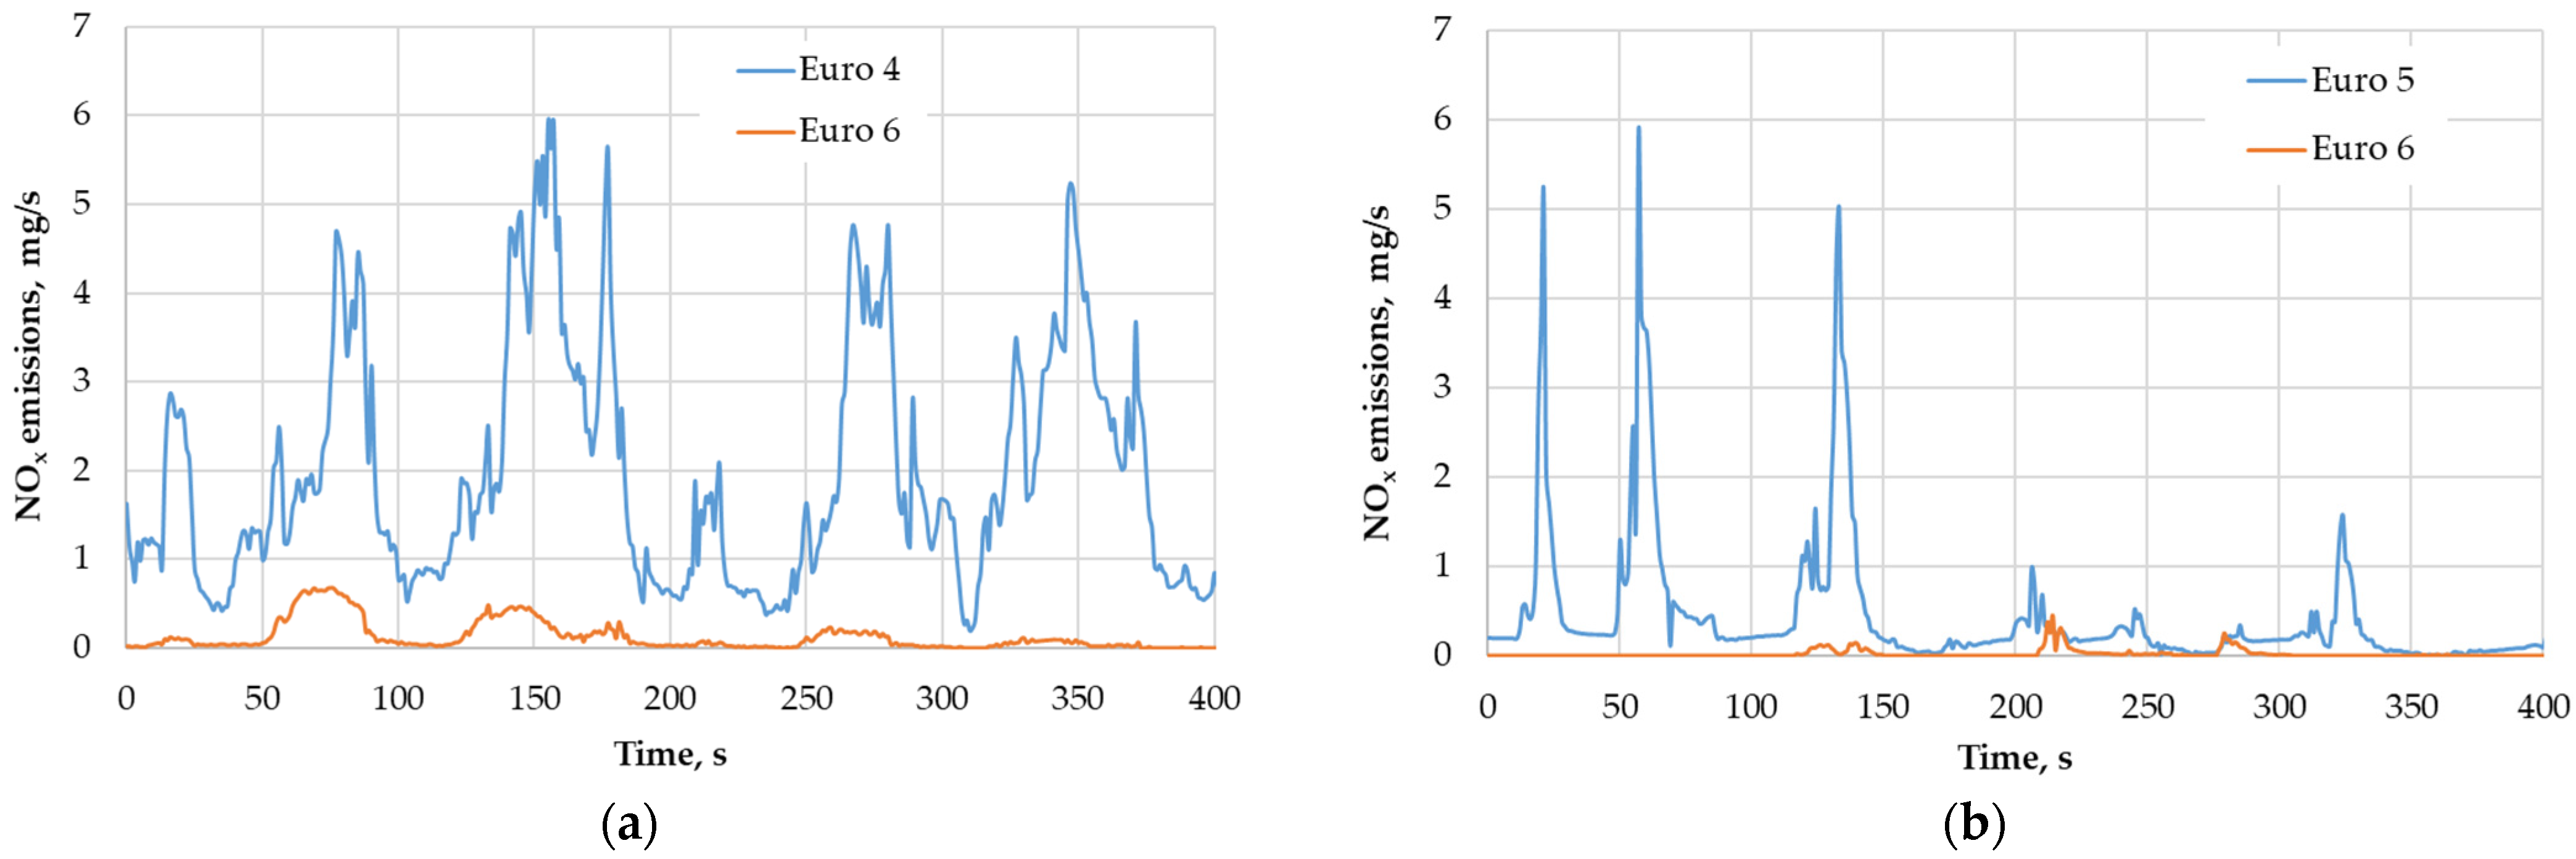
Figure 4 presents the NOx emission profiles of four vehicles, each complying with different Euro emission standards. A clear relationship is observed between acceleration intensity and NOx formation: the sharper the acceleration, the higher the NOx emission rate. This trend is most evident in the Euro 4-compliant diesel vehicle (Figure 4a), where NOx emissions reach up to 6 mg/s during strong acceleration phases. Such peaks indicate insufficient after-treatment or delayed response of the EGR system during dynamic load transitions [59].
In contrast, the Euro 5 gasoline-powered Nissan Qashqai (Figure 4b) shows lower NOx emissions overall, with prominent peaks during the early phases of the driving cycle. As the test progresses, each successive acceleration event produces less NOx, and after approximately 150 s, the emission rate stabilizes at a minimal level, with only minor spikes occurring during acceleration. This trend can likely be attributed to the catalytic converter reaching its optimal operating temperature, thus increasing NOx conversion efficiency. It is also possible that the vehicle is equipped with a NOx storage catalyst (NSC), which becomes significantly more effective once thermally activated (it becomes effective only after reaching its operating temperature (~250–350 °C)).
Both the Euro 6 diesel and gasoline vehicles exhibit consistently low NOx emissions throughout the entire ECE-15 cycle. The emissions remain near-zero in both cases, indicating the successful implementation of advanced emission control systems, such as selective catalytic reduction (SCR) in diesel engines and highly efficient TWC and NSC in gasoline engines. These technologies, in combination with optimized engine calibration and improved combustion strategies, significantly reduce NOx formation even under transient operating conditions.
Overall, the data confirm that NOx emissions are highly dependent on both the emission standard and the dynamic behavior of the vehicle. Older-generation engines, particularly those without active NOx control systems, demonstrate significantly higher NOx output during acceleration. Conversely, modern Euro 6 vehicles show minimal emissions regardless of load conditions, emphasizing the effectiveness of current exhaust after-treatment technologies and regulatory progress.
CO2 emissions are directly proportional to the amount of fuel burned; thus, they can only be reduced by improving engine efficiency or lowering fuel consumption. Exhaust after-treatment systems—such as TWC and DPF—do not reduce CO2, as their function is to control toxic pollutants (CO, HC, NOx, and PM). On the contrary, oxidation processes within these systems (e.g., the conversion of CO and HC into CO2) may slightly increase total carbon dioxide emissions [60].
Figure 5 illustrates that the CO2 emission profiles of Euro 4 and Euro 6 diesel vehicles during the ECE-15 cycle are very similar in both shape and intensity. Emission peaks align with acceleration phases, while drops correspond to deceleration and idle periods. Although Euro 6 emissions are slightly lower in some intervals, they are occasionally higher, and the total CO2 output is nearly identical. This indicates that differences in CO2 emissions between standards are driven not by after-treatment systems—since catalysts and filters do not reduce CO2 and may even slightly increase it—but by combustion efficiency [61]. Improvements in engine and vehicle design contribute to reduced emissions [62], but the additional fuel required for emission control (e.g., DPF regeneration, NOx reduction) can partially offset these gains, resulting in minimal differences under real-world driving conditions.
Figure 5b shows the CO2 emission curves of a Euro 5 Nissan Qashqai (1.2 L, 85 kW) and a Euro 6 VW Passat (2.0 L, 140 kW) during the ECE-15 driving cycle. Although both vehicles follow the same speed profile, the Passat consistently produces higher CO2 emissions, particularly during acceleration phases, where its peaks are significantly elevated. This reflects the increased fuel demand of a larger, more powerful engine under transient loads.
Notably, the Euro 6 vehicle also emits more CO2 during idle phases, despite the absence of any effective mechanical work. This is primarily due to its larger engine displacement, which results in higher internal friction, greater parasitic losses (e.g., from auxiliary systems), and higher baseline fuel consumption simply to keep the engine running [63,64]. As a result, its idle emissions remain above those of the smaller Euro 5 engine throughout the cycle.
These observations highlight that engine size and vehicle power class play a crucial role in CO2 emissions, often outweighing the influence of emission standard alone [65]. While the Euro 6 Passat performs better in terms of regulated pollutants (e.g., NOx), this comes with no inherent advantage in CO2 reduction—especially in urban driving scenarios, like ECE-15.
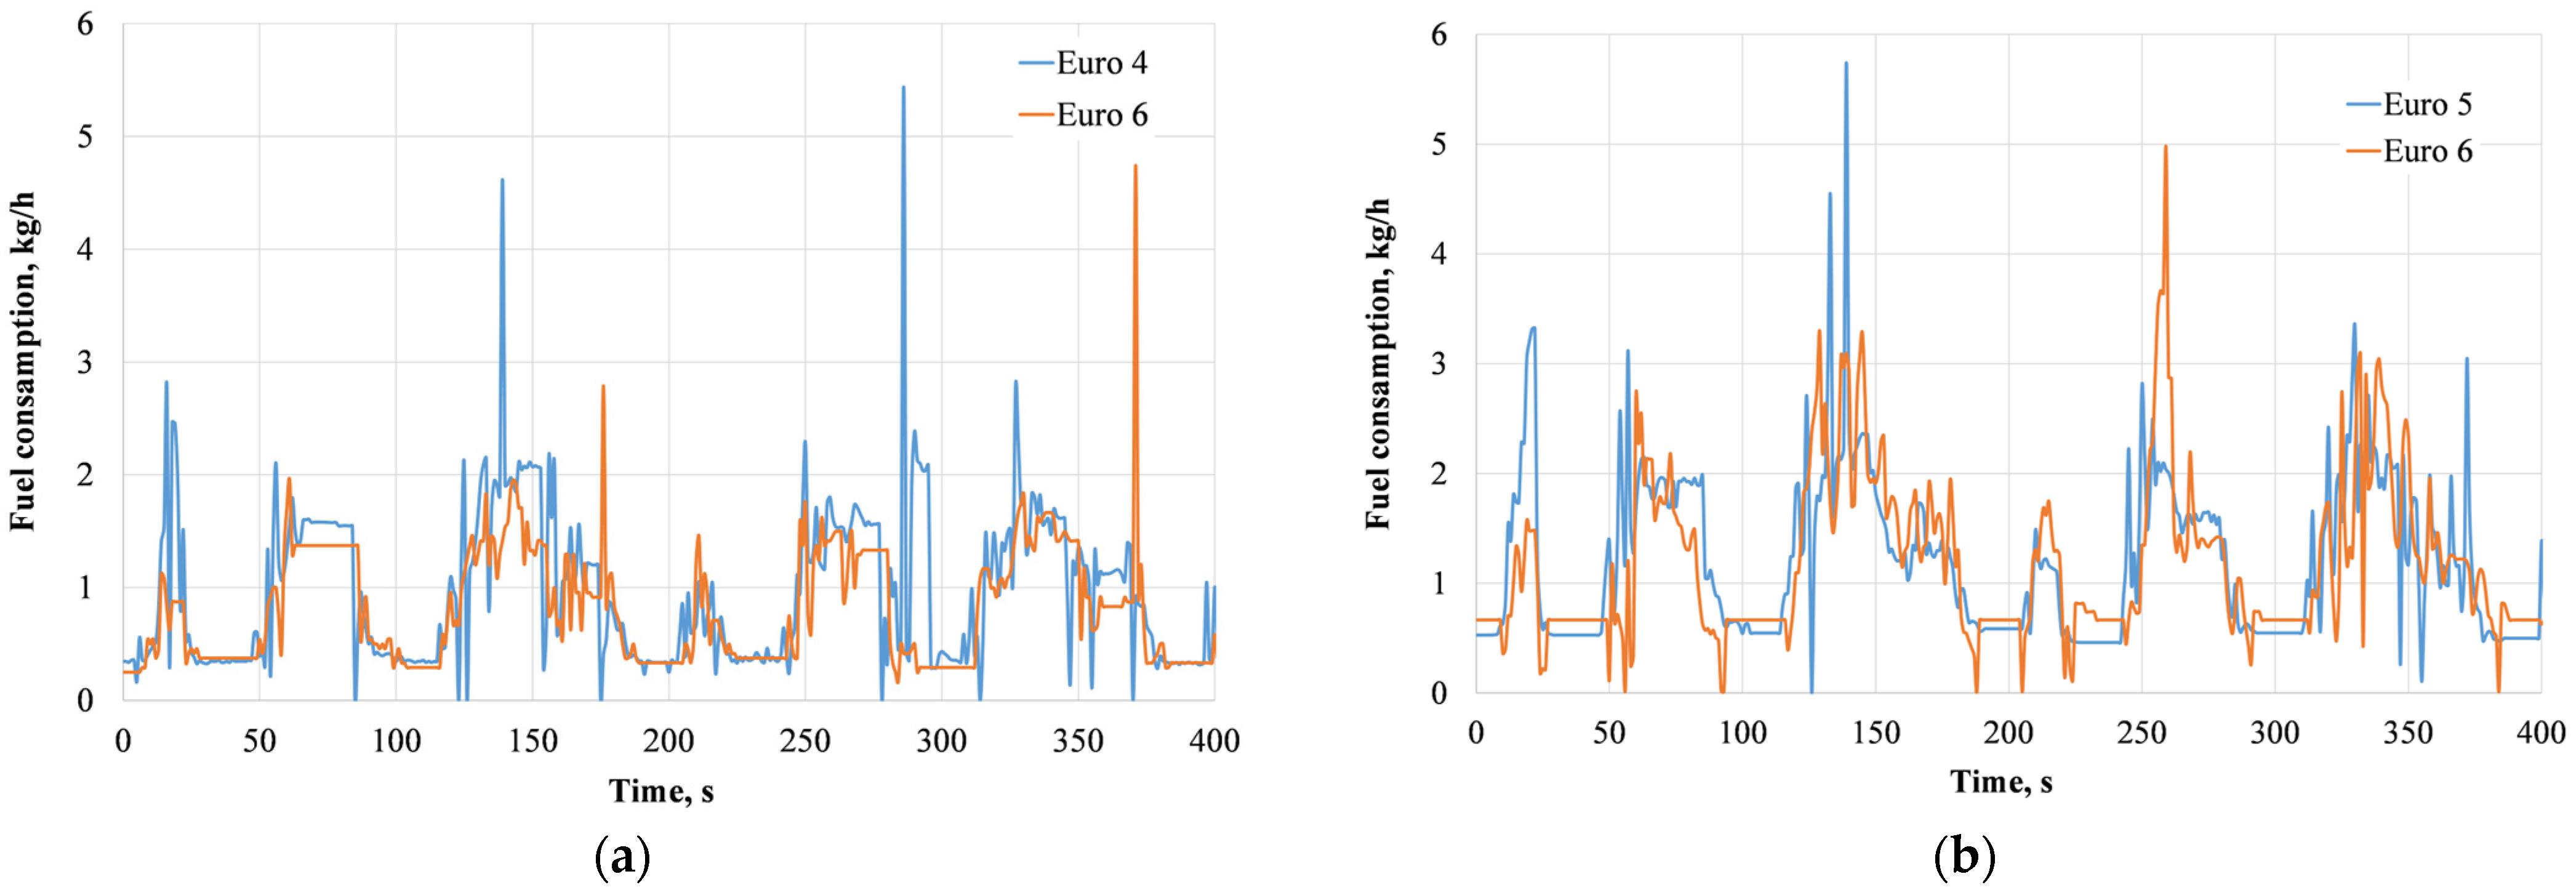
The time-series fuel consumption profiles from the ECE-15 cycle clearly show that engine displacement, power, and vehicle mass influence fuel use under identical driving conditions, often more so than the emission standard category. In the diesel vehicle comparison, the Euro 6 VW Passat (2.0 L, 110 kW) and the older Euro 4 Nissan Qashqai (1.5 L, 78 kW) exhibit nearly identical consumption patterns—with short-term momentary peaks during acceleration and low usage during deceleration/idle—indicating that the newer engine’s efficiency gains were modest in this urban cycle (Figure 6a). Their official CO2 emissions measured under the NEDC cycle are almost identical (Passat—140 g/km vs. Qashqai—145 g/km). This indicates that although the newer car is more powerful, it emits less CO2, clearly demonstrating the effectiveness of advanced engine management technologies.
By contrast, the gasoline pair highlights the impact of vehicle size and power (Figure 6b): the Euro 6 VW Passat (2.0 L, 140 kW engine; unladen mass 1530 kg) consumes considerably more fuel at each acceleration and even during idle than the downsized Euro 5 Nissan Qashqai (1.2 L, 85 kW; 1399 kg). The Passat’s larger, more powerful engine demands more fuel during transient loads, producing significantly higher consumption spikes, and its idle fuel use stays elevated due to greater internal friction and parasitic losses from the bigger displacement. These factors result in higher overall fuel consumption for the Passat, consistent with its higher NEDC-rated CO2 emissions (175 vs. 129 g/km for the Passat vs. Qashqai). Overall, the observed trends underscore that fundamental vehicle characteristics—engine size and output (and, consequently, weight)—are key determinants of dynamic fuel consumption, aligning with their CO2 efficiency ratings, whereas a stricter Euro standard alone does not inherently guarantee lower fuel use in urban driving.

3.2. Calculation Results

Based on the methodology outlined in Section 2.2, the mass flow rate of various exhaust components (g/s) was calculated, subsequently integrated over time, and normalized by the distance travelled during the driving cycle. The results of these calculations are presented in Table 4.
Analysis of the obtained data indicates that emissions from nearly all tested vehicles fall within the permissible limits defined by the corresponding Euro standards, or exceed them only marginally. For the Nissan Qashqai+2 J10, NOx was approximately 46% higher, and HC was twice as low as the respective limits. However, CO emissions exceeded the regulated threshold by more than a factor of two. The calculated CO2 emissions were only 6.2% higher than the value prescribed by the applicable Euro standard.
In the case of the gasoline-powered Nissan Qashqai J11, CO emissions were 33 times lower, while HC emissions were 333 times lower than the permissible limits. Nevertheless, NOx emissions exceeded the standard by 19 mg/km. The estimated CO2 output was 1.6 times higher than the regulatory threshold.
The two VW Passat models tested demonstrated the lowest pollutant levels overall. For both vehicles, the gas analyzer detected no measurable CO emissions, despite the Euro standards allowing up to 0.5 g/km for diesel and 1.0 g/km for gasoline engines. HC emissions were also several tens of times lower than the corresponding limits. However, in line with previous results, CO2 emissions remained elevated. In the diesel model, the calculated CO2 exceeded the limit by only 4 g/km, while in the gasoline model, it surpassed the standard by 90 g/km—or 51.4%.

4. Conclusions

In this study, an emission calculation methodology (g/km) based on the ECE-15 driving cycle was developed and applied to evaluate the compliance of light-duty vehicles with different Euro emission standards. Experimental tests were conducted on passenger cars representing various Euro standard levels. After measuring their emissions and performing calculations using the developed method, the following conclusions were drawn:
  • The Nissan Qashqai+2 J10 (Euro 4) exceeded the CO limit by 2.07 times, while NOx was 1.46 times lower, and HC emissions were 2 times below the allowed value. CO2 emissions exceeded the limit by only 1.06 times, which can be considered a marginal deviation.
  • The VW Passat B8 (Euro 6) demonstrated very low emissions: CO was undetectable, HC amounted to only 1.6% of the limit, and NOx was 3.81 times lower. CO2 emissions exceeded the limit by only 2.9%.
  • The Nissan Qashqai J11 (Euro 5) emitted 33 times less CO and 333 times less HC, but NOx exceeded the limit by 1.32 times. CO2 emissions were 62.8% higher than the Euro 5 threshold.
  • The VW Passat B8 (Euro 6) had no detectable CO emissions, HC amounted to just 1% of the allowed limit, NOx was 15 times lower, and CO2 emissions were 51.4% above the regulated value.
  • While most tested vehicles complied with regulated pollutant limits (CO, HC, and NOx), all exceeded their respective CO2 standards. This finding highlights a key challenge in current emission reduction strategies: without major changes to combustion engine architecture or the adoption of low-carbon fuels, significant CO2 reductions remain unattainable.
  • The developed emission calculation methodology is universal and applicable to any driving cycle, making it suitable for evaluating results obtained under various testing conditions. In addition to its scientific role, the methodology developed in this study has practical implications for the certification of retrofitted vehicles equipped with combined conventional fuel and hydrogen supply systems. The methodology could be further improved by incorporating automated data acquisition solutions and real-time flow analysis, thereby increasing the accuracy of the results.
  • In further research, the methodology developed in this study will be applied to an expanded vehicle sample to enhance the reliability, statistical robustness, and practical relevance of the findings. The focus will shift toward retrofitted internal combustion engine vehicles powered by alternative fuels—such as hydrogen, liquefied petroleum gas, or compressed natural gas—with the aim of evaluating not only their emissions, fuel consumption, and operating parameters but also their compliance with environmental regulations. The ultimate objective is to support the type-approval and certification of modified vehicles, using the validated methodology as a standard emissions evaluation tool under controlled driving cycles.

Author Contributions

Conceptualization, D.A. and S.P.; methodology, D.A., D.P. and S.P.; software, D.A.; validation, D.A., Š.M. and D.P.; formal analysis, S.P.; investigation, D.A. and S.P.; resources, Š.M.; data curation, D.A.; writing—original draft preparation, D.A. and S.P.; writing—review and editing, D.P. and Š.M.; visualization, D.A. and S.P.; supervision, S.P. All authors have read and agreed to the published version of the manuscript.

Funding

This research received no external funding.

Institutional Review Board Statement

Not applicable.

Informed Consent Statement

Not applicable.

Data Availability Statement

Data are contained within the article.

Conflicts of Interest

The authors declare no conflicts of interest.

Abbreviations

The following abbreviations are used in this manuscript:
COCarbon monoxide
CO2Carbon dioxide
DOCDiesel oxidation catalyst
DPFDiesel particulate filter
EGRExhaust gas recirculation
ICEInternal combustion engine
HCHydrocarbon
NEDCNew European Driving Cycle
NONitrogen monoxide
NO2Nitrogen dioxide
NOxNitrogen oxides
NSCNOx storage catalyst
OBDOn-board diagnostics
RDEReal driving emissions
SCRSelective catalytic reduction
TWCThree-way catalysts
ULSDUltra-low sulfur diesel
WLTPWorldwide Harmonized Light-Duty Vehicles Test Procedure

References

  1. Jing, Q.-L.; Liu, H.-Z.; Yu, W.-Q.; He, X. The Impact of Public Transportation on Carbon Emissions—From the Perspective of Energy Consumption. Sustainability 2022, 14, 6248. [Google Scholar] [CrossRef]
  2. Rimpas, D.; Barkas, D.E.; Orfanos, V.A.; Christakis, I. Decarbonizing the Transportation Sector: A Review on the Role of Electric Vehicles Towards the European Green Deal for the New Emission Standards. Air 2025, 3, 10. [Google Scholar] [CrossRef]
  3. Ferrer, A.L.C.; Thomé, A.M.T. Carbon Emissions in Transportation: A Synthesis Framework. Sustainability 2023, 15, 8475. [Google Scholar] [CrossRef]
  4. Liang, J.; Wang, F.; Feng, J.; Zhao, M.; Fang, R.; Pi, D.; Yin, G. A Hierarchical Control of Independently Driven Electric Vehicles Considering Handling Stability and Energy Conservation. IEEE Trans. Intell. Veh. 2024, 9, 738–751. [Google Scholar] [CrossRef]
  5. Liu, H.; Yu, S.; Wang, T.; Li, J.; Wang, Y. A Systematic Review on Sustainability Assessment of Internal Combustion Engines. J. Clean. Prod. 2024, 451, 141996. [Google Scholar] [CrossRef]
  6. Emissions Distributions by Vehicle Age and Policy Implications; TRUE—The Real Urban Emissions Initiative: London, UK, 2020; p. 8. Available online: https://theicct.org/wp-content/uploads/2021/06/US-TRUE-emissions-distribution-oct2020.pdf?utm_source=chatgpt.com (accessed on 23 May 2025).
  7. Pilusa, T.J.; Mollagee, M.M.; Muzenda, E. Reduction of Vehicle Exhaust Emissions from Diesel Engines Using the Whale Concept Filter. Aerosol Air Qual. Res. 2012, 12, 994–1006. [Google Scholar] [CrossRef]
  8. Liu, B.; Shi, Q.; He, L.; Qiu, D. A Study on the Construction of Hefei Urban Driving Cycle for Passenger Vehicle. IFAC-PapersOnLine 2018, 51, 854–858. [Google Scholar] [CrossRef]
  9. Wang, J.; Wang, L.; Li, J.; Li, J.; Xu, F.; Han, F.; He, J.; Chen, Q.; Chen, X. RDE & Dynamometer Analysis of Light-Duty Vehicle Emissions across Altitudes, Temperatures, and Driving Styles. PLoS ONE 2025, 20, e0318298. [Google Scholar] [CrossRef]
  10. Alkama, R.; Ait-Idir, F.; Slimani, Z. Estimation and Measurement of the Automobile Pollution: Application to Bejaia Case. Glob. NEST J. 2006, 8, 277–281. [Google Scholar] [CrossRef]
  11. Wang, Y.; Hao, C.; Ge, Y.; Hao, L.; Tan, J.; Wang, X.; Zhang, P.; Wang, Y.; Tian, W.; Lin, Z.; et al. Fuel Consumption and Emission Performance from Light-Duty Conventional/Hybrid-Electric Vehicles over Different Cycles and Real Driving Tests. Fuel 2020, 278, 118340. [Google Scholar] [CrossRef]
  12. Sofwan, N.M.; Latif, M.T. Characteristics of the Real-Driving Emissions from Gasoline Passenger Vehicles in the Kuala Lumpur Urban Environment. Atmos. Pollut. Res. 2021, 12, 306–315. [Google Scholar] [CrossRef]
  13. Chong, H.S.; Park, Y.; Kwon, S.; Hong, Y. Analysis of Real Driving Gaseous Emissions from Light-Duty Diesel Vehicles. Transp. Res. Part Transp. Environ. 2018, 65, 485–499. [Google Scholar] [CrossRef]
  14. Bagheri, E.; Tehrani, M.M.; Azadi, M.; Moosavian, A. Impact of Driving Characteristic Parameters and Vehicle Type on Fuel Consumption and Emissions Performance over Real Driving Cycles. PLoS ONE 2025, 20, e0317098. [Google Scholar] [CrossRef]
  15. Pöhler, D.; Schmidt, C.; Horbanski, M.; Schmitt, S.; Lampel, J. Identification of Manipulated & Defective Truck NOx Emission Reduction Systems with Plume Chasing for Authority Inspections. Transp. Res. Procedia 2023, 72, 1661–1668. [Google Scholar] [CrossRef]
  16. Jong, W.; Van Der Linde, V. Clean Diesel and Dirty Scandal: The Echo of Volkswagen’s Dieselgate in an Intra-Industry Setting. Public Relat. Rev. 2022, 48, 102146. [Google Scholar] [CrossRef]
  17. Alé-Chilet, J.; Chen, C.; Li, J.; Reynaert, M. Colluding Against Environmental Regulation. Rev. Econ. Stud. 2025, 37, rdaf024. [Google Scholar] [CrossRef]
  18. Reynaert, M.; Sallee, J.M. Who Benefits When Firms Game Corrective Policies? Am. Econ. J. Econ. Policy 2021, 13, 372–412. [Google Scholar] [CrossRef]
  19. Reynaert, M. Abatement Strategies and the Cost of Environmental Regulation: Emission Standards on the European Car Market. Rev. Econ. Stud. 2021, 88, 454–488. [Google Scholar] [CrossRef]
  20. Alexander, D.; Schwandt, H. The Impact of Car Pollution on Infant and Child Health: Evidence from Emissions Cheating. Rev. Econ. Stud. 2022, 89, 2872–2910. [Google Scholar] [CrossRef]
  21. Bachmann, R.; Ehrlich, G.; Fan, Y.; Ruzic, D.; Leard, B. Firms and Collective Reputation: A Study of the Volkswagen Emissions Scandal. J. Eur. Econ. Assoc. 2023, 21, 484–525. [Google Scholar] [CrossRef]
  22. Ater, I.; Yoseph, N.S. The Impact of Environmental Fraud on the Used Car Market: Evidence from Dieselgate. J. Ind. Econ. 2022, 70, 463–491. [Google Scholar] [CrossRef]
  23. Holland, S.P.; Mansur, E.T.; Muller, N.Z.; Yates, A.J. Damages and Expected Deaths Due to Excess NOx Emissions from 2009 to 2015 Volkswagen Diesel Vehicles. Environ. Sci. Technol. 2016, 50, 1111–1117. [Google Scholar] [CrossRef]
  24. Rahman, S.M.A.; Fattah, I.M.R.; Ong, H.C.; Ashik, F.R.; Hassan, M.M.; Murshed, M.T.; Imran, M.A.; Rahman, M.H.; Rahman, M.A.; Hasan, M.A.M.; et al. State-of-the-Art of Establishing Test Procedures for Real Driving Gaseous Emissions from Light- and Heavy-Duty Vehicles. Energies 2021, 14, 4195. [Google Scholar] [CrossRef]
  25. Triantafyllopoulos, G.; Dimaratos, A.; Ntziachristos, L.; Bernard, Y.; Dornoff, J.; Samaras, Z. A Study on the CO2 and NOx Emissions Performance of Euro 6 Diesel Vehicles under Various Chassis Dynamometer and On-Road Conditions Including Latest Regulatory Provisions. Sci. Total Environ. 2019, 666, 337–346. [Google Scholar] [CrossRef]
  26. Bodisco, T.; Zare, A. Practicalities and Driving Dynamics of a Real Driving Emissions (RDE) Euro 6 Regulation Homologation Test. Energies 2019, 12, 2306. [Google Scholar] [CrossRef]
  27. Zachiotis, A.T.; Giakoumis, E.G. Non-Regulatory Parameters Effect on Consumption and Emissions from a Diesel-Powered van over the WLTC. Transp. Res. Part Transp. Environ. 2019, 74, 104–123. [Google Scholar] [CrossRef]
  28. Claßen, J.; Krysmon, S.; Dorscheidt, F.; Sterlepper, S.; Pischinger, S. Real Driving Emission Calibration—Review of Current Validation Methods against the Background of Future Emission Legislation. Appl. Sci. 2021, 11, 5429. [Google Scholar] [CrossRef]
  29. Pelkmans, L.; Debal, P. Comparison of On-Road Emissions with Emissions Measured on Chassis Dynamometer Test Cycles. Transp. Res. Part Transp. Environ. 2006, 11, 233–241. [Google Scholar] [CrossRef]
  30. DIN 70200:2012-06; Technical Product Documentation—System of Documentation—General Principles. Beuth Verlag (DIN Media): Berlin, Germany, 2012.
  31. EN ISO 9001:2015; Quality Management Systems—Requirements. CEN/ISO: Brussels, Belgium, 2015.
  32. ISO 3930/OIML R 99; Instruments for Measuring Vehicle Exhaust Emissions. ISO: Geneva, Switzerland, 2000.
  33. UNECE. Uniform Provisions Concerning the Approval of Engines with Regard to the Emission of Visible Pollutants and the Measurement of Engine Power; Regulation No. 24; United Nations Economic Commission for Europe: Geneva, Switzerland, 2006. [Google Scholar]
  34. Boguski, T.K. Understanding Units of Measurement. Available online: https://cfpub.epa.gov/ncer_abstracts/index.cfm/fuseaction/display.files/fileid/14285 (accessed on 23 May 2025).
  35. Makarevičienė, V.; Pukalskas, S.; Janulis, P. Comparative Investigation of Rapeseed Oil Ethyl and Methyl Ester Emissions = Lyginamieji Rapsų Aliejaus Etil- Ir Metilesterių Deginių Emisijos Tyrimai. Aplink. Inž. 2001, 9, 158–163. [Google Scholar]
  36. Council Directive 70/220/EEC of 20 March 1970 on the Approximation of the Laws of the Member States Relating to Measures to Be Taken Against Air Pollution by Gases from Positive-Ignition Engines of Motor Vehicles; Council of the European Communities: Brussels, Belgium, 1970; Volume TOC.
  37. Al-Esawi, N.; Al Qubeissi, M.; Whitaker, R.; Sazhin, S.S. Blended E85–Diesel Fuel Droplet Heating and Evaporation. Energy Fuels 2019, 33, 2477–2488. [Google Scholar] [CrossRef]
  38. Lee, Y.; Lee, S.; Min, K. Prediction of NOx Considering NO and NO2 for a CI Engine. Proc. Inst. Mech. Eng. Part J. Automob. Eng. 2022, 236, 1058–1068. [Google Scholar] [CrossRef]
  39. Brimblecombe, P.; Chu, M.; Liu, C.-H.; Fu, Y.; Wei, P.; Ning, Z. Roadside NO2/NOx and Primary NO2 from Individual Vehicles. Atmos. Environ. 2023, 295, 119562. [Google Scholar] [CrossRef]
  40. Wang, X.; Huang, K.; Yuan, L.; Xi, S.; Yan, W.; Geng, Z.; Cong, Y.; Sun, Y.; Tan, H.; Wu, X.; et al. Activation of Surface Oxygen Sites in a Cobalt-Based Perovskite Model Catalyst for CO Oxidation. J. Phys. Chem. Lett. 2018, 9, 4146–4154. [Google Scholar] [CrossRef]
  41. He, C.B.; Pan, K.L.; Chang, M.B. Catalytic Oxidation of Trichloroethylene from Gas Streams by Perovskite-Type Catalysts. Environ. Sci. Pollut. Res. 2018, 25, 11584–11594. [Google Scholar] [CrossRef]
  42. Tang, W.; Lu, X.; Liu, F.; Du, S.; Weng, J.; Hoang, S.; Wang, S.; Nam, C.-Y.; Gao, P.-X. Ceria-Based Nanoflake Arrays Integrated on 3D Cordierite Honeycombs for Efficient Low-Temperature Diesel Oxidation Catalyst. Appl. Catal. B Environ. 2019, 245, 623–634. [Google Scholar] [CrossRef]
  43. Nose, H.; Inoue, T.; Katagiri, S.; Sakai, A.; Kawasaki, T.; Okamura, M. Fuel Enrichment Control System by Catalyst Temperature Estimation to Enable Frequent Stoichiometric Operation at High Engine Speed/Load Condition; SAE Technical Paper: Warrendale, PA, USA, 2013. [Google Scholar]
  44. Fuel Trim Info—Ross-Tech Wiki. Available online: https://wiki.ross-tech.com/wiki/index.php/Fuel_Trim_Info?utm_source=chatgpt.com (accessed on 12 May 2025).
  45. Gogola, R.; Kósa, A. Electronic Control of Fuel Mixture Preparation and Injection in Internal Combustion Engines. Am. J. Mech. Eng. 2014, 2, 231–238. [Google Scholar] [CrossRef]
  46. Martínez-Munuera, J.C.; Giménez-Mañogil, J.A.; Matarrese, R.; Castoldi, L.; García-García, A. NOx Reduction Pathways during LNT Operation over Ceria Containing Catalysts: Effect of Copper Presence and Barium Content. Appl. Sci. 2021, 11, 5700. [Google Scholar] [CrossRef]
  47. Schöneborn, M.; Harmening, T.; Giménez-Mañogil, J.; Martínez-Munuera, J.C.; García-García, A. Improved NOx Storage/Release Properties of Ceria-Based Lean NOx Trap Compositions with MnOx Modification. Materials 2019, 12, 2127. [Google Scholar] [CrossRef]
  48. Getsoian, A.B.; Theis, J.R.; Lambert, C.K. Sensitivity of Three-Way Catalyst Light-Off Temperature to Air-Fuel Ratio. Emiss. Control Sci. Technol. 2018, 4, 136–142. [Google Scholar] [CrossRef]
  49. Mc Grane, L.; Douglas, R.; Irwin, K.; Stewart, J.; Woods, A.; Muehlstaedt, F. A Study of the Effect of Light-Off Temperatures and Light-Off Curve Shape on the Cumulative Emissions Performance of 3-Way Catalytic Converters; SAE Technical Paper: Warrendale, PA, USA, 2021. [Google Scholar]
  50. E, J.; Zuo, W.; Gao, J.; Peng, Q.; Zhang, Z.; Hieu, P.M. Effect Analysis on Pressure Drop of the Continuous Regeneration-Diesel Particulate Filter Based on NO2 Assisted Regeneration. Appl. Therm. Eng. 2016, 100, 356–366. [Google Scholar] [CrossRef]
  51. Herreros, J.M.; Gill, S.S.; Lefort, I.; Tsolakis, A.; Millington, P.; Moss, E. Enhancing the Low Temperature Oxidation Performance over a Pt and a Pt–Pd Diesel Oxidation Catalyst. Appl. Catal. B Environ. 2014, 147, 835–841. [Google Scholar] [CrossRef]
  52. Geng, Y.; Shan, W.; Liu, F.; Yang, S. Adjustment of Operation Temperature Window of Mn-Ce Oxide Catalyst for the Selective Catalytic Reduction of NO with NH3. J. Hazard. Mater. 2021, 405, 124223. [Google Scholar] [CrossRef] [PubMed]
  53. Zhang, Z.; Tian, J.; Li, J.; Cao, C.; Wang, S.; Lv, J.; Zheng, W.; Tan, D. The Development of Diesel Oxidation Catalysts and the Effect of Sulfur Dioxide on Catalysts of Metal-Based Diesel Oxidation Catalysts: A Review. Fuel Process. Technol. 2022, 233, 107317. [Google Scholar] [CrossRef]
  54. Xie, L.; Jiang, G.; Qian, F. Research on Aftertreatment Inlet_Outlet Insulation for A Nonroad Middle Range Diesel Engine. Catalysts 2020, 10, 454. [Google Scholar] [CrossRef]
  55. Tsuchiya, A.; Masaoka, S.; Ohyama, J.; Sawabe, K.; Satsuma, A. Effects of Carbon Number and Bond Saturation on Hydrocarbon Combustion over a Diesel Oxidation Catalyst. Catal. Sci. Technol. 2020, 10, 3868–3874. [Google Scholar] [CrossRef]
  56. Cho, C.P.; Kwon, O.S.; Lee, Y.J. Effects of the Sulfur Content of Liquefied Petroleum Gas on Regulated and Unregulated Emissions from Liquefied Petroleum Gas Vehicle. Fuel 2014, 137, 328–334. [Google Scholar] [CrossRef]
  57. Han, D.; E, J.; Deng, Y.; Chen, J.; Leng, E.; Liao, G.; Zhao, X.; Feng, C.; Zhang, F. A Review of Studies Using Hydrocarbon Adsorption Material for Reducing Hydrocarbon Emissions from Cold Start of Gasoline Engine. Renew. Sustain. Energy Rev. 2021, 135, 110079. [Google Scholar] [CrossRef]
  58. Li, J.; Kumar, A.; Chen, X.; Currier, N.; Yezerets, A. Impact of Different Forms of Sulfur Poisoning on Diesel Oxidation Catalyst Performance; SAE Technical Paper: Warrendale, PA, USA, 2013; p. 2013-01-0514. [Google Scholar]
  59. Weiss, M.; Bonnel, P.; Kühlwein, J.; Provenza, A.; Lambrecht, U.; Alessandrini, S.; Carriero, M.; Colombo, R.; Forni, F.; Lanappe, G.; et al. Will Euro 6 Reduce the NOx Emissions of New Diesel Cars?—Insights from on-Road Tests with Portable Emissions Measurement Systems (PEMS). Atmos. Environ. 2012, 62, 657–665. [Google Scholar] [CrossRef]
  60. AECC—Catalysts—From Oxidation Catalysts to Three-Way Catalysts; AECC: Wakefield, MA, USA, 2024.
  61. Dimaratos, A.; Giechaskiel, B.; Clairotte, M.; Fontaras, G. Impact of Active Diesel Particulate Filter Regeneration on Carbon Dioxide, Nitrogen Oxides and Particle Number Emissions from Euro 5 and 6 Vehicles under Laboratory Testing and Real-World Driving. Energies 2022, 15, 5070. [Google Scholar] [CrossRef]
  62. SMMT. New Car CO2 Report 2015; The Society of Motor Manufacturers and Traders: London, UK, 2015; p. 19. [Google Scholar]
  63. Romero, C.A.; Correa, P.; Ariza Echeverri, E.A.; Vergara, D. Strategies for Reducing Automobile Fuel Consumption. Appl. Sci. 2024, 14, 910. [Google Scholar] [CrossRef]
  64. Koszalka, G.; Hunicz, J. Comparative Study of Energy Losses Related to the Ring Pack Operation in Homogeneous Charge Compression Ignition and Spark Ignition Combustion. Energy 2021, 235, 121388. [Google Scholar] [CrossRef]
  65. Pacura, W.; Szramowiat-Sala, K.; Gołaś, J. Emissions from Light-Duty Vehicles—From Statistics to Emission Regulations and Vehicle Testing in the European Union. Energies 2023, 17, 209. [Google Scholar] [CrossRef]
Figure 1. ECE-15 driving cycle.
Sustainability 17 06000 g001
Figure 2. CO emissions of vehicles during the ECE-15 driving cycle: (a) diesel-powered vehicles; (b) gasoline-powered vehicles.
Sustainability 17 06000 g002
Figure 3. HC emissions of vehicles during the ECE-15 driving cycle: (a) diesel-powered vehicles; (b) gasoline-powered vehicles.
Sustainability 17 06000 g003
Figure 4. NOx emissions of vehicles during the ECE-15 driving cycle: (a) diesel-powered vehicles; (b) gasoline-powered vehicles.
Sustainability 17 06000 g004
Figure 5. CO2 emissions of vehicles during the ECE-15 driving cycle: (a) diesel-powered vehicles; (b) gasoline-powered vehicles.
Sustainability 17 06000 g005
Figure 6. Fuel consumption of vehicles during the ECE-15 driving cycle: (a) diesel-powered vehicles; (b) gasoline-powered vehicles.
Sustainability 17 06000 g006
Table 1. Technical specifications of the vehicles used in the experiments.
ParameterTest Vehicles
Nissan Qashqai+2, J10VW Passat,
B8
Nissan Qashqai, J11VW Passat,
B8
Fuel DieselDieselGasolineGasoline
Euro emission standardEuro 4Euro 6Euro 5Euro 6
Year of manufacture2010201920142019
Engine displacement, cm31461196811971984
Number of cylinders4444
Number of valves2424
Fuel supply systemCommon rail, direct injectionCommon rail, direct injectionDirect injectionDirect injection
Engine power, kW (rpm)78 (4000)110 (3750)85 (4500)140 (4750)
Torque, Nm (rpm)240 (1750)360 (1750 … 3000)190 (2000)320 (1500 … 4100)
CO2 emissions (combined) *, g/km145140129175
Unladen weight, kg1604160013991530
* Data determined in the NEDC.
Table 2. Technical specifications of the Maha LPS 3000 dynamometer test bench.
ParameterValue
TypeR100/1
Power of eddy current brake, kW260
Maximum test speed, km/h260
Maximum traction power, kW260
Maximum traction force, kN6
Measurement error, %±2
Table 3. Measurement parameters of the AVL DiCom 4000 emissions analyzer.
ParameterMeasurement LimitsResolution
Opacity, %0 … 1000.1
Absorption (K-Value), m−10 … 99.990.01
CO, %vol.0 … 100.01
CO2, %vol.0 … 200.1
HC, ppm vol.0 … 20,0001
O2, %vol.0 … 250.01
NOx, ppm vol.0 … 50001
λ-calculation0 … 9.9990.001
Table 4. Results of vehicle emissions calculations.
VehicleEmitted
Pollutant
Measured and Calculated EmissionsValue of Euro Standard
Nissan Qashqai+2, J10
Diesel
Euro 4
NOx0.3650.25
CO1.1610.50
HC0.0250.05
CO2154145
VW Passat, B8
Diesel
Euro 6
NOx0.0210.08
CO00.50
HC0.00080.05
CO2144140
Nissan Qashqai, J11
Gasoline
Euro 5
NOx0.0790.06
CO0.0301.0
HC0.00030.10
CO2210129
VW Passat, B8
Gasoline
Euro 6
NOx0.0040.06
CO01.0
HC0.0010.10
CO2265175
Disclaimer/Publisher’s Note: The statements, opinions and data contained in all publications are solely those of the individual author(s) and contributor(s) and not of MDPI and/or the editor(s). MDPI and/or the editor(s) disclaim responsibility for any injury to people or property resulting from any ideas, methods, instructions or products referred to in the content.