1. Introduction
A Circular Supply Chain (CSC) integrates the sustainable principles of the circular economy (CE) into supply processes, promoting a continuous flow of resources through reuse, reduction, and recycling. Unlike the traditional linear model, CSC is grounded in closed-loop processes, resource efficiency, and waste minimization [
1]. A fundamental enabler of CSC effectiveness is the adaptability of supplier management [
2]. However, conventional supplier selection frameworks often lack integration with CE principles, leading to challenges in aligning procurement decisions with sustainability goals. Existing models predominantly emphasize cost and operational efficiency, neglecting critical sustainability-driven criteria essential for a circular approach [
3].
However, transitioning from linear to circular models presents significant challenges, including the absence of specialized knowledge, insufficient management support, and financial constraints. The process can also be hindered by the lack of standardized performance measurement systems and gaps in environmental regulations. Additionally, a lack of urgency or awareness can further complicate the transition [
4]. Supplier selection plays a crucial role in overcoming these challenges, as organizations must ensure that suppliers align with circular principles to enhance resource efficiency and minimize environmental impact. The United Nations Sustainable Development Goals (SDGs), particularly Target 12.5 (Responsible Consumption and Production), reinforce the importance of circularity by aiming to reduce waste generation through prevention, reduction, recycling, and reuse [
5]. Achieving this goal requires structured decision-making processes that integrate sustainability as a core criterion.
Although previous studies [
6,
7] have explored supplier selection in sustainable supply chains, most frameworks remain anchored in conventional Multi-Criteria Decision Analysis (MCDA) methodologies without adequately incorporating circularity principles. Furthermore, while risk assessment has been widely applied in supplier evaluation, its integration within CSC decision-making remains underexplored. The lack of a structured approach that simultaneously accounts for CE principles, sustainability-driven criteria, and risk factors represents a critical gap in the literature. Addressing this gap requires an advanced decision-making framework that moves beyond traditional MCDA applications by embedding CE priorities into supplier evaluation. These methods prioritize aspects such as resource efficiency, waste minimization, closed-loop logistics, environmental compliance, and risk factors.
A well-structured decision-making process significantly enhances the effectiveness of supplier selection [
8]. By incorporating MCDA techniques, such as Analytic Hierarchy Process (AHP) and Benefits, Opportunities, Costs, and Risks (BOCR), organizations can systematically assess suppliers and support more informed decision-making [
9,
10].
This paper aims to bridge this gap by identifying suitable criteria and establishing a structured procedure for assessing sustainable suppliers within the chemical industry. Specifically, the research addresses the following questions: (RQ1) Which criteria suit circular supplier selection (CSS)? (RQ2) How can CSS be assessed? To answer these questions, the study proposes an integrated decision-making model that combines MCDA techniques with risk evaluation, ensuring a more comprehensive and systematic assessment of circular suppliers. Unlike previous studies, this research extends theoretical understanding by positioning supplier selection at the intersection of CE, risk assessment, and MCDA methodologies. Through this approach, it not only advances supply chain sustainability but also strengthens the alignment between CSC practices.
3. Methodology
Aligning supplier selection with SDG’s Target 12.5 requires a structured approach that prioritizes circular suppliers and waste reduction. To develop the proposed model, this section first presents the AHP, which is used to prioritize supplier selection criteria identified in the literature review. Additionally, risk assessment and adjustment formulas are incorporated into the AHP framework to enhance its robustness, ensuring a more structured and reliable decision-making process.
The AHP is one of the most successfully applied MCDA methods for supplier selection [
80]. According to [
81], the AHP is comparable the human mind functioning when facing a complex situation composed by various elements, these are reunited in groups according to their common characteristics. Such groups can then be grouped at a superior level, with another set of common characteristics, until a maximum level is reached, which constitutes the final objective of the decision-making process.
AHP’s foundations include the Fundamental Scale of Absolute Numbers [
81]. The process involves creating a pairwise comparison matrix
A, followed by using Linear Algebra concepts to determine the eigenvector
w and eigenvalue
. This enables the derivation of relative priorities, providing a robust framework for decision-making. In AHP, priorities are determined by applying the Perron-Frobenius theorem, as outlined by [
81] and expressed in Equation (1).
Consistency is an essential property of the matrix
. If
exhibits consistency in its comparisons, then
for
where
is the order of
. In this manner,
. If
is not a perfectly consistent matrix, then
. The Consistency Index
, calculated by Equation (2), serves as a measure of the deviation between
and
:
The Consistency Ratio
, calculated using Equation (3), also considers a Random Index
associated with
. If the
exceeds 0.10, a review of the comparisons may be necessary [
71].
AHP application occurs in many areas and subjects, among which supply chain management can be highlighted. MCDA methods have been developed to aid in the essential managerial task of decision-making. According to the contingency approach, these methods must consider situational factors that can affect the results of the decision-making process. As an MCDA method, AHP was structured to support the formulation and analysis of decisions. With this method, it is possible to break complex problems into components according to a given hierarchy, which facilitates the analysis and solution of the problem [
10]. The application of AHP can be summarized in a few steps, including hierarchy construction, pairwise comparison, consistency verification, and results interpretation [
82]. AHP applications are presented by [
83].
One of the justifications for choosing AHP is that it has been a leading MCDA method for decades [
80,
84,
85]. Another justification is that it is one of the most widely used MCDA methods in the context of the CE [
86]. When contrasted with other approaches for ranking and choice problems [
87], AHP brings a logically structured based on model that enables pairwise comparisons and consistency checks, which is particularly significant when using expert judgments. Although techniques like TOPSIS (Technique for Order Preference by Similarity to Ideal Solution) and ELECTRE (ELimination and Choice Expressing Reality) are useful in ranking alternatives, they often require precise quantitative input or equalization techniques that may suggest bias. AHP, alternatively, ensures qualitative evaluation and enhances transparency in weighting and ranking, suitable for decision problems involving sustainability and circularity [
88,
89].
Despite this, the integration of AHP with a risk matrix is not a novel approach and has been applied in several prior studies [
49,
90]. However, our rationale for selecting standard AHP over more advanced methods such as fuzzy AHP or hybrid MCDA models lies in the clarity, transparency, and applicability of the traditional AHP framework in the context of the present study. The use of standard AHP allows for a consistent, reproducible, and practitioner-friendly structure that is especially relevant when communicating results to stakeholders with limited technical background.
While fuzzy AHP provides enhanced capability to handle uncertainty in subjective judgments [
91,
92], it introduces additional complexity using fuzzy numbers and membership functions, which may compromise interpretability. In contrast, the standard AHP—when supported by a rigorous consistency analysis—offers sufficient robustness for modeling expert preferences in structured decision contexts, such as the prioritization of circularity criteria under defined risk dimensions.
Moreover, this study integrates AHP with a risk-adjusted performance matrix, which enhances the analytical richness by incorporating contextual risk factors into the prioritization process. This approach, while methodologically established, remains effective and aligns with the applied objectives of this research, focusing on practical implementation rather than methodological novelty. Finally, it is recognized that the use of fuzzy AHP or other hybrid models could offer added value in contexts involving greater ambiguity or heterogeneous expert opinions, and this is suggested as a promising direction for future research.
Following the AHP ranking, suppliers undergo a risk assessment based on a risk matrix, which evaluates probability versus impact for key risks. These include financial risks (e.g., bankruptcy and economic instability), environmental risks (e.g., regulatory non-compliance and low material traceability), and operational risks (e.g., delays and insufficient production capacity).
Next, AHP results are integrated with the risk matrix, incorporating an adjustment based on risk Equation (4). Additionally, a threshold for acceptable risk is established, defining the maximum allowable risk score. Suppliers exceeding this limit are disqualified.
where
The proposed model integrates
AHP for selecting circular suppliers based on multiple criteria.
Risk matrix for evaluating threats and uncertainties.
AHP-risk integration to support decision-making and mitigate uncertainty.
By combining AHP with a well-designed risk adjustment mechanism, this methodology advances traditional approaches to supplier selection by embedding considerations of uncertainty and resilience into the decision-making process. Although earlier studies have utilized AHP for evaluating suppliers, the proposed method enhances this process by systematically revising rankings based on exposure to risks. This ensures that the final selection of suppliers adheres to both CE principles and effective risk management practices. This integrated approach strengthens decision-making, providing a robust framework that surpasses conventional applications of MCDA in fostering supply chain sustainability and waste reduction.
To avoid redundancy in the evaluation process, although the same group of experts participated in both the performance assessment and the risk evaluation, the process was carefully structured in sequential phases. Experts were instructed to focus solely on performance-related criteria during the AHP-based prioritization and to consider risk dimensions (operational, financial, and environmental) only in the final stage. This approach followed the company’s internal policy to standardize evaluations and reduce subjectivity in the integration of risk into decision-making.
4. A Decision Model for Circular Supplier Selection
Several case studies have demonstrated the value of applying MCDA methods to supplier selection problems in real-world CE contexts. For instance, ref. [
93,
94] evaluates green suppliers, while [
15,
95,
96] incorporated sustainability into supplier selection. These applications highlight the importance of adapting decision models to sustainability goals.
This research examines a Fortune 500 company recognized as one of the world’s leading chemical producers and a major supplier of crop protection products in Latin America. The company operates across five key global regions: Europe, North America, South America, Asia, and the Pacific, focusing on research, development, manufacturing, and supply of chemical solutions for various markets. Its Latin American headquarters are located in Brazil, a region considered strategic due to its large agricultural market. The company operates more than ten production sites and several logistics hubs in the region, supporting efficient distribution. It also emphasizes sustainable supply chain practices and environmental risk mitigation across its operations.
In this context, sustainable supply chain management has become a strategic priority for the company, with an emphasis on integrated and self-optimizing systems that enhance resource efficiency and waste reduction. The company prioritizes minimizing waste generation through initiatives that promote material reuse, recycling, and circularity.
The research assessed experts and supply chain managers’ alignment with CE principles. Participants were consultants with over 15 years of experience in supply chain and sustainability, working in industrial sectors like chemical manufacturing across the Americas. All experts hold, at least, a bachelor’s degree in Business Administration (BA), Chemistry (C), Environmental Science (EI), or Industrial Engineering (IE), which is detailed in
Table 1.
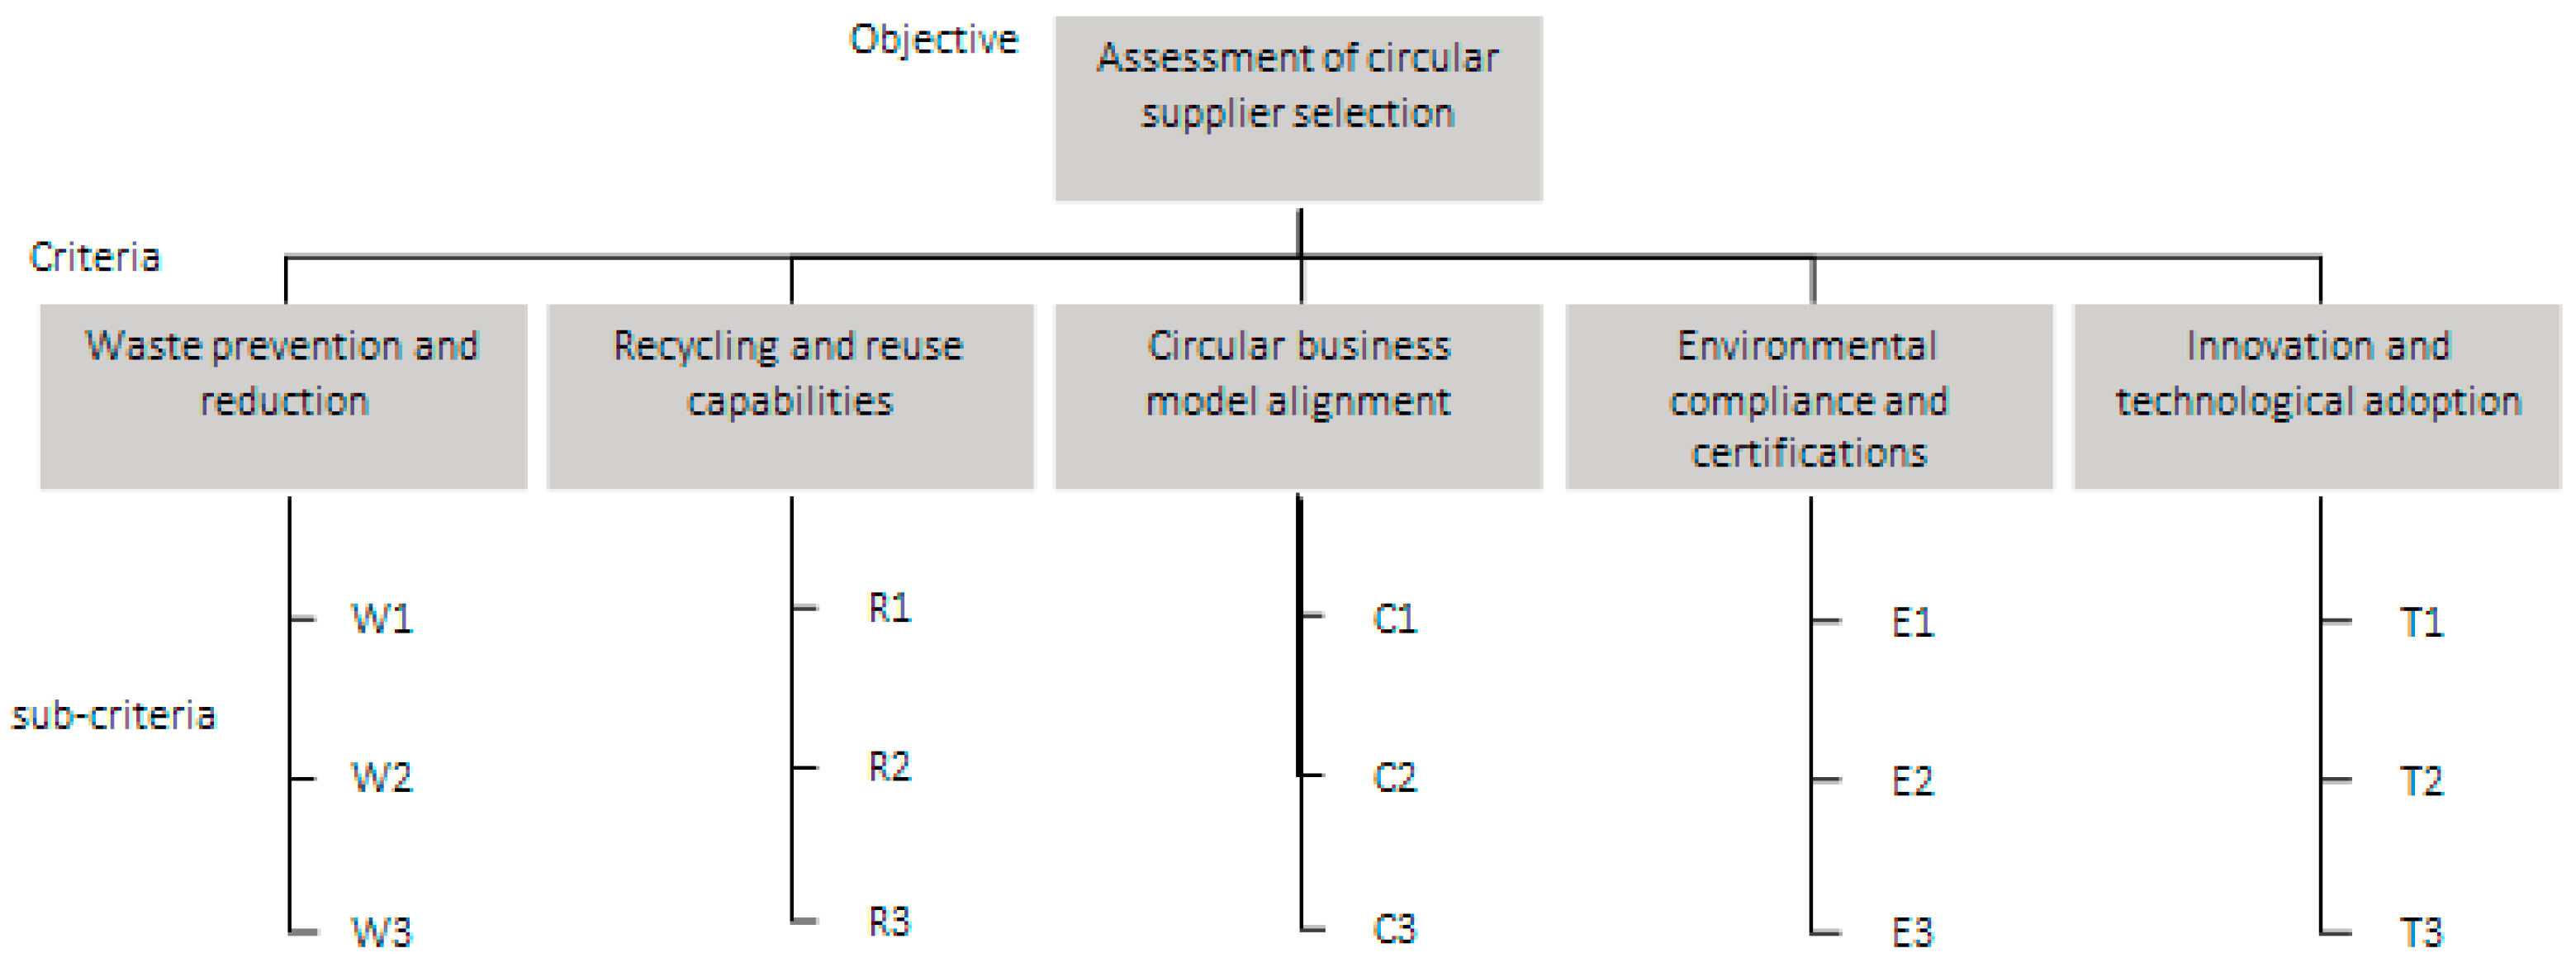
The objective of the proposed model is to select suppliers. This process was carried out in a single, focused, in-person session, enabling direct interaction and collaborative engagement. At the beginning of the session, the AHP stages were explained, and key concepts were translated for the experts. This interaction helped refine the selection process, ensuring a well-defined set of criteria and sub-criteria. Based on their discussion, the experts proposed the criteria and sub-criteria by integrating insights from relevant literature (
Section 2.3).
This collaborative effort ensured that theoretical foundations and practical insights were effectively integrated, making the criteria both comprehensive and contextually relevant. The identified supplier selection criteria reflect key aspects of circularity and sustainability, aligning with SDG’s Target 2.5 by emphasizing waste prevention, recycling, and resource optimization. The criteria were selected from the literature review in
Section 2.3, including waste prevention and reduction, recycling and reuse capabilities, circular business model alignment, environmental compliance and certifications, innovation, and technological adoption. The sub-criteria were structured as follows (
Table 2):
In this model, suppliers A, B, C, D, and E represent the alternatives to be evaluated. The decision-making process aims to identify the supplier that best aligns with the established circularity criteria and contributes to waste reduction and resource efficiency (
Figure 2).
In this stage of the research, the pairwise comparisons among the criteria were assigned through consensus among the experts. Concerning waste prevention and reduction, recycling and reuse capabilities, circular business model alignment, environmental compliance and certifications, innovation, and technological adoption criteria, the experts agreed that a balance among them is necessary for the supplier selection to be successful. Therefore, they assigned a weight of 0.200 to each criterion, ensuring that the total sum of weights amounts to 100%. The pairwise comparisons among the sub-criteria were assigned through consensus among the experts. Local priorities for all attributes can be determined by normalizing the right eigenvector of the combined comparison matrices. Once judgments for criteria and sub-criteria were made, the overall priorities were computed by multiplying each criterion’s priority values by the sub-criteria weights. The local and overall priorities of the criteria are presented in
Table 3.
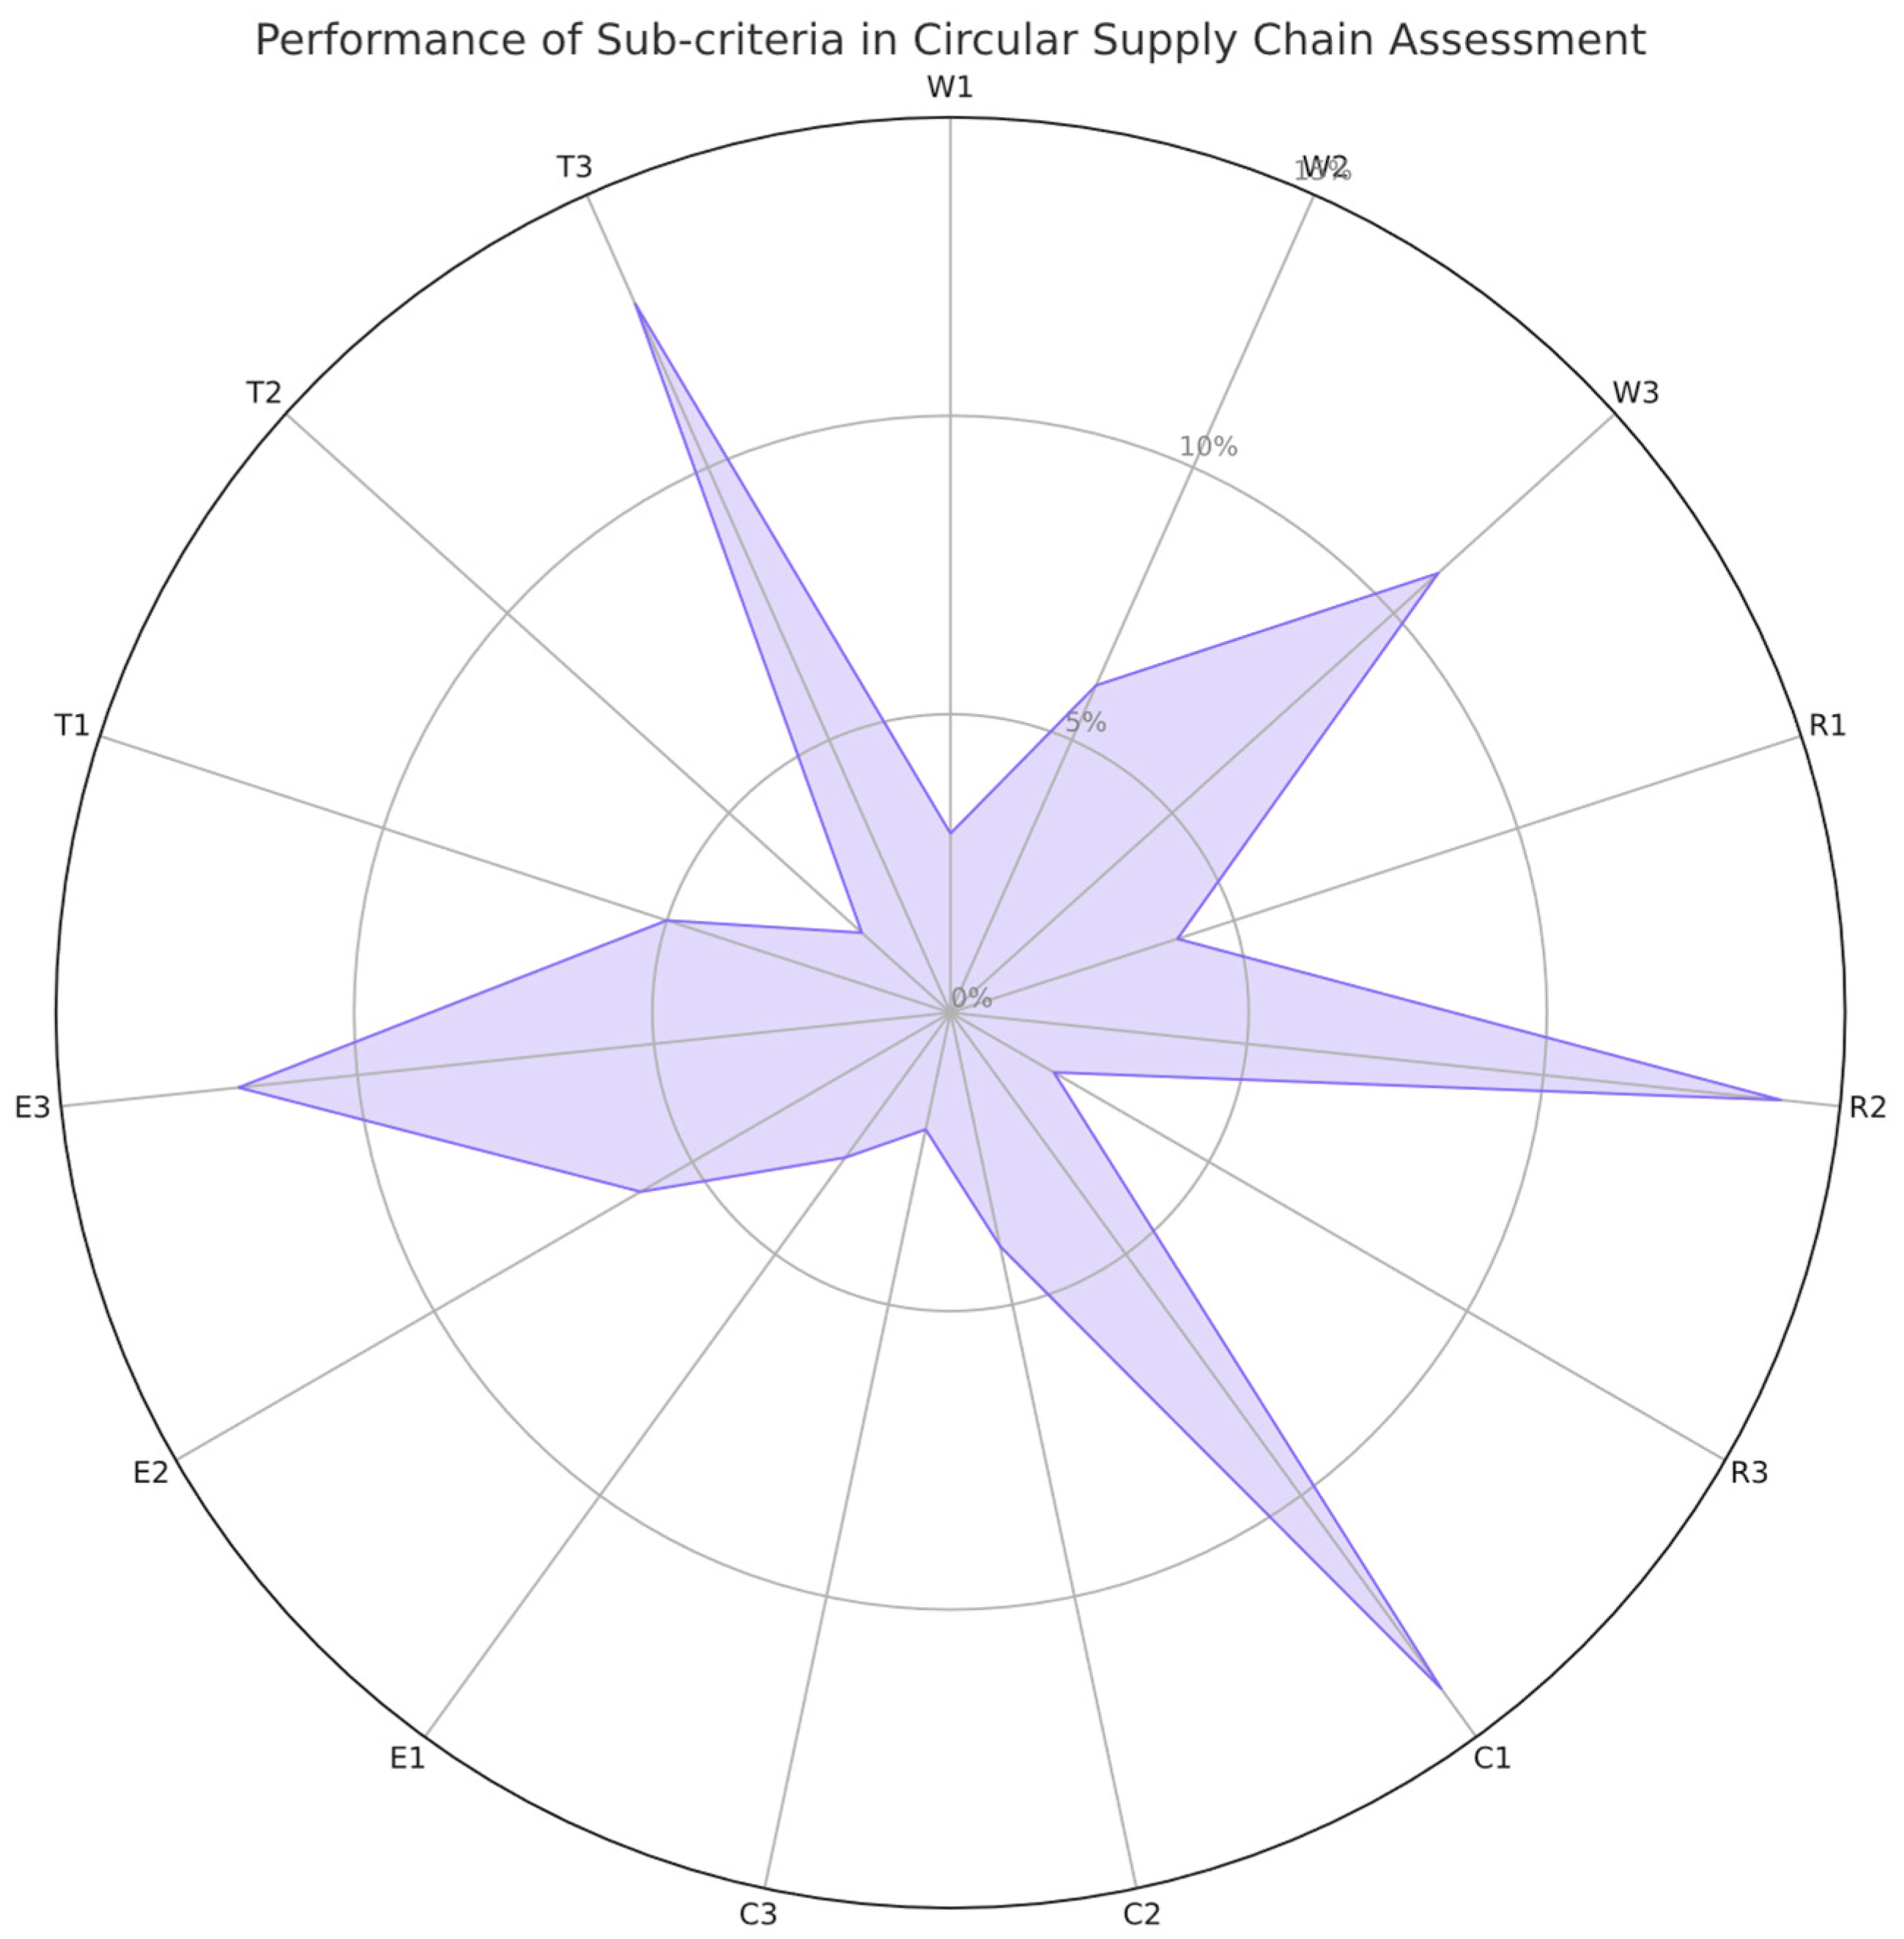
The overall priorities for sub-criteria R2 (End-of-life product management) are highly prominent in the category, reaching 14%, associated with the recycling and reuse capabilities. C1 (CLSC integration) demonstrates a significantly greater contribution, reaching 14%, in circular business model alignment. T3 (Sustainable material substitutions) presents the greatest contributions, reaching 13%, in Innovation, and technological adoption. E3 (Transparent reporting on circularity metrics) presents the greatest contribution, reaching 12%, in environmental compliance and certifications. W3 (Process optimization and waste reduction) presents the greatest contribution, reaching 11%, in waste prevention and reduction. However, its contribution is low in W1 (Eco-design practices) and W2 (Material efficiency) in waste prevention and reduction, R1 (Use of recycled or recovered materials) and R3 Reverse logistics capabilities in Recycling and reuse capabilities, C2 (Industrial symbiosis participation) and C3 (Product-as-a-service) in Circular business model alignment, E1 (Regulatory adherence) and E2 (Third-party sustainability certifications) in Environmental compliance and certifications, T1 (Advanced recycling technologies) and T2 (Digitalization for circularity) in Innovation, and technological adoption. The comparison of the sub-criteria can be observed in
Figure 3.
An advantage of using ratings is the opportunity to avoid biases. When comparing alternatives pairwise (relative measurement), certain historical trends need to be considered. Comparing alternatives against a standard (absolute measurement) appears to provide a less partial or more unbiased measurement. The level of performance corresponding to the attributes in linguistic scales varies from ‘weak’ to ‘excellent’. The adoption of absolute measurement is due to its potential to significantly reduce conflicts in decision-making processes [
81]. In this research, performance levels were used, and alternatives were compared individually to a scale, such as excellent (1.000), very good (0.830), between good and very good (0.670), good (0.500), between weak and good (0.250), and weak [
98]. The overall priorities of the alternatives are presented in
Table 4.
Following the development of the decision model for CSS using the risk matrix (
Table 5). The risk matrix (
Table 5) was established based on expert insights, considering probability and impact. The risk matrix is the result of the product of probability and impact. The following range was considered for probability and impact: very low = 1 to very high = 5.
The risk categories—financial, environmental, and operational—were defined to capture key challenges in CSS. Environmental risks encompass issues such as low material traceability and regulatory non-compliance, which directly impact circularity. Operational risks include barriers such as delays and insufficient production capacity, as well as challenges in reverse logistics and closed-loop supply chain integration.
The numerical parameters reflect a team consensus approach, ensuring a balanced interpretation of risk severity in the decision model. For each alternative and risk category, a raw risk score was calculated by multiplying the assigned probability and impact, calculated by Equation (5).
where
i represents the alternative and
j the risk categories financial, environmental, and operational. These raw scores were then normalized by dividing by the maximum possible score (25) to ensure comparability calculated by Equation (6).
For instance, replacing values in Equation (5), for Alternative A (financial risks), we obtain a raw risk score of 3 × 2 = 6. Similarly, by applying the values in Equation (6), the normalized risk score yields 6/25 = 0.24. This structured risk assessment supports a comprehensive evaluation, aligning with the principles of CSC (
Table 6).
After obtaining the normalized score, the penalty factor α = 0.1 is adopted to adjust the risk impact. For this study, the value α = 0.1 was selected based on expert judgment during the assessment process. Replacing values in Equation (4), for Alternative A we have the adjusted score = 0.710 × (1 − 0.1 × 0.32) = 0.688. The same procedure was performed for the other alternatives. The risks integration with AHP and the adjusted score for alternatives is presented in
Table 7.
Initially, the AHP results (overall) were used to rank the alternatives. However, after incorporating the adjusted score, noticeable shifts in rankings occurred. While alternative D retained its leading position, other alternatives—A, E, B, and C—experienced significant changes. These adjustments stem from the risk factors associated with each alternative, emphasizing their influence on the final ranking. By integrating risk considerations, the evaluation process provides a more nuanced prioritization, ensuring that decision-making accounts for potential uncertainties. This underscores the importance of applying a penalty factor to refine the assessment of risk impact, leading to more informed and resilient supplier selection decisions. Moreover, this approach supports a sustainable supply chain by encouraging the selection of suppliers that minimize waste and enhance resource efficiency, reinforcing the CE principles within the CSC.
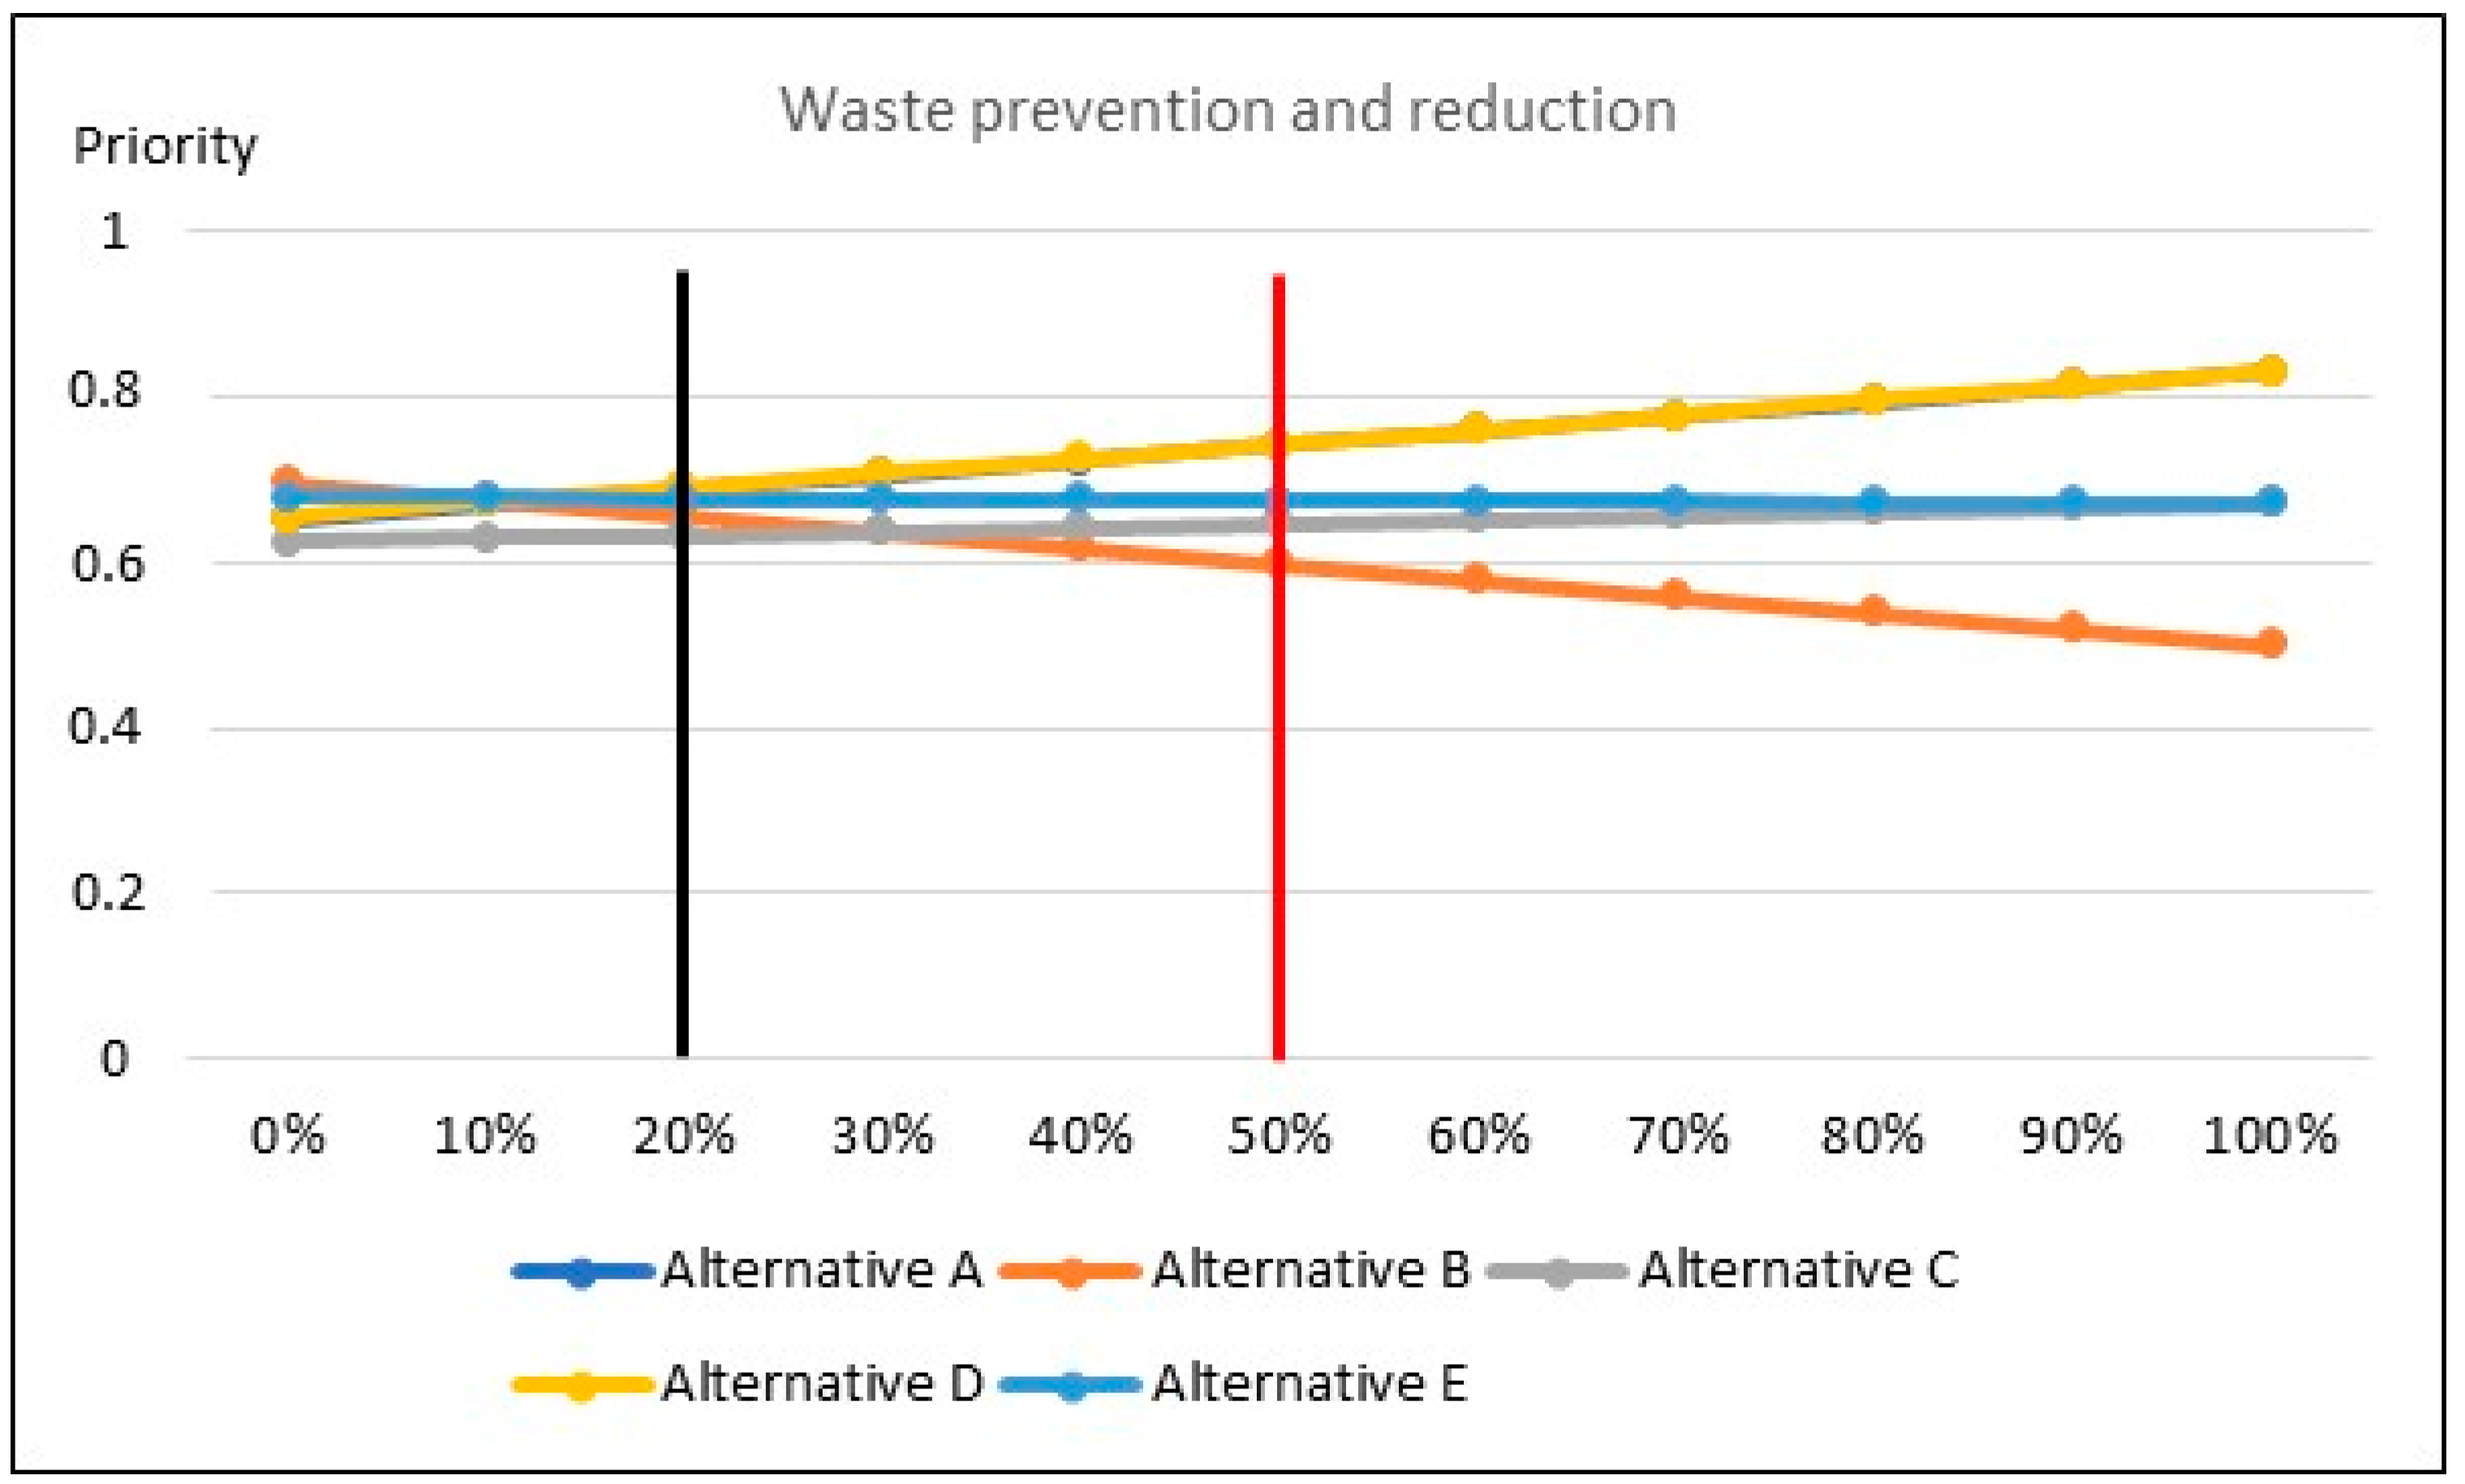
A sensitivity analysis was conducted to evaluate the robustness of the decision model. For this purpose, the criterion waste prevention and reduction was selected due to its recognized relevance in CSC. While the choice of this criterion is illustrative, it allows us to observe how variations in its weight—from the original 20% up to 50%—affect the final scores of the alternatives. The corresponding results are shown in
Figure 4.
Figure 4 illustrates the impact of increasing the weight of the criterion waste prevention and reduction from 20% to 50%. The black vertical line represents the original weight, while the red line indicates the adjusted weight. Notably, the ranking of alternative D remained unchanged, demonstrating its robustness under the weight variation. Meanwhile, alternative C shifted positions with alternative B, indicating a sensitivity to this criterion. Alternatives A and E maintained their original positions, suggesting moderate resilience to this change. These results should not be broadly generalized, as they are based on a specific case context. Future research could extend the findings by applying the model to different organizations or sectors, thereby enhancing its external validity.
5. Discussion
The proposed model for supplier selection requires a structured approach that prioritizes circularity and waste reduction. It emphasizes the need for suppliers to adopt practices that minimize waste through material recovery, closed-loop systems, and sustainable production methods.
The criteria used in this study include waste prevention and reduction, recycling and reuse capabilities, circular business model alignment, environmental compliance and certifications, innovation, and technological adoption. Additionally, 15 relevant sub-criteria were identified and integrated into the AHP calculation, enabling the evaluation of the five alternatives defined in the model.
Moreover, an important advancement of the proposed model was the integration of risk assessment into the decision-making process. The model considers financial, environmental, and operational risk categories, capturing key challenges in CSS. This addition enhances the robustness of the model, making it applicable to diverse industry contexts and particularly valuable for CSC practitioners and researchers.
From a theoretical perspective, this research aligns with recent studies such as [
99,
100], which addressed CE and supplier selection. This work makes a significant contribution to the study of CSS by addressing the gap in MCDA methods that explicitly incorporate risk-adjusted prioritization. While earlier studies have employed AHP for supplier evaluation, they often overlook the dynamic risks that can influence decisions in CSC. By introducing a structured mechanism for risk adjustment, this study enhances the applicability of AHP in uncertain environments, offering a more comprehensive decision-making model that integrates sustainability objectives with operational resilience. Additionally, by aligning supplier selection criteria with the SDG’s Target 12.5, this research underscores the importance of structured decision frameworks in advancing circularity. It presents an innovative approach that moves beyond traditional economic and environmental considerations, systematically incorporating risk as a central factor in CSC management.
From a managerial perspective, the proposed model offers a methodical and data-centric approach to supplier selection, enabling decision-makers to integrate CE principles into CSC strategies. This integration not only enhances supply chain sustainability but also mitigates risks associated with regulatory compliance, environmental impact, and resource scarcity. Furthermore, incorporating risk assessment fortifies the decision-making process, providing managers with a comprehensive framework to balance sustainability goals with operational and financial considerations. The model’s versatility allows its application across various industries, aiding organizations in transitioning towards more responsible and resilient supply chains.
While MCDA methods such as AHP, TOPSIS, and Multi-Criteria Optimization and Compromise Solution (VIKOR) have been widely used for supplier evaluation, their application in circular contexts remains limited in addressing core dimensions such as systemic circularity, risk integration, and real-world applicability [
101,
102,
103]. Unlike conventional approaches that often include sustainability criteria through indirect or auxiliary means, the present model embeds circularity-driven priorities—such as waste prevention capabilities, material reuse strategies, and environmental compliance—into the core decision structure. Moreover, while prior studies frequently assume deterministic settings or rely solely on expert judgment, this study integrates a structured risk-adjusted matrix that systematically accounts for exposure to financial, environmental, and operational risks, thereby increasing analytical robustness and contextual relevance [
79]. This combination of theoretically grounded circularity dimensions with a transparent and practitioner-oriented decision framework enhances both academic insight and decision-making effectiveness in supplier evaluation for circular supply networks.


