1. Introduction
Sustainability has emerged as a critical pillar in supply chain management, compelling the industrial sector to continuously enhance its processes in order to mitigate environmental impacts (EIs) [
1]. This increasing emphasis on sustainability can be attributed to various factors, including the tightening of regulatory frameworks, heightened pressure for the adoption of more responsible practices, and the necessity to optimize resource management [
2].
Sustainable supply chain management and network design entail the integration of economic, environmental, and social objectives into a company’s daily operations, alongside the optimization of material and product flows across the network’s links [
3]. This approach not only ensures compliance with environmental standards and national and international regulations, but also facilitates the achievement of long-term economic objectives [
4]. Thus, operational efficiency is enhanced, clean technologies are adopted, waste is minimized, and the company’s brand image is strengthened in an increasingly sustainability-conscious market [
5].
In this context, industries encounter significant challenges in balancing profitability with sustainability, a dilemma that is more complex in developing countries, such as Ecuador [
6]. The dairy industry exemplifies these complexities, with a supply chain that is heavily reliant on natural resources, subject to seasonal production fluctuations, and constrained by the perishability of its products. In addition to high production costs and fluctuating demand, the sector faces increasing pressure to reduce greenhouse gas emissions [
7]. Other critical sustainability challenges include intensive energy and water consumption, the widespread use of plastic-based packaging, and limited adoption of environmentally friendly raw materials and inputs [
8]. These conditions underscore the urgency of integrating sustainable practices into supply chain design and operation.
Optimization models, due to their ability to handle multiple variables, serve as essential tools for integrating and enhancing sustainability considerations in supply chain network design [
9]. These models can provide robust data for decision-making by enabling the simulation, evaluation, and proposition of scenarios that address costs, resource utilization, and EIs [
10]. In particular, multi-objective optimization is becoming a key tool for balancing competing objectives, such as minimizing EIs while maximizing revenue [
11]. Among the various solution approaches for such models, the epsilon-constraint method is effective for generating a Pareto frontier, which offers decision-makers a set of optimal solutions that strike a balance between different objectives [
12]. Additionally, when modeling stochastic parameters such as demand or costs, approaches such as stochastic, robust, or fuzzy optimization are employed. These methods enable the simulation of more realistic supply chains, facilitating better adaptation to sustainability goals through improved management of variability and fluctuations in critical supply chain parameters [
13].
This research aims to develop a fuzzy optimization model for the sustainable design of a supply chain network. Two objective functions are formulated: one focused on minimizing costs, and the other on reducing EIs. To address the uncertainty inherent in the key supply chain parameters, such as demand and production costs, fuzzy numbers are employed, integrated with fuzzy mixed-integer linear programming techniques. The epsilon-constraint method is utilized to generate the Pareto frontier, illustrating the trade-offs between the two objectives. Additionally, life cycle assessment (LCA) is incorporated to quantify EIs during the production and distribution stages [
14]. The novelty of this research lies in the full integration of a comprehensive LCA—following the ISO 14040/14044 standard and including multiple impact categories—into a fuzzy optimization model. Most previous studies considered LCA separately or only included partial indicators such as climate change [
15]. Therefore, this approach represents a methodological advancement by embedding detailed LCA outcomes directly into the optimization process.
The model is characterized and validated using real data from a small-to-medium enterprise (SME) in the dairy industry in Ecuador. This combination of methods offers a robust framework for evaluating the interaction between economic and environmental factors, as well as a more holistic view of the consequences of these decisions on the operation of the supply chain [
16].
To facilitate understanding, the remainder of the research is organized as follows.
Section 2 provides a concise literature review on supply chain management and sustainable supply chain network design.
Section 3 outlines the methodology employed to achieve the study’s objectives. The development of the model, including its mathematical formulation and the LCA, is discussed in
Section 4.
Section 5 presents the key results derived from the model’s characterization. Finally,
Section 6 offers the conclusions drawn from the research.
2. Literature Review
2.1. Optimization Models for Supply Chain Network Design
Quantitative optimization models are extensively applied in supply chain network design due to their ability to provide critical insights for configuring and optimizing various components of the supply chain, including supplier selection, facility location, distribution center placement, route planning, and product flow management [
17,
18]. For instance, Ge et al. [
19] employed optimization models to identify optimal facility locations within the fresh produce supply chain. Similarly, Valizadeh et al. [
20] developed an optimization model for the vaccine supply chain during the COVID-19 pandemic, highlighting the practical applicability and effectiveness of these models.
In addressing the challenge of managing multiple conflicting optimization objectives in supply chain design, several studies have employed multi-objective programming. For instance, Ahmad et al. [
21] developed a multi-objective model aimed at optimizing the socioeconomic performance of a pharmaceutical supply chain network. Similarly, Rezaei et al. [
18] utilized a bi-objective optimization framework to design a fuel-efficient supply chain network in post-earthquake scenarios. Margolis et al. [
22] proposed a resilient supply network that minimizes costs while maximizing connectivity. These models provide supply chain managers with various configurations that optimize costs and enhance operational efficiency through an analysis of the trade-offs between competing objectives [
12,
23].
2.2. Sustainability in Supply Chain Management
The incorporation of sustainability into supply chain management has shown significant growth over the past two decades, driven by increasing regulatory and societal pressures to reduce EIs and enhance operational processes. Examples of studies adopting these practices include the integration of economic and social impact variables [
24], the use of environmental indicators [
25], the sustainable selection of suppliers [
26], the implementation of closed-loop systems [
27], and the application of circular economy principles [
28].
LCA is a powerful tool that supports the integration of sustainability into supply chains, which enables the identification of various EI categories and the critical points within the supply chain [
29]. The research by Waltho et al. [
30] demonstrates that quantifying EIs through LCA, using the Eco-indicator 99 database, is an effective approach for analyzing different sustainability scenarios. Similarly, Ferreira et al. [
7] emphasized the application of LCA in the dairy industry, highlighting its role in improving the sustainable management of supply chains.
2.3. Sustainable Supply Chain Networks Design
In the context of designing sustainable supply chain networks using optimization models, several studies have employed mixed-integer linear programming (MILP) with a multi-objective approach. Mohebalizadehgashti et al. [
31] applied MILP to design a green supply chain network for meat products, analyzing both economic and environmental factors by accounting for carbon emissions in transportation. Likewise, Mota et al. [
32] developed a MILP model, incorporating economic, social, and environmental variables derived from LCA. Kiani Mavi et al. [
33] proposed a multi-objective model for the sustainable network design of the tire industry, optimizing the total costs while considering the EIs associated with facility establishment, tire processing, and transportation. Moghadam et al. [
34] introduced a multi-objective optimization model for the supply chain network design of photovoltaic systems, focusing on minimizing costs and negative environmental effects while maximizing reliability. Additionally, Mele et al. [
35] developed a multi-objective model that explores various strategies for enhancing sustainability in the fuel supply chain, complemented by a parallel LCA to emphasize its importance in quantifying the EI of products.
In order to model more realistic characteristics in the design of supply chain networks, it is essential to account for the inherent uncertainty in the key parameters, such as demand, lead times, or costs [
36]. Addressing this added complexity requires the use of advanced approaches, such as stochastic, robust, or fuzzy optimization [
37]. Each of these techniques has advantages and limitations: stochastic models rely on the availability of precise probability distributions, which are often hard to obtain in real-world supply chains; robust models tend to produce conservative solutions that may not fully exploit cost-saving opportunities; and fuzzy optimization enables flexible modeling of uncertain or imprecise data [
38]. This is often achieved using fuzzy numbers (e.g., triangular or trapezoidal) rather than linguistic variables to represent parameters such as demand or cost within a range of plausible values [
29].
Fuzzy programming, as highlighted by Wu et al. [
13], is considered an effective approach in supply chain design due to its ability to handle uncertainty by representing parameters as fuzzy sets with membership functions that indicate the degree of truth of a value within the set. In the context of the dairy supply chain, uncertainty arises from multiple sources: variability in milk yield due to seasonal effects, fluctuations in customer demand, volatility in production and transportation costs, and limited data precision in resource availability [
39]. Fuzzy logic is especially well-suited for these challenges, as it allows for the integration of expert knowledge, manages vagueness in data, and supports nonlinear decision environments. In this study, fuzzy numbers are used to characterize uncertain parameters and are later defuzzified to obtain crisp values that are then solved via mixed-integer linear programming techniques.
Several studies serve as key references for this research. For example, [
40] developed a multi-objective mathematical model to configure a sustainable closed-loop supply chain network, considering uncertainty in transportation costs and demand. Talaei et al. [
41] explored a facility location model for a green supply chain network, employing a robust fuzzy programming approach to examine the effects of uncertainties in costs and demand rates. Additionally, Rahbari et al. [
38] investigated the supply chain of canned foods under uncertain conditions, focusing on sustainability concepts through a location–inventory–routing problem.
2.4. Sustainability in the Dairy Supply Chain
The dairy industry supply chain is highly complex, encompassing multiple stages such as production farms, collection centers, industrial processing facilities, distribution networks, and final delivery to customers. Its primary product, milk, undergoes processes that generate significant EIs [
42], particularly through the emission of greenhouse gases and the high consumption of water, energy, and natural resources. These environmental challenges have prompted the growing application of quantitative methods to model various performance scenarios, enabling the adoption of more sustainable practices across the entire supply chain.
Several studies exemplify the application of sustainability-focused research in supply chains. For instance, Babaee Tirkolaee et al. [
43] utilized fuzzy programming to optimize the supply chain of perishable goods, ensuring both sustainability and operational efficiency. Zarei-Kordshouli et al. [
44] investigated the design of a sustainable supply chain for dairy products, proposing a decision-making framework where resilience plays a key role in managing demand fluctuations. Similarly, [
7] underscored the utility of LCA in the dairy sector, noting that energy and water consumption during the production phase are major contributors to the EIs of dairy products.
The reviewed literature reveals ongoing research related to this study, addressing topics such as optimization, LCA, supply chain network design, and the integration of sustainability strategies into these networks. These studies consistently emphasize the necessity of green supply chains to mitigate the EIs of logistics activities, with comprehensive methodologies such as LCA. Additionally, the incorporation of fuzzy variables in network design, while increasing complexity, is recognized as an effective approach for managing uncertainty. However, it is apparent that in-depth studies on the integration of LCA indicators into the design of sustainable supply chain networks, particularly in sectors such as the dairy industry in developing countries, such as Ecuador, remain limited.
Thus, this research aims to contribute to the development of an agile and adaptable supply chain—qualities that are particularly crucial in the food industry, where swift responses to market fluctuations are essential for maintaining sustainable and competitive operations.
3. Methodology
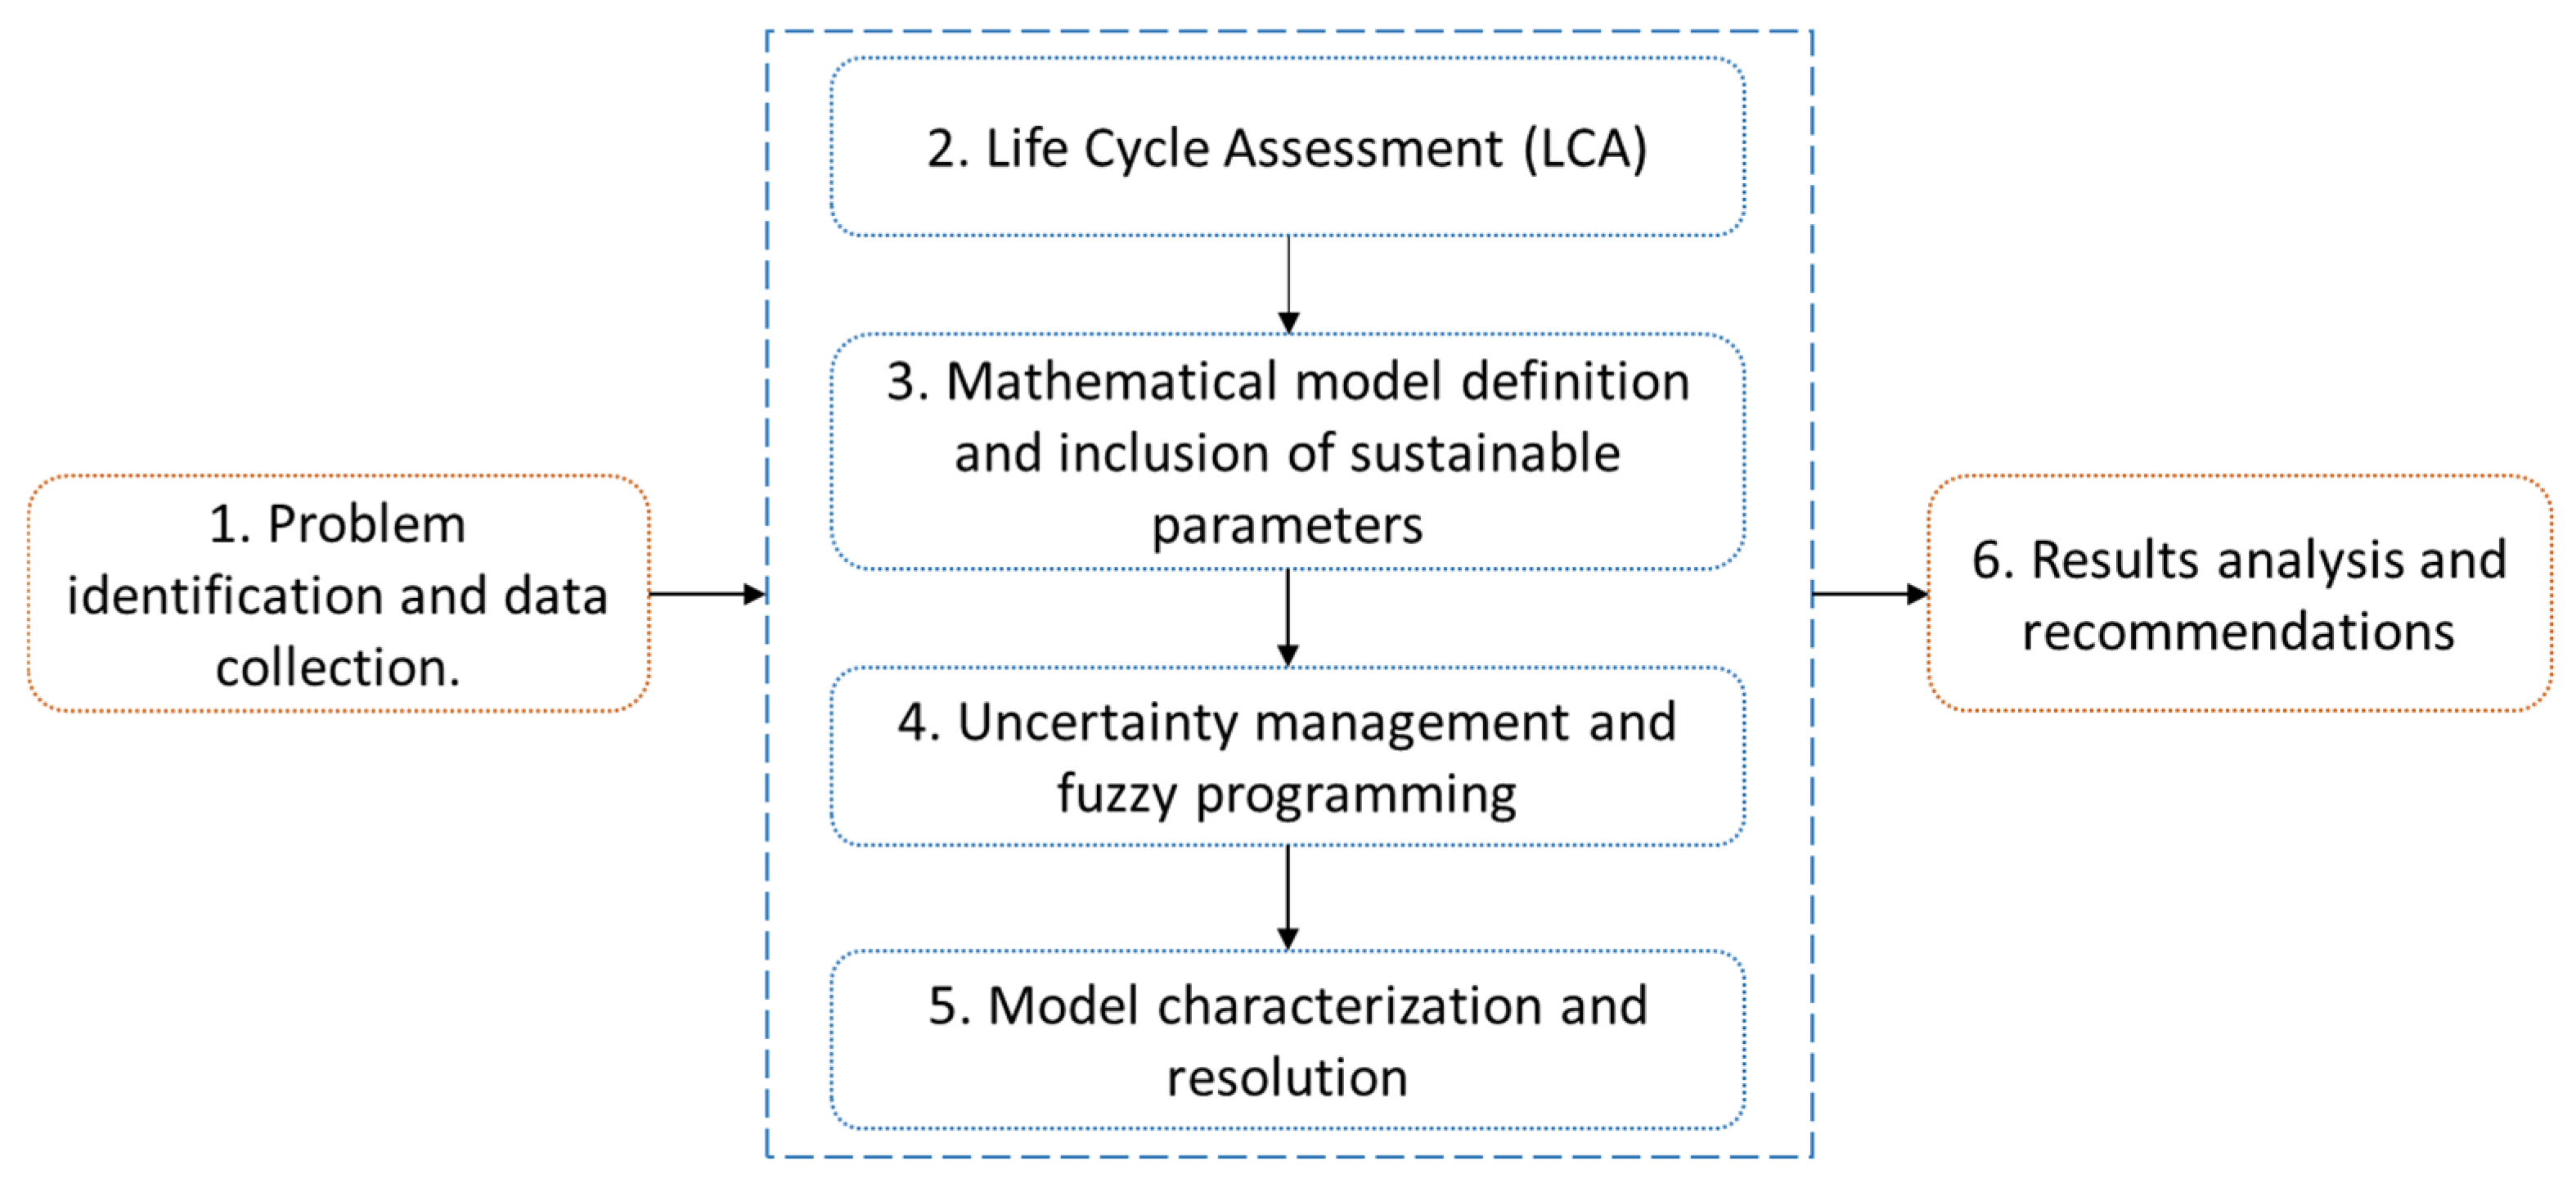
The methodology for developing the optimization model for the sustainable design of a dairy supply chain network is structured into six macro-stages, as illustrated in
Figure 1.
(1) Problem identification and data collection. The initial phase defines the scope of the optimization problem, identifying the main supply chain components across its three tiers: factories, collection centers, and customers. Key products, facility characteristics, transportation features, and underlying assumptions are established. Data were collected through direct observations, surveys, and interviews with staff from production, storage, and distribution operations of a dairy SME in Ecuador. Historical records over a five-year period were also reviewed.
To address data gaps, industry averages and proxy values from similar Ecuadorian dairy SMEs were used. In cases of missing cost or resource data, conservative assumptions were made in consultation with company personnel. In addition, to evaluate the potential impact of these assumptions and ensure the robustness of the results, a sensitivity analysis was conducted and discussed in
Section 5.4.
(2) Life cycle analysis. The LCA methodology is employed in order to quantify the EIs associated with the products throughout the supply chain. This analysis follows the ISO 14040/44 standard and uses the ReCiPe 2016 method for categorization and evaluation. The results are structured into three main endpoint indicators: human health, ecosystem quality, and resource depletion. These indicators are calculated for the production, storage, and distribution stages based on data collected from the case study company and modeled using GaBi 10.5.1 software. The output of this stage serves as the foundation for incorporating sustainability into the optimization model.
(3) Definition of the mathematical model and integration of sustainability parameters. This phase involves the formulation of the baseline mixed-integer linear programming (MILP) model and the integration of sustainability indicators derived from the LCA. Two objective functions are defined: the first minimizes the total cost of the supply chain, and the second minimizes the aggregated EI. The environmental indicators obtained in the previous step are normalized and assigned as coefficients to the relevant decision variables (e.g., production and transportation).
The model also defines decision variables and constraints related to production capacity, storage, material flow balance, and customer demand satisfaction. The resulting model enables decision-makers to evaluate trade-offs between the economic and environmental objectives in the supply chain network design.
The summary of the step-by-step integration of the LCA outputs into the MILP model is presented in
Figure 2.
(4) Uncertainty management and fuzzy programming. Fuzzy programming is incorporated into the baseline optimization model to address the inherent uncertainty in two key supply chain parameters: demand and production costs. These parameters are represented as triangular fuzzy variables. The shape and parameters of the membership functions (minimum, most likely, and maximum values) were determined using a combination of historical data analysis and expert elicitation from the company’s production and sales managers. Specifically, demand variability was modeled using ±10% to ±15% deviations from the average forecast, while cost variability considered market fluctuations over the past two years. Defuzzification was performed using the simple average method to obtain crisp values. Further technical details, including mathematical formulations, fuzzification and defuzzification procedures, and their integration into the optimization model, are provided in
Section 4.4.
(5) Model characterization and solution. To validate the developed bi-objective fuzzy model, this phase involves its characterization using real data from a dairy SME in Ecuador. The model is solved using the epsilon-constraint method, which generates a set of optimal solutions along the Pareto frontier by systematically varying the epsilon value.
(6) Results analysis and recommendations. In the final phase, the results obtained from Phase 5 are analyzed, evaluating the impact of various supply chain configurations and examining the trade-offs between cost and environmental sustainability. Based on these findings, recommendations are provided to enhance sustainability and support informed decision-making in the design of the supply chain network.
4. Model Development
This section addresses the first four phases outlined in the methodology, covering the process from problem definition to the incorporation of uncertainty into the baseline model.
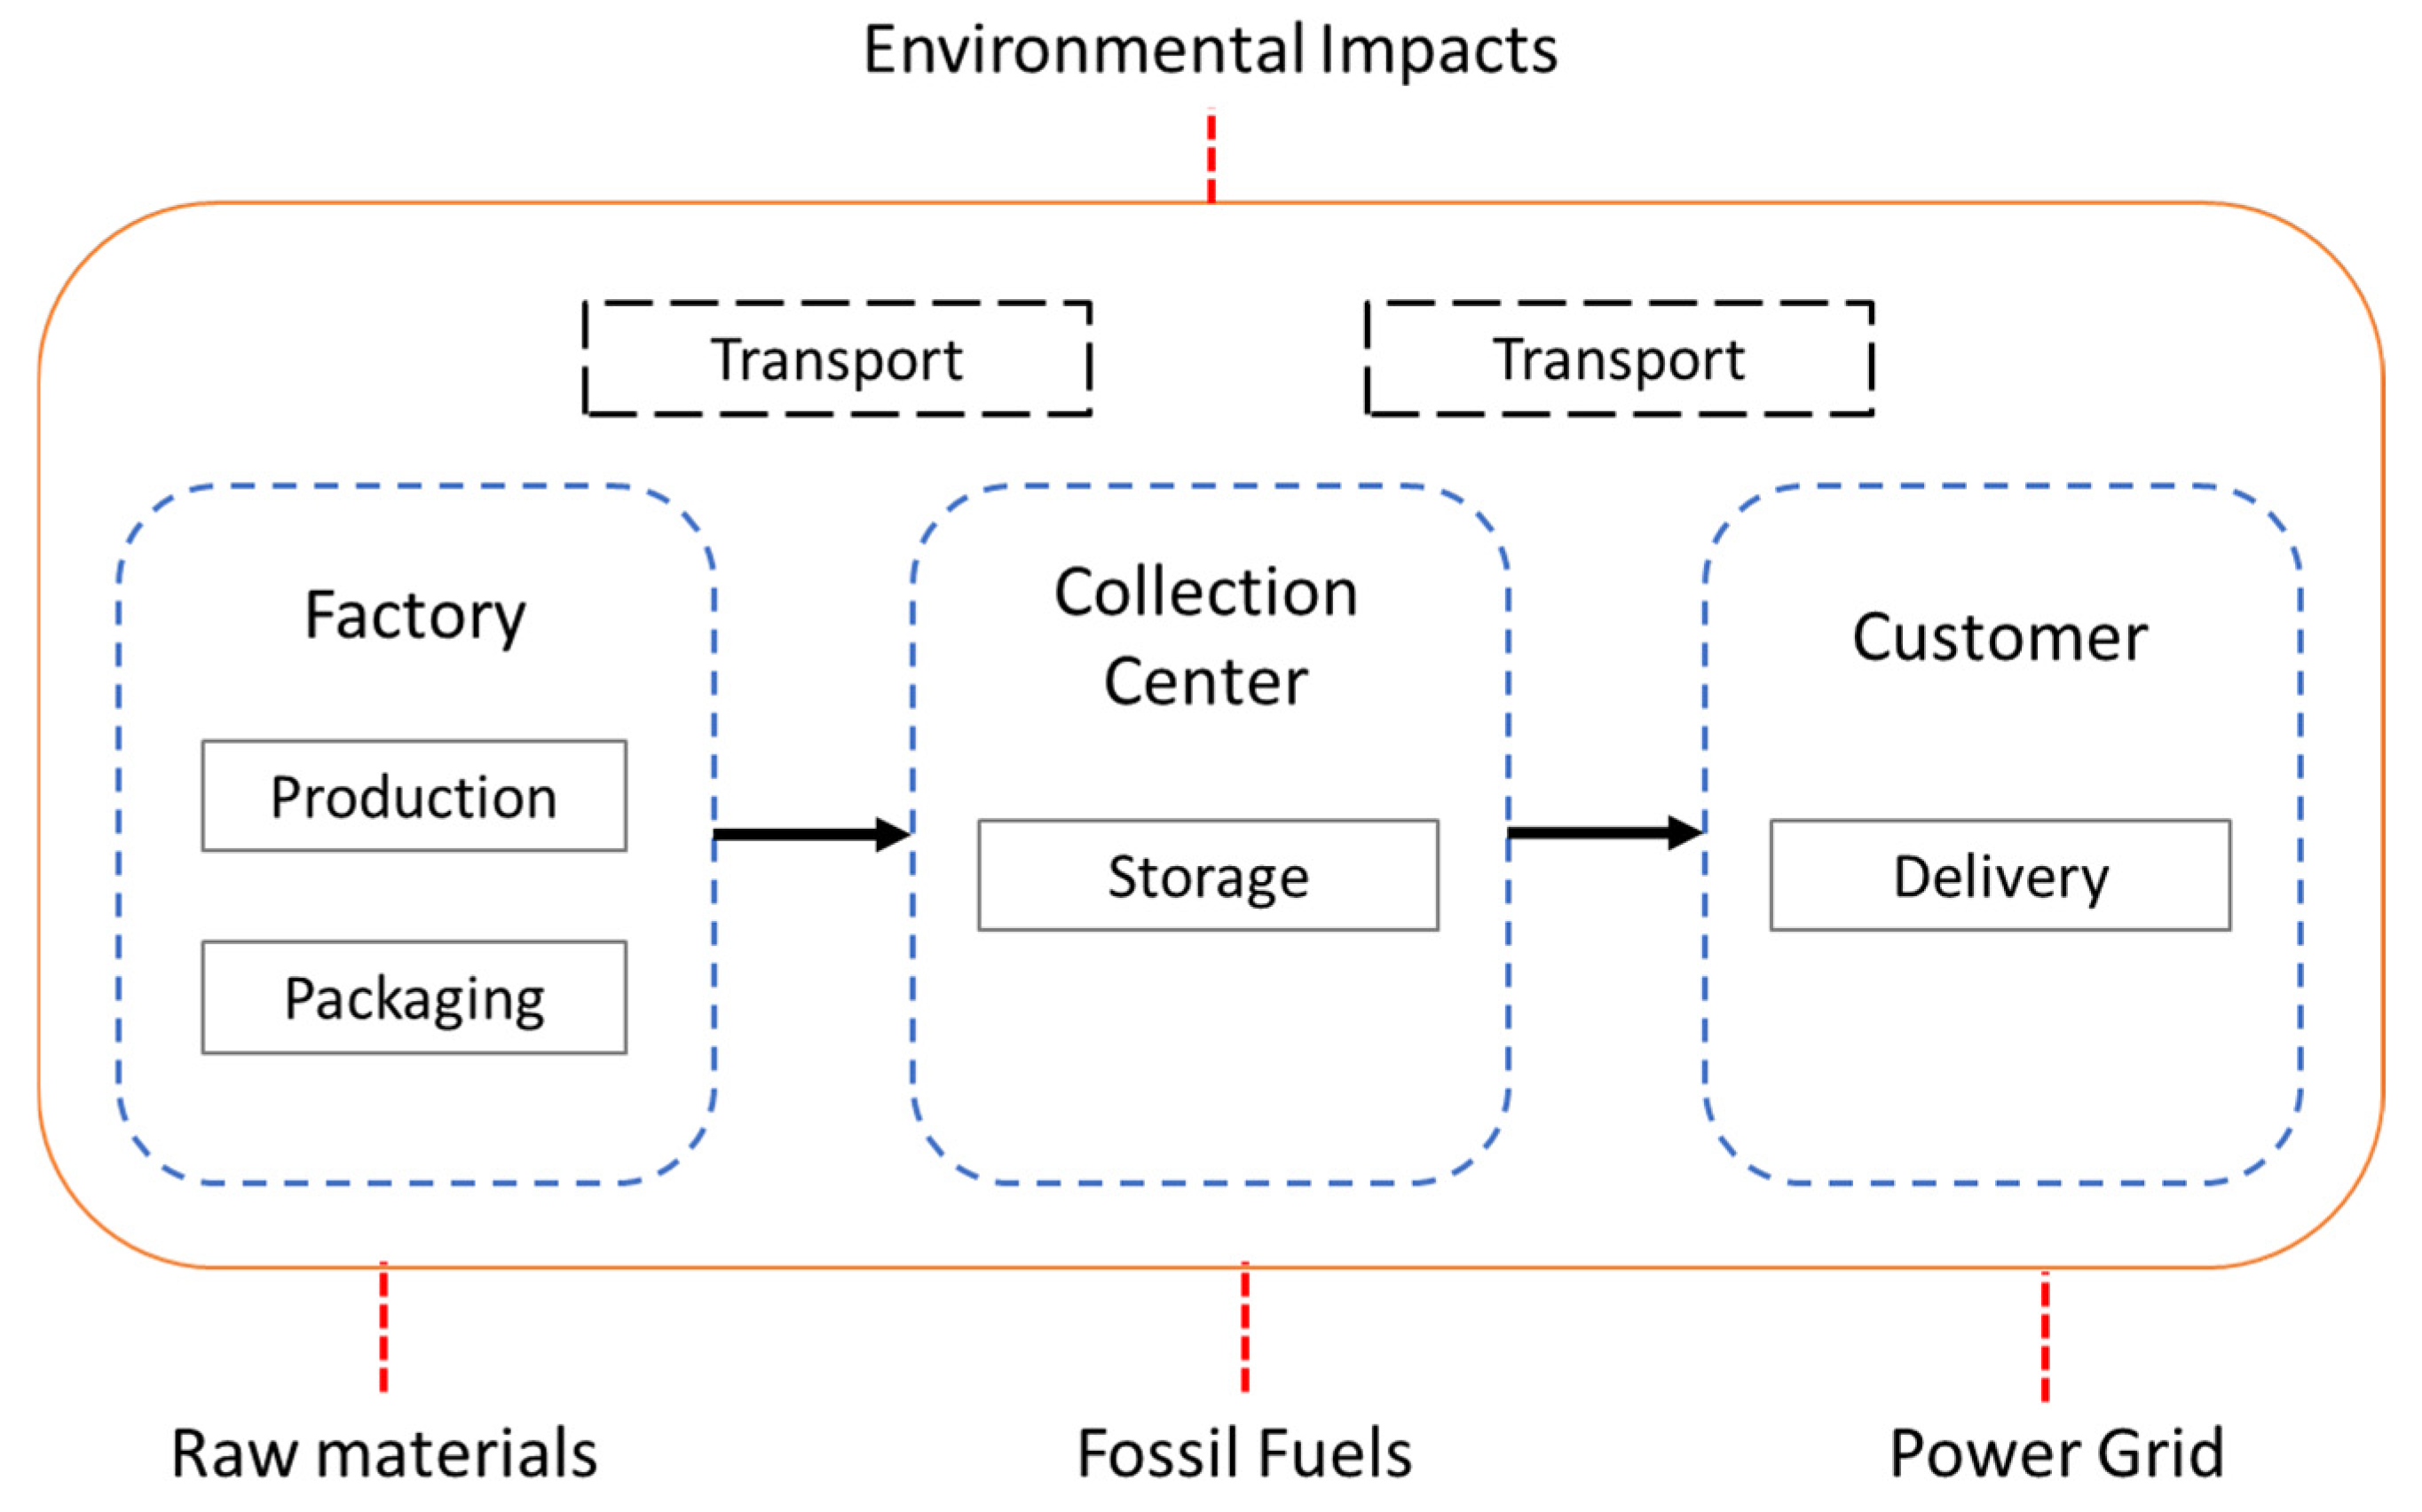
4.1. Problem Identification and Data Collection
The optimization model is developed to support the design of a sustainable supply chain network, characterized by a unidirectional flow of multiple products through three tiers: factories, collection centers, and customers (see
Figure 3).
The network’s characteristics and the assumptions underlying the model are outlined as follows:
Facility and customer locations are fixed.
Each facility operates within a defined capacity limit, applicable to both production and storage.
Different products or items are manufactured that flow through the supply chain network.
The EI depends on both the production process of the item and the specific facility where it is produced.
A single mode of transportation is employed across the network, using trucks with a capacity of 10 t and focusing on forward logistics to deliver products throughout the supply chain.
Products can only be delivered to customers from collection and distribution centers, not directly from factories.
Data inputs were derived from operational records of the case study company, including production rates, storage limits, transport distances, and emission data. These were structured to inform both the LCA and the mathematical model formulation.
4.2. Life Cycle Assesment
The LCA was conducted based on the modeled supply chain, adhering to the steps outlined in the ISO 14040/44 standard [
45], which include the following:
(a) Goal and scope definition. Given the significance of ultra-high temperature (UHT) whole milk for the case study company, two of its commercial presentations were selected as units of analysis: a 1 L Tetra Pak cardboard container, and a 900 mL package in a polyethylene container. The functional unit of the study was defined as “one packaged unit of UHT milk delivered to the final customer.” This allowed for a fair comparison between the two product types across all the evaluated environmental dimensions.
The system boundaries extend from the production stage at the factory through packaging, internal storage, and forward transportation up to the reception of the product by the final customer. The system excludes upstream processes such as raw milk production at farms and downstream activities such as final disposal of packaging waste. A diagram illustrating these system boundaries and included processes is presented in
Figure 4.
(b) Life cycle inventory analysis. Primary data collected in
Section 4.1 were supplemented with detailed information on materials, machinery, energy, and resource use per unit of analysis. Transportation characteristics were specified, including truck type, load capacity, and distance across each arch in the network.
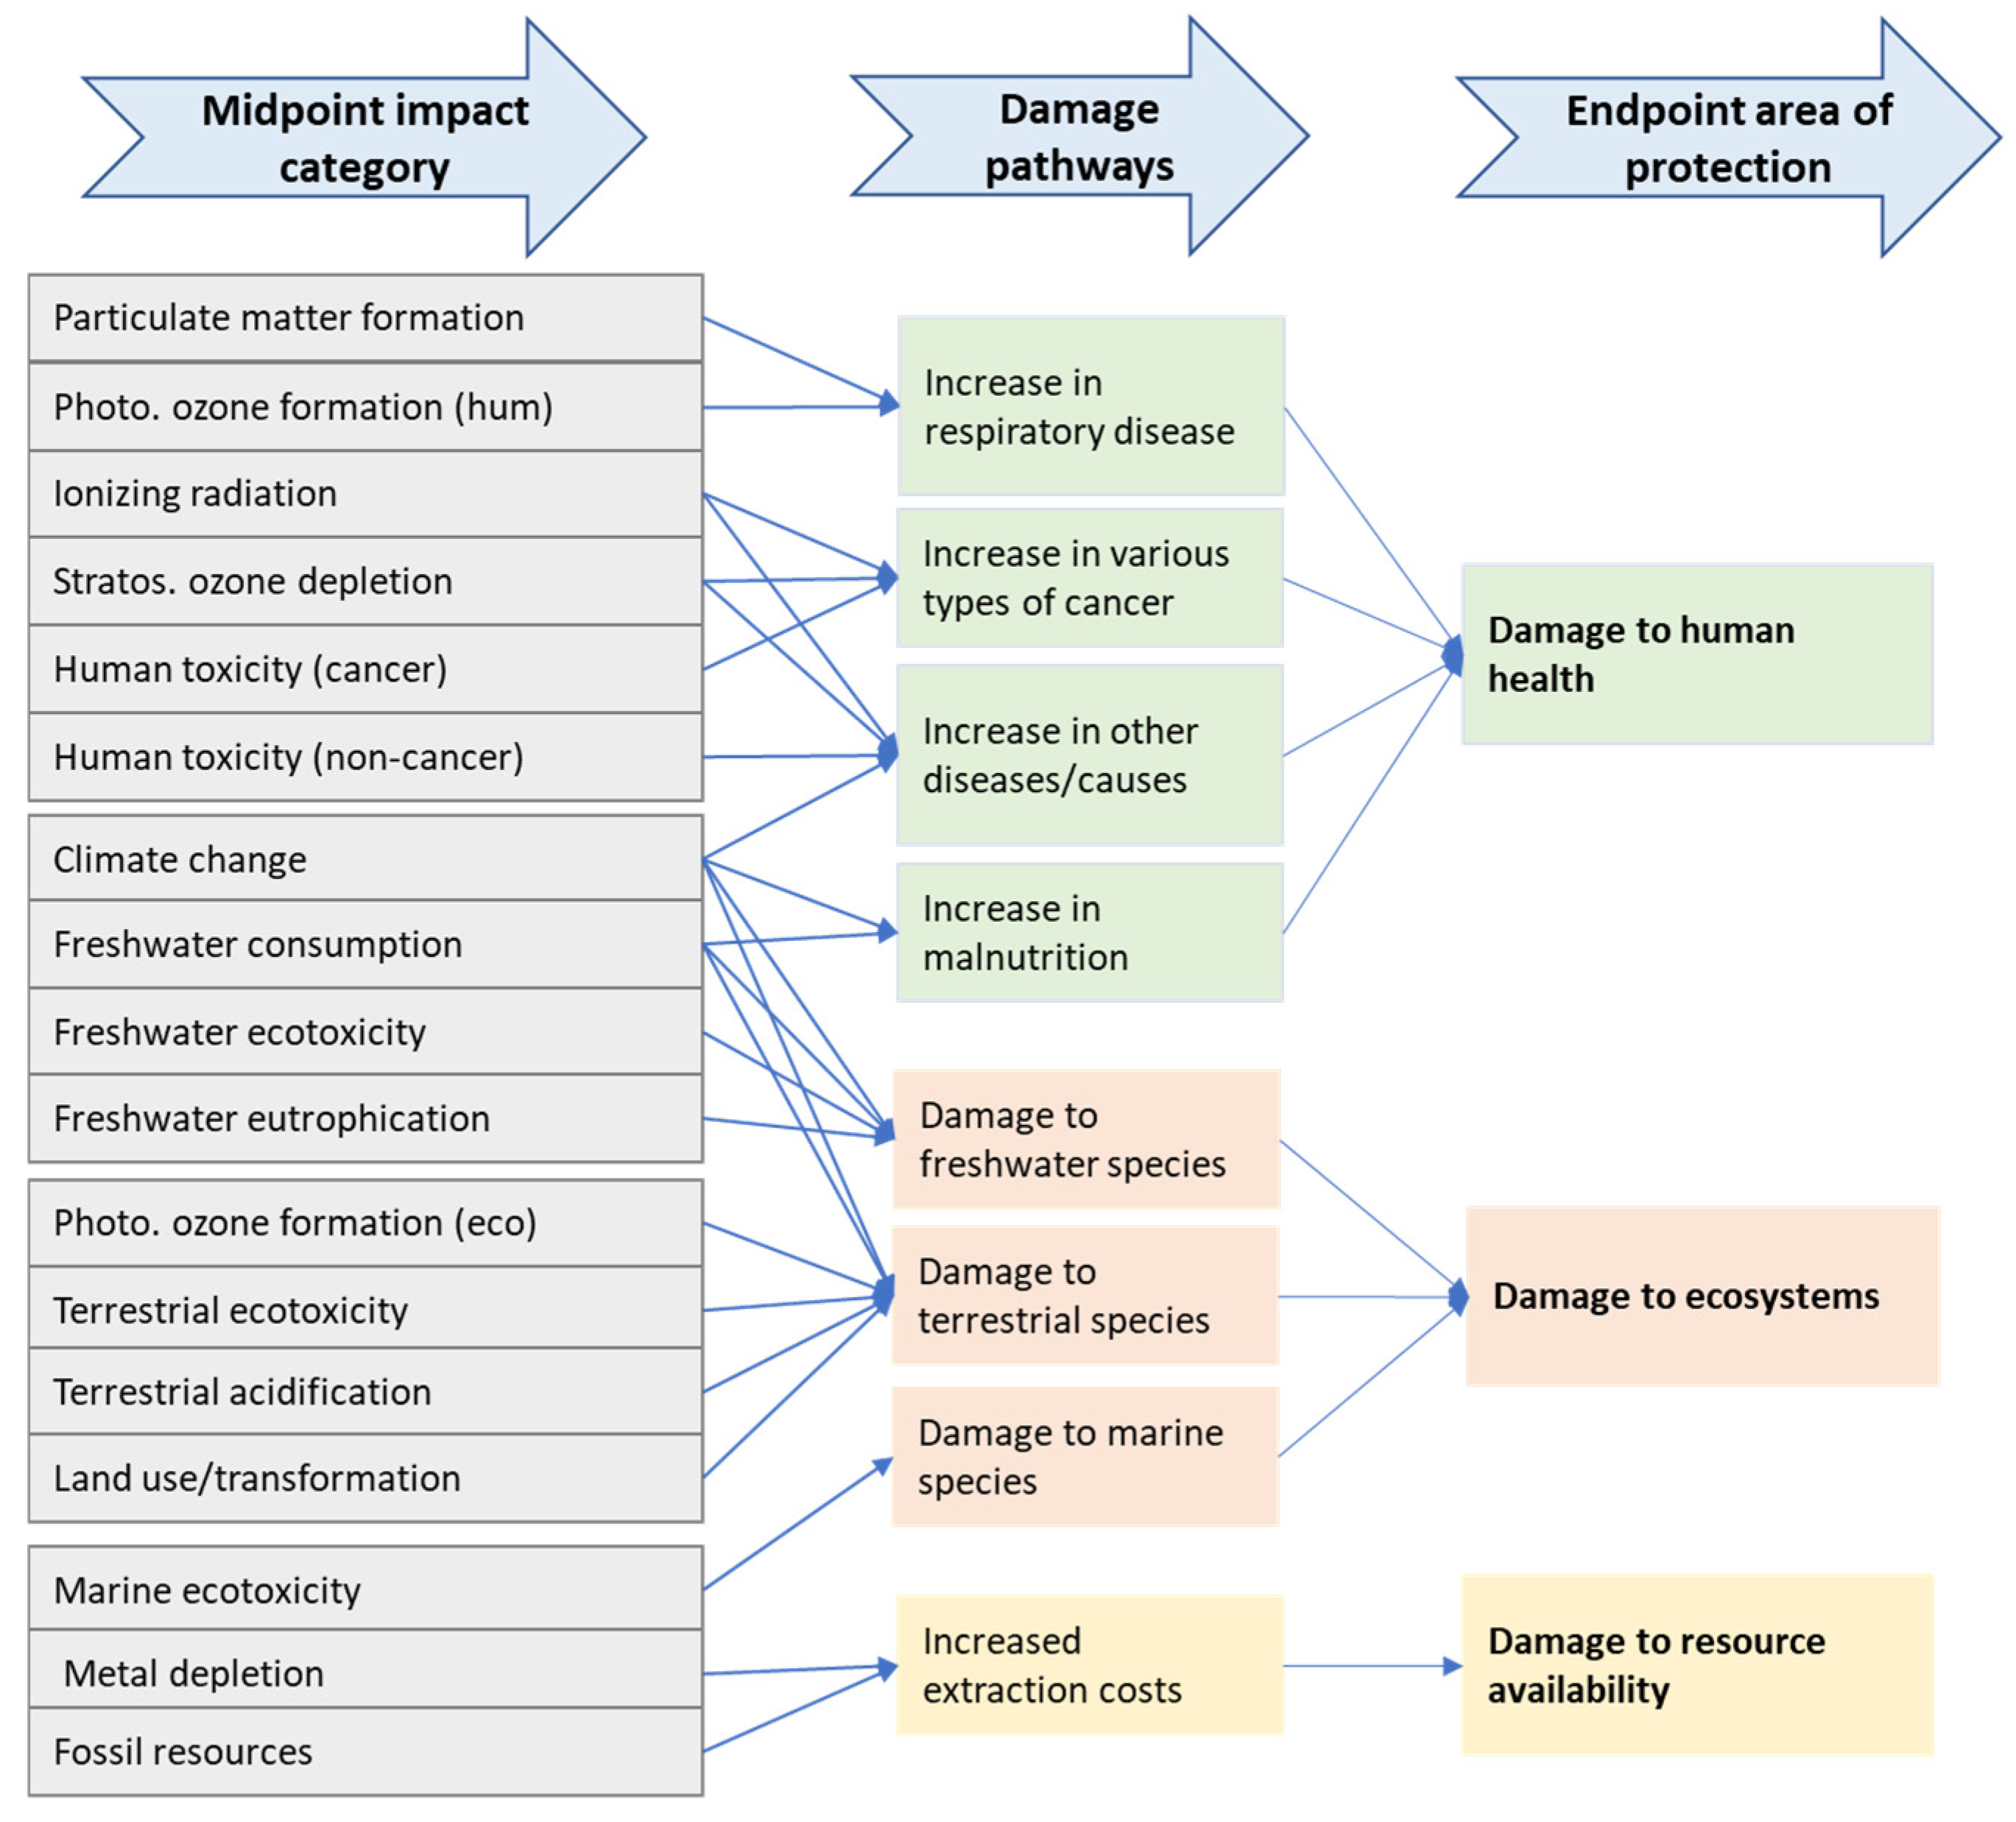
(c) Life cycle impact assessment. The processes and products within the defined system boundaries were modeled using GaBi Professional version 10.5.1, incorporating data from the Sphera 2022 database (Service Pack 39). The model integrates primary data collected during the data-gathering phase (e.g., energy use, materials, packaging, transportation) with secondary background data from the GaBi database to ensure a complete and consistent LCA. The ReCiPe 2016 method was selected because it integrates both midpoint and endpoint indicators, enabling a more comprehensive assessment of environmental performance [
14]. This method includes 17 midpoint categories (e.g., global warming potential, eutrophication, acidification, water use) and 3 endpoint categories: human health, ecosystem quality, and resource depletion.
Figure 5 shows the categories and their interrelation in detail.
(d) Interpretation. This phase focuses on analyzing and comparing the EI categories for each unit of analysis. Given the characteristics of the defined supply chain, EI indicators were calculated for each product type and factory, specifically for the production, packaging, and storage stages. For the transportation stages, linear regression models were developed to estimate the EI as a function of the transported weight (kilograms) and the distance traveled (kilometers). These values were transformed into normalized impact coefficients and integrated into the second objective function of the optimization model.
The production system under analysis is mono-functional, focusing solely on UHT milk production. Therefore, no allocation across coproducts was required. However, where datasets included shared infrastructure (e.g., shared energy sources), allocation was performed using a mass-based approach in accordance with the ISO 14044 guidelines.
4.3. Definition of the Mathematical Model and Inclusion of Sustainability Parameters
The development of the baseline model begins with the definition of indices, parameters and decision variables. Then, the objective functions and constraints are proposed, highlighting the integration of sustainability parameters.
Indices: | production factories, f = 1, 2, 3, … F |
| collection and distribution centers, d = 1, 2, 3, … D |
| wholesale customers, i = 1, 2, 3, … I |
| type of product, j = 1, 2, 3, … J |
Parameters: | fixed cost associated with the operation of factory f |
| productive capacity of factory f per item j |
| cost of producing item j at factory f |
| transportation cost per kilometer for shipping items from the factory to the collection and distribution center |
| weight in kilograms of item j |
| distance from production factory f to collection and distribution center d (in kilometers) |
| EI incurred at factory f during the production of item j |
| coefficient b1 in the EI regression equation for the transportation of item j from factories to collection and distribution centers |
| coefficient b2 in the EI regression equation for the transportation of item j from factories to collection and distribution centers |
| fixed cost generated by using collection and distribution center d |
| storage capacity of collection and distribution center d for item j |
| storage cost for item j at collection and distribution center d |
| transportation cost per kilometer for delivering items from collection and distribution centers to customers |
| distance from collection and distribution center d to customer i (kilometers) |
| coefficient b1 in the EI regression equation for the transportation of item j from collection and distribution centers to customers |
| coefficient b2 in the EI regression equation for the transportation of item j from collection and distribution centers to customers |
| demand of customer i for product j |
Decision variables |
|
|
|
Variables Y and Z are binary, while variables X and Q are positive integers.
Objective functions of the baseline model
The model simultaneously minimizes two distinct objectives, total cost and EI. These objectives are treated as separate components within a multi-objective optimization framework, without predefined weighting. This structure enables the generation of a Pareto front using the ε-constraint method, as detailed in
Section 5.2, thus providing decision-makers with a set of trade-off solutions between economic efficiency and sustainability. The components of each objective function are detailed below:
The first objective function (Equation (1)) focuses on minimizing the costs incurred across the analyzed stages of the supply chain. This objective encompasses production costs (Equation (2)), storage costs (Equation (3)), and transportation costs between factories, collection centers, and customers (Equation (4)).
The second objective function (Equation (5)) aims to minimize the EI across the entire supply chain network and is comprised of three components. The first component (EIa) represents the EI associated with the production and storage of each item at each factory (Equation (6)). The second (EIb) and third components (EIc) capture the EI within the climate change category for transportation activities, specifically from factories to collection centers (Equation (7)) and from collection centers to customers (Equation (8)). This objective function incorporates the indicators outlined in
Section 4.2, providing a sustainability-oriented approach for the proposed supply chain network optimization model.
Baseline model constraints
The model incorporates a set of constraints that reflect operational and logistical realities of the dairy supply chain. These are essential to ensure that the solutions proposed by the optimization model are not only mathematically feasible but also practically implementable.
Constraints in Equation (9) limit the total quantity of product
j that can be produced at factory
f based on its maximum production capacity. It ensures that production plans remain within the operational capabilities of each facility, accounting for resource, labor, and equipment constraints. Constraints in Equation (10) impose a limit on the total quantity of product
j that can be stored and shipped from collection center
d based on its available storage capacity. It reflects real constraints such as warehouse space, refrigeration limits, and handling capabilities.
Constraints in Equation (11) ensure that the quantity of product
j arriving at each collection center
d from all factories equals the amount sent from that center to customers. It enforces conservation of flow within the intermediate tier of the network. Constraints in Equation (12) ensure that the total amount of product
j delivered to customer
i from all collection centers matches their respective demand. It guarantees that customer requirements are fully satisfied under the model’s solution.
4.4. Uncertainty Management and Fuzzy Programming
In supply chain network design, it is required to account for the uncertainty of key parameters, such as demand and the various costs incurred throughout the network. Incorporating uncertainty enhances the robustness of the model, enabling the generation of solutions applicable across a range of plausible scenarios [
46]. One optimization technique that effectively addresses uncertain information is fuzzy programming, which is rooted in the fuzzy set theory introduced by Lotfi Zadeh in 1965.
In a fuzzy set, numbers are represented as a range of possible values, each associated with a membership degree that varies between 0 and 1. A common type of fuzzy number is the triangular fuzzy number, which is defined by three points: the minimum value (
), the most likely value (
), and the maximum value (
). The membership degree is described by a function that assigns to each possible value a number indicating the likelihood of its inclusion in the set. For a triangular fuzzy number, the membership function
is defined as follows:
The function illustrates how the degree of membership for different values of x varies within the range defined by , , and .
Figure 6 illustrates a typical triangular fuzzy number used in this study to represent demand variability. The shape and parameters of the membership function—minimum, most likely, and maximum values—were derived from a combination of historical demand data and expert judgment from the company’s production and sales managers. This graphical representation reflects the imprecise nature of forecasted demand and its likelihood distribution.
In this context, Jezewski et al. [
47] outlined the typical steps involved in fuzzy programming as follows:
- (1)
Parameter fuzzification: it involves incorporating uncertain parameters into the model using fuzzy numbers.
- (2)
Defuzzification: the process of converting fuzzy numbers into precise, “crisp” values. This can be achieved through methods such as simple averaging, weighted averaging, or the centroid method.
- (3)
Problem-solving: the “crisp” values are incorporated into the model, which is then solved using optimization techniques such as linear programming or integer linear programming.
In order to incorporate fuzzy programming into the developed baseline model, the three previously described steps were applied. In the first step, two parameters were identified as uncertain: production cost and demand. Their corresponding fuzzy numbers, defined by the minimum, average, and maximum values, are presented in Equations (13) and (14).
where
represents the production cost of item
j at factory
f, expressed as a fuzzy number. Similarly,
denotes the fuzzy demand of customer
i for product
j. In the case of demand, the parameters
alpha and
beta are used to account for variability, representing percentages of variation applied to the average demand value to determine its lower and upper bounds.
In the second step, the fuzzy numbers defined in Equations (13) and (14) were defuzzified by calculating their simple average. The resulting “crisp” values for production cost and demand are presented in Equations (15) and (16), respectively:
In the final step, the “crisp” values were integrated into the baseline model in order to update Equations (2) and (12), which pertain to the calculation of production costs and the demand fulfillment constraint, respectively. The modified formulations are presented in Equations (17) and (18):
The remaining equations for both the objective functions and the constraints in the baseline model remain unchanged.
5. Results and Discussion
This section describes the results obtained from the LCA, which were used to characterize the fuzzy model together with data from a dairy SME in Ecuador. In this way, the applied resolution method is explained, and the main results obtained to verify the validity of the developed model are presented.
5.1. LCA Results
In order to conduct the EI assessment, the analyzed supply chain was divided into two subsystems: the first encompasses the production and storage stages, while the second focuses exclusively on the transportation of final products to collection centers and subsequently to customers. For Subsystem 1, midpoint and endpoint impact values were calculated for each of the two products defined as units of analysis at each of the three factories where they are produced.
Table 1 presents the EI categories and the corresponding values for the first analysis unit (UHT whole milk in a 1 L Tetra Pak cardboard container) produced at Factory 1.
Table 1 is organized into the following fields: EI category, category unit, midpoint impact value (CFm), endpoint conversion factor, endpoint impact value (CFe), and the total impact value for each impact category in Ecopoints (EPs).
As shown in
Table 2, the four categories with the highest EI are climate change, fossil depletion, metal depletion, and fine particulate matter formation. These impacts are primarily attributed to the significant energy consumption during the milk heating and cooling processes, as well as the reliance on fossil fuels. Additional contributing factors include water usage, cleaning materials, and the use of aluminum and low-density polyethylene in product packaging and palletizing. The values obtained in these categories were consistent with those reported in previous LCA studies on the industrial processing of UHT milk [
48].
For Subsystem 1 and the second analysis unit (UHT whole milk in a 900 mL polyethylene container) produced at Factory 1, impact values similar to those of Product 1 were observed. Notable differences were found in two categories, climate change and fossil depletion, primarily due to the characteristics of the polyethylene packaging, which results in higher greenhouse gas emissions. Conversely, the categories of metal depletion and photochemical ozone formation show significantly lower impacts compared to the first product. This reduction is attributed to the absence of aluminum in the packaging, the product’s dimensions, its packaging efficiency, and the reduced amount of plastic used for palletizing.
Table 2 summarizes the results of Subsystem 1 analysis, presenting the endpoint impact values for each category across the two products defined as units of analysis in each factory.
The data in
Table 2 reveal notable differences in the impact values across the factories. These variations were primarily attributed to factors such as the machinery used in the manufacturing process, productivity rates, energy consumption, boiler specifications, and materials utilized. The influence of these factors on EI is evident, as Factory 1 consistently showed lower values in the studied categories. This factory made significant investments in state-of-the-art machinery, resulting in reduced energy consumption, higher utilization rates, and improved efficiency, which collectively enhance daily productivity. Similarly, Factory 2 reported lower impact values than Factory 3, largely due to its use of a recycled alternative plastic for palletizing, which is currently under trial.
These endpoint values or impact indicators by affected area were incorporated into the mathematical model, specifically within Objective Function 2. This function enables the estimation of the EI in factories and collection centers based on the type of product.
For Subsystem 2, which focuses on the transportation stages, the simulation conducted in the GaBi software revealed that the EI in these stages is primarily influenced by the distance traveled and the weight transported. To model this relationship, a sample of 100 observations was generated by varying the weight, product type, and distances between customers and collection centers. These data were used to develop a linear regression model, yielding a coefficient of determination of 0.90. The dependent variable of the linear regression model is the EI (the global warming category), and the resulting equation is as follows:
The coefficients (0.0061) and (0.0395) from Equation (19) are incorporated into the mathematical model. These coefficients enable the estimation of the EI for transportation arches based on the variables of distance and weight.
To further contextualize the EI impact values of the two packaging types, it is important to interpret them in light of the existing literature and industry benchmarks. While the earlier paragraphs highlight that the polyethylene container had higher impacts in climate change and fossil depletion, the Tetra Pak carton—in metal depletion and photochemical ozone formation, these differences are not only expected but align with trends found in previous LCA studies on food and dairy packaging [
49].
Specifically, research indicates that single-use plastic containers tend to produce greater greenhouse gas emissions due to their fossil-based composition, whereas multilayer composite cartons, such as Tetra Pak, generally exhibit higher metal-related impacts due to their aluminum foil content. On the other hand, Tetra Pak packaging is often associated with a lower global warming potential and fossil depletion due to its lighter weight and incorporation of renewable materials [
48]. Our calculated values are, therefore, considered robust and consistent with these documented trends. Although the numerical values may initially appear abstract, their relative patterns reflect realistic trade-offs inherent in material selection and processing technologies in the dairy sector. This interpretation supports the reliability of the results and enhances their value for sustainability assessments and decision-making.
5.2. Model Characterization and Resolution
In this phase, data from the supply chain of a dairy company based in Chimborazo, Ecuador, were integrated into the fuzzy model. The supply chain consists of three production plants, five distribution centers, and 20 wholesale customers. The two products defined as units of analysis in the LCA flow through the network formed by these links. Transportation within the network is carried out using diesel trucks with a 10 t capacity. The model is validated over a weekly period of time.
The proposed bi-objective fuzzy optimization model employs the epsilon-constraint method, a widely used approach known for its simplicity and flexibility. This method converts a multi-objective problem into a series of single-objective problems by introducing additional constraints. These constraints ensure that the non-optimized objective functions remain less than or equal to a specified epsilon value, which represents the maximum acceptable value for the optimized objective function [
12]. The steps followed in this process are as follows:
Selection of the primary objective. One of the objective functions is chosen as the primary objective. In the proposed model, the cost function is selected for minimization, while the EI function is incorporated into the model as a constraint.
Definition of epsilon values. For each objective function acting as a constraint, a range of epsilon values is defined. In the proposed model, as the objectives of minimizing costs and EI are conflicting, the lower bound of the epsilon range is determined by solving the model with only the EI minimization objective. Conversely, the upper bound is obtained by solving the model with only the cost minimization objective.
Problem resolution. The optimization model is solved as a single-objective problem by assigning an epsilon value to the other objective function. The fuzzy model was implemented in Python 3.10, utilizing the CBC (COIN-OR branch and cut) optimizer, which employs branch-and-cut techniques to solve integer linear programming or mixed-integer linear programming problems.
Iteration. The step of problem resolution is repeated across the defined range of epsilon values, generating a set of optimal solutions that form the Pareto frontier. This frontier represents a collection of optimal solutions, which demonstrates that improving one objective function is not possible without compromising the other.
5.3. Results of the Fuzzy Model for the Dairy Industry
The fuzzy model, based on the customers’ demand, determines the quantity of items produced and flowing through the resulting network design, while accounting for the available capacities of factories and collection centers. Additionally, the model calculates production, storage, and transportation costs, as well as the EI generated across the network.
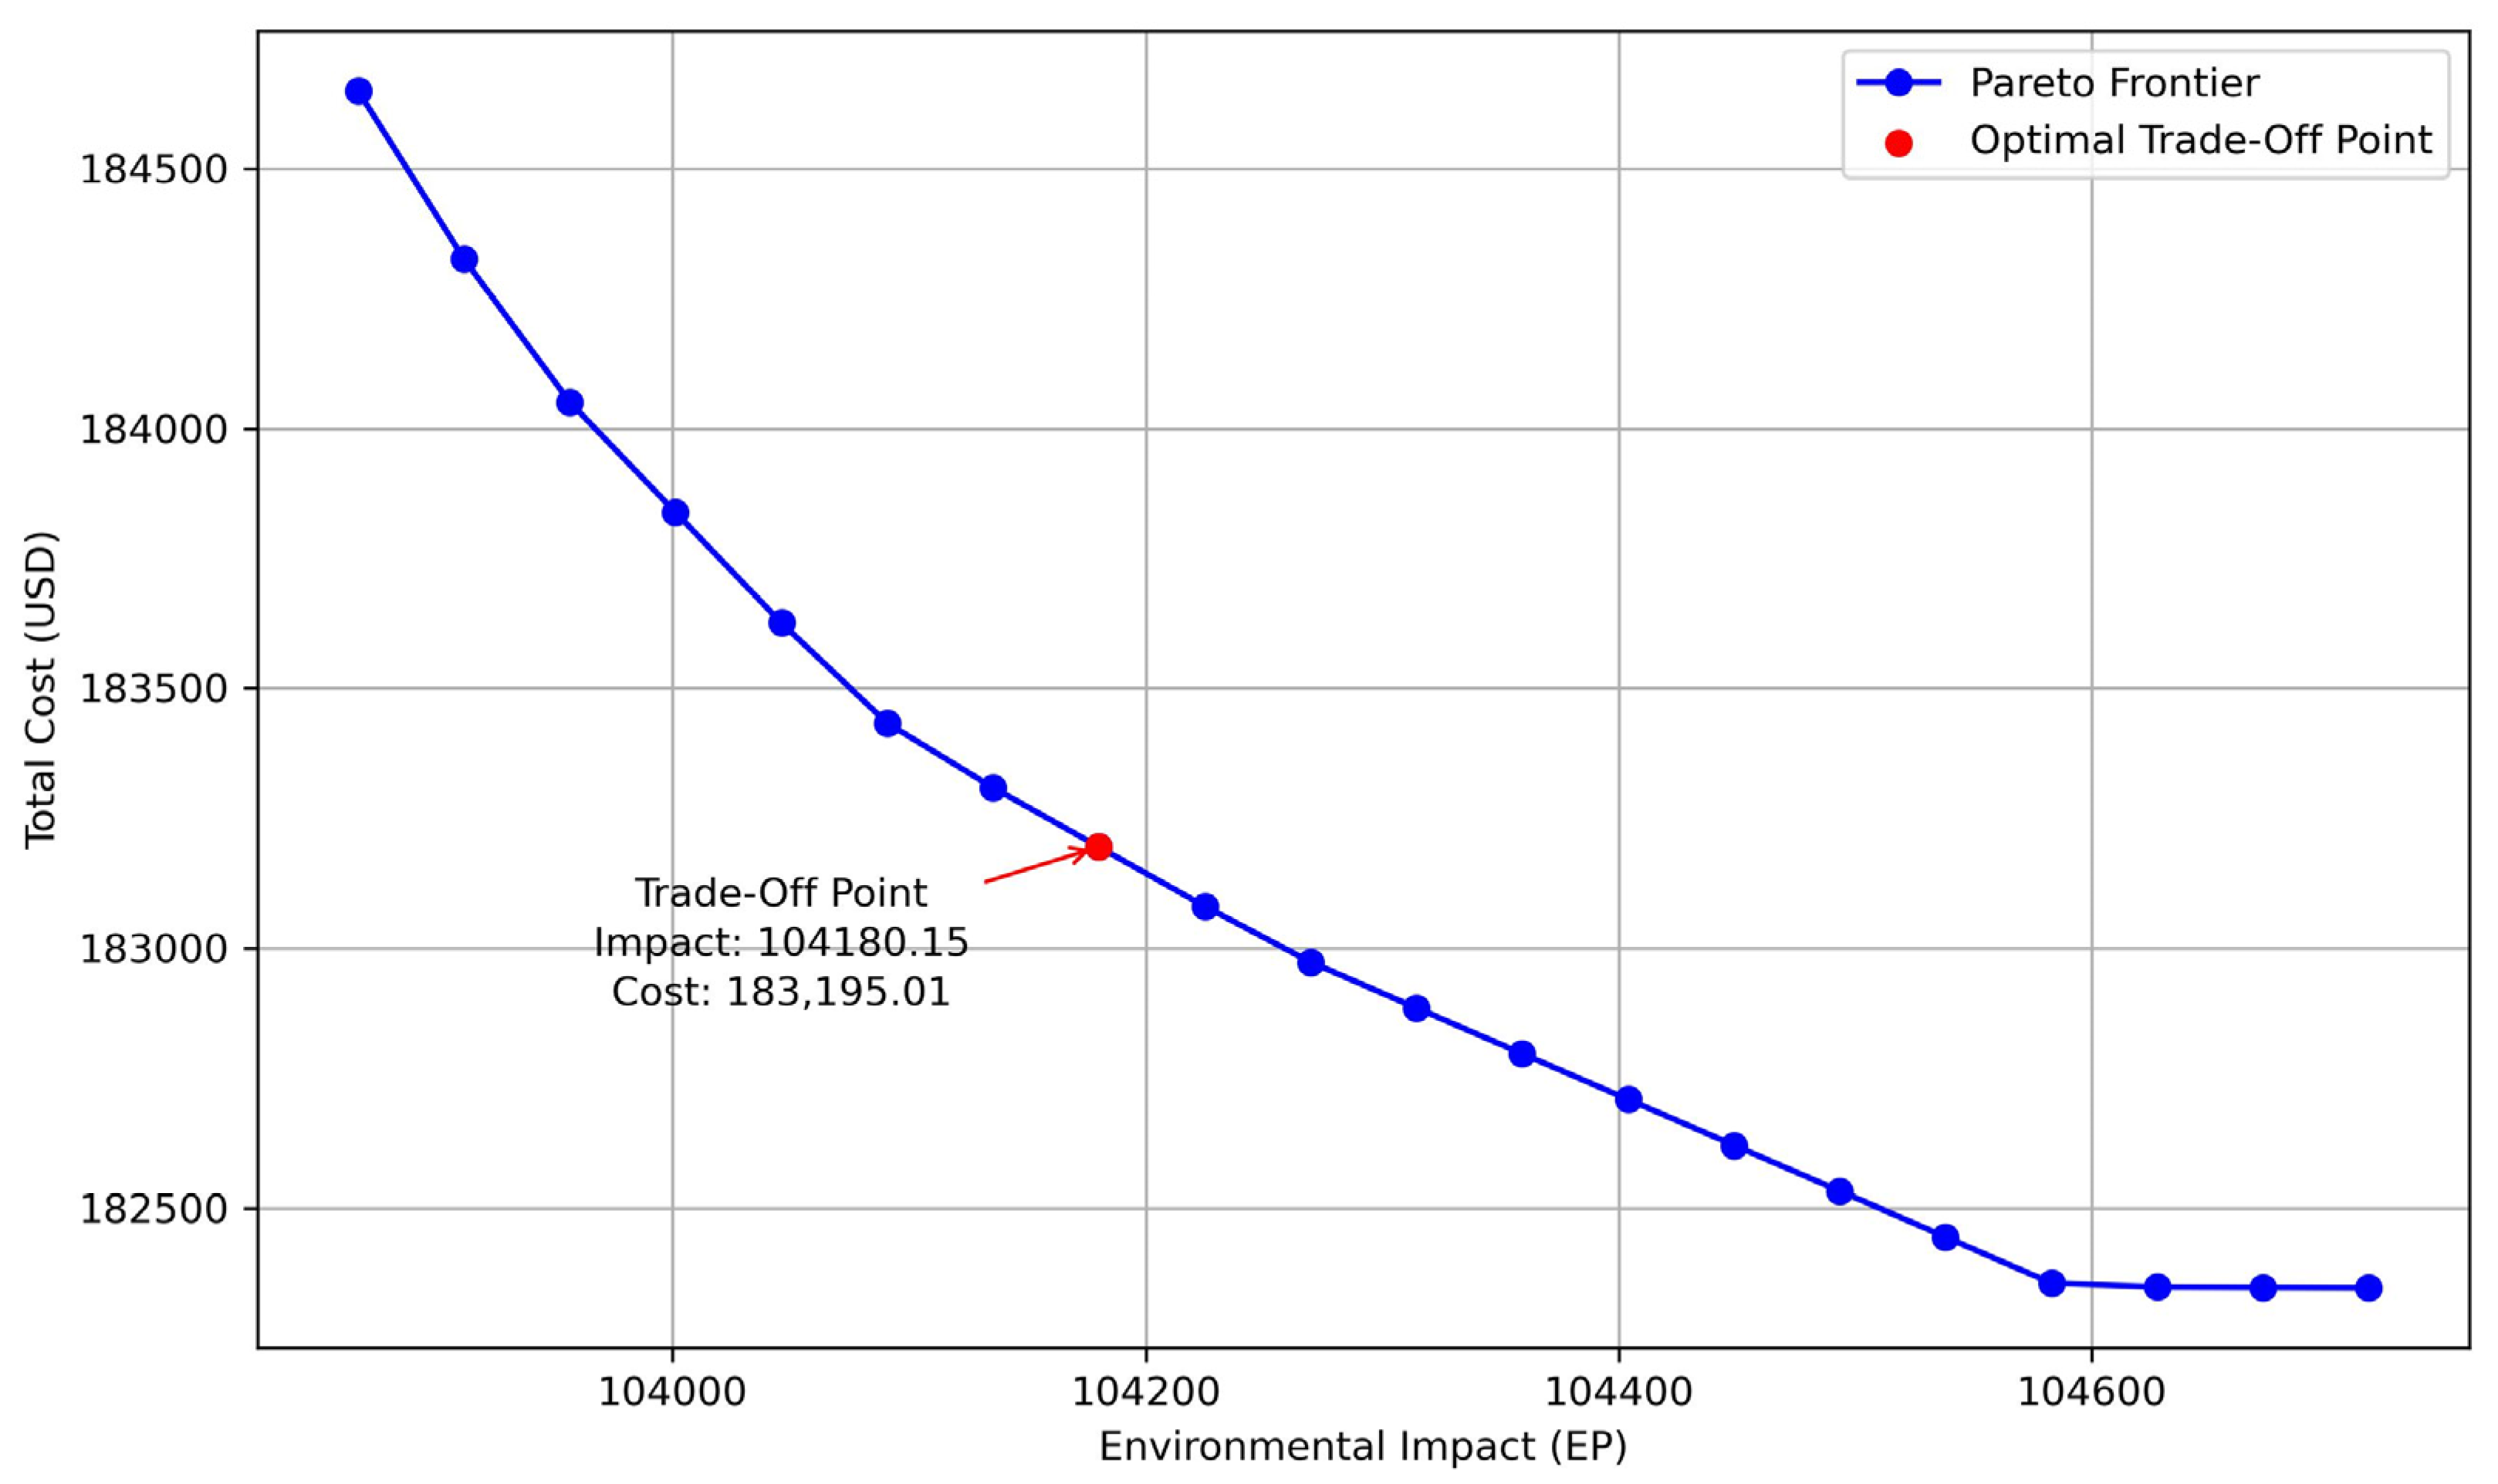
Figure 7 illustrates a set of optimal results represented by a Pareto frontier for various network design configurations obtained by varying the epsilon value (see
Section 5.2).
Figure 7 shows the trade-off between the two conflicting objectives analyzed in the model, since as network costs decrease, the EI generated increases. Costs ranged from
$182,348.23 to
$184,649.86, an increase of
$2301.63, which, in turn, generated a decrease in the impact by 849.99 EPs, from 104,716.99 EPs to 103,867.00 EPs.
Similarly, in
Figure 7, the optimal trade-off point is highlighted in red. This point represents a balanced network design, achieving a compromise between cost minimization (
$183,195) and EI reduction (104,180 EPs).
For the boundary points of the Pareto frontier—specifically, the network design prioritizing cost minimization and the design focusing on EI minimization—
Table 3 provides details on the quantities produced at each factory along with their respective utilization rates.
As shown in
Table 3, the analyzed network designs produce the same total quantity of products and fully meet demand (100%). However, the distribution of production across factories and their utilization rates varies between designs. For instance, in the case of Product 1 (UHT whole milk in a 1 L Tetra Pak cardboard container), prioritizing EI minimization results in Factory 1 operating at full capacity (100% utilization) while Factory 3 is utilized at only 39.48%. Conversely, when cost minimization is prioritized, Factory 1’s utilization drops to 75.77%, and Factory 3’s utilization increases to 99.91%. These differences are driven by the EI and production costs associated with each factory. This aligns with the results in
Section 5.1, where Factory 1 demonstrated a lower EI value but higher production costs, while Factory 3 exhibited a higher EI but lower production costs.
Building on the analysis of the network designs at the boundaries of the Pareto frontier,
Table 4 summarizes the quantities of units transported along the factory-to-center arches for each design. To determine the product flowing through the network arches, the model prioritizes the shortest routes, aiming to minimize both the EI and transportation costs.
Although all the solutions presented on the Pareto frontier are considered optimal, the selection of the most suitable design rests with supply chain management practitioners. This choice should be guided by the associated network costs and the sustainability objectives established by the organization. A reasonable starting point is the equilibrium network design, which corresponds to the optimal trade-off point. Detailed information on this design is presented in
Table 5,
Table 6 and
Table 7.
Based on the data presented in
Table 5,
Table 6 and
Table 7, the balanced network design fulfills 100% of customer demand for Product 1, utilizing 89.52% of the capacity at Factory 1, 84.42% at Factory 2, and 85% at Factory 3. Similarly, for Product 2, Factory 1 operates at full capacity (100%), while Factory 2 and Factory 3 utilize 78.33% and 100% of their capacities, respectively. Regarding the collection and distribution centers, Centers 1–4 are fully utilized (100%), while Center 5 operates at 52.15% capacity for Product 1 and 56.65% for Product 2. As expected, these values reflect a balance, positioned near the midpoint between the network designs at the boundaries of the Pareto frontier (see
Figure 7).
The cost of the equilibrium network design, as indicated in
Table 5, is
$183,195.01, representing a 0.46% increase compared to the minimum cost found at one extreme of the Pareto frontier. This translates to an additional weekly expense of
$846.78 in exchange for a reduction in the EI of 536 EPs. According to Tumpa et al. [
50], these costs should not be seen as losses or expenses. Instead, the implementation of sustainable strategies often yields benefits that exceed these costs by improving areas such as corporate image, market positioning, and the acquisition of new clients, among others.
Finally,
Figure 8 illustrates the configuration and product flow within the equilibrium network design.
5.4. Sensitivity and Robustness Analysis
To address the inherent uncertainty and variability in the supply chain, a sensitivity analysis was conducted using the ε-constraint method. By varying the ε value, a set of optimal network configurations was obtained, each representing a different trade-off between the total cost and the EI. The analysis revealed the following:
A cost-only minimization configuration that favors lower expenses but leads to a higher EI (104,716.99 EPs).
An EI minimization setup that reduces emissions at the expense of higher operational costs ($184,649.86).
A balanced configuration, selected as the optimal trade-off, achieving a cost of $183,195.01 and an EI of 104,180.15 EPs.
This multi-scenario evaluation demonstrates the robustness of the model. Regardless of the selected ε-value, all solutions satisfy 100% of the demand and respect capacity constraints. However, the distribution of production and shipments changes depending on the optimization priority, offering decision-makers flexible configurations according to their strategic objectives.
Additionally, the marginal increase in cost to achieve significant reductions in the EI (e.g., an extra $846.78 per week yields a reduction of 536 EPs) highlights the viability of adopting greener supply chain configurations.
From a managerial perspective, this sensitivity analysis helps visualize potential risks and opportunities:
Risk mitigation: understanding how the model responds to stricter environmental constraints allows firms to anticipate capacity shifts and reallocate resources.
Strategic alignment: companies aiming to enhance sustainability credentials can choose configurations closer to the low-impact extreme.
Operational flexibility: the model provides a decision-making framework to adapt to changing market demands or environmental regulations.
This sensitivity-based approach strengthens the reliability of the proposed model and ensures its practical applicability in real-world supply chain design scenarios.
6. Conclusions
This study examines the implementation of sustainable strategies in supply chain network design through the development of a bi-objective optimization model. The model aims to minimize both costs and the EI by incorporating indicators derived from an LCA. Additionally, fuzzy programming is integrated into the model to address uncertainties in demand and production costs, thereby capturing the dynamic behavior of the supply chain, increasing its complexity, and enhancing its realism. The model was validated using data from a dairy SME in Ecuador.
The first step in developing the model involved collecting data from the supply chain of the analyzed company, focusing on the resources and energy used in the production of two products: UHT whole milk in 1 L Tetra Pak cardboard containers and UHT whole milk in 900 mL polyethylene containers. Using these data and applying the LCA methodology, the EI was systematically quantified for both the production and storage stages (Subsystem 1) and the transportation stage (Subsystem 2). The results indicate that the categories climate change, fossil depletion, metal depletion, and fine particulate matter formation exhibit the highest EI values. These impacts vary depending on the product and factory analyzed, driven by factors such as the type of machinery, energy sources, materials, and packaging used in the production processes [
49].
In the subsequent step of the methodology, the optimization model was developed, incorporating the results of the LCA. This integration enhances the model by providing a comprehensive approach to decision-making, enabling the generation of network designs that consider both costs and their associated EIs. These findings align with previous studies that highlight the value of LCA in implementing sustainable strategies within supply chains [
35,
51,
52]. However, this research advances the field by not only relying on deterministic data, but also addressing the uncertainty of demand and production costs through a fuzzy approach.
After characterizing the model with data from the analyzed dairy company, various network designs were generated using the epsilon-constraint method. This approach yielded a set of optimal solutions and, as noted by Rahbari et al. [
38], enabled the exploration of the trade-off between cost minimization and EI reduction in the supply chain. Previous research on the dairy supply chain, such as by Ferreira et al. [
7], has already emphasized the importance of integrating sustainability into this industry, a necessity further confirmed by our findings. Although a 0.46% increase in costs is initially observed to achieve a reduction of 536 EPs in the EI, studies by Eltayeb et al. [
53] and Tumpa et al. [
50] highlight that such an investment is ultimately rewarded. Improved corporate image, better market positioning, and the attraction of new customers are among the long-term benefits associated with these sustainable practices.
The characterization of the model using data from a dairy SME in the Ecuadorian highlands demonstrated its applicability and relevance for industries with similar characteristics. The model evaluates productivity, enhances the efficient use of facilities, allocates production based on the capacities and EI of each facility, designs optimized product distribution routes, and minimizes distances traveled. These capabilities position the model as a robust decision-support tool, enabling the analysis of scenarios that promote improved sustainable practices in supply chains.
From a practical standpoint, this research contributes a decision-support tool that enables dairy producers to simultaneously optimize cost efficiency and environmental sustainability. For stakeholders in the Ecuadorian dairy industry, the proposed model offers a structured methodology to evaluate and redesign supply chain configurations based on real-world constraints and sustainability objectives. The model can be used to simulate different production allocations, transportation routes, and facility utilizations, helping managers to anticipate the economic and environmental outcomes of their strategic decisions. To improve the sustainability of their supply chains, companies are advised to prioritize low-impact facilities, optimize transportation distances, and adopt data-driven approaches that integrate environmental indicators into planning. Additionally, engaging in scenario-based planning using the model’s multi-objective framework allows firms to better prepare for market shifts or regulatory pressures related to climate impact and resource efficiency.
The limitations of this research primarily relate to the characteristics of the modeled supply chain. The model includes only three tiers (factories, collection and distribution centers, and customers), assumes a unidirectional product flow, and considers a single mode of transportation. Future research could address these limitations by incorporating additional supply chain levels, reverse logistics, closed-loop systems, and multiple transportation modes. These improvements would enhance the model’s capabilities and extend its applicability to a wider range of industrial sectors.
Author Contributions
Conceptualization, P.F.-S. and V.L.-S.; methodology, P.F.-S. and M.M.-M.; software, P.F.-S. and J.L.-V.; validation, J.M.-G. and R.G.; formal analysis, J.M.-G. and R.G.; investigation, P.F.-S. and M.M.-M.; resources, J.L.-V. and V.L.-S.; data curation, J.L.-V.; writing—original draft preparation, P.F.-S. and J.M.-G.; writing—review and editing, J.L.-V. and M.M.-M.; visualization, M.M.-M. and V.L.-S.; supervision, P.F.-S. and R.G.; project administration, M.M.-M.; funding acquisition, V.L.-S. All authors have read and agreed to the published version of the manuscript.
Funding
The authors gratefully acknowledge the Faculty of Engineering at Anahuac University Mexico for financial support.
Institutional Review Board Statement
Not applicable.
Informed Consent Statement
Not applicable.
Data Availability Statement
The data presented in this study are available upon request from the corresponding author due to restrictions.
Conflicts of Interest
The authors declare no conflicts of interest.
References
- Jia, F.; Shahzadi, G.; Bourlakis, M.; John, A. Promoting Resilient and Sustainable Food Systems: A Systematic Literature Review on Short Food Supply Chains. J. Clean. Prod. 2024, 435, 140364. [Google Scholar] [CrossRef]
- Garrido, S.; Muniz, J.; Batista Ribeiro, V. Operations Management, Sustainability & Industry 5.0: A Critical Analysis and Future Agenda. Clean. Logist. Supply Chain 2024, 10, 100141. [Google Scholar] [CrossRef]
- Abbasi, S.; Abbaspour, S.; Eskandari Nasab Siahkoohi, M.; Yousefi Sorkhi, M.; Ghasemi, P. Supply Chain Network Design Concerning Economy and Environmental Sustainability: Crisis Perspective. Results Eng. 2024, 22, 102291. [Google Scholar] [CrossRef]
- Jouzdani, J.; Govindan, K. On the Sustainable Perishable Food Supply Chain Network Design: A Dairy Products Case to Achieve Sustainable Development Goals. J. Clean. Prod. 2021, 278, 123060. [Google Scholar] [CrossRef]
- Barbosa-Póvoa, A.P.; da Silva, C.; Carvalho, A. Opportunities and Challenges in Sustainable Supply Chain: An Operations Research Perspective. Eur. J. Oper. Res. 2018, 268, 399–431. [Google Scholar] [CrossRef]
- Flores-Siguenza, P.; Marmolejo-Saucedo, J.A.; Guamán, R. A Multi-Objective Optimization Model for Sustainable Production Planning in Textile MSMEs. EAI Endorsed Trans. Ind. Netw. Intell. Syst. 2023, 10, e4. [Google Scholar] [CrossRef]
- Ferreira, F.U.; Robra, S.; Ribeiro, P.C.C.; Gomes, C.F.S.; de Almeida Neto, J.A.; Rodrigues, L.B. Towards a Contribution to Sustainable Management of a Dairy Supply Chain. Production 2020, 30, e20190019. [Google Scholar] [CrossRef]
- Cayambe, J.; Heredia, M.R.; Valencia, L.; Torres, B.; Díaz-Ambrona, C.G.H.; Toulkeridis, T. Greenhouse Gas Emissions from Subsistence Dairy Livestock in Rural Livelihoods in the Northern Andes of Ecuador. In Proceedings of the 1st International Conference on Water Energy Food and Sustainability (ICoWEFS 2021), Leiria, Portugal, 10–12 May 2021; da Costa Sanches Galvão, J.R., Duque de Brito, P.S., dos Santos Neves, F., da Silva Craveiro, F.G., de Amorim Almeida, H., Correia Vasco, J.O., Pires Neves, L.M., de Jesus Gomes, R., de Jesus Martins Mourato, S., Santos Ribeiro, V.S., Eds.; Springer International Publishing: Cham, Switzerland, 2021; pp. 65–74. [Google Scholar]
- Chen, S.; Chen, Y. Designing a Resilient Supply Chain Network: A Multi-Objective Data-Driven Distributionally Robust Optimization Method. Comput. Oper. Res. 2024, 173, 106868. [Google Scholar] [CrossRef]
- Brandenburg, M.; Rebs, T. Sustainable Supply Chain Management: A Modelling Perspective. Ann. Oper. Res. 2015, 229, 213–252. [Google Scholar] [CrossRef]
- Miranda-Ackerman, M.A.; Azzaro-Pantel, C.; Aguilar-Lasserre, A.A. A Green Supply Chain Network Design Framework for the Processed Food Industry: Application to the Orange Juice Agrofood Cluster. Comput. Ind. Eng. 2017, 109, 369–389. [Google Scholar] [CrossRef]
- Mavrotas, G. Effective Implementation of the ε-Constraint Method in Multi-Objective Mathematical Programming Problems. Appl. Math. Comput. 2009, 213, 455–465. [Google Scholar] [CrossRef]
- Wu, F.; Lu, J.; Zhang, G. A New Approximate Algorithm for Solving Multiple Objective Linear Programming Problems with Fuzzy Parameters. Appl. Math. Comput. 2006, 174, 524–544. [Google Scholar] [CrossRef]
- Huijbregts, M.A.J.; Steinmann, Z.J.N.; Elshout, P.M.F.; Stam, G.; Verones, F.; Vieira, M.; Zijp, M.; Hollander, A.; van Zelm, R. ReCiPe2016: A Harmonised Life Cycle Impact Assessment Method at Midpoint and Endpoint Level. Int. J. Life Cycle Assess. 2017, 22, 138–147. [Google Scholar] [CrossRef]
- Riofrio, A.; Baykara, H. Techno-Environmental and Life Cycle Assessment of ‘Oat-Milk’ Production in Ecuador: A Cradle-to-Retail Life Cycle Assessment. Int. J. Food Sci. Technol. 2022, 57, 4879–4886. [Google Scholar] [CrossRef]
- Ahi, P.; Searcy, C. Assessing Sustainability in the Supply Chain: A Triple Bottom Line Approach. Appl. Math. Model. 2015, 39, 2882–2896. [Google Scholar] [CrossRef]
- Mavrotas, G. Generation of Efficient Solutions in Multiobjective Mathematical Programming Problems Using GAMS. Effective Implementation of the ε-Constraint Method. 2008. Available online: https://www.gams.com/modlib/adddocs/epscm.pdf (accessed on 10 December 2024).
- Rezaei, M.; Chaharsooghi, S.K.; Husseinzadeh Kashan, A.; Babazadeh, R. Optimal Design and Planning of Biodiesel Supply Chain Network: A Scenario-Based Robust Optimization Approach. Int. J. Energy Environ. Eng. 2020, 11, 111–128. [Google Scholar] [CrossRef]
- Ge, H.; Goetz, S.J.; Cleary, R.; Yi, J.; Gómez, M.I. Facility Locations in the Fresh Produce Supply Chain: An Integration of Optimization and Empirical Methods. Int. J. Prod. Econ. 2022, 249, 108534. [Google Scholar] [CrossRef]
- Valizadeh, J.; Boloukifar, S.; Soltani, S.; Jabalbarezi Hookerd, E.; Fouladi, F.; Andreevna Rushchtc, A.; Du, B.; Shen, J. Designing an Optimization Model for the Vaccine Supply Chain during the COVID-19 Pandemic. Expert Syst. Appl. 2023, 214, 119009. [Google Scholar] [CrossRef]
- Ahmad, F.; Alnowibet, K.A.; Alrasheedi, A.F.; Adhami, A.Y. A Multi-Objective Model for Optimizing the Socio-Economic Performance of a Pharmaceutical Supply Chain. Socioecon. Plann. Sci. 2022, 79, 101126. [Google Scholar] [CrossRef]
- Margolis, J.T.; Sullivan, K.M.; Mason, S.J.; Magagnotti, M. A Multi-Objective Optimization Model for Designing Resilient Supply Chain Networks. Int. J. Prod. Econ. 2018, 204, 174–185. [Google Scholar] [CrossRef]
- Ala, A.; Goli, A.; Mirjalili, S.; Simic, V. A Fuzzy Multi-Objective Optimization Model for Sustainable Healthcare Supply Chain Network Design. Appl. Soft Comput. 2024, 150, 111012. [Google Scholar] [CrossRef]
- Junge, A.L.; Straube, F. Sustainable Supply Chains—Digital Transformation Technologies’ Impact on the Social and Environmental Dimension. Procedia Manuf. 2020, 43, 736–742. [Google Scholar] [CrossRef]
- Li, J.; Wang, L.; Tan, X. Sustainable Design and Optimization of Coal Supply Chain Network under Different Carbon Emission Policies. J. Clean. Prod. 2020, 250, 119548. [Google Scholar] [CrossRef]
- Ghadimi, P.; Wang, C.; Lim, M.K. Sustainable Supply Chain Modeling and Analysis: Past Debate, Present Problems and Future Challenges. Resour. Conserv. Recycl. 2019, 140, 72–84. [Google Scholar] [CrossRef]
- Allehashemi, T.; Amin, S.H.; Zolfaghari, S. A Proposed Multi-Objective Model for Cellphone Closed-Loop Supply Chain Optimization Based on Fuzzy QFD. Expert Syst. Appl. 2022, 210, 118577. [Google Scholar] [CrossRef]
- Baratsas, S.G.; Pistikopoulos, E.N.; Avraamidou, S. A Systems Engineering Framework for the Optimization of Food Supply Chains under Circular Economy Considerations. Sci. Total Environ. 2021, 794, 148726. [Google Scholar] [CrossRef]
- Eskandarpour, M.; Dejax, P.; Miemczyk, J.; Péton, O. Sustainable Supply Chain Network Design: An Optimization-Oriented Review. Omega 2015, 54, 11–32. [Google Scholar] [CrossRef]
- Waltho, C.; Elhedhli, S.; Gzara, F. Green Supply Chain Network Design: A Review Focused on Policy Adoption and Emission Quantification. Int. J. Prod. Econ. 2019, 208, 305–318. [Google Scholar] [CrossRef]
- Mohebalizadehgashti, F.; Zolfagharinia, H.; Amin, S.H. Designing a Green Meat Supply Chain Network: A Multi-Objective Approach. Int. J. Prod. Econ. 2020, 219, 312–327. [Google Scholar] [CrossRef]
- Mota, B.; Gomes, M.I.; Carvalho, A.; Barbosa-Povoa, A.P. Sustainable Supply Chains: An Integrated Modeling Approach under Uncertainty. Omega 2018, 77, 32–57. [Google Scholar] [CrossRef]
- Kiani Mavi, R.; Hosseini Shekarabi, S.A.; Kiani Mavi, N.; Arisian, S.; Moghdani, R. Multi-Objective Optimisation of Sustainable Closed-Loop Supply Chain Networks in the Tire Industry. Eng. Appl. Artif. Intell. 2023, 126, 107116. [Google Scholar] [CrossRef]
- Moghadam, S.S.; Gholamian, M.R.; Zahedi, R.; Shaqaqifar, M. Designing a Multi-Purpose Network of Sustainable and Closed-Loop Renewable Energy Supply Chain, Considering Reliability and Circular Economy. Appl. Energy 2024, 369, 123539. [Google Scholar] [CrossRef]
- Mele, F.D.; Kostin, A.M.; Guillén-Gosálbez, G.; Jiménez, L. Multiobjective Model for More Sustainable Fuel Supply Chains. A Case Study of the Sugar Cane Industry in Argentina. Ind. Eng. Chem. Res. 2011, 50, 4939–4958. [Google Scholar] [CrossRef]
- Cardona-Valdés, Y.; Álvarez, A.; Ozdemir, D. A Bi-Objective Supply Chain Design Problem with Uncertainty. Transp. Res. Part C Emerg. Technol. 2011, 19, 821–832. [Google Scholar] [CrossRef]
- Dubey, R.; Gunasekaran, A.; Papadopoulos, T.; Childe, S.J.; Shibin, K.T.; Wamba, S.F. Sustainable Supply Chain Management: Framework and Further Research Directions. J. Clean. Prod. 2017, 142, 1119–1130. [Google Scholar] [CrossRef]
- Rahbari, M.; Khamseh, A.A.; Mohammadi, M. A Novel Multi-Objective Robust Fuzzy Stochastic Programming Model for Sustainable Agri-Food Supply Chain: Case Study from an Emerging Economy. Environ. Sci. Pollut. Res. Int. 2023, 30, 67398–67442. [Google Scholar] [CrossRef]
- Wang, M.; Islam, S.; Yang, W. Supply Chain Risks in the Dairy Industry. Benchmark. Int. J. 2025. ahead-of-print. [Google Scholar] [CrossRef]
- Nayeri, S.; Paydar, M.M.; Asadi-Gangraj, E.; Emami, S. Multi-Objective Fuzzy Robust Optimization Approach to Sustainable Closed-Loop Supply Chain Network Design. Comput. Ind. Eng. 2020, 148, 106716. [Google Scholar] [CrossRef]
- Talaei, M.; Farhang Moghaddam, B.; Pishvaee, M.S.; Bozorgi-Amiri, A.; Gholamnejad, S. A Robust Fuzzy Optimization Model for Carbon-Efficient Closed-Loop Supply Chain Network Design Problem: A Numerical Illustration in Electronics Industry. J. Clean. Prod. 2016, 113, 662–673. [Google Scholar] [CrossRef]
- Gholizadeh, H.; Jahani, H.; Abareshi, A.; Goh, M. Sustainable Closed-Loop Supply Chain for Dairy Industry with Robust and Heuristic Optimization. Comput. Ind. Eng. 2021, 157, 107324. [Google Scholar] [CrossRef]
- Tirkolaee, E.B.; Aydin, N.S. Integrated Design of Sustainable Supply Chain and Transportation Network Using a Fuzzy Bi-Level Decision Support System for Perishable Products. Expert Syst. Appl. 2022, 195, 116628. [Google Scholar] [CrossRef]
- Zarei-Kordshouli, F.; Paydar, M.M.; Nayeri, S. Designing a Dairy Supply Chain Network Considering Sustainability and Resilience: A Multistage Decision-Making Framework. Clean Technol. Environ. Policy 2023, 25, 2903–2927. [Google Scholar] [CrossRef]
- ISO 14040; Environmental Management—Life Cycle Assessment—Principles and Framework. International Standard Organization (ISO): Geneva, Switzerland, 2006. Available online: https://www.iso.org/obp/ui#iso:std:iso:14040:ed-2:v1:es (accessed on 21 November 2021).
- Kumar, A.; Kumar, K. An Uncertain Sustainable Supply Chain Network Design for Regulating Greenhouse Gas Emission and Supply Chain Cost. Clean. Logist. Supply Chain 2024, 10, 100142. [Google Scholar] [CrossRef]
- Jezewski, M.; Czabanski, R.; Leski, J. Introduction to Fuzzy Sets. In Theory and Applications of Ordered Fuzzy Numbers; Studies in Fuzziness and Soft Computing; Springer: Cham, Switzerland, 2017; pp. 3–22. ISBN 978-3-319-59613-6. [Google Scholar]
- González-García, S.; Castanheira, É.G.; Dias, A.C.; Arroja, L. Using Life Cycle Assessment Methodology to Assess UHT Milk Production in Portugal. Sci. Total Environ. 2013, 442, 225–234. [Google Scholar] [CrossRef]
- Baldini, C.; Gardoni, D.; Guarino, M. A Critical Review of the Recent Evolution of Life Cycle Assessment Applied to Milk Production. J. Clean. Prod. 2017, 140, 421–435. [Google Scholar] [CrossRef]
- Tumpa, T.J.; Ali, S.M.; Rahman, M.H.; Paul, S.K.; Chowdhury, P.; Rehman Khan, S.A. Barriers to Green Supply Chain Management: An Emerging Economy Context. J. Clean. Prod. 2019, 236, 117617. [Google Scholar] [CrossRef]
- Flores-Siguenza, P.; Marmolejo-Saucedo, J.A.; Niembro-Garcia, J. Robust Optimization Model for Sustainable Supply Chain Design Integrating LCA. Sustainability 2023, 15, 14039. [Google Scholar] [CrossRef]
- Abdallah, T.; Farhat, A.; Diabat, A.; Kennedy, S. Green Supply Chains with Carbon Trading and Environmental Sourcing: Formulation and Life Cycle Assessment. Appl. Math. Model. 2012, 36, 4271–4285. [Google Scholar] [CrossRef]
- Eltayeb, T.K.; Zailani, S.; Ramayah, T. Green Supply Chain Initiatives among Certified Companies in Malaysia and Environmental Sustainability: Investigating the Outcomes. Resour. Conserv. Recycl. 2011, 55, 495–506. [Google Scholar] [CrossRef]
| Disclaimer/Publisher’s Note: The statements, opinions and data contained in all publications are solely those of the individual author(s) and contributor(s) and not of MDPI and/or the editor(s). MDPI and/or the editor(s) disclaim responsibility for any injury to people or property resulting from any ideas, methods, instructions or products referred to in the content. |
© 2025 by the authors. Licensee MDPI, Basel, Switzerland. This article is an open access article distributed under the terms and conditions of the Creative Commons Attribution (CC BY) license (https://creativecommons.org/licenses/by/4.0/).


 ,
, 


