Article

Will Road Infrastructure Become the New Engine of Urban Growth? A Consideration of the Economic Externalities

1
Ocean College, Zhejiang University, Zhoushan 316021, China
2
Nanji Islands National Marine Nature Reserve Administration, Wenzhou 325000, China
3
School of Economics and Management, Ningbo University of Technology, Ningbo 315000, China
*
Author to whom correspondence should be addressed.
Sustainability 2025, 17(15), 6813; https://doi.org/10.3390/su17156813
Submission received: 25 May 2025 / Revised: 22 July 2025 / Accepted: 23 July 2025 / Published: 27 July 2025

Abstract

Highway accessibility plays a vital role in supporting local economic development, particularly in regions lacking access to sea or river ports. Recognizing the functional transformation of road infrastructure, the Chinese government has made substantial investments in its expansion. Nevertheless, a theoretical gap remains in justifying whether such investments yield significant economic returns. Drawing on the theory of economic externalities, this study investigates the causal relationship between highway development and regional economic growth, and assesses whether highway construction leads to an acceleration in growth rates. Utilizing panel data from 14 Chinese cities spanning 2000 to 2014, the synthetic control method (SCM) is employed to evaluate the economic externalities of highway investment. The results indicate a positive impact on surrounding industries. Furthermore, a growth rate forecasting analysis based on Back-Propagation Neural Networks (BPNNs) is conducted using industrial enterprise data from 2005 to 2014. The growth rate in the treated city is 1.144%, which is close to the real number 1.117%, higher than the number for the weighted control group, which is 1.000%. The findings suggest that the growth rate of total industrial output improved significantly, confirming the existence of positive spillover effects. This not only enriches the empirical literature on transport infrastructure but also provides targeted enlightenment for the sustainable development of urban economy in terms of policy guidance.

1. Introduction

In the current era, global emergencies—such as trade conflicts and public health crises—have posed significant challenges to economic stability, disrupted international trade flows, and heightened the imperative to stimulate domestic demand. Highway networks play a critical role in the process, influencing factors such as efficiency, investment flows, and production costs [1], contributing a lot to regional sustainable development. An in-depth study of this issue can not only enrich the empirical literature on transport infrastructure but also provide targeted policy insights for industrial upgrading and spatial optimization in urban economies. Yet, what remains surprising is the contrast between the abundance of research in the field of port [2,3] and maritime transportation and the relative scarcity of studies in the field of highway transportation. Historically, public sector planning has emphasized that enhanced transportation accessibility—particularly through transportation infrastructure—promotes local manufacturing growth and economic development, a belief further reinforced during the pandemic. Despite this recognition, investment priorities have long centered on seaports, often overlooking the leadership role that road infrastructure can play beyond merely serving hinterlands [4,5]. Since 2005, Chinese central and local governments have introduced a series of industrial policies aimed at urban economic transformation through industrial upgrading, yet road infrastructure development remains far from being prioritized.
The road infrastructure, as the backbone system of urban spatial structure, serves not only as a physical channel for urban logistics and personnel mobility but also profoundly impacts the economic vitality of cities. In terms of promoting economic sustainability, it primarily manifests in enhancing industrial agglomeration and regional competitiveness. The improvement of highway networks reduces transportation costs and commuting times, enhances enterprise logistics efficiency, and creates conditions for the clustering of manufacturing, commerce, and logistics parks.
From an economic perspective, this phenomenon exemplifies what is termed transportation externalities—a condition where public investment in transportation infrastructure yields positive spillover effects for surrounding economic entities. Although a growing body of literature has improved our understanding of such externalities, three major gaps persist in the research. First, most existing studies focus on correlation rather than causation [6,7], offering limited guidance for evidence-based policymaking [8]. Second, the current literature reveals a persistent bias: highway investments are often undervalued compared to seaport developments [5,9]. Third, in quasi-experimental designs, one of the most pressing methodological challenges is how to construct a credible control group that mirrors the treated unit in all relevant aspects except for the intervention.
This study mainly aims to “rethink the value of highway investment” by assessing the economic externalities of road infrastructure. Specifically, it constructs a causal inference framework that applies the synthetic control method (SCM) to identify the economic impacts of policy interventions and employs a Back-Propagation Neural Network (BPNN) to forecast the dynamic growth of industrial output. The objective of this study is to reveal how highway development can promote coordinated regional economic development. Compared with existing studies, the innovation of this paper lies in its integration of causal identification and machine learning techniques, balancing the rigor of policy evaluation with predictive capabilities. By focusing on a causal inference perspective, this study not only contributes to the empirical literature but also provides valuable insights for policy practitioners regarding the industrial upgrading and spatial reconfiguration of city economies.

2. Literature Review

2.1. Highway Economic Effect and Its Function Conversion

The economic impact of highways has long been associated with their function as extensions of seaport hinterlands. Early studies by Van Klink and van den Berg (1998) [10] as well as Wilmsmeier et al. (2011) [11] highlighted the critical role of inland transport networks, including highways, in supporting seaport operations and enhancing hinterland connectivity. Building upon this foundation, subsequent research continued to affirm the economic contribution of inland ports—often viewed as logistical appendages to seaports—particularly through the lens of transportation accessibility and supply chain efficiency [9,12].
However, as research deepened, a growing body of scholars began to challenge this peripheral perspective. Recent studies argue that inland ports, supported by road infrastructure, should not be seen merely as passive extensions but rather as active engines of regional economic development. Wilmsmeier, Monios, and Lambert (2011) [11] advocate for repositioning road infrastructures which support inland ports as strategic leaders in urban industrial transformation. Parallel to this, another stream of the literature emphasizes the catalytic role of highway investment in attracting manufacturing industries to local cities, suggesting that governments should adopt more proactive policies—such as “inside-out” development strategies—to fully leverage this potential [13,14].
Despite this growing interest, the empirical literature still faces notable limitations. In particular, the causal relationship between highway investment and local economic growth remains underexplored. Most existing studies rely on correlational evidence, which constrains their ability to inform effective policy intervention. As Witte et al. (2017) [9] point out, there is a persistent undervaluation of road infrastructure relative to seaports in both academic research and public investment priorities.
In light of these gaps, the present study seeks to contribute to the literature by re-evaluating the economic role of highways from the perspective of transportation externalities. By employing predictive modeling techniques to estimate the growth rate effects associated with highway investment, this research aims to provide robust empirical evidence on the causal impact of road infrastructure on urban industrial development.

2.2. The Evaluation Methods

With the continuous increase in China’s annual investment in highway transportation infrastructure, the need for robust and reliable policy evaluation methods has become increasingly important. In particular, assessing whether such large-scale investments generate meaningful economic returns and social benefits is crucial for guiding future infrastructure policy [15].
Traditionally, most empirical studies have employed general regression models to explore the relationship between transportation infrastructure and economic outcomes. These studies, based on macro-level data, consistently report a positive correlation between infrastructure improvement and economic growth [6,7,16,17,18,19]. However, the recent literature has increasingly acknowledged a critical limitation in this body of work, namely, the lack of rigorous causal inference regarding the effects of transportation investment policies [8]. This gap undermines the utility of such findings for evidence-based policymaking.
Moreover, the precision of empirical results is highly sensitive to the granularity of the data employed. Scholars have noted that micro-level data enables a more nuanced understanding of economic interactions and provides more accurate insights into the mechanisms underlying infrastructure-driven development [20,21]. Another methodological challenge lies in the potential bias caused by policy endogeneity and self-selection, as infrastructure projects are rarely assigned randomly. The exogenous nature of governmental decision-making in selecting investment locations often violates the assumptions required for unbiased estimation, thus complicating the identification of true causal effects.
To address these methodological challenges, this study adopts the synthetic control method (SCM), a data-driven approach that has emerged as a credible alternative for policy evaluation in non-randomized settings. SCM constructs a counterfactual control unit by creating a weighted combination of untreated units that closely resemble the treated unit in terms of observed covariates and pre-intervention outcomes. This method minimizes selection bias and enhances comparability, enabling researchers to estimate what would have occurred in the absence of intervention. In this study, cities that received new highway investments are compared with a synthetic control composed of cities with similar economic and demographic characteristics but without highway access during the same period.

3. Case Background

In recent years, the Chinese government has increasingly recognized the critical role of inland transportation in promoting urban development. As a result, substantial capital has been allocated to the construction and improvement of inland transportation infrastructure. In the past, the construction of road infrastructure was more closely related to passenger transport, but it is now acknowledged that the improvement of road networks will promote industrial agglomeration [4], and the construction of road infrastructure optimizes the regional transportation environment, reduces transportation costs and time, and promotes industrial agglomeration through economies of scale and siphon effects [5].
Compared with other transport modes, road transportation has a broader and more immediate spillover effect on various sectors of the national economy. Its infrastructure investments often generate increased productivity in manufacturing and related industries by enhancing connectivity and reducing logistics costs [22]. Nevertheless, road infrastructure remains underappreciated in many policy circles, often regarded as subordinate extensions of infrastructures such as seaports. This narrow perspective neglects the fact that road infrastructure can exert significant economic influence even when located far from coastal gateways, particularly in large industrial economies like China [5].
As a major industrial power, China’s secondary sector—especially manufacturing—has long been the principal engine of GDP growth. In response to industrial decline in certain regions and growing global competition, the Chinese government has adopted various strategies to reinvigorate industrial development. Notably, in 2005, the Ministry of Transport issued the Outline of Development Plan for Highway and Waterway Transportation to Revitalize the Northeast Old Industrial Base (hereafter referred to as the “planning policy”). The policy explicitly proposed for the first time to “rationally adjust the layout of freight hub terminals and accelerate the construction of specialized and fast freight terminals, focusing on central cities and relying on expressways and trunk highways. It also emphasized the need to strengthen the service functions of freight hubs, expand functions such as express transportation, multimodal transport, specialized freight services, and modern logistics, and promote the transformation of terminals toward specialization and modernization”. This policy marked the first formal effort to integrate highway development into national transport and industrial planning, with the explicit aim of supporting industrial rejuvenation in the three northeastern provinces: Heilongjiang, Jilin, and Liaoning.
Prior to the policy implementation, the road infrastructure in these provinces was poorly developed, with insufficient road mileage and limited connectivity. To address these shortcomings, the planning policy proposed the construction of a regional highway skeleton network totaling 14,000 km, including 5780 km in Heilongjiang, 4200 km in Jilin, and 4160 km in Liaoning. The overarching objective was to provide reliable transportation support to industrial enterprises and enhance international competitiveness through logistical efficiency.
However, despite its ambitious scope, the actual effectiveness of this planning policy in achieving its intended economic outcomes—particularly with regard to industrial revitalization—remains uncertain. This raises an important empirical question: To what extent has road infrastructure construction, as a strategic inland infrastructure investment, contributed to regional economic growth and industrial performance?

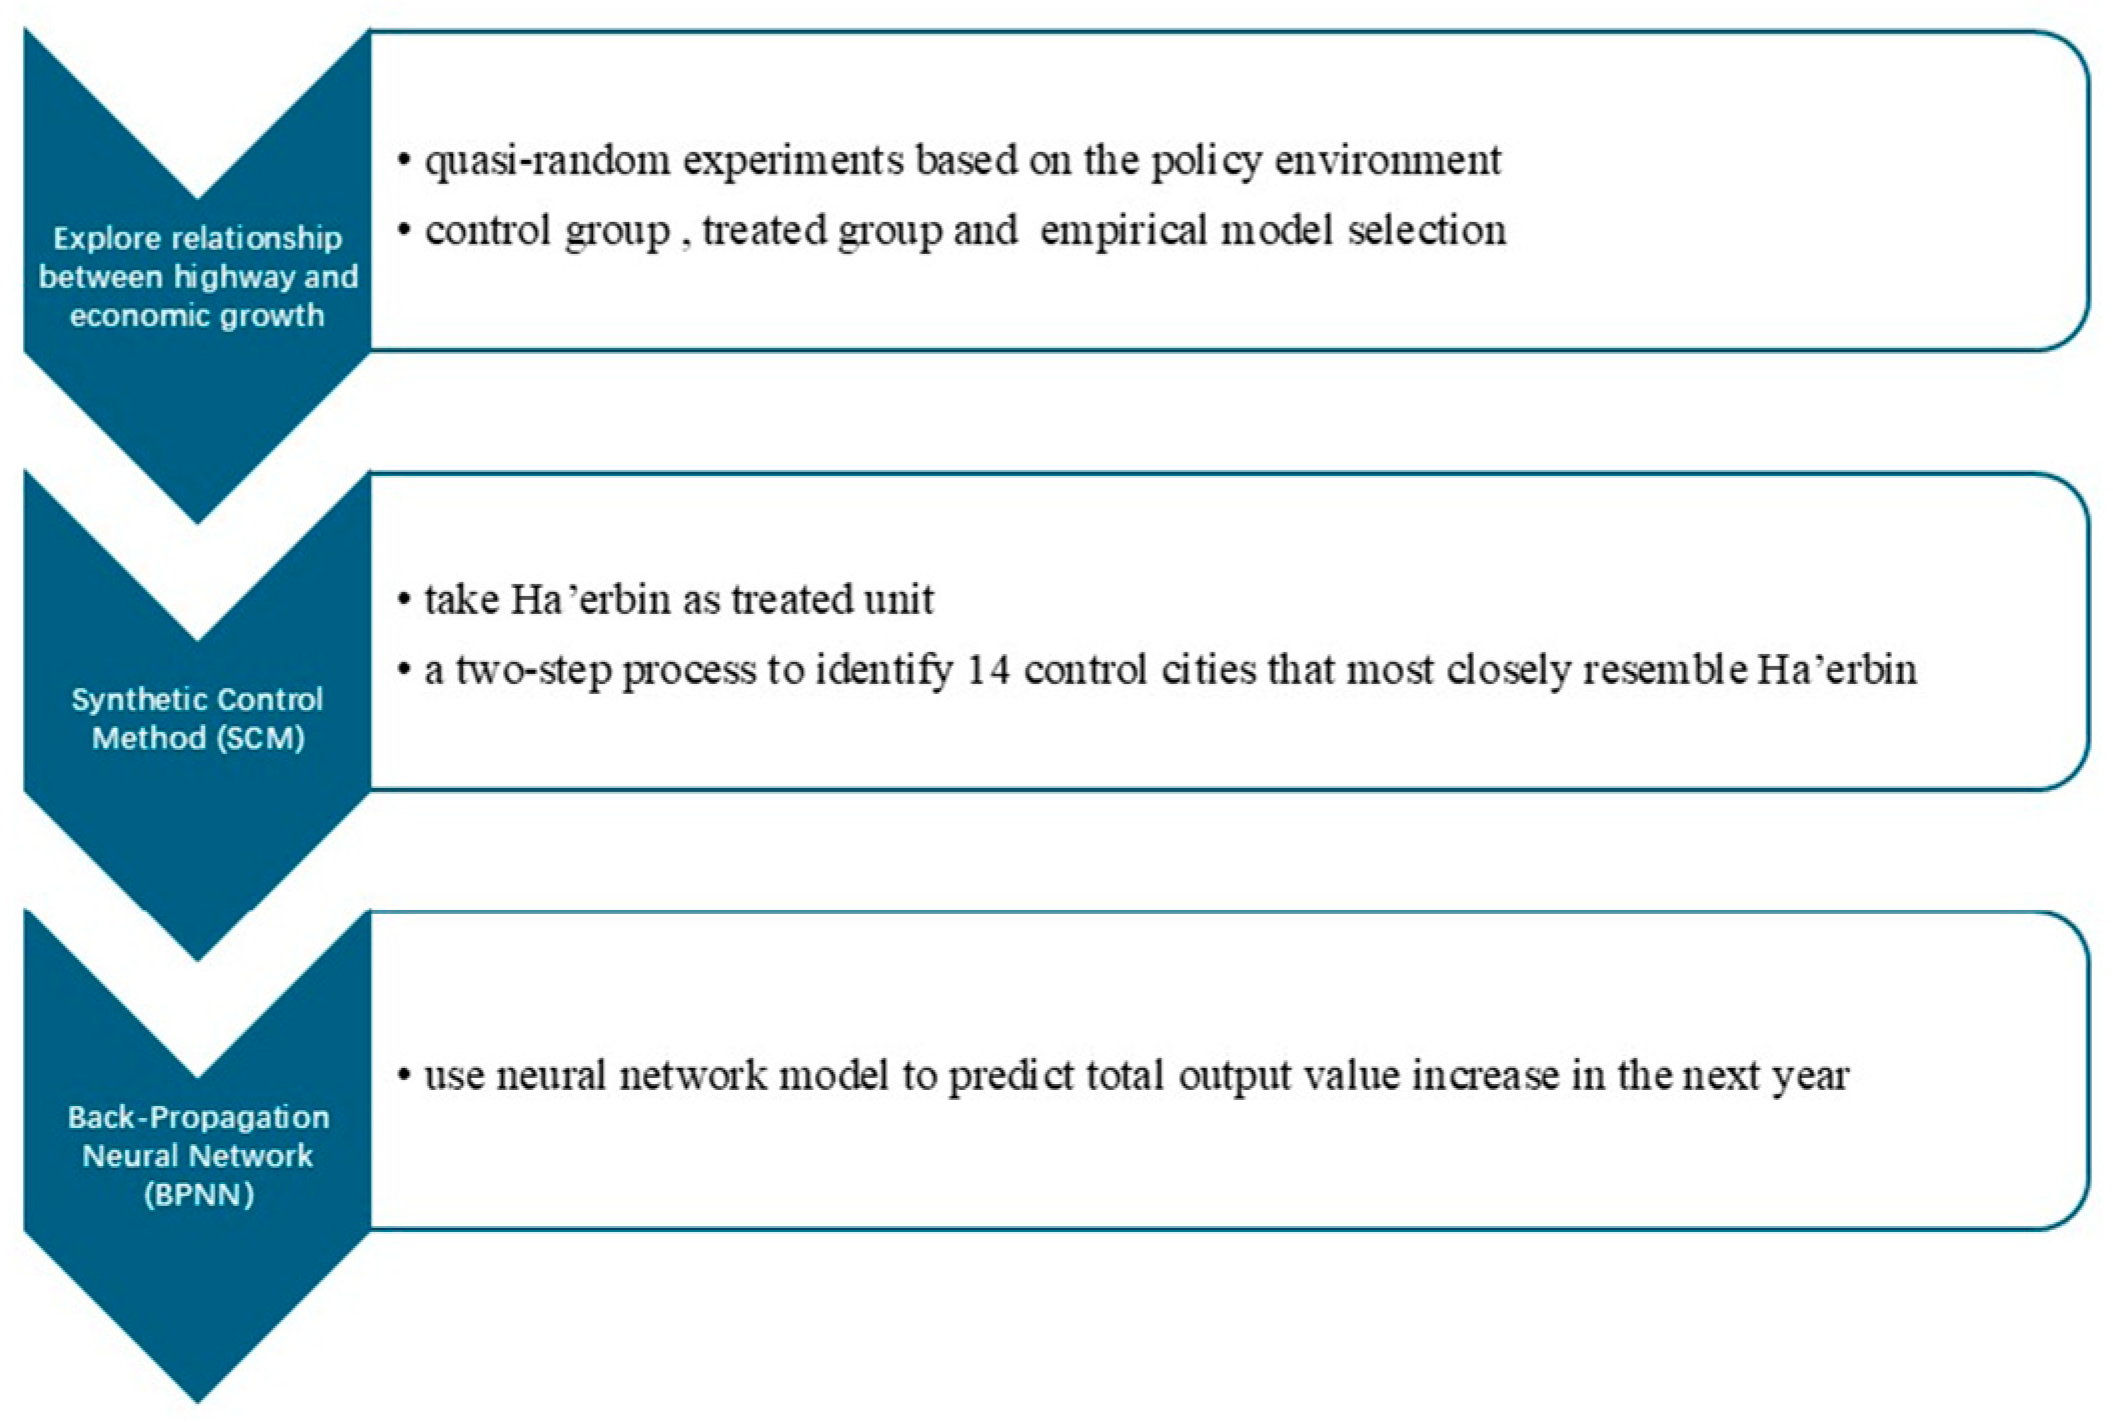
4. Research Method and Data

The extent to which firms are affected by the planning policy is determined by the local governments, considering their city characteristics, and network length used [23]. Therefore, in this paper, we choose Ha’erbin as the treated city, and due to having the longest network length in 2005, the SCM is applied at the initial stage. By weighing the observations in the control groups according to their regional weights, we further conducted firm-level analyses from 2005 to 2013 by using a neural network model to predict total output value increase in the next year. The rationale for combining SCM and BPNN lies in their complementary strengths in causal identification and nonlinear modeling. On one hand, the synthetic control method (SCM) effectively constructs a credible control group, substantially mitigating estimation bias arising from omitted variables or sample selection issues, thereby enhancing the validity of causal inference. On the other hand, Back-Propagation Neural Networks (BPNNs) are particularly adept at capturing complex nonlinear relationships between variables, helping to overcome model mis-specification errors inherent in traditional causal models. Consequently, this integrated approach not only improves the robustness of estimated effects but also strengthens the ability to characterize the dynamic impacts of policy interventions. A flowchart of the technical approach of the study can be found in Figure 1.

4.1. Selection of Control Cities

A central challenge in policy impact evaluation is identifying a credible control group that closely resembles the treated unit in all relevant dimensions, except for exposure to the treatment. To meet this requirement, we employ the synthetic control method (SCM), a data-driven approach initially proposed by Abadie and Gardeazabal (2003) [24] and later refined and applied by Abadie, Diamond, and Hainmueller (2010, 2014) [25,26]. SCM constructs a counterfactual trajectory for the treated unit by generating a weighted combination of untreated units that best replicate the treated unit’s characteristics and outcome trends in the pre-treatment period. In the synthetic control method, the donor pool is a key term that refers to a subgroup of untreated units or control units. Therefore, the possible untreated cities used to create the synthetic control method are conventionally called potential donor cities. Generally, when constructing potential donor cities, the potential donor cities are composed of units that do not experience an intervention, and the pre-intervention data are used to calculate the weights. However, potential donor cities are most likely to include units that are significantly different from the control group sample, resulting in a failure to generate synthetic cities that are as similar as possible to treatment cities. To address this important issue, Abadie and his colleagues (2015) [26] suggested restricting the potential donor cities to be as similar to the case and treatment group samples of a study as possible. This approach not only improves estimation credibility but also reduces subjectivity in the selection of control groups.
In this study, SCM is first used to identify a group of control cities that most closely resemble Harbin, our treated unit, which is a prefecture-level capital city in Heilongjiang Province. The SCM-generated control units serve as a synthetic counterpart to Harbin, allowing for aggregate-level comparison of policy outcomes. However, a well-known limitation of SCM is that it produces a composite estimate at the aggregate level, making it difficult to assess intra-unit heterogeneity or to calculate entity-specific growth outcomes.
Based on observed quantifiable characteristics, the synthetic control method can weight the outcomes of control units to construct a ‘counterfactual’ untreated outcome for the treated unit. Consequently, the synthetic control method offers an irreplaceable advantage, as it can be used to construct a new control group whose outcome variables and covariates are similar to those of the actual treated group before policy implementation, while reducing the degrees of freedom in selecting the control group. This paper utilizes the synthetic control method first. The specific calculation process of the model is as follows [24]:
Y i t N = δ t + θ t Z i + λ t μ i + ε i t
where the subscript i denotes the city, i = 1 , 2 , , j + 1 , and the subscript t denotes the time period, t = 1 , 2 , T 0 , T , with T 0 being the year of policy implementation. Assume Y i t I   represents the GDP of the secondary industry of a city affected by the road infrastructure during the period, so in the pre-intervention period, t = 1 , 2 , T 0 , and Y i t N = Y i t I . In the post-intervention period where t > T 0 , the effect of the road infrastructure can be expressed as α i t = Y i t I Y i t N . For the control group, Y i t N is a known parameter, and Y i t I is an unknown parameter representing the ‘counterfactual group’ to be synthesized, while for the treated group, these two parameters are reversed. When calculating the city’s GDP of the secondary industry before the intervention, δ t represents the time fixed effect, Z i is a vector of control variables, and λ t is a vector of 1 × F unobservable common factor fixed effects.
Let us assume i = 1 , the road infrastructure construction city, and the remaining J potential control group cities are unaffected cities. Consider the vector J × 1 , where W = ( w 2 , w 3 , w 4 , , w J + 1 ) , w j 0 , w 2 + w 3 + w 4 + + w J + 1 = 1 , and each vector represents a virtual synthetic control combination. At this time, let us assume the vector W * = ( w 2 * , w 3 * , w 4 * , , w J + 1 * ) when t T 0 , and j = 2 J + 1 w j * Y j t = Y 11 , , j = 2 J + 1 w j * Y j T 0 = Y 1 T 0 , j = 2 J + 1 w j * Z j = Z 1 , and in the study by Abadie et al. (2010) [25], it has been proven that when t T 0 , Y 1 t N 2 J + 1 w j * Y j t N equals 0. Therefore, based on the ‘counterfactual’ control group, the road infrastructure construction city can be synthesized from the remaining potential control group cities, i.e., a i t = j = 2 J + 1 w j * a j t .
Finally, when Y 1 t I a 1 t j = 2 J + 1 w j * ( Y j t I a j t ) equals 0, it implies that j = 2 J + 1 w j * Y j t I can be considered an unbiased estimator of Y 1 t I , indicating that a 1 t can be described as an estimator of Y 1 t I = Y 1 t I Y 1 t N , which can be used to estimate whether the road infrastructure construction generates economic effects.
To address this limitation, we complement the SCM analysis with a Back-Propagation Neural Network (BPNN) model. After constructing the synthetic control group using SCM, we move to the firm level and use micro-level data from individual industrial enterprises. The values derived from the SCM estimation serve as inputs to the BPNN, enabling us to examine firm-level responsiveness to policy intervention. The neural network’s strong nonlinear learning capacity allows it to capture complex relationships in the data and generate more precise forecasts. This step facilitates a more nuanced analysis of which types of firms are most sensitive to policy effects and the variation in their responses, thus enhancing the overall robustness of the evaluation.
The treated unit, Harbin, was selected based on its inclusion in the national road infrastructure construction policy initiated in 2005. To identify suitable donor cities for SCM, we adopted a two-step screening process. First, we limited the pool to provincial capital cities, given Harbin’s status. Second, we excluded cities that had themselves implemented large-scale road infrastructure construction policies or lacked complete economic data over the analysis period. After filtering, we identified 14 potential donor cities: Beijing, Yinchuan, Shanghai, Guangzhou, Changsha, Guiyang, Lanzhou, Nanning, Hohhot, Urumqi, Nanjing, Nanchang, Zhengzhou, and Wuhan.
We constructed a city-level annual panel dataset covering the period from 2000 to 2012. The year 2012 was chosen as the end of the observation window, as nationwide promotion of multimodal transport policies began that year, introducing potential confounding factors that could not be cleanly separated from the effects of road infrastructure construction investment.
Following the standard SCM procedure [25], we used two sets of variables for matching: (1) predictors of post-treatment outcomes and (2) pre-treatment outcomes. For the first group, we selected three key predictors—employment, fixed asset investment, and road freight volume—the latter serving as a proxy for transportation intensity and road infrastructure construction status [27]. All variables were log-transformed to reduce heteroscedasticity and scale differences. For the second group, we used logarithmic secondary industry GDP in 2002 and 2004 as pre-intervention outcomes, in line with established SCM applications [25,26,27]. These years provide a reliable baseline for measuring policy impacts over time and ensure comparability across units.
Table 1 compares the synthetic Ha’erbin and the real city of Ha’erbin alongside our selected variables. Compared with simply using the average of all the 14 prefecture-level cities, we have a better-matching result. The values of potential donor cities after constructing the synthetic Ha’erbin are shown in Table 2. Accordingly, Beijing, Changsha and Nanjing formed a control group. Hence, in the firm-level growth forecast, the result weights were determined, and we relied on firms in the aggregate three cities as a control group in later BP Neural Network prediction.

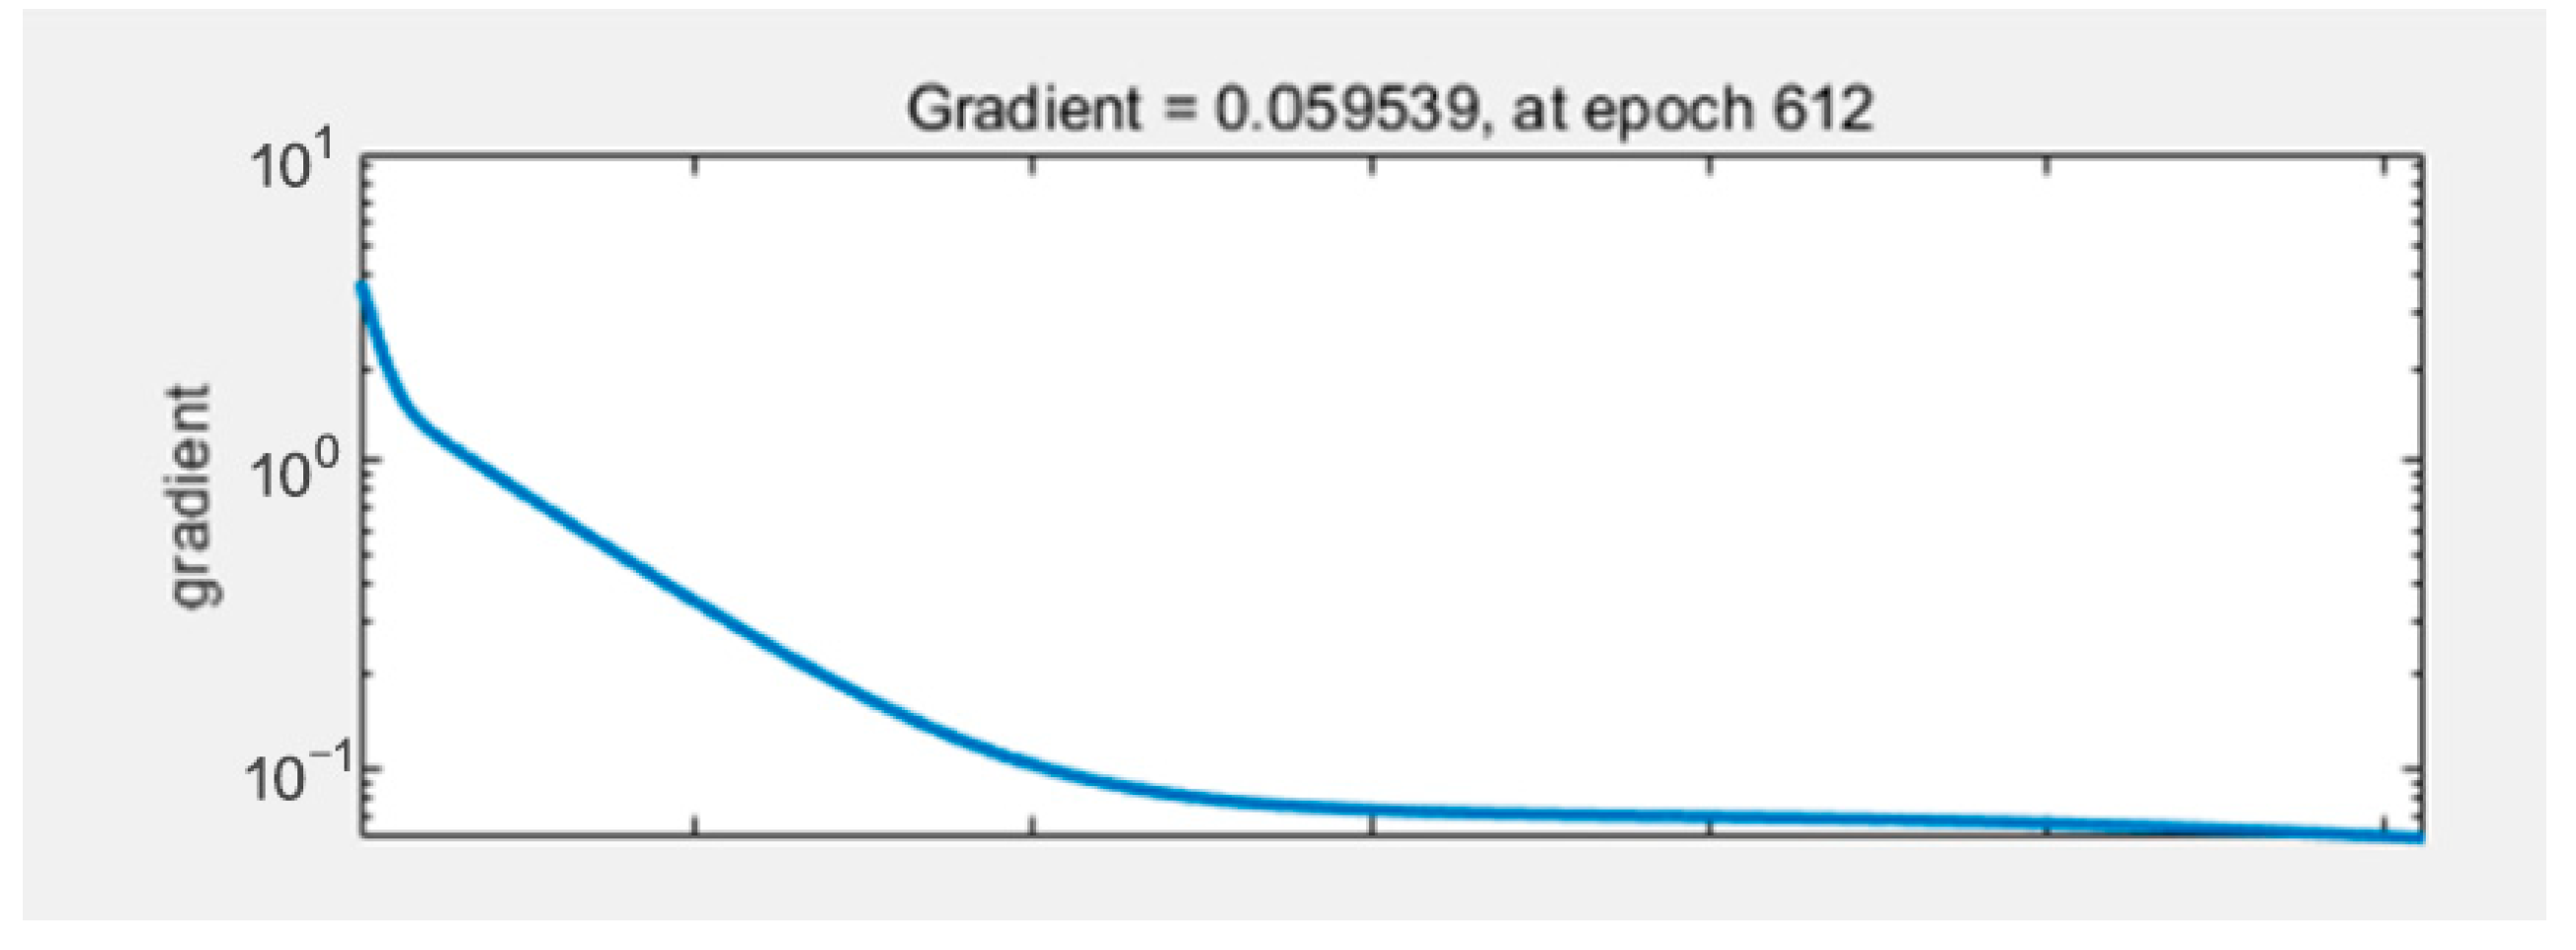
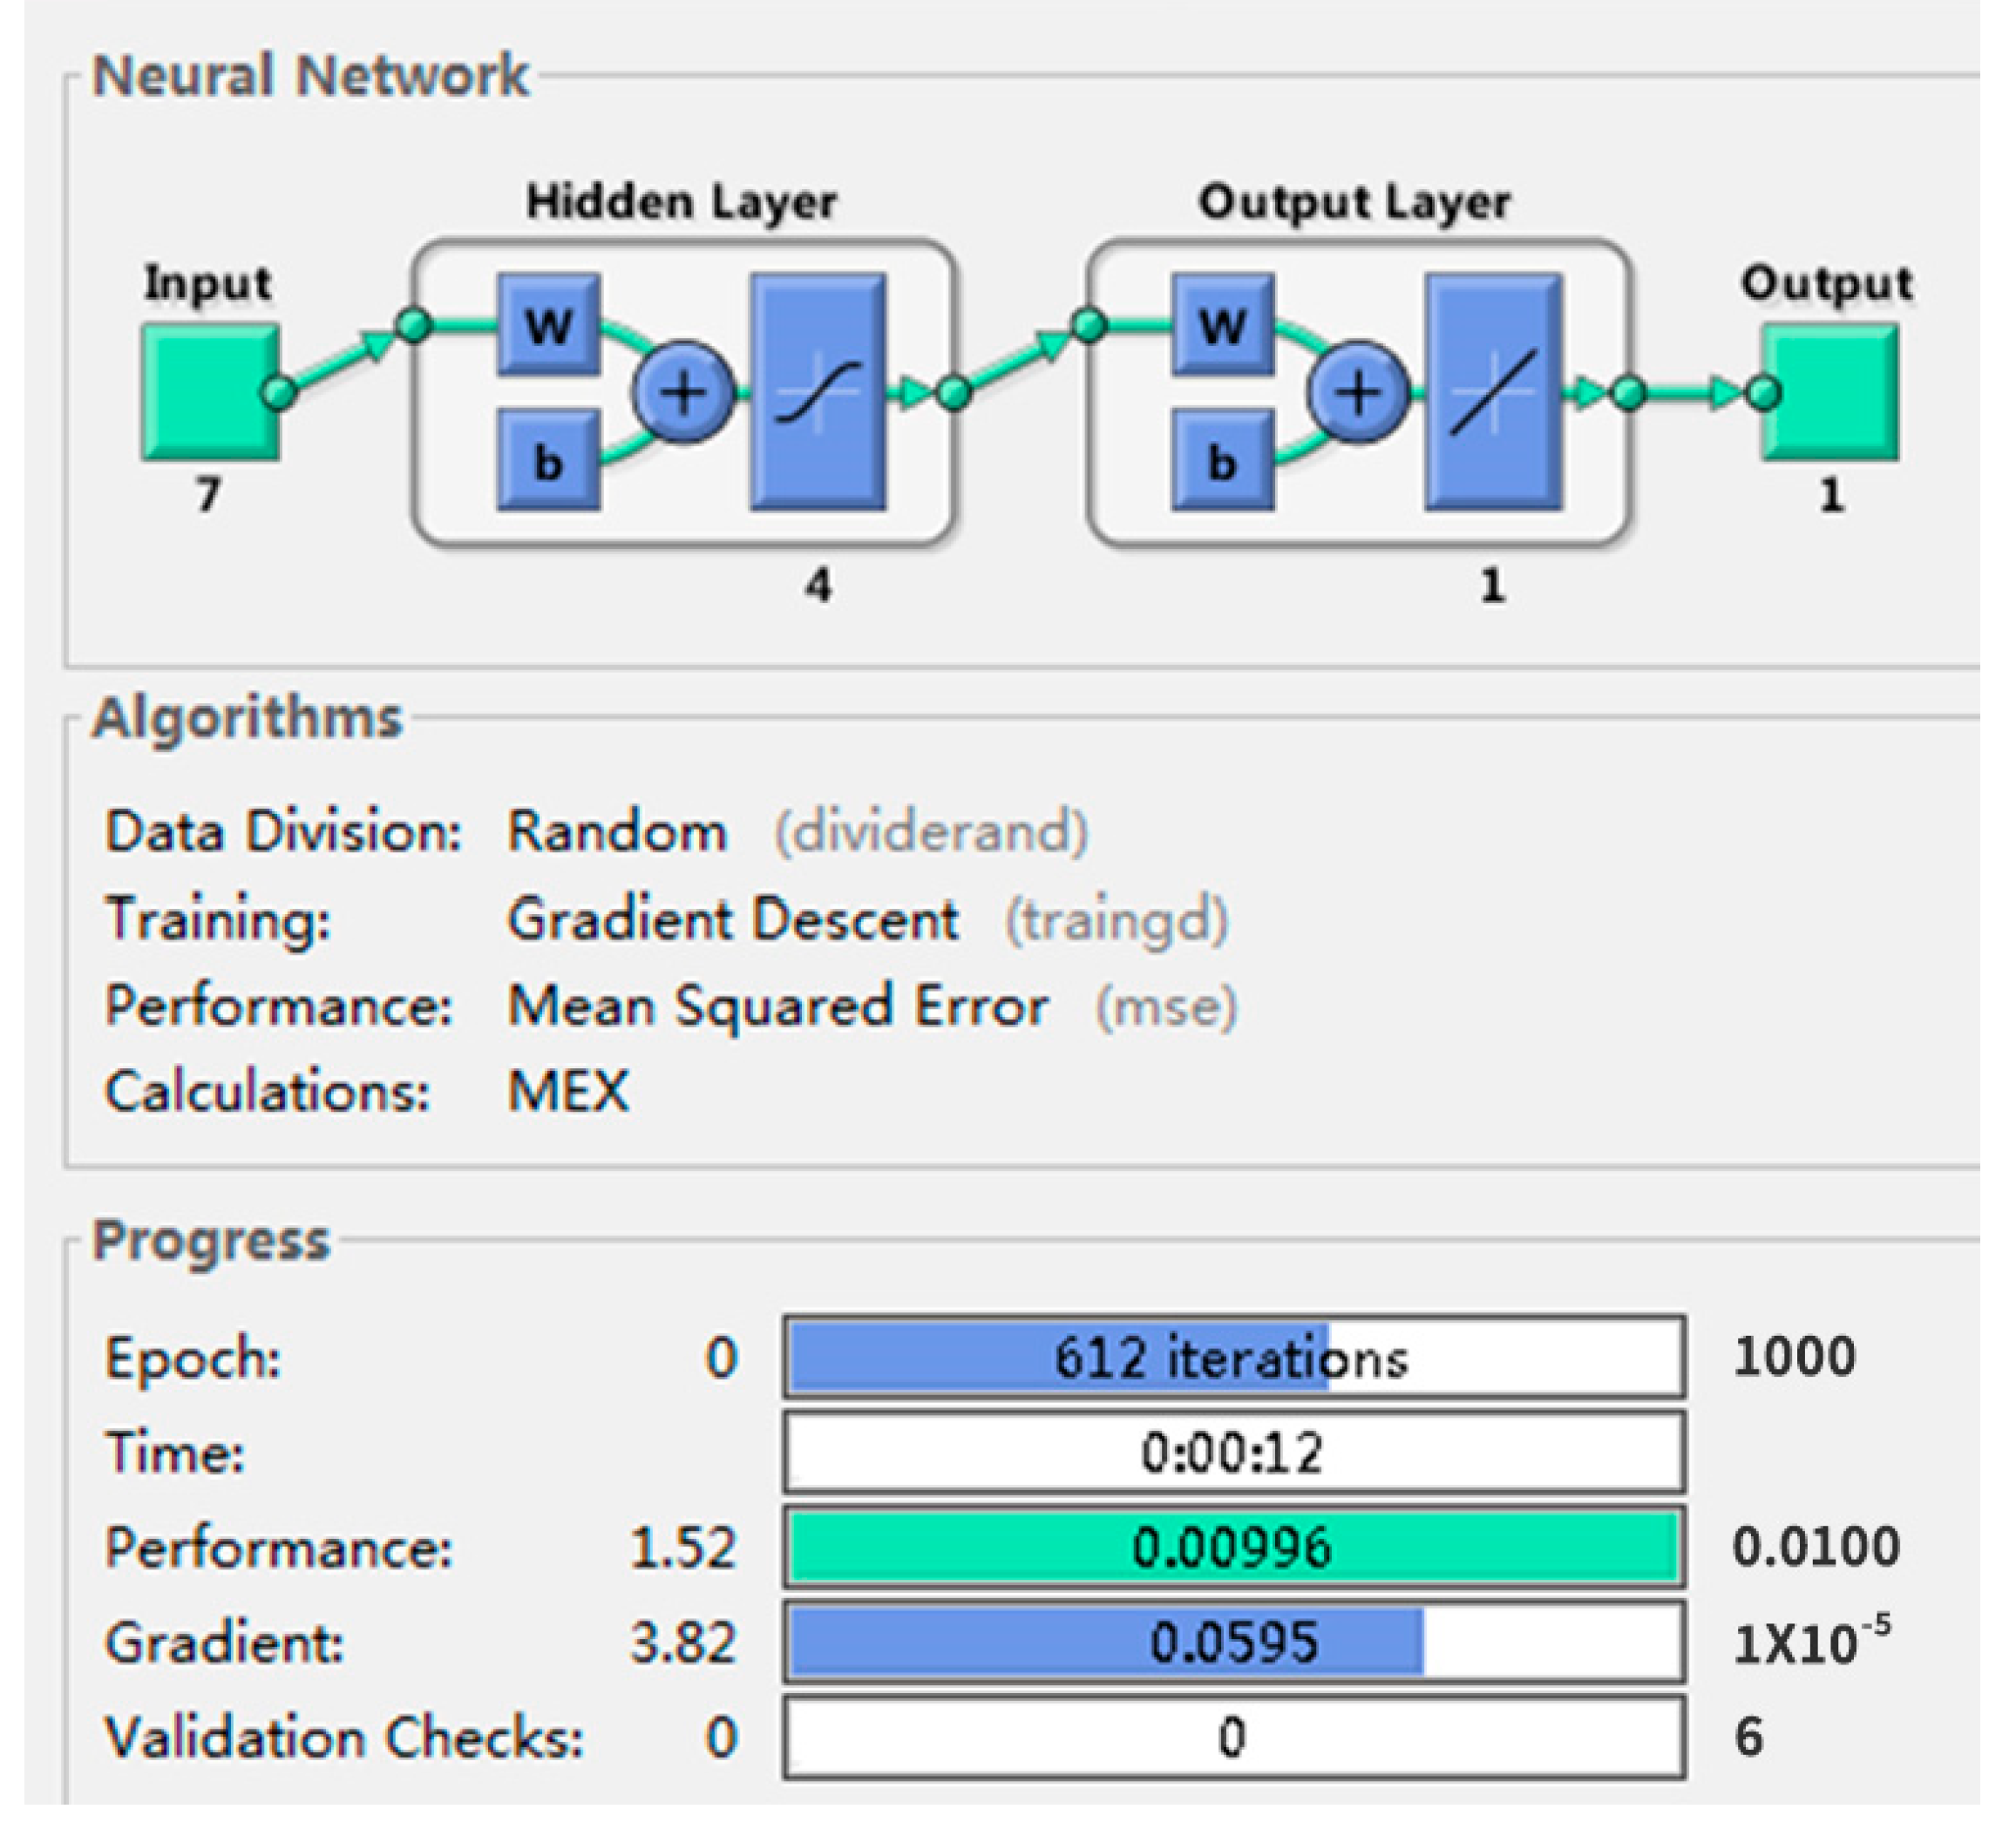
4.2. Back-Propagation Neural Network

The industrial enterprise database in China has only been updated up to 2015. Thus, we predict that the actual growth in the next year could accurately reflect highway economic externality. In our firm-level analysis, we use the years 2005 to 2013 for predicting 2014, and compare it with the real data in 2014 to test the robustness of our model. Moreover, all the observations in 2010 are missing data. The algorithm model can be specified as follows.

4.2.1. The Back-Propagation Neural Network Algorithm Model

The BP Network is also known as Back-Propagation Neural Network. Through the training of sample data, the network weights and thresholds are constantly modified to make the error function drop along the negative gradient direction and approach the expected output.
The BP Network is composed of an input layer, a hidden layer, and an output layer. The hidden layer can have one or more layers. The network uses an S-type transfer function: f x = 1 / 1 + e x . The error function via back-propagation is as follows: E =   i t i + O i 2 / 2 ( t i   is the expected output, and O i   is the calculated output of the network). We constantly adjusted the network weights and thresholds to minimize the error function.

4.2.2. Network Model Solving and Designing

For each year’s total output value, there is a nonlinear mapping relationship with the nature of the companies, number of employees, asset, fixed investment, and profit. Therefore, from 2005 to 2013, the total output value of the company, the nature of the companies, number of employees, asset, fixed investment and profit are input as a 9 × 5 matrix, and we will predict the nature of the companies, number of employees, assets, fixed investment and profit as output. The output layer is a 1 × 5 vector. Therefore, the input layer has 5 nodes and the output layer has 1 node.
Relevant research has shown that the neural network with a hidden layer can approximate a nonlinear function with arbitrary precision as long as there are enough hidden nodes. Therefore, this paper uses a three-layer multi-input single-output BP Network with a hidden layer to establish a prediction model. In the process of network designing, the determination of the number of hidden layer neurons is very important. Too many neurons in the hidden layer will increase the amount of network calculation and easily cause over-fitting problems; too few neurons will affect the network performance and fail to achieve the expected results. The number of hidden layer neurons in the network is directly related to the complexity of the actual problem, the number of neurons in the input and output layers, and the setting of expected errors. At present, there is no clear formula for determining the number of neurons in the hidden layer. There are only some empirical formulas. The final determination of the number of neurons still needs to be determined based on experience and many experiments. This article refers to the following empirical formula in selecting the number of hidden layer neurons:
l =   n + m + α
where n is the number of neurons in the input layer, m is the number of neurons in the output layer, and α is a constant between [4,14]. It can be calculated that the number of neurons is between 4 and 13. In this experiment, the number of hidden layer neurons is 6.
The variables are explained as follows: (1) We used the value of the firm’s total assets to capture the effect of financial capability on economic development [28]. Here, we took its logarithm, denoting it as (Asset). (2) The number of employees is commonly used as an indicator of firm size [29,30]; we took its logarithm and denoting it as (employee). (3) The scale of fixed investments affects both the capacity of production and output [27,31], which generates business ability. We believe that firms with more fixed investments will have higher sensitivity to transportation cost and economic change. In this paper, we took its logarithm, denoting it as (investment). (4) The annual profit represents the profitability of the company; for manufacturing firms, higher profit means more trade orders and higher input–output [32,33]. We believed that the manufacturing firms with better profitability would be more willing to participate in the road infrastructure construction planning policy implementation, which represents having better innovative cognition. Here, we took its logarithm, denoting it as (profit). (5) Some studies have documented the impact of ownership on economic performance or total output [34,35]. We classified firms into state-owned, foreign, and other firms, denoted in the analysis as SOE, Foreign and other, respectively.
In this paper, the data we used came from two major sources: (1) The economic data at prefecture level for selecting the control cities was collected from China’s National Bureau of Statistics, which provides all the indicators in the SCM, such as the secondary industry GDP, number of employees, investment and highway freight volume. (2) For predicting the increment of total output at firm level, the economic information including output, assets, number of employees, investment, profit, as well as demographic data such as name, location, nature, industry, was provided from the China Industry Enterprises Database, which is compiled by China’s National Bureau of Statistics, including industrial companies with annual sales higher than five million CNY (approximately 800,000 USD).
Before analysis, the basic data was first processed. There are some companies that have the following characteristics, for instance, the parent and subsidiary companies with the same company code in all the economic and operating information are completely the same; therefore, in order to ensure the accuracy of the results, this part of the data needs to be identified and deleted. After processing, Table 3 shows more details of the industrial sectors; we summarized the samples of manufacturing companies that operated in the cities of Ha’erbin, Beijing, Changsha and Nanjing. The meanings of codes are shown in Appendix A.
The statistical description of all these variables can be found in Table 4. In Table 4, the average number of employees in our sample is 240, which means that there are many small and medium firms in our sample, which would be more sensitive to economic changes under the transportation policy. In all the variables, the unit of the total value of output, asset, fixed investment, and profit is CNY 1000, the unit of employee is person, and the unit of age is year. Meanwhile, we set three 0–1 variables like state-owned, foreign and others, which represent enterprise nature: ‘1’ means ‘the same as indicator’, and ‘0’ is opposite to ‘1’.
Specifically, the analysis was conducted using MATLAB R2020a and Stata 17.0, on a computer equipped with Intel® i9 processor, 64GB of RAM, and Windows 11 operating system.

5. Results

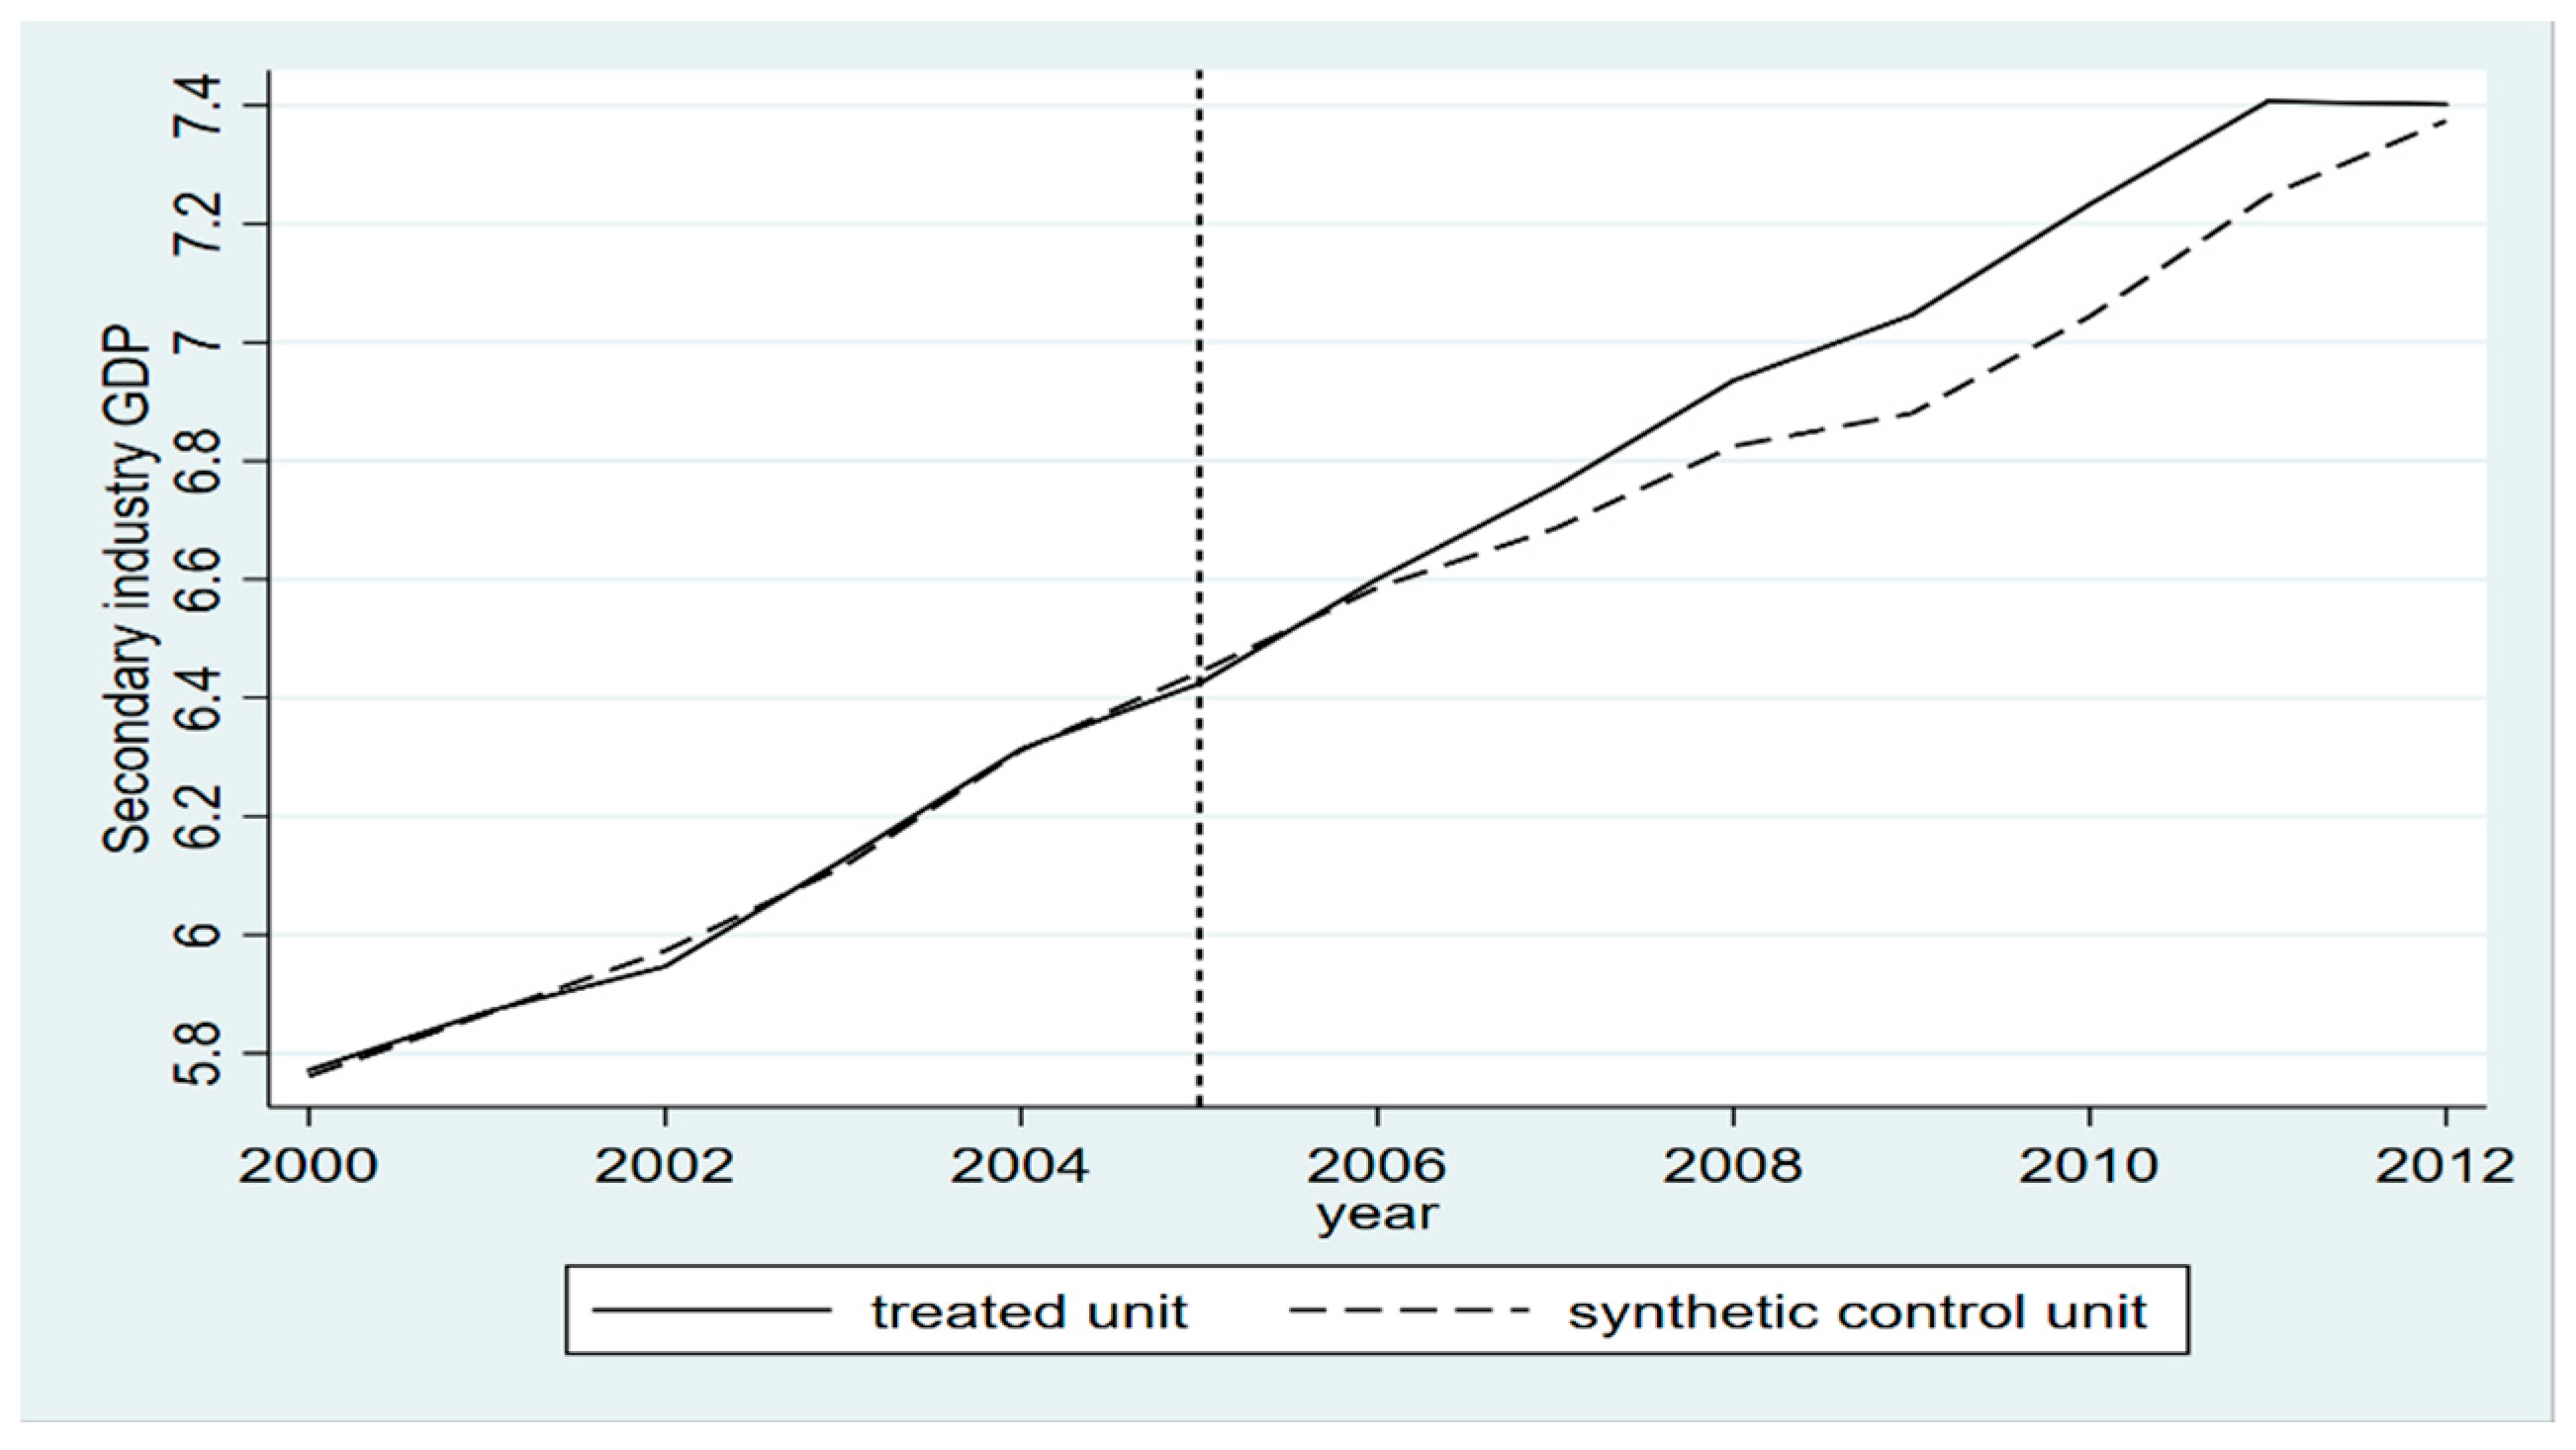
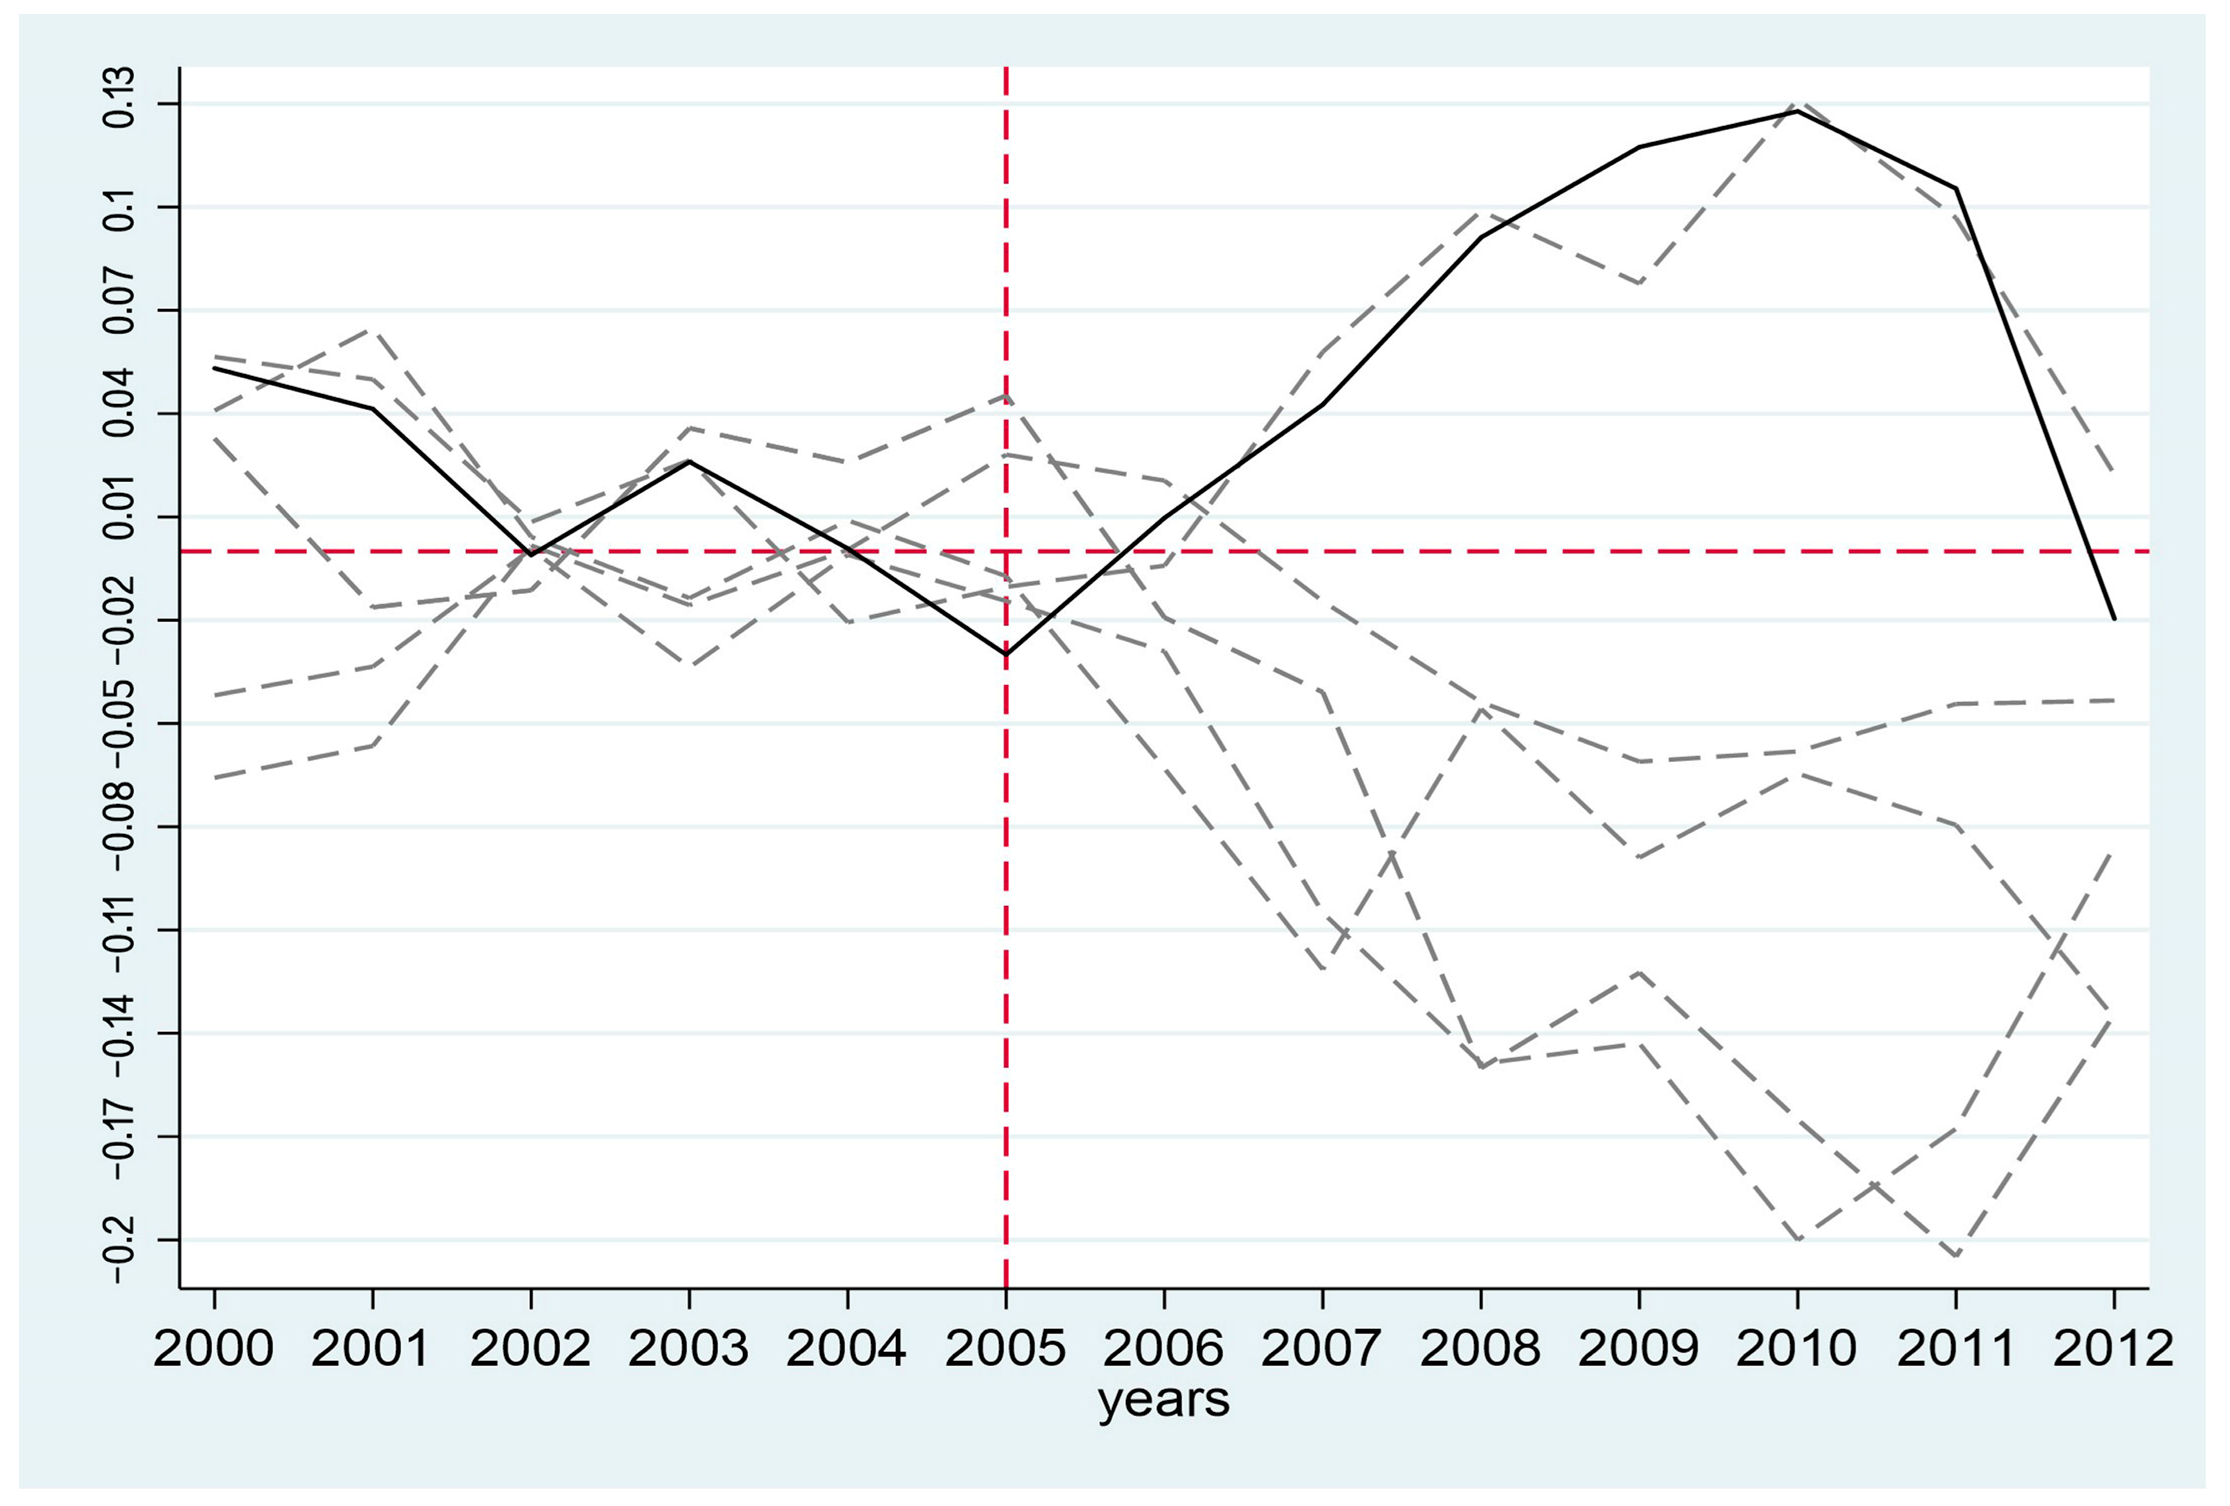
5.1. SCM Analysis at the City Level

It is our central interest to investigate the socio-economic benefits under the externality of the road infrastructure planning policy. In Figure 2, the change in the secondary industry GDP after the implementation of relevant policy in Ha’erbin is shown in comparison with the synthetic city of Ha’erbin; the constructed aggregate weights were derived from the SCM procedure, and the result is shown in Table 2.
In Figure 2, the effectiveness of the road infrastructure planning policy on the secondary industrial GDP growth is clearly demonstrated. The two lines largely overlap before 2005 (the dotted line in the figure), and this overlap lasted until 2006 which is a normal phenomenon. Actually, when finishing the investment and construction, the real operation needs some time to adapt and cause the economic performance increment, which has a hysteresis effect.
Later, the compared synthetic counterpart of Ha’erbin exhibits a noticeable drop. To ensure this result was not driven by chance, following Abadie and Gardeazabal (2003) [24], the placebo study was conducted. As seen in Figure 3, it cumulates the abnormal returns for the road infrastructure construction planning policy implementation and non-implementation from 2005. As shown in the placebo test graph, the solid black line represents the gap between the treated unit (Harbin) and its synthetic control, while the dashed gray lines show the placebo gaps for each control unit in the donor pool. The red vertical line marks the year of intervention (2005), and the red horizontal line represents the baseline of no treatment effect. The gap between the treated unit and its synthetic counterpart becomes increasingly positive after the intervention in 2005, indicating a significant treatment effect. In contrast, the placebo units (dashed lines) do not exhibit similar trends, suggesting that the observed effect is unlikely to be driven by random fluctuations or general trends. This supports the robustness of the SCM estimation. Due to practical growth that happened in 2006, the implemented portfolio outperforms the non-implemented portfolio for most of the test period.

5.2. Firm-Level SCM-BP Neural Network Predict by Using Controls from SCM

In the firm-level BP Neural Network forecast, we compared firms in the city of Ha’erbin to those in the cities of Beijing, Changsha, and Nanjing. The weighted control group was used as a different initial value, and just the growth rate in 2014 was compared.
The training sample data was first normalized and then inputted into the network. We set the hidden layer and output layer excitation functions as tansig and logsig functions, respectively. The network training function is tradingdx, the network performance function is mse, and the number of hidden layer neurons is initially set to 6. In order to set the network parameters, the following steps were taken. The number of network iterations epochs is 5000, the expected error goal is 0.01, and the learning rate LR is 0.01. After the setting is completed, the network will be trained. After multiple iterations, the neural network will stop training when the loss function reaches the minimum. In Figure 4, which is the network aiming to predict the total output value of companies in 2014, at epoch 612, we can learn that the gradient receded to the minimum, which means that the training result of this neural network has reached the global optimum. Figure 5 shows the structure of our network and the index of neural network training. After training, we predicted the total output value of the companies. The index of neural network training is shown in Figure 6. The prediction value is obtained after more than 612 iterations in all data; the growth rate next year in Ha’erbin is 1.144%, which is close to the real number 1.117%, and higher than the weighted control group, which is 1.000%.

6. Conclusions and Discussion

Facing quick social development, high hopes have been placed on the improvement of road accessibility, which has the potential to have equal economic value. Researchers have examined the relationship between road infrastructure and economic factors such as output growth [36] and productivity [37], and found a significant relationship among infrastructure and related outcomes [38]. Building on the existing literature, this study employs a combined approach of the synthetic control method (SCM) and BP Neural Network (BPNN) to achieve more robust causal inference. Regarding the spatial scale of analysis, most previous studies have examined the relationship between road infrastructure and economic growth at the national or regional level. However, transportation infrastructure typically serves limited geographic areas, and policy outcomes may result in differential economic impacts, stimulating growth in some regions or sectors while having neutral or even adverse effects in others. This heterogeneity partly explains the inconsistent findings in regional-level studies on the economic effects of road investment. Considering the rapid pace of urbanization in China, cities have become the primary administrative and spatial units driving economic growth. Thus, this study leverages city-level data to more accurately capture the practical impacts of road infrastructure on regional development. In terms of methodology, endogeneity remains a central empirical challenge in assessing the economic impact of road infrastructure. First, road placement is not random; policymakers tend to prioritize regions expected to experience higher economic growth or regions in need of development support, especially in underdeveloped areas. Second, systematic differences in natural geography, cultural background, and other unobservable factors across regions are often omitted from empirical models, leading to biased estimates. To address these issues, this study applies the synthetic control method, which effectively mitigates sample selection bias and omits variable bias, thereby improving the robustness of the estimated effects. According to our findings, road infrastructure development can positively stimulate urban economic growth.
This study empirically establishes a robust causal relationship between road infrastructure and urban economic development. However, several limitations remain. First, while this paper integrates the synthetic control method (SCM) with a Back-Propagation Neural Network to identify a deterministic relationship between the two, the “black-box” nature of neural networks limits interpretability. As a result, the specific functional form—whether linear or nonlinear—of the relationship remains unclear. According to C. P. Ng and colleagues, the relationship between urbanization and economic growth may exhibit an inverted U-shape. Whether road infrastructure exerts a similar nonlinear effect warrants further investigation. Second, although a large body of literature supports the positive economic impact of road infrastructure—and local governments have shown considerable enthusiasm for its development—China’s extensive railway network offers higher transport capacity and better environmental performance. From the perspective of green and sustainable development, future research should focus on systematically evaluating the trade-offs between highway and railway infrastructure and propose context-specific, cost-effective transportation strategies. Third, given the high population density and industrial concentration in most parts of China, highway investment tends to generate substantial economies of scale, thereby promoting urban economic growth. However, the applicability of this conclusion to other countries and regions remains uncertain. Further studies should conduct comparative analyses across different institutional, geographic, and economic contexts to test the generalizability of the findings. Lastly, there are potential negative externalities associated with the development of road infrastructure. For instance, road expansion is often accompanied by a rapid increase in vehicle ownership, which may pose significant challenges to urban sustainability. A large body of literature on the siting of transport and logistics infrastructure suggests that facilities such as logistics hubs, container terminals, and industrial parks should be relocated to areas outside densely populated urban centers, in order to mitigate the harmful impacts of traffic, industrial, and logistics-related emissions on residents. In the context of growing transport demand, such peripheral siting strategies not only help alleviate environmental pressures within cities but also facilitate the more efficient use of greener, higher-capacity transport modes, such as rail. Therefore, future studies should adopt a complex systems perspective to comprehensively assess the systemic impacts of various types of transport infrastructure—including but not limited to roads—on urban sustainable development.
Although this case provides valuable insights, it must be noted that the findings may not be directly generalizable to other regions without considering their specific regional and economic contexts. Future research should aim to include multiple case studies from different regions to validate the results and better understand the mechanisms through which road infrastructure investment influences urban economic development. In addition, it is worth noting that the empirical analysis is based on data from a single city and a limited donor pool, which may restrict the generalizability of the findings. Given China’s distinctive economic structure and regional heterogeneity, caution should be exercised when extrapolating results to other cities or regions. And the study does not explicitly address the sustainability of the observed effects over the long term. The persistence or attenuation of these effects warrants further investigation, particularly considering evolving economic and policy environments. Future research should aim to include multiple cities with diverse economic backgrounds and expand the donor pool for SCM analyses. Moreover, incorporating longitudinal data focusing on sustainability will help to validate and deepen the understanding of the mechanisms at play.
Our research has significant value for policymakers and confirms that China’s Central Government has chosen an effective policy. Firstly, after transforming the functional cognition of road transportation, we believe its investment is worthwhile and reasonable, although maybe the benefit in the first few years is not obvious. However, from the perspective of sustainable development, this long-term infrastructure project has the potential to significantly drive urban economic growth and therefore deserves strong policy support. For example, public–private partnerships (PPPs) with local state-owned enterprises can be promoted to address investment challenges and jointly create both economic and social value. Secondly, given the evidence that the plan for inland cities is to promote their industrial development through highways, the respective local government could construct road infrastructure to promote the formation of front and back industrial chains and then develop industrial parks or logistic parks surrounding cities. Hence, highways are a new engine of city growth, stimulating domestic demand and countering the devastating economic blow brought by COVID-19. In the future, we would like to investigate the diversity among different cities because the different cities’ characteristics would cause different results.

Author Contributions

Conceptualization, C.X. and K.Y.; methodology, Y.C.; software, Y.C. validation, S.X.; formal analysis, C.X.; investigation, C.X.; resources, K.Y.; data curation, K.Y.; writing—original draft preparation, C.X.; writing—review and editing, Y.C.; visualization, Y.C.; supervision, S.X.; project administration, S.X.; funding acquisition, C.X. All authors have read and agreed to the published version of the manuscript.

Funding

This research was funded by Nanji Islands National Marine Nature Reserve Administration, grant number 529000-I52202.

Institutional Review Board Statement

Not applicable.

Informed Consent Statement

Not applicable.

Data Availability Statement

The original contributions presented in this study are included in the article. Further inquiries can be directed to the corresponding author.

Conflicts of Interest

Author Shangwei Xie was employed by Nanji Islands National Marine Nature Reserve Administration, The remaining authors declare that the research was conducted in the absence of any commercial or financial relationships that could be construed as a potential conflict of interest.

Appendix A

CodeMeaning
13Processing of Agricultural and Sideline Products
14Food Manufacturing
15Manufacture of Alcoholic Beverages, Beverages and Refined Tea
16Tobacco Products Manufacturing
17Textile Industry
18Textile Wearing Apparel and Accessories Manufacturing
19Leather, Fur, Feather Products and Footwear Manufacturing
20Wood Processing and Manufacture of Wood, Bamboo, Rattan, Palm and Straw Products
21Furniture Manufacturing
22Paper and Paper Products Manufacturing
23Printing and Reproduction of Recorded Media
24Manufacture of Cultural, Educational, Sporting and Entertainment Products
25Petroleum, Coal and Other Fuel Processing Industry
26Manufacture of Chemical Raw Materials and Chemical Products
27Pharmaceutical Manufacturing
28Manufacture of Chemical Fibers
29Manufacture of Rubber and Plastics Products
30Manufacture of Non-metallic Mineral Products
31Smelting and Rolling of Ferrous Metals
32Smelting and Rolling of Non-ferrous Metals
33Manufacture of Metal Products
34Manufacture of General-purpose Machinery
35Manufacture of Special-purpose Machinery
36Manufacture of Motor Vehicles
37Manufacture of Railway, Shipbuilding, Aerospace and Other Transport Equipment
38Manufacture of Electrical Machinery and Equipment
39Manufacture of Computers, Communication and Other Electronic Equipment
40Manufacture of Instruments and Meters
41Other Manufacturing
42Comprehensive Utilization of Waste Resources

References

  1. Li, H.; Hu, T.; Ma, X.; Cheng, B. The Impact of Transportation Infrastructure on the Regional Economic Integration in China:A CGE Analysis. Int. Rev. Econ. Financ. 2025, 99, 104045. [Google Scholar] [CrossRef]
  2. Zou, Y.; Xiao, G.; Li, Q.; Biancardo, S.A. Intelligent Maritime Shipping: A Bibliometric Analysis of Internet Technologies and Automated Port Infrastructure Applications. JMSE 2025, 13, 979. [Google Scholar] [CrossRef]
  3. Chen, X.; Wu, S.; Shi, C.; Huang, Y.; Yang, Y.; Ke, R.; Zhao, J. Sensing Data Supported Traffic Flow Prediction via Denoising Schemes and ANN: A Comparison. IEEE Sens. J. 2020, 20, 14317–14328. [Google Scholar] [CrossRef]
  4. Liu, Z.; Zeng, S.; Jin, Z.; Shi, J. Transport infrastructure and industrial agglomeration: Evidence from manufacturing industries in China. Transp. Policy 2022, 121, 100–112. [Google Scholar] [CrossRef]
  5. Bian, F.; Yeh, A.G. Spatial–economic impact of missing national highway links on China’s regional economy. Transp. Res. Part D Transp. Environ. 2020, 84, 102377. [Google Scholar] [CrossRef]
  6. Jiang, X.; He, X.; Zhang, L.; Qin, H.; Shao, F. Multimodal Transportation Infrastructure Investment and Regional Economic Development: A Structural Equation Modeling Empirical Analysis in China from 1986 to 2011. Transp. Policy 2017, 54, 43–52. [Google Scholar] [CrossRef]
  7. Chen, Z.; Li, Y.; Wang, P. Transportation Accessibility and Regional Growth in the Greater Bay Area of China|Request PDF. Transp. Res. Part D Transp. Environ. 2020, 86, 102453. [Google Scholar] [CrossRef]
  8. Wang, H.; Han, J.; Su, M.; Wan, S.; Zhang, Z. The Relationship between Freight Transport and Economic Development: A Case Study of China. Res. Transp. Econ. 2021, 85, 100885. [Google Scholar] [CrossRef]
  9. Witte, P.; Wiegmans, B.; Rodrigue, J.-P. Competition or Complementarity in Dutch Inland Port Development: A Case of Overproximity? J. Transp. Geogr. 2017, 60, 80–88. [Google Scholar] [CrossRef]
  10. Van Klink, H.A.; Van Den Berg, G.C. Gateways and Intermodalism. J. Transp. Geogr. 1998, 6, 1–9. [Google Scholar] [CrossRef]
  11. Wilmsmeier, G.; Monios, J.; Lambert, B. The Directional Development of Intermodal Freight Corridors in Relation to Inland Terminals. J. Transp. Geogr. 2011, 19, 1379–1386. [Google Scholar] [CrossRef]
  12. Ng, A.K.Y.; Ducruet, C.; Jacobs, W.; Monios, J.; Notteboom, T.; Rodrigue, J.-P.; Slack, B.; Tam, K.; Wilmsmeier, G. Port Geography at the Crossroads with Human Geography: Between Flows and Spaces. J. Transp. Geogr. 2014, 41, 84–96. [Google Scholar] [CrossRef]
  13. Zheng, S.; Zhang, Q.; van Blokland, W.B.; Negenborn, R.R. The Development Modes of Inland Ports: Theoretical Models and the Chinese Cases. Marit. Policy Manag. 2021, 48, 583–605. [Google Scholar] [CrossRef]
  14. Monios, J.; Wang, Y. Spatial and Institutional Characteristics of Inland Port Development in China. GeoJournal 2013, 78, 897–913. [Google Scholar] [CrossRef]
  15. Banerjee, A.; Duflo, E.; Qian, N. On the Road: Access to Transportation Infrastructure and Economic Growth in China. J. Dev. Econ. 2020, 145, 102442. [Google Scholar] [CrossRef]
  16. Melo, P.C.; Graham, D.J.; Brage-Ardao, R. The Productivity of Transport Infrastructure Investment: A Meta-Analysis of Empirical Evidence. Reg. Sci. Urban Econ. 2013, 43, 695–706. [Google Scholar] [CrossRef]
  17. Brachert, M.; Titze, M.; Kubis, A. Identifying Industrial Clusters from a Multidimensional Perspective: Methodical Aspects with an Application to Germany. Pap. Reg. Sci. 2011, 90, 419–440. [Google Scholar] [CrossRef]
  18. Becchetti, L.; Panizza, A.D.; Oropallo, F. Role of Industrial District Externalities in Export and Value-Added Performance: Evidence from the Population of Italian Firms. Reg. Stud. 2007, 41, 601–621. [Google Scholar] [CrossRef]
  19. Hulten, C.R.; Bennathan, E.; Srinivasan, S. Infrastructure, Externalities, and Economic Development: A Study of the Indian Manufacturing Industry. World Bank Econ. Rev. 2006, 20, 291–308. [Google Scholar] [CrossRef]
  20. Pessoa, A. Agglomeration and Regional Growth Policy: Externalities versus Comparative Advantages. Ann Reg Sci 2014, 53, 1–27. [Google Scholar] [CrossRef]
  21. Berechman, J.; Ozmen, D.; Ozbay, K. Empirical Analysis of Transportation Investment and Economic Development at State, County and Municipality Levels. Transportation 2006, 33, 537–551. [Google Scholar] [CrossRef]
  22. Chiu, R.-H.; Lin, Y.-C. Applying input-output model to investigate the inter-industrial linkage of transportation industry in Taiwan. J. Mar. Sci. Technol. 2012, 20, 8. [Google Scholar] [CrossRef]
  23. Tong, T.; Yu, T.E. Transportation and Economic Growth in China: A Heterogeneous Panel Cointegration and Causality Analysis. J. Transp. Geogr. 2018, 73, 120–130. [Google Scholar] [CrossRef]
  24. Abadie, A.; Gardeazabal, J. The Economic Costs of Conflict: A Case Study of the Basque Country. Am. Econ. Rev. 2003, 93, 113–132. [Google Scholar] [CrossRef]
  25. Abadie, A.; Diamond, A.; Hainmueller, J. Synthetic Control Methods for Comparative Case Studies: Estimating the Effect of California’s Tobacco Control Program. J. Am. Stat. Assoc. 2010, 105, 493–505. [Google Scholar] [CrossRef]
  26. Abadie, A.; Diamond, A.; Hainmueller, J. Comparative Politics and the Synthetic Control Method: Comparative politics and the synthetic control method. Am. J. Political Sci. 2015, 59, 495–510. [Google Scholar] [CrossRef]
  27. Sun, J.; Wang, F.; Yin, H.; Zhang, B. Money Talks: The Environmental Impact of China’s Green Credit Policy. J. Policy Anal. Manag. 2019, 38, 653–680. [Google Scholar] [CrossRef]
  28. Graham, D.J. Identifying Urbanisation and Localisation Externalities in Manufacturing and Service Industries. Pap. Reg. Sci. 2009, 88, 63–85. [Google Scholar] [CrossRef]
  29. Mody, A.; Wang, F.-Y. Explaining Industrial Growth in Coastal China: Economic Reforms … and What Else? World Bank Econ. Rev. 1997, 11, 293–325. [Google Scholar] [CrossRef]
  30. ten Raa, T.; Wolff, E.N. Secondary Products and the Measurement of Productivity Growth. Reg. Sci. Urban Econ. 1991, 21, 581–615. [Google Scholar] [CrossRef]
  31. Productivity Change in Chinese Industry: 1953–1985. J. Comp. Econ. 1988, 12, 570–591. [CrossRef]
  32. Balakrishnan, P.; Pushpangadan, K.; Babu, M.S. Trade Liberalisation and Productivity Growth in Manufacturing: Evidence from Firm-Level Panel Data. Econ. Political Wkly. 2000, 35, 3679–3682. [Google Scholar]
  33. Balakrishnan, P.; Pushpangadan, K. Total Factor-Productivity Growth in Manufacturing Industry: A Fresh Look. Econ. Political Wkly. 1994, 29, 2028–2035. [Google Scholar]
  34. Laurenceson, J.; Chai, J.C.H. The Economic Performance of China’s State-Owned Industrial Enterprises. J. Contemp. China 2000, 9, 21–39. [Google Scholar] [CrossRef]
  35. Jefferson, G.H.; Rawski, T.G.; Li, W.; Yuxin, Z. Ownership, Productivity Change, and Financial Performance in Chinese Industry. J. Comp. Econ. 2000, 28, 786–813. [Google Scholar] [CrossRef]
  36. Bird, J.; Straub, S. The Brasília Experiment: The Heterogeneous Impact of Road Access on Spatial Development in Brazil. World Dev. 2020, 127, 104739. [Google Scholar] [CrossRef]
  37. Xu, M.; Feng, Y. How Transportation Infrastructure Affects Firm Productivity? Evidence from China. China Econ. Q. Int. 2022, 2, 55–69. [Google Scholar] [CrossRef]
  38. Medeiros, V.; Ribeiro, R.S.M.; Amaral, P.V.M.; Stein, A.Q. Road infrastructure and Economic Development: Measuring Causal Impacts of Infrastructure Investments Using a Three-Step Instrumental Variable Identification Strategy. Transp. Policy 2025, 163, 394–407. [Google Scholar] [CrossRef]
Figure 1. Technical approach of the study.
Sustainability 17 06813 g001
Figure 2. Trends in the secondary industry GDP at the city level: City of Ha’erbin vs. synthetic city of Ha’erbin.
Sustainability 17 06813 g002
Figure 3. Cumulative abnormal portfolio returns.
Sustainability 17 06813 g003
Figure 4. Neural network training performance.
Sustainability 17 06813 g004
Figure 5. Neural network training gradient.
Sustainability 17 06813 g005
Figure 6. The index of neural network training.
Sustainability 17 06813 g006
Table 1. Means of the secondary industry GDP predictors.
VariablesCity of Ha’erbinAverage of 14 Control Cities
RealSynthetic
Ln (Number of employee)6.2065.7355.328
Ln (Fixed investment)5.0955.9576.682
Ln (highway freight volume)8.8428.8798.990
Ln (Secondary industry GDP) (2002)5.9475.9735.830
Ln (Secondary industry GDP) (2004)6.3146.3126.235
Table 2. City values in the synthetic Ha’erbin.
City NameWeightCity NameWeightCity NameWeight
Beijing0.296Guangzhou0Hohhot0
Changsha0.610Shanghai0Urumqi0
Nanjing0.094Nanning0Yinchuan0
Lanzhou0Guizhou0Zhengzhou0
Wuhan0Nanchang0
Table 3. Manufacturing sector’s diffusion of sample firms.
Manufacturing SectorHa’erbin CityBeijing CityNanjing CityChangsha CityAll Samples
Number of Observations%Number of Observations%Number of Observations%Number of Observations%Number of Observations%
13119917.41 5713.87 2902.02 6116.15 26715.82
143284.76 4823.27 2361.65 3063.08 13522.94
152864.15 1961.33 770.54 2282.29 7871.71
16100.15 70.05 80.06 60.06 310.07
171402.03 3322.25 3482.43 1571.58 9772.13
1880.12 6124.15 10757.50 1551.56 18504.03
1970.10 840.57 1280.89 640.64 2830.62
205257.62 710.48 730.51 1571.58 8261.80
211091.58 2531.71 860.60 1471.48 5951.30
221241.80 2491.69 2251.57 3903.92 9882.15
231862.70 8745.92 3182.22 2782.80 16563.61
241331.93 1010.68 2721.90 430.43 5491.20
25490.71 1140.77 980.68 400.40 3010.66
262553.70 9306.30 148210.34 228923.03 495610.79
272954.28 6124.15 2511.75 2652.67 14233.10
2890.13 220.15 350.24 40.04 700.15
29480.70 1471.00 1791.25 1031.04 4771.04
302633.82 6314.28 6384.45 5005.03 20324.43
313615.24 9596.50 10167.09 8688.73 32046.98
32801.16 910.62 2771.93 920.93 5401.18
33811.18 2491.69 3572.49 2252.26 9121.99
343134.54 9076.15 11978.35 3773.79 27946.09
356589.55 11627.87 150010.47 8798.84 41999.15
363254.72 11197.58 7094.95 4634.66 26165.70
373965.75 8815.97 9466.60 4234.26 26465.76
38430.62 1220.83 1711.19 880.89 4240.92
393805.52 10276.96 10617.40 3843.86 28526.21
40961.39 9866.68 7275.07 1381.39 19474.24
411321.92 7485.07 3832.67 1721.73 14353.13
42370.54 1821.23 1180.82 810.81 4180.91
43120.15 360.24 480.33 60.06 1020.22
Total688810014,75710014,329100993910045,913100
Table 4. Descriptive statistics.
VariablesNumber of ObservationsMeanStd. Dev.Min.Max.
total value of output45,894124,980.8312,716.310752,356,620
State-owned45,9130.1180.32301
Foreign45,9130.0810.27301
Others45,9130.7890.40801
Age45,90911.79310.424157
Asset45,911127,680.1377,671.113942,930,350
Employees44,11624036682581
Fixed investment45,74831,906.0194,277.879720,147
Profit45,8307870.82326,922.49−24,955201,031
Disclaimer/Publisher’s Note: The statements, opinions and data contained in all publications are solely those of the individual author(s) and contributor(s) and not of MDPI and/or the editor(s). MDPI and/or the editor(s) disclaim responsibility for any injury to people or property resulting from any ideas, methods, instructions or products referred to in the content.

